updated environmental statement 2013 - wieland- · pdf fileemas environmental verifier,...
TRANSCRIPT

Updated Environmental Statement 2013Vöhringen plant

2
Validation certificate
Statement of the environmental verifier on the verification and validation activities
The undersigned Thomas Schneider, EMAS environmental verifier, registration number DE V 0178, accredited or licensed for the scope NACE 24.44, declares that he has verified whether the Vöhringen works location as indicated in the updated Environmental Statement of Wieland-Werke AG, registration number DE-104-00108, meets all the requirements of Regulation (EC) No 1221/2009 of the European Parliament and of the Council of 25 November 2009 on the voluntary participation by organizations in a Community eco-management and audit scheme (EMAS).
With the signing of this declaration, it is confirmed that
•verificationandvalidationwereperformedinfullcompliancewith the requirements of Regulation (EC) No. 1221/2009,
•the outcome of verification and validation confirms thatthere is no evidence of non-compliance with the applicable environmental regulations,
•the data and information of the updated environmentalstatement of the location present a reliable, credible and
correct picture of site activities within the scope mentioned in the Environmental Statement.
Vöhringen, 19 April 2013
Thomas SchneiderEnvironmental Verifier Reg. No. D-V-0178

3
Environmental and
energy policy of Wieland-Werke AG
Wieland-Werke AG is conscious of its responsibility to nature and to society. Our environmental and energy policy aims to contribute towards protecting our environment and sustaining its quality for the life of the community in general. Environmental protection and the economical use of energy and resources are a managerial task. Environmental interests and the economical use of energy are considered in all the decisions taken in the Company.
In essence, this means:
• We undertake to continually improve environmental protection within the Company. This includes the prevention of pollution, such as emissions and waste, as well as the improvement in the energy efficiency of our processes.
• From the development stage on, we ensure that our products are manufactured in as ecologically sound a manner as possible. Thanks to the technical properties of our products, their use frequently leads to an improvement in the energy efficiency of processes. Since copper and copper alloys are 100 % recyclable, our products are infinitely recyclable.
• We meet all legal obligations as well as other commitments undertaken by us regarding environmental protection, energy use, energy consumption and energy efficiency.
• In accordance with the principles of this policy, we define concrete goals in order to realise the above mentioned improvements. To this end, we provide any information and resources necessary.
April 2012
• We conduct an open dialogue with our customers, suppliers, public authorities, trade and professional organisations and cooperate with them in a constructive manner. This includes the publication of the principles of our environmental and energy policy.
• We expect our service providers and suppliers to act in accordance with the principles defined in this policy. This equally applies to the delivery of products and services.
• We review our divisions and processes on a regular basis in order to determine whether we have achieved our goals and to ascertain whether the management systems are effective. We continually improve our environmental and energy management system.
Wieland-Werke AG

4
July 2012
Organisation chart Wieland-Werke AG
Executive Board
Chairman
Harald Kroener
Sales and Marketing
Werner T. Traa
Engineering and Production
Dr Ulrich Hartmann
Engineering and Production
Ulrich Altstetter
Corporate Units
Corporate Communications, Internal Audit
Sales Processes and Tools
Occupational Safety,Quality Systems
Energy Management,Environmental Protection
Legal Affairs and Insurances
Corporate Divisions
Finance and Controlling
Human Resources
Service and Sales Companies
Metal Division, Foundry, Research and Development,Standards and Associations
Engineering and Logistics
Information Systems
Corporate Functions
Corporate Development Lean-ManagementManufacturing Companies
and Participations
Operational Divisions
Rolled Products Extruded and Drawn Products High Performance Tubes Slide Bearings and Components
Organisational Structure of Wieland-Werke AG

5
Occupational safety and health, environmental
protection and energy at Wieland-Werke AG
Immission protection, hazardous incidents:Oswald AblerPhone +49 731 944 3005Fax +49 731 944 [email protected]
Water law, water protection:Reimar BaumPhone +49 731 944 6417Fax +49 731 944 [email protected]
Waste disposal, hazardous goods:Dieter JechlePhone +49 731 944 3564Fax +49 731 944 [email protected]
Executive Board
Occupational safety and health, environmental
protection and energy management officer
AZ/Zimmermann
Senior safety expert: ASI/Schuster
Environmental protection officer: AZU/Abler
Plant officers for:
- Solid waste: AZU/Jechle
- Hazardous goods: AZU/Jechle
- Water protection: AZU/Baum
- Immission protection: AZU/Abler,
AZU/Hutzel
Energy officer/energy team: AZV/Gaus
Technical Management
Corporate Division Metal, Casting, Research & Development Dr Müller
Operating Division Rolled Products Mr Cüppers
Operating Division Extruded and Drawn Products Mr Ulm
Operation Division Tubes Mr Graßhof
Operation Division Slide Bearings and System Components Mr Vorndran
Ulm worksWorks Manager
S/Vorndran
Vöhringen worksWorks ManagerAZ/Zimmermann
Langenberg worksWorks Manager
WK/Blässing
Villingen worksWorks ManagerWM/Dambietz
Safety experts:
ASI/Vizzutti
ASI/Schuster
Company doctor:
PGAU/Dr Müller-Nübling
Person in charge of radiation protection
not necessary
Officer for:
- Radiation protection
(as per X-ray Ordinance) ASI/Linner
(as per RöV) MFP/Dr Theobald
- Laser protection ASI/Walter
- Hazardous incidents AZU/Abler
- Fire protection ASI/Linner
Contacts for:
- Environmental protection AZU/Abler
- Energy team AIS/Jacob
Safety experts:
ASI/Schuster
ASI/Walter
ASI/Yilmaz
ASI/Linner
Company doctor:
PGAV/Wörner
Person in charge of radiation protection
WV/Rösch
Officer for:
- Radiation protection
(as per X-ray Ordinance) ASI/Linner
(as per RöV) MFP/Dr. Theobald
- Laser protection ASI/Walter
- Hazardous incidents AZU/Abler
- Fire protection ASI/Linner
Contacts for:
- Environmental protection AZU/Abler
- Energy team AZV/Gaus
Safety experts:
WKA/Lins
Mr Küpper (ext.)
Company doctor:
Mr Keßel
Person in charge of radiation protection
WK/Blässing
Officer for:
- Radiation protection
(as per RöV) WKQ/Preick
- Laser protection WKA/Lins
- Hazardous incidents –
- Fire protection WKA/Henzel
- Deputy officer for water
protection WKA/Lins
Contacts for:
- Environmental protection WKA/Lins
- Energy team WKA/Lins
Safety experts:
WMA/Bodamer
Mr Hey (ext.)
Company doctor:
Dr Fritzer
Person in charge of radiation protection
WM/Dambietz
Officer for:
- Radiation protection
(as per RöV) WMT/Vural
- Laser protection WMI/Rapp
- Hazardous incidents –
- Fire protection WME/Hofmann
- Deputy officer for water
protection WMA/Epting
Contacts for:
- Environmental protection WMA/Epting
- Energy team WMA/Epting

6
Diagramme Input
2009 2010 2011 2012
333,400
82,400
4,000
247,000
454,500
90,600
6,400
357,500
442,800
73,700
5,400
363,700
422,800
79,900
5,500
337,400
Raw material input (t)
Total material used
New metals
Intermediate alloys
Scrap
2009 2010 2011 2012
155.3
129.9
25.4
188.4
178.6
9.8
188.1
187.9
0.2
178.5
176.9
1.6
Gas consumption (million kWh)
Total gas consumption
Natural gas
Butane gas
Natural gas and butane are alternative energy sources. Which one is used depends on the current price situation. Owing to the price of high butane, demand in 2011 was met almost entirely with natural gas.The share of process gas rose from 62 to 64 percent of the total consumption. The increase in process gas consumption per ton of production is attributable to the trend towards products with thinner wall thickness and at the same time higher quality requirements.
Inert gas is employed at the annealing furnaces to prevent the formation of oxide layers. The inert gas known as HNx is generated in our own inert gas plants with natural gas or butane as the primary energy source.Remaining needs are covered with gases bought in as technical gases (N2 or H2), which are mixed on site to create the desired ratio. In some cases, annealing is performed in an atmosphere of pure hydrogen.
New metals and intermediate alloys have risen from 18 percent of total material input in 2011 to 20 percent.
2009 2010 2011 2012
8,614
2,933
5,341
340
11,096
4,181
6,447
468
10,593
3,766
6,458
369
10,011
3,329
6,010
413
Inert gas consumption (thousand m³)
Total inert gas consumption
HNx
Nitrogen N
2
2Hydrogen H

7
Water consumption relative to quantity output remained unchanged compared with the previous year.
Electric power consumption relative to quantity output rose by approx. 4 percent in 2012 compared with 2011. This is attributable to the progressive increase in the vertical range of manufacture, combined with the trend towards products with thinner wall thickness.
2009 2010 2011 2012
324.0
317.1
6.9
399.0
392.0
7.0
396.1
389.5
6.6
380.8
375.2
5.6
Electric power consumption (million kWh)
Total power consumption
Bought-in electricity
Hydro-electric power(in-plant generation)
2009 2010 2011 2012
8.121
8.079
0.028
0.014
9.236
9.192
0.041
0.003
8.962
8.919
0.040
0.003
8.871
8.231
0.036
0.004Drinking water of the townof Vöhringen
Drinking water (=groundwater)
Service water (=groundwater)
Total water cosumption
Water consumption (million m3)
2009 2010 2011 2012
1,694
326
738
2,339
430
1,046
2,575
406
1,060
2,395
403
845
Operating supplies
Solid and liquid chemicalsdegreasing agent t
Machining fluids andlubricants t
Diesel and fuel oil t

8
Diagramme Output
The 33,909 t of solid waste in 2012 included 5,810 t of hazardous waste.The largest contributors of this were:
- Zinc oxide filter dust - Emulsions and scrubbing liquids containing oil- Sludge from the wastewater treatment plants
The quantity of wastewater in relation to quatity output remained unchanged.
2009 2010 2011 2012
306,400
100,100*
95,600
55,800
251,500
415,505
148,700*
133,100
58,400
340,200
404,400
138,000
139,200
57,700
334,900
387,200
131,700
123,300
52,700
307,700
Finished products (t)
Total finished products
Rolled products
Extruded/drawn products- Rods and wires
Output casting plant
- Tubes
2009 2010 2011 2012
32,797
7,100
14,680
90
10,927
35,264
8,854
18,399
92
7,919
33,437
10,199
19,273
137
3,828
33,909
9,534
17,414
466
6,495
Waste (t)
Total waste
Waste for recycling
Scrap from metal stock for recycling
Waste for disposal
Debris
2009 2010 2011 2012
8.121
0.266
7.601*
0.2110.043*
9.236
0.266
8.690
0.2360.044
8.962
0.267
8.372
0.2790.044
8.272
0.272
7.716
0.2430.041
Wastewater disposal (million m³)
Total water disposal
Sanitary wastewaterTreated wastewater
Cooling water
Evaporation characteristicCasting plant cooling towers
9
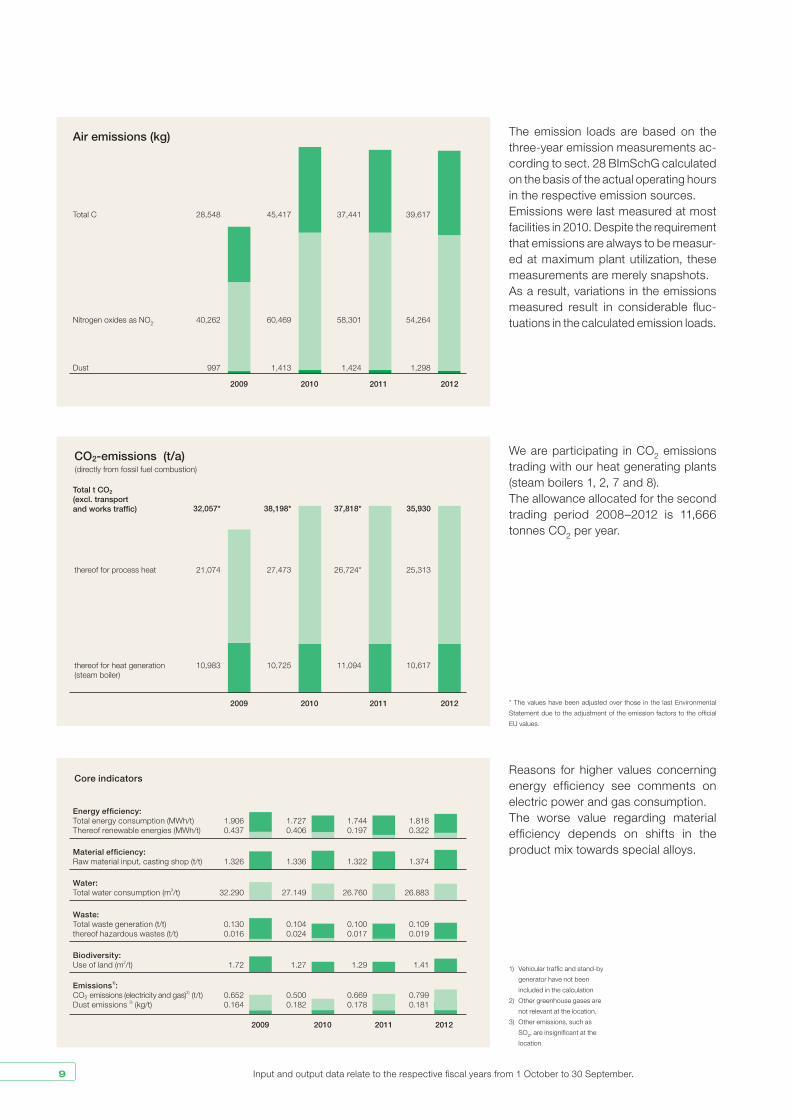
1) Vehicular traffic and stand-by
generator have not been
included in the calculation
2) Other greenhouse gases are
not relevant at the location.
3) Other emissions, such as
SO2, are insignificant at the
location
* The values have been adjusted over those in the last Environmental
Statement due to the adjustment of the emission factors to the official
EU values.
The emission loads are based on the three-year emission measurements ac-cording to sect. 28 BImSchG calculated on the basis of the actual operating hours in the respective emission sources.Emissions were last measured at most facilities in 2010. Despite the requirement that emissions are always to be measur-ed at maximum plant utilization, these measurements are merely snapshots.As a result, variations in the emissions measured result in considerable fluc-tuations in the calculated emission loads.
We are participating in CO2 emissions trading with our heat generating plants (steam boilers 1, 2, 7 and 8).The allowance allocated for the second trading period 2008–2012 is 11,666 tonnes CO2 per year.
Reasons for higher values concerning energy efficiency see comments on electric power and gas consumption. The worse value regarding material efficiency depends on shifts in the product mix towards special alloys.
Input and output data relate to the respective fiscal years from 1 October to 30 September.
2009 2010 2011 2012
28,548
40,262
997
45,417
60,469
1,413
37,441
58,301
1,424
39,617
54,264
1,298
Air emissions (kg)
Total C
Nitrogen oxides as NO2
Dust
2009 2010 2011 2012
21,074
10,983
32,057*
27,473
10,725
38,198*
26,724*
11,094
37,818*
25,313
10,617
35,930
CO2-emissions (t/a)
thereof for process heat
thereof for heat generation(steam boiler)
Total t CO2
(excl. transport and works traffic)
(directly from fossil fuel combustion)
2009 2010 2011 2012
Core indicators
Energy efficiency:Total energy consumption (MWh/t)Thereof renewable energies (MWh/t)
Material efficiency:Raw material input, casting shop (t/t)
Water:Total water consumption (m3/t)
Waste:Total waste generation (t/t)thereof hazardous wastes (t/t)
Biodiversity:Use of land (m2/t)
Emissions1):CO2 emissions (electricity and gas)2) (t/t)Dust emissions 3) (kg/t)
1.9060.437
1.326
32.290
0.1300.016
1.72
0.6520.164
1.7270.406
1.336
27.149
0.1040.024
1.27
0.5000.182
1.7440.197
1.322
26.760
0.1000.017
1.29 1.41
0.6690.178
1.8180.322
1.374
26.883
0.1090.019
0.7990.181
10
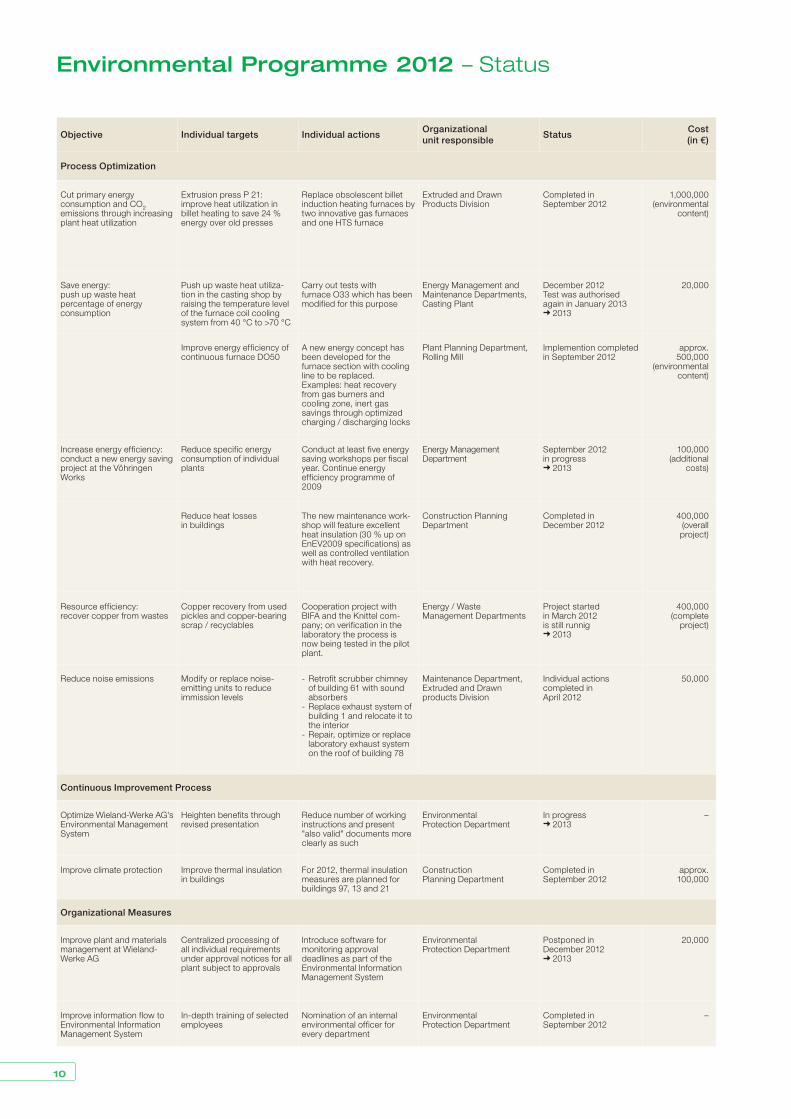
Objective Individual targets Individual actionsOrganizational unit responsible
StatusCost (in €)
Process Optimization
Cut primary energy consumption and CO2emissions through increasing plant heat utilization
Extrusion press P 21: improve heat utilization in billet heating to save 24 % energy over old presses
Replace obsolescent billet induction heating furnaces by two innovative gas furnaces and one HTS furnace
Extruded and Drawn Products Division
Completed in September 2012
1,000,000 (environmental
content)
Save energy:push up waste heat percentage of energy consumption
Push up waste heat utiliza-tion in the casting shop by raising the temperature level of the furnace coil cooling system from 40 °C to >70 °C
Carry out tests with furnace O33 which has been modified for this purpose
Energy Management and Maintenance Departments, Casting Plant
December 2012Test was authorised again in January 2013
2013
20,000
Improve energy efficiency of continuous furnace DO50
A new energy concept has been developed for the furnace section with cooling line to be replaced. Examples: heat recovery from gas burners and cooling zone, inert gas savings through optimized charging / discharging locks
Plant Planning Department, Rolling Mill
Implemention completed in September 2012
approx. 500,000
(environmental content)
Increase energy efficiency:conduct a new energy saving project at the Vöhringen Works
Reduce specific energy consumption of individual plants
Conduct at least five energy saving workshops per fiscal year. Continue energy efficiency programme of 2009
Energy Management Department
September 2012 in progress
2013
100,000 (additional
costs)
Reduce heat losses in buildings
The new maintenance work-shop will feature excellent heat insulation (30 % up on EnEV2009 specifications) as well as controlled ventilation with heat recovery.
Construction Planning Department
Completed in December 2012
400,000 (overall project)
Resource efficiency:recover copper from wastes
Copper recovery from used pickles and copper-bearing scrap / recyclables
Cooperation project with BIFA and the Knittel com-pany; on verification in the laboratory the process is now being tested in the pilot plant.
Energy / Waste Management Departments
Project started in March 2012 is still runnig
2013
400,000 (complete
project)
Reduce noise emissions Modify or replace noise-emitting units to reduce immission levels
- Retrofit scrubber chimney of building 61 with sound absorbers- Replace exhaust system of building 1 and relocate it to the interior - Repair, optimize or replace laboratory exhaust system on the roof of building 78
Maintenance Department, Extruded and Drawn products Division
Individual actions completed in April 2012
50,000
Continuous Improvement Process
Optimize Wieland-Werke AG's Environmental Management System
Heighten benefits through revised presentation
Reduce number of working instructions and present "also valid" documents more clearly as such
Environmental Protection Department
In progress 2013
–
Improve climate protection Improve thermal insulation in buildings
For 2012, thermal insulation measures are planned for buildings 97, 13 and 21
Construction Planning Department
Completed in September 2012
approx. 100,000
Organizational Measures
Improve plant and materials management at Wieland-Werke AG
Centralized processing of all individual requirements under approval notices for all plant subject to approvals
Introduce software for monitoring approval deadlines as part of the Environmental Information Management System
Environmental Protection Department
Postponed in December 2012
2013
20,000
Improve information flow to Environmental Information Management System
In-depth training of selected employees
Nomination of an internal environmental officer for every department
Environmental Protection Department
Completed in September 2012
–
Environmental Programme 2012 – Status

11
Objective Individual targets Individual actionsOrganizational unit responsible
StatusCost (in €)
Process Optimization
Reduce air emissions Reduce NOx- emissions from suction channels on pickling tanks
Development of suitable flue gas cleaning systems for mixed acid pickling lines in the Extruded and Drawn Products Division and Rolled Products Division
Plant Planning Department December 2013 >20,000 (planning
costs)
Save energy:push up the waste heat per-centage of the energy con-sumption
Push up waste heat utiliza-tion in the casting shop by raising the temperature level of the furnace coil cooling system from 40 °C to >70 °C
Carry out tests with furnace O33 which has been modified for this purpose
Energy Management and Maintenance Department Casting Plant
December 2013 50,000
Increase energy efficiency:conduct a new energy saving project at the Vöhringen Works
Reduce specific energy consumption of individual plants
Conduct energy saving work-shops on individual plants.Continue energy efficiency programme of 2009
Energy Management Department
September 2013 >10,000 (personnel
costs)
Reduce heat losses in buildings
Renovation of building 21 taking into account energy saving possibilities
Construction Planning Department
December 2013 580,000
Resource efficiency:recover copper from wastes
Copper recovery from used pickles and copper-bearing scrap / recyclables
Cooperation project with BIFA and the Knittel com-pany; on verification in the laboratory the process is now being tested in the pilot plant.
Energy / Waste Management Departments
December 2013 400,000 (overall project)
Improvements in water pro-tection
Reduce quantity of waste-water and improve handling of substances hazardous to water
Planning of a new bath pick-ling system for wires taking into account the latest state-of-the-art technology
Construction Planning Department
September 2012 >2,000,000 (overall project)
Continuous Improvement Process
Optimize Wieland-Werke AG's Environmental Management System
Heighten benefits through revised presentation
Reduce number of working instructions and present "also valid" documents more clearly as such
Environmental Protection Department
In progress –
Organizational Measures
Improve plant and materials management at Wieland-Werke AG
Centralized processing of all individual requirements under approval notices for all plant subject to approvals
Introduce software for monitoring approval deadlines as part of the Environmental Information Management System
Environmental Protection Department
September 2013 20,000
Environmental Programme 2013

0541
-01
261/
06.
09
Ab
0,5
OD
H (G
SW
/Al)
Wieland-Werke AG www.wieland.com
Graf-Arco-Str. 36, 89079 Ulm, Germany, Phone +49 (0)731 944 0, Fax +49 (0)731 944 2772, [email protected]