updated economic impact analysis: petrochemical facility
TRANSCRIPT

Updated Economic Impact Analysis: Petrochemical Facility in
Beaver County, Pennsylvania
Prepared for Shell Chemical Appalachia, LLC
Robert Morris University – School of Business
Steven Clinton, Ph.D. Marcel C. Minutolo∗, Ph.D.
Brian O’Roark, Ph.D.
April 2021
Final
∗ Corresponding author of study.

Updated Economic Impact Study: Beaver County Petrochemical Facility
Beaver County Petrochemical Facility i
Contents 1. Overall Summary of Study ......................................................................................................... 1
1.1 Summary of Economic Impact ........................................................................................... 3
1.2 Summary of Wage Tax Impact ........................................................................................... 5
1.3 Benefit to and Burden on State and Local Government ..................................................... 7
1.4 Benefits That Cannot be Quantified and Non-Economic Benefits ..................................... 7
1.5 Study Assumptions ............................................................................................................. 7
2. Scope of the Study ...................................................................................................................... 7
2.1 Introduction ......................................................................................................................... 7
2.2 Methodology ....................................................................................................................... 7
2.3 Introduction to Economic Impact Analysis ........................................................................ 9
3. Economic Impact Resulting from Shell Project ....................................................................... 10
3.1 Overall Impacts ................................................................................................................. 10
3.2 Short Term Impact – Construction Phase ......................................................................... 11
3.3 Pennsylvania Construction Spending and Employment ................................................... 12
3.4 SWPA Construction Spending and Employment ............................................................. 13
3.5 Beaver County Construction Spending and Employment ................................................ 13
3.6 Permanent Jobs ................................................................................................................. 13
3.7 Economic Impact .............................................................................................................. 13
3.7.1 Pennsylvania Economic Impact – Construction ............................................................ 13
3.7.2 Pennsylvania Economic Impact – Ongoing Operations ................................................ 14
3.7.3 Pennsylvania State and Local Income Taxes ................................................................. 15
3.8 SWPA Economic Impact .................................................................................................. 15
3.8.1 SWPA Economic Impact – Construction ...................................................................... 15
3.8.2 SWPA Economic Impact – Operations ......................................................................... 16
3.8.3 SWPA Impact on State and Local Taxes ....................................................................... 16
3.9 Beaver County Economic Impact ..................................................................................... 17
3.9.1 Beaver County Economic Impact – Construction ......................................................... 17
3.9.2 Beaver County Economic Impact – Operations ............................................................ 17
3.9.3 Beaver County Impact on State and Local Taxes– Construction .................................. 18
4. Summary of the Discounted Present Value from Ongoing Operations .................................... 19
5. References ................................................................................................................................. 20
EXHIBIT A: Key Study Assumptions .......................................................................................... 22

Updated Economic Impact Study: Beaver County Petrochemical Facility
ii
EXHIBIT B: State Model Build ................................................................................................... 24
EXHIBIT C: The Research Team ................................................................................................. 26
Steven Clinton, Ph.D. ............................................................................................................. 26
Marcel C. Minutolo, Ph.D., CSSBB ....................................................................................... 27
Brian O’Roark, Ph.D. ............................................................................................................. 28

Updated Economic Impact Study: Beaver County Petrochemical Facility
iii
All work contained in this study expresses only the opinion of the authors and is the result of publicly available information. The results and conclusions are those of the authors, not those of
Royal Dutch Shell plc or any of its affiliates.

Updated Economic Impact Study: Beaver County Petrochemical Facility
Economic Impact Study: Beaver County Petrochemical Facility 1
1. Overall Summary of Study
Shell Chemical Appalachia LLC (hereafter “Shell”) is constructing a petrochemicals complex (the Project) near Pittsburgh, Pennsylvania that will convert ethane (derived from shale gas production in the region) into ethylene and, subsequently, polyethylene, which is the key building block for many plastic products. The proposed complex is the first major U.S. project of its type built outside the Gulf Coast region in 20 years. The facility will leverage the plentiful supplies of ethane in the region to produce polyethylenes used extensively by the manufacturing base in any extended region. Locating the facility close to both input supply and final product markets will reduce economic and environmental costs associated with transportation while providing regional manufacturers with more flexibility, shorter supply chains, and enhanced supply dependability. The Project site encompasses approximately 386 acres of the land acquired from Horsehead located within an industrial area adjoining the Ohio River in Potter and Center Townships in Beaver County, Pennsylvania. Much of the property housed industrial operations for many decades, including a lead and zinc smelter that began operating in the 1920s. The Project site offers strategic advantages including access to marine, air, rail and road transportation, and pipelines; proximity to both ethane supply and polyethylene markets; access to a skilled workforce; a prior history of industrial use; and, appropriate zoning and compatible adjoining land uses. With the increase in North American shale gas production, particularly in the “wet gas” portions of the Marcellus and Utica Shales in western Pennsylvania, West Virginia and Ohio, there has been an accompanying increase in ethane production. The resultant availability of increased supplies of ethane at favorable prices has made ethane a highly competitive feedstock for use by the petrochemical industry. Ethane, the primary raw material for the Project, is a natural gas liquid (NGL) that exists in certain natural gas deposits including the Marcellus and Utica Shales. (Propane and butane are examples of other NGLs.) Natural gas companies remove NGLs from natural gas and ship the natural gas (mainly methane) by pipeline for use as a fuel by residences, power plants, and industry. The NGLs are used for a variety of industrial, residential, and commercial uses. Ethane’s primary use is as a feedstock used to create ethylene. Ethylene is an important first step in creating many products. This facility will process the ethylene to make different types of polyethylene. Different grades of polyethylene are used to make:
• Low-density polyethylene (LDPE) and linear low density polyethylene (LLDPE) which are the raw materials for flexible items like food packaging, film, trash bags, diapers, toys, and housewares;
• High-density polyethylene (HDPE) which is used to create “stiffer” products such as crates, drums, bottles, food containers, and other types of housewares.

Updated Economic Impact Study: Beaver County Petrochemical Facility
2
The Project will consist of an ethylene manufacturing process, three (3) polyethylene manufacturing units, a natural gas-fired cogeneration unit comprised of three combustion turbines/duct burners and heat recovery steam generators (HRSGs) to generate electricity and steam, and a variety of ancillary equipment required to support the overall plant operations. Construction and operation of the Project involves a substantial investment, resulting in production of a product that can be utilized by other industries in the area. An earlier study estimated that the cost of the Project would be $6 billion based on an average capital cost of similar projects (Clinton et al. 2014); however, more recently it was reported that the Project would likely cost at least $10 billion (Schneider, 2019). Of the $6 billion estimated spend, the authors estimated that construction work performed within Pennsylvania would total between $900 million and $1.5 billion (not counting additional expenditures involved in fabrication of specialized equipment and materials in other locations) (Clinton et al. 2014). Assuming the same ratio of local spend, given the updated project cost, we estimate that construction work performed within Pennsylvania to total between $1.5 and $2.5 billion. This current report provides an updated independent examination of the economic, fiscal, and qualitative benefits of the Project to three areas: Pennsylvania, the 10-county Southwestern Pennsylvania region, and Beaver County, where the Project is located. The 10-county southwestern Pennsylvania area1 (hereafter SWPA) was selected for analysis to be consistent with other economic and regional planning efforts, and represents the area covered by the Southwestern Planning Commission. The construction of the Project, began with site preparation in 2014 and has resulted in an increase in employment, wages, output, and tax revenue in Pennsylvania as a whole, SWPA in particular and specifically Beaver County. After construction is completed, ongoing operation of the Project is expected to provide a sustained source of added employment, wages, output, and tax revenue. Permanent employment will provide new jobs with annual salaries above current local averages.2 The steady-state operations of the plant is expected to require 600, full-time positions (Suttles, 2020) most of which will be high-paying, skilled positions. There will also be additional indirect and induced increases in employment, wages, output, and tax revenues. The analysis in the study utilizes an accepted econometric technique to calculate the expected economic benefits for Pennsylvania, SWPA, and Beaver County. We rely upon the IMPLAN web-based application initially developed by the United States Department of Agriculture in conjunction with the University of Minnesota. This application is specifically designed for community impact analysis. The current IMPLAN input-output database and application is maintained and sold by IMPLAN Group LLC. Over 1,500 firms across the country use the IMPLAN model. Unlike earlier versions of the application which were desktop based, the current version is web-based. For this study, we use the current web application which is based
1 The 10-County Southwestern Pennsylvania area includes: Allegheny, Armstrong, Beaver, Butler, Fayette, Greene Indiana, Lawrence, Washington, Westmoreland. 2 Per capita personal income in 2018 in Beaver County was $48,763 according to the Bureau of Economic Analysis, 21% higher than the Clinton et al. study (2014).

Updated Economic Impact Study: Beaver County Petrochemical Facility
3
on 2018 tax data in 2020 dollars. The multipliers in the application are the foundation upon which the input-output model estimates the potential impact of economic change. The multipliers express the resultant economic change that occurs in a region given a particular impact.
1.1 Summary of Economic Impact
The analysis in this study shows that the proposed petrochemical facility will provide positive economic benefits in Pennsylvania, SWPA, and Beaver County. Below is a brief summary of the economic impact findings of this study as it relates to labor.
• Pennsylvania Economic Benefits o Construction of the Project resulted in an average, annual increase for Pennsylvania
resident workers of 3,947 jobs over the nine and a half years of Project construction totaling an estimated 33,550 employee-years – the total amount of employment time calculated as one full-time employee per year. Including indirect and induced effects total statewide labor income associated with the Project construction resulted in $1.5 billion; $200 million greater than the high end of earlier estimates. Total Pennsylvania value added is estimated at $1.8 billion.
o It is estimated that ongoing operations at the Project will generate 600 permanent jobs in Pennsylvania. For purposes of this study, project operations are reported to have begun in 2019 with approximately 200 permanent employees. With multipliers, approximately 11,197 total new jobs are expected to be added statewide as a result of the Project. Total labor income from ongoing operations (direct, indirect and induced) over the assumed 40-year operation period is projected at $22.4 billion. Total Pennsylvania value added from ongoing operations is projected at $81.7 billion.
• SWPA Economic Benefits o The construction phase is estimated to have directly employed an annual average of
1,802 workers residing in SWPA. Indirectly construction involved approximately 1,3693 workers in the region after taking multipliers into consideration. The Project’s total regional labor income for the construction phase is projected at $1.9 billion. Value added in the region is estimated at $2.7 billion.
o Operations for the petrochemical facility are estimated to add 540 jobs held by workers residing within SWPA starting in 2020; consistent with the Clinton et al. (2014) study, we assume that 10-percent of the employees will reside outside of SWPA. With multipliers, the total number of regional jobs added as a result of the Project operations is estimated to be 10,127. Total labor income (direct, indirect and induced) is projected at $813 million per year. Over the assumed 40-year operating life of the Project, total regional labor income is projected at $20.4 billion. Annual value added in the region is estimated at $3.3 billion. Over the assumed 40-year operating life of the Project, total present value added is modeled to be $72.5 billion.
• Beaver County Economic Benefits
3 NOTE: While the numbers reported here appear smaller relative to the 2014 study (Clinton, et al, 2014), the actual labor results are very similar. The 2014 study estimated 5 years of construction; the actual construction period with site prep is expected to take a total of 9.5 years contingent upon State mandated shutdowns.

Updated Economic Impact Study: Beaver County Petrochemical Facility
4
o Over the 9.5-year construction phase, estimates based on reported construction numbers and assumed local employment rates suggest an average of approximately 605 Beaver County residents directly employed annually; with employment of Beaver County residents increasing by 251 after taking multipliers into consideration. The estimate of Beaver County residents is based on percentages consistent with the Clinton et al. (2014) study. Labor income related to employment of Beaver County residents is estimated to have risen by $513 million during the construction period for the Project. Total Beaver County value added attributable to the Project construction is estimated to be approximately $693 million.
o Commencing sometime in 2022 (Royal Dutch Shell plc, 2020), reports suggest that the operation of the Project will involve approximately 600 total employees. Of these, the projection is that Project operations will involve approximately 240 to 450 new jobs for Beaver County residents at the petrochemical facility. With multipliers, total new jobs held by Beaver County residents are anticipated to be between 777 and 1,444. Annual labor income increases in Beaver County will be between approximately $73 and $120 million. Over the 40-year operational life of the Project, labor income increases within Beaver County are estimated to total between $1.5 and $2.4 billion. Annual value added in Beaver County would be between $260 and $846 million. Over the assumed 40-year operation period, this equates to a present value of $10.3 to $16.7 billion.
The above described economic impact conclusions are summarized in Table 1.

Updated Economic Impact Study: Beaver County Petrochemical Facility
5
Table 1 Summary of Projected Economic Impact
Pennsylvania Employees Labor Labor Income Value Added Direct Total Total Total
2014-2022 Construction 2,252 3,947 $1,454,486,617 $1,778,850,298 Annual Operations 600 11,197 $1,012,469,516 $3,694,683,105 40 years Operations 600 11,197 $22,384,414,397 $81,684,748,403
SWPA Employees Labor Labor Income Value Added Direct Total Total Total
2014-2022 Construction 1,802 3,171 $1,873,173,963 $2,676,124,205 Annual Operations 540 10,127 $925,369,760 $3,280,676,985 40 years Operations 540 10,127 $20,451,900,327 $72,541,057,771
Beaver County
Employees Labor Labor Income Value Added Direct Total Total Total
Low Range 2014-2022 Construction 605 856 $513,781,733 $693,144,865 Annual Operations 240 777 $73,372,898 $ 260,366,965 40 years Operations 240 777 $1,518,907,523 $ 10,287,598,709 High Range 2014-2022 Construction 605 856 $513,781,733 $693,144,865 Annual Operations 450 1,444 $120,300,506 $846,255,117 40 years Operations 450 1,444 $2,371,895,064 $16,685,119,689
1.2 Summary of Wage Tax Impact
Beyond just the positive labor economic benefits in Pennsylvania, SWPA, and Beaver County are the wage tax benefits from the additional labor income. Below is a brief summary of the economic impact findings of this study as it relates to wage taxes. • Pennsylvania, SWPA, and Beaver County Earned Income Tax Revenue
o Construction labor income generated personal income tax revenues for Pennsylvania and for SWPA during the seven-year construction. Applying the state tax rate of 3.07% and local tax rates of 1%4 to the wages portion of labor income produces an estimate for state and local income taxes from construction labor of $73.1 million for Pennsylvania as a whole: $55.1 million in state income tax and $18.0 million in local income tax. For SWPA the Project generated an estimated $57.1 million in state and local taxes from construction labor: $43.1 million in state income tax and $14.0 million in local income tax. For Beaver County the state and local income tax increase from construction labor is estimated to be $15.7 million: $11.8 million in state income tax and $3.9 million in local income tax.
4 We recognize that tax rates across the state range from 1 to 3%; we opted for the conservative estimate of 1%.
Updated Economic Impact Study: Beaver County Petrochemical Facility
6
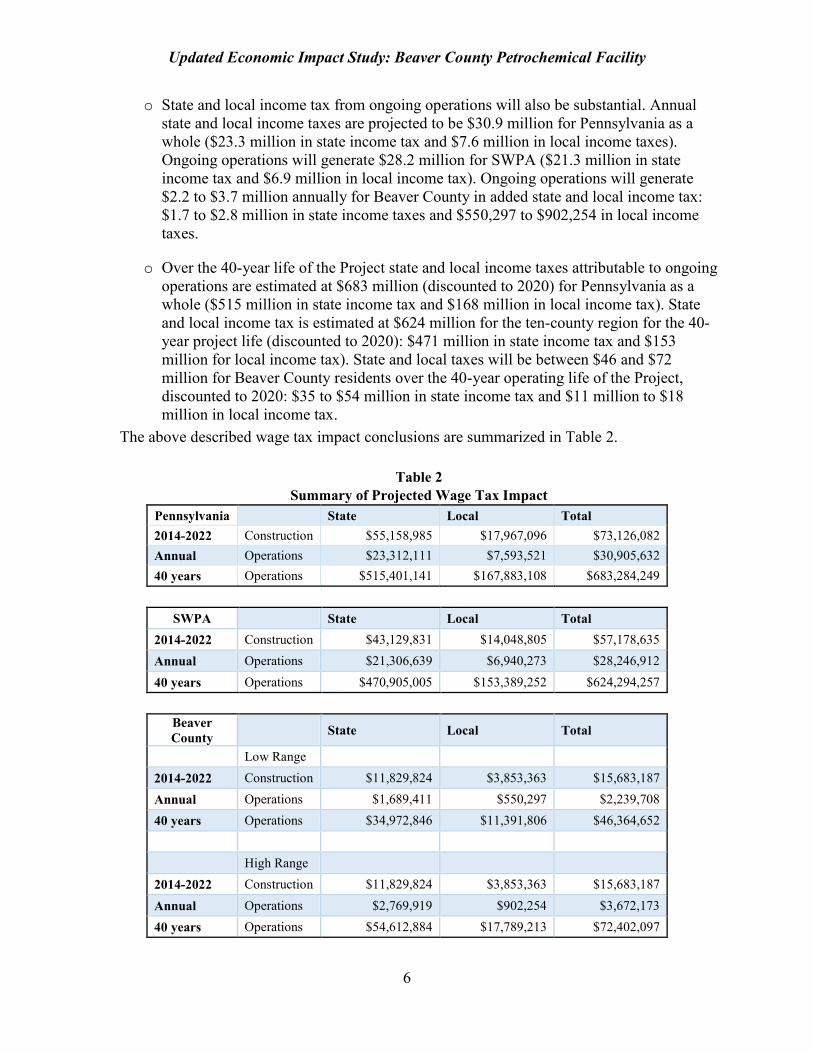
o State and local income tax from ongoing operations will also be substantial. Annual state and local income taxes are projected to be $30.9 million for Pennsylvania as a whole ($23.3 million in state income tax and $7.6 million in local income taxes). Ongoing operations will generate $28.2 million for SWPA ($21.3 million in state income tax and $6.9 million in local income tax). Ongoing operations will generate $2.2 to $3.7 million annually for Beaver County in added state and local income tax: $1.7 to $2.8 million in state income taxes and $550,297 to $902,254 in local income taxes.
o Over the 40-year life of the Project state and local income taxes attributable to ongoing operations are estimated at $683 million (discounted to 2020) for Pennsylvania as a whole ($515 million in state income tax and $168 million in local income tax). State and local income tax is estimated at $624 million for the ten-county region for the 40-year project life (discounted to 2020): $471 million in state income tax and $153 million for local income tax). State and local taxes will be between $46 and $72 million for Beaver County residents over the 40-year operating life of the Project, discounted to 2020: $35 to $54 million in state income tax and $11 million to $18 million in local income tax.
The above described wage tax impact conclusions are summarized in Table 2.
Table 2 Summary of Projected Wage Tax Impact
Pennsylvania State Local Total 2014-2022 Construction $55,158,985 $17,967,096 $73,126,082 Annual Operations $23,312,111 $7,593,521 $30,905,632 40 years Operations $515,401,141 $167,883,108 $683,284,249
SWPA State Local Total 2014-2022 Construction $43,129,831 $14,048,805 $57,178,635 Annual Operations $21,306,639 $6,940,273 $28,246,912 40 years Operations $470,905,005 $153,389,252 $624,294,257
Beaver County State Local Total
Low Range 2014-2022 Construction $11,829,824 $3,853,363 $15,683,187 Annual Operations $1,689,411 $550,297 $2,239,708 40 years Operations $34,972,846 $11,391,806 $46,364,652 High Range 2014-2022 Construction $11,829,824 $3,853,363 $15,683,187 Annual Operations $2,769,919 $902,254 $3,672,173 40 years Operations $54,612,884 $17,789,213 $72,402,097

Updated Economic Impact Study: Beaver County Petrochemical Facility
7
1.3 Benefit to and Burden on State and Local Government
Any new fiscal benefits for state and local government are subject to the interpretation and application of the Pennsylvania state and local tax structure. We assume that the relatively brief duration and concentrated nature of the construction phase and the importation of workers from surrounding states and counties meant that any increased burden on local government services was small. There may have been a temporary increase in the demand for utilities, and once the facility is completed, a small increase in utility demand will continue. We do not anticipate such continued demand burdening the existing infrastructure. As a result, we have not attempted to measure benefits and burdens for state and local government in this study.
1.4 Benefits That Cannot be Quantified and Non-Economic Benefits
The study is focused on the quantitative economic benefits resulting from the construction and operation of the proposed Project. There are qualitative non-economic benefits associated with the Project as well as economic benefits that are difficult to quantify. Examples include providing a dependable feedstock at lower cost for the region’s existing plastics industry as well as avoiding long and costly transportation of polyethylene from Gulf Coast facilities. These qualitative and non-economic benefits are beyond the analysis presented in this report, but are described in other Project-related documents.
1.5 Study Assumptions
As with any economic study, the results of this investigation are sensitive to the assumptions that underlie the work. The assumptions for the study are set forth throughout the discussion. They are summarized in Exhibit A.
2. Scope of the Study
2.1 Introduction
Shell engaged the Robert Morris University School of Business research team of Drs. Clinton, Minutolo, and O’Roark (described in Exhibit B) to provide an independent analysis of the economic impact of the construction and operation of the contemplated petrochemical facility project under development on the property located in Potter and Center Townships (near Monaca) in Beaver County, Pennsylvania. This analysis examines various direct economic changes in job creation and overall economic output, focusing on the construction and operational phases of the Project. Additionally, the multiplicative impacts of the Project are considered.
2.2 Methodology
Three types of economic impacts are examined in this analysis. The first and most apparent is the direct economic impact. Direct economic impacts include the newly created jobs and associated

Updated Economic Impact Study: Beaver County Petrochemical Facility
8
incomes arising from workers engaged in direct construction and operation of a project, and are the easiest to measure. Indirect effects are also assessed. Such indirect effects include the economic benefits that accrue to businesses that provide goods, services and support to the Project. Indirect effects include purchases by individuals and businesses who provide goods, services and support to the Project. Local firms may have to hire new staff and purchase additional inputs to meet increased demand for their goods and services. Finally, induced impacts arise as a result of changes in consumer behavior. Local spending by households directly employed as a result of this new petrochemical plant as well as any new wages to employees of the firms who indirectly benefit from the new facility give rise to induced employment, labor income, value added, and output. Construction expenditures and employment projections used for this analysis were obtained from publicly available sources referenced throughout the paper and provided in the reference section of this document. These estimates together with public information from other similar projects formed the basis for the calculation of direct economic impacts. These data were then processed through the IMPLAN5 web-based econometric modeling application to generate estimates of the indirect and induced effects. The outcome is an estimation of the potential economic activity from the construction and continued operation of the proposed complex. Within the IMPLAN application model, the “event” selected for the construction phase of the economic impact is category number 35, “Construction of new nonresidential manufacturing structures.” Operations expenditures and employment projections used for this analysis were also obtained from publicly available sources referenced throughout the paper and provided in the reference section of this document. These estimates together with public information from other similar projects formed the basis for the calculation of direct economic impacts. These data were then processed through the IMPLAN web-based econometric modeling application to generate estimates of the indirect and induced effects. The outcome is an estimation of the potential economic activity from the construction and continued operation of the proposed complex. Within the IMPLAN application model, the “event” selected for the operations phase of the economic impact is category number 154, “Petroleum Refiners.” The authors of the Clinton, et al. (2014) study state in Footnote 7 that they rely on the multiplier in the IMPLAN application with “caution”. The authors state that “a multiplier of 13 is very large and may overstate the total job creation related to permanent operations.” IMPLAN bases its industry classification schemes on the Bureau of Economic Analysis (BEA) industry classifications. Every five years, BEA updates its industry classification schemes to more accurately reflect the changing United States economy and IMPLAN updates its classifications to align with the BEA. The 2014 study relied upon IMPLAN which at that time included 440 industries (base year 2012). Currently (base year 2018), the IMPLAN dataset includes 546 industries which means that the level of refinement of the dataset is more detailed. While the 2014 study gave the multiplier as 13 for industry code 157, Petroleum Refineries, the 2018 dataset multiplier for 157 is significantly lower. While the dataset includes a classification for 159 Petrochemical Manufacturing, there is no multiplier and no underlying data to model the economic impact on since there is currently no such activity
5 The current version of IMPLAN application uses 2018 as a base year for pricing.

Updated Economic Impact Study: Beaver County Petrochemical Facility
9
within the state of Pennsylvania. Therefore, the nearest analogous industry and multiplier to the previous study, Petroleum Refineries, was selected. Following issuance of required permits, site preparation and construction commenced in 2014. Shell, in its investor reports, lists the completion of construction as 2022+ (Royal Dutch Shell plc, 2020), and has indicated construction would be completes early this decade. For this report, we have chosen the middle of 2022 lacking any additional data points contingent upon state ordered shutdowns or limits due to the novel coronavirus, COVID-19. In estimating the total value of impacts over the nine and a half-year construction period, the annual values in each year are discounted back to a present value stated in 2020 dollars, For the purposes of this study, we use the Wall Street Journal prime rate of 3.25% to determine such present discounted values. Additionally, in this analysis, we derived estimates of the impact of Project operations based on an assumed 40-year operational life of the petrochemical facility. The long-term projected value of the Project is discounted to deal with inflation. Discounted cash flow techniques are designed to take into account the time value of money. In determining such present discounted values, again this study used the Wall Street Journal prime rate of 3.25%.6 The economic projections provided by this modeling method should be understood to be estimates. Due to the unpredictable nature of the economy, changing government regulations, and technological developments, neither the research team nor Shell can guarantee specific levels of economic activity, profits, costs, or benefits to the immediate and surrounding areas.
2.3 Introduction to Economic Impact Analysis
Most business decisions have consequences for an economy. For example, a petrochemical facility project like the one under construction by Shell will increase economic activity in the area where the facility is constructed and operated. Additionally, there will be broader impacts in the region and at the state level. Economic impact analysis projects are forecasts of what will happen to an economy when substantial changes occur. The most common measures of economic impact are total employment, aggregate personal income, value added and business output. “Total employment” considers the number of jobs produced by an economic event. “Aggregate personal income” relates to the wages and benefits provided by the change in jobs. It is noted that labor income includes both employee benefits as well as wages. “Value added” is the equivalent of gross state product at the state level or gross regional product at the regional level. This measure includes wage income and business entity profits. “Output” is the total production value of an industry, it includes all components of production value for a given industry. This is referred to as the Leontief Production Function. When evaluating the economic impact it is important to consider both direct effects of a project as well as indirect and induced effects. The indirect and induced impacts constitute “multiplier effects” because they reflect broader changes in economic activity than the initial direct effect.
6 For comparison purposes, we have also calculated results based on the LIBOR rate of 0.79% not presented herein.

Updated Economic Impact Study: Beaver County Petrochemical Facility
10
Economic models are often used to forecast economic impact. One of the more common is an input/output model which is based upon accounting tables that show how purchases and sales are linked within an industry. The model produces the multipliers that are used to calculate the indirect and induced effects. Among the more popular input/output models are the IMPLAN model produced by IMPLAN, Inc. and the Regional Input/ Output Multiplier System (RIMS-II) produced by the US Bureau of Economic Analysis. As noted above, for this study we used IMPLAN web application. Finally, in order to use economic impact models it is necessary to specify the study area. For purposes of evaluating the economic impact of the proposed petrochemical facility in Beaver County we considered three areas of study: (1) the Commonwealth of Pennsylvania, (2) SWPA, and (3) Beaver County. Additionally, we specify the Multiple Region Input-Output (MRIO) model which recognizes the spillover effects across the regions of study. In expressing the results from the economic modeling effort, the tables and text in the following sections provide numeric model outputs as they are produced by the IMPLAN web application model runs. No efforts have been made to “round” those results. However, it should be understood that although model results may be expressed in what appear to be precise numbers (e.g., 11,197 jobs created) all such model results are estimates of approximate values.
3. Economic Impact Resulting from Shell Project
3.1 Overall Impacts
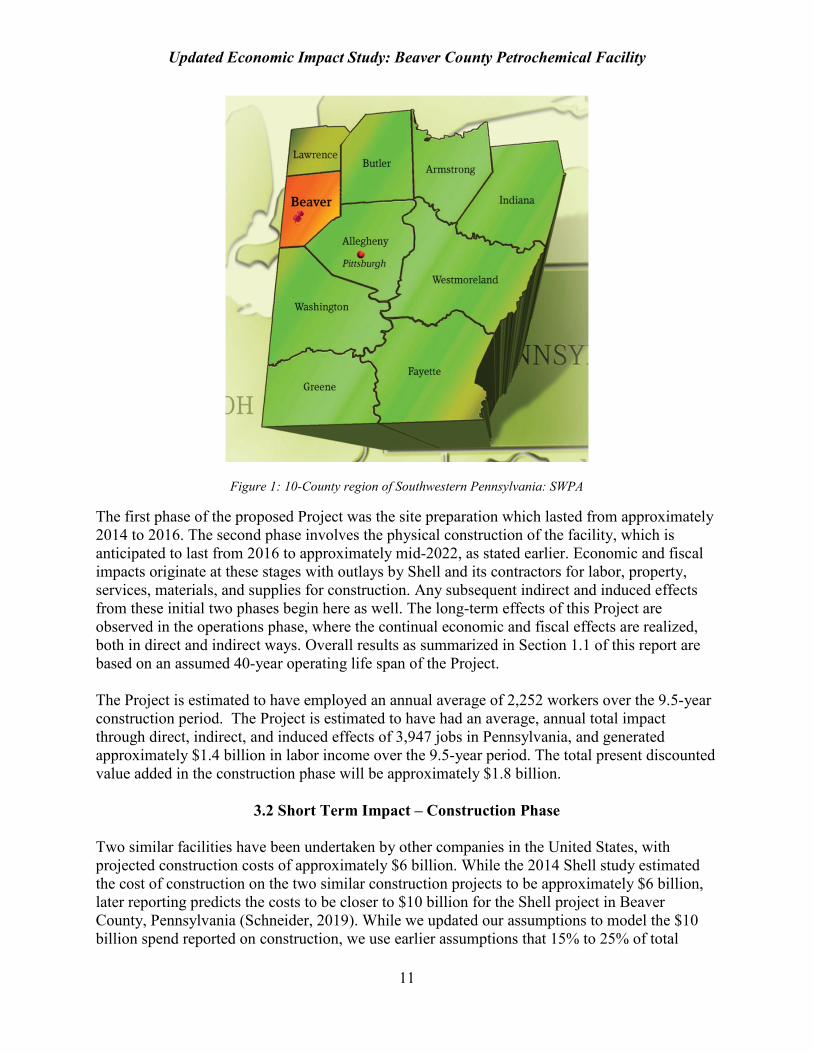
Most of the impact for the proposed Project is expected to occur in Beaver County, Pennsylvania and SWPA, illustrated in Figure 1. While it is anticipated that border counties in Ohio and West Virginia will be impacted, they are excluded from this analysis.
Updated Economic Impact Study: Beaver County Petrochemical Facility
11
Figure 1: 10-County region of Southwestern Pennsylvania: SWPA
The first phase of the proposed Project was the site preparation which lasted from approximately 2014 to 2016. The second phase involves the physical construction of the facility, which is anticipated to last from 2016 to approximately mid-2022, as stated earlier. Economic and fiscal impacts originate at these stages with outlays by Shell and its contractors for labor, property, services, materials, and supplies for construction. Any subsequent indirect and induced effects from these initial two phases begin here as well. The long-term effects of this Project are observed in the operations phase, where the continual economic and fiscal effects are realized, both in direct and indirect ways. Overall results as summarized in Section 1.1 of this report are based on an assumed 40-year operating life span of the Project. The Project is estimated to have employed an annual average of 2,252 workers over the 9.5-year construction period. The Project is estimated to have had an average, annual total impact through direct, indirect, and induced effects of 3,947 jobs in Pennsylvania, and generated approximately $1.4 billion in labor income over the 9.5-year period. The total present discounted value added in the construction phase will be approximately $1.8 billion.
3.2 Short Term Impact – Construction Phase
Two similar facilities have been undertaken by other companies in the United States, with projected construction costs of approximately $6 billion. While the 2014 Shell study estimated the cost of construction on the two similar construction projects to be approximately $6 billion, later reporting predicts the costs to be closer to $10 billion for the Shell project in Beaver County, Pennsylvania (Schneider, 2019). While we updated our assumptions to model the $10 billion spend reported on construction, we use earlier assumptions that 15% to 25% of total

Updated Economic Impact Study: Beaver County Petrochemical Facility
12
construction outlays were spent in Pennsylvania. Based on this information, this study projects Pennsylvania construction spending for the proposed Shell facility in a range of $1.5 to $2.5 billion.
3.3 Pennsylvania Construction Spending and Employment
Reports suggest that at the height of construction, there will be approximately 8,500 construction workers working on the Project in 2020. However, due to the COVID-19 pandemic, construction was halted in March 2020. When restrictions were relaxed, construction resumed in May. Reports suggest that an initial 800 workers returned to the site in early May with 300 additional workers returning per week until peak construction was resumed. The monthly labor numbers are publicly reported estimates that fell and rose due to COVID-19 related restriction. We model average monthly labor numbers to produce an annual labor estimate of all construction workers over the construction period (see Table 2). The economic impacts reported in the following sections are based on the estimated Pennsylvania workforce staffing projections reported in Table 2. It is important to note that construction labor is not uniform over time, and estimates had to be derived. For instance, in December of 2019, the construction labor was reported at 6,250 while in February of 2020 it was reported to be 8,000 and 8,500 in March before the Project was shut down due to the coronavirus (Esposito, 2020; Litvak, 2020). Additionally, Shell in its investor reports list the completion of construction as 2022+ (Royal Dutch Shell plc, 2020), and has indicated construction would be completes early this decade. For the report, we have chosen the middle of 2022 lacking any additional data points. Hence, we estimate an average annual construction labor force of 5,917 throughout 2020, 5,333 through 2021 and 458 in 2022 as the construction is wrapped-up, punch-list items completed, and the facility is brought online.
Consistent with the Clinton et al. (2014) study, we also estimate economic impact for 10 counties in SWPA (Allegheny, Beaver, Armstrong, Butler, Fayette, Green, Indiana, Lawrence, Westmoreland and Washington) assuming that 80% of the Pennsylvania construction spending will take place in these 10 counties (see Table 3).
Table 3
Pennsylvania Construction Workforce by Year Year 2014 2015 2016 2017 2018 2019 2020 2021 2022 Jan 400 400 400 400 1000 3500 7500 6500 2000 Feb 400 400 400 400 1250 3750 8000 6500 1500 Mar 400 400 400 400 1500 4000 8000 6500 1000 Apr 400 400 400 400 1750 4250 0 6500 500 May 400 400 400 500 2000 4500 800 6500 250 Jun 400 400 400 600 2250 4750 2000 6500 250 Jul 400 400 400 700 2500 4750 3200 6000 0 Aug 400 400 400 800 2750 5000 5000 5500 0 Sep 400 400 400 900 2750 5500 6200 4500 0 Oct 400 400 400 1000 3000 6000 6500 3500 0 Nov 400 400 400 1000 3000 6250 6500 3000 0 Dec 400 400 400 1000 3250 6250 6500 2500 0
NOTE: Numbers in bold were reported in publicly available sources cited in references herein.
Updated Economic Impact Study: Beaver County Petrochemical Facility
13
We estimated the beginning of the operations and completion of the construction based on reports of completion and start prior to COVID and what the labor time would look like post-COVID shutdown. We assumed approximately one year to completion prior to shutdown with tapering of labor to estimate total labor hours. With a report of 6,500 laborers post-shutdown, we extended the time out to reflect the total labor hours. The extension is consistent with Shell’s quarterly report (Royal Dutch Shell plc, 2020).
3.4 SWPA Construction Spending and Employment
We also estimate economic impact for 10 counties in SWPA (Allegheny, Beaver, Armstrong, Butler, Fayette, Green, Indiana, Lawrence, Westmoreland and Washington) assuming that 80% of the Pennsylvania construction spending will take place in these 10 counties. Consistent with the Clinton et al. (2014) study, we estimate that 80% of the Pennsylvania construction workforce will come from SWPA (see Table 2).
3.5 Beaver County Construction Spending and Employment
Finally, we estimate the economic impact for Beaver County. Again, in-line with the Clinton et al. (2014) study, we estimate that 20% of construction workers will come from Beaver County (see Table 2).
3.6 Permanent Jobs
After construction (starting in 2021) the Beaver County petrochemical facility will employ 600 fulltime people who will live and work in the region. We model the economic impact of this job creation on the Pennsylvania economy assuming that all workers who fill these jobs will reside in the Commonwealth. We also model the economic impact in SWPA assuming that 90% of the people who fill the new jobs reside in the region. Thus, 540 new jobholders will work and live in SWPA. Finally, we consider the impact of the new jobs on Beaver County. Based on comparative commuting patterns we assume that 40% to 75% of the people who fill the new jobs will live in Beaver County, generating 240 to 450 new jobs for people who reside there. We use the IMPLAN web application to model the economic impact of these jobs on category number 157, Petroleum Refinery operation.7
3.7 Economic Impact
3.7.1 Pennsylvania Economic Impact – Construction
Table 3 shows the economic impact of the construction project on the Pennsylvania economy as produced by the IMPLAN web application. The annual average number of workers at the Beaver County Project from Pennsylvania is estimated to be 2,252. When multipliers for indirect and induced effects are taken into consideration, the total employment impact is estimated at 3,947 workers. Pennsylvania construction is expected to generate approximately $1.5 billion in direct
7 Because there is no current refinery operation in region, we created a multiplier to estimate the SWPA and Beaver impacts based on state results.

Updated Economic Impact Study: Beaver County Petrochemical Facility
14
labor income in Pennsylvania. Total impact on Pennsylvania’s labor income is estimated at $2.4 billion. The total value added to Pennsylvania’s state domestic product during the construction phase is estimated to be nearly $3.4 billion (see Table 4).
Table 4 Construction Phase Impact on Pennsylvania Economy
Pennsylvania Impact Type Employees Labor Income Value Added Direct Effect 2,252 $1,454,486,617 $1,778,850,298 Indirect Effect 564 $384,319,782 $642,559,392 Induced Effect 1,131 $556,806,433 $934,514,681 Total Effect 3,947 $2,395,612,831 $3,355,924,371
3.7.2 Pennsylvania Economic Impact – Ongoing Operations
Table 5 shows the annual Pennsylvania economic impact relating to ongoing operations of the Project. As noted above, ongoing operations are expected to produce 600 jobs in Pennsylvania (this is the direct effect on labor). The direct labor income attributable to these jobs will be approximately $133 million. Counting indirect effects and induced effects, total employment on an annual basis in Pennsylvania can be expected to increase by 11,197 jobs with total labor income of approximately $1 billion annually.8 Using the current Wall Street Journal prime rate of 3.25% for discounting a 40-year annuity, the discounted value of the labor income streams for the projected 40 years of plant operation (the start year for ongoing operations) is approximately $22.4 billion. Annually, operation of the petrochemical facility will generate approximately $3.7 billion in value added for Pennsylvania. Over the 40-year life of the Project this will generate $81.7 billion in value added.
Table 5 Operations Phase Impact on Pennsylvania Economy
Pennsylvania
Impact Type Employees Labor Income Value Added Direct Effect 600 $132,841,880 $1,514,969,124 Indirect Effect 6,336 $646,562,243 $1,788,646,049 Induced Effect 4,261 $233,065,393 $391,067,933 Total Effect 11,197 $1,012,469,516 $3,694,683,106
8 The average wages and benefits for each of these jobs is $221,403. Given that most of these jobs are high-paying and that top-end supervisory positions for a petrochemical facility of this complexity pay quite well (producing an outlier effect) the IMPLAN web application wage rates are supportable. While we are unable to disclose specific multipliers, they range from a low of 1.01 to 24.24. We rely on the multiplier with great caution.

Updated Economic Impact Study: Beaver County Petrochemical Facility
15
3.7.3 Pennsylvania State and Local Income Taxes
The project is expected to exert a substantial impact on state and local taxes. There will be a number of tax impacts such as income tax, property tax, and licenses and permits. The income tax is the most tractable. We assume a 3.07% state income tax rate for the Pennsylvania wage income and a 1% local rate. Given that labor income in the model includes both wages and benefits we assume that benefits are 34% of wages9 so that 75% of labor income would be taxed as wages and 25% would not be taxed because it relates to nontaxable benefits.10 We estimate the total state and local income tax on $2.4 billion of construction wages and their multiplier effects to be $73 million: $55 million in state income tax and $18 million in local income tax.
Similarly, we estimate annual state and local income taxes on wages earned in connection with the new jobs created by ongoing operations of the Project to be $31 million annually: $23 million in state income tax and $8 million in local income tax. During the assumed 40 years of the Project life, the NPV of the total state and local tax revenues are expected to be approximately $683 million: $515 million in state income tax and $168 million in local income tax; assuming no changes in taxation rates (see Table 2).
3.8 SWPA Economic Impact
As described above, we also modeled the economic impact of the Project on SWPA, assuming that 80% of the Pennsylvania construction spending would be spent in the region and that 90% of the employees hired for ongoing operations will live in SWPA. Permanent operations will generate 540 new jobs for people who reside in the area.
3.8.1 SWPA Economic Impact – Construction
Based on our assumptions, the Project construction created an annual average of 1,802 in direct jobs in SWPA and total jobs beyond those directly employed through indirect and induced effects of 3,171. As shown in Table 6 below, labor income in the region increased by $1.1 billion in direct impact and $1.9 billion in total labor income. Total value added in SWPA is estimated to be $2.7 billion.
9 Benefit percentages based on a review of grant applications. 10 The IMPLAN model provides an estimate of state and local income taxes.

Updated Economic Impact Study: Beaver County Petrochemical Facility
16
Table 6
Construction Phase Impact on SWPA Economy
SWPA Construction Impact Type Employees Labor Income Value Added Direct Effect 1,802 $1,139,383,384 $1,422,814,514 Indirect Effect 439 $289,027,239 $494,867,404 Induced Effect 930 $444,763,340 $758,442,287 Total Effect 3,171 $1,873,173,963 $2,676,124,205
3.8.2 SWPA Economic Impact – Operations
There will be an estimated 540 jobs created directly in SWPA in connection with project operations. Direct labor income is projected to be approximately $119 million per year resulting in an NPV of $2.6 billion over the life of the facility as shown in Table 7 below. The total effect of the Project on permanent employment in the 10-county area on an annual basis will be the addition of 10,127 jobs with annual labor income of $925 million (not reported in table). After discounting, the total labor income over the assumed 40-year project life will be $20 billion. Total discounted annual value added attributable to ongoing operations over 40 years in SWPA will be $73 billion.
Table 7
NPV of Operations Phase Impact on SWPA Economy
SWPA Operations Impact Type Employment Labor Income Value Added Direct 540 $2,630,957,792 $29,266,255,871 Indirect 5,843 $12,998,060,276 $35,052,744,980 Induced 3,744 $4,822,882,259 $8,222,056,920 10,127 $20,451,900,327 $72,541,057,771
3.8.3 SWPA Impact on State and Local Taxes
The project will also have a substantial impact on state and local taxes in SWPA. In SWPA between 2014 and 2021, state and local taxes are estimated to have increased by $57 million as a result of the construction of the Project: $43 million for state income tax and $14 million in local income taxes.
State and local taxes in SWPA are expected to increase as a result of ongoing operations of the Project. The project is expected to increase state and local revenues in the region by approximately $28 million annually: $21 million in state income taxes and $7 million in local income taxes.

Updated Economic Impact Study: Beaver County Petrochemical Facility
17
Over the assumed 40-year life of the Project, additional income tax revenues are projected to be $624 million: $471 million for state income taxes and $153 million in local income tax.
3.9 Beaver County Economic Impact
Finally, we model the economic impact of the Project on Beaver County. As noted above, the assumption for this model is that 20% of the Pennsylvania construction spending will be spent in Beaver County and that 40% to 75% of the new employees engaged in ongoing operations will reside in Beaver County.
3.9.1 Beaver County Economic Impact – Construction
Table 8 summarizes the Beaver County construction economic impact between 2014 and 2022. The project annually employed an estimated 605 workers from Beaver County with direct labor income estimated at $417 million. Including indirect and induced effects Beaver County employment increased by 856 jobs with total labor income from the Project (direct, indirect and induced impact) of $514 million. The project’s direct, indirect and induced value added to Beaver County is estimated at $693 million.
Table 8
Construction Phase Impact on Beaver County Economy
Beaver Construction Impact Type Employees Labor Income Total Value Added Direct Effect 605 $417,063,111 $525,448,498 Indirect Effect 82 $39,811,274 $66,047,649 Induced Effect 169 $56,907,348 $101,648,718 Total Effect 856 $513,781,733 $693,144,865
3.9.2 Beaver County Economic Impact – Operations
In addition to the economic impact of the construction phase, ongoing operations in Beaver County are anticipated to produce between 240 and 450 jobs. The annual economic impact of this is described in Table 9. The model projects 240 to 450 ongoing jobs with direct annual labor income between $40 million and $67 million (not reported in the table). After including indirect and induced effects, the new jobs at the Project will create between 777 and 1,444 new jobs with $73 million to $120 million in labor income (not reported in the table). Over the 40-year project life, these jobs will produce between $1.5 billion and $2.4 billion in labor income for Beaver County residents. Total annual value added in Beaver County by ongoing operations at the facility is predicted to be between $260 million and $846 million (not reported in the table). Over the 40 year life of the Project, value added is projected to be between $10 billion and $17 billion.
Table 9

Updated Economic Impact Study: Beaver County Petrochemical Facility
18
Operations Phase Impact on Beaver County Economy
Beaver County Operations Low Impact Type Employees Labor Income Value Added Direct Effect 240 $886,601,083 $8,699,545,320 Indirect Effect 267 $386,367,068 $1,127,403,721 Induced Effect 270 $245,939,372 $460,649,668 Total Effect 777 $1,518,907,523 $10,287,598,709 Operations High Impact Type Employees Labor Income Value Added Direct Effect 450 $1,325,830,212 $14,050,681,467 Indirect Effect 501 $646,049,216 $1,885,145,908 Induced Effect 494 $400,015,636 $749,292,314 Total Effect 1,444 $2,371,895,064 $16,685,119,689
3.9.3 Beaver County Impact on State and Local Taxes– Construction
Construction of the Project in Beaver County enhanced state and local revenue as Beaver County residents employed in the construction paid state and local taxes. We estimate that Project construction generated an additional $16 million in Pennsylvania and local income taxes during the eight years of project construction: $12 million in state income tax and $4 million in local income taxes.
Further, there will be annual additional state and local tax revenue related to the creation of additional jobs in the county. Annual state and local tax revenue attributable to the employment of Beaver County at the Project will be between $2.2 and $3.7 million: $1.7 to $2.8 million for state income taxes and $550,000 to $902,000 in local income tax. For the 40-year life of the Project these tax revenue streams will produce $46 to $72 million: $35 to $54 million in added state income tax and $11 to $18 million in local income taxes.

Updated Economic Impact Study: Beaver County Petrochemical Facility
19
4. Summary of the Discounted Present Value from Ongoing Operations
As an accessible reference, we provide a summary of the estimated discounted present value from ongoing operations in Table 10. In the table, we include both the low and high PV at the State, SWPA, and Beaver County level. Included are measures of total labor income, total value added, and total output. Additionally, we have included summary estimates of the PV of total tax revenue as well as a breakdown for the state and local taxes.
Table 10 Summary of Discounted PV of Ongoing Operations
Pennsylvania Labor Income $22,384,414,397 Value Added $81,684,748,403 Total Output $202,472,060,541 Total Tax $683,284,249 State Tax $515,401,141 Local Tax $167,883,108 SWPA Labor Income
$20,451,900,327
Value Added $72,541,057,771 Total Output $175,074,469,359 Total Tax $624,294,257 State Tax $470,905,005 Local Tax $153,389,252 Beaver County Low High Labor Income
$1,518,907,523 $2,371,895,064
Value Added $10,287,598,709 $16,685,119,689 Total Output $10,715,328,527 $17,881,869,177 Total Tax $46,364,652 $72,402,097 State Tax $34,972,846 $54,612,884 Local Tax $11,391,806 $17,789,213

Updated Economic Impact Study: Beaver County Petrochemical Facility
20
5. References
Corkery, M. (2019, Aug 12). Deluged by plastics but bustling to make more: [national desk]. New York Times Retrieved from https://reddog.rmu.edu/login?url=https://reddog.rmu.edu:3479/docview/2271663722?accountid=28365 Esposito, F. (2018, Oct 12). Shell Petrochemical Project on Track in Pennsylvania. Rubber & Plastics News, Cuyahoga Falls, OH: Rubber & Plastics News. https://www.rubbernews.com/article/20181012/NEWS/181019974/shell-petrochemical-project-on-track-in-pennsylvania Esposito, F. (2019, Nov 8). Virus concerns halt Shell project construction. Plastics News, Detroit, Michigan: Plastics News Company. https://www.plasticsnews.com/news/shells-massive-petrochemicals-project-takes-shape-pennsylvania Esposito, F. (2020, Mar 3). Shell’s Massive Petrochemicals Project Takes Shape in Pennsylvania. Plastics News, Detroit, Michigan: Plastics News Company. https://www.plasticsnews.com/news/virus-concerns-halt-shell-pennsylvania-project-construction Hamblet, T. (2016, Jun 8). Shell PA Cracker Plant Project a Lot Bigger Than First Thought. Marcellus Drilling News (Online), Kirkwood, New York: Marcellus Drilling News Company. https://marcellusdrilling.com/2016/06/shell-pa-cracker-plant-project-a-lot-bigger-than-first-thought/ Litvak, A. (2020). Shell Says it Will Reintroduce 300 Construction Workers a Week in Ramp Up at Cracker Site. Pittsburgh, Post-Gazette, Pittsburgh, PA: Block Communications. May 13, 2020. https://www.post-gazette.com/business/powersource/2020/05/13/Shell-chemical-Appalachia-reintroduce-300-construction-workers-cracker-Beaver-County-COVID-19/stories/202005130130 Royal Dutch Shell, plc. (2020). Second Quarter 2020 Results: Decisive Actions and Strong Performance Deliver Cash. https://www.shell.com/investors/financial-reporting/quarterly-results/2020/q2-2020.html Schneider, K. (2019). Shell Sees New Role for Former Steel Region: Plastics: Square Feet New York Times (Online), New York: New York Times Company. Mar 26, 2019. https://www.nytimes.com/2019/03/26/business/shell-polyethylene-factory-pennsylvania.html Stonesifer, J. (2017, Nov 8). Shell Officially Starts Construction on $6 Billion Ethane Cracker Plant. The Times, Aliquippa, PA: Gannett Media Corp. https://www.timesonline.com/news/20171108/shell-officially-starts-construction-on-6-billion-ethane-cracker-plant Suttles, C. (2020). Beaver County sees economic growth amid cracker construction. New York Times (Online), New York: New York Times Company. Jan 8, 2020.

Updated Economic Impact Study: Beaver County Petrochemical Facility
21
https://www.timesonline.com/news/20200108/beaver-county-sees-economic-growth-amid-cracker-construction Zuidema, T. (2019, Feb 25). Have Environmentalist Lost Their Battle to Thwart the Petrochemical Industry in Southwest PA? Public Source, Pittsburgh, PA: Public Source. https://www.publicsource.org/have-environmentalists-lost-their-battle-to-thwart-the-petrochemical-industry-in-southwest-pa/

Updated Economic Impact Study: Beaver County Petrochemical Facility
22
EXHIBIT A: Key Study Assumptions
1. Construction continues as planned and the Plant goes online by mid-2022 with full operations.
2. COVID-19 does not significantly impact the planned opening of the Plant by mid-2022. 3. The facility has an assumed operational life of 40 years. 4. Construction employment generates the Pennsylvania jobs as reported in various outlets
as follows.
Year 2014 2015 2016 2017 2018 2019 2020 2021 2022 Jan 400 400 400 400 1000 3500 7500 6500 2000 Feb 400 400 400 400 1250 3750 8000 6500 1500 Mar 400 400 400 400 1500 4000 8000 6500 1000 Apr 400 400 400 400 1750 4250 0 6500 500 May 400 400 400 500 2000 4500 800 6500 250 Jun 400 400 400 600 2250 4750 2000 6500 250 Jul 400 400 400 700 2500 4750 3200 6000 0 Aug 400 400 400 800 2750 5000 5000 5500 0 Sep 400 400 400 900 2750 5500 6200 4500 0 Oct 400 400 400 1000 3000 6000 6500 3500 0 Nov 400 400 400 1000 3000 6250 6500 3000 0 Dec 400 400 400 1000 3250 6250 6500 2500 0 Note: Numbers if BOLD were publicly reported in the media; sources in references
2020 construction was averaged across the year by the reported low at the beginning of the year of 7,500 workers and the estimated high of 6,500, assuming a tapering in 2022 with full operations mid-2022.
5. Permanent workforce for the facility will consist of 600 workers as reported (Suttles, 2020; Esposito, 2018).
6. 80% of construction workers and 90% of permanent workers will reside within the 10-county southwest Pennsylvania region.
7. 20% of construction workers and 40% to 75% of permanent workers will reside in Beaver County.
8. A 3.25% (WSJ11 prime rate) and 0.79% (LIBOR12) discount rates are appropriate for discounting future flows of money.
9. The Pennsylvania personal income tax rate is 3.07% and the local tax rate is 1%.13 10. Total labor income is broken down as: Benefits 32%; and, wages 68%. 11. There is enough labor mobility in SWPA to provide adequate permanent staffing. 12. The underlying accounting tables and the resultant multipliers contained in IMPLAN are
sufficiently reliable to provide sound spending estimates.
11 Source: https://www.bankrate.com/rates/interest-rates/wall-street-prime-rate.aspx 12 Source: https://www.bankrate.com/rates/interest-rates/libor.aspx 13 It should be noted that the true local tax rate in Pennsylvania ranges from 1% to 3%. Therefore, the local tax numbers are likely underestimated.

Updated Economic Impact Study: Beaver County Petrochemical Facility
23
13. There will be a market for the products produced by the proposed ethane cracking facility.

Updated Economic Impact Study: Beaver County Petrochemical Facility
24
EXHIBIT B: State Model Build
The following are the sample parameters that were used for the construction of the Pennsylvania state models. The SWPA and Beaver models were built in a similar fashion but with scaled numbers as detailed in the body of the report.
1. Model year 2014 was set with 400 as the construction labor, “Dollar year 2020”, and industry code 51 - Construction of new manufacturing structures.
2. Model year 2015 was set with 400 as the construction labor, “Dollar year 2020”, and
industry code 51 - Construction of new manufacturing structures.
3. Model year 2016 was set with 400 as the construction labor, “Dollar year 2020”, and industry code 51 - Construction of new manufacturing structures.
4. Model year 2017 was set with 675 as the construction labor, “Dollar year 2020”, and
industry code 51 - Construction of new manufacturing structures. The additional workers were based on the 400 at the beginning of 2017 and 1,000 reported in November. We assumed a gradual growth and averaged out the total for the year.
5. Model year 2018 was set with 2,250 as the construction labor, “Dollar year 2020”, and
industry code 51 - Construction of new manufacturing structures. The additional workers were based on the 1,000 at the beginning of 2018 and 3,000 reported in October. We assumed a gradual growth and averaged out the total for the year.
6. Model year 2019 was set with 4,875 as the construction labor, “Dollar year 2020”, and
industry code 51 - Construction of new manufacturing structures. The additional construction workers were based on the 3,500 at the beginning of 2019 (3,000 from the end of 2018 and an additional 250 hire) and 5,000 reported in August; 6,000 reported in October; and, 6,250 reported in December. We assumed a gradual growth and averaged out the total for the year. Additionally, we were informed that approximately 200 full-time operations workers were on site around June; averaged out, this is 117 Operations employees for 2019. We applied industry code 154 – Petroleum Refineries.
7. Model year 2020 was set with 5,017 as the construction labor, “Dollar year 2020”, and
industry code 51 - Construction of new manufacturing structures. The additional construction workers were based on the 7,500 at the beginning of 2020 and 8,000 reported in February. It was reported that operations shut down completely in April; 8,000 employees at the beginning of March and operations reported to have shutdown completely at the end of the month. It was later reported that 800 employees returned to work in May with 300 returning per week until full complement returns. The 5,017 is the result of averaging out the labor on a monthly basis over the year. Additionally, we were informed that approximately 400 full-time operations workers were on site at the beginning of the year. We assumed a similar “COVID Curve” for the operations employees with a result of 400 by the end of the year preparing for full complement in the beginning in 2022; averaged out, this is 325 Operations employees for 2020. We applied industry code 154 – Petroleum Refineries

Updated Economic Impact Study: Beaver County Petrochemical Facility
25
8. Model year 2021 was set with 5,333 as the construction labor, “Dollar year 2020”, and
industry code 51 - Construction of new manufacturing structures. Construction is assumed to get to 6,500 as COVID related restrictions are lifted then tapering in 2022. The 5,333 is the result of averaging out the labor on a monthly basis over the year. Full-time labor is assumed to reach a high of 600 as the facility prepares for operations; the results are an average of 527 over 2021.
9. Model year 2022 was set with 917 as the construction labor, “Dollar year 2020”, and
industry code 51 - Construction of new manufacturing structures. We assume that construction will draw-down over the year resulting in “0” by mid-2022. We assume that 600 full-time operations workers will be on site. We applied industry code 154 – Petroleum Refineries.
Updated Economic Impact Study: Beaver County Petrochemical Facility
26
EXHIBIT C: The Research Team
Steven Clinton, Ph.D.
Dr. Steven Clinton is a Professor of Marketing at Robert Morris University. He has served as the Department Head for the Department of Marketing and as Associate Dean for Student Success. He has previously held academic appointments at the University of New Orleans (Department of Marketing) and Arizona State University (Department of Supply Chain Management). Dr. Clinton earned his Doctor of Philosophy in Marketing at Michigan State University. He also holds a Master of Science in Taxation (University of Wisconsin-Milwaukee), a Master of International Business Studies (University of South Carolina), and a Bachelor of Arts in French (University of Wisconsin). Dr. Clinton’s research interests include international supply chain organization, customer service in logistics, logistics strategy, and selection processes involving international logistics service intermediaries. He has published in Journal of State Taxation, Journal of Business Logistics, Transportation Journal, International Journal of Physical Distribution and Logistics Management, Journal of Production and Inventory Management, and International Marketing Review as well as numerous conference proceedings. While in the private sector, Dr. Clinton worked in several areas of supply chain management – most notably in international transportation. In 1988 Dr. Clinton earned his customhouse broker’s license from the Department of Treasury. His license remains active today. He has engaged in consulting and executive education with Steelcase Corporation and United Parcel Service.

Updated Economic Impact Study: Beaver County Petrochemical Facility
27
Marcel C. Minutolo, Ph.D., CSSBB
Professor Marcel C. Minutolo is Professor of Strategic Management at Robert Morris University. He earned his Doctorate of Philosophy from the Joseph M. Katz Graduate School of Business in Strategic Management with a minor in Artificial Intelligence. He holds a Master’s in Business Administration, a Graduate Certificate in Asian Studies, and a Bachelor’s of Arts in Philosophy. He is a Certified Six Sigma Black Belt and an AWS Accredited Cloud Practitioner. Marcel Minutolo has been an entrepreneur for over 25 years and a business development consultant for 20. He has taught courses at both the MBA and undergraduate level in strategy, finance, and decision making. He has conference proceedings and publications on technology transfer, mergers and acquisitions, human resources, and decision making. He has consulted with firms on the negotiation of test service agreements, business development plans, and various funding mechanisms into the Department of Defense laboratory systems. His clients have included numerous start-ups, large firms, as well as state and federal organizations. Dr. Minutolo is a former United States Army Military Intelligence Officer. He has been deployed as part of peace keeping operations with the United Nations in Bosnia-Herzegovina, post-Katrina and Rita support, as well as other areas. He is the former commander of the 556 Military Intelligence Company, 56th Stryker Brigade. Dr. Minutolo has conducted research studies for the United Way of Allegheny County, led the strategic planning process for Adagio Health Care and the Veteran Leadership Program of Western Pennsylvania, and has been a partner with Just Harvest. He was awarded the title of “Money Hero” by Money Magazine.

Updated Economic Impact Study: Beaver County Petrochemical Facility
28
Brian O’Roark, Ph.D.
Dr. Brian O’Roark is a University Professor of economics and the B.K. Simon Fellow for the study of Free Enterprise. He previously held an academic position at James Madison University. Dr. O’Roark earned his Ph.D. in economics from George Mason University, concentrating on public finance and law and economics. He also holds a Bachelor of Arts in economics and history from Grove City College. Dr. O’Roark has taught courses at both the MBA and undergraduate level in a variety of fields including managerial economics, the economics of information security, public policy, and law and economics. He has received numerous awards for his teaching at the university and national levels. Dr. O’Roark’s research interests include public finance, the economics of information security, and economic education. Dr. O’Roark serves on the board of advisors and as the editor for the Journal of Economics Teaching, as well as being co-director of the Leonard M. Kokkila Center for Economic Education at Robert Morris University. He is the author of three books and dozens of scholarly articles. He is a regular presenter at academic conferences and has been an invited to speak to groups across the United States and Canada. Dr. O’Roark serves as a representative on the Brady’s Run Sanitary Authority in Beaver County, Pennsylvania. He has consulted with law firms and firms in the energy industry.