up to 4mtpa of rom coal; coal processing and handling at
TRANSCRIPT

S:10723829_9 KQH
24 February 2021
Attention: Chair of Panel Prof Richard Mackay AM Office of the Independent Planning Commission Level 3, 201 Elizabeth Street SYDNEY NSW 2000
Senior Associate Blake Dyer Direct Line (02) 8083 0437 Email [email protected] Partner Breellen Warry Our Ref BXW:BZD:18750088
By email
Dear Professor Mackay
Tahmoor South Coal Project – SSD 17_8445: Underground longwall mining, and associated activities, to extract coal from the Bulli seam within CCL 716 and CCL 747; Coal Extraction of up to 4Mtpa of ROM Coal; Coal processing and handling at the existing Tahmoor Colliery Coal Handling Preparation Plant and Rail Facilities (the Project)
1. We act for Ironlaw Pty Ltd (Ironlaw), the owner of 95 Great Southern Road, Bargo (the Property). The Property is located within the proposed project area subject of SSD 17_8445 (Project). We refer to our previous submission to the Secretary dated 5 March 2019 (March Submission).
2. We wish to make a further objection to the Project on behalf of our client, Ironlaw.
3. This objection refers to the following documents throughout this objection:
(a) Tahmoor South Coal Project: SSD 8445, Planning Secretary’s Environmental Assessment Report, December 2020 (Assessment Report);
(b) Tahmoor South Coal Project: SSD 8445, Preliminary Issues Report, June 2019 (Preliminary Issues Report);
(c) Tahmoor South - Second Project Amendment Report, August 2020 (2nd Amendment Report);
(d) Recommended draft conditions of consent by the NSW Department of Planning, Industry and Environment (DPIE).
Summary of Objection
4. In summary, the Project should be refused on the basis that:
(a) The Project is incompatible with other land uses in the vicinity, contrary to cl 12 of the State Environmental Planning Policy (Mining, Petroleum Production and Extractive Industries)
24 February 2021 Page 2
Submission on SSD 17_8445 Tahmoor South Colliery expansion
S:10723829_9 KQH
2009 (Mining SEPP). In particular, the Proponent has not provided adequate information to allow for assessment of:
(i) the existing uses and approved uses in the vicinity of the Project;
(ii) whether or not the development is likely to have a significant impact on the uses that, in the opinion of the consent authority having regard to land use trends, are likely to be the preferred uses of land in the vicinity of the development; and
(iii) the ways in which the development may be incompatible with any of those existing, approved or likely preferred uses.
(b) The likely impacts of the Project will have significant impacts on the natural and built form with the Project area as shown in Figure E1 of the Assessment Report (Project Area). In addition, the Project will have unacceptable social and economic impacts in the locality resulting from:
(i) unacceptable direct and indirect subsidence impacts – Subsidence Advisory NSW (SA NSW) has advised that it is not possible to mitigate the predicted subsidence impacts through practical engineering design;
(ii) sterilisation of other alternative land uses for the life of the mine – all development within the mine subsidence district requires approval by SA NSW, and they have indicated that they will not approve any subdivision applications should the Project be approved (and indeed have already refused a number of applications based on the impacts of the Project, though not yet approved);
(iii) pollution of local waterways particularly upstream of local swimming holes including waste from mining activities and the onsite sewerage plant – the current operations on the site have led to water pollution incidents. These impacts are likely to continue should the mine be approved to expand, and they have not been adequately assessed or addressed as part of the application;
(iv) irreversible impacts on groundwater bores resulting from fracturing;
(v) impacts from scope 1, 2 and 3 greenhouse gas emissions (GHGs), with no offset or mitigation measures proposed; and
(vi) the economic costs to the public arising from the Project outweigh the public benefit to the public resulting in zero net present value economic benefit to the community.
(c) Many of the social, economic and environmental costs of the mine will be passed on to the local and wider community, with most, if not all of the benefit going to private commercial interests which are assumed in the Proponent’s own reports to be 100% foreign based.
(d) Further, the economic benefits of the Project are uncertain, and are substantially overstated. The peer review of the economic reports cited concerns over the transparency of figures provided in the Proponent’s report, and it called the calculation of distributed costs ‘dubious’.1 Further, it appears that when all of these costs are factored in, there is zero net benefit to the public. As a result, the impacts of the development far outweigh any economic and public benefits and the Project is clearly contrary to the public interest.
1 BIS Oxford Economics Economic Impact Assessment Review, April 2020

24 February 2021 Page 3
Submission on SSD 17_8445 Tahmoor South Colliery expansion
S:10723829_9 KQH
(e) The site is not suitable for the proposed development – SA NSW has expressed significant concern over the assessment and accuracy of the non-conventional subsidence impacts. Without further assessment of these impacts, the IPC cannot satisfy itself that the Project will not have a significant impact on the existing built form development, the natural environment including waterways, and items of Aboriginal and historical heritage. Further, many of the existing structures were built prior to the current SA NSW guidelines for future development. This is important because SA NSW is not willing to permit future development even it if were built to these standards due to the potential impacts.
(f) There are significant concerns raised in submissions by affected local residents and businesses as to the likely impacts of the Project if it were approved in its current form. There are also concerns raised as to the environmental impacts to the wider community resulting from GHGs if the Project were to be approved.
(g) The recommended conditions of consent by DPIE have the effect of leaving until later, an important aspect of the Project that will reduce the he potential impacts to natural features including the impacts on stream features, a cliff line and Aboriginal heritage sites.
(h) Further, the recommended conditions lack certainty and finality. This is particularly important given that the Assessment Report says that the Project is approvable, ‘subject to the strict conditions of consent’.2 If the Project is approved with these conditions in place, the consent may open to a finding of invalidity on this basis.
5. For these reasons, the Project should be refused under s 4.15(1)(a), (b), (c), (d) and (e) of the Environmental Planning and Assessment Act 1979 (EP&A Act).
Grounds of Objection
6. As you know, the objects of the EP&A Act include:
to facilitate ecologically sustainable development by integrating relevant economic, environmental and social considerations in decision-making about environmental planning and assessment
7. In this regard, under s 4.15 of the EP&A Act, in determining a development application, the consent authority is to have regard to, among other things:
(a) the provisions of any environmental planning instrument (s 4.15(1)(a)(i));
(b) the provisions of the regulations ((s 4.15(1)(a)(ii));
(c) the likely impacts of that development, including environmental impacts on both the natural and built environments, and social and economic impacts in the locality (s 4.15(1)(b));
(d) the suitability of the site for the development (s 4.15(1)(c));
(e) any submissions made (s 4.15(1)(d); and
(f) the public interest (s 4.15(1)(e)).
8. As outlined in more detail below, the Project should be refused having regard to these matters.
2 Assessment Report, p xvii

24 February 2021 Page 4
Submission on SSD 17_8445 Tahmoor South Colliery expansion
S:10723829_9 KQH
Ground 1: The economic assessment of the Project undertaken by the proponent and accepted by DPIE in the Assessment Report is critically flawed
9. The Project will not deliver the economic benefits that they promise, and will likely deliver no net benefit to the public. Further, the Project, if approved, will be at huge cost to the public, due to impacts from subsidence, impacts on the environment and greenhouse gas emissions.
10. The economic costs and impacts of the Project therefore far outweigh the economic benefits and the Project should be refused on the basis that the Project is not in the public interest, per s 4.15(1)(e) of the EP&A Act.
11. Therefore the likely economic impacts of the Project in the locality are relevant grounds for refusal per s 4.15(1)(a)(i) of the EP&A Act.
12. The amended economic report submitted by the Proponent have been criticised by the peer review commissioned by DPIE. The report was criticised for lacking transparency, not being in accordance with the guidelines, overstating benefits, and in not including many costs to the community that should have been assessed and included as part of the economic impact assessment.
13. Further, the peer review identified that the Project was very sensitive to low coal prices. This is critically important to the economic case for the Project because, we are currently experiencing low coal prices which appear to not be recovering any time soon and, the previous owner announced that it would be closing the mine due to low coal prices.
14. Our client has commissioned a number of independent economic reviews of the Project by Emeritus Professor Bennett and Mr Don Miles. Similar to the peer review commissioned by DPIE and undertaken by BIS Oxford Economics, Professor Bennett and Mr Miles are critical of the stated benefits, and the missing costs to the public from the Proponent’s EIAs.
15. In summary, these reviews have revealed that :
(a) The Project has a public net present value (NPV) of significantly less than zero (NPV < 0).
(b) The private NPV benefits of nearly $1 billion are outweighed by public NPV costs of more than $2 billion. That approximation does not even account for the opportunity costs imposed on Bargo landowners impacted by the Project.
16. Of particular note, the Proponent has not disclosed actual company tax paid, nor has it disclosed actual royalties paid which would have made a more realistic assessment of the Project possible. We have made an application under the Government Information (Public Access) Act 2009, but this information was not released to us before the due date of this written objection.
17. We discuss this in more detail below.
Background of economic assessment
18. The Proponent provided an Economic Impact Assessment by Cadence Economics (CE EIA) with the original environmental impacts statement (EIS). Of note, the CE EIA said that the:
(a) Project would mine 48 million tonnes of run of mine (ROM) coal;
(b) Project would operate for 13 years;

24 February 2021 Page 5
Submission on SSD 17_8445 Tahmoor South Colliery expansion
S:10723829_9 KQH
(c) Project provides a NPV of $699.5 million made up of $276 million in direct benefit, and $423.6 million in indirect benefits;
(d) Project would only cause indirect costs of $0.1 million; and
(e) amount of royalties were only estimated, and do not appear to be based upon actual royalties paid by the Proponent in existing operations under Tahmoor.
19. The Preliminary Issues Report (at [6.6]) required additional information in relation to the economic assessment of the Project including further:
(a) justification of disutility of working in mining;
(b) justification of the sensitivity analysis scenario results; and
(c) discussion in the local effects analysis (LEA) of local environmental, social and transport impacts, including integration with the social impact assessment (SIA) results.
20. On 4 December 2019, the Proponent produced an amended Economic Impact Assessment by Ernst & Young (EY EIA 2019), who had subsequently acquired Cadence Economics. This report states that:
(a) they ‘do not imply and it should not be construed that we have verified any of the information provided to us, or that our enquiries could have identified any matter that a more extensive examination might disclose. However, as part of our scope of work we have evaluated the information provided to us by Tahmoor as well as other parties through enquiry and analysis’ (p 2). This is important because again royalties were only estimated, and do not appear to be based upon actual royalties paid by the Proponent in existing operations under Tahmoor;
(b) the Project would reduce mining to 42.4 million tonnes of ROM coal;
(c) the Project would produce a net benefit of $783.8 million NPV, comprising of $272.1 million in direct benefit and $511.8 million in indirect benefits; and
(d) the Project would produce costs to the community of $0.1 million NPV.
21. On April 2020, DPIE requested that BIS Oxford undertake a peer review of the EY EIA 2019. The BIS Peer Review raised a number of issues with the EY EIA 2019 including:
(a) Production volumes and pricing assumptions – they do not have access to the data underlying these. In terms of production volumes:
(i) One issue may be the prospect of unexpected geological or technical issues which could push up project costs and affect project viability while the outcome of the COVID-19 pandemic may have an effect on coal demand and thereby production volumes.
(ii) Another risk is growing opposition to the use of coal as an energy source.
(iii) In terms of pricing, the results appear reasonable but could also be affected by short to medium term risks such as the impact of COVID-19 on global coal markets.

24 February 2021 Page 6
Submission on SSD 17_8445 Tahmoor South Colliery expansion
S:10723829_9 KQH
(iv) It was suggested that DPIE seek clarification on both of these factors,3 however this does not appear to have occurred.
(b) Producer surplus and treatment of costs – While the producer surplus accruing to NSW is nil there are some issues relating to its calculation. Moreover, there is no indication that contingencies have been allowed for in the calculation of project costs. This could affect estimated profitability and thereby company tax revenues. We note that the Proponent disclosed that it was operating at a loss in September 2020.4
(c) Sensitivity tests – While a range of sensitivity tests are presented there are a number of questions around their application including relatively small tests for capital and operating cost blow outs, apparently perverse effects of increasing operating costs (which increase benefits to NSW), a lack of discussion about remedial environmental measures not being successful, no testing for materially higher greenhouse gas costs and the omission of a test excluding worker benefits.
(d) Benefits to workers – The discussion and calculations in this section are not consistent with key elements of the NSW Government (2015) Guidelines for the economic assessment of mining and coal seam gas proposals (the Guidelines) which call for strong evidence to be presented in support of wage premiums and consequent worker benefits. It was suggested that benefits to workers be omitted from the CBA. As such benefits amount to $264.3 million in NPV terms, this would have material impacts on the assessed benefits to NSW (reducing benefits by approximately one third). This would not in itself make the Project unviable but if combined with higher externalities, contingencies and/or other costs could make it more marginal.
(e) Benefits to suppliers – These are presented, however more transparency on the cited figure of $1,226.3 million (NPV terms) in spending on inputs could be provided.
(f) Distributional impacts – These are omitted from the analysis in contrast to the requirements of the Guidelines.
(g) Environmental and social externalities – While considerable detail is provided, there are some questions about the quantums estimated in the assessment. The allocation of Scope 1 and 2 greenhouse gas damage to NSW (only) with an assessed cost of just $0.1 million (NPV terms) during the project lifetime seems dubious. This has a material effect as the global cost of such externalities is calculated as $102.3 million in NPV terms. Moreover there is a case that the assessed price of carbon could rise during the project lifetime. The relatively small groundwater and surface water costs could be called into question, while the subsidence, ambient noise, biodiversity and net public infrastructure assessments might also require further scrutiny. We suggest DPIE seek clarification on some of the claims made in this section.
22. The BIS Peer Review also said that the:
(a) Project will produce 42.4 million tonnes of ROM coal with 30.3 million tonnes of saleable output being hard coking coal and 1.3 million tonnes being thermal coal.
(b) Project would operate from 2022 to 2035;
3 BIS Peer Review, p 2 4 3 September 2020 Minutes, Tahmoor Colliery Community Consultative Committee, 8.1
24 February 2021 Page 7
Submission on SSD 17_8445 Tahmoor South Colliery expansion
S:10723829_9 KQH
(c) Project would provide $417.2 million in net benefits NPV if all GHGs were included;
(d) statement amount of $0.1 million NPV was ‘dubious’ given that there were a number of distributional impacts that have not been included, such as:
(i) GHGs, which were understated and which did not include scope 3 emissions;
(ii) Groundwater – stated as nil;
(iii) Surface water – stated as $13.6 million in NPV terms with the number being questioned, and it not being clear if the costing allows for costs beyond the operation of the mining activities;
(iv) Ambient noise impact – stated as $11.5 million in NPV terms, with the number being queried due a lack of clarity as to how this number was derived;
(v) Biodiversity and ecological impact – stated as $20.3 million in NPV terms, with the number being queried due a lack of clarity as to how this number was derived;
(vi) Subsidence – stated as $13.6 million in NPV terms, with this number being questioned and notes that these costs can be significant;
(vii) Net public infrastructure costs – stated as being included in subsidence costs, notes that no allowance appears to have been made on costs to the local council for increased road maintenance etc. Queries raised about this approach.
(e) The presentation of results in the LEA are not in accordance with the requirements of the Guidelines.
23. On 3 August 2020, the Proponent produced an amended Economic Impact Assessment by Ernst & Young (EY EIA 2020). Of note, the EY EIA 2020 said:
(a) they ‘do not imply and it should not be construed that we have verified any of the information provided to us, or that our enquiries could have identified any matter that a more extensive examination might disclose. However, as part of our scope of work we have evaluated the information provided to us by Tahmoor as well as other parties through enquiry and analysis’ (p 2). This is important because again royalties were only estimated, and do not appear to be based upon actual royalties paid by the Proponent in existing operations under Tahmoor;
(b) the Project was reduced to 32.7 million tonnes of ROM coal, due to a change in the layout of the mine and a reduction in the width, length and number of proposed longwalls;
(c) the Project would produce a net benefit of $664.9 million NPV, comprising of $215 million in direct benefit and $450 million in indirect benefits; and
(d) the Project would produce costs to the community of $0.1 million NPV.
24. The EY EIA does not refer to the BIS Peer Review, nor does it appear to have addressed any of the concerns raised in the BIS Peer Review.
25. Based upon the information in the Assessment Report, it does not appear that DPIE sought the clarification that was recommended to be sought from the Proponent in the BIS Peer Review.
26. The figure stated in the Assessment Report as to the net benefit of the Project is that stated by the EY EIA 2020 which is $664.9 million NPV, comprising of $215 million in direct benefit and $450

24 February 2021 Page 8
Submission on SSD 17_8445 Tahmoor South Colliery expansion
S:10723829_9 KQH
million in indirect benefits. This figure has not been further reviewed by BIS Oxford, but seems to be significantly higher than the suggested amount in the BIS Peer Review, despite the amount of coal being significantly reduced.
Further issues with assessment of economic benefits
27. On 17 December 2019, Emeritus Professor Jeffrey Bennett produce an expert witness report which we provided to DPIE (Annexure A to this objection) (Bennett Report 2019).
28. Professor Bennett’s expert report concluded that:
(a) On the basis of the opinions presented in this review, the NPV of the proposed mine has been over estimated by Cadence Economics.
(b) Instead of the projected NPV of $699.5m that is put forward by the proponent of SSD-8445, a more appropriate NPV of $247.2m should be attributed to the proposal based upon the information contained in the BCA.
(c) This lower NPV estimate does not take into account the missing and under estimated indirect costs of the mine proposal. These remain to be estimated but when included would further lower the estimated NPV of the proposed mine.
29. The Bennett Report 2019 stated the following six opinions:
(a) The estimate of the direct benefits is too high. Both payroll taxes and council rates should be excluded. That done, the (discounted) net direct benefit of the proposal falls from $276m to $247.3.
(b) The estimate of the indirect benefits relating to employment is too high. The indirect benefits of the proposal that relate to employment should be set at zero rather than the $212.2m claimed in the CE EIA.
(c) The estimate of the indirect benefits relating to suppliers is too high. The indirect benefits of the proposal that relate to the supply of non-labour resources should be set at zero rather than the $211.4 million claimed in the CE EIA.
(d) Potentially significant indirect costs have been either under estimated or omitted from the benefit cost analysis. The extent of the indirect cost underestimation due to the omission of the opportunity costs of land has not been estimated.
(e) The local impacts are exaggerated. The extent of the over estimation of the local area effects has not been quantified. However, given that there has been no justification for deviating from the zero indirect benefits assumption, then the local area effects, when based on the state wide indirect benefits should be taken to be zero.
30. On 19 March 2020, following the publication of the EY EIA 2019 on the Major Projects Website, we had Emeritus Professor Bennett produce a supplementary expert witness report (Bennett Report 2020) (Annexure B) which concluded that:
(a) His six opinions set out in the Bennett Report 2019 remain unchanged because they all relate to broad, methodological issues.
(b) The somewhat surprising result is that the net present value of the amended mine proposal is higher than the originally proposed mine: up from $699.5m to $783.8m. This is despite a reduction in mine output from 48 to 43 Mt ROM coal over the life expectancy of the

24 February 2021 Page 9
Submission on SSD 17_8445 Tahmoor South Colliery expansion
S:10723829_9 KQH
project. The increase is a result of a change in coal price assumption, which resulted in a higher amount in NPV terms despite less coal being mined.
(c) The amended mine proposal will result in $5m less direct net benefits to the people of NSW. That brings the NPV of the mine to around $242m, down from around $247m as estimated in his previous review.
(d) This figure omits the indirect benefits calculated by both Cadence Economics and EY on the grounds of the arguments set out in his previous report. The economic logic that is at the foundation of those arguments has not changed.
(a) The estimate of $242m is still regarded as an overestimate of the NPV of the mine because of the additional arguments made in my original report, as they relate to the omission or underestimation of a range of the indirect costs of the mine.
31. On 22 February 2021, following the EY EIA 2020 being published on the Major Projects Website late December 2020, Mr Don Miles also prepared a report (Miles Report) (Annexure C). The Miles Report concluded that:
(a) Mr Miles supported the findings of the Bennett Reports.
(b) The only direct benefits of the Project that can be relied upon are royalties paid to the NSW Government. Because there were no actual royalty payments provided, there could be no certainty as to the assumptions that were made in the CE EIA and the EY EIAs.
(c) Because the Proponent said that the Tahmoor mine was operating at a loss in September 2020,5 this demonstrates that company tax should not be counted as a benefit in the CBA. This is consistent with the decision of Preston CJ in Gloucester Resources Limited v Minister for Planning [2019] NSWLEC 7, and also the NSW Government Guide to Cost-Benefit Analysis (TPP17-03) at p 65 that says that taxes should usually be excluded from CBAs.
(d) Based upon his model of the Project, the Project has a net benefit of zero NPV, or less. This was because, once the indirect costs that had not been included in the CE EIA and the EY EIAs were included, the direct benefits were outweighed by the costs to the community.
(e) In summary, for the public the Project is a lemon and should not be approved.
32. The issue as to whether there is a net benefit to the public resulting from the Project goes to the heart of DPIE’s recommendation that the Project should be approved. It has taken the Proponent’s numbers without subjecting them to the scrutiny that was recommended in DPIE’s own commissioned peer review.
33. We note that in the matter of Gloucester Resources Limited v Minister for Planning [2019] NSWLEC 7, Preston CJ held at [686] to [687]:
“686. The task of determining the development application for the Project, in essence, requires the Court, exercising the function of the consent authority, “to balance the public interest in approving or disapproving the Project, having regard to the competing economic and other benefits and the potential negative impacts the Project would have if approved”: Warkworth Mining Ltd v Bulga Milbrodale Progress Association Inc at [171].
5 3 September 2020 Minutes, Tahmoor Colliery Community Consultative Committee, 8.1

24 February 2021 Page 10
Submission on SSD 17_8445 Tahmoor South Colliery expansion
S:10723829_9 KQH
687. The Rocky Hill Coal Project will yield public benefits, including economic benefits, but it will also have significant negative impacts, including visual, amenity, social and climate change impacts and impacts on the existing, approved and likely preferred uses of land in the vicinity of the Project, which are all costs of the Project. Balancing the benefits and costs of the Project is, in the end, a qualitative and not quantitative exercise. I have previously likened it to a process of intuitive synthesis of the relevant factors: Bulga Milbrodale Progress Association Inc v Minister for Planning and Infrastructure and Warkworth Mining Limited at [141]. Forms of economic assessment such as cost benefit analysis, which quantify, monetise and aggregate different factors, assist but are not a substitute for the intuitive synthesis required of the consent authority in determining the development application.”
34. Here, the IPC has to balance the public interest in approving or disapproving the Project, having regard to the competing economic and other benefits and the potential negative impacts the Project would have if approved.
35. The Project will have significant negative impacts, including amenity, environmental, social and climate change impacts, in addition to impacts on the existing, approved and likely preferred uses of land in the vicinity of the Project. These are all costs of the Project. Balancing the benefits and costs of the Project is, in the end, a qualitative and not quantitative exercise. However, when the IPC does undertake a quantitative analysis of the Project, it has a zero to negative NPV economic benefit.
36. On this basis alone, the IPC should refuse the Project and it is clearly contrary to the public interest.
Ground 2: Failure to satisfy the Mining SEPP
37. The Project does not satisfy the Mining SEPP, and should be refused on the basis that it does not satisfy the requirements of that environmental planning instrument per s 4.15(1)(a)(ii) of the EP&A Act.
38. In addition, the development is not ecologically sustainable development in that it will give rise to additional GHG emissions, and will cause impact to the environment which is not sustainable and for which no suitable mitigation measures have been proposed. As a result the Project is not in the public interest (section 4.15(1)(e) of the EP&A Act).
The Project is inconsistent Clause 12(a) Mining SEPP
39. The Project and the Assessment Report fail to adequately consider the effect of subsidence related impacts on these varying existing, approved and likely preferred uses of land within these zones.
40. This assessment is required to be carried out for the purposes of clause 12(a) of the Mining SEPP when considering the existing, approved and likely approved uses. It is not sufficient to rely on the Mining SEPP rendering the Project permissible to dispense with this assessment.
41. Clause 12 of the Mining SEPP provides that:
Before determining an application for consent for development for the purposes of mining, petroleum production or extractive industry, the consent authority must:

24 February 2021 Page 11
Submission on SSD 17_8445 Tahmoor South Colliery expansion
S:10723829_9 KQH
(a) consider:
(i) the existing uses and approved uses of land in the vicinity of the development, and
(ii) whether or not the development is likely to have a significant impact on the uses that, in the opinion of the consent authority having regard to land use trends, are likely to be the preferred uses of land in the vicinity of the development, and
(iii) any ways in which the development may be incompatible with any of those existing, approved or likely preferred uses, and
(b) evaluate and compare the respective public benefits of the development and the land uses referred to in paragraph (a) (i) and (ii), and
(c) evaluate any measures proposed by the applicant to avoid or minimise any incompatibility, as referred to in paragraph (a) (iii).
Comparative public benefits of the mine and other land uses (clause 12(b) Mining SEPP)
42. No assessment has been undertaken by the Proponent, or in the Assessment Report to consider cl 12(b) of the Mining SEPP in that no evaluation and comparison has been carried out between the respective public benefits of the development and:
(a) the existing uses and approved uses of land in the vicinity of the development, and
(b) whether or not the development is likely to have a significant impact on the uses that, in the opinion of the consent authority having regard to land use trends, are likely to be the preferred uses of land in the vicinity of the development.
43. If approved in its current form, the Project will have the effect of delaying the development of land in the vicinity of the Project in relation to any further subdivision or building works within the project area until such time as undermining has ceased, likely until 2035. For this reason, the Project is incompatible with existing, approved and likely preferred uses land uses in the vicinity of the Project.
44. At paragraph [66] in Gloucester Resources it was agreed between the experts (and ultimately by the Court) that (emphasis added):
indicators of land use trends, giving rise to likely preferred uses, are: the historical, current and approved uses of the land; the planning controls under the applicable land use zonings, including the range of permissible uses in each zone, the objectives of each zone, and the development standards for development in the zone, such as the minimum lot size; uses identified in State, regional and local strategic plans, studies and strategies as being preferred future uses; and economic circumstances.
45. In circumstances where mining is prohibited within a zone, it should not be considered the preferred use and an assessment against the objectives of that zone and a comparison against the other land uses within that zone that are permitted with consents is required. This has not been undertaken. The assessment that is required to be undertaken in relation to cl 12 of the Mining

24 February 2021 Page 12
Submission on SSD 17_8445 Tahmoor South Colliery expansion
S:10723829_9 KQH
SEPP, as highlighted by Preston CJ in Gloucester Resources has not been undertaken by the Proponent.6
46. In particular:
(a) No assessment has been undertaken against the aims and objectives of the other zones which the Project site traverses, in particular against those zones within which mining is prohibited. The assessment of the Project against these objectives, is required under clause 12 of the Mining SEPP as identified in Gloucester Resources.
(b) No assessment has been undertaken against the aims of the WLEP 2011, in particular subclauses:
(2)(a) “to provide for the management of natural resources and the protection of the natural landscape character”;
(2)(b) “to protect, conserve and enhance the built, landscape and Aboriginal cultural heritage”; and
(2)(d) “to encourage development that provides for an integrated transport and infrastructure system and adequate facilities and service provision for future growth”.
47. The zoning of the land which will be impacted/undermined as a result of the Project includes RU1 Primary Production, RU4 Primary Production Small Lots, R2 Low Density Residential, R5 Large Lot Residential, B2 Local Centre, R3 Medium Density Residential, IN2 Light Industrial, SP2 Infrastructure, E2 Environmental Conservation and RE1 Public Recreation. Extractive industries are prohibited in all zones save for RU1 Primary Production.
48. The uses of the land in the vicinity of the Project include residential (including rural-residential estates), Bargo Sports Ground and Sports Clubs, Bargo Public School, the Bargo Train Station, the Bargo Post Office, Retirement Villages, Rural Agriculture including Ingham’s Enterprises, Town Centre Businesses, Bargo Tip and substantial tracks of land earmarked for future residential development.
49. Wollondilly Shire Council (WSC) in its Growth Management Strategy 2011 has indicated that they expect a population increase of 20,000 over the next 25 years, and they plan to deliver 7,500 new houses over the next 25 years. In Bargo itself, they expect a need for 2000 new dwellings.
50. The Assessment Report states that the Project will have implications for future development in the area, and that WSC indicated a long-term target of 2,000 additional houses in Bargo by 2036, most of the urban growth planned to occur to the east of the township and above the proposed longwalls.
51. In response to a request from WSC in relation to the extent to which the Project would affect local growth, MSEC conducted a simulation exercise to forecast the potential impacts of the proposed mining on the future urban growth area. It was assumed that 1,930 houses would be constructed within the SSA, with 1,509 located directly above the proposed longwall mining area. The exercise conservatively assumed that all houses would be brick veneer construction on strip footings.
52. MSEC predicted that of the 2,000 houses in the growth area, 1501 (75%) would require nil to very minor repairs (Nil-R0), 323 (16%) would require minor cosmetic repairs (R1 to R2), 131 (7%) would
6 Gloucester Resources Limited v Minister for Planning [2019] NSWLEC 7 at [80] – [86].

24 February 2021 Page 13
Submission on SSD 17_8445 Tahmoor South Colliery expansion
S:10723829_9 KQH
require substantial serviceability and structural repairs (R3 to R4) and 45 (2%) would require re-build (R5). The distribution of impacts is increased compared to the existing housing impacts because there would be a greater proportion of potential future houses that are located directly above the proposed longwall mining area. Further, MSEC predicted that the maximum tilts would be between 7 mm/m and 10 mm/m at 26 houses (i.e. 2 % of the total) and would be greater than 10 mm/m at 72 houses (i.e. 5 % of the total) at the completion of mining.
53. As the Project is located within the Bargo Mine Subsidence District, any future development in the district requires SA NSW approval. SA NSW has advised DPIE that, as it is not possible to fully mitigate the predicted subsidence impacts through practical engineering design, and to prevent further impact on the community, applications to rezone and subdivide land for urban development within the proposed mining area are likely to be refused, should the Project be approved. Indeed, a number of applications for subdivisions within the Bargo area have already been refused within the Bargo area due to the Project.
54. In addition, despite 8 years of assessments and discussions and the fact that it was ready to be approved, Ironlaw recently had a planning proposal refused by the Minister’s delegate due to anticipated subsidence impacts of this Project.
55. This means that the delivery of the target 2,000 additional houses will not be achieved in Bargo by 2036.
56. The social impacts that are likely to flow from the sterilisation of land uses in the Project Area include:
(a) that there will be no opportunity for new housing to be built in the area, pushing up the price of housing. Furthermore, it will have a significant impact on both Council and DPIE being able to reach its housing targets;
(b) landowners will be unable to develop their land until at least 2036, effectively sterilising landholdings within Bargo for at least the next 15 years. This will also result in a reduction in jobs in the housing and construction industry within the Bargo area;
(c) there will be no new infrastructure for industry and business built which will have social and economic impacts upon the community which is being undermined;
(d) the possibility of mental health issues arising from an increased cost of living and lack of employment opportunities. This Project will not be creating a surplus of jobs, merely extending the life of the existing mine; and
(e) if a landowner cannot obtain approval under the Coal Mine Subsidence Compensation Act 2017 (CMSC Act), they are not entitled to any compensation under that Act. This would directly impact the value of that land which will be undermined, as well as any improvements on that land, it would also cause a great deal of stress and anxiety to those affected landowners.
57. No assessment of these impacts have been undertaken by the Proponent or in the Assessment Report. These have been raised by as relevant considerations for the consent authority in Gloucester Resources per Preston CJ at [682] – [685].

24 February 2021 Page 14
Submission on SSD 17_8445 Tahmoor South Colliery expansion
S:10723829_9 KQH
58. The only consideration has been that ‘DPIE considers the Bargo area is unlikely to be a strategic urban growth area during the life of the mine. Mining associated with the Project is forecasted to cease by 2032. After this time the area could be used for further urban development.’7
Comparative mitigation measures proposed by the Proponent of the mine and other land uses (clause 12(c) Mining SEPP)
59. No assessment has been undertaken by the Proponent, or in the Assessment Report to consider cl 12(c) of the Mining SEPP in that no measures have been proposed by the Proponent to avoid or minimise any ways in which the development may be incompatible with any of those existing, approved or likely preferred uses. The only option that has been considered is to delay this development until after mining has ceased.
60. Further to the above, the Assessment Report notes that ‘DPIE acknowledges that the extent of potential impacts to other built features is substantial, however accepts that the magnitude of predicted subsidence impacts are generally minor in nature and can be relatively easily remediated to ensure they remain in a safe and serviceable condition via a Built Features Management Plan, which would form part of the Extraction Plan process’.8
61. This is in direct contradiction to the following statements contained in the Assessment Report:
(a) SA NSW has confirmed that MSEC has extensive expertise in subsidence predictions and that it is confident the predictions in relation to the Project are informed by data gained from Tahmoor North and their knowledge of the Southern Coalfield geology.9
(b) Despite this, localised anomalies in subsidence behaviour due to geological structures such as the Nepean Fault and other effects in the natural system are not fully predictable by empirical models. Subsidence levels greater than predictions have previously been observed in parts of Tahmoor Mine (i.e. during mining of Longwalls 8, 13, 24A-27 and 32), which are thought to be due to the presence of faults and dykes near river valleys and gorges.10
(c) MSEC indicated that non-conventional ground movements would likely occur within and around the SSA, due to near surface geological conditions, steep topography and valley related movements. MSEC indicated that these non-conventional movements are often accompanied by elevated tilts, curvatures and strains, which are likely to exceed the conventional predictions.11
(d) SA NSW has identified that the proposed mine scheduling would mean that some houses would be impacted by more than one longwall and could therefore experience subsidence impacts for extended periods of time. In particular, houses located above LWs 103A and 104A could experience subsidence impacts for up to 7 years (i.e. from 2023 when mining commences in LW 103A until 2030 when mining commences in LW 104A). Therefore, several homeowners could be living in damaged properties for a number of years, or may
7 Assessment Report, p 73 8 Assessment Report, p 77 9 Assessment Report, p 42 10 Assessment Report, p 42 11 Assessment Report, p 46

24 February 2021 Page 15
Submission on SSD 17_8445 Tahmoor South Colliery expansion
S:10723829_9 KQH
require relocation on several occasions (where their properties require extensive repairs or rebuilding).12
(e) SA NSW has advised DPIE that, as it is not possible to fully mitigate the predicted subsidence impacts through practical engineering design, and to prevent further impact on the community, applications to rezone and subdivide land for urban development within the proposed mining area are likely to be refused, should the Project be approved.13
62. This does not satisfy the requirements of cl 12(c) of the Mining SEPP.
Greenhouse gas emissions and ecologically sustainable development (clause 14 Mining SEPP)
63. In addition, limited assessment has been undertaken by the Applicant in relation to ‘upstream’ (Scope 2) and ‘downstream’ (Scope 3) Greenhouse Gas Emissions.
64. The Assessment Report dismisses the impacts of scope 3 GHGs on the basis that ‘DPIE recognises there are no current alternatives to the use of coking coal to produce large scale raw steel materials. Whilst there is potential for the development of coal-free steel making technologies over the medium to long term, these alternatives are unlikely to be available on a commercial scale during the life of the Project.’14
65. Such an argument was not accepted by Preston CJ in Gloucester Resources at [548] where he stated:
‘The current and likely future demand for coking coal for use in steel production can be met, however, by other coking coal mines, both existing and approved, in Australia. Whilst it is not necessary in order for coking coal to be able to be used in steel production for it to have the particular properties of the coking coal that would be produced by the Rocky Hill Coal Project, such as having high fluidity, there are a number of Australian mines that produce high fluidity coking coal. Coking coal mines with a high fluidity of approximately 1000 DDPM or more include Integra (Underground), Broadmeadow, Wongawilli, Goonyella and Moranbha North. Mines that produce both coking coal and thermal coal and have a maximum fluidity of approximately 1000 DDPM or more including Austar, Duralie, Stratford, Kestrel, Dawson Complex, Tahmoor, Appin and Byerwren. Hence, demand for coking coal for use in steel production will be able to be met by supply from other Australian mines if the Project is not approved.’
66. There is no serious abatement of GHGs by the Proponent, with ‘flaring’ weakly suggested in the Assessment Report (p, 125).
67. The total emissions for Scope 1, 2 and 3 would equate to 93.8 million tonnes of CO2-e over the life of the mine.
68. The proponent says that the scope 1 and 2 GHGs would represent approximately 0.65% of total NSW emissions and 0.2% of total Australian emissions.15 There is no discussion of scope 3 GHGs.
12 Assessment Report, p 71 13 Assessment Report, p73 14 Assessment Report, p 125 15 Assessment Report, p 125

24 February 2021 Page 16
Submission on SSD 17_8445 Tahmoor South Colliery expansion
S:10723829_9 KQH
However, following this logic, they would equate to 1.53% of NSW emissions and 0.47% of Australia’s GHGs. This is a significant contribution for a single project.
69. In Gloucester Resources, Chief Justice Preston said at [525]:
There is a causal link between the Project’s cumulative GHG emissions and climate change and its consequences. The Project’s cumulative GHG emissions will contribute to the global total of GHG concentrations in the atmosphere. The global total of GHG concentrations will affect the climate system and cause climate change impacts. The Project’s cumulative GHG emissions are therefore likely to contribute to the future changes to the climate system and the impacts of climate change. In this way, the Project is likely to have indirect impacts on the environment, including the climate system, the oceanic and terrestrial environment, and people.
70. Like the proposed coal mine in Gloucester Resources, this Project would have a significant impact on Australia’s ability to meet its obligations under the Paris Agreement 2015. There are no proposed mitigation measures for scope 3 GHGs.
71. The proposed mitigation measures for the Project under the recommended conditions are:
(a) B14 – which requires that the Proponent must take all reasonable and feasible steps to improve energy efficiency and reduce fugitive greenhouse gas emissions of the development, and implement greenhouse gas abatement measures (including beneficial reuse and/or flaring) with respect to methane produced by underground coal mining; and
(b) B18 – which require the preparation of a Greenhouse Gas Management Plan that describes the measures to be implemented to ensure best practice management is being employed (including in respect to energy efficiency and the minimisation of greenhouse gas emissions from the site).
72. As a result, the consent authority has not has not addressed this critical issue which is required to be addressed by clause 14(2) of the Mining SEPP, and the proposed conditions at B14 and B18 do not address the requirements of cl 14(1)(c) of the Mining SEPP.
73. Further, the Project is contrary to section 4.15(1)(b) of the EP&A Act due the likely impacts of the development, including environmental impacts on both the natural and built environments, and social and economic impacts in the locality.
74. In addition, the development is not ecologically sustainable development in that it will give rise to additional GHG emissions, and will cause impact to the environment which is not sustainable and for which no suitable mitigation measures have been proposed. As a result the Project is not in the public interest (section 4.15(1)(e) of the EP&A Act).
Ground 3: Failure to adequately consider the likely impacts of the development
75. The Project fails to adequately consider the likely impacts of the development, including impacts to the natural and built environment, as well as the social and economic impacts in the locality of the Project. On that basis it should be refused having regard to s 4.15(1)(b) of the EP&A Act.
Subsidence impacts
76. As also outlined above, SA NSW is of the view that ground movement from underground mining is not conventional and that the location and magnitude of non-conventional ground movements

24 February 2021 Page 17
Submission on SSD 17_8445 Tahmoor South Colliery expansion
S:10723829_9 KQH
cannot be accurately predicted and it is not possible to mitigate these impacts through practical engineering design. As such, as a result of this Project, SA NSW has advised that it would not support any future rezoning or redevelopment in the vicinity of the mine until mining operations have ceased.
77. Our client commissioned an expert report as to what was meant by anomalous subsidence at Tahmoor (Annexure D). They provided an opinion that the use of “non-conventional anomalous ground movements” (eg by SA NSW in their letter of 18 March 2019 to DPIE) was referring to the “increased subsidence” recorded at Tahmoor North and indicated by greater than expected vertical subsidence should be considered as anomalous in the context of the prediction method being used by MSEC. This is addition to the “Non-conventional anomalous” strain measurements referred to by MSEC.
78. The result being that further assessment is required by calibrating the IPM data from the Tahmoor and Tahmoor North geometry with less focus on the other mines in the Southern coalfields, or by developing an alternative prediction method specific for Tahmoor South. This is particularly important because the Project has already been amended twice due to the significant subsidence impact predictions from previous mine layouts and footprints.
79. It is therefore apparent that, in fact, the extent of the subsidence impacts of the Project are not known and have not been fully assessed.
80. Not only does the information provided by the Proponent not satisfy the requirement of cl 12(b) of the Mining SEPP, the lack of information indicates that:
(a) there has been an inadequate assessment of the likely impacts of the Project, including the social and economic impacts on the community (as required by s 4.15(1)(b) of the EP&A Act); and
(b) the Project is not in the public interest(s 4.15(e), EP&A Act).
81. For this reason alone, the Project clearly does not facilitate ecologically sustainable development and indeed to approve the Project would fly in the face of the precautionary principle which is required to be addressed in the Proponent’s environment impact statement per cl 7(4) of Schedule 2 to the EP&A Regulation.
82. The precautionary principle, says that if there are threats of serious or irreversible environmental damage, lack of full scientific certainty should not be used as a reason for postponing measures to prevent environmental degradation. In the application of the precautionary principle, public and private decisions should be guided by—
(i) careful evaluation to avoid, wherever practicable, serious or irreversible damage to the environment, and
(ii) an assessment of the risk-weighted consequences of various options.
83. SA NSW has flagged a serious concern of serious or irreversible damage to the environment from non-conventional anomalous ground movement. Because there are no effort to avoid these impacts, and there is a real risk identified by SA NSW as to these potential impacts, the Project should be refused on this basis.

24 February 2021 Page 18
Submission on SSD 17_8445 Tahmoor South Colliery expansion
S:10723829_9 KQH
Social impacts
84. The social impacts of the proposed development is a mandatory consideration under section 4.15(1)(b) of the EPA Act (and a requirement of SEARs), as well as part of the CBA which is required under cl 12 of the Mining SEPP. The assessment of the social impacts of the Project that have been undertaken is wholly inadequate and does not satisfy the 9 key requirements at page 5 of the Social Impact Assessment Guideline (Department of Planning and Environment, 2017) (the SIA Guideline).
85. The social impacts of the subsidence and the effective sterilisation of the land within the Project area for the life of the Project have not been addressed or assessed by the Applicant. For example, part 4.8 of the Social Impact Assessment at Appendix Q of the EIS (SIA) which purports to assess the personal and property rights of the Project does not even consider the impacts of the sterilisation of land within the project area, in clear violation of property rights. Proposed mitigation measures within this paragraph are vague and uncertain. Similarly, the Fears and Aspirations section of the SIA does not even address the issues and social impacts that would flow from the sterilisation of surface land uses as a result of the Project.
86. Following the Preliminary Issues Report, an addendum SIA was prepared by AECOM on 20 February 2020 (SIA Addendum).
87. The Assessment Report (p, 131) indicates that the ‘SIA identified that there was a high likelihood of stress and anxiety impacts associated with subsidence impacts on private properties and bores. In particular, psychological stress may result from actual or anticipated property damage or water supply loss, as well as hardship and disturbance associated with the timing, duration and process of reparation and compensation claims.’
88. It is noted that the SIA and the SIA Addendum have been compared against ongoing impacts of the mine (for adverse impacts), but have not compared them to a situation where the mine was not expanding or continuing to operate beyond existing operations under Tahmoor. This results in social impacts that otherwise might have been consider to be high impact, being labelled as a lower impact.
89. Conversely, the SIA and the SIA Addendum have been compared against the impact of the mine not continuing to operate (for beneficial impacts), and have not compared them to the other benefits if the mine were not approved to expand. For example, the other work opportunities in construction that will now be delayed for the life of the mine if the Project is approved.
90. The SIA Addendum notes that ‘the psychological and other indirect impacts of subsidence (such as stress, anxiety, uncertainty, disturbance and hardship) discussed above are anticipated for people living at properties predicted to experience subsidence impacts. These impacts would be mitigated through comprehensive consultation at the community and individual level.’16
91. The SIA Addendum then goes on to state that ‘Tahmoor Coal has extensive experience to-date in managing subsidence-related impacts from Tahmoor Mine, including in investigating and closing out subsidence claims in accordance with the requirements of Subsidence Advisory NSW. Since 2004, Tahmoor Mine has mined under the entire township of Tahmoor, safely and competently managing (and mitigating) subsidence impacts to approximately 1,890 residential dwellings and commercial premises and on major built infrastructure’.17
16 SIA Addendum, 4-2 17 SIA Addendum, 4-5

24 February 2021 Page 19
Submission on SSD 17_8445 Tahmoor South Colliery expansion
S:10723829_9 KQH
92. This is despite the comments by SA NSW regarding the social impacts for communities affected by subsidence, particularly in relation to the claims process. These comments arise from the experience of residents in Tahmoor North, and the significant impacts that they faced from mining beneath their town. Clearly the previous operations have resulting in significant social impacts and “enhanced consultation” will not address this.
93. In summary:
(a) The ‘community consultation measures’ are unlikely to address the social impacts of the Project.
(b) No assessment has been undertaken on the potential impacts resulting from surface development being delayed until after the Project has finished.
(c) The SIA Addendum overstates the benefits of the Project, and underestimates the negative impacts arising from the Project.
(d) DPIE does not have sufficient information to be assured that the Project will not have unacceptable social impacts.
Groundwater
94. The Assessment Report noted that while DPIE-Water acknowledged the Groundwater Modelling Plan contained some useful information, it considered that the plan should be revised prior to determination to include further clarity on the modelling processes; workflow checks and feedback loops; sensitivity analysis and calibration techniques; and model review and updates throughout the Project’s life. DPIE-Water also recommended that the Groundwater Modelling Plan be independently third-party reviewed.
95. The Assessment Report considers that it is acceptable to require that the Groundwater Modelling Plan be reviewed and updated once additional information is available, particularly in relation to the Thirlmere Lakes Research Program. Given the research program is due to be completed in late 2021, DPIE accepts that a 2-year timeframe for completing the model review is reasonable and has recommended a condition accordingly.
96. This would therefore leave significant issues for further determination and assessment 2 years after the grant of development consent. Given that the impacts on groundwater can be significant and in most cases cannot be remediated, and given the concerns around the certainty of unpredictable impacts from subsidence, this does not provide the consent authority with enough information to understand the likely impacts of the development on groundwater.
97. The Assessment Report also predicts that recovery of water levels within the proposed mining footprint would not be complete until about the year 2200. With predicted drawdowns in the longwall areas of 10-30m remaining until 2500.18
98. Given that many rural and agricultural land uses within and in the vicinity of the Project Area rely upon groundwater, this is a significant impact to those land uses considering that the proposed mining operations are only proposed to run for 10 years.
99. The proposed ‘make good’ provisions include deepening a bore, drilling a new bore or providing an alternative water supply. This process is proposed to be managed through SA NSW under the claims process in the CMSC Act through an ad hoc process. Given the uncertainty held by SA NSW
18 Assessment Report, p 86

24 February 2021 Page 20
Submission on SSD 17_8445 Tahmoor South Colliery expansion
S:10723829_9 KQH
regarding the potential non-conventional subsidence impacts, and the concern raised with the modelling by DPIE-Water. This mitigation process may not be able to adequately compensate affected landowners who have their bore-water supply impacted by the Project.
100. The Independent Expert Scientific Committee on Coal Seam Gas and Large Coal Mining Development (IESC) has raised concerns with the modelling and the certain assumptions made in relation to potential impacts on Thirlmere lakes.19
101. Again, the Assessment Report recommends that further and more comprehensive modelling be undertaken after determination of the Project.
102. This is in our view, a significant indicator that there is insufficient information for the consent authority to assess the Project. A consent must be final and certain.20 In Mison v Randwick Municipal Council, Clarke JA held (at 740):
Where a consent leaves for later decision an important aspect of the development and the decision on that aspect could alter the proposed development in a fundamental respect it is difficult to see how that consent could be regarded as final. An example of a case in which a purported consent was held not to be final is to be found in Lend Lease Management Pty Ltd v Sydney City Council (1986) 68 LGRA 61. In that case Cripps J (at 85) concluded that a purported consent which left to the city planner the power to determine which of two substantially different floor ratios should be applied to the development was not a valid consent.
103. The assessment of fundamental and significant environmental impacts cannot be left until the determination of the Project by the IPC.
Surface Water
104. Both DPIE and Biodiversity, Conservation and Science Directorate within DPIE (BCS) believe the model should be further validated as additional streamflow monitoring data becomes available, particularly following mining in the Tahmoor North western domain and from the BCS Thirlmere Lakes Research Program.21
105. DPIE proposes to require further assessment be undertaken post determination of the Project.
106. DPIE notes that there will be subsidence impacts to the Bargo River, Teatree Hollow, Dog Trap Creek and Hornes Creek which can potentially result in increased levels of ponding and scouring. Further, DPIE notes that other potential impacts include:
(a) impacts to flow rate and quantity of flow due to subsidence induced shallow fracturing and baseflow reductions;
(b) changes to hydraulic characteristics and the physical stability of the watercourses due to subsidence induced tilts and curvature;
(c) impacts to the water quality of watercourses as a result of increases in subsidence induced scour and liberation or contaminants (iron and gas releases); and
19 Assessment Report, p 79 20 Mison v Randwick Municipal Council (1991) 23 NSWLR 734 21 Assessment Report, p 85

24 February 2021 Page 21
Submission on SSD 17_8445 Tahmoor South Colliery expansion
S:10723829_9 KQH
(d) changes to localised flooding and flood regimes due to the effects of subsidence on the geometry of watercourses.
107. Due to subsidence impacts to Dog Trap Creek, it is proposed to shorten LW103B by 400m. However, no shortening of long walls beneath LW102B and LW101B are proposed where similar or worse impacts are predicted.22
108. We also note that the Project will have an impact on the waterflow within the Sydney Drinking Water catchment extent, to an amount of approximately 65ML a year.23 In many cases, the impacts caused by subsidence and rock fracturing are irreversible.24 The proposed rehabilitation objective requiring watercourses damaged by subsidence impacts to be hydraulically and geomorphologically stable, with riparian vegetation that is the same or better than prior to mining is unlikely to be achievable, and is merely aspirational.
109. The existing EPL includes a requirement to enhance treatment of water prior to release via Pollution Reduction Program (PRP) 22, which involved the development and commissioning of a water treatment plant (WTP) to reduce concentrations of arsenic, nickel and zinc in mine water released from LDP 1. The WTP was constructed in 2015, however the plant had continued performance issues and has now been deemed incapable of treating the mine water to the required quality. As a result, Tahmoor Coal has confirmed that has been investigating options to construct a new reverse osmosis (RO) based treatment plant, with a specification for the design and construction of the new plant issued in January 2020.25
110. There have been significant and repeated non-compliance and pollution events arising from non-compliance with the existing environmental protection licence (EPL).26 The IESC raised concerns about the potential impacts to the surface water receiving environment from overflow discharges from sedimentation basins into Tea Tree Hollow and the Bargo River.27
111. The Assessment Report relies upon a WTP to resolve existing and future water quality issues, when it has not been proposed yet, has not been designed and does not form part of the Project.
112. This is a clear indication that the current operations will exacerbate existing issues with the development.
Ground 4: The likely impacts of the Project are so severe as to warrant the Projects refusal
113. In addition to the fact that an inadequate assessment has been undertaken in order to allow the IPC to fully understand the likely impacts of the Project, as outlined above, the Assessment Report also clearly shows that the Project will result in a number unacceptable environmental impacts to both the natural and built environments, and social and economic impacts in the locality. As such, the Project should be refused having regard to s 4.15(1)(b) of the EP&A Act.
22 Assessment Report, p 88 23 Assessment Report, p 93 24 Report of the Independent Expert Panel for Mining in the Catchment: Part 2 Coal Mining Impacts in the Special Areas of the
Greater Sydney Water Catchment, p iv 25 Assessment Report, p 95-96 26 Assessment Report, p 96 27 Assessment Report, p 97

24 February 2021 Page 22
Submission on SSD 17_8445 Tahmoor South Colliery expansion
S:10723829_9 KQH
114. Further, the likely environmental impacts of the Project are such that the Project site is not suitable for the development. As such, the Project should be refused having regard to s 4.15(1)(c) of the EP&A Act.
115. The result of approval of the Project will be catastrophic for any future development of land which is proposed to be undermined. This is contrary to clause 12 of the Mining SEPP, the aims and objectives of the WLEP, and s 4.15(1)(a)(i) of the EP&A Act.
Impacts on items of Aboriginal Heritage
116. The Assessment Report (p, 127 - 128) identifies that there are 29 sites of Aboriginal Heritage above the Project. Of these 4 sites of high aboriginal heritage which are rock shelters with artwork along Dog Trap Creek will be impacted by subsidence.
117. There are no real mitigation measures proposed other than monitoring in the Project. Some of the predicted impacts may result in remediation being impossible, particularly in relation the site of high aboriginal heritage.
118. The Assessment Report suggests that the impacts can be managed by condition (p, 128). However, the recommended conditions of consent at B40 to B45 no real measures to manage impacts.
119. The impacts of the Project on items of Aboriginal Heritage have not been adequately managed or mitigated.
Impacts on items of Historic Heritage
120. The Assessment Report (p, 129) says that due ‘to potential long-term impacts on the Wirrimbirra Sanctuary, Heritage NSW recommended that the proposed longwalls be relocated outside the State Heritage Register curtilage and an adequate buffer zone be identified around the curtilage. However, DPIE does not consider this warranted, given subsidence impacts on heritage items and structures within the Sanctuary are predicted to be minor or negligible, and able to be monitored and, if necessary, repaired.’
121. Given the concerns raised by SA NSW that it is not possible to fully mitigate the predicted subsidence impacts through practical engineering design, this is not an acceptable position to take regarding the potential impacts on the Wirrimbirra Sanctuary.
Sterilisation of land above proposed longwall mining areas
122. As already discussed above, the effect of the Project will sterilise all surface ground development until that land has been undermined. This could be until after 2035 and beyond, based on previous indications from SA NSW.
123. The Project will cause subsidence above the levels to which SA NSW will provide approval for development under s 22 of the CMSC Act.
124. SA NSW has made clear that if the Project were approved, the result would be the delay of all other land uses above the Project area for, at the minimum, the duration of the Project.
125. The result of approval of the Project will be catastrophic for any future development of land which is proposed to be undermined. This is contrary to clause 12 of the Mining SEPP, the aims and objectives of the WLEP, and s 4.15(1)(a)(i), (b) and (e) of the EP&A Act.

24 February 2021 Page 23
Submission on SSD 17_8445 Tahmoor South Colliery expansion
S:10723829_9 KQH
Ground 4: The proposed conditions of consent are insufficient and cannot cure the deficiencies of the Application and impacts of the Project
126. There are a number of issues with the recommended conditions of consent. These include that:
(a) there are a number of conditions that require further assessment of impacts which relate to essential matters of consideration; and
(b) there are a number of conditions which are drafted in terms which lack clarity, finality and specify.
127. For example, Proposed condition A7 provides:
A7. Unless the Planning Secretary agrees otherwise, the Applicant must set back the commencement location (ie south eastern end) of Longwall 103B a minimum distance of 400 metres to avoid mining directly under Dog Trap Creek.
128. Proposed condition A8 provides:
A8. If the Applicant decides to seek the Planning Secretary’s approval to vary the commencement location of Longwall 103B set in condition A7 above, then it must include the following information in the relevant Extraction Plan:
(a) significance assessment of key stream and riparian features including pool volumes and water holding capacity, pool ecological attributes, groundwater dependent ecosystems and Aboriginal heritage sites;
(b) updated subsidence effects, impact and consequence assessment comparing the shortened longwall commencement position and the commencement position originally proposed;
(c) details of likely remediation required on the predictions for each of the commencement positions, and considering any watercourse damage from previously extracted longwalls; and
(d) costs and benefits of the commencement positions, including consideration of costs of any predicted remediation.
to the satisfaction of the Secretary.
129. A consent must be final and certain.28 In Mison v Randwick Municipal Council, Clarke JA held (at 740):
Where a consent leaves for later decision an important aspect of the development and the decision on that aspect could alter the proposed development in a fundamental respect it is difficult to see how that consent could be regarded as final. An example of a case in which a purported consent was held not to be final is to be found in Lend Lease Management Pty Ltd v Sydney City Council (1986) 68 LGRA 61. In that case Cripps J (at 85) concluded that a purported consent which left to the city planner the power to determine which of two substantially different floor ratios should be applied to the development was not a valid consent.
28 Mison v Randwick Municipal Council (1991) 23 NSWLR 734

24 February 2021 Page 24
Submission on SSD 17_8445 Tahmoor South Colliery expansion
S:10723829_9 KQH
130. Proposed condition A7 has the effect of leaving until later, the decision of the commencement location of Longwall 103B. This is a fundamental aspect of the Project, as it is considered in the Assessment Report as an amendment that will reduce the potential impacts to natural features including the impacts on stream features, a cliff line and Aboriginal heritage sites.29
131. The reduction in Longwall 103B was recommended by DPIE in consideration of the development as a whole. The way in which proposed condition A7 has been drafted lacks certainty and finality, in that the Secretary may determine to revert to the original length of Longwall 103B, or to some other length.
132. There are also concerns regarding a number of conditions that are unclear and cannot provide any certainty to any prudent party as to their application.
133. For example, proposed condition A1 provides:
A1. In addition to meeting the specific performance measures and criteria established under this consent, the Applicant must implement all reasonable and feasible measures to prevent, and if prevention is not reasonable and feasible, minimise, any material harm to the environment that may result from the construction and operation of the development, and any rehabilitation required under this consent.
134. Firstly, the construction of the condition is clunky, and the actual meaning of the condition is unclear. Further, it appears to act as a qualifier or pre-condition to all other conditions. Effectively this condition appears to mean that any specific performance measures and criteria established under the consent are meaningless.
135. Secondly, under the definitions section of the proposed conditions, “Feasible” is defined to mean “what is possible and practical in the circumstances”. “Reasonable” is defined to mean “applying judgement in arriving at a decision, taking into account: mitigation benefits, cost of mitigation versus benefits provided, community views and the nature and extent of potential improvements”.
136. The term “reasonable and feasible” is used widely in the proposed conditions of consent, in relation to:
(a) measures to prevent any material harm to the environment (A1);
(b) avoidance and mitigation measures in relation to particulate matter emissions (B11);
(c) air quality during operation (B14);
(d) water management (B32);
(e) protection of Aboriginal heritage (B40);
(f) establishing local vegetation connectivity and wildlife corridors (B55);
(g) mitigation upon request (D2); and
(h) preventing reoccurrences of exceedances of the performance criteria in the consent and remediating exceedances (E4).
29 Assessment Report pgs vi, xii, 11

24 February 2021 Page 25
Submission on SSD 17_8445 Tahmoor South Colliery expansion
S:10723829_9 KQH
137. The words “reasonable and feasible” were considered by Pain J in SNS Pty Ltd v Roads and Maritime Services [2018] NSWLEC 7 where it was held:
[290] In relation to the assumptions the prudent hypothetical parties would make about access to the Acquired Land, they would not consider that condition D49 in the WestConnex Project approval provides much certainty in gaining access for construction purposes. The condition is imprecisely drafted and does not refer to construction access explicitly. The definition of “reasonable and feasible” in the approval conditions is very unclear and cannot provide any certainty to a prudent party about its application. Having to resort to court action to enforce vaguely worded obligations would be considered highly risky and would lead to potentially lengthy delay even assuming success.
138. Similarly, the definition of “reasonable and feasible” used extensively through the proposed conditions is unclear, and does not provide certainty. “Reasonable” in each of these conditions gives a subjective discretion to the proponent to weigh the relative benefits against the costs incurred in mitigation. This postpones matters of substance for later determination (by the proponent) which lacks finality.30
139. Further, it indicates that real consideration could not have given to s 4.15(b) of the EPA Act in circumstances where the environmental, social and economic impacts in the locality are subject to future assessment in the context of whether their mitigation is ‘reasonable’.31
140. Considerable detail, particularly with regard to the detailed Longwall design, is deferred to the development of the extraction plans in accordance with Condition C8.
141. The Longwall design has ramifications for the subsidence impacts of the development and the economic viability of the Project. For the reasons detailed above, these matters are critical to the assessment of the Project. In deferring these details to the development of the Extraction Plans, matters of substance are left for later determination and the consent (if granted) lacks finality.
142. Additionally, it weakens the consideration that has been given to the impacts of the mine under s 4.15(b) of the EP&A Act as these impacts are susceptible to change through the incremental amendment of the mine plan occasioned by the extraction plans.
143. The proposed conditions of consent do not cure the short comings of the Project, and do not resolve or discharge the obligations and considerations of the consent authority.
144. As highlighted above, there is inadequate information to allow the consent authority to satisfy itself as to various jurisdictional pre-requisites to the grant of consent. Further, the proposed conditions of consent, do not cure the deficiencies of the Project and do not adequately determine various matters that are essential to the assessment of the Project.
Conclusion
145. Having regard to the requirements of s 4.15(1) of the EP&A Act, the Project should be refused on the basis that:
(a) The Project does not satisfy the requirements of the Mining SEPP and Wollondilly LEP for the purposes of section 4.15(1)(a)(i) of the EP&A Act .
30 Mison v Randwick Municipal Council (1991) 23 NSWLR 734 31 Weal v Bathurst City Council(2000) 111 LGERA 181; [2000] NSWCA 88 at [94] – [95]

24 February 2021 Page 26
Submission on SSD 17_8445 Tahmoor South Colliery expansion
S:10723829_9 KQH
(b) The likely impacts of that Project, including the environmental impacts on both the natural and built environments, and social and economic impacts in the locality are so severe as to warrant the refusal of the Project for the purposes of s 4.15(1)(b) of the EP&A Act.
(c) Further, the IPC does not have sufficient information to be assured that the Project will not have unacceptable environmental impacts on both the natural and built environments, and social and economic impacts in the locality s 4.15(1)(b) of the EP&A Act.
(d) On the information before the IPC, the known negative impacts from the Project indicate that the site is not suitable for the development having regard to s 4.15(1)(c) of the EP&A Act.
(e) The IPC has heard many submissions made during the course of the public hearing that outline the significant impact of the Project if it were to be approved and which would warrant refusal having regard to ss 4.15(1)(d) of the EP&A Act.
(f) The known impacts of the development, and the lack of public benefit to the community clearly indicate that the Project is contrary to section 4.15(1)(e) of the EP&A Act.
146. Insufficient information is provided with the Application to allow the consent authority to be satisfied of the matters required by section 4.15(1) of the EP&A Act.
147. The Project also fails to satisfy the objects of the EP&A Act, in that the Project does not:
(a) promote the social and economic welfare of the community and a better environment by the proper management, development and conservation of the State’s natural and other resources (s 1.3(a));
(b) promote the orderly and economic use and development of land (s 1.3(c));
(c) promote the delivery and maintenance of affordable housing (s 1.3(d);
(d) protect the environment, including the conservation of threatened and other species of native animals and plants, ecological communities and their habitats (s 1.3(e));
(e) promote the sustainable management of built and cultural heritage (including Aboriginal cultural heritage) (s 1.3(f));
(f) promote good design and amenity of the built environment (s 1.3(g)).
148. For these reasons, the IPC must refuse the Project.
If you have any questions regarding the abovementioned, please do not hesitate to contact Breellen Warry, Partner or Blake Dyer, Senior Associate.
Regards
Holding Redlich Enclosures: 4
Expert Witness Report
Tahmoor South Coal Mine Expansion SSD-8445: CBA and LEA submitted with the EIS
Name:
Jeffrey William Bennett
Address:
“Manandawara” 168 Wurungul Lane Gundaroo NSW 2620
Qualifications:
Emeritus Professor, Crawford School of Public Policy, Australian National University
Bachelor of Agricultural Economics (Hons 1) (UNE), PhD (ANU)
Fellow of the Academy of Social Sciences in Australia, Distinguished Fellow of the
Australasian Agricultural and Resource Economics Society.
Author of 140 refereed international journal papers and 18 books in the fields of
environmental, natural resource and agricultural economics.
Member of the NSW Department of Planning, Industry and Environment’s Biodiversity
Conservation Advisory Panel
Formerly, part-time member of the NSW Planning Advisory Commission
Principal of the consulting group Environmental and Resource Economics with clients from
the private and public sectors
Full Curriculum Vitae is available at https://crawford.anu.edu.au/people/visitors/jeff-
bennett
Declaration:
I have read the expert witness code of conduct and agree to be bound by it.
17 December 2019

2
The aim of this report is to provide an expert review of the Benefit Cost Analysis (BCA) and the Local
Effects Analysis (LEA) prepared by Cadence Economics as a component of the Environmental Impact
Statement (EIS) for the Tahmoor South Coal Mine Expansion (SSD-8445).
The review sets out six opinions regarding the BCA and LEA that have a material impact on the
conclusions that can be drawn from the economic analysis of the proposal.
Summary
On the basis of the opinions presented in this review, the net present value (NPV) of the proposed
mine has been over estimated by Cadence Economics.
Instead of the projected NPV of $699.5m that is put forward by the proponent of SSD-8445, a more
appropriate NPV of $247.2m should be attributed to the proposal based upon the information
contained in the BCA.
This lower NPV estimate does not take into account the missing and under estimated indirect costs
of the mine proposal. These remain to be estimated but when included would further lower the
estimated NPV of the proposed mine.
1. Direct benefits
Opinion:
The estimate of the direct benefits is too high. Both payroll taxes and council rates should be
excluded. That done, the (discounted) net direct benefit of the proposal falls from $276m to $247.3.
Justification:
The calculation of the present value of the net direct benefit of the mine includes payroll tax
payments as a benefit to the NSW Government. The NSW “Guidelines for the economic assessment
of mining and coal seam gas proposals” (hereafter referred to as ‘The Guidelines’) state that such
payments should be regarded as a cost because it is likely that, if not employed in the new project,
workers would find jobs elsewhere and have payroll tax paid for those positions.
‘Note that a new mine will also pay other taxes, such as payroll tax and personal income tax. The
majority of these taxes will have been generated without the project, as people would have been
employed elsewhere. Hence these should be included in costs. To the extent that a proponent can
demonstrate that other taxes are genuinely additional and will not be offset by lower tax payments
elsewhere in the economy, they may be recognised, provided that the impact of these taxes on the
overall NPV of the project is reported.’ (p10 The Guidelines).
There is no demonstration in the BCA that the payroll tax is ‘genuinely additional’. Therefore it
should be excluded as a direct benefit.
The payroll tax payments included as a benefit amount to $21.7m. Excluding this amount from the
total benefits accruing to the NSW Government reduces the total from $177.7m to $156.0m.
Similarly a further amount of $7m is estimated as a benefit to the project in rates paid to Wollondilly
Shire. Without justification of this amount being additional to rates that would be paid without the
mine development, it should not be considered a benefit.
With both payroll taxes and council rates excluded, the (discounted) net direct benefit of the
proposal falls from $276m to $247.3.

3
2. Indirect benefits relating to employment
Opinion:
The estimate of the indirect benefits relating to employment is too high. The indirect benefits of the
proposal that relate to employment should be set at zero rather than the $212.2m claimed in the
Cadence BCA.
Justification:
An amount of $212.2m is included as an indirect benefit of the proposed mine expansion accruing to
workers employed in the project. This amount is the premium in the average wage paid to mine
workers, above the average wage across workers in NSW. The Guidelines allow the consideration of
such an indirect benefit but recommends that:
‘An appropriate starting assumption should be that workers do not receive a wage premium, even if
they will earn more working in the mining sector’ (p13 The Guidelines).
This position is based on the assumption that labour markets operate relatively unencumbered and
deliver relatively higher wages to workers with greater productivity (due to their skills) and for doing
jobs which are unpleasant and/or risky.
However The Guidelines recommend that a case by case approach be taken when moving away from
the zero indirect benefit assumption and requires that arguments be advanced by the proponent to
justify any positive employment indirect benefit. The Guidelines suggests a number of possible
justifications:
1. Persistently high unemployment or other social disadvantage in the region;
2. New skills will be developed in the mine workforce; and
3. Payments made above those which would otherwise be necessary to attract similarly skilled
workers from other employment.
The Cadence BCA argues that there is no disutility from working in the proposed mine expansion
because allowances associated with underground work set out in the Black Coal Mining Industry
Award 2010 are minor. It does not present any other arguments regarding unemployment levels or
social disadvantage but rather calculates the average wage difference between mine wages and the
rest of NSW. The assumption made is that if the mine was not to proceed, the retrenched workers
from the existing mine would receive the average wage across NSW.
This approach causes an over-estimation of indirect benefits related to employment.
There is no persistent unemployment or social disadvantage evident or predicted for the region. The
rate of regional unemployment is lower than the state average1. Given the region’s proximity to the
Sydney labour market this is likely to remain the case. Hence, the opportunity cost of those
employed in the proposed mine will be the foregone wage in other employment.
The proposed mine will not be developing new skills for workers given that most of the employment
opportunities provided will be taken by workers currently employed in the existing mine.
1 The Cadence Local Effects Analysis states that “unemployment in the region is currently 2.3 per cent
compared to 4.8 per cent in NSW” (p 46).

4
The foregone wage of workers in the proposed mine is unlikely to be the average wage of all NSW
workers. The skill sets of workers is not that of the average worker.
The disutility of working underground may not be reflected in award conditions but is otherwise
inherent in the wage premium paid to underground miners. It is not embodied in the wage of the
average NSW worker.
To justify the payment of an ‘unnecessary’ wage premium to workers at the Tahmoor mine would
require the presentation of evidence to demonstrate the existence of labour ‘market failure’ such as
the presence of a monopoly supplier of labour that is able to force the wage rate above that which
clears the market (i.e. equates labour supply with demand). No such evidence is presented in the
Cadence BCA.
In the absence of case-based evidence to support the movement away from what The Guidelines
suggests as the default assumption regarding wage premiums, the indirect benefits of the proposal
that relate to employment should be set at zero rather than the $212.2m claimed in the Cadence
BCA.
It should also be noted that the wages paid to mine employees are included as costs in the
estimation of the net direct benefits of the proposal. The inclusion of wage premiums as indirect
benefits as per the Cadence BCA means that the wage premium is included twice in the analysis:
once as a cost, and once as a benefit. This in itself is counter intuitive.
3. Indirect benefits relating to suppliers
Opinion:
The estimate of the indirect benefits relating to suppliers is too high. The indirect benefits of the
proposal that relate to the supply of non-labour resources should be set at zero rather than the
$211.4 million claimed in the Cadence BCA
Justification:
Similar to the indirect benefit potentially generated by a project through employment of people, The
Guidelines recommend consideration of indirect benefits arising from the supply of other factors of
production:
Similar to the economic benefit gained by existing landholders and workers, local suppliers may also
receive an economic benefit by achieving higher surpluses through supplying the mining/coal seam
gas project. (p14 The Guidelines)
The Guidelines also make it clear that these surpluses must be demonstrated to arise net of any
surplus generated in the resources next best use; i.e. their opportunity costs.
This should be net of any producer surplus loss because of a reduction in an existing industry. (p14
The Guidelines)
The Cadence BCA estimates the discounted supplier indirect benefits to be $211.4m. This estimate is
based on the producer surpluses of NSW suppliers as generated by the application of Input-Output
Analysis Type I multipliers. That estimate is the ‘value added’ produced for the first round suppliers
of resource inputs.
This approach does not however take into account the foregone producer surpluses that would be
generated by the use of the resources to be employed in the mine.

5
Similar to the arguments presented for the employment indirect effects, omission of producer
surplus opportunity costs implies that the resources used would not generate any producer surplus
in their alternative uses. The implication of this is that the resources would either be otherwise
unemployed or that they would be used in industries that are so competitive that any surplus is
competed away. No evidence to support these potential arguments is provided in the Cadence BCA.
Given the mobility of resources used in the coal mining industry (at least prior to commissioning)
both within the state of NSW and nationally, resources have multiple potential alternative uses. Put
simply, the alternative of unemployed resources is highly unlikely. Secondly, not all of these
alternative uses would be in industries that are any more or less competitive than the market
context facing the Tahmoor mine proposal. Rather, the default setting applied to the consideration
of indirect labour employment benefits is appropriate for the estimation of the indirect benefits
associated with the supply of other resources.
In the absence of evidence to support the assumption that the producer surpluses available to
suppliers of resources to the proposed mine are any different from those that could be earned in the
next best uses of those resources, the indirect benefits of the proposal that relate to the supply of
non-labour resources should be set at zero rather than the $211.4 million claimed in the Cadence
BCA.
Again it is worth noting that the input costs of supplying resources to the mine are considered to be
costs in the calculation of the direct benefits of the proposed mine, however in the Cadence BCA a
part of those costs is then treated as a benefit in that they are labelled an ‘indirect benefit’. As
mentioned above, this approach is counter intuitive.
4. Indirect costs
Opinion:
Potentially significant indirect costs have been either under estimated or omitted from the benefit
cost analysis. The extent of the indirect cost underestimation due to the omission of the opportunity
costs of land has not been estimated.
Justification:
A number of indirect costs relating to environmental impacts are included in the BCA as monetary
estimates. These include the costs of biodiversity loss, noise and dust. The approach taken to the
quantification of these costs is to include the costs borne by the mine’s operation in meeting the
statutory obligations regarding these impacts. Hence, the financial costs of noise and dust
abatement are assumed to eliminate the costs borne by neighbours from these nuisances. Likewise,
the cost of offsetting biodiversity loss, as determined by the NSW government’s offset calculator, is
assumed to ‘make good’ any of the biodiversity loss caused by the mine.
This approach assumes that there is no residual cost associated with noise and dust given that
statutory obligations have been met.
It also assumes that the NSW Government’s biodiversity offset scheme provides perfect substitution
for the biodiversity loss caused by the mine.
Both of these assumptions mean that there are some noise, dust and biodiversity costs that are not
included in the BCA. The magnitude of these omissions is not known.

6
Other indirect costs are not estimated in monetary terms for the BCA. These include impacts on
Aboriginal and European heritage as well as aesthetic impacts. These indirect costs are evaluated
qualitatively but are not integrated into the net present value of the proposal. Their exclusion
implies that the net present value of the proposed mine as reported in the BCA is an overestimate.
The extent of that overestimation cannot be judged without further analysis to estimate in monetary
terms, the environmental and cultural impacts of the mine. It is, however, clear that these costs exist
given the literature that is reported in the international data base of environmental value estimates
maintained by the Canadian Department of the Environment with support from the Australian
Government: https://www.evri.ca/en.
A further indirect cost relating to the opportunity cost of land has also been omitted.
The BCA concludes that the value of land impacted by the underground mine workings will be the
same with or without the mine. The assumption made is that the surface impacts of the long-walls
will not impact materially on the current uses of the land. While that may be the case, opportunity
costs do not only relate to current uses of the land impacted. They also relate to the potential land
use changes that would occur if the mine did not proceed. Given the peri-urban nature of the land to
be undermined by the Tahmoor mine, the current agriculturally based land uses are likely to give
way to urban development. The appropriate measure of opportunity cost is therefore the difference
between land values with and without the proposed mine. These land values reflect the present
value of the uses to which the land can be put.
If, as a condition of the mine going ahead, no change in land use was permitted, then the
opportunity cost of the land above the mine would be the difference between the value of the land
as currently used and its value as an urban development (net of the costs of development).
If the mine was allowed to go ahead with the prospects of housing above the long walls being
impacted by subsidence, then the opportunity cost would be the costs of that subsidence. Estimates
of that value could be achieved through an analysis of the costs of rectifying potential problems or
through an analysis of the prices of land with and without the prospect of subsidence prior to the
announcement of the undermining.
If the mine was allowed to proceed and housing development above the longwalls was not
permitted until after the completion of the mining operation, then the opportunity cost of the land
above the mine would be the difference in the value of the land with and without the caveat on
future development.
Hence the value of the indirect cost associated with the mine proposal is dependent on any
associated decision regarding future housing developments. It will be highest if the housing
development is prevented. There will be lower indirect costs associated with the mine’s land use if
surface development was permitted.
The extent of the indirect cost underestimation due to the omission of the opportunity costs of land
has not been estimated.
5. Local Effects Analysis
Opinion:
The local impacts are exaggerated. The extent of the over estimation of the local area effects has not
been quantified. However, given that there has been no justification for deviating from the zero

7
indirect benefits assumption, then the local area effects, when based on the state wide indirect
benefits should be taken to be zero.
Justification:
The Cadence estimates of the local impacts of the proposed mine are based on the estimates of the
indirect employment and services analysis set out in the BCA. Given that it has been demonstrated
above that these indirect benefits (on a state-wide basis) have been over-estimated then it is
necessarily the case that the proportion of those indirect benefits accruing to the local region are
also over estimated.
Furthermore, if the local effects are considered not in monetary benefit terms but rather in terms of
the number of additional jobs and the volume of extra business created by the mine (compared to
the case where the mine does not proceed) then an overestimate also arises using the Cadence
approach. That is because the estimates of additional jobs and services understate the possibilities
for other industries to take up the resources that would not be employed if the proposed mine did
not go ahead. In other words, alternative uses for the resources would likely emerge.
The extent of the over estimation of the local area effects has not been quantified. However, given
that there has been no justification for diverting from the zero indirect benefits assumption, then
the local area effects, when based on the state wide indirect benefits should be taken to be zero.
Conclusions
The key elements of the BCA are presented in the Cadence report in Table 19 on page 40.
The conclusion drawn by Cadence from the BCA results is that the project will generate a net present
value of $699.5m. The primary drivers of that figure are:
1. Royalties $177.7m
2. Taxes $ 98.3
3. Indirect employment benefits $212.2m
4. Indirect suppliers benefits $211.4
The indirect costs as estimated by Cadence are immaterial in the NPV calculation at just $0.1m.
On the basis of the opinions presented above, the NPV estimate has been over estimated.
Lowering the tax component by $27.7m by removing the payroll tax and rates elements and setting
the indirect benefits to zero leaves an NPV of $247.2m. This estimate is significantly lower than the
projected net present value of $699.5m put forward by the proponent.
This lower NPV estimate does not take into account the missing and under estimated indirect costs
of the mine proposal. These remain to be estimated but when included would further lower the
estimated NPV of the proposed mine. If the opportunity cost of land together with the other indirect
costs of the mine are greater than $247.2m, it could be concluded that the proposed mine would
not enhance the well-being of the people of NSW.
Further analysis would require inclusion of the omitted indirect costs into the NPV calculation and
the conduct of a sensitivity analysis on that lower NPV estimate. The approach taken by Cadence to
the sensitivity task is appropriate particularly in varying the expected prices to be received for
coking/thermal coal over the lifetime of the project. The prices assumed by Cadence are currently
lower than the prevailing prices on international markets.

8
The lower NPV would be reflected by lower estimates of the beneficial impacts of the mine on the
local region.
Documents consulted
Cadence Economics (2018). ‘Economic Impact assessment of the Tahmoor South Project’.
NSW Government (2015). ‘Guidelines for the economic assessment of mining and coal seam gas
proposals’.
The Treasury (2017). ‘NSW Government Guide to Cost-Benefit Analysis’, Policy and Guidelines Paper
TPP 17-03.
1
Expert Witness Supplementary Report
Tahmoor South Coal Mine Expansion SSD-8445: CBA and LEA submitted with the EIS
Name:
Jeffrey William Bennett
Address:
“Manandawara” 168 Wurungul Lane Gundaroo NSW 2620
Qualifications:
Emeritus Professor, Crawford School of Public Policy, Australian National University
Bachelor of Agricultural Economics (Hons 1) (UNE), PhD (ANU)
Fellow of the Academy of Social Sciences in Australia, Distinguished Fellow of the
Australasian Agricultural and Resource Economics Society.
Author of 140 refereed international journal papers and 18 books in the fields of
environmental, natural resource and agricultural economics.
Member of the NSW Department of Planning, Industry and Environment’s Biodiversity
Conservation Advisory Panel
Formerly, part-time member of the NSW Planning Advisory Commission
Principal of the consulting group Environmental and Resource Economics with clients from
the private and public sectors
Full Curriculum Vitae is available at https://crawford.anu.edu.au/people/visitors/jeff-
bennett
Declaration:
I have read the expert witness code of conduct and agree to be bound by it.
19 March 2020

2
1. Background In December 2019, I prepared a review of the Benefit Cost Analysis (BCA) and the Local Effects
Analysis (LEA) prepared by Cadence Economics as a component of the Environmental Impact
Statement (EIS) for the Tahmoor South Coal Mine Expansion (SSD-8445). That review set out six
opinions regarding the BCA and LEA that had a material impact on the conclusions that can be drawn
from the economic analysis of the proposal.
In this report, I provide a supplementary review of the economic impact assessment of the amended
Tahmoor South Coal Project, as prepared by EY and presented as Appendix L of the Environmental
Impact Assessment.
The review is supplementary because the analysis performed by EY for the amended mine is
fundamentally the same as that performed by Cadence Economics. While a number of assumptions
that underpin the analyses have changed, the methodology used is the same.
Hence, the six opinions set out in my initial review remain unchanged because they all relate to
broad, methodological issues. This supplementary review details the changes made to underpinning
assumptions between the Cadence and EY analyses and makes comment on their validity.
2. Coal price assumption The price assumed for coal through time is different between the two analyses. In the Cadence
Economics study, the price (for metallurgical coal) varies between $201 and $166. The EY study
assumed price ranges from $219 to $184. This significant increase in price is not substantiated other
than through references to sources (Source: EY estimates based on Consensus Economics (2019),
Office of the Chief Economics (2019) and Tahmoor Coal) which are the same as those use by
Cadence Economics, but apparently up-dated.
The price of coal is volatile. This is particularly the case at present with the AUD/USD exchange rate
and resource/energy prices falling heavily with the outbreak of the COVID19 virus. The implication is
that price forecasts are notoriously uncertain. While both studies use sensitivity analyses to show
the impact of different price forecasts on their results, this does not present a consistent picture
across the two analyses. It would have been preferable to use the same base case price assumptions
so that a more straightforward comparison between the original and modified projects could have
been established.
This is an important point because the price assumption drives much of the analyses. The higher
prices through time assumed by EY means that the impact on predicted gross revenue caused by the
reduction in mine output under the amended mine plan is masked. While gross revenue falls for the
amended project, the higher prices make up for some of the lost output.
Furthermore, the increase in predicted price means that royalties are increased (from $149m to
$161m in present value terms).
With lower gross revenues and increased costs (resulting from increases in capital and operating
costs) the present value of the producer surplus falls from $609.6m to $324.3m between the original
and amended projects. While that is irrelevant, directly, to the overall BCA in terms of profits to the
mine’s owner (as a foreign owned operation, no benefit accrues to the people of NSW from profit), it
is relevant in terms of reduced company tax. This component falls from $98.3m to $81.3m (in
present value terms).

3
Overall then, the direct value of the mine falls by $5m because of the combination of the change in
price assumption and the output reduction. If the price assumption had been sustained between the
Cadence and EY analyses this fall would have been significantly larger.
3. Indirect benefits A key change to the assumptions underpinning the benefit cost analysis involves the wages paid to
mine workers. Under the Cadence Economics analysis, wages varied over time between $106,000 pa
and $146,000 pa. EY assumes a constant wage over the life of the mine of $150,000 pa.
The impacts of this change are (at least) two fold.
First, it reduces the NPV of the mine’s profits. However this is irrelevant to the BCA except through
its impact on company tax as discussed above.
Second, it has an impact on the indirect benefit to workers claimed by the analyses. That indirect
benefit rises (in PV terms) from $212.2m (original project) to $264.3m (amended project).
The increases in capital and operating costs (apart from wages) born under the amended mine
proposal also impacts on the indirect benefits claimed for ‘suppliers’. This increases from $211.4m to
$247.5m between the Cadence Economics and EY studies.
Together, these increases amount to additional indirect benefits of $88m.
This increase in indirect benefits overshadows the reduction in direct benefits of $5m.
The somewhat surprising result is that the net present value of the amended mine proposal is
higher than the originally proposed mine: up from $699.5m to $783.8m.
This is despite a reduction in mine output from 48 to 43 Mt ROM coal over the life expectancy of the
project.
4. Conclusion The amended mine proposal will result in $5m less direct net benefits to the people of NSW. That
brings the NPV of the mine to around $242m, down from around $247m as estimated in my original
review.
This figure omits the indirect benefits calculated by both Cadence and EY on the grounds of the
arguments set out in my original report. The economic logic that is at the foundation of those
arguments has not changed.
The estimate of $242m is still regarded as an overestimate of the NPV of the mine because of the
additional arguments made in my original report, as they relate to the omission or underestimation
of a range of the indirect costs of the mine.

Economic Review - Expansion of the Tahmoor Colliery © 2021 POST COVID SOLUTIONS
1. Qualifications
1. Mr Don Miles, Director POST COVID SOLUTIONS (PCS), M.Sc. (Economics) Iowa State University 1983; former International Professor of Economics, Forecasting and Decision Analysis at Guangdong University of Foreign Studies, China in 2006; former Acting Head and Lecturer of Agricultural Economics and Marketing at Curtin University, Muresk, WA in 1985.
2. Previously held roles include:
(a) Chief Senior Economist at Conics (now RPS), Director of Transport Economics at GTA Consultants, Principal Transport Economist at PB (now WSP), Principal Economist at URS (now AECOM).
(b) Principal Economist at the NSW Department of Planning and Environment, Sydney.
(c) Senior Financial Cost Controller, Department of Transport, Energy & Infrastructure, Adelaide.
(d) Transportation Tax Economist at the Oregon Department of Transport, Salem, USA.
2. Executive Summary
3. In the opinion of PCS, the Tahmoor mine expansion project (Project) has a public net present value (NPV) of significantly less than zero (NPV < 0).
4. On this basis, and considering the stated costs to the public, the Project should be refused.
3. Scope
5. PCS have been instructed to review:
(a) The Cadence Economics (CE) and Ernst & Young (EY) Cost Benefit Analyses (CBA);
(b) Professor Emeritus Jeff Bennett’s expert witness report (dated 17 December 2019) and his supplementary expert witness report (dated 19 March 2020) following the update of original estimates from Cadence Economics by Ernst & Young who had acquired CE;
(c) Any relevant reports, guidelines, tests, findings, coal and carbon prices, mine data, royalty forecasts, models, and other information that can assist in forming PCS opinion.
6. Limited resources, data, and time permitting, PCS have been asked to provide opinion related to:
(a) The net public benefits of the proposed coal mine expansion project (the Project);
(b) The net present value of the mining royalties for the Project;
(c) The net present value of scope 1, 2, 3 total greenhouse gas (GHG) emissions identified;
(d) Possible future carbon prices and a recommended price(s) of carbon to use in the CBA;
(e) Possible future coal prices and recommended price(s) of coals to use in the CBA;
(f) Reported Tahmoor coal mine losses versus conflicting 30 per cent company tax claims;
2
(g) Any transparency, uncertainty, and optimism bias issues;
(h) Multiple entangled risks that appear minimised in the two economic impact assessments;
(i) Any technical information related to CBA, optimal levels of abatement (OLA), problem shifting analysis (PSA), local effects analysis (LEA), probability-weighted mean-centred unbiased expected value analysis (EVA), and economic impact assessments (EIA) in general;
(j) Any possible omissions or errors;
(k) Any possible remedies or solutions; and
(l) Any observations and conclusions.
4. Background: The socio-economic-ecologic and public benefits of the mine and other land uses
7. The public benefits of the proposed Coal Mine Expansion Project need to be considered in two ways:
(a) Whether the benefits of the project outweigh its costs to the members the NSW community as a whole; and
(b) Whether the public benefits of the project outweigh the public benefits of the next best alternative land use.
8. Five tools and tests are often used to provide information for these two relevant matters.
(a) A CBA is used to assess the public interest by estimating the NPV of the project expansion to the NSW community;
(b) Whether the NPV public benefits of the project expansion outweigh the NPV public benefits of other land uses, and in particular the next highest and best alternative land use;
(c) Is the project’s NPV significantly higher than other projects’ NPV’s? NSW Treasury (2017, page 1) guidelines state “CBA helps decision makers to maximise welfare for the community.” This translates into a first-best decision of maximising the NPV (NPV = max).
(i) A negative (NPV < 0), or statistically zero net present value (NPV = 0), clearly identifies that there are superior (NPV > 0) alternative projects’ that can make society much better off. A negative NPV is a clearly sub-optimal resource wasteful and inefficient decision.
(ii) Low and uncertain positive NPV’s can also identify opportunity costs from foregoing the projects that better maximise the NPV and the welfare for NSW (i.e., 0 < NPV < max).
9. Some impacts are difficult to quantify objectively. Valuation of some impacts might be at least partly subjective or not robustly possible. Such unquantified impacts and externalities may not explicitly be included in the final NPV, but they must to be reported alongside the NPV especially if they are material or have been omitted. The CBA must be transparent.
(a) As a consequence, a positive NPV does not necessarily mean that the project is in the public interest. The consent authority must assess unquantified impacts, externalities, costs imposed on third parties, or information about the project to be determinative.

3
(b) The consent authority can consider if there will be any funded abatement or actual remediation of negative externalities, impacts on third parties and future generations.
(c) It can request that some optimal level of abatement (OLA) i.e., above zero per cent abatement and less than 100 per cent abatement be evaluated. Neither 0% nor 100% per cent abatement are ever likely ever optimal (i.e., in math; 0% < OLA <100%).
(d) There exist well-documented non-market valuation tools that can be applied if needed.
10. An LEA is used to assess the likely impacts of the project in the locality when that the CBA NPV above is mean-centred, unbiased, robustly, transparently, and significantly positive (NPV > 0). LEA is irrelevant if the CBA NPV is negative or statistically zero. With low and uncertain NPV’s, there are clearly superior alternative projects’ with higher and more certain unbiased positive NPV’s which make society better off (e.g., positive mean centred unbiased probability-weighted expected value analysis result 0 < EVA <= max). If an LEA is needed the results need to also be mean-centred unbiased expected values, or based on actual numbers that may be available. Actuals are superior to econometrically mean-centred unbiased expected values with R-squares and other statistics, which are superior to guesses. Some LEA models have been discredited and are unacceptable.1
11. As recommended by Professor Peter Abelson in March 2014 for the former Department of Planning and Infrastructure and NSW White Paper (2013, page 88) implementation, and approved by NSW Treasury:
The prime method of reporting the overall change in land use should be the public net present value. If NPV is positive, the benefits exceed the costs and there is a net social (or public) benefit. The higher the NPV the greater the net social benefit. The value of land is compared to its highest alternative use. This may include the value of land in housing, lower density commercial space, open space (passive or active) etc. The public NPV is the best decision metric.
12. Professor Abelson and NSW Treasury approved “The key elements in the estimation of the net social benefit of a major mining project are:
The value of land used in mining rather than in its highest alternative use;
Major public expenditure not internalised in the economics of the mining project;
Environmental and social impacts of various kinds; and
Any other local economic effects not captured.”
13. Professor Peter Abelson, NSW Planning and Treasury are quoted because of material deficiencies in the proponent’s submissions. This insight will be subsequently used to further enhance the expert witness reports’ submitted by Professor Jeff Bennett on behalf of Holding Redlich (HR) and the client.
14. Professor Peter Abelson and Professor Jeff Bennett are the two top CBA economists in Australia. Mr Peter Brain is Australia’s top LEA expert and premier energy demand forecaster. All three experts and their communications and works have been appropriately considered for this report. They have shaped the conclusions. Any errors are PCS and Holding Redlich’s (HR), and not the experts consulted.
1 P.J. Brain, (1986, 2017, 2020) “How Orthodox Economic Models Justify Deregulation, Inequality and Unemployment” and 27 September
2020 original e-communication “CGE models are the biggest load of c--p one can imagine. Since the GFC, Holden, and COVID shocks, actual employment numbers have been superior to econometric R-squares which in turn are superior “zombie economics” models which may or may not be superior to guestimates. Bottom line is CGE is sub-optimal, GFC discredited; superior economic models and best guestimates with probabilities or confidence indicators are preferred or more reliable.

4
15. Many consultants’ reports have so many disclaimers stating that their reports cannot be relied on. This has been noted since Hopkins v AECOM Australia Pty Ltd (No 8) [2016] FCA 1096 which is said to have cost millions in legal fees without going to a full court hearing. The final settlement was signed on 31 May 2016 and some parties were held harmless with no case to answer. Others were not. It did however give impressive array of legal disclaimers on other reports by firms like AECOM.
16. This report is produced by PCS to the best of ability based on limited data, with limited time and resources available. A more comprehensive and in-depth follow-up PCS report based on and future probability-weighted mean-centred unbiased EVA is proposed. That said the results in this initial PCS report based on simplifying assumptions are considered useful approximations. Scenario 100,000,000 t CO2 equivalent provides additional insight.
5. Synopsis of Expert Opinions and Relevant Information
17. Professor Emeritus Jeff Bennett has on behalf of HR and Ironlaw summited an expert witness report (dated 17 December 2019) and a supplementary expert witness report (dated 19 March 2020) following the update of original estimates from CE) by EY who had acquired CE. A number of key assumptions changed comparing CE and EY.
18. Professor Bennett’s December 2019 review of the CBA and the LEA prepared by CE as a component of the EIS for the Project sets out six expert opinions regarding deficiencies in the CBA and LEA that had a material impact on the conclusions that can be drawn from the economic analysis of the proposal.
19. His supplementary expert report on the updated analysis performed by EY for the amended mine is fundamentally the same as that performed by CE. A number of assumptions that underpin the analyses changed, but the methodology used is the same. Professor Bennett’s six opinions set out in his initial review thus remained unchanged because they all related to broad, methodological issues. His supplementary review details the changes made to underpinning assumptions between the CE and EY analyses and commented on their validity.
6. Coal Prices and Other Key Assumptions
20. Professor Bennett noted the price assumed for coal through time is materially different between the first two CBA’s. In the CE CBA study, the price (for metallurgical coal/hard coking coal or HCC) varies between $201 and $166. The EY study assumed price ranges from $219 to $184. The coal prices adopted for the EY analysis were on average, over the life of the project (2020 to 2035) for thermal coal price assumed to average $93.8 dollars per tonne and hard coking coal price averaged $187.1 dollars per tonne. The EY price peaks in 2020 at $219.2 declining to a constant of about $184.6 per tonne from 2024.
21. Tahmoor Coal did not provide CE (and presumably EY) their internal price forecasts for HCC and thermal coal. CE noted “the benchmark price for Australian thermal coal includes an ash content of 13.7 per cent. The project’s thermal coal has a much higher ash content of 21 per cent, reducing the calorific content of the coal. Given the relatively low quality, thermal is assumed to only fetch 91.5 per cent of the benchmark price.” EY EIS noted “over the life of the project, Tahmoor Coal advises that both the hard coking coal (HCC) and thermal coal (TC) will sell for 90% of the reference price.” These variable HCC and TC prices and reference price discounts thus affected the net present values, average prices of coal, the economics of a variable mixture of expected quantities and qualities of saleable thermal, hard coking coal, and additional run of mine (ROM) washing royalty discounts valued at $3.50 a tonne.

5
22. Professor Bennett stated the increase in predicted prices means that royalties are increased from $149m (CE) to $161m (EY) in present value terms. Coal royalties became then two thirds of the EY CBA’s total benefits in NPV terms. They increased from CE’s 60 per cent to EY’s 66 per cent of the respective CBA’s totals based on Professor Bennett’s work. The remaining percentages were then from the NPV of company taxes apportioned to NSW (i.e., CE’s 40 per cent or $98.3 million, and EY’s 33 per cent or $81.3 million). Company taxes have since been zeroed and removed from the public benefit test. The mine also reported a loss in September 2020.
23. Following NSW Treasury (2017), and PCS (2021) works, royalties are now the most important and only public benefit. Like the prices for both coals, royalties reflected a variable mix of expected quantities of saleable thermal and hard coking coal, ROM production, coal washing, updated discounts to the reference prices, and dynamic exchange rates.
24. Econometric forecasts and R-squares etc. could have been provided based on actual data but that is not yet available. Actual payments, discounts, and their calculations which have a long and accurate history should have been provided all consultants. They were not. As a result EIA (and presumably other EIS) models were built without actuals. The NPV results and assumptions, in the absence of robust EVA and actuals must be considered uncertain. Without data histories; no probabilities, confidence ranges or R-squares could be provided.
25. Table 1 shows the Royalty NPV’s reported by CE (18 December 2018), EY (4 December 2019) and PCS (10 February 2021). All have been calculated at a 7 per cent (7%) discount rate, other assumptions vary marginally, and the methods appear consistent. PCS was able to reverse engineer CE’s NPV results.
Table 1 - Royalty NPV’s reported by CE (18 December 2018), EY (4 December 2019) and PCS (10 February 2021)
Royalty NPV’s reported by CE (18 December 2018), EY (4 December 2019) and PCS (10 February 2021)
Cadence Economics (CE) $149,100,000 NPV
Ernst & Young (EY) $161,100,000 NPV
Post COVID Solutions (PCS) $144,100,000 NPV
Scenario 100,000,000 (PCS) $144,100,000 NPV
26. For simplicity and speed, PCS initial study used a constant HCC price of $195.00 (courtesy of a USD $150 reference price sourced on 9 February 2021 by Paul Manley of Wood Mackenzie *1.3). PCS initial study also used a TC constant price of $104.00 (courtesy of a USD $80 reference price sourced on 9 February 2021 by Paul Manley of Wood Mackenzie *1.3). PCS used a constant 90% of the coal reference price courtesy EY’s EIA report. PCS used a marginally higher per cent of TC than EY (courtesy ERM’s and CE’s reports). PCS used a 5.8% higher ROM differential courtesy EY compared to CE. PCS used an average cost of production of $111.11 courtesy MineCraft Consulting Pty Ltd October 2020 data. These assumptions contributed to PCS $144.1 million in royalties above. Based on the models and assumptions used, compared to CE’s $149.116, EY is 8 per cent higher and PCS 3.3 per cent lower. Not a huge difference. In other words, the three sub-optimal models used work. But no probabilities, confidence ranges, R-squares or statistics could be provided without actuals.
27. Subsequent PCS models will use a significant range of dynamic and probability weighted HCC and TC coal prices, carbon prices, exchange rates, reference price discounts, costs, mine productivity, timings, engineering, safety and other variables to generate unbiased mean-centred probability-

6
weighted EVA results. Probability-weighted dynamic PSA EVA results would be superior. In a simple PCS ‘Scenario 100,000,000’ the mine expansion is constrained to 100,000,000 tCO2e—all scopes—and with marginally higher TC prices ($107.86) the PCS royalty NPV remains $144.1 million. This scenario is used to simplify the GHG issue.
28. Table 2 shows the PCS approximated Royalty Payments, Discounts and Net Benefits. This table shows that only tangible NSW benefit is the public NPV Royalty Benefit which is less than $2 million in years 1 and 16, and peaks in year 4 (based on the initial PCS simplifying assumptions specified above).
Table 2 - PCS approximated Royalty Payments, Discounts and Net Benefits
29. The material increases in royalties between CE (December 2018 = $149.1 M) and EY (December 2019 = $161.1 M) contrast SIMEC subsequently reporting in September 2020 meeting minutes that “Tahmoor Coal is running at a loss” which implies tax losses may be carried forward or occurred, and which makes the company tax payments of $81.3 million in NPV benefits in EY completely uncertain. This reported loss is also despite a higher amount and percentage of thermal coal in the earlier CE CBA (9.3 per cent) compared to the updated optimistic EY CBA (5.9 per cent).
30. Only TC is produced at loss and HCC is produced at a profit. So if the average cost per tonne exceeds the average saleable coal price, the mine may temporarily close. A temporary closure will impact royalties via the amounts, timing and effect of the discounts. Reasons for the reported loss are not transparent; one assumes TC prices, safety, or a COVID/JobKeeper pause.
31. The CE and EY CBA’s silently imply that the State would get no revenues and no apportioned company taxes if the mine expansion was refused. They failed to estimate how much could have been received from property development, real estate sales, and related power, water, sewer, road, telecom, active transport, school and recreational projects. It has not yet been possible to obtain exact histories of actual royalties and company taxes paid over the years’ or the lost revenues from sub-divisions and the pre-sold property sales that were refused.
Year Gross ROYALTY Discount Royalty Payment NPV FactorNPV Royalty
BENEFIT
1 2,310,615$ 872,812$ 1,437,803$ 1.0000 1,437,803$
2 8,015,330$ 3,029,590$ 4,985,740$ 0.9346 4,659,672$
3 19,949,914$ 7,544,594$ 12,405,320$ 0.8734 10,834,807$
4 27,115,832$ 10,282,080$ 16,833,753$ 0.8163 13,741,392$
5 28,253,980$ 10,853,249$ 17,400,730$ 0.7629 13,275,017$
6 29,719,901$ 11,462,772$ 18,257,130$ 0.7130 13,017,334$
7 30,143,606$ 11,495,002$ 18,648,604$ 0.6663 12,425,565$
8 32,992,790$ 12,550,010$ 20,442,779$ 0.6227 12,729,719$
9 30,097,477$ 11,498,415$ 18,599,063$ 0.5820 10,824,655$
10 27,462,779$ 10,493,117$ 16,969,662$ 0.5439 9,229,799$
11 32,693,541$ 12,400,146$ 20,293,396$ 0.5083 10,315,133$
12 28,835,115$ 11,074,903$ 17,760,212$ 0.4751 8,437,877$
13 30,693,113$ 11,687,215$ 19,005,898$ 0.4440 8,438,619$
14 30,616,789$ 11,653,330$ 18,963,459$ 0.4150 7,869,835$
15 20,235,389$ 7,691,170$ 12,544,219$ 0.3878 4,864,648$
16 8,917,619$ 3,401,761$ 5,515,858$ 0.3624 1,998,947$
PCS 388,053,790$ 147,990,165$ 240,063,625$ 144,100,821$

7
32. That aside multiple CBA guidelines require EIA estimates to be net of the alternative next highest and best use — so the opportunity costs are transparent. The proponents were required to demonstrate the ‘genuinely additional’ public net present values. It is highly unlikely that one-third of total benefits are ‘genuinely additional’ because of the range of property development projects foregone. It is also clear that the coal mine expansion is NOT the highest and best use because the public NPV is equal to zero in the conservative Scenario 100,000,000 when all emissions are priced at a trivial $2.41 per tonne of CO2e.
33. The proponents also failed to meet all of Planning and Infrastructure and Treasury approved (which EY actually had in 2014-2015 or so) “key elements in the estimation of the net social benefit of a major mining project” specifically:
(a) The value of land used in mining rather than in its highest alternative use (missing);
(b) Major public expenditure not internalised in the economics of the mining project (zero);
(c) Environmental and social impacts of various kinds (ten are zero, $0.11 million total); and
(d) Any other local economic effects not captured (three are not optimal or pass on greater costs to third parties and future generations).
34. CE and EY did report that the quantities mined, sold and recycled changed. Mine output decreased from 48 to 43 Mt ROM coal over the life expectancy of the project. Gross revenues resulted from saleable coal production of 38.4 Mt * $158.33 in CE and 32.2 Mt * $178.94 average price in EY’s CBA. Another factor was the reference price discount reported increased to be 10 per cent. Recent royalty actuals are thus needed to confirm the accuracy of CE’s, EY’s and PCS’s assumptions. These have been requested and can be analysed using advanced econometrics, PSA EVA models, and mine models for credibility. There is no other first-best alternative proxy to the actuals.
35. The State Budget indicates mining royalties are forecast to fall to $1.4 billion in 2020-21. The additional $4.6 billion revenue over the three years to 2023-24 reflects a $1.4 billion (23 per cent) drop over the four years to 2023-24. The much weaker outlook for coal royalties is due to a combination of lower than previously forecast thermal coal prices and a higher than anticipated Australian dollar. Global coal markets are facing significant long-term structural challenges. Demand for coal as an energy source has been weakening, driven by competition from other sources, the widespread substitution away from coal-fired electricity generation into technologies fuelled by increasingly competitive liquid natural gas and renewable energy sources, all per the NSW Budget papers.
36. This NSW government proxy indicator infers optimism bias in EY’s EIA NPV. Royalties may well be lower than EY’s hoped for $161.1 million NPV EY December 2019 report. PCS considers a superior estimate is $144.1 million in NPV terms. PCS is $17 million in NPV terms (or 10 per cent) lower than EY. Ten years of actual royalties should have been submitted by the proponent’s so that there is no debate, no hologram, and no transparency issue. Ten years of actuals royalty payments tend not to be biased, and may be interrogated using econometric, PSA EVA, mine engineering models, and test statistics. Recall, royalties are now 100 per cent (all) of the public benefit. Royalty benefits and their timing matter most. Timing and amounts affect the public NPV.
7. Transparency, Uncertainty, and Optimism Bias Issues
37. It did not escape Professor Bennett’s attention that there had been significant under-estimations of costs and over-estimations of benefits by CE and EY. Optimism bias in the hundreds of millions in NPV terms, and some odd contradictory claims of materially increased indirect benefits, vs. a 16

8
per cent reduction in saleable coal and 11 per cent reduction in ROM tonnages when comparing CE and EY:
“Together, these increases amount to additional indirect benefits of $88m. This increase
in indirect benefits overshadows the reduction in direct benefits of $5m. The somewhat
surprising result is that the net present value of the amended mine proposal is higher
than the originally proposed mine” (original emphasis).”
38. Under the CE analysis, wages varied over time between $106,000 pa and $146,000 pa. EY assumes a constant wage over the life of the mine of $150,000 pa. This had an impact on the indirect benefit to workers. This artificial indirect benefit rose (in PV terms) from $212.2m (original project) to $264.3m (amended project). Some 24.5 per cent higher.
39. Since wages paid were not actuals, PCS used propriety © MineCraft data and estimated an average cost of production excluding royalties (driven by coal prices and ROM discounts) and finance costs (driven by interest rates, lending arrangements, and exchange rates) of $111.11 per tonne. Actual costs per tonne and revenues were not provided. That said approximated private NPV benefits are far out-weighed by the ten public NPV third-party and inter-generational costs that were effectively zeroed by CE and EY.
40. Professor Bennett noted it would have been preferable to use the same base case price assumptions so that a more straightforward comparison between the original CE and modified EY projects could have been established. He noted that:
i. “This is an important point because the price assumption drives much of the analyses.
ii. The higher prices through time assumed by EY means that the impact on predicted gross
revenue caused by the reduction in mine output under the amended mine plan is
masked.
iii. While gross revenue falls for the amended project, the higher prices make up for some
of the lost output. “
iv. CE’s NPV “includes $0.1 million of incremental costs that are not internalised by the
proponent.”
v. EY’s NPV notes “The Project is expected to generate modest incremental indirect costs
on the NSW community of $0.11 million, through greenhouse gas emissions.”
41. Thus, excluding relevant omissions by CE and EY, and new information about mine losses, Professor Bennett estimated the NPV of the mine changed to $242.2m, down from $247.2m as estimated in his supplemental and original reports. Overall this is about 2% lower. In addition to uncertainty around key discounts and one-third of benefits ($81.3 million NPV), it also excludes hundreds of millions in missing externalities presumably because the proponents assume they do not impact NSW and because of the low carbon prices used.
42. Professor Bennett’s supplemental advice states: “The estimate of $242m is still regarded as an overestimate of the NPV of the mine because of the additional arguments made in my original report, as they relate to the omission or underestimation of a range of the indirect costs of the mine.”
43. The true level of abatement of negative externalities (relevant non-internalised indirect third-party costs) is discussed in more detail later. In ten cases it is effectively zero, one was less (or much less) than one per cent depending on the price of carbon, and in three there appears to be around 50 per cent abatement though the internalisation of costs. Nowhere is there any discussion of the optimal levels of pollution abatement, and the material impacts of externalised costs that cause both CE’s and EY’s CBAs to go negative (NPV < 0).
9
44. There is insufficient transparency on cumulative long-term impacts of multiple additional coal mines and coal gas projects. There are no insights regarding any Net Zero 2030 and 2050 impacts; or clarity related to the Climate Change Fund that was set up in 2007 under Part 6A of the Energy and Utilities Administration Act 1987. Around 80 per cent of NSW electricity comes from coal and NSW coal exports are about 3 (three) per cent of total global coal consumption. In 2014 NSW greenhouse gas emissions were 130.1 million tonnes of CO2e and NSW per capita emissions were 17.4 tonnes of CO2 equivalent. NSW is responsible for nearly a quarter of Australia’s emissions. Australia is one of 187 countries that have committed to keeping global temperature rises to well below 2°C under the Paris Agreement. Accordingly, it would appear that approval of 100,000,000 additional t CO2e in Tahmoor must result in an off-setting or larger reduction somewhere else at some time if the target is really ZERO.
45. It was also clear that some of the project’s mine productivity numbers were optimistic. Tahmoor is a low productivity, deep, gassy mine with limited upside capacity. Engineering and safety restrictions in operating conditions (panel width, height, resource mix, size, two earthquake fault lines, stability, subsidence, hours in the day, etc.) influence the outcomes.
46. As a consequence of experts’ reports PCS needed to build a similar hologram of the project in order to better understand what was hollow and what was not in CE and EY. PCS initial approximations in Table 3 below are effectively, including four low years, on average 12.367 per cent higher than the last 8 (eight) years of Tahmoor saleable coal actuals (that averaged 34,347 tonnes a week with no low years). PCS assumes higher productivity than Tahmoor has achieved since 2012. However, PCS does not anticipate a step change that consistently exceeds 55,700 tonnes a week in mine productivity. A low cost mine sub-optimal expansion is profitable enough as it generates almost $1 billion in net private benefits over 16 years.
47. From 2012 through 2019 the best year reported was 2016 which produced 2,208,695 tonnes of saleable coal and achieved 42,475 tonnes per week against a KPI of 55,700 tonnes a week. There are 11 years in Table 3 below that are expected to exceed that reported 42,475 tonnes per week 8 year best. Optimism bias in the production, mix and/or mine’s productivity was thus only partially scaled back by PCS. No expansion year achieves over 55,700 tonnes a week and the average mix is no longer over 94 per cent (94.1%) high-value hard coking coal; it’s now ‘only’ 90.6 per cent HCC. Additional actuals may support PCS view.
48. In comparison CE has 6 years exceeding the 55,700 tonne KPI that has not yet been realised from 2012 to 2019 inclusive. It would take a sustained step change to exceed the 55,700 KPI for 6 years. There seems to be no incentive to push that hard. At around $111.11 a tonne average in production cost, overall the mine appears quite profitable. Business-as-usual is OK; higher productivity toward the KPI is profitable enough (with an approximated net income of $1,581,710,973 and a private NPV of $949,584,221) based on initial PCS pricing, exchange rate, mine productivity, cost and net royalty payment assumptions. Under Scenario 100,000,000 the private NPV becomes $953,714,704 primarily due to marginally higher TC prices. Bottom line is the mine appears quite profitable, and the reported loss is unexplained or temporary.

10
Table 3 - Possible Production and Productivity at the Tahmoor Coal Mine Expansion Project
7.1 Tahmoor Coal Mine Losses
49. In 2020, Simec meeting minutes for September 2020, notes in paragraph 8.1 that Tahmoor Coal is running at a loss, quote:
(a) “Coking Coal price continues to be challenged by Covid-19 related global effects.
(b) Tahmoor Coal is running at a loss.
(c) A plan is being put in place to ensure recovery from this.”
50. Previously in July 2018 the Tahmoor South Project Newsletter stated:
(a) “GFG Alliance’s SIMEC Mining division acquired Glencore’s high-quality Tahmoor metallurgical coking coal mine in New South Wales on 20 April 2018.
(b) Glencore announced in June 2016 that the Tahmoor Coal Mine would close by 2019 because of continued low coal prices.”
51. The current China Australia coal dispute has not been adequately resolved and Australian metallurgical coal/hard coking coal prices and exports have been impacted in various ways. It is not yet clear in 2021 what the real impacts are on the Tahmoor Coal Mine, and associated businesses, in part because of interests in green hydrogen and zero-carbon steel.
(a) In June 2020 GFG Alliance head Sanjeev Gupta announced a $1 billion-plus refurbishment plan for the Whyalla Steelworks related to powering the plant with green hydrogen and producing green steel.
(b) It is reportedly hoped that using that hydrogen in place of metallurgical coal in the steelmaking process will result in Whyalla being the largest producer of carbon-neutral steel by 2030.
Year Hard Coking
Product Coal
Thermal Product
CoalSaleable Coal
55,700 tonnes
per week
Residual
Productivity
1 175,404 13,980 189,384 3,642 52,058
2 607,995 49,369 657,364 12,642 43,058
3 1,512,280 124,755 1,637,035 31,481 24,219
4 2,048,664 182,353 2,231,017 42,904 12,796
5 2,100,037 254,913 2,354,950 45,288 10,412
6 2,197,485 289,720 2,487,205 47,831 7,869
7 2,261,346 232,853 2,494,199 47,965 7,735
8 2,482,901 240,215 2,723,115 52,368 3,332
9 2,252,677 242,262 2,494,939 47,980 7,720
10 2,055,168 221,641 2,276,808 43,785 11,915
11 2,469,317 221,281 2,690,598 51,742 3,958
12 2,143,623 259,422 2,403,045 46,212 9,488
13 2,306,868 229,037 2,535,905 48,767 6,933
14 2,302,328 226,225 2,528,553 48,626 7,074
15 1,524,344 144,495 1,668,839 32,093 23,607
16 668,718 69,400 738,118 14,195 41,505
PCS 29,109,151 3,001,922 32,111,073 38,595

11
(c) In late January 2021 it was reported in the Sydney Morning Herald that Fortescue Metals Group chairman Andrew “Twiggy” Forrest said the time is right for Australia to develop a green steel-making industry, harnessing the country’s abundant iron ore resources and using zero-emissions energy technology to substitute coal.
52. The CE and EY coal price assumptions, the China/Australia coal trade situation, reference price discounts, and the costs of production are relevant. In the short term the mine will have significant expansion costs. In the long term it can capture the potential benefits of exchange rate, coal price and trade normalisation, and diversification of sales into India, Japan, Taiwan, and South Korea (some of whom appear to be arbitrage selling their own coal into China for a premium and buying Australian coal to use at a discount).
53. CE infer that the company is highly profitable, pays millions in taxes, and is not transferring benefits to its transport, steel, overhead or offshore operations. CE did not report interrogation of royalty calculations, deductions, company tax payments, tax losses, or other sensitive or commercial in confidence data. Reverse engineering suggests CE’s average reference price discount was about 7 per cent to around 93 per cent of the reference price.
54. Similarly EY (a tax expert) report on page 16 and estimate that the company is highly profitable and contributes $81.3 million to NSW via company taxes at a 30 per cent rate, as follows:
(a) “Consistent with the Guidelines, the company tax payments made to the Australian Government are levied on the profits generated under the Project. A company tax rate of 30 per cent is used to estimate the tax payments made to the Australian Government under the assumption that all the profit generated by the mine is subject to company tax in Australia (for example, ignoring financing costs).
(b) Consistent with the Guidelines, company tax attributable to NSW is based on the State’s share of the national population (32 per cent) as specified under the Guidelines.
(c) As summarised in Table 6 it is estimated the Project will generate $718.5 million in taxable profit in NPV terms over the period 2020 to 2035 (this is an estimate of the accounting profit from which company taxes are calculated).
(d) At a company tax rate of 30 per cent, the company tax estimate is $253.9 million in NPV terms, of which $81.3 million is attributable to NSW.
(e) Like other coal mining companies, the proponent can minimise its tax payments within the rules of the tax system. The $81.3 million NPV is uncertain. Actual tax returns (and royalty payments) are needed.
(f) Elsewhere EY (page 14) state “Over the life of the Project, Tahmoor Coal advises that both the hard coking coal and thermal coal will sell for 90% of the reference price.”
55. Professor Bennett (March 2020, p.2) states “With lower gross revenues and increased costs (resulting from increases in capital and operating costs) the present value of the producer surplus falls from $609.6m to $324.3m between the original and amended projects. While that is irrelevant, directly, to the overall CBA in terms of profits to the mine’s owner (as a foreign owned operation, no benefit accrues to the people of NSW from profit), it is relevant in terms of reduced company tax. This component falls from $98.3m to $81.3m (in present value terms).”
56. NSW Treasury (March 2017, p. 62) Transfer payments: “Transfer payments are financial transfers between groups that do not involve the use of economic resources. These payments should be excluded from a CBA because they have no impact on net benefits of the program, as the benefits

12
to one group are offset by costs to other groups. If the analysis, however, aims to show distributional impacts on various groups affected by the proposal, this could be included in the analysis and appropriately qualified so as to avoid double-counting.”
57. Accordingly, if the company is not profitable, carries forward tax losses from 2020, has expansion costs that exceed immediate revenues, engages in reference price discounting, or legal forms of transfer pricing to shift money or profits to Whyalla in SA or other business lines, then one can reduce the relevant NPV by up to $93.3m under CE assumptions or by $81.3 million under EY assumptions. Profits may be legally shifted, overseas finance costs may have variable interest and exchange rates, and losses may be recorded in NSW.
58. It is one hollow part of the CE and EY holograms. It is excluded by PCS because it is a highly uncertain transfer and ‘not genuinely an additional’ NPV benefit to NSW. There are 5 (five) years of materially low production in PCS’s Table 3 and 3 years (three) are early when they have a much greater NPV impact. If costs of production are materially higher in those low years, as a PSA EVA would assume, then the private tax advantage may make EY’s 30 % tax rate even more uncertain and optimistic.
59. Further this EY $81.3 million amended NPV must in reality be viewed as a transfer between groups, must be excluded to avoid optimism bias, and to comply with NSW Treasury 2017 guidance and with Planning and Infrastructure 2014 guidance. In other words, the $81.3 million is best considered zero, or potentially negative if reflecting current losses and less if the future tax rate is not 30 per cent. Bottom line the $81.3 million was highly uncertain, with no identified EVA probability, nor assurances, and must be excluded on technical grounds because it is also a transfer.
60. Interestingly, the CE and EY company taxes (e.g., EY EIS page 17 footnote 12 “Based on a 32 per cent population share”) and royalties imply the company is highly profitable. They assume sustainable coal prices and a modest discount off the reference prices. EY assumes a high mix of the more valuable hard coal (94%) and less of cheaper thermal coal (6%). But both CE and EY assume low abatement costs and many zero third-party costs. They both identify and also infer unreasonably low carbon prices and/or NSW GHG or Net Zero impacts.
61. There is further uncertainty around question of GST. Company tax is explicitly included by CE and EY, but GST is unclear. On the one hand, GST is an indirect tax that is a transfer and not part of the real cost of production. On the other, GST is paid to the Commonwealth government and NSW indirectly receives a variable percentage of 27.9 per cent in 2019-20 (up from 27.4 per cent in 2018-19). One obvious solution is that variable transfer payments such as taxes or GST be clearly presented by CE and EY using both WITH and WITHOUT GST, as would normally be the case in EVA and sensitivity testing. In aggregate GST is material, especially if CE or EY consider that Tahmoor pay a modest percentage of that total.
62. “In 2018-19, the financial year before the coronavirus outbreak, the GST raised $66.4 billion. But the amount collected last financial year, which was affected by bushfires and COVID-19 lockdowns, is expected to slump to about $60.5 billion. That will be the biggest annual fall in GST revenue since the tax was introduced in 2000, eclipsing the decline of about $2 billion in 2008-09 during the global financial crisis. In 2018-19 the GST contributed about 22 per cent of NSW budget revenue, which equates to the combined value of the two biggest state taxes – transfer duty and payroll tax. An economic and fiscal update in July slashed the forecast size of the national GST pool by $7.6 billion this financial year, which translates to a revenue loss of about $2.3 billion for

13
NSW. However, some economists believe the federal budget will reveal an even bigger GST decline for 2020-21.”2
63. It is not clear what assumptions CE and EY used around GST, there is no With GST and Without GST; there is no transparency despite NSW being a beneficiary of GST and quite interested in the subject.
64. In the case of this specific mine, actuals are needed to know how much GST was actually paid by Tahmoor to the Commonwealth or not over the past decade, and if that is genuinely additional, or not, compared to what property developments and other businesses generated and potentially transferred. Double counting and legal tax-minimisation strategies are uncertainties that plague taxes and transfers. Without actuals, they should be removed from any considerations.
65. Think about this clearly; IPC planning approval would create $1,588,615,100 for the proponent “out-of-thin-air” so to speak under Scenario 100,000,000 t CO2e. For a private billion in NPV or so you must think the proponent could hire PCS, HR, and DPIE. Clearly, there is no substitute for a decade or more of actuals to present a compelling argument; aka here are my actual tax returns, my GST calculations, my royalty payments, my payrolls and numbers of seasonal and full-time workers before, during and after COVID. Such evidence is significantly more credible than CGE LEA models that have been politely called “zombie economics”—perhaps because those long discredited sub-optimal models can raise projects from the grave — post 1986, 2017, 2020, the GFC, Holden, and COVID. Actuals are worth (black) gold, so to speak. They are worth far more than CE’s EIA and EY’s EIA which are too uncertain, skewed, and contain too much fluff, omissions and missing GHG emissions.
66. To muddy the down-stream water further another form of pricing includes taxes and penalties for emissions and transgressions. While taxes and financial penalties are transfer payments that are not generally included in a CBA, they can be a useful proxy of negative environmental impacts if they accurately reflect the timing and levels of externalised detrimental events and costs of collection. CE and EY do not make any penalties paid or not clear.
67. Only a decade or more of actual royalty, company taxes, GST, discounts, refunds, penalties and the like can be determinative. The CGE LEA is not. Even models in the USA that failed to predict actuals such as 2021 job growth that dropped dramatically in 2020 and have only recovered to 2016 levels have been improved, as they were after the dot-com bust, and US 9/11 events that accelerated slow-downs. The CE EIA and EY EIA are simply too uncertain, not-fit-for-purpose, and optimistic on multiple fronts. There are no probability-weighted, unbiased, mean centred expected values presented, no R-squares, no rigour. There are no probabilities around CE’s and EY’s numbers (e.g., 100%, 50%, 10% or zero chance, when). There is no EVA.
68. Only royalties can be estimated (reverse engineered) with any sort of confidence depending on the assumptions, timings, discounts, prices, mixes and production levels. The rest is too uncertain, fluff that must be binned.
7.2 Multiple Entangled Risks That Are Minimised
69. What is clear is that there are multiple entangled risks including coal and carbon prices, coal reference price discounts, exchange rates, production volumes, qualities, delays/accidents, mine productivity issues, log-normal costs, missing contingencies, late profits, short-term tax losses, company tax rates, royalty discounts, transfers, externalised greenhouse gas emissions, groundwater, uneven subsidence, biodiversity, noise, transport, safety, COVID, NET ZERO trade-
2 Sydney Morning Herald article https://www.smh.com.au/national/nsw/nsw-braces-for-historic-hit-to-gst-revenue-20201005-p5627w.html.

14
offs, penalties, remediation, and opportunity cost elements that are minimised. These entangled risks must be better addressed by the proponent.
70. Regardless of the causes of minimisation and space-time-systems economics quantum entanglement, the project must be refused based on current law, and accepted best practice. For example, Boardman et al. state (2018) EVA is the way to deal with an uncertain range of costs or benefits and when the distribution of costs is skewed, the expected cost exceeds the best (most likely) estimate, and net benefits are even less depending on the relevant probability distributions. PCS © papers dating back to 1978 detail PSA and similar EVA solutions. Problem Shifting Analysis (see PCS © 2013 pp. 2-8) is an EVA model.
71. The high levels of entangled uncertainty, seen in the decision of Preston CJ in Gloucester Resources Limited v Minister for Planning [2019] NSWLEC 7, and along with transparency issues, transfers, lack of actual data, with/without/next best comparisons, adjustments for optimism bias etc. noted in NSW Government Guide to Cost-Benefit Analysis (TPP17-03), supports PCS view that transfers and optimism bias both be excluded from CBAs NPV’s.
72. For example, the NSW Government Guide to Cost-Benefit Analysis (TPP17-03) states: “Transfer payments are financial transfers between groups that do not involve the use of economic resources. These payments should be excluded from a CBA because they have no impact on net benefits of the program, as the benefits to one group are offset by costs to other groups.”3
73. Further the estimates presented in CE’s EIA and EY’s EIA are plagued by optimism bias, the lack robust with/without/next best alternative comparisons, are not ‘genuinely additional’ and so must be excluded. There are accepted solutions for systemic optimism bias.
Scope 1, 2, 3 Total Greenhouse Emissions
Courtesy ERM Figure 1 below shows scope 1, 2 and 3 Greenhouse emissions are summarised in ERM’s
figure 3 which is sourced from “The Greenhouse Gas Protocol” © World Resources Institute and World
Business Council for Sustainable Development (March 2004 page 26).
Figure 1 - Overview of Scope 1, 2 and 3 Emissions
74. In words; coal, coal gas, and the energy sector is the largest single source of emissions into air, water, soil, and related socio-economic-ecologic systems. Importantly emission sources can
3 section 7.5 Items that should be excluded from a CBA, page 62

15
include at different times, in different places, with different cumulative, irreversible (e.g., species extinction), or temporary direct impacts such activities as power generation, vehicles using unsealed roads, airborne aerosols, mining, and dusty rail cars transporting coal. Thus, multiple externalities and problem shifts may occur in many forms, places, at different times via different pathways. They impact a significant variety of natural and human systems and the entire global system.
75. The cumulative and far reaching impacts have long lasting legal and synergistic (1+2+3 = 10) impacts that defy mathematical economics (1+2+3 = 6.00). It is so profound it has been called “space-time-systems economics quantum entanglement” © 2020 (TXu 2-212-143). It is also relevant to the price of carbon, public NPV, CBA’s, and the legal profession. One © example is “Solutions to Problems like COVID-19 and Global Climate Change decades before they existed. Not a TYPO. Space-Time-Systems Economics Quantum Entanglement.” The bottom line is both the problem and solution can be identified and solved simultaneously sometimes years’ and decades’ in advance and to the satisfaction of Courts.
76. Table 4 below shows the indicators of scope 1, scope 2 and scope 3 greenhouse emissions and third party costs based on ERM, CE and EY reports. These are “genuinely additional” contributions to systems.
Table 4 - Indicators of scope 1, scope 2 and scope 3 greenhouse emissions and third party costs
77. In contrast to normal variable prices reflecting dynamic exchange rates, where the good or bad is produced or consumed in different periods and regions, and reflecting different discounting rates and time horizons, the cumulative damages caused by one tCO2e may be similar whether emitted this year or next year in one region or another because it has both stock and flow characteristics as described by the © 1977-1978 first Three Laws of Human Ecology.
Year Scope 1 Emissions
(t CO2-e)
Scope 2 Emissions
(t CO2-e)
Scope 3 Emissions
(t CO2-e)GHG
1 217,528 8,061 518,278 743,867
2 224,528 27,596 1,798,705 2,050,828
3 256,530 70,704 4,478,730 4,805,964
4 601,805 91,370 6,099,792 6,792,967
5 577,868 89,220 6,418,384 7,085,472
6 674,785 90,963 6,772,196 7,537,944
7 661,899 92,656 6,809,949 7,564,504
8 841,159 100,396 7,439,511 8,381,065
9 1,203,888 94,157 6,808,942 8,106,986
10 1,228,158 86,885 6,213,458 7,528,502
11 1,262,015 97,319 7,355,882 8,715,216
12 953,377 90,272 6,549,691 7,593,340
13 1,043,511 90,534 6,926,323 8,060,368
14 462,373 101,626 6,906,938 7,470,937
15 450,243 66,864 4,560,124 5,077,231
16 634,222 28,718 2,015,137 2,678,077
PCS 11,293,888 1,227,342 87,672,038 100,193,268

16
78. GHG today appear to obey these three original laws of human ecology:4
(a) “There is no such being as an independent individual, no such invention as an isolated technology, no such thing as a single resource, and no such place as an independent nation-state. Each is linked by flows of materials, money, energy and information and interacts with external phenomena, environments or other systems.”5
(b) “Humankind is an organised ecosystem of flows and stocks of transformed and reconstructed materials, money, energy and information. Organised specifically referred to social, economic, political, physical, biological, and ecological structures of systems.”6
(c) “One generation’s, community’s, or culture’s answers, solutions, or opportunities become other people’s problems. Four broad forms of problem shifts were originally documented. The norm and common element was that “we shift problems rather than solve them.”7
79. A virtual hypothetical price for coal mine emissions then can be conceptualised as a self-adjusting artificial $1.00 per tCO2-e that magically remains $1.00; “as if conceptually constant, cumulative and global.” It reaches from the mine, into coal transportation, residents’ homes, the fossil-fuel power plant, the finance company, investor or owner, business travel, out-sourced companies, the consumer of the power generated and other products, and all the rubbish dumps. It covers all scope 1, scope 2 and scope 3 emissions (see Figure 1 above).
80. Like the coal mine, GHG have invisible costs somewhere, sometime, some place, some way, and can be:
(a) Temporary (passing coal train dust causes a temporary breathing problem);
(b) Permanent (the coal is extracted from the ground and burned so there is less coal);
(c) Threshold (sea level rise, losses of prime NSW beachfront homes);
(d) Cumulative (increasingly severe and more frequent climatic events, co-related NSW bushfires, floods, droughts, coral bleaching, flying animal migrations); or even
(e) Irreversible (as in the case of extinctions of marine and plant species that cannot migrate nor adapt in-situ to global warming).
81. Like the invisible coal train dust that is neither created nor really destroyed, the coal and dust is transformed and transported along pathways. The material event (of coal mining) vanishes into energy and then vanishes into power, financial, and other socio-economic-ecologic systems. The coal material itself is gone (mined and burned); it thus vanishes into energy and money (debt and income) which further vanishes into lesser and greater systems. One way to trace and measure this magical debt and credit economic vanishing act and out-sourced activities is via Scope 1, Scope 2 and Scope 3 GHG emissions, private and public net present values.
4 These first three laws of human ecology are also found in the 1987 economics textbook “Systems Economics: Concepts, Models, and Multi-Disciplinary Perspectives,” the 1983 paper “Wholistic Analysis, Problem Shifting Analysis, and Systems Economics” and the 1978 paper “At the Frontier of Human Knowledge: Wholistic Analysis.” 5 1977-1978 First Law of Human Ecology ©1978 (TX 55-268), 1981 (TX 655-571), 1984 (TX 1-294-095), 2013 (TXU 1-889-926), 2020 (TXu 2-195-471) 6 1977-1978 Second Law of Human Ecology ©1978 (TX 55-268), 1981 (TX 655-571), 1984 (TX 1-294-095), 2013 (TXU 1-889-926), 2020 (TXu 2-195-471) 7 1977-1978 Third Law of Human Ecology ©1978 (TX 55-268), 1981 (TX 655-571), 1984 (TX 1-294-095), 2013 (TXU 1-889-926), 2020 (TXu 2-195-471), 2020 (TXu 2-212-143)

17
82. The standardised unit of measurement for GHG emissions is tonnes of carbon dioxide equivalent (tCO2e). That means warming impacts of GHGs other than carbon dioxide are converted to a carbon dioxide equivalent amount via global warming potential conversion factors and agreed global greenhouse measures. It means that scope 1, scope 2, and scope 3 tonnes of CO2e are cumulative and a problem that need solving. According to Bill Gates 51,000,000,000 is the number of tonnes of CO2e that we all are putting into the atmosphere every year and this number needs to be reduced to zero:8
BILL GATES: Fifty-one billion is the number of tonnes of CO2 equivalent that we're putting into the atmosphere every year and if we want to stop the temperature from rising, we have to reduce that all the way down to zero and that's going to be very hard because there's a lot of sources of emissions.
LEIGH SALES: Is zero emissions achievable?
BILL GATES: This will be the hardest thing humanity has ever done because the physical economy - cement, steel, transportation, agriculture - all of these sectors will have to make changes.
83. PCS virtual “as if conceptually constant, cumulative and global” hypothetical price for coal mine emissions conceptualised as a self-adjusting artificial $1.00 per tCO2-e that magically remains $1.00 is like some NSW State agencies assume. Like the Climate Change Fund or some users of the European Union Emissions Trading System (EU ETS) it can assume an increasing future carbon market price partially or fully offset by NPV discounting. The dis-benefit can be calculated in different ways using difference reference prices and exchange rates. There are various imperfections and market failures. It does not adequately reflect intergenerational, sea-level rise, bushfire, flood, insurance, litigation, and the increasing severity and frequency of entangled events to 2100 and beyond. Further it does not fully recognise the difficult climate challenges ahead, and that pollution abatement costs increase at an increasing rate.
84. For example, the only Scope 3 emissions presented for the Project relate to energy use to produce both thermal and coking coal. These Scope 3 emissions figures are thus an underestimate as emissions from out-sourcing activities and the shipping of saleable coal were not included; including to India and new export markets, and/or fuel consumption for many such ocean going vessels idled off the coast of China for months.
85. What is more interesting about Australia’s import and export CO2e figures is that since 1990 they are unevenly increasing, and are being ignored. This is summarised in Figure 2 below: Global emissions generated during production of Australia’s imports and exports, by quarter, June 1990 to June 2020. Ships, aircraft, Australia’s imports, exports, business trips, outsourcing, and even overseas educations can contribute to ‘omissions’ and emissions.
86. Further, some carbon prices (tCO2e) or certificates are based on units of energy (MWh) and are additionally imperfect. Scenario 100,000,000 for example is thus an entangled quantum that is a GHG under-estimate. The real price or dis-benefit of carbon is far more than $1.00. The $1.00 per tonne of CO2e is, however, a simplistic useful and powerful proxy that signals what the next $1.00 contributes. At only $3.00 per tonne this Project is technically a lemon; the public costs exceed the public benefits. Only the lemon tree grower really profits when the average reference price of coals exceed around $111.11 a tonne.
87. These GHG tCO2e measurements are all materially important given the Tahmoor coal has been mined, burned, vanished, and is not being replaced anytime soon. After the Tahmoor area is
8 © 7.30 report and https://www.abc.net.au/7.30/reaching-zero-emissions-will-be-hardest-thing/13161502

18
mined out many of the miners will move on; some to WA, some overseas, some to the SEQ coast or the eventual grave. What lasting public benefits will remain? Uneven subsidence, earthquake damage risk, a used rail line, 16 years of royalty payments, GHG emissions, net zero, and additional damage to NSW socio-economic-ecologic systems.
88. As accurately generalised and predicted by the first Three Laws of Human Ecology9 above, the empty long walls mined at Tahmoor have not really vanished, they may just be temporarily invisible unless you are underground looking for gas or lost water.
89. There is “genuinely additional” gas and other GHG emissions to be found above that Tahmoor (expansion) ground now and for many decades into the future. PCS estimate that the genuinely additional Scope 1, Scope 2 and Scope 3 are cumulatively more than 100,000,000 CO2-e tonnes. PCS approximations are itemised by year and Scope in Table 4 above and Table 5 below. They are based on ERM’s, CE’s and EY’s work and expert reports. Like goods, these bad items have a monetary value, and the future price or dis-benefit of carbon is a non-trivial question.
90. Table 5 below shows Scenario 100,000,000, where the tonnes of CO2e are calculated at a virtual $1.00 per tonne.
Table 5 - Scenario 100,000,000
91. DPIE baseline emission projections and net zero emissions pathway modelling covered all major sectors of the NSW economy including electricity, on-site energy use, mining, transport, industry, waste, agriculture, and forestry. They are interesting. DPIE’s projection of future baseline emissions assumed no new emission abatement policies were implemented, with the reduction in carbon emissions resulting from proposed policies forecast against that baseline. The actions in
9 © 1977-1978
Year Scope 1 Emissions
(t CO2-e)
Scope 2 Emissions
(t CO2-e)
Scope 3 Emissions
(t CO2-e)GHG
1 217,108 8,045 517,279 742,432
2 224,095 27,542 1,795,235 2,046,872
3 256,035 70,568 4,470,091 4,796,694
4 600,645 91,194 6,088,026 6,779,864
5 576,754 89,048 6,406,003 7,071,805
6 673,483 90,788 6,759,133 7,523,403
7 660,622 92,478 6,796,813 7,549,912
8 839,536 100,202 7,425,160 8,364,899
9 1,201,565 93,976 6,795,807 8,091,348
10 1,225,789 86,718 6,201,472 7,513,980
11 1,259,581 97,131 7,341,693 8,698,405
12 951,538 90,098 6,537,057 7,578,693
13 1,041,498 90,359 6,912,963 8,044,820
14 461,481 101,430 6,893,615 7,456,526
15 449,375 66,735 4,551,327 5,067,438
16 632,998 28,662 2,011,250 2,672,911
PCS 11,272,102 1,224,975 87,502,923 100,000,000

19
that NSW plan were forecast based on neutral (best-estimate) assumptions to REDUCE annual NSW emissions by 35.8 mega-tonnes a year by 2030, with annual emissions reduced by 35% on initial 2005 levels. This is summarised in Table 6 below. DPIE have not yet responded to a recent email enquiry as to exactly what and what was not included in their model, so Table 6 is accepted at face value.
Table 6 - NSW (Appendix 1) Emissions Reductions Forecasts from 2019 to 2030 (Mt/year), compared to PCS Scenario 100,000,000 t CO2e Table 5, and PCS Table 4 initial assumptions approximation.
92. Accordingly, from the above annual reductions in NSW and global emissions, the Project proponents should transparently provide some analysis of:
(a) Their proposed total GHG emissions contributions in tCO2e (preferably an EVA);
(b) Their expected annual emissions profiles of this analysis (Scope 1 and 2 and 3);
(c) Estimates of the economic impact of GHG emission in NSW and including exports, imports, out-sourcing, business transfers overseas, as relevant (see Figures 1 and 2);
(d) With/Without/Next Best impact analysis on NSW and other third parties;
(e) How the proponents contributions impact others’ Net Zero 2030 and 2050 contributions—if one is increasing by 100,000,000 t CO2 e others’ must decrease;
(f) It is simply not reasonable nor credible to assume this coal mine expansion that contributes 100,000,000 tonnes of CO2e or more has no impacts, or less than $0.11 million in impacts on other producers’ of CO2 e in NSW, or a price of cents;
(g) NSW is REDUCING annual emissions by 35.8 mega-tonnes a year by 2030, with annual emissions reduced by 35% on initial 2005 levels (as seen in Table 6 App 1);
(h) The majority of NSW greenhouse gas emissions come from the extraction, processing and burning of fossil fuels;
(i) No Tahmoor coal mine expansion helps everyone else by more than 100,000,000 tonnes of CO2e in scope 1, scope 2 and scope 3 over the next 16 years;

20
(j) According to Bill Gates 51,000,000,000 is the number of tonnes of CO2e that we all are putting into the atmosphere every year and this needs to be reduced to zero; and
(k) Every tonne of CO2e reduction thus counts.
93. The Chief Justice of the NSW Land and Environment Court found in Gloucester Resources at [646]:
“I find Mr Brown’s approach to apportionment of the costs of GHG emissions to be unsound.”
94. At [513] Preston CJ also said:
“I find, therefore, that the consideration of the impacts of the Project on the environment and the public interest justify considering not only the Scope 1 and Scope 2 emissions but also the Scope 3 emissions of the Project.”
7.3 The Price of Scope 1, Scope 2 and Scope 3 emissions, Future Carbon Prices and PCS Recommended Price of Carbon to Use in this CBA
95. To DPIE’s credit, the April 2018 Technical Notes supporting the Guidelines for the Economic Assessment of Mining and Coal Seam Gas Proposals state (on page 48):
(a) “Even though there is uncertainty around the future mix of price and regulatory approaches to GHG abatement, price expectations from the European Union Emissions Trading System (EU ETS) currently provides one of the clearest indications of a market based carbon price linked to longer term emission targets.”
(b) “As a central estimate of a carbon price, the EU ETS carbon price potentially provides a benchmark to proponents for examining the implications of domestic carbon pricing or other abatement measures on the emissions output of mining and CSG operations.”
96. “As if constant, cumulative and global” and based on the first Three Laws of Human Ecology, PCS Table 4 and 5 above crudely estimate that in 16 years linked to the Tahmoor coal mine expansion there is potentially $100,000,000 of emissions or more for every artificial $1.00 increase in the price of carbon in NSW.
97. PCS believes the GHG are shifted off-site, they are no longer in empty long-walls deep underground, nor in an abandoned mining area in year 25 or in year 100, and that problems are shifted as accurately described in the three 1977-1978 Laws of Human Ecology.
98. By way of direct comparison is ERM Australia Pacific Pty Ltd (ERM, 23 November 2018, page 27) report in their Part 5 ‘SUMMARY OF GHG EMISSIONS’ summary of the annual GHG emissions in Table 5.1 estimated CO2-e (tonnes) – for all scopes. ERM’s table 5.1 infers by cumulative addition $119,485,140 of Scope 1, 2 and 3 emissions for every virtual or artificial $1.00 increase in the price of carbon. The only Scope 3 emissions presented by ERM for the Project relate to energy use to produce both thermal and coking coal. They exclude shipping, etc. They are therefore conservative estimates. ERM’s well documented numbers are marginally higher than PCS’s 100,000,000 tCO2e which PCS considers a useful scenario.
99. The real price of carbon is thus materially relevant, and so are the ways it is calculated and the reference carbon market price source and the exchange rates. It further matters if the carbon prices increases over time or not, in part because of present value (PV) discounting at a 7 per cent rate. The amount of approximated CO2-e (tonnes) appears less important than the inferred or market price of carbon. If an optimal carbon price is multiplied by 100,000,000 or some marginally better cumulative number for the Tahmoor project and out-sourced activities, the NPV becomes

21
negative (NPV < 0). If it is multiplied by a realistic EU ETS carbon reference price, US carbon price index, or EU future market price it becomes significantly negative.
100. In round numbers, the 16 year cumulative 100,000,000 CO2e tonnes of Scope 1, Scope 2 and Scope 3 greenhouse emissions are “genuinely additional” contributions to the above-ground biosphere housing socio-economic-ecologic systems. As presented by ERM for the Project they only relate to energy use to produce both thermal and coking coal. PCS 100,000,000 number is rounded down to allow for CE’s $0.102 million and EY’s $0.11 million. EY EIS page 21 states: “The Project is expected to generate modest incremental indirect costs on the NSW community of $0.11 million, through greenhouse gas emissions.”
101. By way of stark contrast to PCS and ERM and Figure 1; CE state (page 27) state “On a global basis, the total estimated GHG cost is $94.7 million in NPV terms (13,468,487 scope 1 + 1,463,663 scope 2, with no mention of any scope 3, and a total of 14,932,150 tCO2-e in CE’s Table 14 Greenhouse gas emissions).”
102. Incredulously CE’s CBA (page 25) only “includes $0.1 million ($101,893) of incremental costs that are not internalised by the proponent.” There is NO mention by CE of ERM’s aggregate $119 million in third party GHG costs per hypothetical $1.00 increase in carbon prices. There is no mention of the almost billion ($965,993,259) in NPV terms at a $13.52 tCO2-e CE observed carbon market price, nor the virtual $1,615,439,093 (= $13.52 * 119,485,140 tCO2-e). It is hard to miss such large numbers. It takes ‘bravery’ to fail to add 13,468,487 (scope 1) +1,463,663 (scope 2) +104,552,990 (scope 3) to equal 119,485,140 tCO2-e.
103. Preston CJ in the matter of Gloucester Resources refers to the Technical Note Supporting the Guidelines for the Economic Assessment of Mining and Coal Seam Gas Proposals (April 2018) (Technical Notes):
(a) At [644] Mr Brown of Cadence Economics adopted the approach in the Technical Notes, and the Court notes that they talk about scope 1 and 2, but not scope 3 GHGs.
(b) At [646] of Gloucester Resources, the Court said:
“I find Mr Brown’s approach to apportionment of the costs of GHG emissions to be unsound. Mr Brown cites no authority in support…
I find, therefore, that the consideration of the impacts of the Project on the environment and the public interest justify considering not only the Scope 1 and Scope 2 emissions but also the Scope 3 emissions of the Project.”
104. In some analyses like CE’s CBA and EY’s CBA it’s almost like all winds stop at the NSW border, the seas do not ever rise above a high-tide property mark, like only a car that runs over you hurts and multiple car accidents/deaths have no impact on future insurance premiums. But with PSA and energy CBAs, for an energy project or policy that transmits impacts across borders guidance is include all costs and benefits and all regions and sub-regions in terms of NPV impacts. Then problem shifts are clear. Care is taken not to double count and not to miss material costs, benefits and non-market goods or bads. In the case where values or pathways cannot be determined detrimental or beneficial problem shifts are described and foot-noted for transparency. Millions or billions are simply not omitted for any reason.
105. Further CE’s “constant, cumulative and global” inferred price is simply implausible because ERM’s 119,485,140 cumulative underestimated tCO2e affects this coal mines NPV by only $0.102 million ($101,892) of incremental costs. Even using CE’s adjusted sub-optimal $13.34 real price the NPV only drops to $953,132,402 and the gross $1,593,931,768 (=$13.34 * 119,485,140 tCO2-e).There

22
are almost a billion in third-party costs inferred and ignored by CE. Their hologram is indeed hollow and not holistic. This is a significant omission.
106. EY are not much better the CE. “The Project is expected to generate modest incremental indirect costs on the NSW community of $0.11 million, through greenhouse gas emissions.” Greenhouse gas emissions –The EIA Appendix A (page 32) addresses the issue of Scope 1 and 2 greenhouse gas emissions. EY does note that the project would generate almost 13.4 million tonnes of Scope 1 and 2 greenhouse gases during its lifetime. Based on an EY average carbon price of $14.17tCO2-e using auction data from the Clean Energy Regulator it estimates that on a global scale, the cost of these scope 1 and 2 emissions would amount to $102.3 million in NPV terms. Again no mention of the EU ETS, or even US carbon index prices, or traded future markets.
107. There is no mention of Scope 3 emissions by EY or CE; it is however clearly quantified by ERM their source for their scope 1 and 2 estimates. There is no transparency for the millions or billions in total externalised third party GHG costs. At least the EY tCO2-e price of carbon is marginally less biased. However, there is no attempt by EY to use the recommended EU ETS that provides one of the clearest indications of a market based carbon price linked to longer term emission targets. So while the private gains are large and internalised by SIMEC; the public benefits (NSW royalties) are comparatively small, and all of the ten missing externalised third-party costs huge and clearly minimised. Omissions include EU ETS prices, material quantities, relevant GHG scopes, NSW Net Zero 2050, and more frequent bushfires, worse floods, and other gone-with-the-wind impacts.
108. Both CE’s EIA and EY’s EIA “constant, cumulative and global” inferred price is simply too implausible because ERM’s stated 119,485,140 or even PCS’s 100,000,000 cumulative tCO2e affects this coal mines NPV by only $0.102 million in CE’s incremental costs and $0.11million in EY’s analyses. The math 101,892/119,485,140 = 0.0008528; not even 1 (one) per cent of ERM’s or the PCS lower GHG total.
109. Even BIS Oxford Economics think the price of carbon should be higher and variable. BIS page 17 notes “Another issue relates to the price point used and its application across the lifetime of the project. (EY’s) price of $14.17t CO2-e in question appears to relate to the auction results of July 2019.This price is then applied across the lifetime of the project from 2020 to 2035. However, such prices could clearly move around in the long run. More example, there is a risk that as Australia seeks to meet the more challenging stipulations of the Paris Agreement the cost of abatement could rise. It is worth noting that the price at the March 2020 auction had risen to $16.14t CO2-e – an increase of 14%”.
110. The four prices used in reports are $13.34 and $13.52 by CE, $14.17 by EY, and $16.14 t CO2-e by BIS Oxford Economics. The next auction is auction 12 scheduled for 12-13 April 2021. It will be the first with the US Biden-Harris administration in power. PCS guess it may be $20.00 t CO2-e or so. The point is that constant prices assumed in the EIS CBA’s are too optimistic. BIS Oxford Economics criticism has still not been adequately addressed by the proponents.
111. Worse, please recall “as a central estimate of a carbon price, the EU ETS carbon price potentially provides a benchmark to proponents for examining the implications of domestic carbon pricing or other abatement measures on the emissions output of mining and CSG operations.” Like for TC and HCC coal prices, this carbon price is a reference price.
112. And, the 2019 EU ETS market averaged nearly 25 Euro for the year but the forward prices were around 26 Euro in 2020 and modestly increasing to 29 Euro in 2024, a rough annual increase of around 2.5 per cent. Clearly future EU carbon prices inferred modest growth in 2019. The proponents however opted for no increases over the 16 year horizon. There is a material difference between the gradually increasing 25, 26…29 Euros, (i.e., then AUD $40.00 or so), and

23
EY’s constant price of $14.17t CO2-e. Even $20.00 t CO2-e, EU ETS and related futures markets would have been a better carbon reference price.
113. Since 2019, both the EU and USA prices of carbon have increased further. On the 12 February 2021, the EU ETS inferred a price of AUD $62.74 (from 40.22 EURO*1.56). On the 12 February 2021, even the IHS weighted index price is USD $27.7164*1.3 or AUD $36.0313.
114. One reason to suspect there may be increasing dis-benefits or higher carbon prices (and global emissions pressure) is any correlations with Australia’s global emissions linked to shipping, exports and/or imports. Economies, trade and shipping have been generally growing slowly since the 1990 recession, although unevenly. This is illustrated in Figure 2 below. Another is Net Zero 2030 and 2050 and the 13 per cent forecast annual reduction in emissions from 2019 to 2030. That plan outlined NSW’s long-term objectives aims to achieve Net Zero emissions by 2050 and to make the State more resilient to a changing climate.
115. This paper was reviewed by Peter Brain, Executive Director of National Institute of Economic and Industry Research (NIEIR). NIEIR is the premier energy demand forecaster in Australia. NIEIR’s history of demand forecasting spans all of its 30 year history. In the 1980s and early 1990s, NIEIR prepared economic and energy projections for former consolidated state energy utilities such as Electricity Commission of NSW, State Electricity Commission of Victoria, Queensland Electricity Commission, Electricity Trust of South Australia, and State Electricity Commission of Western Australia. NIEIR now has a client base that includes most Australian network gas and electricity businesses. Their clients also include organisations responsible for network/generation planning and energy markets management. NIEIR regularly prepares energy demand forecasts for businesses and governmental organisations in the energy supply industry across Australia. The Institute prepares industry-based forecasts and employs rigorous models of energy sales, demand and for policy advice.
116. Figure 2 below shows the global emissions generated during production of Australia’s imports and exports, by quarter, June 1990 to June 2020. These are not decreasing, they are increasing although unevenly.
Figure 2 - Global emissions generated during production of Australia’s imports and exports, by quarter, June 1990 to June 2020.

24
117. PCS was asked in September 2020 to review a proposed uniform carbon price recommendation for CBA’s in NSW, among other CBA matters. The carbon price issue is a bit like the old re-switching issue that plagued discount rates until 7 per cent was agreed upon so that one CBA could be compared to another. Some agencies’ and proponents’ have higher and lower prices for carbon so their NPV’s look superior. This is ‘easily’ fixed by using a recommended price, such as $40.00 per tCO2e or some better estimate from the EU ETS or even the USA IHS weighted index.
118. Compared to CE, EY and BIS Oxford Economics, a better “as if constant, cumulative and global” price would have been $40.00 per tCO2e. There are a couple of other considerations:
(a) Firstly is that the market and futures prices have been raising;
(b) Secondly, there are multiple ways, sources and methodologies;
(c) Thirdly, when discounted at 7 per cent the public net cost gradually falls from $40.00 to $14.50 per tonne in 16 years;
(d) Fourthly, it is quite difficult to get two economists to agree, and it is even harder to get 40 economists to agree;
(e) Fifthly, the EU ETS was clearly and has been consistently recommended as preferred. It made and makes sense. It solves problems, including gaming of carbon prices;
(f) Sixthly, PCS did not object to the $40.00 per tonne recommendation in September 2020; nor suggest a marginally better estimate than $40.00 based on cumulative, threshold, irreversible impacts, the first Three Laws of Human Ecology, and knowledge of Systems Economics;
(g) Finally, if say 100,000,000 tCO2e only and all incurred in year 16, when the discounted price is $14.50, then the NPV impact is $1.45 billion. If say the 100,000,000 is spread evenly over 16 years at 6,250,000 a year, then the NPV is $1.75 billion. If “as if constant, cumulative and global” and hypothetically re-adjusting, it is conceptually $4 billion.
119. Accordingly, based on ERM et al., the public NPV impact is a cost of GHG is $2,396,466,554. This cost far exceeds the $144,100,821 public benefit from royalties. This negative $2 billion plus NPV estimate is an under-estimate for multiple reasons mentioned above. This under-estimate is summarised in Table 7 below.
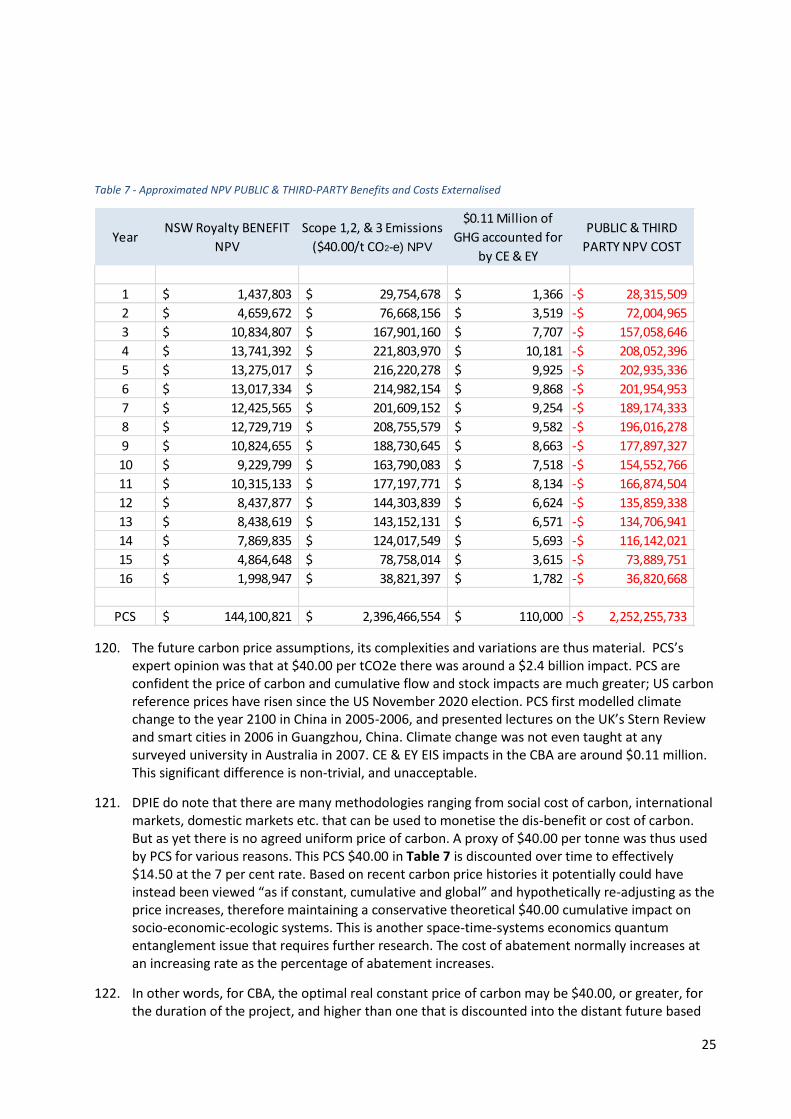
25
Table 7 - Approximated NPV PUBLIC & THIRD-PARTY Benefits and Costs Externalised
120. The future carbon price assumptions, its complexities and variations are thus material. PCS’s expert opinion was that at $40.00 per tCO2e there was around a $2.4 billion impact. PCS are confident the price of carbon and cumulative flow and stock impacts are much greater; US carbon reference prices have risen since the US November 2020 election. PCS first modelled climate change to the year 2100 in China in 2005-2006, and presented lectures on the UK’s Stern Review and smart cities in 2006 in Guangzhou, China. Climate change was not even taught at any surveyed university in Australia in 2007. CE & EY EIS impacts in the CBA are around $0.11 million. This significant difference is non-trivial, and unacceptable.
121. DPIE do note that there are many methodologies ranging from social cost of carbon, international markets, domestic markets etc. that can be used to monetise the dis-benefit or cost of carbon. But as yet there is no agreed uniform price of carbon. A proxy of $40.00 per tonne was thus used by PCS for various reasons. This PCS $40.00 in Table 7 is discounted over time to effectively $14.50 at the 7 per cent rate. Based on recent carbon price histories it potentially could have instead been viewed “as if constant, cumulative and global” and hypothetically re-adjusting as the price increases, therefore maintaining a conservative theoretical $40.00 cumulative impact on socio-economic-ecologic systems. This is another space-time-systems economics quantum entanglement issue that requires further research. The cost of abatement normally increases at an increasing rate as the percentage of abatement increases.
122. In other words, for CBA, the optimal real constant price of carbon may be $40.00, or greater, for the duration of the project, and higher than one that is discounted into the distant future based
Year NSW Royalty BENEFIT
NPV
Scope 1,2, & 3 Emissions
($40.00/t CO2-e) NPV
$0.11 Million of
GHG accounted for
by CE & EY
PUBLIC & THIRD
PARTY NPV COST
1 1,437,803$ 29,754,678$ 1,366$ 28,315,509-$
2 4,659,672$ 76,668,156$ 3,519$ 72,004,965-$
3 10,834,807$ 167,901,160$ 7,707$ 157,058,646-$
4 13,741,392$ 221,803,970$ 10,181$ 208,052,396-$
5 13,275,017$ 216,220,278$ 9,925$ 202,935,336-$
6 13,017,334$ 214,982,154$ 9,868$ 201,954,953-$
7 12,425,565$ 201,609,152$ 9,254$ 189,174,333-$
8 12,729,719$ 208,755,579$ 9,582$ 196,016,278-$
9 10,824,655$ 188,730,645$ 8,663$ 177,897,327-$
10 9,229,799$ 163,790,083$ 7,518$ 154,552,766-$
11 10,315,133$ 177,197,771$ 8,134$ 166,874,504-$
12 8,437,877$ 144,303,839$ 6,624$ 135,859,338-$
13 8,438,619$ 143,152,131$ 6,571$ 134,706,941-$
14 7,869,835$ 124,017,549$ 5,693$ 116,142,021-$
15 4,864,648$ 78,758,014$ 3,615$ 73,889,751-$
16 1,998,947$ 38,821,397$ 1,782$ 36,820,668-$
PCS 144,100,821$ 2,396,466,554$ 110,000$ 2,252,255,733-$
26
on carbon reference, market and index prices. No one is suggesting $1.00 per tCO2e that generates only $100 million in third party impacts, nor the trivial $0.11 million in NPV impacts as suggested by CE and EY CBA.
123. PCS are happy to write a scholarly paper on carbon pricing for CBA’s or PSA EVA’s, if necessary. There is not quite enough space, time or budget to do it here. $40.00 per tonne is considered a useful although a simple under-estimate like PCS Scenario 100,000,000 that does not need further analysis because the public costs far exceed both the public and private net benefits.
124. It is thus sufficient to conclude, the inferred price of carbon is clearly not $1.00 or less. The optimal price is materially higher per tCO2e. The inferred NPV = 0 price of carbon assuming the conservative 100,000,000 tonne scenario is only $ 2.41. Any higher price of carbon drives the NPV to less than zero.
7.4 Current Law
125. For as long as PCS can remember policy, program, investment and proposed analyses no matter if zero impact, how small, or large and complex needed to be compared to current law. Current law was and is the baseline in most countries in the world. Even regime change was compared to the current regime no matter how good or bad. In other words, current law is current law (standing), not some fiction. Some complex analyses took a few years, others months or days. PCS obtained legal counsel which informed their opinion that cumulatively including scope 1, scope 2 and scope 3 is current law, and if anything PCS Scenario 100,000,000 tCO2e is an underestimate. Shipping, trade and out-sourcing activities are sometimes missed despite their growth since 1990.
126. The earlier debate about any optimal carbon or market price guide aside, the important omission of all Scope 3 emissions by CE and EY alone defies the decision in Gloucester Resources.
127. It is not a fiction and it is of direct relevance because PCS crude estimates are 11,293,888 Scope 1 + 1,227,342 Scope 2 + 87,672,038 Scope 3 equals 100,193,268 tCO2e “as if constant, cumulative and global.” And this total is an under-estimate.
128. These approximations are based on ERM’s 2018 Greenhouse Gas Assessment, ERM’s more rigorous methodology, and CE’s and EY’s acceptance of ERM’s expert report. There may be material differences in the methodologies, but the numbers are of large order of magnitude greater for the Project than in the Gloucester Resources case. The law and logic should prevail, even though the numbers might be improved (and higher) given time, data and resources.
129. Notably Preston CJ said in Gloucester Resources at [429], [430], [486] – [487], [513] and [515]:
“429. The Air Quality and Health Risk Assessment for the amended EIS estimated the CO2-e (tonnes) for Scope 1, 2 and 3 emissions for the Project as being 1,566,685 (Scope 1 emissions), 241,891 (Scope 2 emissions), and 36,283,171 (Scope 3 emissions) (Table 18.1, p 2A-160). [PCS Note: This totals 38,091,747 times the price of carbon.]
430. The Scope 3 emissions figure is an underestimate, as emissions from the shipping of product coal were not included due to the uncertainties in emission estimates, including in future export destinations and limited data on emission factors and/or fuel consumption for ocean going vessels (Air Quality and Health Risk Assessment, p 2A-159).
486. The Rocky Hill Coal Project will result in GHG emissions. The Air Quality and Health Risk Assessment for the amended EIS estimated the Scope 1 and Scope 2 emissions to be about 1.8Mt CO2-e (vs. an estimated 12.5 Mt at Tahmoor) over the life of the mine and Scope 3 emissions to be at least 36Mt CO2-e (vs. 100.2 Mt at Tahmoor). The estimated scope 3 emissions are limited to the emissions from the combustion of product coal from the Project
27
by end users, such as steel mills and electricity power stations, as the emissions from shipping of product coal were not included. GHG emissions from the combustion of product coal by end users are downstream emissions.
487. Although GRL submitted that Scope 3 emissions should not be considered in determining GRL’s application for consent for the Rocky Hill Coal Project, I find they are relevant to be considered.
513. I find, therefore, that the consideration of the impacts of the Project on the environment and the public interest justify considering not only the Scope 1 and Scope 2 emissions but also the Scope 3 emissions of the Project.
515. The direct and indirect GHG emissions of the Rocky Hill Coal Project will contribute cumulatively to the global total GHG emissions. In aggregate, the Scope 1, 2 and 3 emissions over the life of the Project will be at least 37.8Mt (this typo excludes scope 2) CO2-e, a sizeable individual source of GHG emissions. It matters not that this aggregate of the Project’s GHG emissions may represent a small fraction of the global total of GHG emissions.”
130. Chief Justice Preston also said at [525]: “There is a causal link between the Project’s cumulative GHG emissions and climate change and its consequences. The Project’s cumulative GHG emissions will contribute to the global total of GHG concentrations in the atmosphere. The global total of GHG concentrations will affect the climate system and cause climate change impacts. The Project’s cumulative GHG emissions are therefore likely to contribute to the future changes to the climate system and the impacts of climate change. In this way, the Project is likely to have indirect impacts on the environment, including the climate system, the oceanic and terrestrial environment, and people.”
131. This omission and under-estimates by CE and EY must be grounds for refusal of the Project. The price of carbon and scope 1, 2 and 3 third party impacts is not cents; it is real dollars, $40.00 or more, and increasing. An NPV impact of $0.1 million is optimism bias. The inferred low price and scope 3 issues are non-trivial problems. The Australian coal ships idled off the coast of China for months only makes the numbers higher. It also affected CE’s and EY’s NPV sensitivity test results.
132. As BIS Oxford Economics note “the treatment of greenhouse gas emissions also deserves further scrutiny. As indicated below, these are assessed at only $0.1 million over the life of the project, although on a global basis the EIA estimates costs at $102.3 million (NPV Scope 1 and 2 only). The sensitivity test appears to be undertaken assuming a cost of $0.1 million –i.e. a 10% variation is not material. Absent from the testing is a scenario where greenhouse gas emissions are $102.3 million in NPV terms (and significantly more if Scope 3 are included) or indeed any allowance for this amount to rise if the cost of carbon rises into the future as discussed below. Inclusion of global costs and a higher price of carbon would make a material difference to the sensitivity tests.”
133. According to BIS Oxford Economics: “Another issue is growing opposition to the mining of coal in general and the export of coal in particular given global warming concerns. Though most of the TSCP’s output is coking coal and not thermal coal, this may have impacts on project viability but is not discussed here or elsewhere in the CBA.”10
134. So in addition BIS Oxford Economics state: “There may be some argument that cost blow outs could be larger than such quantums. Combined with the lack of clarity on whether contingencies have been allowed for, this may be an issue requiring further investigation. However, a related
10 BIS Oxford Economics Peer Review of Economic Impact Assessment Tahmoor Coal Project, April 2020, p, 15

28
issue is that, as modelled, inclusion of benefits to local suppliers would appear to more than compensate for higher operating costs. So ever higher operating costs might yield ever higher net benefits to NSW. Obviously there would be a point at which the project would not be financially sustainable but this counterintuitive issue should be noted when considering these tests.”11
135. Accordingly, it is unclear if the Tahmoor Coal Mine will close, for what combination of reasons/events, and if so when, or not. It is also not perfectly clear if approval for mine expansion were granted if the mine would be simply on-sold. It has apparently changed hands since 2003. These questions and risks must be better addressed by the proponent, especially given the pre-September 2020 losses, post-September 2020 coal prices, post- November 2020 unresolved China issues, the earlier 2016 Glencore mine closure statement when coal prices were low, and reports dating back to 2003. The variability of coal prices may impact cash flows, losses, liabilities and equity, as they have with State Budget royalties. There appears to be no reported explanation for the reported loss.
136. There is further hidden optimism bias in proponents’ reports, costs and assumptions. For example there is no proper explicit EIA accounting for systemic optimism bias. NSW Treasury (2017), the UK Green Book (2018), and multiple international studies define optimism bias and cures. In general it manifests itself hidden in overly optimistic benefits, under-estimating the timing and magnitude of capital and/or operating costs, and by ignoring log-normal cost distributions, entangled problem shifts, and other risks. Recommended practise follows:
(a) The Green Book 2020 (2018 pp. 89-91) notes that benefits should be reduced and costs increased because of systematic optimism bias problems.
(b) For example, the present value of costs should be increased by the appropriate optimism bias factor. So if costs are -£10 million and the optimism bias factor is 40%, this would lead to optimism bias adjusted costs of -£14 million (i.e. -£10 million*(1+0.4)).
(c) Also, if an appropriate optimism bias factor is available the present value of the benefits should also be adjusted (which would lead to a lower level of estimated benefits).
(d) Infrastructure Australia (IA) includes detailed technical notes, and there are best practice cost estimating guides too.
(e) Changing the timing, magnitude, duration and nature of recessions and booms, and their impacts on unbiased mean-centred expected values is another model practice.
137. One of the more interesting ones is that costs and revenues do not have nice bell-shaped distribution curves and this materially impacts the results. Costs have a log-normal curve with a long skewed and expensive tail. Revenues do not. Revenues most often fall short of expectations, as sometimes can be seen some in SIMEC reports. CBA quantities of saleable coal can be less than expected, the CBA qualities/mix of hard and thermal coal and remanets can vary materially, the CBA relevant prices, exchange rates, discounts, transport and China/trade issues are problematic. Even COVID may be a factor as reported by SIMEC.
138. With regard to opportunity costs, NSW Treasury CBA Guidelines (2017) state: “Committing resources to a particular project or program will preclude their use elsewhere. The value of the resources used is their ‘opportunity cost’. This is the value of those resources in their most
11 BIS Oxford Economics Peer Review of Economic Impact Assessment Tahmoor Coal Project, April 2020, p, 14

29
attractive alternative use. In general, market forces will generate a price for capital, labour or other inputs that reflect the opportunity cost of the resources.”12
139. While greenhouse gas emissions have been externalised and shifted via sea level rise, bushfire catastrophes, wildlife species loss, water and air pollution, flood insurances, winds, and global warming costs, the NSW Government also committed to reducing CO2 emissions by meeting Paris emission targets. In December 2015, 195 countries, including Australia, agreed on the United Nations Paris Agreement on climate change. In 2016, the NSW Government released its Climate Change Policy Framework with an objective to achieve net zero emissions by 2050. The NSW Department of Planning, Industry and Environment (2019) published a Net Zero Plan Stage 1: 2020–2030 to fast-track reduction of emissions over the next decade along with a goal of net zero emissions by 2050.
140. Approval of Tahmoor mine expansion must be refused based analysis summarised in Table 1 through to Table 8. That quick analysis does not even take into account the opportunity costs of the highest and best use of the land for high-end estates and people fleeing Melbourne, Sydney, USA and India due to COVID-19. Nor does it account for all the ten externalities born by third-parties, including signatories of the Paris Agreement.
141. Table 8 below infers that almost $1 billion in private benefits are created for SIMEC, more than $2 billion in public and third-party costs are externalised, and problems are just shifted.
142. Table 8 shows the approximated NPV PRIVATE Coal Mine Benefits Internalised by SIMEC. PCS notes that the actual costs, revenues and discounts were not available. It is now possible for some borrowers to borrow money at negative interest rates; some companies also have depreciation events, transfer arrangements, and unexpected costs per tonne in different years. This analysis assumes $111.11 average costs per tonne, excluding Finance and Royalty costs. The real numbers are unknown and probably vary.
Table 8 - approximated NPV PRIVATE Coal Mine Benefits Internalised by SIMEC
12 NSW Government Guide to Cost-Benefit Analysis (TPP17-03), p 32
Year Saleable HCC
NPVSaleable TC NPV
SALEABLE COAL
TOTAL NPV
COSTS Excl Finance
& Royalties
Net Royalties
NPV
NPV PRIVATE
BENEFIT
1 30,783,337$ 1,308,544$ 32,091,881$ 21,042,434$ 1,437,803$ 9,611,644$
2 99,724,689$ 4,318,741$ 104,043,430$ 68,262,900$ 4,659,672$ 31,120,858$
3 231,804,805$ 10,198,741$ 242,003,546$ 158,863,523$ 10,834,807$ 72,305,216$
4 293,492,906$ 13,932,840$ 307,425,746$ 202,351,241$ 13,741,392$ 91,333,113$
5 281,171,754$ 18,202,707$ 299,374,462$ 199,619,295$ 13,275,017$ 86,480,149$
6 274,974,570$ 19,335,008$ 294,309,578$ 197,039,948$ 13,017,334$ 84,252,297$
7 264,431,921$ 14,522,033$ 278,953,954$ 184,651,989$ 12,425,565$ 81,876,400$
8 271,340,971$ 14,000,836$ 285,341,807$ 188,407,447$ 12,729,719$ 84,204,641$
9 230,090,659$ 13,197,284$ 243,287,943$ 161,337,776$ 10,824,655$ 71,125,512$
10 196,174,885$ 11,283,521$ 207,458,406$ 137,593,741$ 9,229,799$ 60,634,866$
11 220,279,456$ 10,527,864$ 230,807,320$ 151,957,455$ 10,315,133$ 68,534,732$
12 178,735,373$ 11,536,337$ 190,271,710$ 126,852,802$ 8,437,877$ 54,981,031$
13 179,755,798$ 9,518,401$ 189,274,199$ 125,103,402$ 8,438,619$ 55,732,178$
14 167,684,280$ 8,787,489$ 176,471,769$ 116,593,213$ 7,869,835$ 52,008,721$
15 103,745,163$ 5,244,891$ 108,990,053$ 71,907,690$ 4,864,648$ 32,217,715$
16 42,531,248$ 2,354,100$ 44,885,348$ 29,721,251$ 1,998,947$ 13,165,150$
PCS 3,066,721,813$ 168,269,336$ 3,234,991,149$ 2,141,306,107$ 144,100,821$ 949,584,221$

30
143. If time and data had permitted, PCS would prefer to be able to compare the actual land that has been mined and subsided badly with the land that has/will not be, if possible--then the IPC have 'actuals' instead of 'proxies.'
144. As noted, it would be wise to compare actual royalties, revenues and company taxes paid by SIMEC and the revenues and company taxes the state and landowners' would have received from property sales, sub-divisions, and lifestyle enhancements.
145. It is clearly sensible to at least review ten years of the most recent Royalty and Discount actuals for both that reflect current the market, operating and engineering environment. The productivity of the mine expansion is driven by a lot of engineering, economic, geologic and safety factors.
146. Glencore and other documents indicate there is a real uncertainty and that de-risked mean-centred unbiased expected values may be less than proponents, CE and EY wish. All the benefits are so uncertain the Project should be refused. The externalised and zeroed costs overwhelm both the private and the public benefits.
147. A cracked leaking swimming pool is not as much fun as one that is dust and leak free. A home or rail line on a surface that is buckling unevenly is not as safe, especially given the immediate proximity of real fault lines at the Tahmoor mine site. Recall for example the full direct, indirect and future costs of the minor Newcastle earthquake. Instead think about the highest and best use of the land for housing, the ecosystems and the preservation of threatened species that all have a much higher NPV than this Project.
148. The property market for houses on land with swimming pools that don’t leak, manageable estates, and speciality COVID-retreat properties is hot. People are voting with their feet, urban equity, stock market gains, bitcoins, and fleeing Melbourne, Sydney, the USA and India, etc. It's like what the 1996 US Quadruple-plus Pay Check Theory predicts, plus they can 'escape' from COVID spreaders who are 'using' narrow/small high-rise lifts, poor air-conditioning/ventilation systems, and no high-quality masks. In comparison to property, the market for coal is stranded like the Australian ships idled off the coast of China. There is an over-supply of Australian coal, and an under-supply of landed housing.
149. More than 300 new homes (in total worth millions) have been reportedly rejected so because of the proposed mine, subsidence and other issues.
150. Contrary to advice since 2014, and best practices, the Proponent did not consider the value of gated-estate properties, nor ordinary property sub-divisions. Millions could have been and more can be still made. People fleeing Melbourne and Sydney can buy their dream homes in Bargo NSW. Americans are now desperate and face 500,000 deaths; the UK will never be the same; India has millions of millionaires trying to flee. To many of these people their families’ futures matter far more that the million dollar costs of moving. PCS refer to the 1996 US Quadruple-plus Pay Check Theory.
151. In comparison coal mining contributes to subsidence, externalised third-party costs, a sub-optimal NPV and one that for the public is negative (NPV < 0). The proponent does not even attempt to achieve any OLA and a detrimental PSA strategy.
8. Additional Technical Reasons the Project must be Rejected: Optimal Levels of Abatement (OLA) and Problem Shifting Analysis (PSA)
152. OLA, CBA and PSA have been taught in Australia since at least February 1984. Basically, with OLA zero abatement results in 100 per cent of the costs being externalised onto third parties. Both the CE and EY CBA’s have effectively zero abatement or remediation costs for:
31
(a) Air quality
(b) Greenhouse gas emissions (Scope 3 in ERM has gone missing in CE and EY)
(c) Visual amenity
(d) Transport impact
(e) Net public infrastructure cost
(f) Surface water impact
(g) Loss of surplus to other industries
(h) Water
(i) Aboriginal cultural and historical heritage
(j) Land opportunity costs
153. If a proponent engages in zero abatement as above, or 100 per cent abatement, the results are sub-optimal and immediately questioned. In this project ten issues have zero abatement or remediation; none have 100 per cent abatement. Three have an internal solution assumed to be 50 per cent because abatement costs normally increase dramatically at an increasing rate as the percentage of abatement increases towards 100 per cent.
154. Marginal abatement costs often increase at an increasing rate as the percentage of abatement increases. So to achieve 100 per cent abatement costs an unreasonable amount of money. To achieve a small percentage of abatement is cheap, 50 per cent modestly expensive and 100 per cent virtually impossible.
155. Marginal abatement benefits often change at a different rate as the percentage of abatement increases. So to achieve 100 per cent abatement costs an unreasonably large amount of money for virtually no additional benefit, and similarly results in a sub-optimal outcome.
156. By utilising abatement costs and benefits, marginal abatement costs, marginal abatement benefits, and totalling both costs and benefits, it is possible to identify an internal optimal solution (i.e. where, 0% < OLA < 100% abatement). To quote the Dictionary of Economics the optimal level of pollution is “the level of pollution that maximizes social welfare by equating the marginal cost of additional pollution with the marginal benefit. The concept of the optimal level recognizes that there may be benefits to allowing pollution which would be lost were pollution to be eliminated.”13
157. The optimal level of abatement can also be derived by summing abatement costs and abatement benefits noting the global minima and a range of efficiency. Again the OLA is not at zero abatement, nor at 100 per cent abatement.
158. The Tahmoor expansion project contributes to a number of third party impacts and detrimental problem shifts, including greenhouse gases and climate change. No evidence is presented that any of the solutions are either holistic or optimal from a public or a NPV perspective.
159. PSA is an EVA model that considers direct and indirect, current and future, cumulative and non-cumulative, threshold and irreversible impacts, within and outside human ecological and political boundaries. PSA uses a 100 year time span to better evaluate entangled and slow to materialise impacts. It helps develop answers which can better solve problems, optimise beneficial shifts, and
13 A Dictionary of Economics (2009), J Black, N Hashimzade, and G Myles, Oxford University Press

32
minimise undesirable shifts to other people, generations, and states of transformation, places or parts of the global complex.
160. Its relevance here is that it does not just mitigate a single externality, PSA tries to holistically consider multiple systems, space-time-systems, socio-economic-ecological inter-dependencies, and synergistic effects. In comparison the coal mine expansion proponents only appear to be concerned with less than one per cent of greenhouse gas Scope 1 and 2 emissions and no Scope 3 emissions. Ten problem shifts have no remediation, and somehow disappear.
161. A consent authority cannot rationally and technically approve a development that is likely to have some identified environmental impact, then a magical or even theoretical possibility that the environmental impact will be mitigated or optimally offset by some unspecified and uncertain action at some unspecified and uncertain time in the future. Problem shifts infrequently magically disappear, they are transformed, and shifted as the word implies.
162. PCS note this mine expansion project is not in the public interest because:
(a) It is clearly does not comply with the principles of ecologically sustainable development (ten cases of effectively no abatement);
(b) The direct and indirect greenhouse gas emissions will contribute to climate change (Scope 3 GHG’s have been omitted by CE and EY; in December 2015, 195 countries including Australia agreed on climate change; in 2016 NSW released its Climate Change Policy Framework with an objective to achieve net zero emissions by 2050; CE’s 2018 and EY’s 2019 net zero flow-on impacts are not transparent);
(c) A significant quantum of other costs are externalised and impact systems;
(d) The benefits are overstated, skewed and highly uncertain, and
(e) One of the reasons for refusal of the coal mine application and appeal in Gloucester Resources Limited v Minister for Planning [2019] NSWLEC 7 was:
“The economic and public benefits of the mine are uncertain and overstated and not shown to be greater than the public costs of the mine.”
9. Conclusion
163. It is PCS opinion that the Tahmoor mine expansion project has a public net present value of significantly less than zero (NPV < 0). For this reason, it is PCS’ opinion that the Project ought to be refused.
164. As summarised in multiple PCS tables above, even private NPV benefits of nearly $1 billion are outweighed by public NPV costs of more than $2 billion. That approximation does not even account for the opportunity costs imposed on the client and other Bargo NSW landowners impacted.
165. It is PCS opinion that almost no amount of economic ‘magic’ can get the public NPV robustly positive or statistically closer to zero, other than a carbon price of less than $2.41 t CO2e. The gap between ‘tangible’ NSW benefits and ten externalised costs is simply too large using credible estimates and EU ETS reference carbon prices.
166. There is no compensation to stakeholders’ and land owners affected by the Project regarding the relevant detrimental problem shifts and externalised costs.
33
167. The Proponent’s CBA and public benefits of the mine are so uncertain and skewed with optimism bias they are not robustly demonstrated to be greater than the public costs of the mine expansion.
168. The only tangible public benefit is royalty payments, given the September 2020 SIMEC reported loss and the July 2018 SIMEC / Glencore June 2016 public statement about the impact of low coal prices on Tahmoor mine viability even that public benefit NPV may be uncertain.
169. It would appear that thermal coal may be uneconomic with low coal prices, as Glencore (June 2016) clearly inferred with a mine closure announcement. Despite this, the mine appears profitable if the average costs of production are $111.11 a tonne.
170. The relevance of low coal prices is that they may trigger a temporary shutdown of the mine. If the mine were to shut down because of low prices, no royalties or corporate income tax may be paid for a period of time. CE’s and EY’s public NPV of the project would thus be further reduced because of the delay. PCS determined it is already significantly negative (NPV < 0).
171. In round numbers, the Project’s 16 year cumulative 100,000,000 CO2e tonnes of Scope 1, Scope 2 and Scope 3 greenhouse emissions are “genuinely additional” contributions to the above-ground biosphere housing socio-economic-ecologic systems.
172. If the below ground the Project expansion HCC and TC coals and ROM are mined out, burned, and transformed into heat, dust, income, debt-service, discounts, many useful goods and eventual landfill or waste, then entangled problems will likely have been shifted to the public.
173. Only royalty NPV’s can be estimated (reverse engineered) with any sort of confidence depending on the assumptions, timings, discounts, prices, mix and production levels. The rest of the information in the CBAs are too uncertain and skewed which ought to be ignored.
174. When average coal reference prices are less than the long-run costs of production almost everyone loses, depending on who secures any discount transfers, upfront fee or out-sourced payments, independent of the dynamic movements of coal and carbon reference prices.
175. In plain English, the coal mine expansion Project is a lemon, except for the primary beneficiaries when the average price of coals is materially more than the long-run costs of production of around $111.11 per tonne.

34
10. References
ABC, “Family who lost their home in bushfire fears they could lose it again to Tahmoor coal mine expansion” - ABC News https://www.abc.net.au/news/2021-02-13/bargo-residents-reject-tahmoor-mine-expansion/13150732
ABC, “Tahmoor mine expansion 'critical', coal boss says, as IPC hears MP's claims of smear campaign” - ABC News https://www.abc.net.au/news/2021-02-15/ipc-public-hearings-into-tahmoor-coal-mine-expansion-underway/13154812
Abelson P. (March 2014) “Guidelines for Strategic Impact Assessment” Applied Economics P/L, Mosman, NSW, White Paper CBA
Guidelines for NSW Department of Planning & Infrastructure
Abelson P. (August 2020) “Economic Inputs for Revised Energy (Efficiency) CBA Framework Or for a Guide to Cost-Benefit Analysis in
the Energy Sector” Applied Economics P/L, Mosman, NSW, Energy CBA Guidelines for NSW Department of Planning, Industry and
Environment. PCS reviewed this Professor Abelson document in September 2020 and other CBA expert advice including from
Professor David Pannell and others post June 2020.
Australian Local Government Association (August 2019) Response to the Scientific Evidence on Anthropogenic Climate Change, Deakin, ACT, Submission https://alga.asn.au/submission-in-response-to-the-climate-change-authority-consultation-paper/
Barnett J., ERM Pty LTD (2018) Tahmoor South Project Greenhouse Gas Assessment
Bennett J. (17 December 2019) Expert Witness Report Tahmoor South Coal Mine Expansion SSD-8445: CBA and LEA submitted with
the EIS, Holding Redlich
Bennett J. (19 March 2020) Expert Witness Supplementary Report Tahmoor South Coal Mine Expansion SSD-8445: CBA and LEA
submitted with the EIS, Holding Redlich
Black, J., N Hashimzade, and G Myles, Dictionary of Economics (2009), Oxford University Press
Boardman A., Greenberg, D., Vining, A. and D. Weimer (July 2018) “Cost-Benefit Analysis, Concepts and Practice” United Kingdom
Brain, P.J. (1989, 2017, 2020) “How Orthodox Economic Models Justify Deregulation, Inequality and Unemployment” National
Institute of Economic & Industry Research, Melbourne, Victoria, personal communications, and https://nieir.com.au/
Brain, P.J. (February 2021) Executive Director of National Institute of Economic and Industry Research (NIEIR), Melbourne, Victoria,
personal communications, and https://nieir.com.au/
Burtraw D. and M. Themann (2018) “Pricing Carbon Effectively: Lessons from the European Emissions Trading System,” Resources
for the Future; https://media.rff.org/documents/PricingCarbonEffectively_Report_1.pdf
Busfield J. (October 2020) “Review of Tahmoor South Proposed Mine,” MineCraft Pty Ltd, North Lakes, Queensland, report for NSW
Department of Planning, Industry and Environment
Central Appalachian Coal Futures Price - End of Day Settlement Price and News – IndexMundi https://www.indexmundi.com/commodities/?commodity=central-appalachian-coal
Clean Energy Regulator, News item - Project registration for Auction 12 closes Thursday – don’t miss out! http://www.cleanenergyregulator.gov.au/About/Pages/News%20and%20updates/NewsItem.aspx?ListId=19b4efbb-6f5d-4637-94c4-121c1f96fcfe&ItemId=895
Clean Energy Regulator News item - The annual Clean Energy Regulator Stakeholder Survey 2020-21 is underway http://www.cleanenergyregulator.gov.au/About/Pages/News%20and%20updates/NewsItem.aspx?ListId=19b4efbb-6f5d-4637-94c4-121c1f96fcfe&ItemId=890
Clean Energy Regulator Markets Carbon Markets http://www.cleanenergyregulator.gov.au/Infohub/Markets
Clean Energy Wire, Understanding the European Union’s Emissions Trading System https://www.cleanenergywire.org/factsheets/understanding-european-unions-emissions-trading-system
Climate Action, EU Emissions Trading System (EU ETS) https://ec.europa.eu/clima/policies/ets_en
CME Group FOB Australia Premium Hard Coking Coal (TSI) Futures Quotes - CME Group https://www.cmegroup.com/trading/energy/coal/fob-australia-premium-hard-coking-coal-tsi.html

35
Coal, Australian thermal coal - Monthly Price (Australian Dollar per Metric Ton) - Commodity Prices - Price Charts, Data, and News –
IndexMundi https://www.indexmundi.com/commodities/?commodity=coal-australian&months=60¤cy=aud#google_vignette
Coal, Australian thermal coal Monthly Price - Australian Dollar per Metric Ton;
https://www.indexmundi.com/commodities/?commodity=coal-australian&months=120
and https://www.indexmundi.com/commodities/?commodity=coal-australian&months=240¤cy=aud
Coal News (2021) https://www.indexmundi.com/commodities/news/coal
Department of Industry, Science, Energy and Resources, National Greenhouse Gas Inventory: June 2020
https://www.industry.gov.au/publications/national-greenhouse-gas-inventory-june-2020
Ember Daily EU ETS Carbon Market Price in Euros (2021), Carbon Price Viewer – Ember https://ember-climate.org/data/carbon-
price-viewer/
Fox K. and D. Miles eds. (1987) “Systems Economics: Concepts, Models, and Multi-Disciplinary Perspectives,” ISU Press, Ames
Gates B. (2021) Reaching zero emissions will be 'hardest thing humanity's done', Bill Gates says - 7.30
https://www.abc.net.au/7.30/reaching-zero-emissions-will-be-hardest-thing/13161502
Gloucester Resources Limited v Minister for Planning - NSW Caselaw
https://www.caselaw.nsw.gov.au/decision/5c59012ce4b02a5a800be47f
Gupta S. (2021) Comments on the need and direction of a green-steel making industry: https://www.pv-magazine-
australia.com/2020/06/10/bringing-green-steel-to-reality-gfg-launches-whyalla-overhaul/
Hard coking coal (2021) - IndexMundi Search https://www.indexmundi.com/search/?q=hard%20coking%20coal
HM Treasury (2020), the Green Book: Central Government Guidance on Appraisal and Evaluation, H.M. Treasury, London
IHS Markit Global Carbon Index (2021) https://indices.ihsmarkit.com/Carbonindex
IHS Markit Global Carbon Index (2021) https://ihsmarkit.com/products/global-carbon-index.html
IHS Markit Global Carbon Index White Paper https://ihsmarkit.com/Info/0919/global-carbon-index-white-paper.html
KPMG Coal Price and FX market forecasts (December 2020 – January 2021) - coal-price-fx-market-forecast-december-2020-january-2021.pdf https://assets.kpmg/content/dam/kpmg/au/pdf/2021/coal-price-fx-market-forecast-december-2020-january-2021.pdf
KPMG Coal Price and FX Market forecasts - KPMG Australia https://home.kpmg/au/en/home/insights/2021/02/coal-price-fx-market-forecasts.html
Manley P., (February 2021) Wood Mackenzie, personal communications regarding the current prices of thermal and hard coking
coals, reference prices, Tahmoor expansion mine profitability, and his previous advice and related matters.
Miles D. and M. Burge (1996) Quadruple Plus Pay Check Migration costs and benefits.pdf
Miles D (2006) Prof Miles International_Symposium_paper45.doc, GUFS, Guangzhou
Miles D (2020) Ten Laws of Systems Economics & Robotics uploaded USA CRO April 3 2020.pdf Washington DC
Miles D. (2020) “Solutions to Problems like COVID-19 and Global Climate Change decades before they existed. Not a TYPO. Space-
Time-Systems Economics Quantum Entanglement”
Washington DC
NGGI Figure 20 nggi-quarterly-update-june-2020-data-sources.xlsx https://www.industry.gov.au/sites/default/files/2020-11/nggi-quarterly-update-june-2020-data-sources.xlsx
NGGI Quarterly Update of Australia’s National Greenhouse Gas Inventory: June 2020 - nggi-quarterly-update-june-2020.pdf https://www.industry.gov.au/sites/default/files/2020-11/nggi-quarterly-update-june-2020.pdf
Nordhaus W. (2015) “The Climate Casino: Risk, Uncertainty, and Economics for a Warming World”

36
NSW Environmental Protection Authority (2016) Approved Methods for the Modelling and Assessing of Air Pollutants in New South
Wales
NSW Environment, Energy and Science, Emissions in NSW fact sheet https://www.environment.nsw.gov.au/research-and-
publications/publications-search/climate-change-fact-sheet-emissions-in-nsw
NSW Environment, Energy and Science, NSW Climate Change Policy Framework https://www.environment.nsw.gov.au/research-
and-publications/publications-search/nsw-climate-change-policy-framework
NSW Environment, Energy and Science, Climate Change Policy Framework https://www.environment.nsw.gov.au/topics/Climate-
change/Policy-framework
NSW Minister for Mineral Resources, Clause 3 of the Ministerial Determination sets out the method for calculating the value of coal
recovered, including deductions that may be claimed, effective 1st January 2009, signed by IAN MACDONALD, MLC, Minister for
Mineral Resources, last sourced 5 February 2021:
https://www.revenue.nsw.gov.au/taxes-duties-levies-royalties/royalties/coal
NSW OEH Net Zero Plan. Stage 1: 2020-2030 - net-zero-plan-2020-2030-200057.pdf https://www.environment.nsw.gov.au/-/media/OEH/Corporate-Site/Documents/Climate-change/net-zero-plan-2020-2030-200057.pdf
NSW OEH Climate Change Fund Annual Report 2019—2020 - nsw-climate-change-fund-annual-report-2019-2020-200499.pdf https://www.environment.nsw.gov.au/-/media/OEH/Corporate-Site/Documents/Climate-change/nsw-climate-change-fund-annual-report-2019-2020-200499.pdf
NSW OEH Fact Sheet: Emissions in NSW - emissions-fact-sheet-160612.pdf https://www.environment.nsw.gov.au/-/media/OEH/Corporate-Site/Documents/Climate-change/emissions-fact-sheet-160612.pdf
NSW Legislation, Mining Act 1992 No 29 https://www.legislation.nsw.gov.au/view/html/inforce/current/act-1992-029
NSW Planning and Environment, Economic | Major Projects - Department of Planning and Environment https://www.planningportal.nsw.gov.au/major-projects/assessment/policies-and-guidelines/key-guidance/economic
NSW Planning and Environment, Key Guidance | Major Projects - Department of Planning and Environment https://www.planningportal.nsw.gov.au/major-projects/assessment/policies-and-guidelines/key-guidance
NSW Planning and Environment, Air | Major Projects - Department of Planning and Environment https://www.planningportal.nsw.gov.au/major-projects/assessment/policies-and-guidelines/key-guidance/air
NSW Planning and Environment Guidelines for the economic assessment of mining and coal seam gas proposals - C34250AF72674275836541CD48CBEC49.ashx https://www.planning.nsw.gov.au/Policy-and-Legislation/Mining-and-Resources/~/media/C34250AF72674275836541CD48CBEC49.ashx
NSW Planning and Environment (2018) Technical Notes Supporting The Guidelines for the Economic Assessment of Mining and Coal Seam Gas Proposals - technical-notes-supporting-the-guidelines-for-the-economic-assessment-of-mining-and-coal-seam-gas https://www.planning.nsw.gov.au/-/media/Files/DPE/Other/technical-notes-supporting-the-guidelines-for-the-economic-assessment-of-mining-and-coal-seam-gas-proposals-2018-04-27.ashx?la=en
NSW Planning & Environment (2015), Guidelines for the Economic Assessment of Mining and Coal Seam Gas Proposals, http://www.planning.nsw.gov.au/Policy-and-Legislation/Mining-andResources/~/media/C34250AF72674275836541CD48CBEC49.ashx
NSW Planning, Industry & Environment Tahmoor South Project – getContent https://majorprojects.planningportal.nsw.gov.au/prweb/PRRestService/mp/01/getContent?AttachRef=EXH-897%2120200221T071151.427%20GMT
NSW Resources and Geoscience Future of Coal Statement https://www.resourcesandgeoscience.nsw.gov.au/miners-and-explorers/programs-and-initiatives/future-of-coal-statement#:~:text=The%20Strategic%20Statement%20on%20Coal,point%20action%20plan%20built%20around%3A&text=Reducing%20the%20impact%20of%20coal,out%20of%20thermal%20coal%20mining
NSW Resources and Geoscience Advisory Body for Strategic Release for Coal and Petroleum https://www.resourcesandgeoscience.nsw.gov.au/__data/assets/pdf_file/0011/718481/Strategic-Release-Framework-Terms-of-Reference.pdf

37
NSW Resources and Geoscience Areas in NSW coal regions available and excluded from future coal exploration and mining https://www.resourcesandgeoscience.nsw.gov.au/__data/assets/pdf_file/0007/1236976/Coal-mining-release-and-exclusion-areas-map.pdf
NSW State Budget Forward Estimates for Coal Royalties https://www.budget.nsw.gov.au/sites/default/files/2020-
11/Appendices%20B-BP1%20Budget%202020-21.pdf
NSW Treasury (2017) TPP17-03 NSW Government Guide to Cost-Benefit Analysis - TPP17-03 NSW Government Guide to Cost-Benefit Analysis - pdf_0.pdf https://www.treasury.nsw.gov.au/sites/default/files/2017-03/TPP17-03%20NSW%20Government%20Guide%20to%20Cost-Benefit%20Analysis%20-%20pdf_0.pdf
NSW Treasury (2021) Ensuring great value for the people of NSW: Treasury’s new way of assessing cost and benefit | NSW Treasury https://www.treasury.nsw.gov.au/news/ensuring-great-value-people-nsw-treasurys-new-way-assessing-cost-and-benefit
NSW Trade and Investment, NSW Coal Mining Guidelines for Royalty Compliance,
http://www.resourcesandenergy.nsw.gov.au/__data/assets/pdf_file/0007/399562/ royalty-and-statisticsguidelines-coal.pdf
NSW Trade and Investment: Resources and Energy: Coal Royalty rates http://www.resourcesandenergy.nsw.gov.au/miners-
andexplorers/enforcement/royalties/royalty-rates
Simec (September 2020), meeting minutes noting para 8.1 that Tahmoor Coal is running at a loss:
http://www.simec.com/media/7074/q3-2020-tcccc-minutes-september-meeting-20200903.pdf
Simec a03448_simec-tahmoor-coal-project-news-7_v2.pdf http://www.simec.com/media/6801/a03448_simec-tahmoor-coal-
project-news-7_v2.pdf
Simec a11019_simec_tahmoor-south-resident-info-pack_v4-final.pdf http://www.simec.com/media/7102/a11019_simec_tahmoor-south-resident-info-pack_v4-final.pdf
Simec simec-flyer-concept-v2-lowres - Tahmoor-South-flyer.pdf http://www.tahmoorsouth.com.au/wp-content/uploads/2021/02/Tahmoor-South-flyer.pdf
The SMH/Twiggy Forest article regarding the need and direction of a green-steel making industry
https://www.smh.com.au/business/companies/twiggy-forrest-s-fortescue-targets-zero-carbon-steel-to-phase-out-coal-20210122-
p56w7e.html#:~:text=Billionaire%20Fortescue%20Metals%20Group%20chairman,energy%20technology%20to%20substitute%20co
al.
The SMH Federal Budget 2020: GST slump to hit NSW coffers https://www.smh.com.au/national/nsw/nsw-braces-for-historic-hit-to-gst-revenue-20201005-p5627w.html
Reuters Column: India's coal imports rebound as Australia wins market share https://www.reuters.com/article/idUSL1N2KE08P
Submissions made by Subsidence Australia NSW https://www.planningportal.nsw.gov.au/major-projects/project/10966, and
https://www.planningportal.nsw.gov.au/major-projects/submission/292676
Tessler A., BIS Oxford Economics (2020) Peer Review of Economic Impact Assessment, Tahmoor South Coal Project, released by DPIE
for this and public review.
Transport for NSW (2016, 2018, 2019) “Principles and Guidelines for Economic Appraisal of Transport Investment and Initiatives;”
and updated “Transport for NSW Cost-Benefit Analysis Guide: This guide applies to all agencies within the NSW Transport cluster”;
https://www.transport.nsw.gov.au/projects/project-delivery-requirements/evaluation-and-assurance/transport-for-nsw-cost-
benefit
US Government Printing Office (1984, p.129) published for the 1985 USA Senate “Farm Policy Perspectives: Setting the Stage for
1985 Agricultural Legislation” re Systems Economics, Washington DC
WRI & WBCSD, Greenhouse Gas Protocol | https://ghgprotocol.org/
WRI & WBCSD, About WRI & WBCSD | Greenhouse Gas Protocol https://ghgprotocol.org/about-wri-wbcsd
***
Information and © first three 1977-1978 laws of human ecology, © ten laws of systems economics, © ten new laws of robotics, © space-time-
systems economics quantum entanglement, © time bending, © the world’s best predictive model, © events prices incomes regions analysis, ©
systems access connectivity and value uplift, © before birth to after death (entire human lifecycle) models, and other data shown in tables and
charts are POST COVID SOLUTIONS own data, and proprietary models — except where otherwise stated, used, and cited in footnotes, references,

38
sources, notes, etc. — and are thus copyright © POST COVID SOLUTIONS. Any or all permissions and PCS assistance to help use any or all related ©
materials can be obtained by emailing [email protected], or SMS to mobile 61-416 367 039, or by writing to Miles Report c/-
PO Box 318, Crows Nest, NSW 1585, in Australia.

What is anomalous subsidence at Tahmoor?
Ross Seedsman
Leigh Appleyard
2 February 2021
SUMMARY The “increased subsidence” recorded at Tahmoor North and indicated by greater than expected
vertical subsidence should be considered as anomalous in the context of the prediction method
being used. This is in addition to the “non-conventional anomalous” strain measurements referred
to by MSEC.
INTRODUCTION Subsidence predictions for the 2nd amendment mine plan for Tahmoor South are summarised in
Table 4.2 of the MSEC report1, reproduced below. Note the use of the term “conventional”. Applying
the MSEC conversion factor of 15, the curvature values represent tensile strains of 2.4-2.7 mm/m
and compressive strains of 3.45 – 4.2 mm/m.
Referring to the guidelines adopted by Subsidence Advisory, the maximum tilts would require
adoption of Guideline 4 and the maximum strains would require adoption of Guideline 5.
The MSEC report includes discussions regarding “non-conventional anomalous movements”. In their
letter of 18 March 2019 Subsidence Advisory has used the term “non-conventional anomalous
movements” and abbreviated it to NCAM – they also noted that “it is difficult to mitigate subsidence
damage from anomalous subsidence movement through design”. In their letter of 20 May 2020 they
refer to anomalous movements at Tahmoor North and separately non-conventional anomalous
movements.
In their letter of 20 May 2020, when discussing future surface development, Subsidence Advisory
make reference only to the “predicted surface impacts” with no reference to anomalous
movements. As mentioned above, the predicted tilts are in excess of 7 mm/m and perhaps this is
the basis of their likely to refuse comment.
1 Tahmoor South Project – Second Amendment report for Longwall 101A to 106B. MSEC July 2020, Report Number MSEC1123, Revision A

You have requested commentary on what anomalous subsidence is, how common is it for other
projects, and whether there are any further assessments that could be done to better understand it.
TERMINOLOGY The Oxford Dictionary definition of anomaly is:
Something that deviates from what is standard, normal, or expected.
As we understand it, the terminology adopted by MSEC appears to be as follows:
• Conventional subsidence relates to the smooth variation in vertical subsidence and the
associated tilts and curvatures that are derived mathematically. MSEC predicts this using
their internally-developed Incremental Profile Method (IPM). There is a claim on the MSEC
website that this has an accuracy of +/-15% when applied to flat ground distant from
valleys.
• Non conventional movements are either deformations associated with proximity to valleys
or far-field movements. The prediction of
deformations is difficult for valleys and can be
readily managed for future dwellings by stand-offs
from the crests and toes of slopes. Far-field
movements are not material for dwellings. Non-
conventional movements are not discussed in this
advice. MSEC also uses the term irregular
subsidence for situations where the vertical
subsidence associated with non-conventional
subsidence is not a smooth curve. They attribute
irregular subsidence to abrupt changes in
geological conditions, steep topography and
valleys. MSEC Figure 4.8 shows the location of
observed potential non-conventional movements
– the blue ones are related to valleys and the red
ones are possibly impacts related to anomalies.
•
• An anomaly is defined as non-conventional ground movements that were not expected to
occur and cannot be explained. MSEC uses the term “non conventional anomalous” as it
relates to strain with only one use of the word anomalous in the context of unexpected
subsidence ground movements.
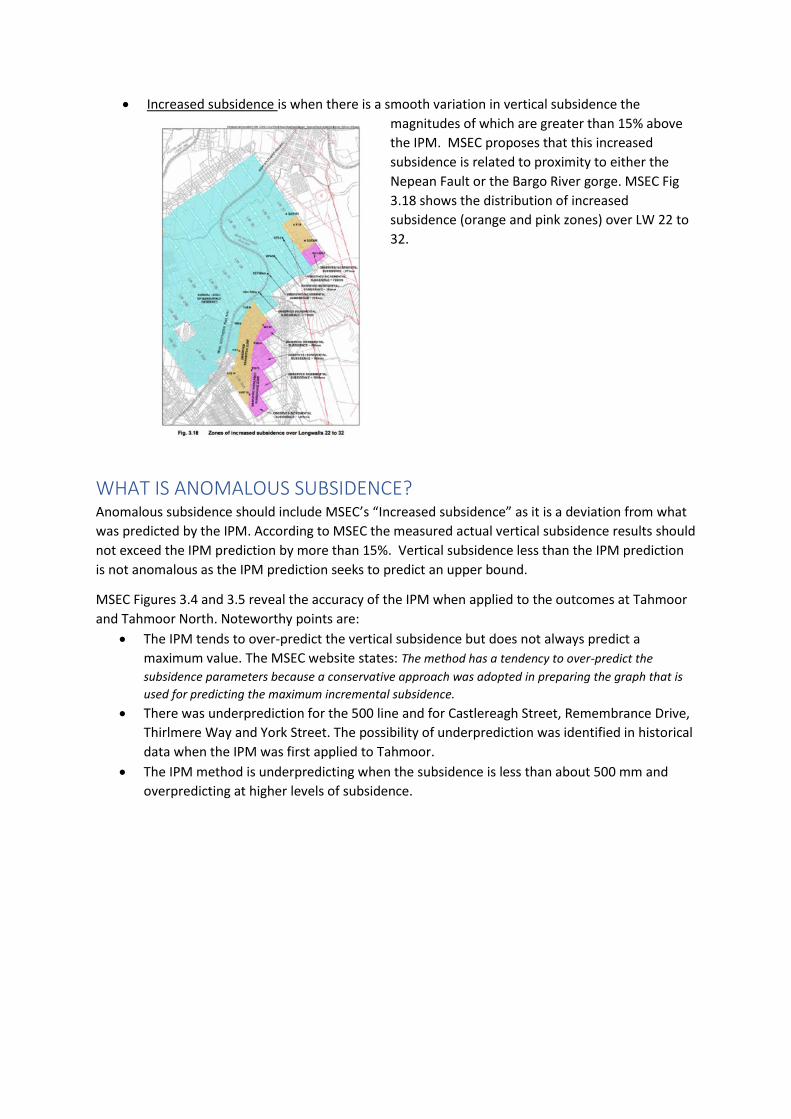
• Increased subsidence is when there is a smooth variation in vertical subsidence the
magnitudes of which are greater than 15% above
the IPM. MSEC proposes that this increased
subsidence is related to proximity to either the
Nepean Fault or the Bargo River gorge. MSEC Fig
3.18 shows the distribution of increased
subsidence (orange and pink zones) over LW 22 to
32.
WHAT IS ANOMALOUS SUBSIDENCE? Anomalous subsidence should include MSEC’s “Increased subsidence” as it is a deviation from what
was predicted by the IPM. According to MSEC the measured actual vertical subsidence results should
not exceed the IPM prediction by more than 15%. Vertical subsidence less than the IPM prediction
is not anomalous as the IPM prediction seeks to predict an upper bound.
MSEC Figures 3.4 and 3.5 reveal the accuracy of the IPM when applied to the outcomes at Tahmoor
and Tahmoor North. Noteworthy points are:
• The IPM tends to over-predict the vertical subsidence but does not always predict a
maximum value. The MSEC website states: The method has a tendency to over-predict the
subsidence parameters because a conservative approach was adopted in preparing the graph that is
used for predicting the maximum incremental subsidence.
• There was underprediction for the 500 line and for Castlereagh Street, Remembrance Drive,
Thirlmere Way and York Street. The possibility of underprediction was identified in historical
data when the IPM was first applied to Tahmoor.
• The IPM method is underpredicting when the subsidence is less than about 500 mm and
overpredicting at higher levels of subsidence.

HOW COMMON IS ANOMALOUS SUBSIDENCE AT OTHER PROJECTS? Because the IPM is propriety intellectual property of MSEC it is not known if there are examples of
“increased subsidence” at other mines. Note the annotation of Figure 3.4 and 3.5:
The accuracy of empirical predictions of maximum subsidence is typically within +/-
15% of the maximum observed subsidence, or within +/-50 mm of the maximum
observed subsidence where the magnitude is small.
FURTHER ASSESSMENTS Anomalous subsidence outcomes could be reduced in the future by calibrating the IPM to data from
the Tahmoor and Tahmoor North geometry with less focus on the other mines in the Southern
coalfields or by developing an alternative prediction method specific for Tahmoor South.