unplugged publishable final report -...
TRANSCRIPT

Final Report
Project acronym & number: UNPLUGGED
Project Number 314 126
Project title: Wireless charging for Electric Vehicles
Status: Final
Authors: All Project partners
Contributors:
Reviewers
Due date of deliverable: 2015-05-30
Document identifier: UNPLUGGED_Final-Report_v150530.01-Final
Revision: v150530.01
Date: 2015-05-30

UNPLUGGED 07.05.2015
UNPLUGGED Publishable Final Report.docx Page 2 of 68
UNPLUGGED: Wireless charging for Electric Vehicles
UNPLUGGED project aims to investigate how the use of inductive charging of Electric Vehicles (EV) in urban environments improves the convenience and sustainability of car-based mobility. In particular, it will be investigated how smart inductive charging infrastructure can facilitate full EV integration in the urban road systems while improving customer acceptance and perceived practicality. UNPLUGGED will achieve these goals by examining in detail the technical feasibility, practical issues, interoperability, user percep-tion and socio-economic impacts of inductive charging. As one special variant, inductive en-route charg-ing will be investigated thoroughly.
As part of the project, two smart inductive charging systems will be built, taking into consideration re-quirements from OEMs, energy utilities and end users. The systems will be innovative and will go beyond the current state of the art in terms of high power transfer, allowing for smart communication between the vehicle and the grid, as well as being in line with the latest inductive charging standards and considering interoperability. These innovative inductive charging systems designed and built as part of the project will then be tested and assessed in order to understand their potential impacts on urban mobility and the ac-ceptance of e-mobility. Application in an en-route charging scenario in particular will be examined for dif-ferent vehicle types, ranging from cars to buses.
It is anticipated that UNPLUGGED will provide clear evidence on and demonstrate whether the use of smart inductive charging infrastructure can overcome some of the perceived barriers for e-mobility, such as range and size of on-board energy storage, and practical difficulties associated with installing tradi-tional charging post infrastructure.
Project Consortium
− fka Forschungsgesellschaft Kraftfahrwesen mbH Aachen , Germany
− ENIDE SOLUTIONS .S.L , Spain
− CENTRO RICERCHE FIAT SCPA, Italy
− UNIVERSITA DEGLI STUDI DI FIRENZE, Italy
− VOLVO TECHNOLOGY AB, Sweden
− Continental Automotive GmbH, Germany
− Hella KGaA Hueck & Co., Germany
− VRIJE UNIVERSITEIT BRUSSEL, Belgium
− IDIADA AUTOMOTIVE TECHNOLOGY SA, Spain
− TRL LIMITED, United Kingdom
− COMMISSARIAT A L ENERGIE ATOMIQUE ET AUX ENERGIES ALTERNATIVES, France
− ENDESA SA, Spain
− ENEL DISTRIBUZIONE S.P.A., Italy
− FUNDACION CIRCE CENTRO DE INVESTIGACION DE RECURSOS Y CONSUMOS ENERGETICOS, Spain
− POLITECNICO DI TORINO, Italy
− TRANSPORT FOR LONDON, United Kingdom
− BAE Systems (Operations) Ltd, United Kingdom
More Information
Coordinator: Axel Barkow (coordinator)
Mail: [email protected] Tel +49 241 8861 185 - Mobil +49 163 7027833 - Fax +49 241 8861 110
Forschungsgesellschaft Kraftfahrwesen mbH Aachen
Steinbachstr. 7 - 52074 Aachen - Germany
[email protected] - www.unplugged-project.eu
Dissemination Level
PU Public X
PP Restricted to other programme participants (including the Commission Services)
RE Restricted to a group specified by the consortium (including the Commission Services)
CO Confidential, only for members of the consortium (including the Commission Services)

UNPLUGGED 07.05.2015
UNPLUGGED Publishable Final Report.docx Page 3 of 68
Change History
Version Notes Date
V150402.01 Creation of the document (Lammermann) 02.04.2015
V150507.02 Merging the contributions (Geulen) 07.05.2015
V150507.03 Input finalization 15.05.2015

UNPLUGGED 07.05.2015
UNPLUGGED Publishable Final Report.docx Page 4 of 68
Table of Contents 1 Executive Summary ................................. ......................................................................................... 7
2 Introduction ...................................... ................................................................................................. 8
3 Objectives ........................................ .................................................................................................. 9
3.1.1 Background ........................................................................................................................... 9
3.1.2 Inductive charging ................................................................................................................. 9
3.1.3 The potential of inductive en-route charging ......................................................................... 9
4 Project results ................................... .............................................................................................. 11
4.1 3,7 kW charging system ......................................................................................................... 11
4.1.1 Frequency sweep to determine resonance ......................................................................... 12
4.1.2 Frequency alteration due to system warm up ..................................................................... 13
4.1.3 Dimensioning of the rectifier ................................................................................................ 13
4.1.4 Conclusions of the vehicle integration ................................................................................. 14
4.1.5 Summary and outlook.......................................................................................................... 15
4.2 50 kW System......................................................................................................................... 15
4.2.1 Essays with two coils ........................................................................................................... 16
4.2.2 Misalignment test ................................................................................................................. 17
4.2.3 Software architecture of communications in charger side ................................................... 17
4.2.4 Design and implementation of the HMI ............................................................................... 18
4.2.5 Control and automation ....................................................................................................... 19
4.2.6 Installation of the primary and secondary............................................................................ 19
4.2.7 Conclusions ......................................................................................................................... 20
4.3 Communication concept ......................................................................................................... 21
4.4 EMC Aspects .......................................................................................................................... 23
4.4.1 EMC outside the vehicle ...................................................................................................... 23
4.4.2 EMC inside the vehicle ........................................................................................................ 26
4.5 Interoperability aspects ........................................................................................................... 30
4.5.1 Integration with the road infrastructure ................................................................................ 31
4.5.2 Assessment of charging bay design and integration into the city-scape ............................ 33
4.5.3 Provision of driver information ............................................................................................. 34
4.6 Technical and economic feasibility of wireless charging ........................................................ 34
4.6.1 Comparative analysis for vehicle technical solutions .......................................................... 34
4.6.2 London - UK - Use case ...................................................................................................... 39
4.6.3 Firenze - IT - Use case ........................................................................................................ 42
4.7 Power grid impact ................................................................................................................... 50
4.8 Standardization aspects ......................................................................................................... 51
4.8.1 State of the art of standardization developments ................................................................ 51
4.8.2 Standardization Analysis for WPT systems......................................................................... 54
4.8.3 New Standardization developments for WPT systems ....................................................... 55
5 Potential impact .................................. ............................................................................................ 57
5.1 Social acceptance of the wireless charging technology ......................................................... 57
5.2 Environmental impact assessment – the case study of Firenze and London ........................ 58
5.2.1 Summary for private cars scenario ...................................................................................... 58
5.2.2 Summary for freight vehicles (vans) scenario ..................................................................... 60

UNPLUGGED 07.05.2015
UNPLUGGED Publishable Final Report.docx Page 5 of 68
5.2.3 Summary for taxi scenario ................................................................................................... 62
5.2.4 Summary for bus scenario .................................................................................................. 63
5.2.5 Socio-economic impact assessment conclusion ................................................................. 64
6 Project website and list of beneficiaries ......... ............................................................................. 66
7 References ........................................ ............................................................................................... 68


UNPLUGGED 07.05.2015
UNPLUGGED Publishable Final Report.docx Page 7 of 68
1 Executive Summary
Today, electric vehicles (EV) are having a hard time being accepted by the customer and diffusing in the market. Even though many aspects of EVs seem making them very appealing (e.g. very low energy cost and zero tail pipe emissions) there are several concerns that people have on this technology as Range anxiety, initial investment cost or frequency of recharging.
Inductive charging offers several advantages over the conductive (using a cable) charging method: easy operation, convenience, safety or advance V2G applications. These advantages already prove the use-fulness of (stationary) inductive charging compared to the currently more common conductive charging infrastructure. However inductive charging will offer many more possibilities in the future, especially con-cerning en-route charging.
UNPLUGGED project aimed to investigate how the use of inductive charging of Electric Vehicles (EV) in urban environments improves the convenience and sustainability of car-based mobility. In particular, it was investigated how smart inductive charging infrastructure could facilitate full EV integration in the ur-ban road systems while improving customer acceptance and perceived practicality. UNPLUGGED achieved these goals by examining in detail the technical feasibility, practical issues, interoperability, user perception and socio-economic impacts of inductive charging. As one special variant, inductive en-route charging was investigated thoroughly.
The main results of UNPLUGGED have covered aspects as:
• 3,7 kW charging system operational prototype, tested for efficiency.
• 50 kW charging system operational prototype, considering two different vehicles, with different re-strictions and conditions; the charger is able to give full power to both, improving flexibility.
• Communication modules (EVCC and SECC) are part of both inductive charging systems. One pair was installed in the 3,7 kW system and one pair in the 50 kW system as well.
• EMC aspects with the purpose of measuring the magnetic field (B-field) emissions coming from the inductive charging system and check their compliance.
• Interoperability aspects which is considered a key issue in the public and commercial acceptance of wireless power transfer for electric vehicles
• Technical and economic feasibility of wireless charging
• Power grid impact, with an evaluation of the grid impact for the inductive charging station designed during the project.
• Standardization aspects, covering the study of existing and on-going related standards for Wireless Power Transfer, both on the grid side as well as the vehicle side
As part of the project, a socio-economic impact has been also investigated, taking into account aspects as the environmental impact and the user propensity to move to a different mobility paradigm. As a result, the models show that in most cases, there is a financial gain to society that can be made from switching a vehicle fleet to electric vehicles and Unplugged electric vehicles. This financial gain is not accrued by individual vehicle owners, but by wider society as an environmental benefit.
In conclusion, the project has clearly met the initial expectations in terms of investigation because of the knowledge advancements that were reached. Actually, some of the partners have internally announced its willingness to commercialize their results. As consequence they are analyzing the proper IPR tools to cover their results and prepare the specific commercialization strategy that will be performed after Un-plugged project life.

UNPLUGGED 07.05.2015
UNPLUGGED Publishable Final Report.docx Page 8 of 68
2 Introduction
The most common method for EV charging is the usage of a cable plug-in system used either at home, at work or at specific charging stations spread across some cities. An alternative to this charging method is the wireless inductive charging. With this charging method it is possible to just position your car on a charging point and start the contactless charging process without any additional effort. Wireless charging offers the potential to charge the vehicle not only during longer parking phases. Wireless charging is also possible en-route at short stops e.g. at bus stops, taxi ranks and traffic lights or even while driving and hence decrease the size and cost of the battery.
In 2012 seventeen partners from different European countries started collaborating on several aspects of wireless charging within the UNPLUGGED project co-funded by the 7th Framework Programme of the EC. The common question to answer was how the use of inductive charging of Electric Vehicles in urban environments improves the convenience and sustainability of car-based mobility.
The partners in UNPLUGGED project developed and integrated two wireless charging systems for a pas-senger car and a commercial vehicle investigating several aspects including interoperability, efficiency and standardization. These two systems focused on two different power classes. Many technological details have been investigated, starting from an interoperable communication solution and ending with EMC measurements proving the safety of the wireless charging technology for the end user.
The potential of en-route charging has been assessed in various studies including economic and social facets.
Standardization can play an important role bringing new technology into the market. UNPLUGGED has not only seized ongoing standardization activities, but also actively contributed by extending existing standards on national and international level based on the research results created in the project.
UNPLUGGED is embedded into a group of several European research projects investigating wireless charging technology. FastInCharge project’s intention is to develop a cost-effective modular infrastructure offering a global solution for EV charging. The concept of FastInCharge is to create a highly performing inductive solution which will enable a 40 kW power transfer and in comparison to UNPLUGGED is more focused on the static en-route scenario. The main objective of FABRIC project is to conduct feasibility analysis of dynamic en-route charging technologies for long term electric vehicle range extension. FABRIC targets various types of vehicles, including passenger cars, light weight duty vehicles and heavy vehicles and buses. Appropriate charging solutions will be integrated and tested in different sites, cover-ing an extensive part of Europe from Italy in the South, through France, to Sweden in the North.
UNPLUGGED 07.05.2015
UNPLUGGED Publishable Final Report.docx Page 9 of 68
3 Objectives
3.1.1 Background
Today, electric vehicles (EV) are having a hard time being accepted by the customer and diffusing in the market. Even though many aspects of EVs seem making them very appealing (e.g. very low energy cost and zero tail pipe emissions) there are several concerns that people have on this technology:
• Range anxiety: Because of the limited range of EVs caused by the current relatively low capacity of batteries, the freedom of the driver, one of the major reasons to own a vehicle, is limited
• EVs require a significantly higher initial investment cost than vehicles with common combustion engines due to the high cost of the energy storage (battery)
• The EV batteries need to recharge frequently and hence the driver has to find suitable recharging stations and has to plan the routes accordingly
The charging process itself is very time consuming and hence user-unfriendly
3.1.2 Inductive charging
This offers several advantages over the conductive (using a cable) charging method:
• It is easily operated and comfortable due to the automation of the charging process
• Since there is no need to plug-in a cable the driver will not have to get out of the car and get his hands dirty especially in rainy, snowy or muddy environments (which also do not affect the wire-less inductive charging process).
• There is no risk that the user forgets to plug in the vehicle at the end of the parking, losing the capability of a fit range for the following use of the car
• The system is safe against vandalism, misuse/abuse and environmental influences (e.g. humidi-ty) because all devices are encapsulated in the vehicle and the ground
• There is no negative impact on the cityscape (all devices are hidden in the ground)
• Without having to manually connect the vehicle to the grid the availability of the EV for vehicle-to-grid applications (V2G) is higher (e.g. for using the vehicle’s battery to store excess energy in the grid)
These above mentioned advantages already prove the usefulness of (stationary ) inductive charging compared to the currently more common conductive charging infrastructure. However inductive charging will offer many more possibilities in the future, especially concerning en-route charging.
3.1.3 The potential of inductive en-route charging
With inductive en-route charging, EVs could be charged while standing at the traffic light, the bus stop or the taxi stand while it should be impracticable with the conductive charging option. So, using wireless inductive charging, these short timeframes could be used to charge the EV and hence its range. The charging method above is called “static inductive en-route charging” because the vehicle is standing still while charging.
In addition, there is also the possibility to charge the vehicle while it is actually moving. This charging method is called “dynamic inductive en-route charging”. This charging method holds the potential of giv-ing the driver virtually limitless range as long as he stays on paths specifically adapted for dynamic induc-tive en-route charging. This could lead to a reduction of battery size or the use of capacitors which would both lower the weight and the cost for the vehicle. The impact on the infrastructure has to be taken into

UNPLUGGED 07.05.2015
UNPLUGGED Publishable Final Report.docx Page 10 of 68
account, so it has to be evaluated if or when, dynamic inductive charging is needed and preferable to only static inductive charging.
UNPLUGGED project aimed to investigate how the use of inductive charging of Electric Vehicles (EV) in urban environments improves the convenience and sustainability of car-based mobility. In particular, it was investigated how smart inductive charging infrastructure could facilitate full EV integration in the ur-ban road systems while improving customer acceptance and perceived practicality. UNPLUGGED achieved these goals by examining in detail the technical feasibility, practical issues, interoperability, user perception and socio-economic impacts of inductive charging. As one special variant, inductive en-route charging was investigated thoroughly.

UNPLUGGED 07.05.2015
UNPLUGGED Publishable Final Report.docx Page 11 of 68
4 Project results
4.1 3,7 kW charging system
During the trials, the system was tested for efficiency. Numerous components are involved in the induc-tive energy transmission. The system can be divided into two basic groups namely the primary side and the secondary side. The primary side consists of the inverter, the capacitor and the transmitting coil. The inverter prepares the energy provided by the mains network for the oscillating circuit. The capacitor and the transmitting coil form the oscillating circuit for the inductive transmission. On the secondary side the magnetic field is taken up by the coil which in turn resonates with the capacitor. A rectifier then converts the energy so that it can be stored in the battery. Current flows through all these components involved in the process. Since the components are not ideal, they are prone to losses i.e. every component loses a small part of the energy in the form of for e.g. heat. To estimate these losses, measurements were con-ducted. Since it is not possible to measure all the components during operation, their losses were deter-mined by calculation. For this purpose, the series resistances were determined using an LCR meter. To control the system, currents on the primary and secondary side were measured. Using the currents and the parasitic resistances, the losses in each component can be determined.
The transmission parameters are listed in the following table (Figure 1). The primary power of 2453 W can be seen which can be calculated from the primary current and voltage. Similarly, the output power is 2012 W. Thus, the power loss is 441 W.
Uprim[V] Iprim[A] Pprim[W] Ploss[W]
310,6 7,9 2453,74 441,34
Usec[V] Isec[A] Psec[W] Efficiency [%]
223,6 9,0 2012,4 82,01 Figure 1: Transmission parameters
With the help of these values, the 441W power loss can be distributed as below (Figure 2). It can be seen that most of the heat losses occur in the inverter, primary coil and the primary capacitor. On the second-ary side, only 64 W of the transmitted power is lost.
Component Ploss[W]
CPrim 93,6
LPrim 122,32
LSec 11,34
CSec 22,92
Rectifier 10,8
Inverter 169,54 Figure 2: Power losses of each component
The losses can be expressed with respect to the complete system in the table Figure 3. It can be seen that almost 14% of the losses occur on the primary side.
Component Ploss[%]
CPrim 3.82%
LPrim 4.99%
LSec 0.46%
CSec 0.93%
Rectifier 0.44%
Inverter 6.91% Figure 3: Power losses of each component corresponding to the input power
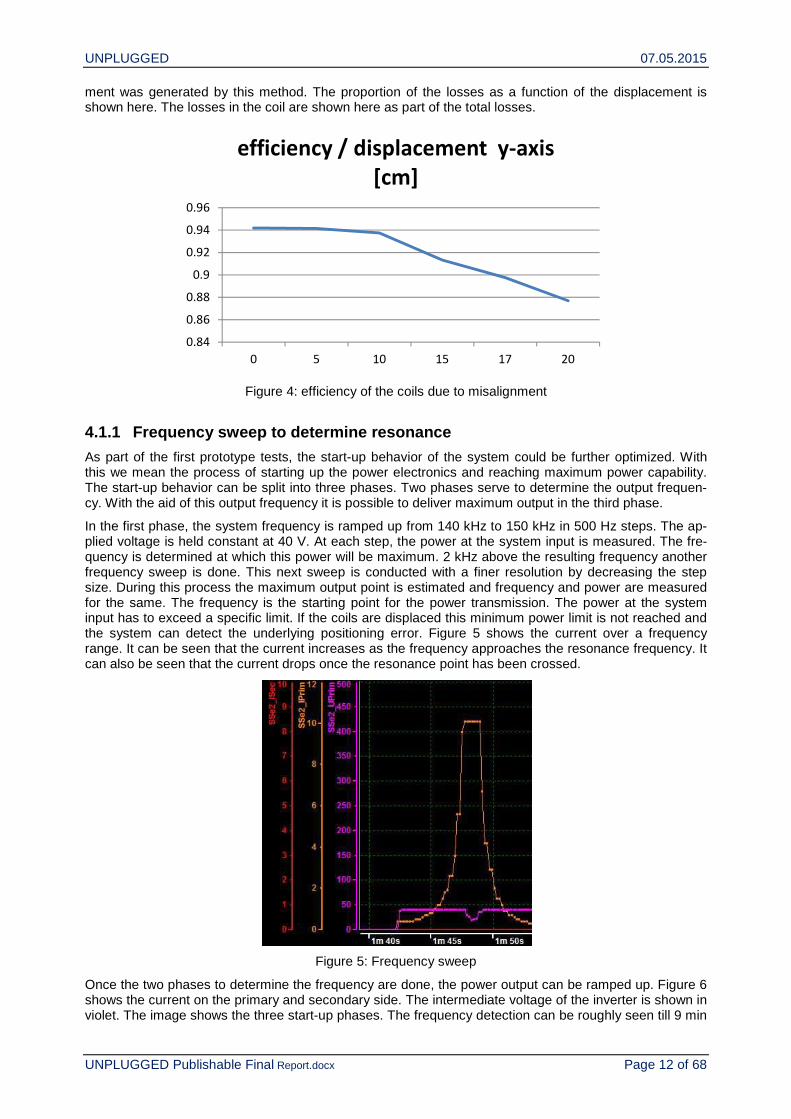
If the same procedure is followed, individual components can also be measured for e.g. with respect to coil displacement. The following graph (Figure 4) of the losses in the coils as a function of the displace-
UNPLUGGED 07.05.2015
UNPLUGGED Publishable Final Report.docx Page 12 of 68
ment was generated by this method. The proportion of the losses as a function of the displacement is shown here. The losses in the coil are shown here as part of the total losses.
Figure 4: efficiency of the coils due to misalignment
4.1.1 Frequency sweep to determine resonance
As part of the first prototype tests, the start-up behavior of the system could be further optimized. With this we mean the process of starting up the power electronics and reaching maximum power capability. The start-up behavior can be split into three phases. Two phases serve to determine the output frequen-cy. With the aid of this output frequency it is possible to deliver maximum output in the third phase.
In the first phase, the system frequency is ramped up from 140 kHz to 150 kHz in 500 Hz steps. The ap-plied voltage is held constant at 40 V. At each step, the power at the system input is measured. The fre-quency is determined at which this power will be maximum. 2 kHz above the resulting frequency another frequency sweep is done. This next sweep is conducted with a finer resolution by decreasing the step size. During this process the maximum output point is estimated and frequency and power are measured for the same. The frequency is the starting point for the power transmission. The power at the system input has to exceed a specific limit. If the coils are displaced this minimum power limit is not reached and the system can detect the underlying positioning error. Figure 5 shows the current over a frequency range. It can be seen that the current increases as the frequency approaches the resonance frequency. It can also be seen that the current drops once the resonance point has been crossed.
Figure 5: Frequency sweep
Once the two phases to determine the frequency are done, the power output can be ramped up. Figure 6 shows the current on the primary and secondary side. The intermediate voltage of the inverter is shown in violet. The image shows the three start-up phases. The frequency detection can be roughly seen till 9 min
0.84
0.86
0.88
0.9
0.92
0.94
0.96
0 5 10 15 17 20
efficiency / displacement y-axis
[cm]

UNPLUGGED 07.05.2015
UNPLUGGED Publishable Final Report.docx Page 13 of 68
40 sec. The rising and falling of the primary current can be seen clearly. At 9 min 42 sec it can be seen that the frequency is set at 2 kHz above the roughly determined resonance frequency and the second phase follows. This happens at the same intermediate voltage. Just before 9 min 50 sec, the intermediate voltage is increased after checking the input voltage. The intermediate voltage is increased in steps. The frequency is adjusted after every step. The frequency adjustment is done till a justifiable level of power loss is reached. Following this, an additional step is taken. Thus the start-up phase can have varying du-rations based on the position, requested power and other parameters. The process was chosen for the prototype stage to develop a robust and safe system. If parameters stay constant during series produc-tion, the start-up phase can be further optimized. The poses the question for e.g. of it is sufficient to limit the frequency range to143 - 148 kHz instead of 140 - 150 kHz.
Figure 6: Power delivery start up phase
4.1.2 Frequency alteration due to system warm up
To achieve a maximum efficiency for the power transfer the major aspect is to operate the system in its resonance frequency. The exact frequency is, amongst other conditions, depending on the gap between the coils and the misalignment in driving and cross direction. As these parameter differ for each parking approach and different loading of the vehicle the resonance frequency is not fixed for a system or vehicle but needs to be determined at the beginning of each charging process. This is done by a frequency sweep and assessment of the actual losses.
Beside the geometrical parameters the electrical values of the resonance circuit are crucial for the reso-nance frequency. In detail this are mainly the resistance and the capacity of the capacitors and the re-sistance of the coil.
As the electrical components warm up due to the electric losses during the charging process the actual resonance frequency of the collective inductive system is constantly changing. These changes are not negligible as they may exceed 5% in respect to the inertial frequency. Without consideration of this aspect the system would waste energy as it is not operating in an optimal operating point.
Therefore the control algorithm in the primary side of the system is constantly monitoring the losses and thus the efficiency of the charging process and adapts the frequency if necessary. It is important to con-sider this when dimensioning the system as one needs to provide a potential frequency band that is wide enough to react to the frequency shifting.
4.1.3 Dimensioning of the rectifier
On the vehicle side the rectifier is one of the major parts of the inductive charging power system. Its func-tion is to convert the alternating current from the pickup coil to direct current that can be feed into the vehicle power net. It mainly consists of a bridge rectifier build from four diodes.
The nominal Voltage of the Fiat 500 is about 255 V. So the operating voltage of the rectifier and thus the diodes are a little bit higher at about 260 V. During operating the system higher voltages may occur. These peaks are caused by transient effects like fast load changing. There high is depending on the ac-

UNPLUGGED 07.05.2015
UNPLUGGED Publishable Final Report.docx Page 14 of 68
tual state of the system. Especially during test phase when sometimes no load is applied to the second-ary side the risk of high voltage peaks is high. This aspect is important to take into account when dimen-sioning the components of the rectifier.
Therefore diodes where chosen that are capable to work with 600 V, nearly twice the nominal voltage. Additional a capacitor was applied to filter and thus reduce the maximum peak voltage.
During operation of the system it turned out to be not enough. Figure 7 shows a picture of the burned diodes of the rectifier. As a consequence the diodes where replaced with diodes capable to work at up to 1,200 V.
Figure 7: Burned diodes of the rectifier
4.1.4 Conclusions of the vehicle integration
Regarding the integration of the charging system two aspects have to be considered: the mechanical and the logical integration. In the UNPLUGGED project the system had to be integrated into an existing vehi-cle, a Fiat 500. This vehicle has been converted from a conventional, commercial available vehicle equipped with a combustion engine to an electric vehicle before.
Two different aspects follow from this processing of the vehicle. On the one hand for the mechanical inte-gration only the space was available that has not already been used for the components needed for the electrification. The electric power train and the high-voltage battery normally use more space than the original combustion engine. As a result the procedure for mounting (and demounting) the components is quite laborious and some problems with the laying of the cables occurred (s. Figure 8: cable damaged due to a collision with a metal part of the construction).
Figure 8: Damaged cable due to inconvenient mounting construction
On the other hand the data integration of the electric drive train into the vehicle network architecture is not very deep and the logic for the electric charging is quite simple. As for the integration of the inductive charging system the original system needs to be manipulated that is an optimal situation as a simple ar-

UNPLUGGED 07.05.2015
UNPLUGGED Publishable Final Report.docx Page 15 of 68
chitecture is easier to manipulate. For the UNPLUGGED project information about the build in conductive charger where available and the inductive system was designed to replace this charger. A simultaneous operation of the conductive and inductive charger presupposes a management instance that coordinates the energy flow. The demand for charging power announced from the high voltage battery needs to be distributed in an efficient way between the two charging system. This was not implemented within the UNPLUGGED project.
These questions are of no interest if the inductive charging system is considered by the car manufacturer and sold with the vehicle or as optional equipment. In this case suitable space will be reserved for an adapted component. In general the space needed for a 3.7 kW secondary side like the one build up in the project is small enough so that it should be available if considered during the design of the vehicle. IT interfaces will be designed to make sure the system integrates with the vehicle functions.
For inductive charging systems aiming for the aftermarket the initial situation is comparable to the UNPLUGGED project or, regarding the data integration, worse. Additionally a system for the aftermarket would be cheaper if it would fit for different vehicles with only few adoptions. The main challenge here is not the coil that can be build quite flat even including the housing. But the power electronics should be placed near the coil due to EMC and efficiency reasons. As the high voltage battery is often placed at a large area of the underbody it might not be possible to install it.
For the electrical and IT integration for a commercial solution it is not feasible to remove the conductive charger. The customer will not accept to reduce its charging possibilities to only the inductive system in medium term. Thus a different interface than that of the on-board charger should be used. One possibility would be to use the DC-Charging Interface, both the power and the data part. In that case the secondary side of the inductive system would simulate a standardised DC charging interface, e.g. CHADEMO or CCS.
4.1.5 Summary and outlook
The efficiency of the implemented system can be improved by fitting it to the specific vehicle. This applies to the system voltage and the dimensioning of the electric parameters. Additionally the start procedure for the charging can be accelerated by adapting the control parameter. This was not done to be able to moni-tor the sequence and be able to intervene if necessary due to the prototype character of the system.
The mentioned monitoring of the losses during the charging process can possibly be used to detect for-eign objects between the coils. This could help to prevent damage to the vehicle from ignited items or harm of animals. Likewise it is conceivable that it can be used to qualify the exact positioning of the sec-ondary coil above the primary coil. Further investigations are needed here.
The next step to get a commercial system is to analyze the robustness of the secondary side of the induc-tive charging system in terms of automotive requirements. Especially the mechanical robustness to typi-cal vibrations occurring in vehicles should be tested in a long term test.
4.2 50 kW System
The design of the charger considers two different vehicles, with different restrictions and conditions; the charger is able to give full power (50 kW) to both, trying to make the charger as flexible as possible. The fundamental parameters for the studied vehicles are shown in Table 1:
Vehicle 1 Air gap: 0.18 to 0.234m Selected coil size 0.3×0.4m Distance between 25 kW units: 0.25m Battery Voltage: minimum 259 V rated 355 V maximum 380 V Maximum misalignment
Vehicle 2 Air gap: 0.2 to 0.25m Selected coil size 0.3×0.4m Distance between 25 kW units : 0.25m Battery Voltage: minimum 700 V rated 750 V Maximum misalignment ±0.1m x-direction and ±0.13 m
UNPLUGGED 07.05.2015
UNPLUGGED Publishable Final Report.docx Page 16 of 68
±0.1m x-direction and ±0.13 m y-direction.
y-direction
Table 1. Vehicles rated parameters.
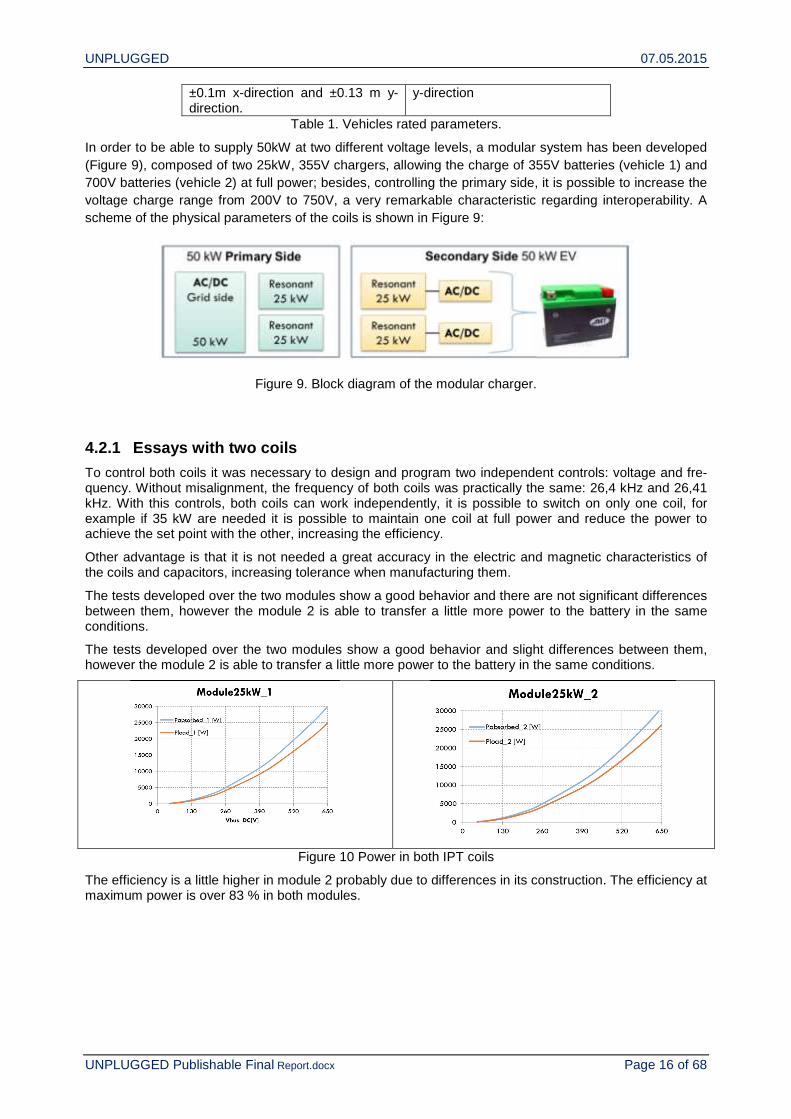
In order to be able to supply 50kW at two different voltage levels, a modular system has been developed (Figure 9), composed of two 25kW, 355V chargers, allowing the charge of 355V batteries (vehicle 1) and 700V batteries (vehicle 2) at full power; besides, controlling the primary side, it is possible to increase the voltage charge range from 200V to 750V, a very remarkable characteristic regarding interoperability. A scheme of the physical parameters of the coils is shown in Figure 9:
Figure 9. Block diagram of the modular charger.
4.2.1 Essays with two coils
To control both coils it was necessary to design and program two independent controls: voltage and fre-quency. Without misalignment, the frequency of both coils was practically the same: 26,4 kHz and 26,41 kHz. With this controls, both coils can work independently, it is possible to switch on only one coil, for example if 35 kW are needed it is possible to maintain one coil at full power and reduce the power to achieve the set point with the other, increasing the efficiency.
Other advantage is that it is not needed a great accuracy in the electric and magnetic characteristics of the coils and capacitors, increasing tolerance when manufacturing them.
The tests developed over the two modules show a good behavior and there are not significant differences between them, however the module 2 is able to transfer a little more power to the battery in the same conditions.
The tests developed over the two modules show a good behavior and slight differences between them, however the module 2 is able to transfer a little more power to the battery in the same conditions.
Figure 10 Power in both IPT coils
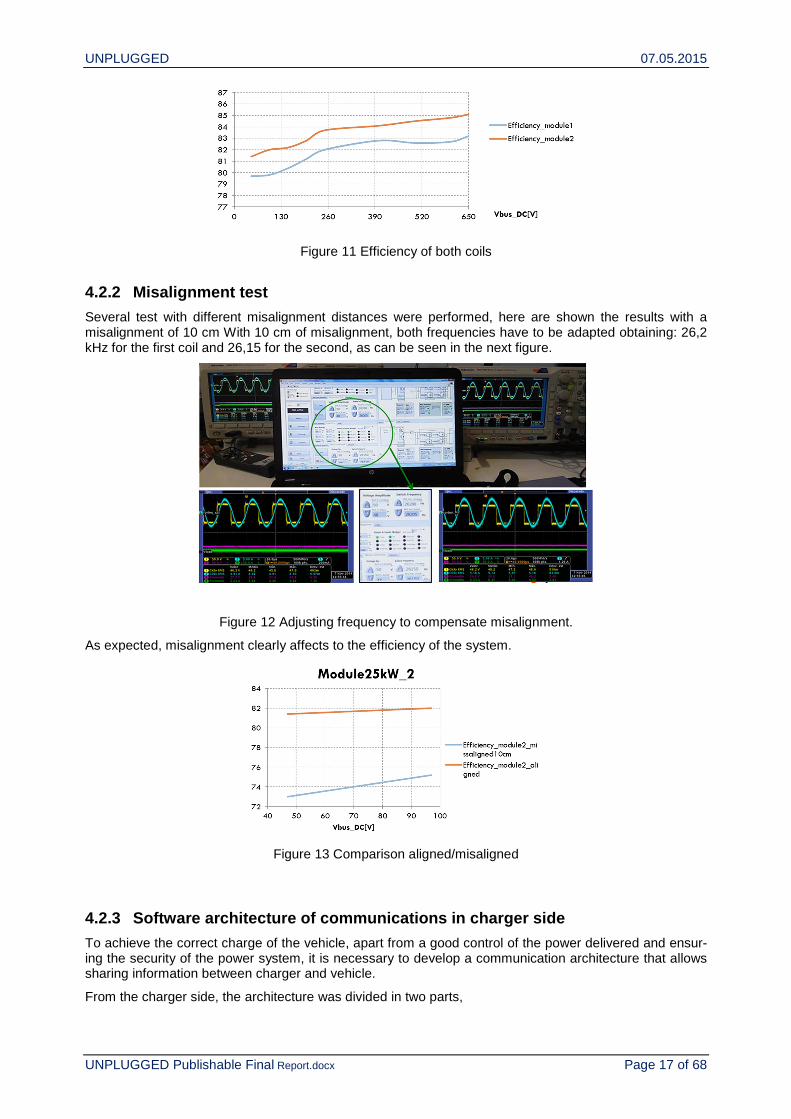
The efficiency is a little higher in module 2 probably due to differences in its construction. The efficiency at maximum power is over 83 % in both modules.
UNPLUGGED 07.05.2015
UNPLUGGED Publishable Final Report.docx Page 17 of 68
Figure 11 Efficiency of both coils
4.2.2 Misalignment test
Several test with different misalignment distances were performed, here are shown the results with a misalignment of 10 cm With 10 cm of misalignment, both frequencies have to be adapted obtaining: 26,2 kHz for the first coil and 26,15 for the second, as can be seen in the next figure.
Figure 12 Adjusting frequency to compensate misalignment.
As expected, misalignment clearly affects to the efficiency of the system.
Figure 13 Comparison aligned/misaligned
4.2.3 Software architecture of communications in ch arger side
To achieve the correct charge of the vehicle, apart from a good control of the power delivered and ensur-ing the security of the power system, it is necessary to develop a communication architecture that allows sharing information between charger and vehicle.
From the charger side, the architecture was divided in two parts,
UNPLUGGED 07.05.2015
UNPLUGGED Publishable Final Report.docx Page 18 of 68
• Communication protocol between charger and vehicle: In the charger a specific system was de-veloped to communicate with Continental modules via CAN communication. Some timeouts were added to avoid problems with the power control; the identifier of the user was defined to follow the e-Mobility ID format (eMA-ID) and the communication process was modified in some points to allow the correct integration of the protocol with the rest of the units
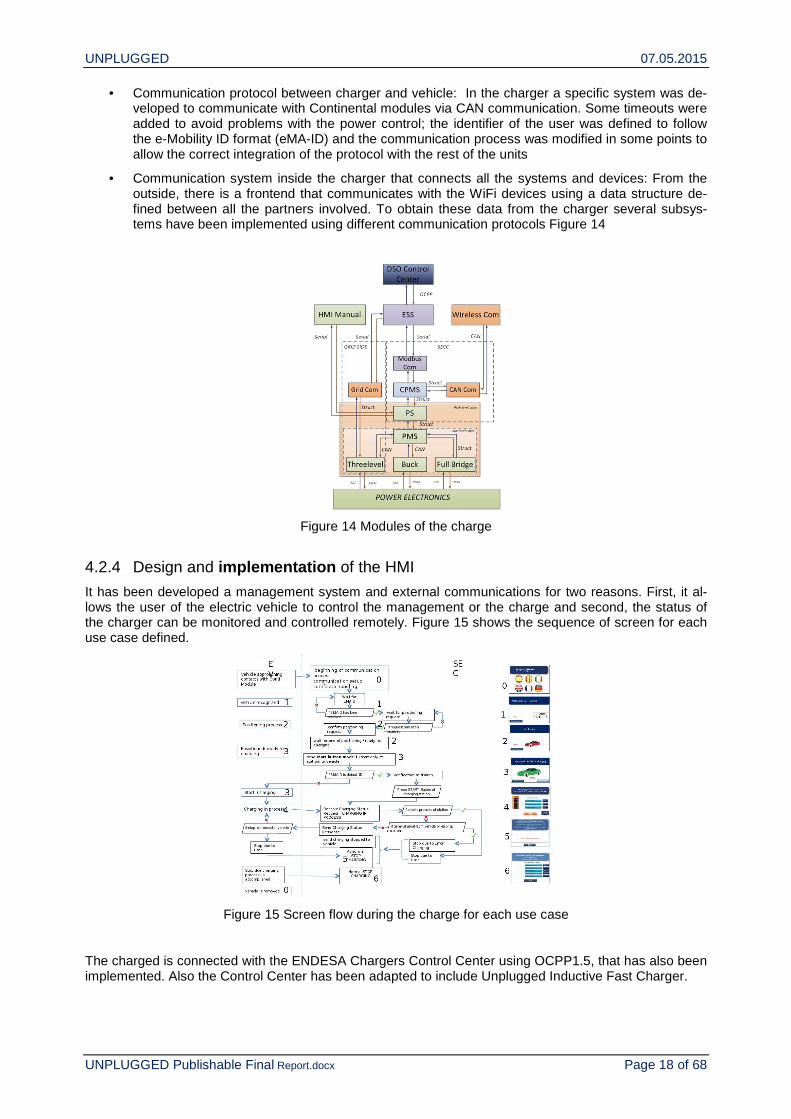
• Communication system inside the charger that connects all the systems and devices: From the outside, there is a frontend that communicates with the WiFi devices using a data structure de-fined between all the partners involved. To obtain these data from the charger several subsys-tems have been implemented using different communication protocols Figure 14
Figure 14 Modules of the charge
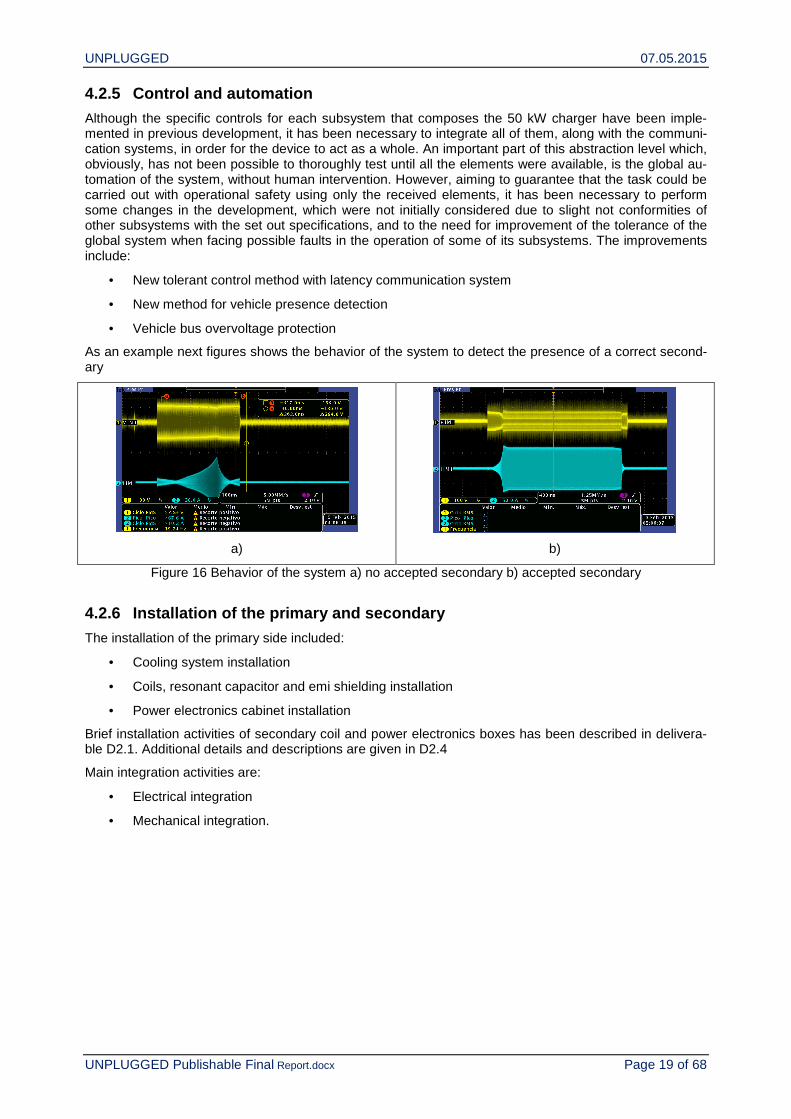
4.2.4 Design and implementation of the HMI
It has been developed a management system and external communications for two reasons. First, it al-lows the user of the electric vehicle to control the management or the charge and second, the status of the charger can be monitored and controlled remotely. Figure 15 shows the sequence of screen for each use case defined.
Figure 15 Screen flow during the charge for each use case
The charged is connected with the ENDESA Chargers Control Center using OCPP1.5, that has also been implemented. Also the Control Center has been adapted to include Unplugged Inductive Fast Charger.
UNPLUGGED 07.05.2015
UNPLUGGED Publishable Final Report.docx Page 19 of 68
4.2.5 Control and automation
Although the specific controls for each subsystem that composes the 50 kW charger have been imple-mented in previous development, it has been necessary to integrate all of them, along with the communi-cation systems, in order for the device to act as a whole. An important part of this abstraction level which, obviously, has not been possible to thoroughly test until all the elements were available, is the global au-tomation of the system, without human intervention. However, aiming to guarantee that the task could be carried out with operational safety using only the received elements, it has been necessary to perform some changes in the development, which were not initially considered due to slight not conformities of other subsystems with the set out specifications, and to the need for improvement of the tolerance of the global system when facing possible faults in the operation of some of its subsystems. The improvements include:
• New tolerant control method with latency communication system
• New method for vehicle presence detection
• Vehicle bus overvoltage protection
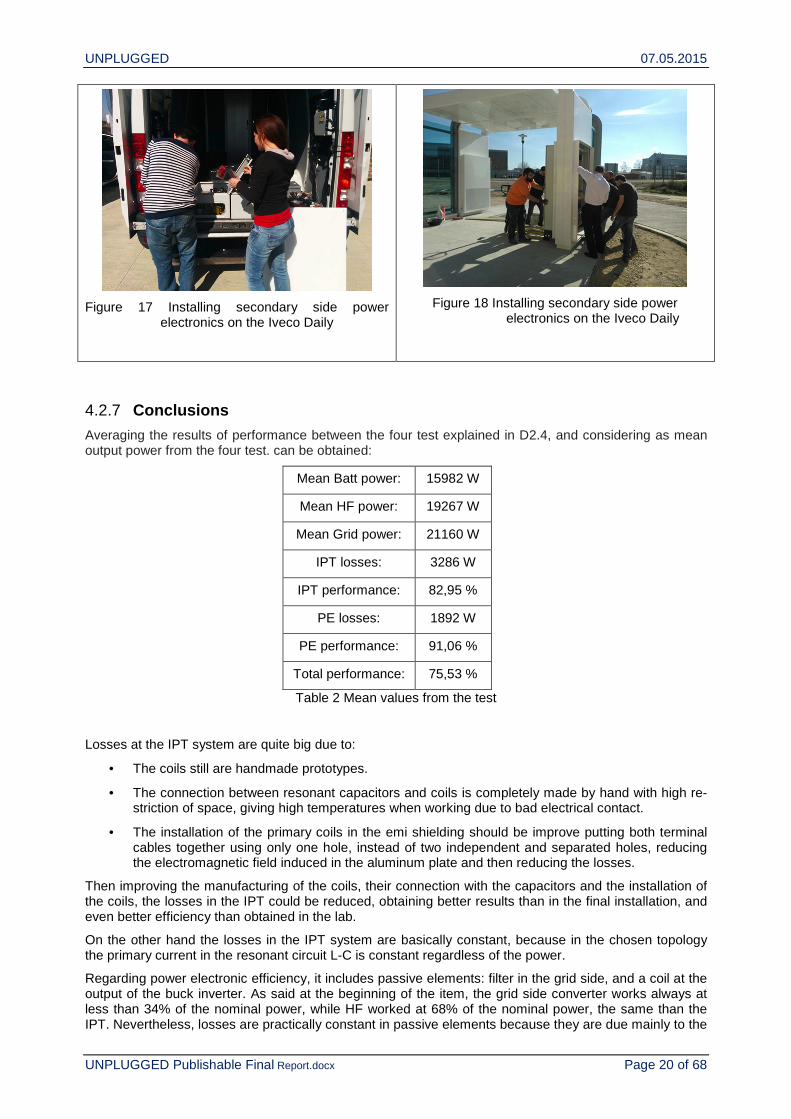
As an example next figures shows the behavior of the system to detect the presence of a correct second-ary
a)
b)
Figure 16 Behavior of the system a) no accepted secondary b) accepted secondary
4.2.6 Installation of the primary and secondary
The installation of the primary side included:
• Cooling system installation
• Coils, resonant capacitor and emi shielding installation
• Power electronics cabinet installation
Brief installation activities of secondary coil and power electronics boxes has been described in delivera-ble D2.1. Additional details and descriptions are given in D2.4
Main integration activities are:
• Electrical integration
• Mechanical integration.
UNPLUGGED 07.05.2015
UNPLUGGED Publishable Final Report.docx Page 20 of 68
Figure 17 Installing secondary side power electronics on the Iveco Daily
Figure 18 Installing secondary side power electronics on the Iveco Daily
4.2.7 Conclusions
Averaging the results of performance between the four test explained in D2.4, and considering as mean output power from the four test. can be obtained:
Mean Batt power: 15982 W
Mean HF power: 19267 W
Mean Grid power: 21160 W
IPT losses: 3286 W
IPT performance: 82,95 %
PE losses: 1892 W
PE performance: 91,06 %
Total performance: 75,53 %
Table 2 Mean values from the test
Losses at the IPT system are quite big due to:
• The coils still are handmade prototypes.
• The connection between resonant capacitors and coils is completely made by hand with high re-striction of space, giving high temperatures when working due to bad electrical contact.
• The installation of the primary coils in the emi shielding should be improve putting both terminal cables together using only one hole, instead of two independent and separated holes, reducing the electromagnetic field induced in the aluminum plate and then reducing the losses.
Then improving the manufacturing of the coils, their connection with the capacitors and the installation of the coils, the losses in the IPT could be reduced, obtaining better results than in the final installation, and even better efficiency than obtained in the lab.
On the other hand the losses in the IPT system are basically constant, because in the chosen topology the primary current in the resonant circuit L-C is constant regardless of the power.
Regarding power electronic efficiency, it includes passive elements: filter in the grid side, and a coil at the output of the buck inverter. As said at the beginning of the item, the grid side converter works always at less than 34% of the nominal power, while HF worked at 68% of the nominal power, the same than the IPT. Nevertheless, losses are practically constant in passive elements because they are due mainly to the
UNPLUGGED 07.05.2015
UNPLUGGED Publishable Final Report.docx Page 21 of 68
ripple of the current, and the ripple reduces as the power increases. On the other hand losses in the pow-er electronics components increase with the current. At this point in order to obtain some figures giving 50 kW to the battery, it has been considered: IPT losses are the doubled due to there are two coils working: 6572 W; losses at the passive elements of the filter side are constant, while the losses due to the buck coil is doubled, and finally, losses at the electronics components are doubled, giving 3513 W. With this, total losses are estimated at 9725 W. The next table shows the estimated values considered at 50 kW.
Batt power: 50.000 W
HF power: 56572 W
Grid power: 59725 W
IPT losses: 6572 W
IPT performance: 88,38 %
PE losses: 3153 W
PE performance: 94,7 %
Total performance: 83,71 %
Table 3 Estimated values at 50 kW
4.3 Communication concept
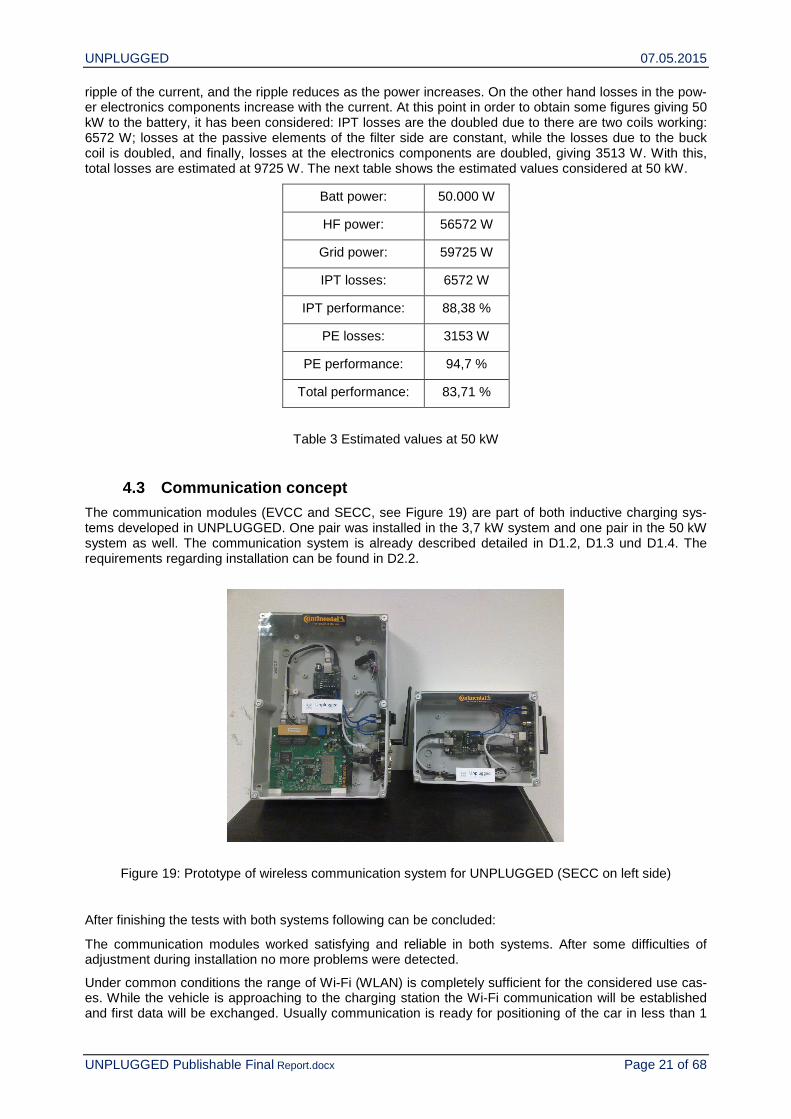
The communication modules (EVCC and SECC, see Figure 19) are part of both inductive charging sys-tems developed in UNPLUGGED. One pair was installed in the 3,7 kW system and one pair in the 50 kW system as well. The communication system is already described detailed in D1.2, D1.3 und D1.4. The requirements regarding installation can be found in D2.2.
Figure 19: Prototype of wireless communication system for UNPLUGGED (SECC on left side)
After finishing the tests with both systems following can be concluded:
The communication modules worked satisfying and reliable in both systems. After some difficulties of adjustment during installation no more problems were detected.
Under common conditions the range of Wi-Fi (WLAN) is completely sufficient for the considered use cas-es. While the vehicle is approaching to the charging station the Wi-Fi communication will be established and first data will be exchanged. Usually communication is ready for positioning of the car in less than 1

UNPLUGGED 07.05.2015
UNPLUGGED Publishable Final Report.docx Page 22 of 68
second. Further data, e.g. for identification, authentication and authorization will be exchanged during the car is positioning at the charging station. Commonly positioning takes much more time than communica-tion needs for data transfer.
After the car is positioned and a confirmation by the driver technical data needed for charging procedure will be exchanged (see Figure 20) and the charging procedure itself could start. During charging a contin-uous data exchange takes place (cycle time approx. 100 ms). When charging is completed the communi-cation stops and the Wi-Fi channel will be released for other vehicles.
Figure 20: Example of a communication protocol of wireless communication
For future applications we recommend special attention should be given to fault tolerance of the commu-nication. In general wireless communications can be interfered and thus less reliable than wired commu-nications are.
Following aspects should be considered. For some applications (e.g. huge parking areas, parking garag-es) can be expected that one base station has to handle many cars and many parking lots for inductive charging. Additionally many other devices not relevant for inductive charging (other vehicles, computers, smartphones and so on) but with Wi-Fi interfaces will be nearby. All these devices have to share the available Wi-Fi channels. This means communication partners have to change their Wi-Fi channel from time to time and this change needs time. Beside these system inherent delays “real” interferences from environment can occur. Summarized interrupts of the Wi-Fi connection from several 100 milliseconds to seconds cannot be excluded.
A measure to mitigate these difficulties would be a second communication channel, e.g. a low level com-munication directly by the coils. This second communication channel could raise not only availability and reliability, but could be useful also for reasons of safety and security. In this way a secure pairing between user, vehicle and a defined primary charging coil could be realized for instance. Possibly safety and secu-rity requirements make a second communication channel indispensable for commercial applications.
UNPLUGGED 07.05.2015
UNPLUGGED Publishable Final Report.docx Page 23 of 68
4.4 EMC Aspects
4.4.1 EMC outside the vehicle
The purpose of the EMC measurements outside the vehicle was to measure the magnetic field (B-field) emissions coming from the inductive charging system outside the vehicle and check their compliance against ICNIRP 98 and ICNIRP 2010 guidelines.
To understand the effect of the vehicle’s body on the magnetic field, the tests were divided into 2 parts:
1. Measurement of the magnetic field at system level (Only the inductive charging system outside the vehicle body).
2. Measurement of the magnetic field at vehicle level (The inductive charging system installed inside the test vehicle).
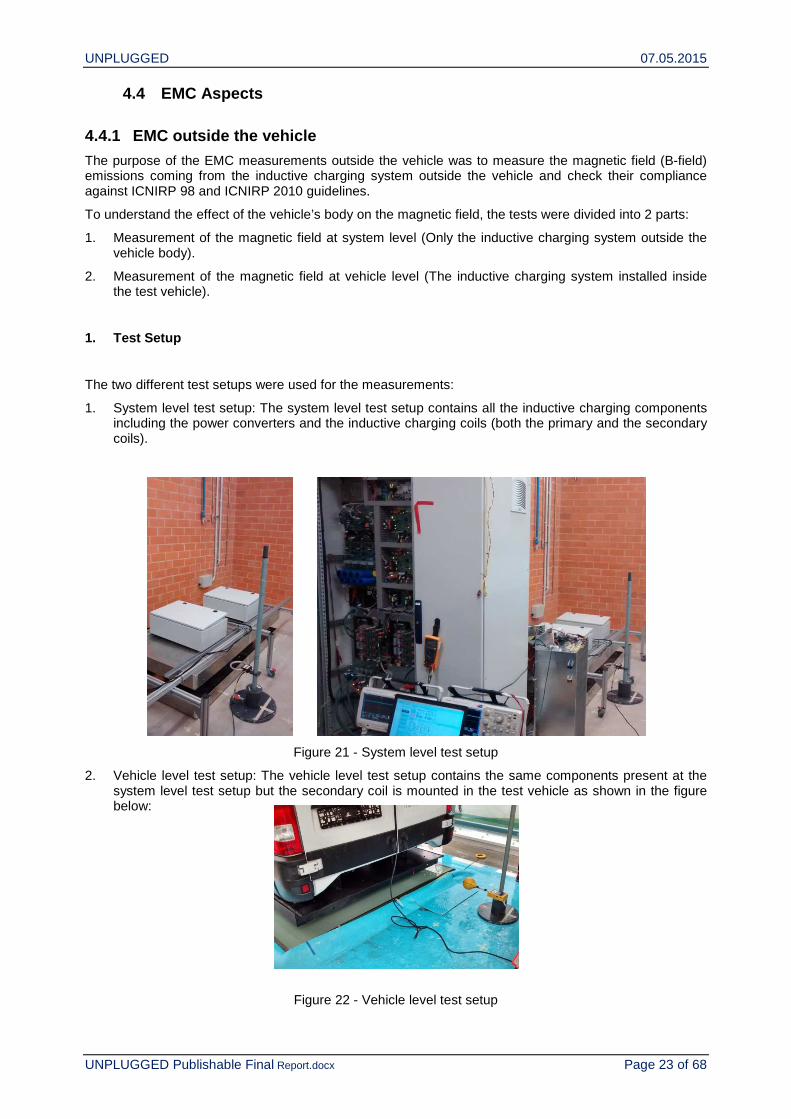
1. Test Setup
The two different test setups were used for the measurements:
1. System level test setup: The system level test setup contains all the inductive charging components including the power converters and the inductive charging coils (both the primary and the secondary coils).
Figure 21 - System level test setup
2. Vehicle level test setup: The vehicle level test setup contains the same components present at the system level test setup but the secondary coil is mounted in the test vehicle as shown in the figure below:
Figure 22 - Vehicle level test setup

UNPLUGGED 07.05.2015
UNPLUGGED Publishable Final Report.docx Page 24 of 68
2. Measurement Procedure and Results
Due to the prototype nature of the EUT (Equipment Under Test) and the available testing time, same kinds of tests could not be repeated on both the test setups.
An overview of the measurement procedures and the obtained results is provided in the below sections:
System level Measurements:
As the equipment was not yet fitted with the refrigeration system, it was not possible to measure the emissions at full power for more than 2 minutes. Hence, the measurement was split into two parts. First the B-field measurements were taken at 50% of the coils full power to search for the points with maximum emissions using an isotropic field probe and then a loop antenna was used to take the frequency domain measurements at full power at the 4 identified maximum emission points.
1. Maximum emission points determination using isotropic B-field probe at 50% power
• The inductive charging system was turned on at 50% power (30A current in each coil)
• An isotropic field probe was used to measure the B-field emissions at all the points shown in the below diagram:
Figure 23 - Measurement points
• 4 points with the highest emissions were identified (x=0.5, y=-0.5, Z=0.2), (x=0.5, y=0.5, Z=0.2), (x=-1, y=-0.5, Z=0.2), (x=1, y=-0.5, Z=0.2).
2. Frequency domain measurements against ICNIRP guidelines at full power
• Finally, a loop antenna was used to measure the emissions at the above 4 points in the frequency domain (20 Hz to 10MHz) at full power (60A current in each coil).
System level Results:
y
x
x=0m
x=0.5m
x=1m
x=1.5m
y=0m y=0.5m y=1m y=1.5m
x=2m
y=-0.5my=-1my=-1.5m
yz
z
y
Z=0.2m
Z=1m
Z=0.5m
Z=0.0m
y
x
yz
z
y
Z=0.2m
Z=1m
Z=0.5m
Z=0.0m
UNPLUGGED 07.05.2015
UNPLUGGED Publishable Final Report.docx Page 25 of 68
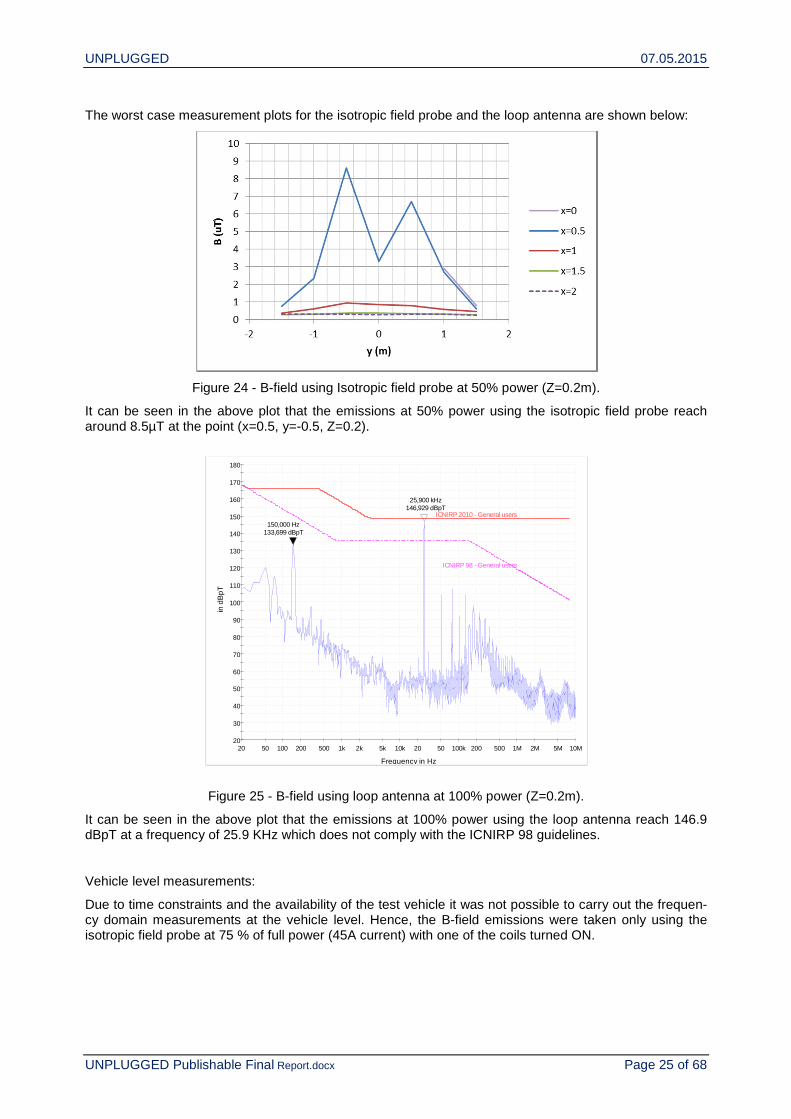
The worst case measurement plots for the isotropic field probe and the loop antenna are shown below:
Figure 24 - B-field using Isotropic field probe at 50% power (Z=0.2m).
It can be seen in the above plot that the emissions at 50% power using the isotropic field probe reach around 8.5µT at the point (x=0.5, y=-0.5, Z=0.2).
Figure 25 - B-field using loop antenna at 100% power (Z=0.2m).
It can be seen in the above plot that the emissions at 100% power using the loop antenna reach 146.9 dBpT at a frequency of 25.9 KHz which does not comply with the ICNIRP 98 guidelines.
Vehicle level measurements:
Due to time constraints and the availability of the test vehicle it was not possible to carry out the frequen-cy domain measurements at the vehicle level. Hence, the B-field emissions were taken only using the isotropic field probe at 75 % of full power (45A current) with one of the coils turned ON.
20
30
40
50
60
70
80
90
100
110
120
130
140
150
160
170
180
20 50 100 200 500 1k 2k 5k 10k 20 50 100k 200 500 1M 2M 5M 10M
in
dB
pT
Frequency in Hz
ICNIRP 2010 - General users
ICNIRP 98 - General users
25,900 kHz146,929 dBpT
150,000 Hz133,699 dBpT
UNPLUGGED 07.05.2015
UNPLUGGED Publishable Final Report.docx Page 26 of 68
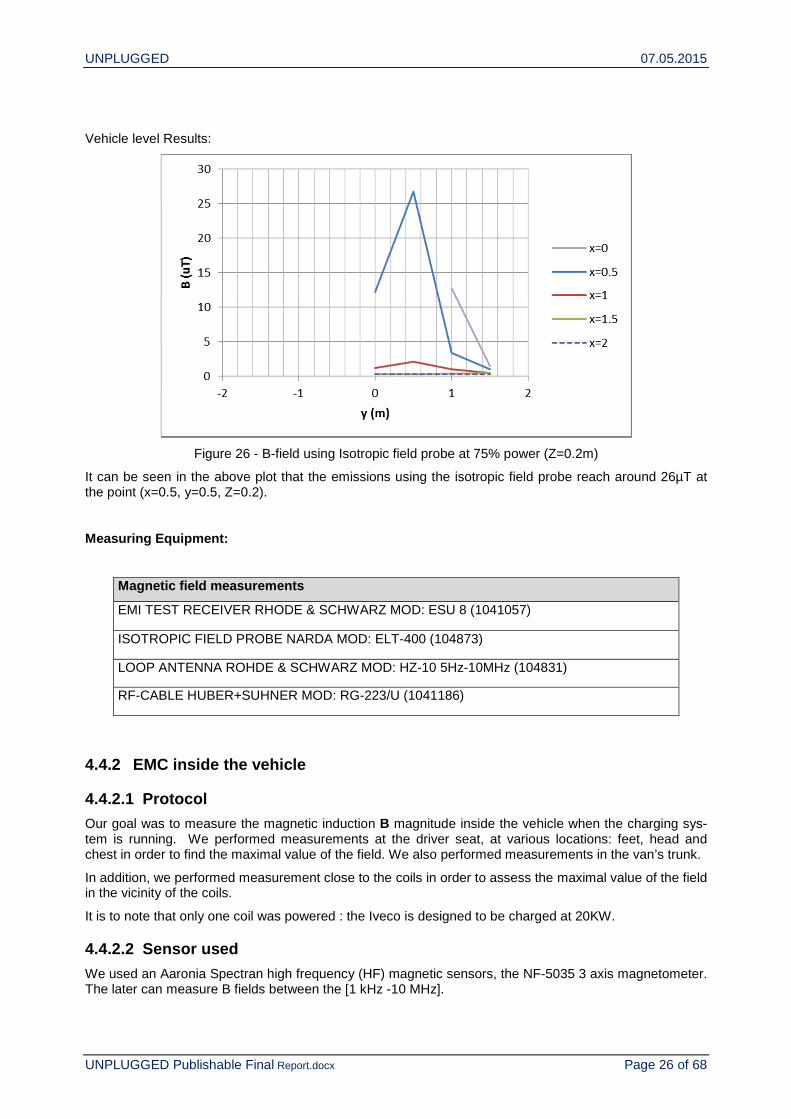
Vehicle level Results:
Figure 26 - B-field using Isotropic field probe at 75% power (Z=0.2m)
It can be seen in the above plot that the emissions using the isotropic field probe reach around 26µT at the point (x=0.5, y=0.5, Z=0.2).
Measuring Equipment:
Magnetic field measurements
EMI TEST RECEIVER RHODE & SCHWARZ MOD: ESU 8 (1041057)
ISOTROPIC FIELD PROBE NARDA MOD: ELT-400 (104873)
LOOP ANTENNA ROHDE & SCHWARZ MOD: HZ-10 5Hz-10MHz (104831)
RF-CABLE HUBER+SUHNER MOD: RG-223/U (1041186)
4.4.2 EMC inside the vehicle
4.4.2.1 Protocol
Our goal was to measure the magnetic induction B magnitude inside the vehicle when the charging sys-tem is running. We performed measurements at the driver seat, at various locations: feet, head and chest in order to find the maximal value of the field. We also performed measurements in the van’s trunk.
In addition, we performed measurement close to the coils in order to assess the maximal value of the field in the vicinity of the coils.
It is to note that only one coil was powered : the Iveco is designed to be charged at 20KW.
4.4.2.2 Sensor used
We used an Aaronia Spectran high frequency (HF) magnetic sensors, the NF-5035 3 axis magnetometer. The later can measure B fields between the [1 kHz -10 MHz].
UNPLUGGED 07.05.2015
UNPLUGGED Publishable Final Report.docx Page 27 of 68
This high frequency sensor can perform measurement of the field created by the induction coil (20 KW, f~25 KHz).
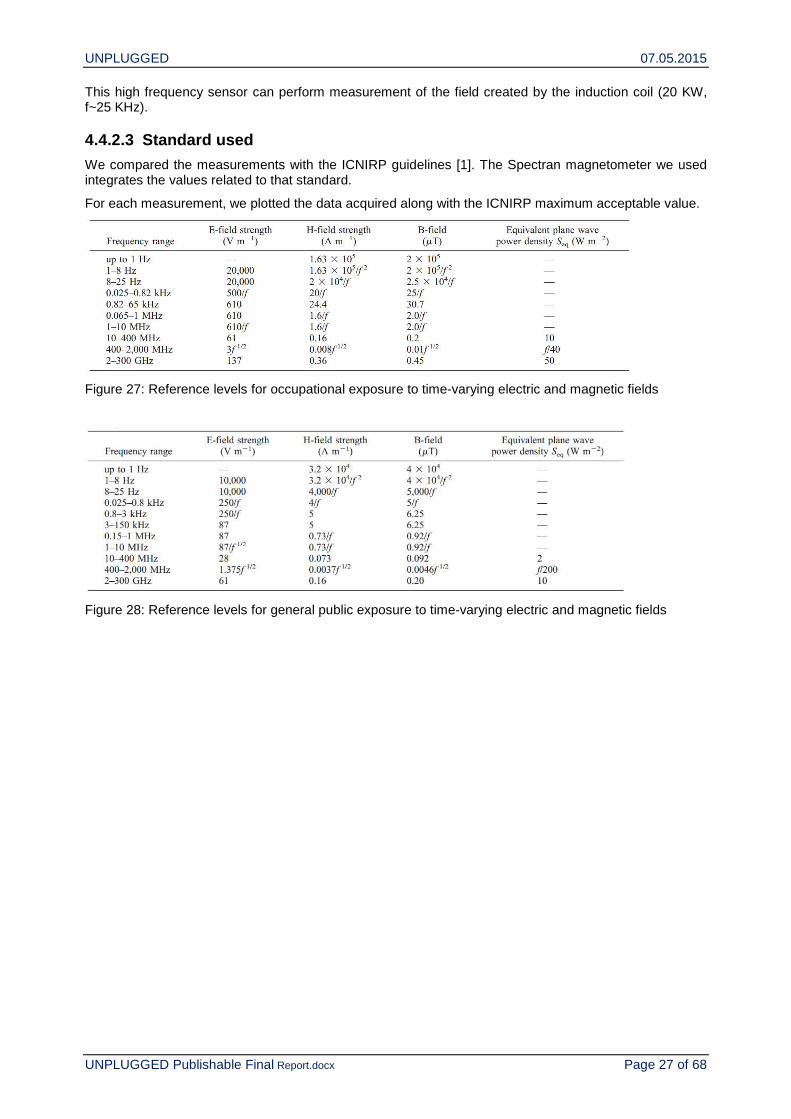
4.4.2.3 Standard used
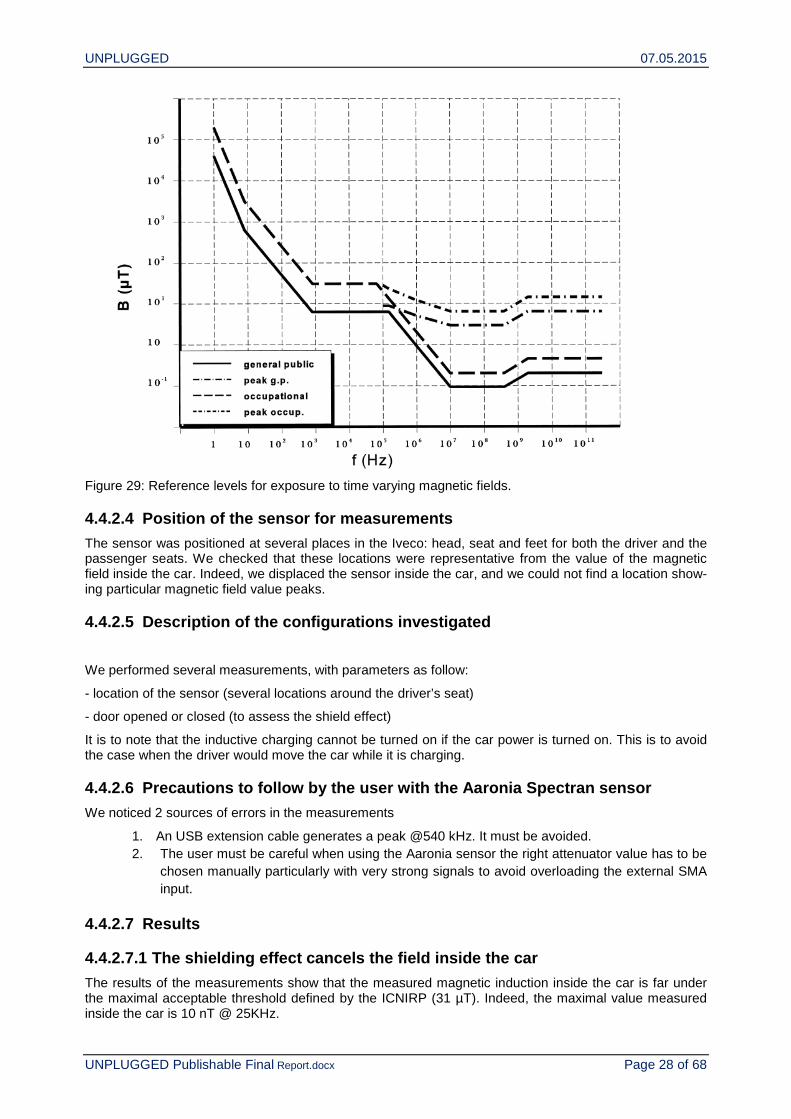
We compared the measurements with the ICNIRP guidelines [1]. The Spectran magnetometer we used integrates the values related to that standard.
For each measurement, we plotted the data acquired along with the ICNIRP maximum acceptable value.
Figure 27: Reference levels for occupational exposure to time-varying electric and magnetic fields
Figure 28: Reference levels for general public exposure to time-varying electric and magnetic fields
UNPLUGGED 07.05.2015
UNPLUGGED Publishable Final Report.docx Page 28 of 68
Figure 29: Reference levels for exposure to time varying magnetic fields.
4.4.2.4 Position of the sensor for measurements
The sensor was positioned at several places in the Iveco: head, seat and feet for both the driver and the passenger seats. We checked that these locations were representative from the value of the magnetic field inside the car. Indeed, we displaced the sensor inside the car, and we could not find a location show-ing particular magnetic field value peaks.
4.4.2.5 Description of the configurations investiga ted
We performed several measurements, with parameters as follow:
- location of the sensor (several locations around the driver’s seat)
- door opened or closed (to assess the shield effect)
It is to note that the inductive charging cannot be turned on if the car power is turned on. This is to avoid the case when the driver would move the car while it is charging.
4.4.2.6 Precautions to follow by the user with the Aaronia Spectran sensor
We noticed 2 sources of errors in the measurements
1. An USB extension cable generates a peak @540 kHz. It must be avoided. 2. The user must be careful when using the Aaronia sensor the right attenuator value has to be
chosen manually particularly with very strong signals to avoid overloading the external SMA input.
4.4.2.7 Results
4.4.2.7.1 The shielding effect cancels the field in side the car
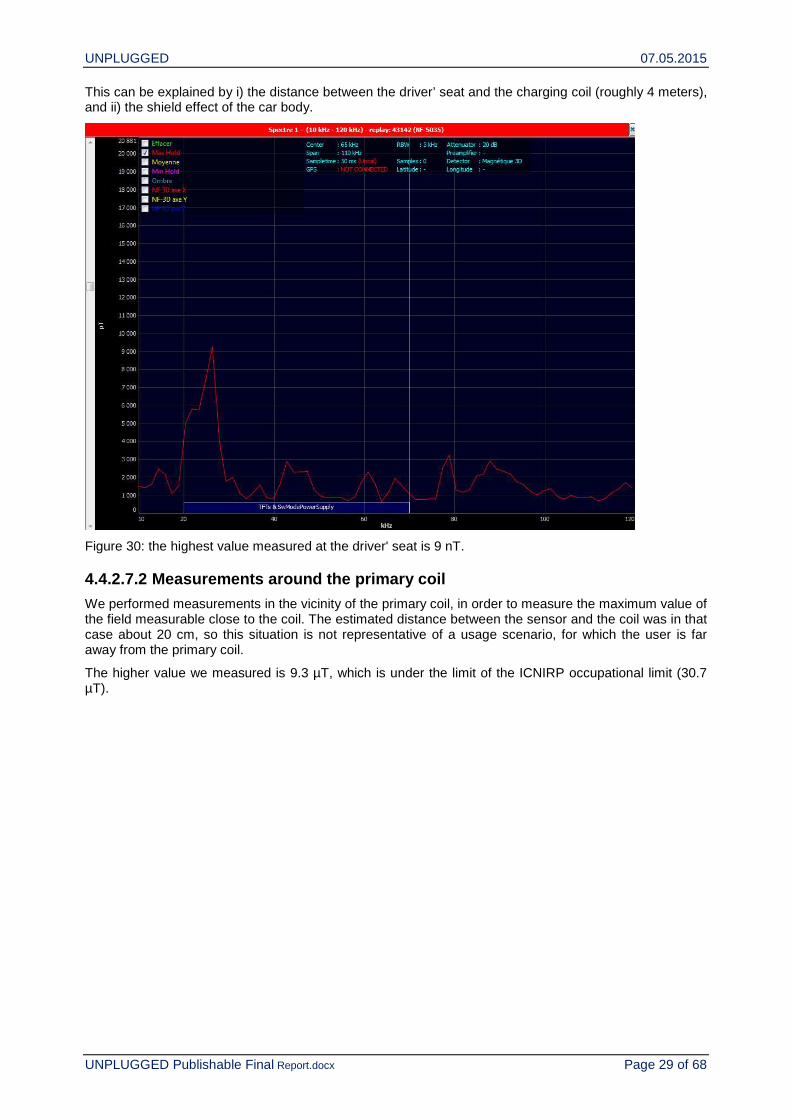
The results of the measurements show that the measured magnetic induction inside the car is far under the maximal acceptable threshold defined by the ICNIRP (31 µT). Indeed, the maximal value measured inside the car is 10 nT @ 25KHz.
UNPLUGGED 07.05.2015
UNPLUGGED Publishable Final Report.docx Page 29 of 68
This can be explained by i) the distance between the driver’ seat and the charging coil (roughly 4 meters), and ii) the shield effect of the car body.
Figure 30: the highest value measured at the driver' seat is 9 nT.
4.4.2.7.2 Measurements around the primary coil
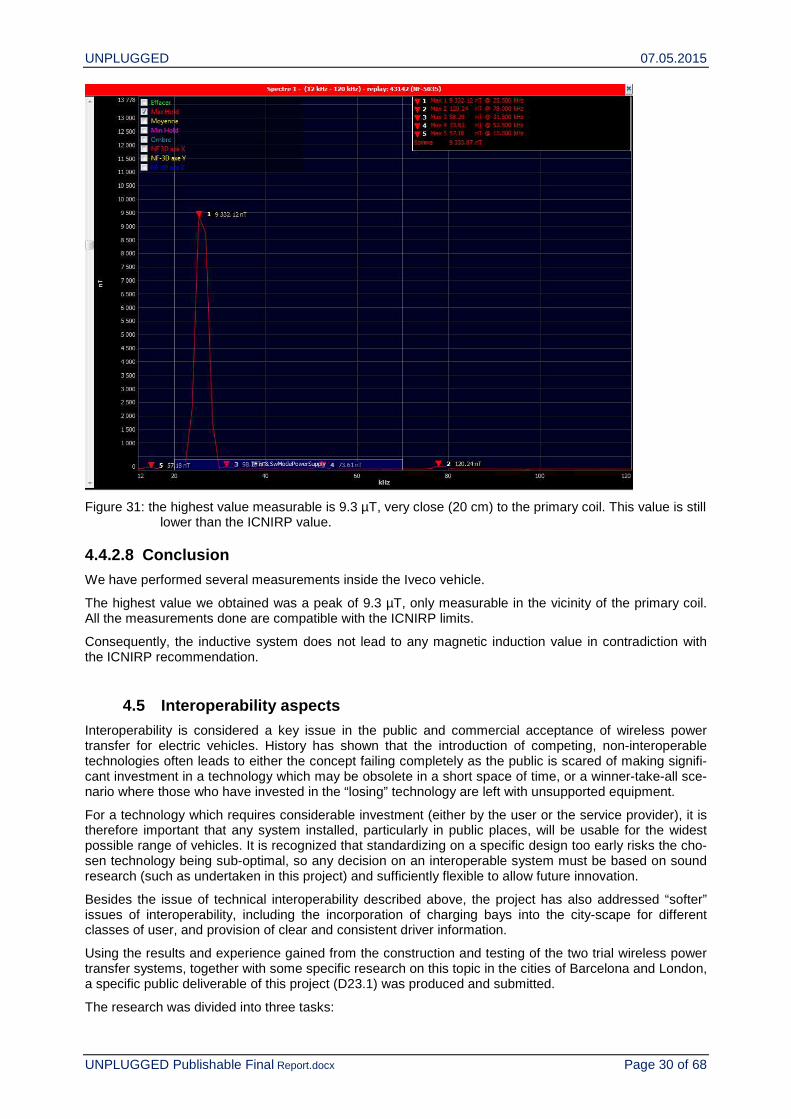
We performed measurements in the vicinity of the primary coil, in order to measure the maximum value of the field measurable close to the coil. The estimated distance between the sensor and the coil was in that case about 20 cm, so this situation is not representative of a usage scenario, for which the user is far away from the primary coil.
The higher value we measured is 9.3 µT, which is under the limit of the ICNIRP occupational limit (30.7 µT).
UNPLUGGED 07.05.2015
UNPLUGGED Publishable Final Report.docx Page 30 of 68
Figure 31: the highest value measurable is 9.3 µT, very close (20 cm) to the primary coil. This value is still lower than the ICNIRP value.
4.4.2.8 Conclusion
We have performed several measurements inside the Iveco vehicle.
The highest value we obtained was a peak of 9.3 µT, only measurable in the vicinity of the primary coil. All the measurements done are compatible with the ICNIRP limits.
Consequently, the inductive system does not lead to any magnetic induction value in contradiction with the ICNIRP recommendation.
4.5 Interoperability aspects
Interoperability is considered a key issue in the public and commercial acceptance of wireless power transfer for electric vehicles. History has shown that the introduction of competing, non-interoperable technologies often leads to either the concept failing completely as the public is scared of making signifi-cant investment in a technology which may be obsolete in a short space of time, or a winner-take-all sce-nario where those who have invested in the “losing” technology are left with unsupported equipment.
For a technology which requires considerable investment (either by the user or the service provider), it is therefore important that any system installed, particularly in public places, will be usable for the widest possible range of vehicles. It is recognized that standardizing on a specific design too early risks the cho-sen technology being sub-optimal, so any decision on an interoperable system must be based on sound research (such as undertaken in this project) and sufficiently flexible to allow future innovation.
Besides the issue of technical interoperability described above, the project has also addressed “softer” issues of interoperability, including the incorporation of charging bays into the city-scape for different classes of user, and provision of clear and consistent driver information.
Using the results and experience gained from the construction and testing of the two trial wireless power transfer systems, together with some specific research on this topic in the cities of Barcelona and London, a specific public deliverable of this project (D23.1) was produced and submitted.
The research was divided into three tasks:

UNPLUGGED 07.05.2015
UNPLUGGED Publishable Final Report.docx Page 31 of 68
• Assess possible methods of integration with road infrastructure, including the transfer of power. This addressed:
o Electrical interoperability – the pickup coil is able to receive the wireless power from the power transfer coil efficiently and safely. This therefore requires the charging and pickup coils to be compatible in terms of technology, power transfer rate, frequency, spacing re-quirements etc. This is also the area of largest risk as it requires that all WPT systems work, or at least fall back to, a common standard, which could severely affect new en-trants to the market who may have incompatible but innovative solutions.
o Communications interoperability – The vehicle and power transfer infrastructure are able to communicate.
• Assess interoperability of charging “bay” designs with different vehicles and locations for installa-tions
• Provision of driver information (signage / road markings, etc.).
In addition, the state of standards supporting interoperability was reported.
4.5.1 Integration with the road infrastructure
4.5.1.1 Electrical Interoperability
Interoperability between the power transfer elements of different providers of equipment is dependent on the primary and secondary parts of power transfer equipment working to the same technical specifica-tions. The most important aspects of these are:
• Using the same fundamental technology. In the case of systems investigated in UNPLUGGED, as in nearly all wireless power transfer systems, these are based on resonant inductive coupling.
• Using compatible architecture. Resonant inductive coupling systems can produce constant volt-age or constant current secondary outputs, and it is important that at least the secondary side is aware of what the primary side is expecting. In the case of systems investigated in UNPLUGGED, as in nearly all wireless power transfer systems, these provide a constant current secondary output, requiring the power is controlled by the primary.
• Coil topology. Different systems may use different shapes and numbers of coils. Coupling be-tween different shapes and sizes of primary vs. secondary coils may be compromised and lead to unacceptable levels of EMC.
• Agreement on the frequency of operation. Being a resonant system (see above), it is important that both the primary and secondary sides operate at the same frequency. Where systems which normally operate at different frequencies wish to be interoperable, at least one of the systems needs to be able to switch its operating frequency to match the other.
• Alignment issues. Different systems have different requirements with respect to maximum al-lowed misalignment between the primary and secondary parts.
Due to the tight timescales in the project, interoperability of power transfer between the completed sys-tems could not be tested; however the transfer of power was tested both in simulation and on a test sys-tem.
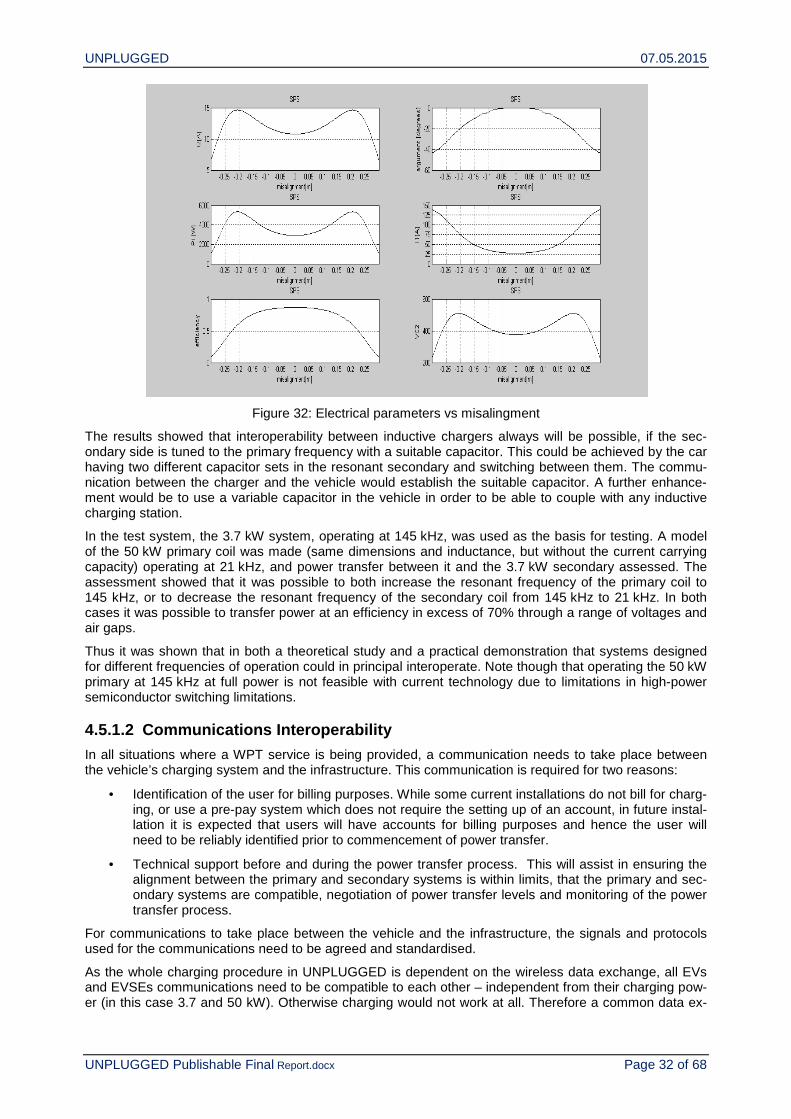
In the simulation study, it was demonstrated that it is theoretically possible to charge a 250 V electric ve-hicle battery with a 3.7 kW secondary coil mounted at the bottom of the vehicle and separated from the road around 0.15 m, with a different primary coil than the one it was originally designed. The simulation evaluated the effect of varying voltage, alignment, frequency and controllability to mitigate misalignment. As an example of the results, Figure 32 shows the variation in the main electrical parameters for various levels of misalignment. The most useful curve is the efficiency curve (bottom right) which shows virtually no drop in efficiency up to a misalignment of 5cm, and minimal efficiency drop up to 15cm. Efficiency drop below 50% from about 23cm.
UNPLUGGED 07.05.2015
UNPLUGGED Publishable Final Report.docx Page 32 of 68
Figure 32: Electrical parameters vs misalingment
The results showed that interoperability between inductive chargers always will be possible, if the sec-ondary side is tuned to the primary frequency with a suitable capacitor. This could be achieved by the car having two different capacitor sets in the resonant secondary and switching between them. The commu-nication between the charger and the vehicle would establish the suitable capacitor. A further enhance-ment would be to use a variable capacitor in the vehicle in order to be able to couple with any inductive charging station.
In the test system, the 3.7 kW system, operating at 145 kHz, was used as the basis for testing. A model of the 50 kW primary coil was made (same dimensions and inductance, but without the current carrying capacity) operating at 21 kHz, and power transfer between it and the 3.7 kW secondary assessed. The assessment showed that it was possible to both increase the resonant frequency of the primary coil to 145 kHz, or to decrease the resonant frequency of the secondary coil from 145 kHz to 21 kHz. In both cases it was possible to transfer power at an efficiency in excess of 70% through a range of voltages and air gaps.
Thus it was shown that in both a theoretical study and a practical demonstration that systems designed for different frequencies of operation could in principal interoperate. Note though that operating the 50 kW primary at 145 kHz at full power is not feasible with current technology due to limitations in high-power semiconductor switching limitations.
4.5.1.2 Communications Interoperability
In all situations where a WPT service is being provided, a communication needs to take place between the vehicle’s charging system and the infrastructure. This communication is required for two reasons:
• Identification of the user for billing purposes. While some current installations do not bill for charg-ing, or use a pre-pay system which does not require the setting up of an account, in future instal-lation it is expected that users will have accounts for billing purposes and hence the user will need to be reliably identified prior to commencement of power transfer.
• Technical support before and during the power transfer process. This will assist in ensuring the alignment between the primary and secondary systems is within limits, that the primary and sec-ondary systems are compatible, negotiation of power transfer levels and monitoring of the power transfer process.
For communications to take place between the vehicle and the infrastructure, the signals and protocols used for the communications need to be agreed and standardised.
As the whole charging procedure in UNPLUGGED is dependent on the wireless data exchange, all EVs and EVSEs communications need to be compatible to each other – independent from their charging pow-er (in this case 3.7 and 50 kW). Otherwise charging would not work at all. Therefore a common data ex-

UNPLUGGED 07.05.2015
UNPLUGGED Publishable Final Report.docx Page 33 of 68
change mechanism was created for both passenger and commercial vehicle, using the same communica-tion controllers and the same data flow.
The requirement was to use an existing standardised wireless link, which is able (e.g. in terms of speed and data length) to support this. After an investigation of several wireless data busses (among others Bluetooth), it was decided to specify a Wi-Fi/Ethernet system making use of ISO 15118 (which specifies the communication between Electric Vehicles (EV), including Battery Electric Vehicles and Plug-In Hybrid Electric Vehicles, and the Electric Vehicle Supply Equipment (EVSE)) protocols. ISO15118 was originally designed for conductive charging only, but in principle the requirements for conductive and wireless pow-er transfer are similar. This configuration is also under discussion in wireless charging transmission inter-national standardisation groups.
(Special) wireless charging data like current electrical battery values, maximum values, current power on primary and secondary side, some mutual diagnostic statuses and other data like start of charging infor-mation were collected and put into new ISO 15118 data protocols. Both EV/truck and charging stations were programmed to accept the same incoming data via the communication controllers, so they are fully interoperable in terms of data communication.
During implementation, several rounds of debugging and updating were required to achieve the interop-erability desired. The amount of effort required to achieve this is indicative of the importance of clear and well formulated specifications.
The inherent non-deterministic nature of wireless communications means that additional error handling is required to ensure reliable communications can be achieved between the EV and the EVSE.
The experience of this project has shown that communications interoperability is possible, but will require robust standards which take into account the strengths and weaknesses inherent in wireless communica-tions.
4.5.2 Assessment of charging bay design and integra tion into the city-scape
Two studies were undertaken by members of the project team:
• ENIDE investigated the integration of inductive charging systems with road infrastructure and with vehicles in Barcelona.
• TFL undertook a study of needs and boundary conditions for the implementation of inductive charging infrastructure for EVs within London.
Both studies took a wide ranging look at the needs and requirements of electric vehicle in the respective locations, and investigated how charging infrastructure could be incorporated into the road infrastructure in the two cities. Further, both studies concentrated on two specific user groups – taxis and light delivery vehicles, as these have been identified as the most likely initial users of dynamic charging in cities. Both vehicle types tend to stop for short periods where the use of plug-in charging would be time consuming and inconvenient.
Taxi ranks and queuing areas would be a prime candidate for charging infrastructure for taxis. Because of the short time they tend to spend in these locations, higher power infrastructure would be most suitable.
Delivery vans on the other hand would benefit most from charging infrastructure in shopping centres and logistics premises. As they tend to be stationary for longer periods of time at these locations, lower power systems would most likely be sufficient for these. The installation of wireless charge system in load-ing/unloading bays makes sense for short duration stops (up to 30 minutes stop time). For longer duration stops the plug-in charge system fully covers the driver’s needs.
Additional areas where infrastructure should be considered include commercial parking (shopping centres etc.), tourism zones, connectivity with other transport modes, services for citizens (hospitals, schools, etc.) and deliveries to residential streets.
Citizens’ perception is a key factor for the wireless charging system installation success. The information should emphasize the benefits of the wireless system, should not be intrusive and should indicate the safety of the installation. This was illustrated by a survey of London taxi drivers, whose chief concern about electric vehicles was range and the possibility of running out of charge.
UNPLUGGED 07.05.2015
UNPLUGGED Publishable Final Report.docx Page 34 of 68
4.5.3 Provision of driver information
The objective of this part of the work was to ensure maximum usability of future wireless charging sys-tems. In ISO 9241, usability is defined as "the extent to which a product can be used by specified users to achieve specified goals with effectiveness, efficiency, and satisfaction in a specified context of use". This means that usability defines the user degree of ease and satisfaction when interacting with a tool.
Three aspects of the provision of information to drivers were addressed in this project, namely the in-vehicle Human-Machine Interface (HMI), the overall charging HMI, and the provision of signage.
Guidelines for the clear and unambiguous provision of information to the driver were addressed in the in-vehicle HMI. As an illustration, an initial HMI design was analysed, shortcomings identified and an im-proved version presented. The adoption of a standard set of symbols and HMI design elements would enhance interoperability as users move between vehicles.
The HMI at the charging station was also discussed, identifying the different methods that the power transfer process may be initiated and controlled. The choice of the type of method of control used is based on the type of contract that the user has, and also has to cope with users without a contract. In-teroperability between these different processes requires standardisation of message interfaces between EVSEs and in-vehicle systems.
Finally the issue of signage was investigated. It was found that many countries are already adopting sign-age to cope with the introduction of electric vehicle and charging infrastructure. Unfortunately most coun-tries are adopting their own signage, with little evidence of standardisation, although some countries are adopting the same or similar signage to other, mostly neighbouring countries. An additional complexity is that in some countries, signage is a devolved responsibility for different provinces/regions, for example Italy, so national standards do not exist.
4.6 Technical and economic feasibility of wireless charging
An important step to foster the introduction of the wireless technology within an urban environment is the capability to assess its economic feasibility and social acceptance. Since the cost effectiveness of the vehicle and the infrastructure is a fundamental issue to be addressed to motivate the city government to move to such technology, a model to optimize and assess the charging infrastructure has been devel-oped.
This model has been applied to two case studies (London -UK- and Firenze -IT-), for which the estimated infrastructure costs have been calculated. In order to have a functional solution also the performance and technical solutions to equip a vehicle has been taken into account. In particular the alternative energy storage solutions have been studied.
However, technical and economic feasibilities are not the only parameters to take into account: a techno-logical solution could experience a breakdown if the end user is not willing to accept it. In the next chap-ter, the social acceptance analysis carried out within the project will be reported.
4.6.1 Comparative analysis for vehicle technical so lutions
The main issues that will be analyzed in the next paragraphs are the alternative market-available energy storage solutions and the comparison between the feasible conductive and wireless charging alternatives.
4.6.1.1 Storage system equipped on board
In this paragraph a summary of the available technologies to store the energy on board of the vehicle is given. The solutions proposed are the Lead acid, the NiNH and the Li-ion batteries. Most promising solu-tion also presented are the Ultracapacitors and the Flywheels.
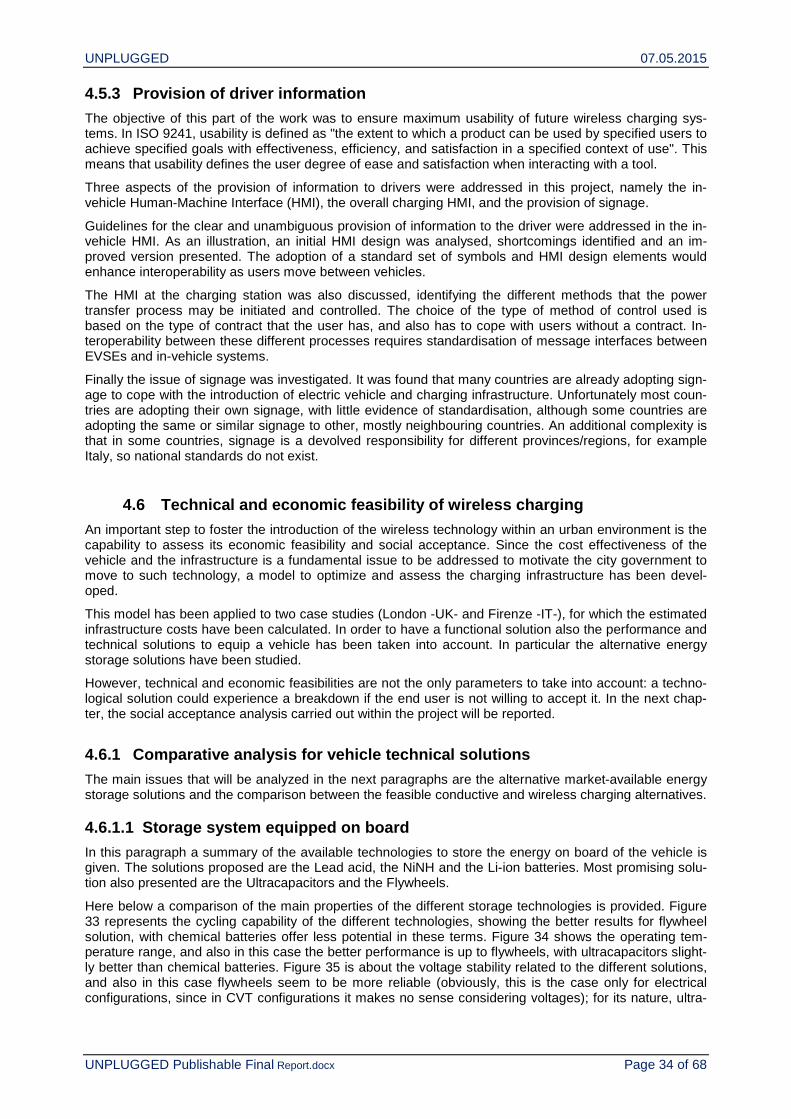
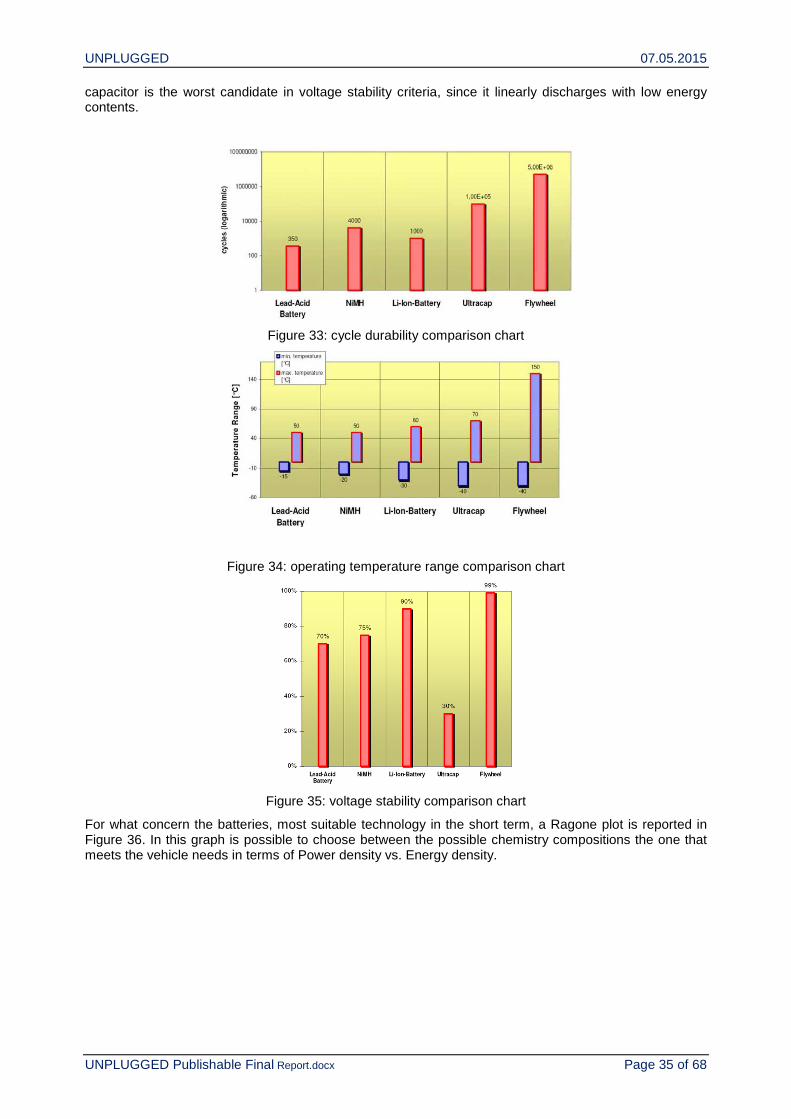
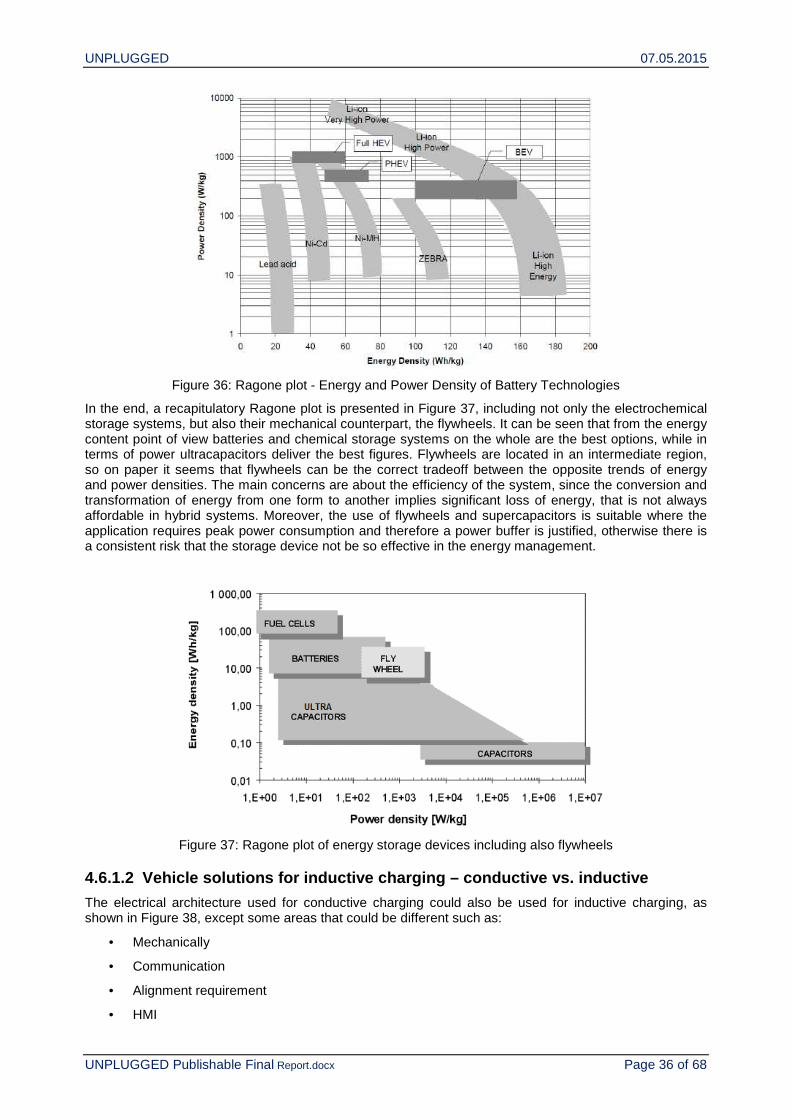
Here below a comparison of the main properties of the different storage technologies is provided. Figure 33 represents the cycling capability of the different technologies, showing the better results for flywheel solution, with chemical batteries offer less potential in these terms. Figure 34 shows the operating tem-perature range, and also in this case the better performance is up to flywheels, with ultracapacitors slight-ly better than chemical batteries. Figure 35 is about the voltage stability related to the different solutions, and also in this case flywheels seem to be more reliable (obviously, this is the case only for electrical configurations, since in CVT configurations it makes no sense considering voltages); for its nature, ultra-
UNPLUGGED 07.05.2015
UNPLUGGED Publishable Final Report.docx Page 35 of 68
capacitor is the worst candidate in voltage stability criteria, since it linearly discharges with low energy contents.
Figure 33: cycle durability comparison chart
Figure 34: operating temperature range comparison chart
Figure 35: voltage stability comparison chart
For what concern the batteries, most suitable technology in the short term, a Ragone plot is reported in Figure 36. In this graph is possible to choose between the possible chemistry compositions the one that meets the vehicle needs in terms of Power density vs. Energy density.
UNPLUGGED 07.05.2015
UNPLUGGED Publishable Final Report.docx Page 36 of 68
Figure 36: Ragone plot - Energy and Power Density of Battery Technologies
In the end, a recapitulatory Ragone plot is presented in Figure 37, including not only the electrochemical storage systems, but also their mechanical counterpart, the flywheels. It can be seen that from the energy content point of view batteries and chemical storage systems on the whole are the best options, while in terms of power ultracapacitors deliver the best figures. Flywheels are located in an intermediate region, so on paper it seems that flywheels can be the correct tradeoff between the opposite trends of energy and power densities. The main concerns are about the efficiency of the system, since the conversion and transformation of energy from one form to another implies significant loss of energy, that is not always affordable in hybrid systems. Moreover, the use of flywheels and supercapacitors is suitable where the application requires peak power consumption and therefore a power buffer is justified, otherwise there is a consistent risk that the storage device not be so effective in the energy management.
Figure 37: Ragone plot of energy storage devices including also flywheels
4.6.1.2 Vehicle solutions for inductive charging – conductive vs. inductive
The electrical architecture used for conductive charging could also be used for inductive charging, as shown in Figure 38, except some areas that could be different such as:
• Mechanically
• Communication
• Alignment requirement
• HMI
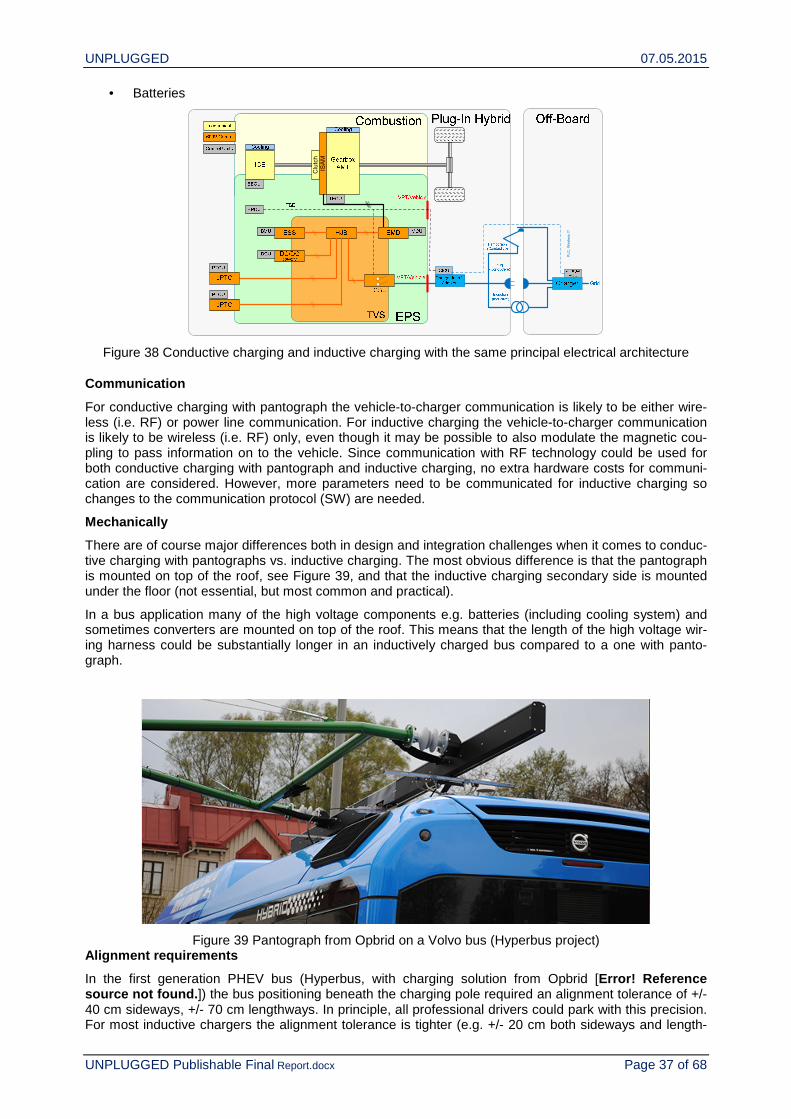
UNPLUGGED 07.05.2015
UNPLUGGED Publishable Final Report.docx Page 37 of 68
• Batteries
Figure 38 Conductive charging and inductive charging with the same principal electrical architecture
Communication
For conductive charging with pantograph the vehicle-to-charger communication is likely to be either wire-less (i.e. RF) or power line communication. For inductive charging the vehicle-to-charger communication is likely to be wireless (i.e. RF) only, even though it may be possible to also modulate the magnetic cou-pling to pass information on to the vehicle. Since communication with RF technology could be used for both conductive charging with pantograph and inductive charging, no extra hardware costs for communi-cation are considered. However, more parameters need to be communicated for inductive charging so changes to the communication protocol (SW) are needed.
Mechanically
There are of course major differences both in design and integration challenges when it comes to conduc-tive charging with pantographs vs. inductive charging. The most obvious difference is that the pantograph is mounted on top of the roof, see Figure 39, and that the inductive charging secondary side is mounted under the floor (not essential, but most common and practical).
In a bus application many of the high voltage components e.g. batteries (including cooling system) and sometimes converters are mounted on top of the roof. This means that the length of the high voltage wir-ing harness could be substantially longer in an inductively charged bus compared to a one with panto-graph.
Figure 39 Pantograph from Opbrid on a Volvo bus (Hyperbus project) Alignment requirements
In the first generation PHEV bus (Hyperbus, with charging solution from Opbrid [Error! Reference source not found. ]) the bus positioning beneath the charging pole required an alignment tolerance of +/- 40 cm sideways, +/- 70 cm lengthways. In principle, all professional drivers could park with this precision. For most inductive chargers the alignment tolerance is tighter (e.g. +/- 20 cm both sideways and length-
Clu
tch
ISA
M
PL
C,
Wir
ele
ss !?
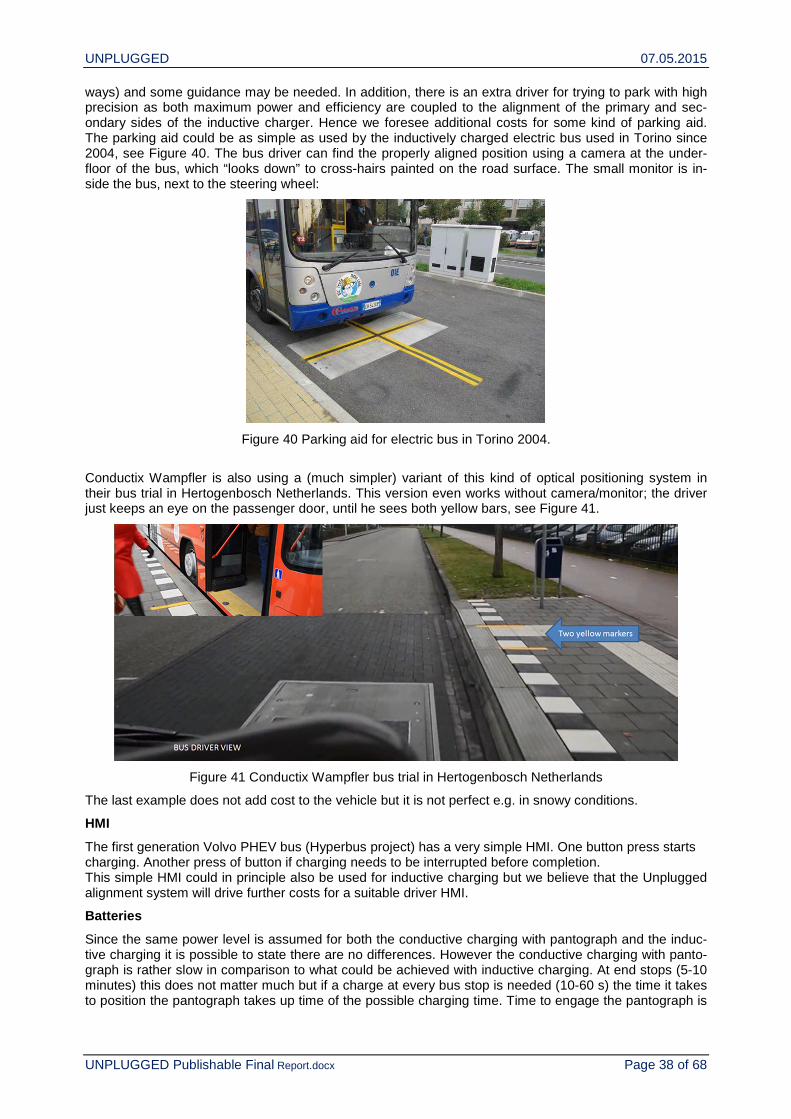
UNPLUGGED 07.05.2015
UNPLUGGED Publishable Final Report.docx Page 38 of 68
ways) and some guidance may be needed. In addition, there is an extra driver for trying to park with high precision as both maximum power and efficiency are coupled to the alignment of the primary and sec-ondary sides of the inductive charger. Hence we foresee additional costs for some kind of parking aid. The parking aid could be as simple as used by the inductively charged electric bus used in Torino since 2004, see Figure 40. The bus driver can find the properly aligned position using a camera at the under-floor of the bus, which “looks down” to cross-hairs painted on the road surface. The small monitor is in-side the bus, next to the steering wheel:
Figure 40 Parking aid for electric bus in Torino 2004.
Conductix Wampfler is also using a (much simpler) variant of this kind of optical positioning system in their bus trial in Hertogenbosch Netherlands. This version even works without camera/monitor; the driver just keeps an eye on the passenger door, until he sees both yellow bars, see Figure 41.
Figure 41 Conductix Wampfler bus trial in Hertogenbosch Netherlands
The last example does not add cost to the vehicle but it is not perfect e.g. in snowy conditions.
HMI
The first generation Volvo PHEV bus (Hyperbus project) has a very simple HMI. One button press starts charging. Another press of button if charging needs to be interrupted before completion. This simple HMI could in principle also be used for inductive charging but we believe that the Unplugged alignment system will drive further costs for a suitable driver HMI.
Batteries
Since the same power level is assumed for both the conductive charging with pantograph and the induc-tive charging it is possible to state there are no differences. However the conductive charging with panto-graph is rather slow in comparison to what could be achieved with inductive charging. At end stops (5-10 minutes) this does not matter much but if a charge at every bus stop is needed (10-60 s) the time it takes to position the pantograph takes up time of the possible charging time. Time to engage the pantograph is
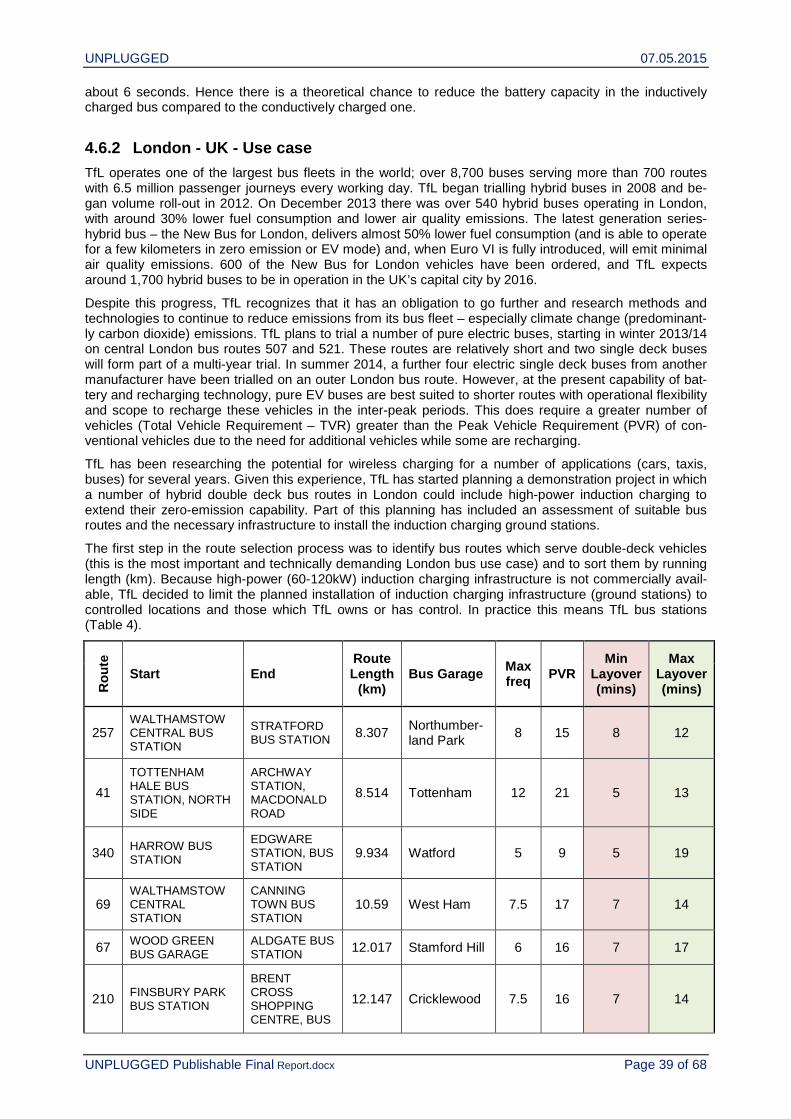
UNPLUGGED 07.05.2015
UNPLUGGED Publishable Final Report.docx Page 39 of 68
about 6 seconds. Hence there is a theoretical chance to reduce the battery capacity in the inductively charged bus compared to the conductively charged one.
4.6.2 London - UK - Use case
TfL operates one of the largest bus fleets in the world; over 8,700 buses serving more than 700 routes with 6.5 million passenger journeys every working day. TfL began trialling hybrid buses in 2008 and be-gan volume roll-out in 2012. On December 2013 there was over 540 hybrid buses operating in London, with around 30% lower fuel consumption and lower air quality emissions. The latest generation series-hybrid bus – the New Bus for London, delivers almost 50% lower fuel consumption (and is able to operate for a few kilometers in zero emission or EV mode) and, when Euro VI is fully introduced, will emit minimal air quality emissions. 600 of the New Bus for London vehicles have been ordered, and TfL expects around 1,700 hybrid buses to be in operation in the UK’s capital city by 2016.
Despite this progress, TfL recognizes that it has an obligation to go further and research methods and technologies to continue to reduce emissions from its bus fleet – especially climate change (predominant-ly carbon dioxide) emissions. TfL plans to trial a number of pure electric buses, starting in winter 2013/14 on central London bus routes 507 and 521. These routes are relatively short and two single deck buses will form part of a multi-year trial. In summer 2014, a further four electric single deck buses from another manufacturer have been trialled on an outer London bus route. However, at the present capability of bat-tery and recharging technology, pure EV buses are best suited to shorter routes with operational flexibility and scope to recharge these vehicles in the inter-peak periods. This does require a greater number of vehicles (Total Vehicle Requirement – TVR) greater than the Peak Vehicle Requirement (PVR) of con-ventional vehicles due to the need for additional vehicles while some are recharging.
TfL has been researching the potential for wireless charging for a number of applications (cars, taxis, buses) for several years. Given this experience, TfL has started planning a demonstration project in which a number of hybrid double deck bus routes in London could include high-power induction charging to extend their zero-emission capability. Part of this planning has included an assessment of suitable bus routes and the necessary infrastructure to install the induction charging ground stations.
The first step in the route selection process was to identify bus routes which serve double-deck vehicles (this is the most important and technically demanding London bus use case) and to sort them by running length (km). Because high-power (60-120kW) induction charging infrastructure is not commercially avail-able, TfL decided to limit the planned installation of induction charging infrastructure (ground stations) to controlled locations and those which TfL owns or has control. In practice this means TfL bus stations (Table 4).
Rou
te
Start End Route Length
(km) Bus Garage Max
freq PVR Min
Layover (mins)
Max Layover (mins)
257 WALTHAMSTOW CENTRAL BUS STATION
STRATFORD BUS STATION 8.307 Northumber-
land Park 8 15 8 12
41
TOTTENHAM HALE BUS STATION, NORTH SIDE
ARCHWAY STATION, MACDONALD ROAD
8.514 Tottenham 12 21 5 13
340 HARROW BUS STATION
EDGWARE STATION, BUS STATION
9.934 Watford 5 9 5 19
69 WALTHAMSTOW CENTRAL STATION
CANNING TOWN BUS STATION
10.59 West Ham 7.5 17 7 14
67 WOOD GREEN BUS GARAGE
ALDGATE BUS STATION 12.017 Stamford Hill 6 16 7 17
210 FINSBURY PARK BUS STATION
BRENT CROSS SHOPPING CENTRE, BUS
12.147 Cricklewood 7.5 16 7 14
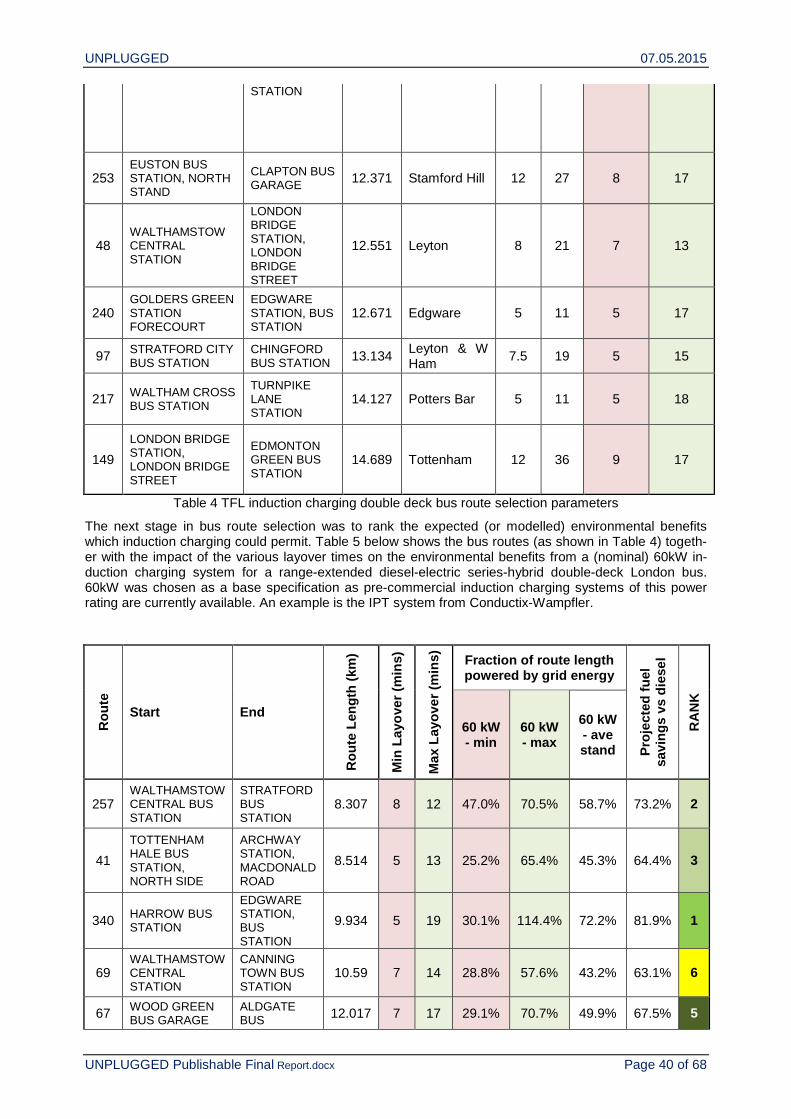
UNPLUGGED 07.05.2015
UNPLUGGED Publishable Final Report.docx Page 40 of 68
STATION
253 EUSTON BUS STATION, NORTH STAND
CLAPTON BUS GARAGE 12.371 Stamford Hill 12 27 8 17
48 WALTHAMSTOW CENTRAL STATION
LONDON BRIDGE STATION, LONDON BRIDGE STREET
12.551 Leyton 8 21 7 13
240 GOLDERS GREEN STATION FORECOURT
EDGWARE STATION, BUS STATION
12.671 Edgware 5 11 5 17
97 STRATFORD CITY BUS STATION
CHINGFORD BUS STATION 13.134
Leyton & W Ham
7.5 19 5 15
217 WALTHAM CROSS BUS STATION
TURNPIKE LANE STATION
14.127 Potters Bar 5 11 5 18
149
LONDON BRIDGE STATION, LONDON BRIDGE STREET
EDMONTON GREEN BUS STATION
14.689 Tottenham 12 36 9 17
Table 4 TFL induction charging double deck bus route selection parameters
The next stage in bus route selection was to rank the expected (or modelled) environmental benefits which induction charging could permit. Table 5 below shows the bus routes (as shown in Table 4) togeth-er with the impact of the various layover times on the environmental benefits from a (nominal) 60kW in-duction charging system for a range-extended diesel-electric series-hybrid double-deck London bus. 60kW was chosen as a base specification as pre-commercial induction charging systems of this power rating are currently available. An example is the IPT system from Conductix-Wampfler.
Rou
te
Start End
Rou
te L
engt
h (k
m)
Min
Lay
over
(m
ins)
Max
Lay
over
(m
ins)
Fraction of route length powered by grid energy
Pro
ject
ed fu
el
savi
ngs
vs d
iese
l
RA
NK
60 kW - min
60 kW - max
60 kW - ave stand
257 WALTHAMSTOW CENTRAL BUS STATION
STRATFORD BUS STATION
8.307 8 12 47.0% 70.5% 58.7% 73.2% 2
41
TOTTENHAM HALE BUS STATION, NORTH SIDE
ARCHWAY STATION, MACDONALD ROAD
8.514 5 13 25.2% 65.4% 45.3% 64.4% 3
340 HARROW BUS STATION
EDGWARE STATION, BUS STATION
9.934 5 19 30.1% 114.4% 72.2% 81.9% 1
69 WALTHAMSTOW CENTRAL STATION
CANNING TOWN BUS STATION
10.59 7 14 28.8% 57.6% 43.2% 63.1% 6
67 WOOD GREEN BUS GARAGE
ALDGATE BUS 12.017 7 17 29.1% 70.7% 49.9% 67.5% 5
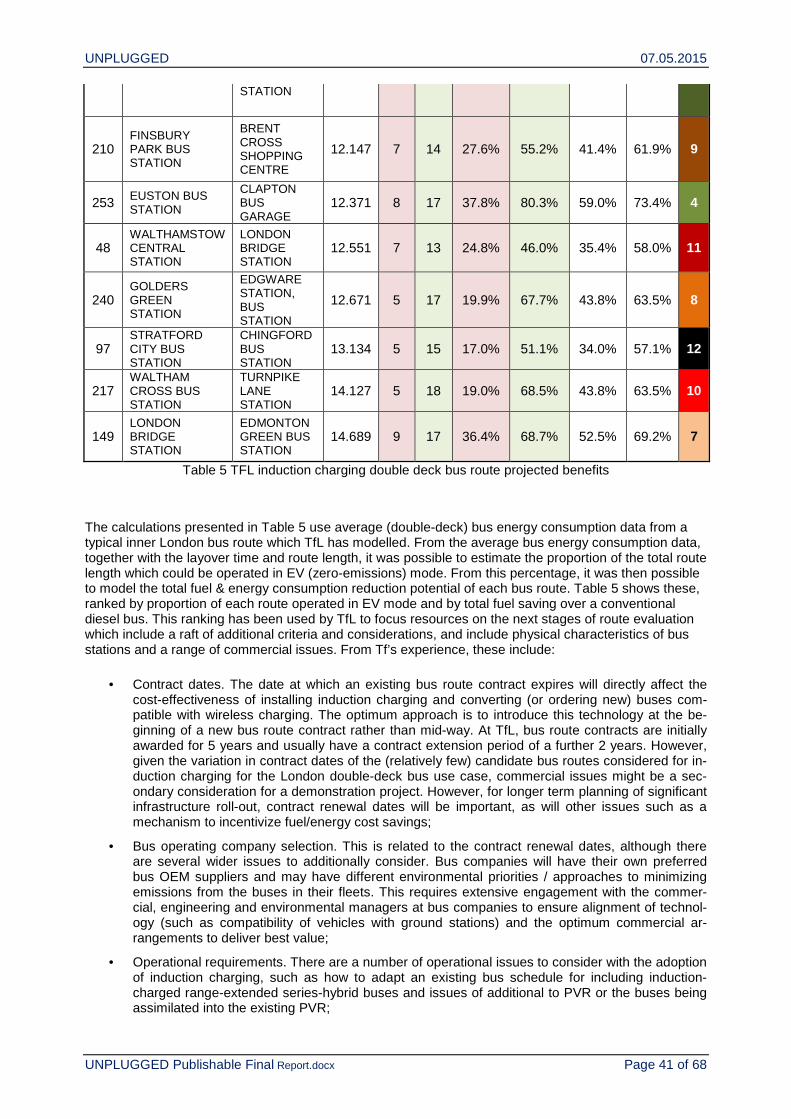
UNPLUGGED 07.05.2015
UNPLUGGED Publishable Final Report.docx Page 41 of 68
STATION
210 FINSBURY PARK BUS STATION
BRENT CROSS SHOPPING CENTRE
12.147 7 14 27.6% 55.2% 41.4% 61.9% 9
253 EUSTON BUS STATION
CLAPTON BUS GARAGE
12.371 8 17 37.8% 80.3% 59.0% 73.4% 4
48 WALTHAMSTOW CENTRAL STATION
LONDON BRIDGE STATION
12.551 7 13 24.8% 46.0% 35.4% 58.0% 11
240 GOLDERS GREEN STATION
EDGWARE STATION, BUS STATION
12.671 5 17 19.9% 67.7% 43.8% 63.5% 8
97 STRATFORD CITY BUS STATION
CHINGFORD BUS STATION
13.134 5 15 17.0% 51.1% 34.0% 57.1% 12
217 WALTHAM CROSS BUS STATION
TURNPIKE LANE STATION
14.127 5 18 19.0% 68.5% 43.8% 63.5% 10
149 LONDON BRIDGE STATION
EDMONTON GREEN BUS STATION
14.689 9 17 36.4% 68.7% 52.5% 69.2% 7
Table 5 TFL induction charging double deck bus route projected benefits
The calculations presented in Table 5 use average (double-deck) bus energy consumption data from a typical inner London bus route which TfL has modelled. From the average bus energy consumption data, together with the layover time and route length, it was possible to estimate the proportion of the total route length which could be operated in EV (zero-emissions) mode. From this percentage, it was then possible to model the total fuel & energy consumption reduction potential of each bus route. Table 5 shows these, ranked by proportion of each route operated in EV mode and by total fuel saving over a conventional diesel bus. This ranking has been used by TfL to focus resources on the next stages of route evaluation which include a raft of additional criteria and considerations, and include physical characteristics of bus stations and a range of commercial issues. From Tf’s experience, these include:
• Contract dates. The date at which an existing bus route contract expires will directly affect the cost-effectiveness of installing induction charging and converting (or ordering new) buses com-patible with wireless charging. The optimum approach is to introduce this technology at the be-ginning of a new bus route contract rather than mid-way. At TfL, bus route contracts are initially awarded for 5 years and usually have a contract extension period of a further 2 years. However, given the variation in contract dates of the (relatively few) candidate bus routes considered for in-duction charging for the London double-deck bus use case, commercial issues might be a sec-ondary consideration for a demonstration project. However, for longer term planning of significant infrastructure roll-out, contract renewal dates will be important, as will other issues such as a mechanism to incentivize fuel/energy cost savings;
• Bus operating company selection. This is related to the contract renewal dates, although there are several wider issues to additionally consider. Bus companies will have their own preferred bus OEM suppliers and may have different environmental priorities / approaches to minimizing emissions from the buses in their fleets. This requires extensive engagement with the commer-cial, engineering and environmental managers at bus companies to ensure alignment of technol-ogy (such as compatibility of vehicles with ground stations) and the optimum commercial ar-rangements to deliver best value;
• Operational requirements. There are a number of operational issues to consider with the adoption of induction charging, such as how to adapt an existing bus schedule for including induction-charged range-extended series-hybrid buses and issues of additional to PVR or the buses being assimilated into the existing PVR;

UNPLUGGED 07.05.2015
UNPLUGGED Publishable Final Report.docx Page 42 of 68
• Physical space. Because of the technology-specific infrastructure there is a requirement for dedi-cated bus stands at bus stations. In addition, adequate vehicle turning space / maneuvering room is needed to ensure vehicles are correctly parked / aligned with the induction charging ground stations. In addition, sufficient room for the installation, commissioning and maintenance of induc-tion charging ground stations must be planned and adequate space maintained;
• Services. The key service is a sufficient electricity supply to either the existing electricity distribu-tion network at the bus station or a dedicated connection for the induction charging ground sta-tion. The locations of other services (communications, drainage, gas mains etc.) must also be well understood and this could additionally require site-specific topographical surveys to ensure the proposed site of the induction charging ground station is clear of obstructions; and
• Structural suitability. The suitability of a given location for the installation of a wireless induction charging ground station is dependent on a number of site-specific features, such as cantilevered slabs (rather than solid earth foundations), adjacent underground ticket halls and the presence of existing service.
After consideration of these issues / factors, the next step is to design and install the ground stations, the process for which is described in a TfL internal standard – Wireless Bus Charging Infrastructure Installa-tion Guidelines – that are given below:
1. Benchmark of the concept: The use of wireless technology to power on road transport is not a new concept and the use of hybrid and/or fully electric vehicles have been in circulation in various countries for many years. It is mandatory to start from other solutions strategies in order to be aware of known issues.
2. Site investigatins/Survey/Enquires: Once a site has been identified as a possible location where wireless charging infrastructure could be installed, a number of checks can be carried out to ensure the suitability of its location both physically and operationally prior to any design and construction work taking place:
a. locate a potential power source
b. obtain underground utility records
c. obtain details of any below ground structures
d. obtain an accurate plan of the site
e. obtain details of current stop/standing arrangements and underground structures.
In conclusion, in this paragraph different analysis for wireless/ inductive charging has been carried out to understand how and how much the wireless charging technology could be implemented within the city of London. A set of technical best practices have been provided to support the installation of new devices within any municipality mobility net.
4.6.3 Firenze - IT - Use case
A second use case has been provided for the city of Firenze, for which public and private mobility have been analyzed and a dimensioning model has been proposed: the objective of this paragraph, in fact, is to provide and apply to Firenze a method to best locate wireless infrastructures by using cost as discrimi-nating variable.
4.6.3.1 The bus scenario
First of all, the borders and all the terminal stops of the city of Firenze have been assessed. Then, all the bus lines have been divided in three categories in order to study one line per each category as an arche-type, reported in the table
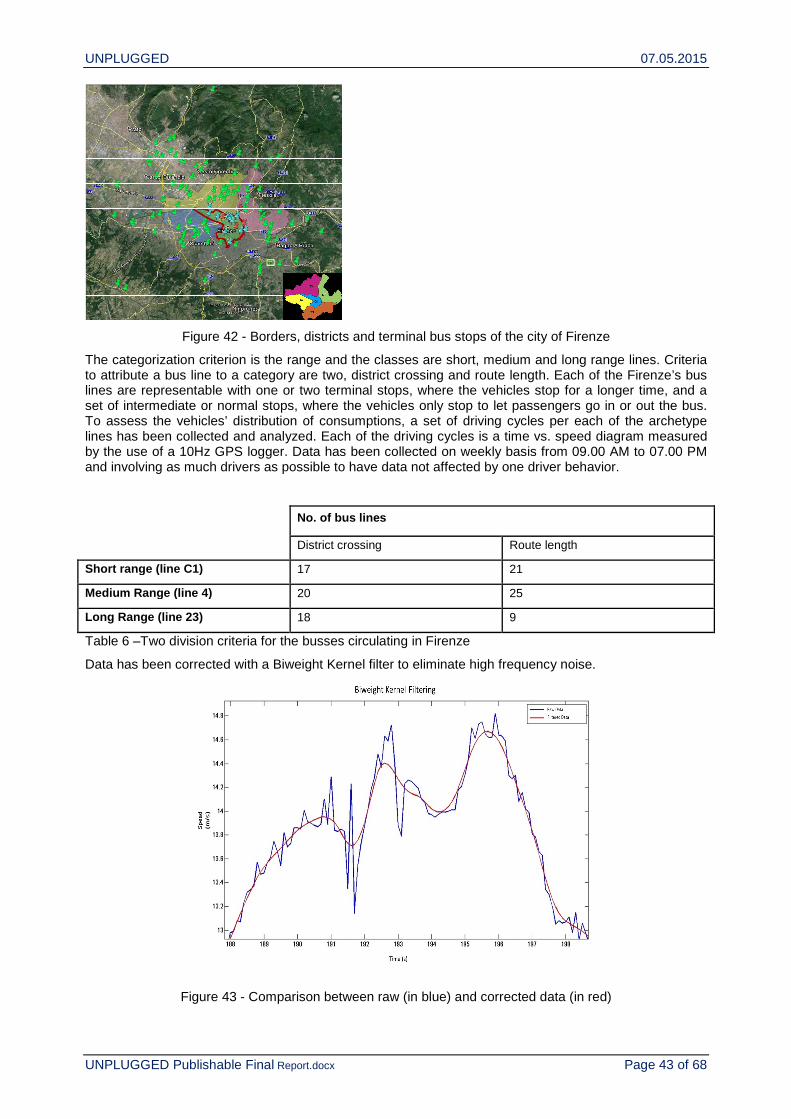
UNPLUGGED 07.05.2015
UNPLUGGED Publishable Final Report.docx Page 43 of 68
Figure 42 - Borders, districts and terminal bus stops of the city of Firenze
The categorization criterion is the range and the classes are short, medium and long range lines. Criteria to attribute a bus line to a category are two, district crossing and route length. Each of the Firenze’s bus lines are representable with one or two terminal stops, where the vehicles stop for a longer time, and a set of intermediate or normal stops, where the vehicles only stop to let passengers go in or out the bus. To assess the vehicles’ distribution of consumptions, a set of driving cycles per each of the archetype lines has been collected and analyzed. Each of the driving cycles is a time vs. speed diagram measured by the use of a 10Hz GPS logger. Data has been collected on weekly basis from 09.00 AM to 07.00 PM and involving as much drivers as possible to have data not affected by one driver behavior.
No. of bus lines
District crossing Route length
Short range (line C1) 17 21
Medium Range (line 4) 20 25
Long Range (line 23) 18 9
Table 6 –Two division criteria for the busses circulating in Firenze
Data has been corrected with a Biweight Kernel filter to eliminate high frequency noise.
Figure 43 - Comparison between raw (in blue) and corrected data (in red)
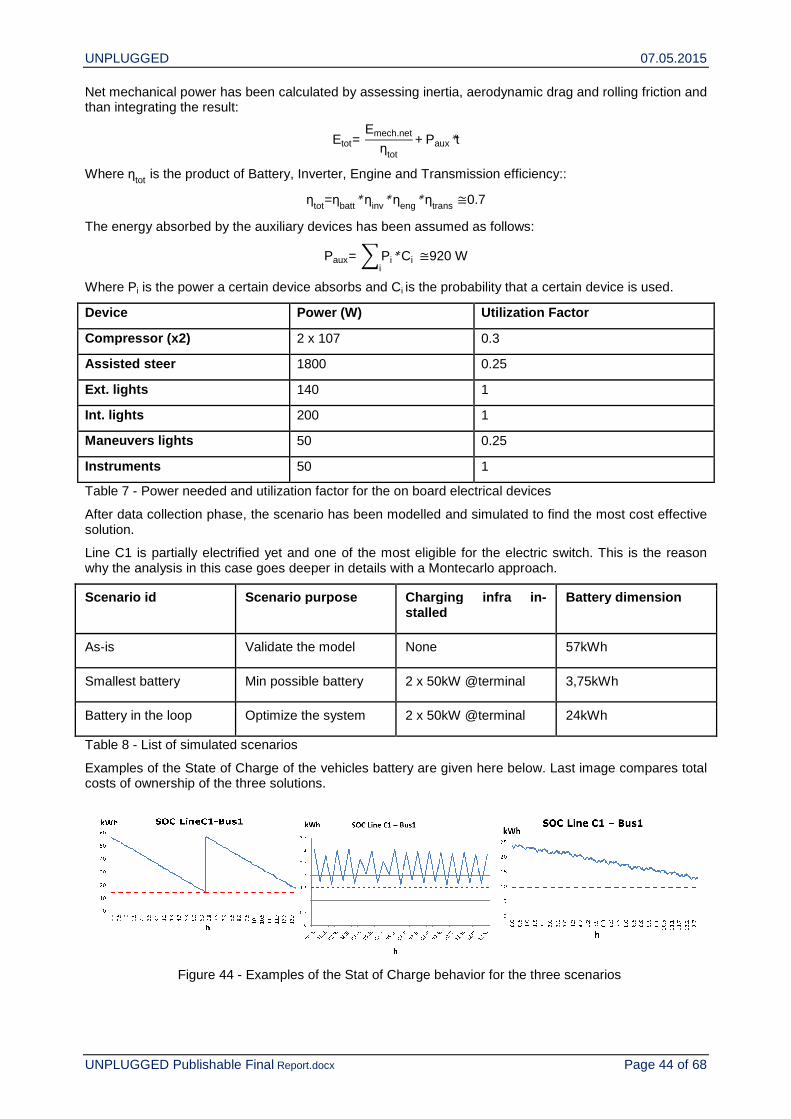
UNPLUGGED 07.05.2015
UNPLUGGED Publishable Final Report.docx Page 44 of 68
Net mechanical power has been calculated by assessing inertia, aerodynamic drag and rolling friction and than integrating the result:
Etot= Emech.net
ηtot
+ Paux*t
Where ηtot is the product of Battery, Inverter, Engine and Transmission efficiency::
ηtot=ηbatt* ηinv* ηeng* ηtrans ≅0.7
The energy absorbed by the auxiliary devices has been assumed as follows:
Paux= Pi* Cii
≅920 W
Where Pi is the power a certain device absorbs and Ci is the probability that a certain device is used.
Device Power (W) Utilization Factor
Compressor (x2) 2 x 10⁷ 0.3
Assisted steer 1800 0.25
Ext. lights 140 1
Int. lights 200 1
Maneuvers lights 50 0.25
Instruments 50 1
Table 7 - Power needed and utilization factor for the on board electrical devices
After data collection phase, the scenario has been modelled and simulated to find the most cost effective solution.
Line C1 is partially electrified yet and one of the most eligible for the electric switch. This is the reason why the analysis in this case goes deeper in details with a Montecarlo approach.
Scenario id Scenario purpose Charging infra i n-stalled
Battery dim ension
As-is Validate the model None 57kWh
Smallest battery Min possible battery 2 x 50kW @terminal 3,75kWh
Battery in the loop Optimize the system 2 x 50kW @terminal 24kWh
Table 8 - List of simulated scenarios
Examples of the State of Charge of the vehicles battery are given here below. Last image compares total costs of ownership of the three solutions.
Figure 44 - Examples of the Stat of Charge behavior for the three scenarios
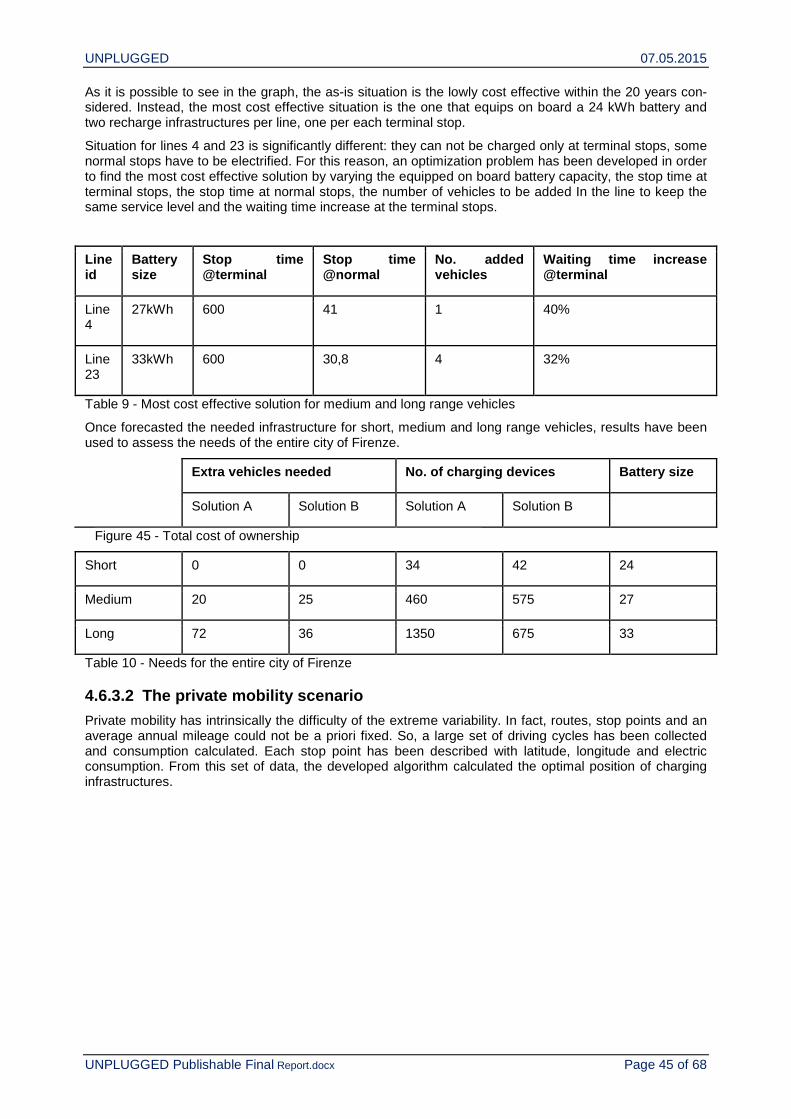
UNPLUGGED 07.05.2015
UNPLUGGED Publishable Final Report.docx Page 45 of 68
As it is possible to see in the graph, the as-is situation is the lowly cost effective within the 20 years con-sidered. Instead, the most cost effective situation is the one that equips on board a 24 kWh battery and two recharge infrastructures per line, one per each terminal stop.
Situation for lines 4 and 23 is significantly different: they can not be charged only at terminal stops, some normal stops have to be electrified. For this reason, an optimization problem has been developed in order to find the most cost effective solution by varying the equipped on board battery capacity, the stop time at terminal stops, the stop time at normal stops, the number of vehicles to be added In the line to keep the same service level and the waiting time increase at the terminal stops.
Line id
Battery size
Stop time @terminal
Stop time @normal
No. added vehicles
Waiting time increase @terminal
Line 4
27kWh 600 41 1 40%
Line 23
33kWh 600 30,8 4 32%
Table 9 - Most cost effective solution for medium and long range vehicles
Once forecasted the needed infrastructure for short, medium and long range vehicles, results have been used to assess the needs of the entire city of Firenze.
Ext ra vehicles needed No. of charging devices Battery size
Solution A Solution B Solution A Solution B
Short 0 0 34 42 24
Medium 20 25 460 575 27
Long 72 36 1350 675 33
Table 10 - Needs for the entire city of Firenze
4.6.3.2 The private mobility scenario
Private mobility has intrinsically the difficulty of the extreme variability. In fact, routes, stop points and an average annual mileage could not be a priori fixed. So, a large set of driving cycles has been collected and consumption calculated. Each stop point has been described with latitude, longitude and electric consumption. From this set of data, the developed algorithm calculated the optimal position of charging infrastructures.
Figure 45 - Total cost of ownership
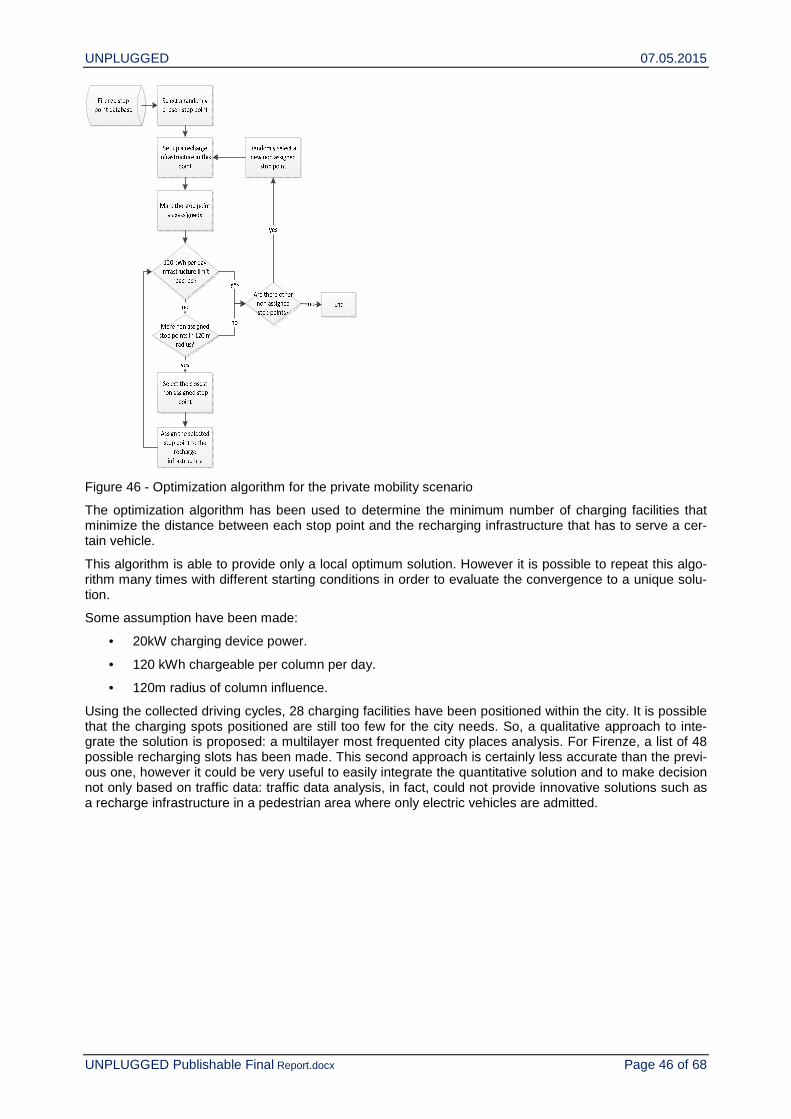
UNPLUGGED 07.05.2015
UNPLUGGED Publishable Final Report.docx Page 46 of 68
Figure 46 - Optimization algorithm for the private mobility scenario
The optimization algorithm has been used to determine the minimum number of charging facilities that minimize the distance between each stop point and the recharging infrastructure that has to serve a cer-tain vehicle.
This algorithm is able to provide only a local optimum solution. However it is possible to repeat this algo-rithm many times with different starting conditions in order to evaluate the convergence to a unique solu-tion.
Some assumption have been made:
• 20kW charging device power.
• 120 kWh chargeable per column per day.
• 120m radius of column influence.
Using the collected driving cycles, 28 charging facilities have been positioned within the city. It is possible that the charging spots positioned are still too few for the city needs. So, a qualitative approach to inte-grate the solution is proposed: a multilayer most frequented city places analysis. For Firenze, a list of 48 possible recharging slots has been made. This second approach is certainly less accurate than the previ-ous one, however it could be very useful to easily integrate the quantitative solution and to make decision not only based on traffic data: traffic data analysis, in fact, could not provide innovative solutions such as a recharge infrastructure in a pedestrian area where only electric vehicles are admitted.

UNPLUGGED 07.05.2015
UNPLUGGED Publishable Final Report.docx Page 47 of 68
Street name Lat Long Priority i n-dex
Typology
Piazza Mercato Centrale 43°46'36.61 11°15'14.11 5 City aggregation
Ospedale Careggi 43°48'12.50 11°14'45.09 5 City aggregation
Piazza Indipendenza 43°46'48.50 11°15'11.86 5 City center parking area
Via del Mezzetta e San Salvi
43°46'22.04 11°17'36.57 4 Municipality offices
Borgo san Frediano 43°46'11.33 11°14'35.65 4 Shops
… … … … …
Figure 47 - Charging facilities localization method (example)
4.6.3.3 The electric park&ride scenario
The eP+R is a parking area where people leave their BEVs, take public transportation vehicles, and find vehicles recharged, ready for the return trip. In our proposal, while inside the eP+R, BEVs can be used for V2G services:
• Energy trading - PTP uses the battery capacity to operate as energy buyer/seller, depending on electricity prices acting on national market. During the day, PTP buys energy at low price and re-sells it at high price.
• Storage, including spinning reserves and regulation - PTP is paid by TSO for use BEVs bat-teries as storage device, in order to not waste energy obtained from not programmable renewa-ble sources.
A revenue equation was defined for both services.
The simulation tool is based on Montecarlo method and it has been developed according to a parametric, time-driven (minute-by-minute) approach.
Main model inputs :
• BEVs models and features, number, arrival time and points of origin
• BEVs energy trading prices and energy supplier purchasing
• Dimensions of eP+R sites (number of parking places)
Main model outputs :
• Occupation rate of the eP+R
• Residual energy in BEVs batteries entering in the eP+R
• BEVs recharging energy at the end of residence time
• Hourly capacity and energy stored in the eP+R
• Power available from the eP+R
• Amount of energy sold or bought for V2G services
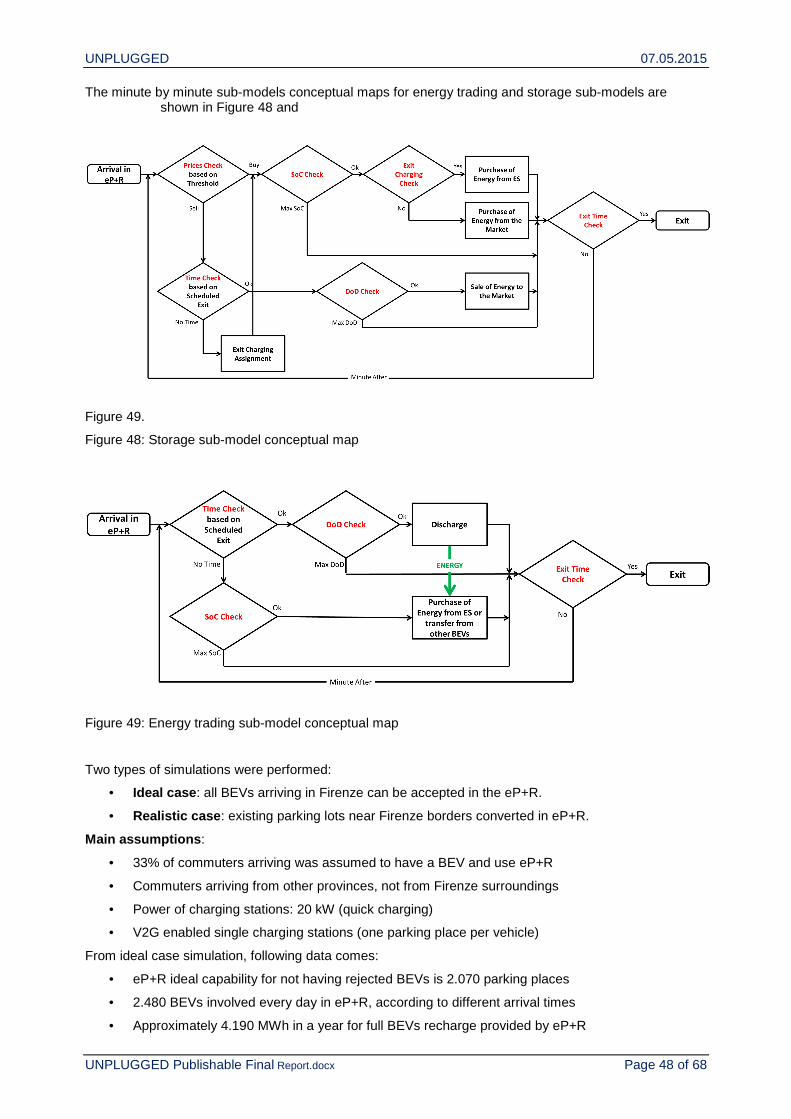
UNPLUGGED 07.05.2015
UNPLUGGED Publishable Final Report.docx Page 48 of 68
The minute by minute sub-models conceptual maps for energy trading and storage sub-models are shown in Figure 48 and
Figure 49.
Figure 48: Storage sub-model conceptual map
Figure 49: Energy trading sub-model conceptual map
Two types of simulations were performed:
• Ideal case : all BEVs arriving in Firenze can be accepted in the eP+R.
• Realistic case : existing parking lots near Firenze borders converted in eP+R.
Main assumptions :
• 33% of commuters arriving was assumed to have a BEV and use eP+R
• Commuters arriving from other provinces, not from Firenze surroundings
• Power of charging stations: 20 kW (quick charging)
• V2G enabled single charging stations (one parking place per vehicle)
From ideal case simulation, following data comes:
• eP+R ideal capability for not having rejected BEVs is 2.070 parking places
• 2.480 BEVs involved every day in eP+R, according to different arrival times
• Approximately 4.190 MWh in a year for full BEVs recharge provided by eP+R
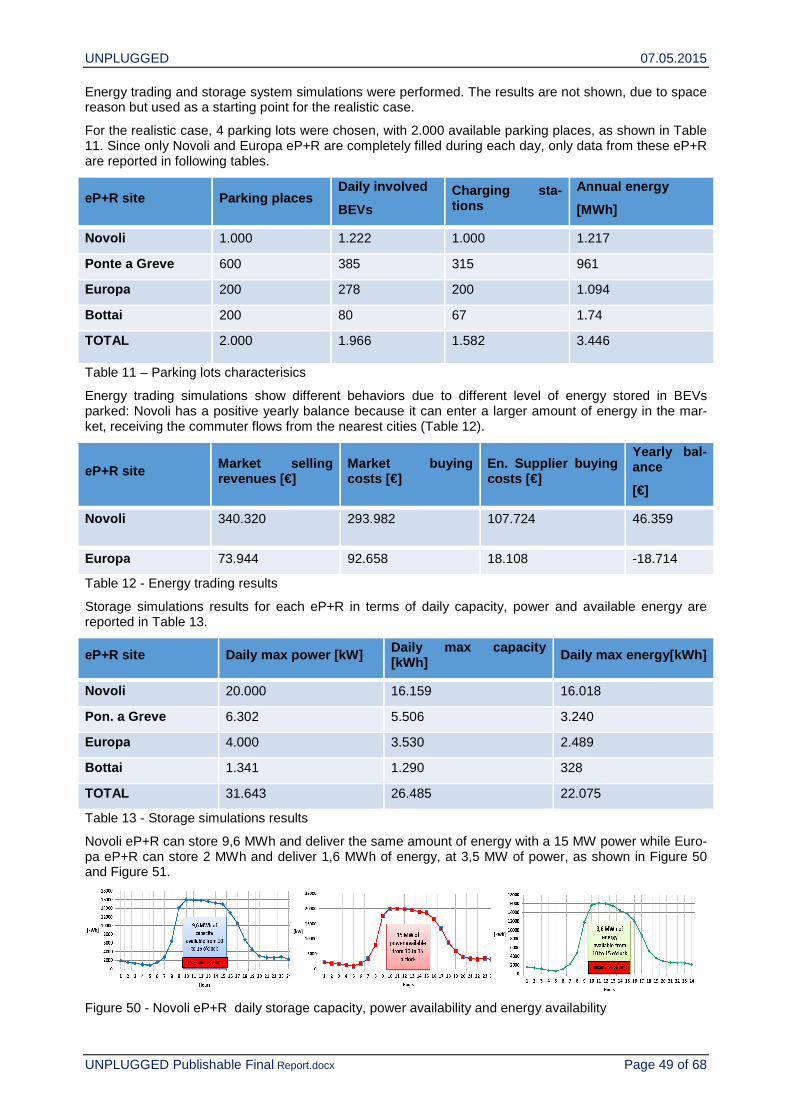
UNPLUGGED 07.05.2015
UNPLUGGED Publishable Final Report.docx Page 49 of 68
Energy trading and storage system simulations were performed. The results are not shown, due to space reason but used as a starting point for the realistic case.
For the realistic case, 4 parking lots were chosen, with 2.000 available parking places, as shown in Table 11. Since only Novoli and Europa eP+R are completely filled during each day, only data from these eP+R are reported in following tables.
eP+R site Parking places Daily involved
BEVs
Charging sta-tions
Annual energy
[MWh]
Novoli 1.000 1.222 1.000 1.217
Ponte a Greve 600 385 315 961
Europa 200 278 200 1.094
Bottai 200 80 67 1.74
TOTAL 2.000 1.966 1.582 3.446
Table 11 – Parking lots characterisics
Energy trading simulations show different behaviors due to different level of energy stored in BEVs parked: Novoli has a positive yearly balance because it can enter a larger amount of energy in the mar-ket, receiving the commuter flows from the nearest cities (Table 12).
eP+R site Market selling revenues [€]
Market buying costs [€]
En. Supplier buying costs [€]
Yearly ba l-ance
[€]
Novoli 340.320 293.982 107.724 46.359
Europa 73.944 92.658 18.108 -18.714
Table 12 - Energy trading results
Storage simulations results for each eP+R in terms of daily capacity, power and available energy are reported in Table 13.
eP+R site Daily max power [kW] Daily max capacity [kWh]
Daily max energy[kWh]
Novoli 20.000 16.159 16.018
Pon. a Greve 6.302 5.506 3.240
Europa 4.000 3.530 2.489
Bottai 1.341 1.290 328
TOTAL 31.643 26.485 22.075
Table 13 - Storage simulations results
Novoli eP+R can store 9,6 MWh and deliver the same amount of energy with a 15 MW power while Euro-pa eP+R can store 2 MWh and deliver 1,6 MWh of energy, at 3,5 MW of power, as shown in Figure 50 and Figure 51.
Figure 50 - Novoli eP+R daily storage capacity, power availability and energy availability
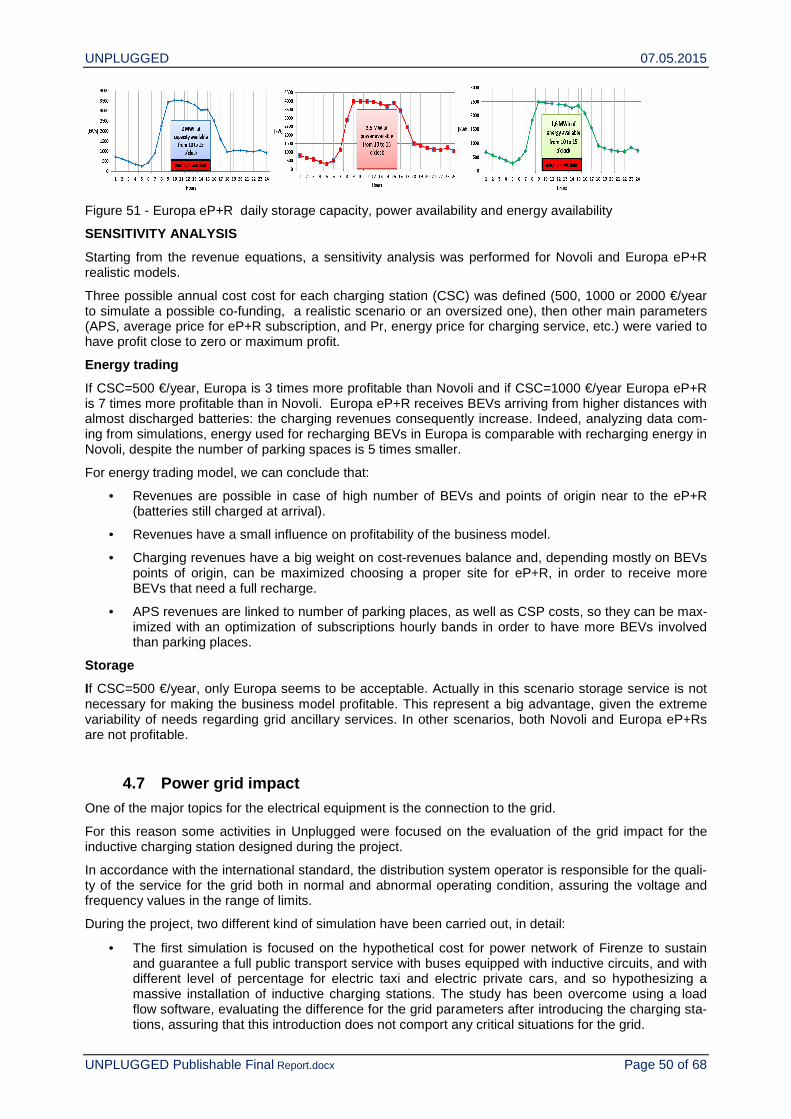
UNPLUGGED 07.05.2015
UNPLUGGED Publishable Final Report.docx Page 50 of 68
Figure 51 - Europa eP+R daily storage capacity, power availability and energy availability
SENSITIVITY ANALYSIS
Starting from the revenue equations, a sensitivity analysis was performed for Novoli and Europa eP+R realistic models.
Three possible annual cost cost for each charging station (CSC) was defined (500, 1000 or 2000 €/year to simulate a possible co-funding, a realistic scenario or an oversized one), then other main parameters (APS, average price for eP+R subscription, and Pr, energy price for charging service, etc.) were varied to have profit close to zero or maximum profit.
Energy trading
If CSC=500 €/year, Europa is 3 times more profitable than Novoli and if CSC=1000 €/year Europa eP+R is 7 times more profitable than in Novoli. Europa eP+R receives BEVs arriving from higher distances with almost discharged batteries: the charging revenues consequently increase. Indeed, analyzing data com-ing from simulations, energy used for recharging BEVs in Europa is comparable with recharging energy in Novoli, despite the number of parking spaces is 5 times smaller.
For energy trading model, we can conclude that:
• Revenues are possible in case of high number of BEVs and points of origin near to the eP+R (batteries still charged at arrival).
• Revenues have a small influence on profitability of the business model.
• Charging revenues have a big weight on cost-revenues balance and, depending mostly on BEVs points of origin, can be maximized choosing a proper site for eP+R, in order to receive more BEVs that need a full recharge.
• APS revenues are linked to number of parking places, as well as CSP costs, so they can be max-imized with an optimization of subscriptions hourly bands in order to have more BEVs involved than parking places.
Storage
If CSC=500 €/year, only Europa seems to be acceptable. Actually in this scenario storage service is not necessary for making the business model profitable. This represent a big advantage, given the extreme variability of needs regarding grid ancillary services. In other scenarios, both Novoli and Europa eP+Rs are not profitable.
4.7 Power grid impact
One of the major topics for the electrical equipment is the connection to the grid.
For this reason some activities in Unplugged were focused on the evaluation of the grid impact for the inductive charging station designed during the project.
In accordance with the international standard, the distribution system operator is responsible for the quali-ty of the service for the grid both in normal and abnormal operating condition, assuring the voltage and frequency values in the range of limits.
During the project, two different kind of simulation have been carried out, in detail:
• The first simulation is focused on the hypothetical cost for power network of Firenze to sustain and guarantee a full public transport service with buses equipped with inductive circuits, and with different level of percentage for electric taxi and electric private cars, and so hypothesizing a massive installation of inductive charging stations. The study has been overcome using a load flow software, evaluating the difference for the grid parameters after introducing the charging sta-tions, assuring that this introduction does not comport any critical situations for the grid.

UNPLUGGED 07.05.2015
UNPLUGGED Publishable Final Report.docx Page 51 of 68
Based on the gathered results, it is shown that the grid in Firenze is enough strong to avoid ex-cessive economic effort.
For the analysis all loads have been considered with a steady profile during all day, without the possibility of modulating the load as happen with the smart charging. Thus, with this possibility the grid operator can avoid useless reinforcement for upgrading the transformers.
The full study can be found in the deliverables 3.2 and 3.3.
• The second simulation regards the real impact of the designed inductive charging station, for which at Circe the voltage and current have been measured. These values were the input data for the simulation on a real Italian grid network and they have been considered in addition to the real consumption values recorded on one day in November 2013 for the line under analysis.
A first part of analysis was to evaluate the harmonic current and voltage in comparison with the international standard, while a second part referred to the
The results compared with the international standards limits show how the examined inductive charging station does not influence the network quality and the THD values are fully compliant to the limits. These results can be pinpointed to the great design of the inductive charging station.
The full analysis can be found in deliverable 2.4.
4.8 Standardization aspects
Due to the important role of the electric vehicles (EVs) in our society, different standards (such as nation-al, European and international) in a number of different organizations have attracted a lot of attention in electric vehicles and their powertrains. These standards impose specific limits, specifications and regula-tions that should be considered in order to enhance high performance systems. In unplugged project, three main tasks regarding the standardization activities have been performed. These tasks are described in the following subsections.
4.8.1 State of the art of standardization developme nts
In Unplugged project, a thorough state of the art of standardization developments for wireless power transfer (WPT) systems has been performed in order to review the existing and current standards at for the grid side as well as the vehicle side. This part dealt with different issues such as safety, electromag-netic fields, communications and electromagnetic compatibility (EMC), which should be considered on the particular case of the wireless charging systems developed within this project.
There is an extensive number of standards focused on electric vehicles (EVs), their relationships to the infrastructures and to their users. These standards and regulations are developed at different levels (such as International, European and National) in a number of different organizations. In the international level, the standardization is mainly dealt with by two institutions: the International Electrotechnical Commission (IEC) and International Organization for Standardization (ISO). In the IEC committees, many of the dele-gated experts are electricians or component manufacturers, while in ISO committee there is a much stronger input from vehicle manufacturers.
Within Europe, CENELEC and CEN operate as the pendants of IEC and ISO. Both have been active in electric vehicle standardization in the 1990s, through their technical committees CENELEC TC69X and CEN TC301. Within national level (such as Germany), DIN provides the stakeholders a platform for the development of standards as a service to industry. It means that DIN works closely with its stakeholders in order to develop consensus based standards that meet market requirements and regulations. In addi-tion, DIN represents Germany’s standardization interests as a member of CEN and ISO, while DKE rep-resents Germany’s standardization interests as a member of CENELEC and IEC.
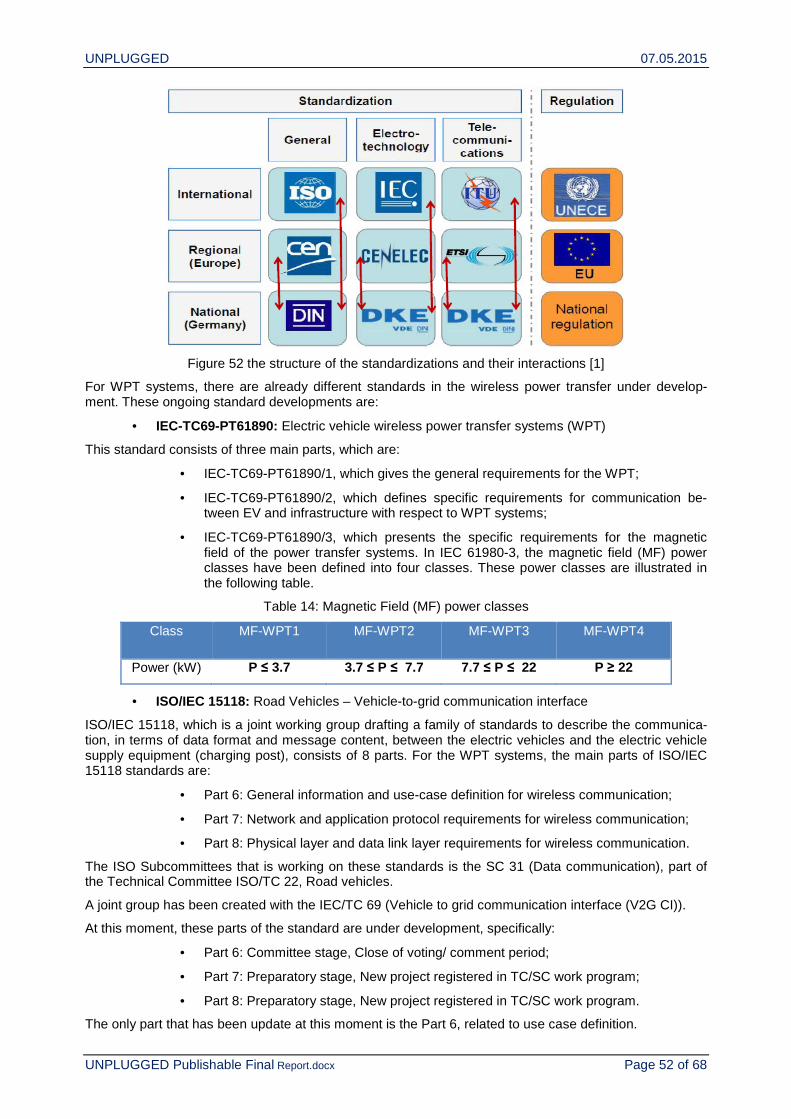
UNPLUGGED 07.05.2015
UNPLUGGED Publishable Final Report.docx Page 52 of 68
Figure 52 the structure of the standardizations and their interactions [1]
For WPT systems, there are already different standards in the wireless power transfer under develop-ment. These ongoing standard developments are:
• IEC-TC69-PT61890: Electric vehicle wireless power transfer systems (WPT)
This standard consists of three main parts, which are:
• IEC-TC69-PT61890/1, which gives the general requirements for the WPT;
• IEC-TC69-PT61890/2, which defines specific requirements for communication be-tween EV and infrastructure with respect to WPT systems;
• IEC-TC69-PT61890/3, which presents the specific requirements for the magnetic field of the power transfer systems. In IEC 61980-3, the magnetic field (MF) power classes have been defined into four classes. These power classes are illustrated in the following table.
Table 14: Magnetic Field (MF) power classes
Class MF-WPT1 MF-WPT2 MF-WPT3 MF-WPT4
Power (kW) P ≤ 3.7 3.7 ≤ P ≤ 7.7 7.7 ≤ P ≤ 22 P ≥ 22
• ISO/IEC 15118: Road Vehicles – Vehicle-to-grid communication interface
ISO/IEC 15118, which is a joint working group drafting a family of standards to describe the communica-tion, in terms of data format and message content, between the electric vehicles and the electric vehicle supply equipment (charging post), consists of 8 parts. For the WPT systems, the main parts of ISO/IEC 15118 standards are:
• Part 6: General information and use-case definition for wireless communication;
• Part 7: Network and application protocol requirements for wireless communication;
• Part 8: Physical layer and data link layer requirements for wireless communication.
The ISO Subcommittees that is working on these standards is the SC 31 (Data communication), part of the Technical Committee ISO/TC 22, Road vehicles.
A joint group has been created with the IEC/TC 69 (Vehicle to grid communication interface (V2G CI)).
At this moment, these parts of the standard are under development, specifically:
• Part 6: Committee stage, Close of voting/ comment period;
• Part 7: Preparatory stage, New project registered in TC/SC work program;
• Part 8: Preparatory stage, New project registered in TC/SC work program.
The only part that has been update at this moment is the Part 6, related to use case definition.

UNPLUGGED 07.05.2015
UNPLUGGED Publishable Final Report.docx Page 53 of 68
This part of this International Standard specifies a wireless communication link as an alternative to the existing wired communication link included in ISO/IEC 15118-3 standard (“Physical layer and Data Link layer requirements”). It introduces additional requirements with respect to Part 1 (General Requirements), specific for wireless charging communication interface, taking into account that no action of plug-in is required for WPT. This standard specifies the communication infrastructure requirements on both SECC and EVCC sides:
• SECC may control one or many EVSEs and may broadcast identification and infor-mation for discovery association
• EV discovery and association may be possible without driver action.
Actors defined in the Part 6 are the same described in Part 1:
• Primary Actors: EV and EVSE, EVCC and SECC, User, HMI, etc.
• Secondary Actors: E-Mobility Operator clearing house, Demand Clearing House, OEM, etc.
• DKE AK 353.0.1 standards for wireless charging syst ems
Currently, several basic technical framework conditions for the inductive charging of electric vehicles are being developed in various projects within German standardization bodies. At present, well-founded standards proposals can only be drawn up when the results of these projects are available. Further course of action concerning the standards proposal submitted to the IEC (IEC 61980-1 “Electric vehicle inductive charging systems”) has been identified within DKE AK 353.0.1. Active and timely participation of German experts at international level is planned in order to prevent the premature standardization of technical solutions, which would inhibit technical progress and unnecessarily restrict the diversity of good solutions. The content of FDIS 61980-1 will be the base for a DIN-EN standard planned for 2016.
• ISO 19363 relevant aspects: Electrically propelled road vehicles-Inductive wireless connec-tion to an external electric power supply-Interoperability and Safety requirements
ISO 19363 standard is related to the vehicle side of wireless charging. ISO TC 22 SC 21 is the group that will work on it. The purpose of the standard development is to define specific installation conditions; both for voltage class A (maximum working voltage ≤ 25 Vac or ≤ 60 Vdc) and class B (> 25 and ≤ 1000 Vac or > 60 and ≤ 1500 Vdc). Requirements and definitions are strongly needed in order to guarantee interoper-ability, safe connection and safety requirements for the interface with a wireless external electric power supplies, constituting a Wireless Power Transfer System (WPT). The first content of the proposal should define and specify the needed requirements for the following aspects:
• Secondary device specifications in terms of general requirements, working frequency, power class, location and dimensions, command controls, efficiency;
• Protection of person against electric shock in terms of protection against direct con-tact and single failure, isolation resistance;
• Thermal protection for an overcurrent and fire hazard;
• Protection of human against the electromagnetic field;
• Power supply specifications considering the disconnection functions and devices and control commands;
• Test procedures in terms of interoperability, safety and construction.
• ISO 26262 relevant aspects: Road Vehicles – Functio nal Safety
ISO 26262 standard is the adaptation of IEC 61508 to achieve the needed specifications of Electri-cal/Electronic/programmable electronic (E/E/PE) safety-related systems for the road vehicles. This adap-tion deals with the functional safety, which is one of the key issues of future vehicle generations. Further-more, ISO 26262 standard provides a guidance to avoid any risk by offering feasible requirements and processes. As mentioned in ISO 26262, the safety of the system can be achieved through a number of safety measures that are carried out in different technologies. The main objectives of ISO26262 are:
• providing an automotive safety lifecycle;
• providing an automotive specific risk-based approach for determining risk classes;
UNPLUGGED 07.05.2015
UNPLUGGED Publishable Final Report.docx Page 54 of 68
• using ASILs for specifying the item’s necessary safety requirements; and
• describing the requirements for validation and confirmation measures to ensure a suf-ficient and acceptable level of safety.
4.8.2 Standardization Analysis for WPT systems
In Unplugged project, this second part is given the analysis of the ongoing standardization work and the relevant standards that should be considered for the wireless charging systems for electric vehicle appli-cations. This analysis covered the following items:
• Interaction between global standards and national standards;
• Electric Grid Regulations and standards: Primary Side of the WPT;
• Electric Regulations and Standards: Secondary Side of the WPT;
• Electromagnetic Compatibility (EMC) Standards;
• Electric Component Standards;
• Safety Requirements and Regulations.
IEC 61980-1 concerns the general requirements for WPT system with a connection to the supply network up to 1000 V a.c. and 1500 V d.c.; general requirements can be pinpointed to electromagnetic compatibil-ity, electrical safety, operational indication and functional characteristics, without involving the mainte-nance aspects. It reports all connection points have to be equipped as protection against electric shock based on the IEC 61851-1. In addition, the IEC 61980-1 refers to IEC 60068-2-3 test procedure for the leakage current and insulation resistance. Therefore, the WPT systems when it works at its nominal volt-age and provides maximum output power and current, has to be designed to guarantee the insulation resistance with a 500 V DC voltage applied between all inputs/outputs, leakage- touch current and the impulse dielectric. Moreover, the protection against overcurrent and overvoltage shall be assured and shall comply with the requirements of IEC 60364-4-43/-44 and IEC 60364-7-722. In order to guarantee a correct behavior in normal service condition and avoid a degradation of performance, the WPT system supply components are tested in different conditions.
In general, the EMC shall be guaranteed according to IEC 61851-21-1 and IEC 61851-21-2 for the charger devices. These standards provide EMC requirements in case of conductive charging for the on board and off board charger equipment. Furthermore, the immunity requirements are provided including the performance criterion. In order to evaluate the harmonic nuisance at low frequency of the WPT sys-tem connected to the low voltage AC grid, the system shall be compliant to IEC 61000-3-2 and IEC 61000-3-12, respectively for input current less than or equal 16 A per phase or greater than 16 A up to 75 A per phase. These standards indicate the harmonic distortion for each harmonic order and the total har-monic distortion (THD) value. The emission of voltage fluctuation and flicker shall comply with IEC 61000-3-11 for an input current from 16 A up to 75 A per phase. Analysis of the impact of the high frequency, conducted emissions and radiated emissions shall be evaluated in accordance with CISPR 11. It also provides more information regarding the parking lot with its measurements and the installation of the pri-mary circuit and air gap in detail.
Due to the fact of developing a new EMC standards for WPT, which the IEC 61980-3 standard is still in development and draft versions, the secondary part of the WPT system must follow the IEC 61000 stand-ards, especially part 6.3. This standard is applicable to systems installed in public streets. IEC 61000-6-3 sets the tests to be made in order to evaluate the charger and indicates the standards that regulate these tests: IEC 61000-3-2, IEC 61000-3-3, IEC 61000-3-11, IEC 61000-3-12, CISPR 16 and CISPR 22. These standards are still applicable for the secondary part of the WPT. As a starting point, the WPT must meet the following rules:
• Directive 2009/19/EC from the Commission, which modifies Directive 72/245/CEE, which was the first European Directive related to vehicle EMC characteristics. This directive, among other as-pects, sets a group of standards related to electromagnetic compatibility that every vehicle, in-cluding electric vehicles with inductive charging must meet to be marketed in the European Un-ion.
• Regulation 10.4 from the United Nations: This Regulation, ‘Uniform provisions concerning the ap-proval of vehicles with regard to electromagnetic compatibility’, describes all the requirements to be met and the standards to be followed so that any vehicle does not introduce intolerable elec-tromagnetic disturbances to the environment.

UNPLUGGED 07.05.2015
UNPLUGGED Publishable Final Report.docx Page 55 of 68
In electric components standards, the electrical components of the WPT system shall fulfil different spe-cific requirements. To make sure that all the components are in accordance with the requirements in IEC 61980-1, this standard proposes a series of tests, which have to be performed under special test condi-tions. This section describes some of the tests and requirements for the electrical components in WPT systems, which are proposed by the part 1. For further information please check the IEC 61980. For ex-ample, there are fixed limits for leakage/touch current that have to be tested under specific conditions. Another test is to measure the insulation resistance, applying 500V DC between all the inputs and outputs connected together and the accessible parts. On one hand, the insulation resistance shall be R≥1MΩ for a class I equipment and R ≥ 7MΩ for a class II equipment. On the another hand, the control of the tem-perature during continuous charging is also very important in order to ensure that the temperature rise does not damage current-carrying parts or adjacent parts of the equipment.
For the construction materials, it is also necessary to test the behaviour of the materials used for the con-struction of the WPT system. The materials shall be capable of withstanding the mechanical, electrical, thermal and environmental stresses of the different operating conditions. In the following table, some of the tests for the materials are summarized.
Table 15: Different tested characteristics for WPT systems
Test Characteristics Definition Norm
Stability/Mechanical impact
It defines the minimum degree of the protection against the mechanical impact for locations ac-cording to the restricted access (IK07), and non-restricted access (IK08 -IK10 depending on the system).
IEC 62262, IEC 61439-7
Mechanical load A force of 500N shall be applied for 5 minutes in the all the horizontal direction of the ground mounted equipment.
61439-7
Strength of materials and parts
Tests to make sure the protection against corro-sion shall be done
61439-1
Environmental con-ditions
The WPT system shall be designed to resist the effect of normal automotive solvents and fluids, vibration, shock and material flammability stand-ards.
IEC 61300-2-34
Properties of insulat-ing materials
Tests for verification of thermal stability of enclo-sures, resistance to fire, resistance to ultra-violet radiation etc.
61439-1, IEC 60695-2-11, IEC 60695-10-2, IEC 60112, IEC
61439-1
For mounting the primary device, taking into account the mechanical air gab, there are different mounting types for the primary device:
• In-ground-mounting (at or below surface) • On-ground-mounting
According to In-ground-mounting system, the primary device is completely embedded in the ground and mounted flush with the road surface, while the primary device is mounted on or below the surface. How-ever, the distance between the secondary device and the primary device is smaller than the vehicle ground clearance underneath the secondary device. In the VDE-AR-E 2122-4-2 regulations, there are guidelines should be considered for primary side mounting. According to these guidelines, in the case of in-ground-mounting system, the secondary device shall be installed where the electrical air gap is be-tween 100 mm and 170 mm. For the on-ground-mounting system, the mounting height can be from 0 mm to 50 mm and the distance between the two devices, for maximum mounting height, shall be from 50 mm to 120 mm (in order to fulfil the same values of electrical air gab as for the in-ground-mounting system).
4.8.3 New Standardization developments for WPT syst ems
Based on the main findings in unplugged project, the first objective of this part was to give a feedback to the standardization committees at national level and international level, focusing on the electrotechnical

UNPLUGGED 07.05.2015
UNPLUGGED Publishable Final Report.docx Page 56 of 68
side as well as automotive side. The second objective was to develop a new draft of compatibility stand-ards defining dimensional and functional interchangeability requirement, which may identify the specific gaps where an additional standardization work may be usefully considered.
The consortium has proposed a new annex on the design specifications for a 50 kW magnetic field (MF) WPT for heavy-duty vehicles. This MF-WPT system comprises a primary device of two coils rated 25 kW and a secondary device of two coils rated 25 kW. The primary device can be mounted in the ground or on the ground according to IEC 61980-1.
In the current standard IEC 61980-3 (still under development), four power classes are defined, which are illustrated in Table 14. Since WPT systems with power greater than 100 kW are existing, it would be pref-erable to change these power classes. Furthermore, in Unplugged project, a 50 kW of two coils rated 25 kW has been developed and implemented. Based on the obtained results, it is shown that there is a dif-ference in the B- field measurements between the WPT of power rated 25 kW and rated 50 kW. There-fore, there is a need to change the power classes that have been proposed in IEC 61980-3 by adding extra power classes as demonstrated in Table 16.
Table 16: The proposed magnetic Field (MF) power classes
Class MF-WPT1 MF-WPT2 MF-WPT3 MF-WPT4 MF-WPT5 MF-WPT6
Power (kW) P ≤ 3.7 3.7 ≤ P ≤ 7.7 7.7 ≤ P ≤ 22 22 ≤ P ≤ 50 50 ≤ P ≤ 100 P ≥ 100
Regarding the wireless communication protocols, wireless communication protocol applied in Unplugged Project is derived from ISO 15118 standard. Communication between infrastructure and vehicle is derived from wired communication part, being wireless communication (both for wired and wireless charge) still in an earlier development phase.
Experience of Unplugged Project has been based on CAN communication with the integration of CAN-wireless gateways on infrastructure and vehicle side. The communication protocol has been implemented during the project activities, and after first testing phases, some improvements in the protocol have been considered. In particular, differently from the wired case, it is useful to consider the following aspects:
• no plug action is required for wireless charging scenario; • it is not strictly necessary to have the vehicle parked to access High Level Communication
and optional Values Added Services; • enable and starting of charging phase can be made on infrastructure side AND/OR on vehicle
side. These additional possibilities have been inserted in the developed and implemented protocol for Un-plugged project. Additional requirements on management of High Level Communication and Values Added Services could be developed in new proposal, for improvement of wireless charging integration in electric distribution grid. Furthermore, additional consideration on encryption of sensitive data trans-ferred over wireless must be considered. A fault tolerant as well as flexible (changing environment, dif-ferent protocols) wireless link with data encryption capability and safe against manipulation and hacking) needs to be taken into account.
It can be concluded that in all development steps the current standards and standardized procedures are used. However, as an input for current standardization activities, the following aspects can be considered more in detail and the results out of UNPUGGED could contribute to current standardization activities:
• Sequence description and timing;
• Certificate handling;
• Identification, authentication and authorization procedure.
UNPLUGGED 07.05.2015
UNPLUGGED Publishable Final Report.docx Page 57 of 68
5 Potential impact Socio economic impact has also been investigated within the project because any technology could be successful only if appreciated and useful for the end users. Parameters involved to investigate this issue are the impact on the environment and the user propensity to move to a different mobility paradigm. In this paragraph, the results of an online survey designed to investigate the social acceptance of wireless charging for EVs, undertaken by VUB and TRL in Belgium and the UK respectively, and an environmental impact assessment for the introduction of wireless charging technology in cities will be presented. In the next paragraph the benefits on the environment achievable with a different mobility paradigm are report-ed.
5.1 Social acceptance of the wireless charging tech nology
Two approaches have been used to assess the social acceptance of the possible customers:
• a survey carried out by VUB based on the Living Labs project to seek high level opinions from EV trial participants in Belgium on their interest in wireless charging for EVs
• a TRL survey of EV trial participants and key UK stakeholders via an online survey to enable us-ers and stakeholders to offer opinions and information on wireless power transfers (WPT) for electric vehicles (EVs).
Most of the respondents to the TRL questionnaire were from the UK. Although some responses received were from other European countries and the USA, the numbers were too low to be able to include them in the analysis. Therefore, the TRL survey analysis represents an assessment of social acceptance of WPT for EVs in the UK and VUB analysis represents an assessment of social acceptance of WPT for EVs in Belgium.
Key outcomes from the TRL study:
Overall, the majority of respondents seem to think that wirelessly charged vehicles are a good idea. Stakeholders may be slightly less optimistic about WPT vehicles and infrastructure than private users. This may be due stakeholders having more awareness of WPT and its possible drawbacks, for example possible high costs of infrastructure, versus potential benefits. Reduced running costs were highlighted as one of the main potential benefits for private users. Stakeholders saw reduction in CO2 and improved air quality as their key benefits.
Concerns highlighted in the comments section of the survey included possible unknown health and safety issues due to EM radiation, additional expenditure on vehicles, infrastructure and electricity, and skepti-cism over environmental benefits when compared to current vehicles.
In conclusion, the study demonstrates that the stakeholder group was slightly less positive than the pri-vate users group. All stakeholders were aware of wireless inductive charging before starting the ques-tionnaire. This may account for the slightly less positive response. Stakeholders are more aware of any possible issues or challenges relating to the uptake of wirelessly charged vehicles.
Looking at investment and costs of electric vehicles, most respondents indicated they would be willing to pay extra for a vehicle with wireless charging capability. Only a small minority indicated they would be willing to pay less for a wirelessly charged electric vehicle.
Significantly, approximately one third of private user respondents indicated they would not be willing to pay towards public wireless charging infrastructure. Those who would be willing to invest in wireless charging infrastructure indicated, on average, that they would only invest if WPT vehicles made up twenty percent of the total vehicle fleet.
On being asked to consider the importance of various factors when considering investing in wireless charging vehicles and infrastructure, the most important factor to both groups was indicated to be ‘im-proved practicality/simplicity of charging’, i.e. making EVs easier to use. Reduced running costs were very important to private users, while ‘CO2 reduction’ and ‘air quality improvement’ were very important to stakeholders.
When considering standard electric vehicles against wirelessly charged vehicles, the majority of respond-ents think that the costs of bus and taxi services would be the same.

UNPLUGGED 07.05.2015
UNPLUGGED Publishable Final Report.docx Page 58 of 68
The additional comments made support to some extent the above conclusions. Respondents queried the potential costs of the wireless charging systems, both installation and maintenance. Other comments related to concerns over system interoperability.
There were also a number of respondents who had concerns that there may be a possibility of health impacts from EM radiation, including on wildlife. Such concerns, even though not founded on any current evidence, may be of importance to public opinion if wireless charging becomes widespread. The com-ments also mentioned other potential detrimental effects of wireless charging, such as having a negative influence on mobile phone and wi-fi signals.
Key outcomes from the VUB study:
This section presents the VUB social acceptance study that took place in Belgium, based at the Flemish Living Lab Electric Vehicles.This is a program to facilitate and accelerate the innovation and adoption of electric vehicles in the Flemish region, which addresses a variety of scientific research topics. Not only pure technological topics but also socio-economic aspects are examined. These include topics such as market potential analyses, travel and purchase behavior. They also cover expectations, opinions and attitudes.
Within this living lab, a test panel of consumers was selected to try out and test an electric vehicle. A total of 96 test families have integrated an EV into their daily lives. In return, they had to complete a survey before and after testing the vehicle.
This analysis focuses on inductive charging, more specifically the attractiveness of this type of charging in Belgium. This topic was mainly covered in questions that were answered after the testing period.
Respondents who were able to integrate an electric car in their daily life showed some interest in the technology of inductive wireless charging. As a result, inductive charging systems could be an option to improve the consumer acceptance for EVs since it is easier to use and safer than any other charging or refueling methods. More importantly, this technology gives the EV a competitive advantage compared to conventional cars because no stops are needed in order to recharge, if used en-route. When following the wireless trend of other electronic devices, wireless charging of EVs could increase the level of flexibility for consumers of electro-mobility, which is currently perceived as being too low.
On the other hand, this relatively new technology does not convince people to buy an EV. The majority would not consider the installation of wireless charging and would not be willing to pay more for such a charging session in public places.
5.2 Environmental impact assessment – the case stud y of Firenze and London
This task modelled introduction of wireless charging into London city in order to provide a high level as-sessment of socio-economic and environmental impacts of inductive charging in London. The work de-scribed in this section extends to additional vehicle types (taxis, vans and cars) and to an additional Eu-ropean city, Firenze (IT). The bus scenario is provided, in addition, also for the city of Barcelona (E).
The models in general show that switching to an EV fleet and an Unplugged EV fleet, even by as little as 5%, can offer cost savings when capital, operating and societal costs are all taken into consideration, provided certain assumptions are taken into account as described in further detail in the report.
The impacts of WPT are difficult to isolate because the role of WPT is largely to facilitate more practical use of EVs and increase the proportion of electric-only distance driven. Therefore, a like–for–like compar-ison would require increasing the electric-only mileage per year for all vehicles considered, which then results in increased costs for fuel and maintenance, as well as higher emissions. It is thus not possible to fully quantify the possible socio-economic impacts of the introduction of WPT charging in this analysis. The analysis does however highlight that the introduction of WPT charging would facilitate achieving the benefits for EVs for higher proportion of fleets being converted; this is because without WPT charging, it would not be practical to replace some standard vehicles with EVs due to range constraints and long charging times.
In next paragraphs, the analysis for cars, vans, taxi and buses will be reported.
5.2.1 Summary for private cars scenario
When comparing the two fleets below it should be noted that London has approximately ten times as many cars as Firenze. This may make a difference to some of the comparative results. The total number
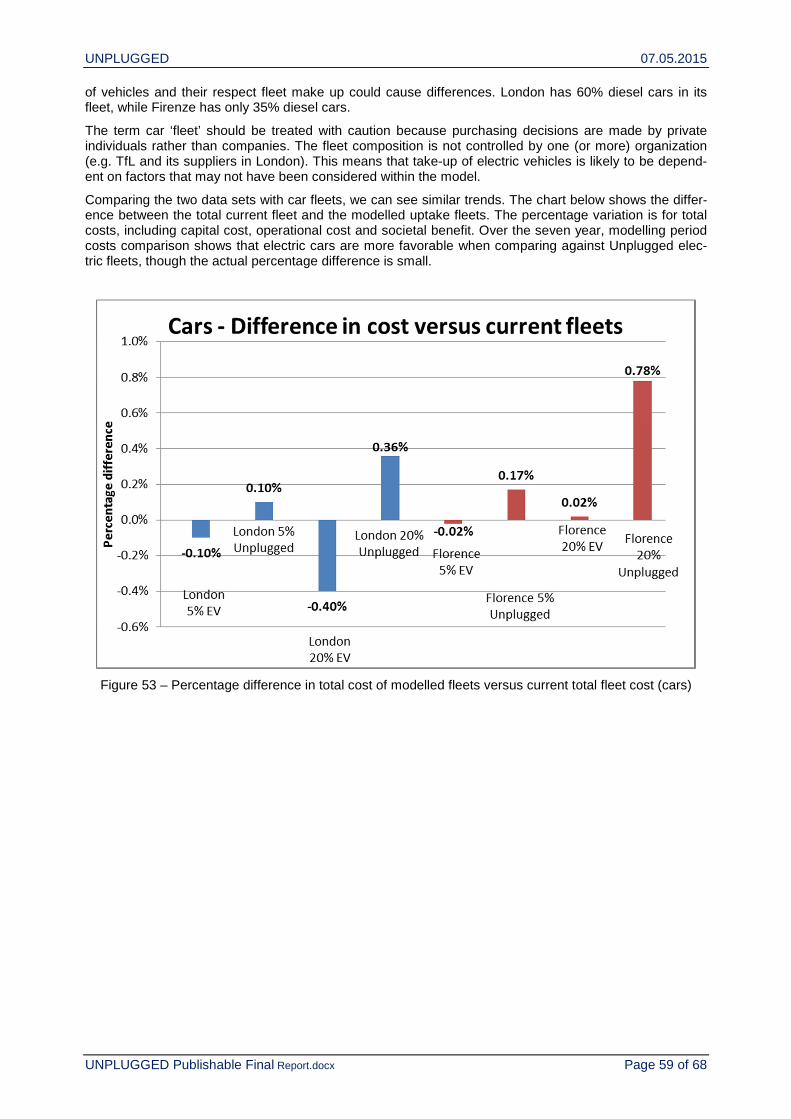
UNPLUGGED 07.05.2015
UNPLUGGED Publishable Final Report.docx Page 59 of 68
of vehicles and their respect fleet make up could cause differences. London has 60% diesel cars in its fleet, while Firenze has only 35% diesel cars.
The term car ‘fleet’ should be treated with caution because purchasing decisions are made by private individuals rather than companies. The fleet composition is not controlled by one (or more) organization (e.g. TfL and its suppliers in London). This means that take-up of electric vehicles is likely to be depend-ent on factors that may not have been considered within the model.
Comparing the two data sets with car fleets, we can see similar trends. The chart below shows the differ-ence between the total current fleet and the modelled uptake fleets. The percentage variation is for total costs, including capital cost, operational cost and societal benefit. Over the seven year, modelling period costs comparison shows that electric cars are more favorable when comparing against Unplugged elec-tric fleets, though the actual percentage difference is small.
Figure 53 – Percentage difference in total cost of modelled fleets versus current total fleet cost (cars)
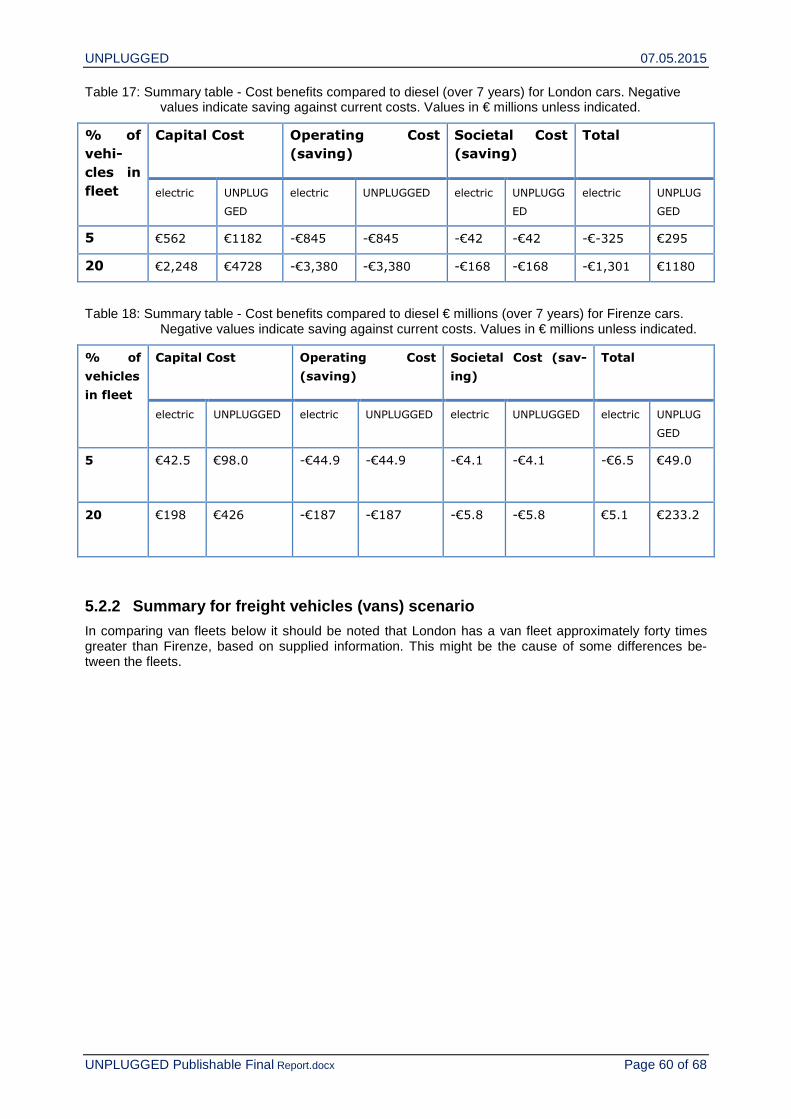
UNPLUGGED 07.05.2015
UNPLUGGED Publishable Final Report.docx Page 60 of 68
Table 17: Summary table - Cost benefits compared to diesel (over 7 years) for London cars. Negative values indicate saving against current costs. Values in € millions unless indicated.
% of
vehi-
cles in
fleet
Capital Cost Operating Cost
(saving)
Societal Cost
(saving)
Total
electric UNPLUG
GED
electric UNPLUGGED electric UNPLUGG
ED
electric UNPLUG
GED
5 €562 €1182 -€845 -€845 -€42 -€42 -€-325 €295
20 €2,248 €4728 -€3,380 -€3,380 -€168 -€168 -€1,301 €1180
Table 18: Summary table - Cost benefits compared to diesel € millions (over 7 years) for Firenze cars. Negative values indicate saving against current costs. Values in € millions unless indicated.
% of
vehicles
in fleet
Capital Cost Operating Cost
(saving)
Societal Cost (sav-
ing)
Total
electric UNPLUGGED electric UNPLUGGED electric UNPLUGGED electric UNPLUG
GED
5 €42.5 €98.0 -€44.9 -€44.9 -€4.1 -€4.1 -€6.5
€49.0
20 €198 €426
-€187 -€187 -€5.8 -€5.8 €5.1 €233.2
5.2.2 Summary for freight vehicles (vans) scenario
In comparing van fleets below it should be noted that London has a van fleet approximately forty times greater than Firenze, based on supplied information. This might be the cause of some differences be-tween the fleets.
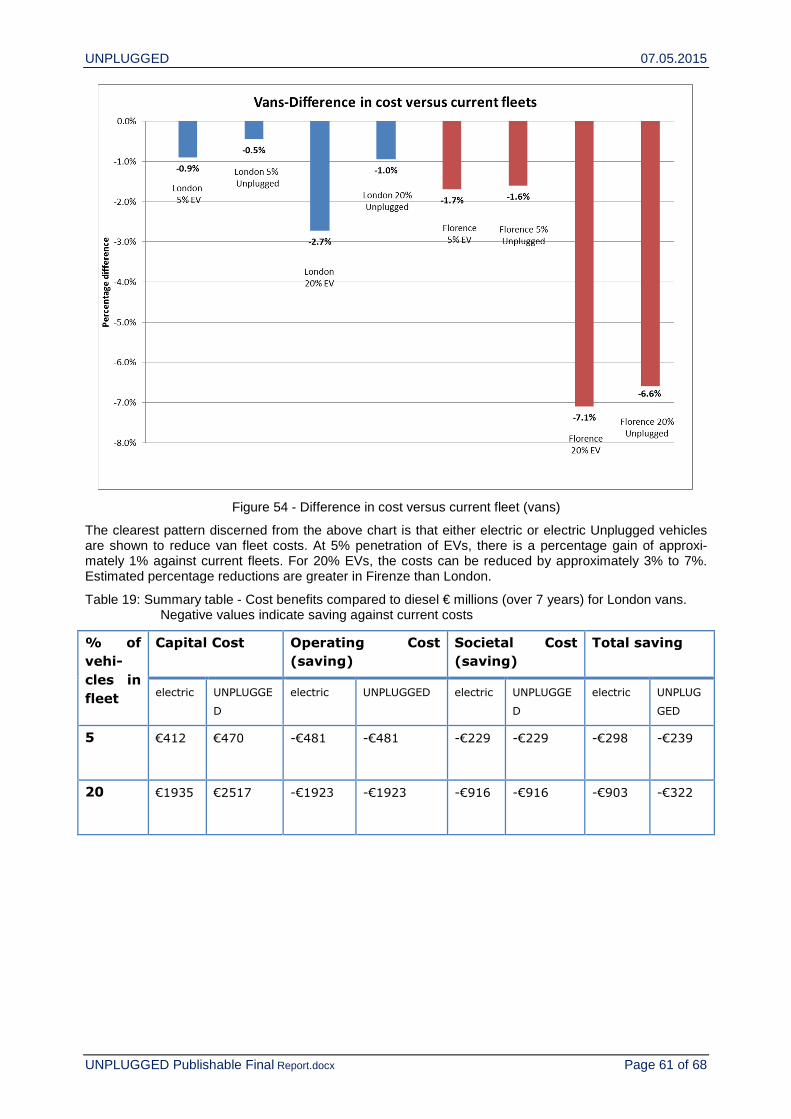
UNPLUGGED 07.05.2015
UNPLUGGED Publishable Final Report.docx Page 61 of 68
Figure 54 - Difference in cost versus current fleet (vans)
The clearest pattern discerned from the above chart is that either electric or electric Unplugged vehicles are shown to reduce van fleet costs. At 5% penetration of EVs, there is a percentage gain of approxi-mately 1% against current fleets. For 20% EVs, the costs can be reduced by approximately 3% to 7%. Estimated percentage reductions are greater in Firenze than London.
Table 19: Summary table - Cost benefits compared to diesel € millions (over 7 years) for London vans. Negative values indicate saving against current costs
% of
vehi-
cles in
fleet
Capital Cost Operating Cost
(saving)
Societal Cost
(saving)
Total saving
electric UNPLUGGE
D
electric UNPLUGGED electric UNPLUGGE
D
electric UNPLUG
GED
5 €412 €470 -€481 -€481 -€229 -€229 -€298
-€239
20 €1935 €2517 -€1923 -€1923 -€916 -€916 -€903
-€322
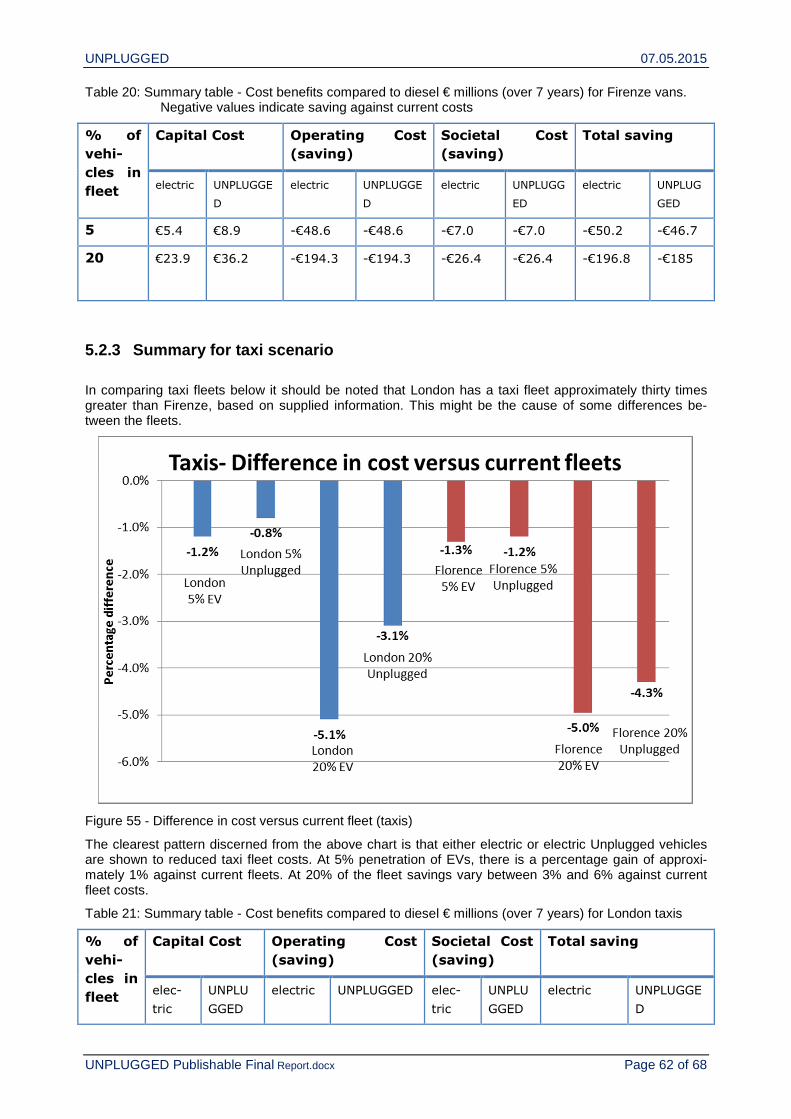
UNPLUGGED 07.05.2015
UNPLUGGED Publishable Final Report.docx Page 62 of 68
Table 20: Summary table - Cost benefits compared to diesel € millions (over 7 years) for Firenze vans. Negative values indicate saving against current costs
% of
vehi-
cles in
fleet
Capital Cost Operating Cost
(saving)
Societal Cost
(saving)
Total saving
electric UNPLUGGE
D
electric UNPLUGGE
D
electric UNPLUGG
ED
electric UNPLUG
GED
5 €5.4 €8.9 -€48.6 -€48.6 -€7.0 -€7.0 -€50.2 -€46.7
20 €23.9 €36.2 -€194.3 -€194.3 -€26.4 -€26.4 -€196.8
-€185
5.2.3 Summary for taxi scenario
In comparing taxi fleets below it should be noted that London has a taxi fleet approximately thirty times greater than Firenze, based on supplied information. This might be the cause of some differences be-tween the fleets.
Figure 55 - Difference in cost versus current fleet (taxis)
The clearest pattern discerned from the above chart is that either electric or electric Unplugged vehicles are shown to reduced taxi fleet costs. At 5% penetration of EVs, there is a percentage gain of approxi-mately 1% against current fleets. At 20% of the fleet savings vary between 3% and 6% against current fleet costs.
Table 21: Summary table - Cost benefits compared to diesel € millions (over 7 years) for London taxis
% of
vehi-
cles in
fleet
Capital Cost Operating Cost
(saving)
Societal Cost
(saving)
Total saving
elec-
tric
UNPLU
GGED
electric UNPLUGGED elec-
tric
UNPLU
GGED
electric UNPLUGGE
D
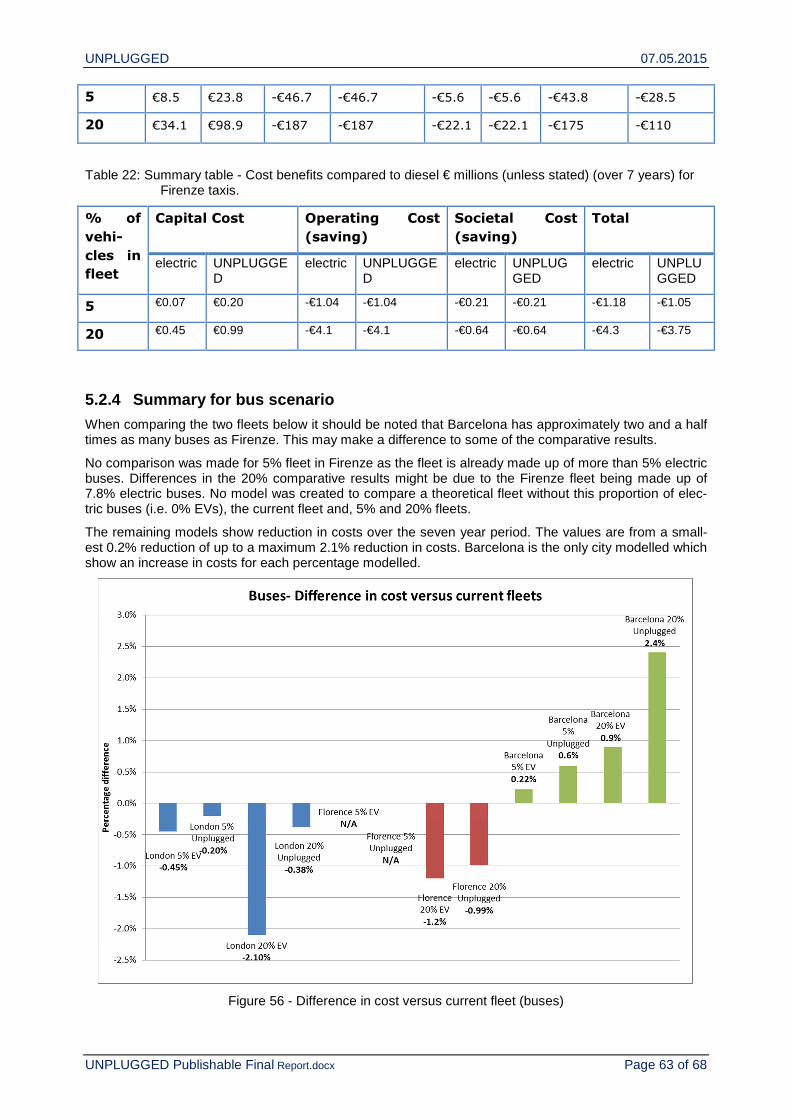
UNPLUGGED 07.05.2015
UNPLUGGED Publishable Final Report.docx Page 63 of 68
5 €8.5 €23.8 -€46.7 -€46.7 -€5.6 -€5.6 -€43.8 -€28.5
20 €34.1 €98.9 -€187 -€187 -€22.1 -€22.1 -€175 -€110
Table 22: Summary table - Cost benefits compared to diesel € millions (unless stated) (over 7 years) for Firenze taxis.
% of
vehi-
cles in
fleet
Capital Cost Operating Cost
(saving)
Societal Cost
(saving)
Total
electric UNPLUGGED
electric UNPLUGGED
electric UNPLUGGED
electric UNPLUGGED
5 €0.07 €0.20 -€1.04 -€1.04 -€0.21 -€0.21 -€1.18 -€1.05
20 €0.45 €0.99 -€4.1 -€4.1 -€0.64 -€0.64 -€4.3 -€3.75
5.2.4 Summary for bus scenario
When comparing the two fleets below it should be noted that Barcelona has approximately two and a half times as many buses as Firenze. This may make a difference to some of the comparative results.
No comparison was made for 5% fleet in Firenze as the fleet is already made up of more than 5% electric buses. Differences in the 20% comparative results might be due to the Firenze fleet being made up of 7.8% electric buses. No model was created to compare a theoretical fleet without this proportion of elec-tric buses (i.e. 0% EVs), the current fleet and, 5% and 20% fleets.
The remaining models show reduction in costs over the seven year period. The values are from a small-est 0.2% reduction of up to a maximum 2.1% reduction in costs. Barcelona is the only city modelled which show an increase in costs for each percentage modelled.
Figure 56 - Difference in cost versus current fleet (buses)
UNPLUGGED 07.05.2015
UNPLUGGED Publishable Final Report.docx Page 64 of 68
Table 23: Summary table - Cost benefits compared to diesel € millions (over 7 years) for Barcelona buses
% of
vehicles
in fleet
Capital Cost
(saving)
Operating Cost
(saving)
Societal Cost (sav-
ing)
Total
electric UNPLUGG
ED
electric UNPLUGGE
D
electric UNPLUGGED electric UNPLUG
GED
5 €10.9 €13.2 -€7.1 -€7.1 -€2.4 -€2.4 €1.4 €3.7
20 €44.7 €54.2 -€28.8 -€28.8 -€10.1 -€10.1 €5.8 €15.3
Table 24: Summary table - Cost benefits compared to diesel € millions (over 7 years) for Firenze buses
% of
vehi-
cles in
fleet
Capital Cost Operating Cost
(saving)
Societal Cost
(saving)
Total
electric UNPLUGGED electric UNPLUGGED electric UNPLUGGE
D
electric UNPLUG
GED
5 No comparison
made
20 €11.5 €11.1 -€11.0 -€11.0 -€4.1 -€4.1 -€3.5
-€2.8
Table 25: Summary table - Cost benefits compared to diesel € millions (over 7 years) for London buses
% of
vehi-
cles in
fleet
Capital Cost Operating Cost
(saving)
Societal Cost
(saving)
Total
electric UNPLUGGED electric UNPLUGGED electric UNPLUGGE
D
electric UNPLUG
GED
5 €9.0 €11.4 -€12.2 -€11.8 -€1.0 -€1.0 -€4.2 -€1.2
20 €36.9 €50.4 -€49.2 -€49.2 -€4.9 -€4.9 -€17.1 -€3.7
5.2.5 Socio-economic impact assessment conclusion
The models show that in most cases, there is a financial gain to society that can be made from switching a vehicle fleet to electric vehicles and Unplugged electric vehicles. This financial gain is not accrued by individual vehicle owners, but by wider society as an environmental benefit.
The benefits are clearer for vans, buses and taxis than they are for cars. For each of the cases above, vans, buses and taxis show all negative cost difference indicating savings. Only the Barcelona bus fleet shows an increase in costs for all modelled percentages. For cars there are some cost increases, notice-ably for 20% penetration of Unplugged vehicles in Firenze. It is possible that this is due to car fleets being composed of a smaller percentage of diesel powered vehicles. The large majority of non-car fleets were composed of diesel vehicles, whilst the car fleets were composed of more petrol than diesel vehicles, so the air quality benefits of replacing them with EVs are lower.
As expected savings are modelled to be greater in real terms when fleets are modelled to have 20% EV or Unplugged EV.
The highest potential saving is modelled to be in Firenze for the van fleet, where approximately 7% cost savings may be obtained by switching to 20% EV or 20% Unplugged fleets.

UNPLUGGED 07.05.2015
UNPLUGGED Publishable Final Report.docx Page 65 of 68
When fleets are modelled to be 5% EV and 5% Unplugged, savings tend to be approximately 1%. De-pending on the size of the fleet and the capital costs these can still be significant amounts.
Comparing standard EVs with Unplugged EVs, the differences in the modelling figures are derived from the initial capital costs, which are currently estimated to be higher than for standard EVs. Therefore sav-ings are generally lower for Unplugged EVs than for standard EVs.
As discussed previously, it is difficult to isolate the impact of WPT charging technology on the cost-benefit of EVs. Although it is clear that the capital costs are likely to be higher and the benefits derived in terms of running cost and societal cost savings are the same on per mile basis, unlike conventional EVs, UNPLUGGED EVs are able to opportunistically change en-route, therefore maximizing the electric-only range and total electric miles driven, thus increasing the overall benefits. UNPLUGGED technology can be best thought of as facilitating higher proportion of EVs in fleets and therefore, allowing to meet theoret-ical savings calculated which would otherwise not be possible due to EVs not being able to achieve the same duty cycles, as conventional ICE vehicles in some cases.

UNPLUGGED 07.05.2015
UNPLUGGED Publishable Final Report.docx Page 66 of 68
6 Project website and list of beneficiaries The main information sources concerning the project are as follows:
Project website: www.unplugged-project.eu
Twitter account: @FP7UNPLUGGED
Linkedin Group: FP7 UNPLUGGED project
eMail: [email protected]
The main project contacts are as follows
Project Coordinator: Axel Barkow / FKA Forschungsgesellschaft Kraftfahrwesen mbH Aachen
www.fka.de
Communication Coordinator: David Quesada / ENIDE Solutions S.L. / www.enide.eu
The contacts for the project partners are as follows:
Stefano Spizzi [email protected] CENTRO RICERCHE FIAT SCPA
www.crf.it
Gianni Campa-telli
[email protected] UNIVERSITA DEGLI STUDI DI FIRENZE
www.unifi.it
Johansson Roy [email protected] VOLVO TECHNOLOGY AB
www.volvo.com
Jens Fiedler [email protected]
Continental Auto-motive GmbH
www.conti-online.com
Martin Dierkes [email protected] Hella KGaA Hueck & Co.
www.hella.com
Omar Hegazy [email protected] VRIJE UNIVERSITEIT BRUSSEL
www.vub.ac.be
Prashanth Dhur-jati
[email protected] IDIADA AUTOMOTIVE TECHNOLOGY SA
www.applusidiada.com
Peter Vermaat [email protected] TRL LIMITED www.trl.co.uk
Antoine Viana [email protected] COMMISSARIAT A L ENERGIE ATOMIQUE ET AUX ENERGIES ALTERNATIVES
www.cea.fr
Lourdes Garcia [email protected] ENDESA SA www.endesa.com

UNPLUGGED 07.05.2015
UNPLUGGED Publishable Final Report.docx Page 67 of 68
Eleonora Sam-martino
[email protected] ENEL DISTRIBUZIONE S.P.A.
www.enel.it
José Francisco Sanz
[email protected] FUNDACION CIRCE CENTRO DE INVESTIGACION DE RECURSOS Y CONSUMOS ENERGETICOS
www.fcirce.es
Rosario Ceravo-lo
[email protected] POLITECNICO DI TORINO
www.polito.it
Mark Poulton [email protected] TRANSPORT FOR LONDON
www.tfl.gov.uk
Matthew Law-rence
[email protected] BAE Systems (Operations) Ltd
www.baesystems.com

UNPLUGGED 07.05.2015
UNPLUGGED Publishable Final Report.docx Page 68 of 68
7 References
[1] "The German Standarization Roadmap for Electromobility, Version 1.0.1," National Plattform Electromobilitat, Nov.,2010.
[2] IEC61980-1/CD, "Electric vehicle inductive charging systems — Part 1:General requirements," No. 69/236/CD, IEC TC69 WG4, 2013.
[3] IEC 61890-2/CD: Electric vehicle wireless power transfer systems (WPT) Part 2: specific requirements for communication between EV and infrastructure with respect to WPT systems, IEC TC69 WG4, Dec. 2014.
[4] IEC 61890-3: Electric vehicle wireless power transfer systems (WPT) Part 3: specific requirements for the magnetic field of the power transfer systems, IEC TC69 WG4, Dec. 2014.
[5] ISO/TC 22/SC 21/WG 1, N769/ ISO 19363 WD: Vehicle operation conditions, vehicle safety and energy storage installation, Sept. 2014.
[6] The German Standarization Roadmap for Electromobility, Version 1.0.1," National Plattform Electromobilitat, Nov.,2010.
[7] ISO/IEC 15118-1: Vehicle to grid Communication Interface – Part 1: General information and use case definition.
[8] ISO/IEC 15118-2: Vehicle to grid Communication Interface – Part 2: Network and application protocol requirements.
[9] ISO/IEC 15118-6/Ed.1: General information and use-case definition for wireless communication, 69/303/CD, Sept. 2014.
[10] ICNIRP GUIDELINES FOR LIMITING EXPOSURE TO TIME‐VARYING ELECTRIC, MAGNETIC AND ELECTROMAGNETIC FIELDS (UP TO 300 GHZ). HEALTH PHYSICS 74 (4):494‐522; 1998.