fabric at unplugged final event
TRANSCRIPT

Dr. Yannis Damousis, ICCSFABRIC project manager
UNPLUGGED Final Event, Zaragoza 26-03-2015
Dynamic charging for more efficient FEVs: The FABRIC project

FABRIC FP7 Integrated Project
User requirements
Technical feasibility
Standardization/ Interoperability
Liaison with other projects
Innovation
Collaboration
Dynamic wireless charging of FEV
Jan 2014
Jan 2018
UNPLUGGED Final Event26.03.15
Budget: 9 M€ Funding: 6.5 M€
Duration: 48 months Start: 1 January 2014
Coordinator:

Motivation: Why dynamic charging?
UNPLUGGED Final Event26.03.15
• Allows EV charging while travelling (dynamic) or during short stops ideal for
urban environment (stationary)
• Drivers do not have to deal with dirty and potentially dangerous cables (rain,
cable vandalism, cable wear, etc) + Easier charging process
Increased
range
Smaller
batteries
Cheaper
EVs
Reduced
range
anxiety
Increased
mobility
No visual
pollution
More
comfortSafer
Driver
benefits
Roosegaarde and Heijmans

FABRIC objectives
UNPLUGGED Final Event26.03.15
.
• Three wireless EV
charging prototypes
able to support
dynamic charging
• Supporting ICT
• Integration with road
and grid
infrastructure
• ITALY
• FRANCE
• SWEDEN
• GRID
• ROADS
• BUSSINESS
• ENVIRONMENT

Project workflow and schedule
Year 1 Years 2-3 Years 3-4
UNPLUGGED Final Event26.03.15
Milestone: ICT system
concept, charging
solutions requirements
Milestone: Vehicles and
test sites architecture
Milestone: Prototypes
and test sites available
Milestone: Cost benefit
analysis and business
models for large scale
deployment
Jan 2014 Jan 2018
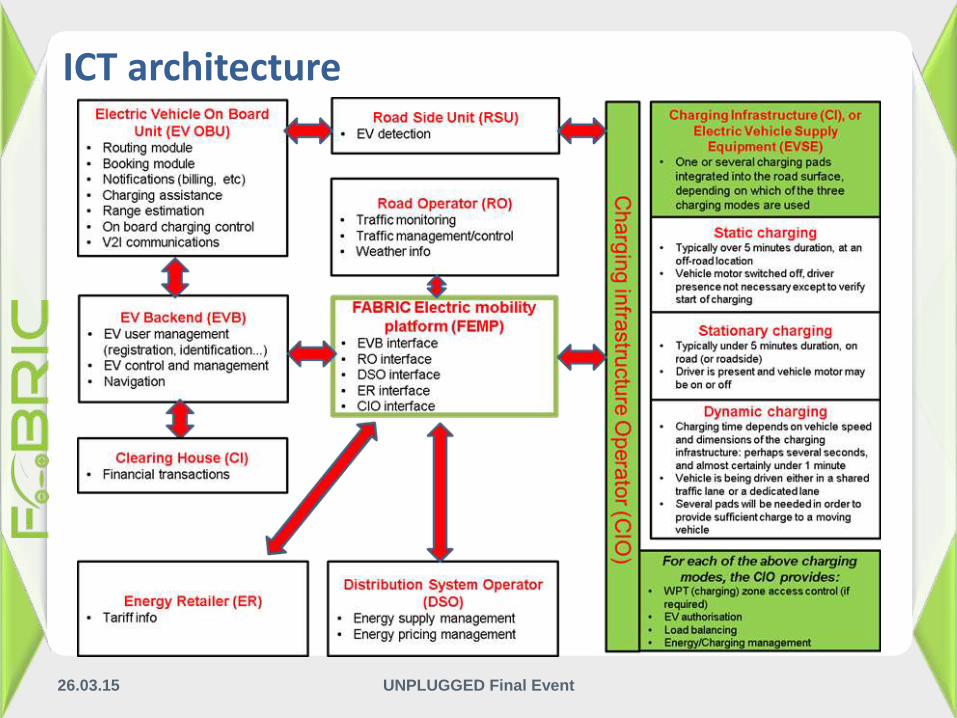
ICT architecture
UNPLUGGED Final Event26.03.15

ICT architecture
UNPLUGGED Final Event26.03.15
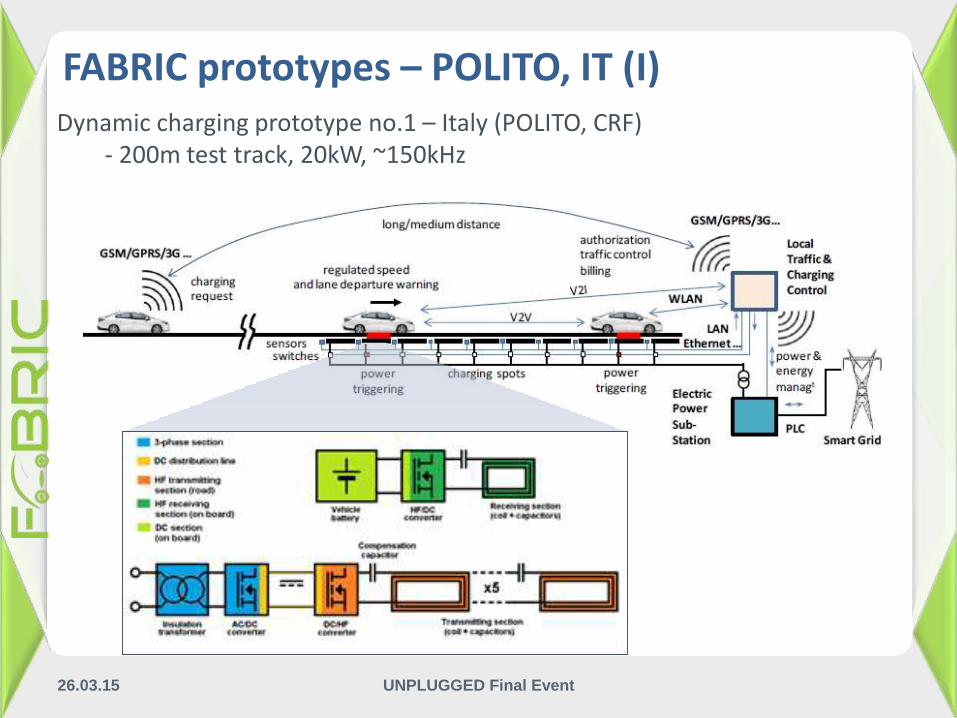
FABRIC prototypes – POLITO, IT (I)
UNPLUGGED Final Event26.03.15
Dynamic charging prototype no.1 – Italy (POLITO, CRF)- 200m test track, 20kW, ~150kHz

FABRIC prototypes – SAET, IT (II)
UNPLUGGED Final Event26.03.15
Dynamic charging prototype no.2 – Italy (SAET)
– 50m, 10-150kHz load-resonant power frequency
Source: SAET
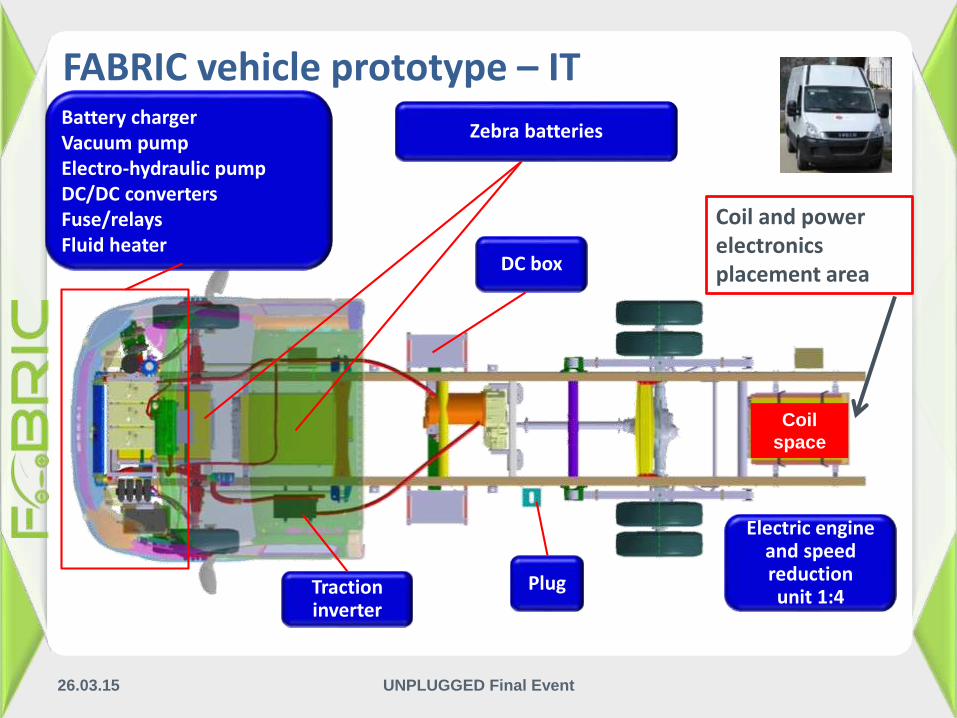
FABRIC vehicle prototype – IT
UNPLUGGED Final Event26.03.15
Source: SAET
DC box
Plug
Electric engine and speed reductionunit 1:4
Battery chargerVacuum pumpElectro-hydraulic pumpDC/DC convertersFuse/relaysFluid heater
Zebra batteries
Traction inverter
Coil
space
Coil and power electronics placement area
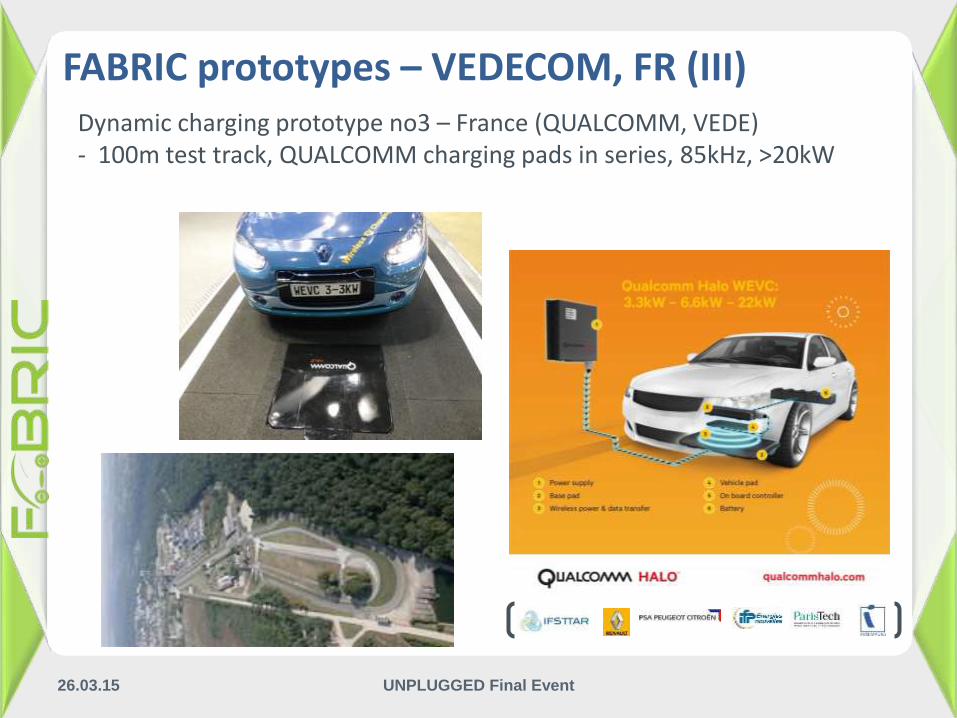
FABRIC prototypes – VEDECOM, FR (III)
UNPLUGGED Final Event26.03.15
Dynamic charging prototype no3 – France (QUALCOMM, VEDE) - 100m test track, QUALCOMM charging pads in series, 85kHz, >20kW

Other prototype testing
UNPLUGGED Final Event26.03.15
• Volvo GTT ATR/cars test site in Hällered
• Test track for conductive electrical road tests (DC 750V)
• Test track is 435m long, electrified part of the track is 275m.
• Technology evaluation results
• Demo of the track and system
• EM emissions measurements
• Conductive charging technology benchmarking
• Preliminary tests• expected power transfer efficiency verification• electro dynamic forces• electric circuit dynamics• overvoltage/under voltage dynamics

UNPLUGGED Final Event26.03.15
• Speed: to be defined
• Peak power: 25 kW
• Storage foreseen at DC
bus (supercaps?)
Analysis of the grid - SITAF test site (Italy)

Analysis of the grid - Satory test site (France)
UNPLUGGED Final Event26.03.15
Static Switches
Local Grid 3ph-200kVA
DC
AC
AC
DC
DC
AC
AC
DC
DC
AC Energy Storage System
Optional Energy storage system
To assume
Peak power management
Triggered by car detection
85kHz
Qualcomm system proposal:
2x Double Coupling units
(one each 50m of track)
expected to 2 x 50kVA
• Speed: 60 km/h regular
(up to 90 km/h to be confirmed)
• Peak power: 4x 25 kW = 100 kW
• Tests with 2 cars max. 50 kW
Analysis of the grid – test sites
UNPLUGGED Final Event26.03.15
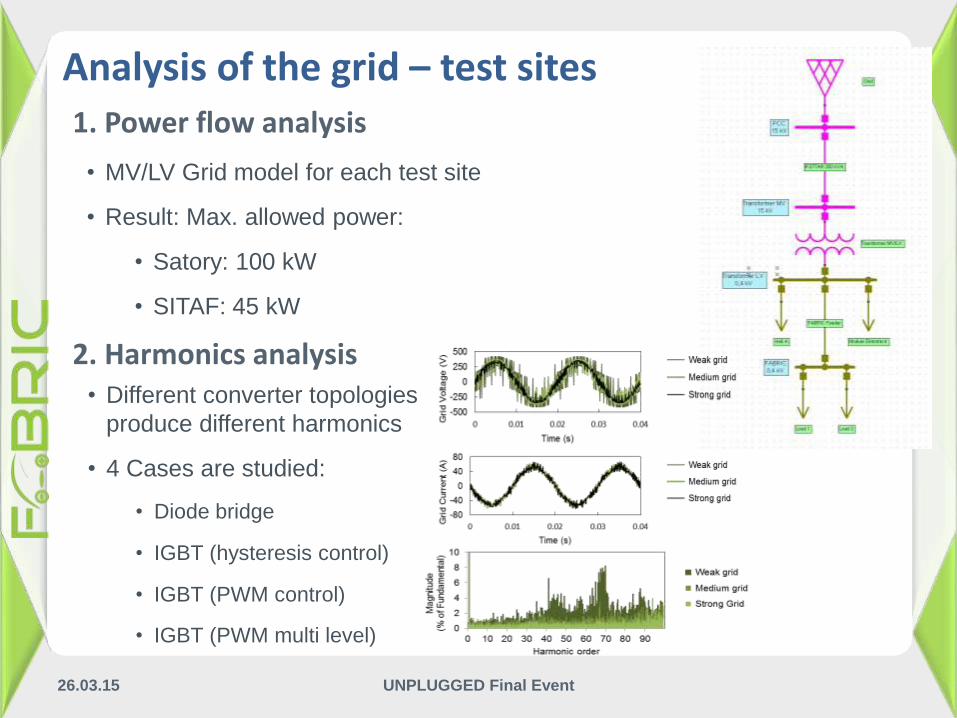
1. Power flow analysis
• MV/LV Grid model for each test site
• Result: Max. allowed power:
• Satory: 100 kW
• SITAF: 45 kW
2. Harmonics analysis• Different converter topologies
produce different harmonics
• 4 Cases are studied:
• Diode bridge
• IGBT (hysteresis control)
• IGBT (PWM control)
• IGBT (PWM multi level)

Analysis of the grid – Impact simulation
UNPLUGGED Final Event26.03.15
Parameters:
1. Charging lane length (8km)
2. Vehicle speed & length
3. Minimum headway
4. Traffic (urban/interurban)
5. Maximum charging pad power level (50kW)
Charging events are
created according to
traffic, lane length
Charging events are
translated to a power
level according to the
charging duration

UNPLUGGED Final Event26.03.15
o Substantial amount of switching associated to vehicles passing over charging pads
o Demand fluctuates from 2-8 MW in some seconds
o Unrealistic power jump in the grid load
o Max step 4MW in 100ms
Demand analysisDemand 1h
Demand 5s
Analysis of the grid – Impact simulation
UNPLUGGED Final Event25.03.15
Analysis of the grid – Impact simulation
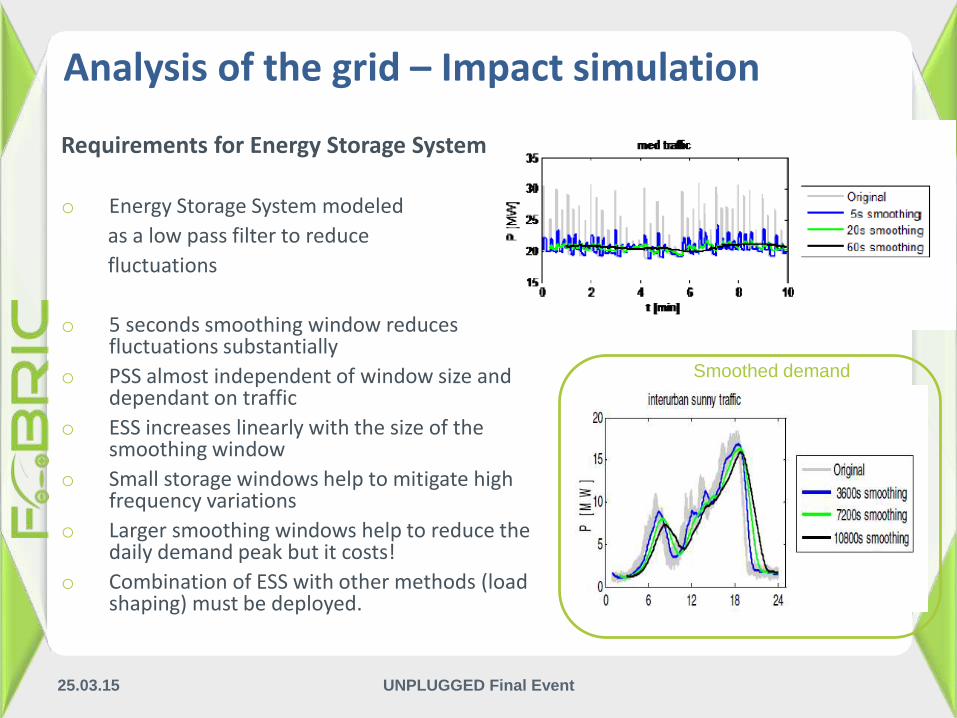
Requirements for Energy Storage System
o Energy Storage System modeled
as a low pass filter to reduce
fluctuations
o 5 seconds smoothing window reduces fluctuations substantially
o PSS almost independent of window size and dependant on traffic
o ESS increases linearly with the size of the smoothing window
o Small storage windows help to mitigate high frequency variations
o Larger smoothing windows help to reduce the daily demand peak but it costs!
o Combination of ESS with other methods (load shaping) must be deployed.
Smoothed demand

Analysis of the road – test sites
UNPLUGGED Final Event26.03.15
• 1st year:
• Collection of charging solutions
specifications and test sites data
• 2nd year:
• Core samples analysis and highway
road modeling
• Stress and long term impact analysis

Contact with FABRIC
UNPLUGGED Final Event26.03.15
LinkedIn groupWebsite www.fabric-project.eu ERG
Coordinator: [email protected]: [email protected]

Thank you!
Dr. Yannis Damousis
Scientific project manager
Institute of Communication and
Computer Systems (ICCS)
UNPLUGGED Final Event26.03.15