unlocking mno data to enhance public services and humanitarian efforts€¦ · public services and...
TRANSCRIPT
Unlocking MNO data to enhance public services and humanitarian efforts
FEBRUARY 2018

digitalimpactallliance.org2
ACKNOWLEDGMENTS
This paper was authored by Syed Raza, Rezvan Ma’ani and Danielle Dhillon.
This effort would not have been possible without the critical support of Rachel Sibande, Melissa Johns and Kate Wilson, as well as the extended team at the Digital Impact Alliance (DIAL). We are deeply grateful for their generosity of time, support and insights. We also would like to acknowledge Delta Partners Group, whose research and analysis informed this report.
We would like to thank our donors, the United States Agency for International Development (USAID), the Bill & Melinda Gates Foundation and the Swedish International Development Cooperation Agency (Sida), for their vision and leadership in establishing DIAL and enabling our ongoing research agenda. With the support of these donors and the United Nations Foundation, DIAL is able to pioneer new efforts that contribute to leveraging the use of data for development.
ABOUT DIAL
The Digital Impact Alliance aims to realize a more inclusive digital society in emerging markets, in which all women, men and children benefit from life-enhancing, mobile-based digital services. A partnership among USAID, the Bill & Melinda Gates Foundation, the Swedish government and the United Nations Foundation, DIAL helps accelerate the collective efforts of government, industry and development organizations to realize this vision.
DIAL is staffed by a global team of technology researchers, developers and investors, guided by a board of leading emerging market entrepreneurs, technologists and development experts. With this leadership, DIAL is uniquely positioned to serve as a neutral broker, bringing together government, industry and other development stakeholders to promote new solutions to old problems. For more information about the Digital Impact Alliance, please visit our website: www.digitalimpactalliance.org

3Unlocking MNO data to enhance public services and humanitarian efforts
Contents
Foreword . . . . . . . . . . . . . . . . . . . . . . . . . . . . . . . . . . . . . . . . . . . . . . . . . . . . . . . . . . . . 4
Introduction . . . . . . . . . . . . . . . . . . . . . . . . . . . . . . . . . . . . . . . . . . . . . . . . . . . . . . . . . . 5 MNO data provides rich insights . . . . . . . . . . . . . . . . . . . . . . . . . . . . . . . . . . . . . . . . 5 Challenges stand in the way . . . . . . . . . . . . . . . . . . . . . . . . . . . . . . . . . . . . . . . . . . . 5 Enabling policies and frameworks are within reach . . . . . . . . . . . . . . . . . . . . . . . . . . 5
Prioritizing applications of MNO data . . . . . . . . . . . . . . . . . . . . . . . . . . . . . . . . . . . . . 6 Types and uses of data for development . . . . . . . . . . . . . . . . . . . . . . . . . . . . . . . . . . 6 Most valuable data insight categories . . . . . . . . . . . . . . . . . . . . . . . . . . . . . . . . . . . . 7 Aggregating demand for MNO data can unlock the market . . . . . . . . . . . . . . . . . . . . 8
D4D can also help MNOs succeed in emerging markets . . . . . . . . . . . . . . . . . . . . . . 9 MNOs are facing business model pressures . . . . . . . . . . . . . . . . . . . . . . . . . . . . . . . 9 Commercial incentives align with public service goals. . . . . . . . . . . . . . . . . . . . . . . 10 Opportunities for further value creation . . . . . . . . . . . . . . . . . . . . . . . . . . . . . . . . . . 11 Commercial incentives align with public service goals. . . . . . . . . . . . . . . . . . . . . . . 13
The impact of regulations and data limitations on D4D . . . . . . . . . . . . . . . . . . . . . 14 MNOs are held back by prevailing legal frameworks . . . . . . . . . . . . . . . . . . . . . . . . 14 Development agencies must consider the limitations of MNO data. . . . . . . . . . . . . 14
Conclusion . . . . . . . . . . . . . . . . . . . . . . . . . . . . . . . . . . . . . . . . . . . . . . . . . . . . . . . . . . 15
Annex: Methodology for determining the relative usefulness of MNO data elements for government and NGO use . . . . . . . . . . . . . . . . . . . . . . . . . 16
Unlocking MNO data to enhance public services and humanitarian efforts

digitalimpactallliance.org4
FOREWORDThe widespread accessibility and increasing affordability of digital devices such as mobile phones and data services, along with the resulting availability of data about historically underserved regions and populations of the world, are beginning to provide exciting opportunities to transform the development and humanitarian sectors. However, a number of complex challenges are limiting the full-scale use of the valuable data gathered by mobile network operators (MNOs).
The Digital Impact Alliance (DIAL) works with partners to solve these challenges and unlock mobile data so it can be used for development and humanitarian purposes. This paper is the first in a series in which DIAL and its partners share experiences building upon existing efforts in this nascent sector. Our goal is to address calls from sector experts and leading multilateral and development institutions for open, structured and standards-driven approaches to acquire, analyze and embed mobile network data with routine data to help solve some of the world’s most intractable development problems.
This first paper will lay out DIAL’s perspectives on the shared value proposition of data for development (D4D)—for governments and humanitarian organizations on the demand side and for MNOs on the supply side—as well as the primary obstacles to reaping the rewards of this promising sector. By highlighting the significant benefits of D4D for all stakeholders and addressing some of the ways to clear the obstacles that stand in the way, this paper can help the ecosystem develop a common language to drive us forward.
This paper builds off of existing reports that describe the benefits of digital technologies and data for development as well as the challenges faced, including the June 2017 report, The State of Mobile Data for Social Good, issued by GSMA and UN Global Pulse, and the World Bank’s World Development Report 2016: Digital Dividends. This paper seeks to address and highlight market implementation experiences on a number of recommendations in these studies so as to advocate for a more systematic, secure and fully functional D4D ecosystem.
Subsequent papers in this series will aim to answer specific research questions on market models, operational and technical models, and governance models for mobile data through the optic of different stakeholders while building towards the goals of a common learning framework. This framework should provide a common language of learning and a system for coordination between various D4D actors.

5Unlocking MNO data to enhance public services and humanitarian efforts
INTRODUCTION MNO data provides rich insights The explosion in data and the advancement of analytics and digital technologies offer unprecedented opportunities to better understand underserved populations and subsequently provide radically new ways to address humanitarian and development challenges. This massive increase in data comes from many private-sector actors that interact with their customers digitally, including consumer goods companies, technology companies, health care providers, and banking and financial services providers. In particular, MNOs hold rich data1 about their users, including locations, behaviors, social networks, usage and spend (e.g., how much a user spends on voice, text, internet connectivity and additional services). When this type of data is combined with routine data (e.g., census, government health management information systems, programmatic),2 much richer insights are generated.
Some governments and NGOs already recognize the benefits of D4D and are using insights drawn from MNO data for a range of development and humanitarian applications. When aggregated and combined with routine data, MNO data leads to enhanced decision-making, resource allocation and improved service delivery.3 MNO data gives accurate information on population behaviors such as population density and movement on a spatially or temporally defined basis. Using it can also save time and money over other data collection methods. MNOs have been front and center of the data for development sector, participating in impact studies and pilots, especially around humanitarian crises. The availability of data provides MNOs with an opportunity to rethink customer engagement. As they build the organizational and operational capacity to analyze massive amounts of network data, MNOs can use that capacity to redesign their relationship with the nonprofit and public sectors. Today, there are many options for collaboration, but MNOs are only just beginning to realize the business and commercial value of these approaches, mostly through pilots and one-off engagements.
Challenges stand in the wayStakeholders face numerous challenges that hold them back from taking advantage of this market opportunity. Governments and NGOs often lack the awareness and resources to realize the cross-sectoral benefits made possible by the structured availability of MNO data. They don’t know the best way to frame data requests, pay for availability or utilize analytical approaches to make the most out of what is available. This reduces the likelihood of usage, hinders coordination across ministries or organizations in submitting data requests, makes payment burdensome, and limits their own internal capacity building.
On the supply side, the MNOs’ business models in these predominantly prepaid markets remain focused on customer acquisition. And while we see increased sophistication in specific disciplines such as retail pricing, product packaging and customer churn management, MNOs in low-income markets are still in the early days of building analytical capabilities that target traditionally defined low-value customers (LVCs). MNOs also confront decisions around pricing their data appropriately for humanitarian and development sectors.
Regulatory concerns are among the strongest deterrent for MNOs to share their data. Justified concerns around privacy and risks associated with the misuse of data deter even the best-intentioned and resourceful actors. As governments and NGOs use MNO data, they should be aware of its limitations and recognize the importance of layering this data with existing data sources to increase the robustness of analysis.
Enabling policies and frameworks are within reachRecognizing challenges on the demand and supply sides is the first step to creating enabling policies and governance frameworks for the successful implementation of D4D. Governments and NGOs should work toward identifying common data asks and streamlining requests of MNOs. MNOs should look to operationalizing these public-private partnerships at scale by working with governments and NGOs to develop standard approaches to mitigate customer fragmentation and regulatory uncertainty.
1 In structured, semi-structured and unstructured representations2 Note that data in this context does not mean customer data packages, but rather anonymized and aggregated data captured in the network, such as that in Call Detail Records, VAS services, browsing behavior, KYC (know your customer) information, etc.3 We use “data availability” to include MNO data and/or insights access, data creation and data generation, as well as algorithmic approaches to access and analyze data that remains within the firewall of the data holder or data custodian.

digitalimpactallliance.org6
PRIORITIZING APPLICATIONS OF MNO DATATypes and uses of data for developmentIncreasingly, national governments, multilaterals and development agencies are seeking to invest in global datasets and build big data indicators that help them understand populations better. These composite indicators are made possible by the availability of mobile, geospatial and digital datasets, as well as technological improvements, including lower-cost computing power and analytical tooling sophistication such as machine learning approaches, cloud-first infrastructure, and ubiquitous connectivity. Digital data sources offer robustness, timeliness, accuracy and completeness never before realized in the development sector. And if unpacked systematically, they can offer a step-change in reaching the underserved.
FIGURE 1: Applicability of MNO data-driven insights across a range of development topics
Sample Data Element How It’s Used Enabling MNO
Solution
Location data: Population size and density distribution
Data snapshot: Knowing population distribution is essential to knowing where to provide services. This enables governments to efficiently allocate resources and maximize the number of people being served.
Data series over time: Accurate demand forecasting (minimizing waste in distributing resources such as vaccines, seed, school supplies, infrastructure, etc.) and faster response to migratory populations.
Better assess accuracy of population count using MNO subscriber estimates by location (over time)
Profile data: Demographic information
Data snapshot: A national-level unique identifier (UID) enables effective linking of user data records across government services. This data integration enables more effective government resource allocation, including less redundant supplies. If combined with location data, it can help build demographic databases, allowing service providers to be more efficient and effective in meeting the needs of specific populations.
Data series over time: Profile data (e.g., income and education) collected over time helps service providers, both government and private sector, understand trends in key demographic variables. Understanding these trends can help service providers know which programs are working, which are not and what new programs might be required. By combining it with location data, service providers can modify or add new services due to changing demographics, all in a privacy-aware manner.
Provides unique ID (within the network) using mobile phone number
Capture and manage profile data over time
If combined with location, can plot subscriber location based on profile elements
Usage/Spend data: Value segmentation
Data snapshot: Understanding the mobile service spending behaviors (including airtime top up – see annex for details) of population segments is key if consumers are to be charged for government or private-sector services. If prices are too high, services will go unused and provider resources will be wasted. If prices are too low, the service provider will not get an optimal return on investment. If combined with profile data, this data can help service providers build models that will predict utilization of programs and services, as well as inform the design of new, innovative products and services.
Data series over time: Understanding trends in spending can help service providers anticipate community resilience levels in the event of an impending crisis. With this information, service providers can develop relevant programs at appropriate price points to help mitigate the negative impact of such events. If combined with profile data, it can help service providers target products and services efficiently and effectively and price appropriately.
Leverage mobile service usage/spend levels to proxy value segmentation of selected data set

7Unlocking MNO data to enhance public services and humanitarian efforts
MNO data is ideal for helping these entities address a range of development and humanitarian issues and improve service delivery. Not only can it deliver powerful insights at a relatively low cost, but practitioners are especially excited about the portability of insights drawn from MNO data. For example, different granularities of location data can be used to answer questions within a sector (e.g., immunization program execution, health facility rollout, disease burden prediction) and across sectors (e.g., energy infrastructure planning, transport route design, humanitarian assistance planning).
At a foundational level, there are three elements of MNO data that can generate useful insights: user location data (population size and dynamic density distribution); profile data (demographic information); and usage/spend data (details of how customers utilize telephony and data services across voice, text and connectivity). These data elements can also be combined to provide more powerful insights.4 For example, usage/spend data combined with profile data can help service providers build models that predict utilization of programs and services, target products and services efficiently and effectively, and price appropriately. Figure 1 on the previous page describes some use case applications of each data element, both as a snapshot and over time.5
Most valuable data insight categoriesDespite the benefits of MNO data, its value has not been fully realized and the ecosystem has not yet moved beyond pilots. One reason that the demand for MNO data remains fragmented is because cross-sector applications are not well-known, leading to ad-hoc approaches. Additionally, much of the development community still relies on infrequent aggregate data (e.g., national census) and project level data (e.g., data specific to a particular donor-funded program). Governments and NGOs not only base their work around these legacy data points, but also collect—typically in a manual or semi-automated manner—their own data to design programs and measure impact.
The development community is still struggling to understand how best to acquire and integrate these newer data elements. DIAL and Delta Partners Group investigated which data elements (location, user profile, usage and spend6) were most useful to each development sector vs. difficulty to extract.7 This analysis of the various combinations of data elements—single and composite—indicate that those that include aggregated user location-based data at multiple levels of granularity and aggregation (including subscriber level, tower level and aggregate level) have demonstrated the most valuable insights across multiple development sectors.
The results highlighted five priority insights on mobile users that can be most relevant to government and NGO efforts, based on their viability, implementability and replicability. These included (I) location snapshot, (II) location over time, (III) usage/spend over time by profile and location, (IV)
4 Note that we are defining use cases for low-income markets with low smartphone usage, and, therefore, there are minimal to no substitution options by digital platforms or app providers for the same types of information. In developed markets, similar information can be extracted not just from MNOs, but also location-based service providers and a host of digital services providers, analytics providers, data brokerage and aggregation platforms, etc.5 Note that there are earlier studies released by GSMA, UNGP, Cartesian and a number of other organizations that lay out data captured in network and IT elements in an MNO. There are additional studies by research and academic institutions (e.g., Flowminder) that highlight complex aggregates (e.g., social network analysis) and indicators (e.g., by tower or catchment area). We have narrowed our analyses to be driven by concrete, real-world use cases.6 The analysis included location data; profile data, including unique ID, device type and basic customer information; usage and spend data, including Mins/MBs/SMS used, websites and apps accessed, and top-up amounts. It did not include two other MNO data elements because they are typically harder to access due to low penetration of smartphones in our markets: ambient information, including signal interferences and outages; and third-party data, including purchase history, social media, messaging apps and GIS location maps. See Annex 1 for more details.7 This finding mirrors commercial use cases where aggregate value capture in data-rich environments of location-based services is upwards of 60 percent. (Source: McKinsey Big Data Study 2012)
Five priority MNO data insight categories (I) Location snapshot
(II) Location over time
(III) Usage/spend over time by profile and location
(IV) Location snapshot by profile
(V) Location over time by profile

digitalimpactallliance.org8
location snapshot by profile, and (V) location over time by profile. Figure 2 below indicates these data elements as “top priority.” The study based its analysis on applications in five sectors: economic development, humanitarian assistance, health care, education and agriculture. To prioritize the most important insights that can be generated, the analysis estimated:
• Viability: The level of risk associated with sharing data• Implementability: The ease of data ingestion, transformation, storage, analysis and visualization• Replicability: The level of reusability of the same insight across several different development
needs and sectors
A detailed explanation of the methodology and a list of the 15 insight categories linked to 30 different use cases are provided in Annex 1.
8 Delta Partners Group, 2017.9 For example, algorithmic efficiency can be achieved by cross-deployment of analytics developed to solve for neuro-generative disorders and childhood stunting (Ref. Bill Gates, JPM Global Health Summit). Similarly, a food security project in Country A that incorporated mobile, satellite and ground-truth data and a health system strengthening project in Country B that incorporated mobile, satellite and DHIS2 data can utilize similar algorithmic approaches.10 Note that the GSMA, through its BD4SG program, is enabling such common mechanisms. Other actors, including the World Bank and ITU, are also engaged in collaborative design of a “standard data protocol.” DIAL is working on a number of investments supporting GSMA and others in developing a specification for the purpose.
Aggregating demand for MNO data can unlock the marketThe cross-sectoral benefits of MNO data for government and NGO service delivery can only be realized on a sustained basis if the demand is more structured, cohesive and organized, particularly because data sharing is traditionally not part of the core business of an MNO. Data asks for a specific sector or research question must be made more regularly and with a more standardized approach to lessen one-off requests. By pooling demand and addressing regulatory concerns by MNOs, governments and NGOs can lower the hurdles for participating in this market. This requires governments and NGOs to build their internal capacity to query and appropriately use MNO data.
In the world of big data, machine learning and advanced artificial intelligence, we are seeing that common algorithmic approaches can be utilized to answer a range of questions.9 In a similar manner, MNO data can be used to serve multiple government and NGO needs. But first, acquisition methods must be standardized, and a universal protocol must be agreed upon,10 which will lead to the pooling of demand, more structured access, and improved querying and usage of MNO data.
FIGURE 2: Illustrative prioritization of MNO data insight categories8
Usage-based social circlesLocation snapshot and usage (SMS/call) analysis
Usage/spend over time by profileUsage/spend over timeUsage/spend snapshot by profile
Usage snapshot(m-payments) usage and spend trends by profile and location
Profile snapshot (excluded for low viability)
Location snapshotLocation over timeLocation snapshot by profileLocation over time by profileUsage/spend over time by profile and location
Location over time by usage/spend and profileLocation and usage/spend over time by profileLocation and usage/spend snapshot
LOW MEDIUM HIGHREPLICABILITY
VI
AB
ILIT
Y
LOW
MED
IUM
HIG
H
HIGH technical implementability
MEDIUM technical implementability
LOW technical implementability
9Unlocking MNO data to enhance public services and humanitarian efforts
11 ARPU, average revenue per user, is a subscriber profitability metric used by the telco industry. Note that “low ARPU” is relative to industry averages and not to GNI estimates.12 Varies based on local regulations.13 McKinsey TMT 2016: Telecommunications industry at cliff’s edge.14 Strategy&: 2017 Telecommunications Trends https://www.strategyand.pwc.com/trend/2017-telecommunications-industry-trends
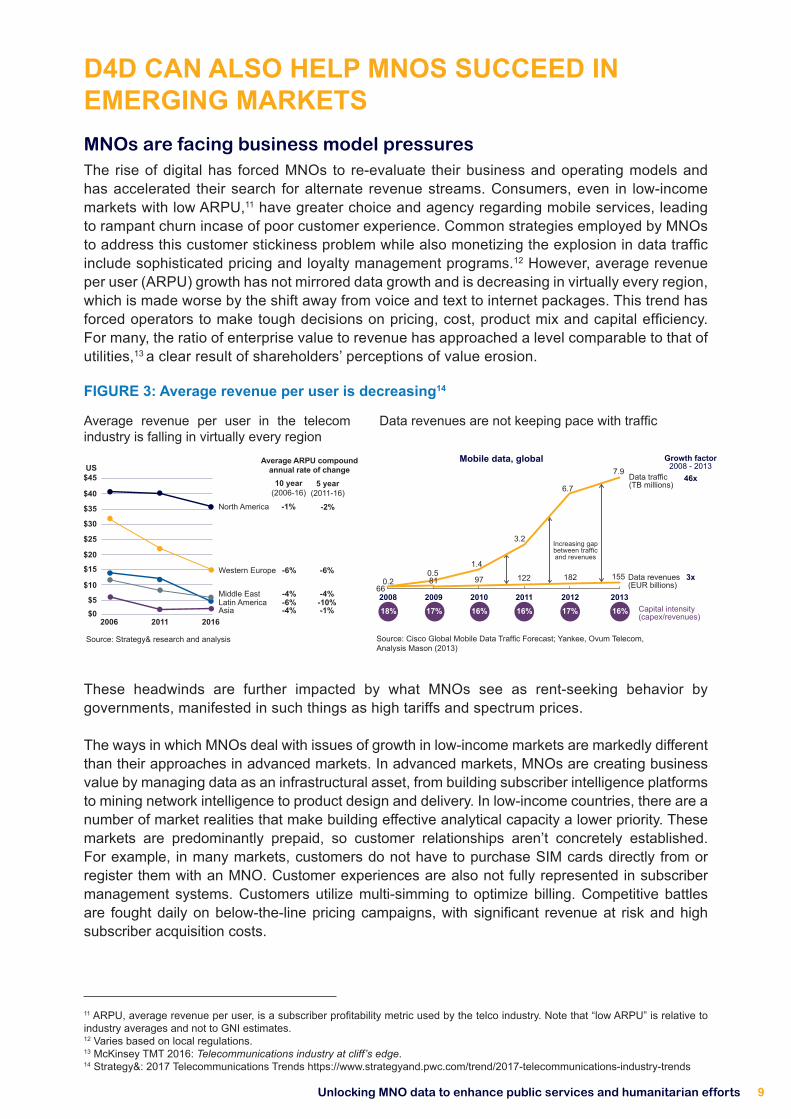
D4D CAN ALSO HELP MNOS SUCCEED IN EMERGING MARKETSMNOs are facing business model pressuresThe rise of digital has forced MNOs to re-evaluate their business and operating models and has accelerated their search for alternate revenue streams. Consumers, even in low-income markets with low ARPU,11 have greater choice and agency regarding mobile services, leading to rampant churn incase of poor customer experience. Common strategies employed by MNOs to address this customer stickiness problem while also monetizing the explosion in data traffic include sophisticated pricing and loyalty management programs.12 However, average revenue per user (ARPU) growth has not mirrored data growth and is decreasing in virtually every region, which is made worse by the shift away from voice and text to internet packages. This trend has forced operators to make tough decisions on pricing, cost, product mix and capital efficiency. For many, the ratio of enterprise value to revenue has approached a level comparable to that of utilities,13 a clear result of shareholders’ perceptions of value erosion.
18% 17% 16% 16% 17% 16%
FIGURE 3: Average revenue per user is decreasing14
Data revenues are not keeping pace with traffic
Average ARPU compound annual rate of change
10 year(2006-16)
-1%North America
5 year(2011-16)
-2%
Western Europe -6% -6%
Middle East -4% -4%Latin America -6% -10%Asia -4% -1%
$45
$40
$35
$30
$25
$20
$15
$10
$5$0
Source: Strategy& research and analysis
2006 2011 2016
US
6.7
7.9
3.2
1.40.581 97 122 155182
Data traffic(TB millions)
Increasing gap between traffic and revenues
Data revenues(EUR billions)0.2
662008 2009 2010 2011 2012 2013
Capital intensity (capex/revenues)
Growth factor2008 - 2013
Mobile data, global
46x
3x
Source: Cisco Global Mobile Data Traffic Forecast; Yankee, Ovum Telecom, Analysis Mason (2013)
Average revenue per user in the telecom industry is falling in virtually every region
These headwinds are further impacted by what MNOs see as rent-seeking behavior by governments, manifested in such things as high tariffs and spectrum prices.
The ways in which MNOs deal with issues of growth in low-income markets are markedly different than their approaches in advanced markets. In advanced markets, MNOs are creating business value by managing data as an infrastructural asset, from building subscriber intelligence platforms to mining network intelligence to product design and delivery. In low-income countries, there are a number of market realities that make building effective analytical capacity a lower priority. These markets are predominantly prepaid, so customer relationships aren’t concretely established. For example, in many markets, customers do not have to purchase SIM cards directly from or register them with an MNO. Customer experiences are also not fully represented in subscriber management systems. Customers utilize multi-simming to optimize billing. Competitive battles are fought daily on below-the-line pricing campaigns, with significant revenue at risk and high subscriber acquisition costs.

digitalimpactallliance.org10
The pressure on margins due to these factors and low ARPUs despite high capex needs make it difficult for even operating units of global telecommunications companies to focus on analytics sophistication. In addition, many low-income countries do not have strong KYC15 regulations in place, so the profile data MNOs collect in these countries is not as rich as what they collect in higher-income countries.16 Finally, operators in low-income markets do not have the option of pursuing the range of alternate business streams (e.g., video on-demand) that their developed market counterparts have. Therefore, they need to double down on core business (voice, text and data) and manage churn while planning for a digital future. These market dynamics directly impact the attitudes and approaches MNOs take while collaborating with the nonprofit sector.
Commercial incentives align with public service goalsSome of the challenges MNOs face in low-income markets can be addressed through analytics. Even for those MNOs that are just beginning on the analytics journey, the same data that is used to solve for business problems can be used to tackle development and humanitarian challenges. Therefore, establishing effective coordination between MNOs and governments and NGOs to gather and analyze data can lead to a win-win situation. For example, analogous testing campaigns that target reducing churn of customers can help identify populations that may face high disease burden risk. The same analytical model that an MNO would create to map mobility and usage patterns of customers to understand profitable clusters for modeling capital expenditures could also be used to inform public service delivery.
15 KYC: know your customer .16 Note that broader data communities are weak too, so combining MNO data insights with low-quality health data or population density data may have a compounding effect on the error.17 Delta Partners Group analysis.
FIGURE 4: Big data use cases identified for an MNO in emerging markets17
The same data MNOs use to solve these business problems can be used to tackle development and humanitarian challenges.

11Unlocking MNO data to enhance public services and humanitarian efforts
For example, the analytic approaches used to understand common insights such as location can be used for both commercial and public-sector decision-making. Figure 4 provides an illustrative breakout of various insight categories and big data use cases an MNO currently could develop for business purposes. It shows that business use cases and insight categories are closely aligned with development sector use cases.
These examples illustrate how MNOs can capture revenue and enhance customer relationships through data collection and building analytical capacity while also being good corporate citizens. In fact, MNOs are uniquely qualified to develop products for the public sector because of the type of data they’re able to acquire. In low-income markets, where smartphone penetration and related application usage is low, MNOs have a competitive advantage over app and internet content providers. That means MNOs have more comprehensive data when it comes to key population indicators, including geographic distribution, income, mobility patterns, social networks, etc. And once they establish partnerships with governments and agencies, MNOs can capture brand value at low market penetration stage.18 Many operators are front and center of these value levers. For example, as part of its Data for Development Innovation Challenge in 2012, Orange released 2.5 billion anonymized CDRs of its customers in the Ivory Coast. The global contest generated ideas that sought to transform the city of Abidjan, including how to cut average commute time, and sparked significant interest in data for development.19
Opportunities for further value creationMNOs should keep in mind that the governments, organizations and agencies they work with will have a wide range of needs, as well as varying levels of sophistication, and ability and willingness to pay for the data they are requesting. These variables will impact how MNOs design their TDaaS (telco data-as-a-service) and related offerings.20 Additionally, MNOs can develop a product for one agency at a relatively low cost, then quickly tweak it to serve the needs of different demand-side agencies.
For example, in the case of a natural disaster, data can be made available in a one-off data philanthropy engagement. In the case of vaccine distribution, an MNO may decide to provide one-off access to its aggregated data for responders to target defaulter populations. At the same time, an MNO may come to a commercial agreement with a Ministry of Health or other donor to provide ongoing or periodic access to its aggregated user data.
These opportunities rest on a continuum, as shown in Figure 5.21 By exploring different levels of engagement, MNOs can develop a better understanding of a new market segment (e.g., public health) and new customer segments (e.g., traditionally considered low-value customers). This can lead to a range of ICT offerings for a new customer base.
18 For instance, in its sixth sustainability report, Safaricom showed the societal value it created was around 10 times greater than the financial profit it made.19 http://www.nytimes.com/2013/08/08/technology/development-groups-tap-big-data-to-direct-humanitarian-aid.html 20 DIAL, which typically invests in low-income markets, brings significant analytical capacity via a network of global technology partners to the local MNOs, which have found it extremely rewarding to have access to best-in-class expertise. While not all NGOs can offer that as an operating model, DIAL believes it can work with partners to provide risk capital to increase market sophistication and accelerated evolution both on the demand and supply sides.21 DIAL is conducting a study in H1 2018 on data commercialization frameworks that can be applied by MNOs in social-sector settings.
By exploring different levels of engagement, MNOs can develop a better understanding of a new market segment (e.g., public health) and new customer segments (e.g., traditionally considered low-value customers).

digitalimpactallliance.org12
22 According to 451 Research, global MNO data revenue is expected to jump from $24 billion today to $79 billion in 2020. Currently, MNOs capture, at the high end, 10 percent of this revenue, or $2 billion via the telecom data-as-a-service (TDaaS) model. This is expected to increase to $24 billion, or 30 percent of market share, by 2020.23 See GSMA Big Data for Social Good Accelerator, UNICEF’s Magic Box, and UN Global Pulse research on the topic.
As demand-side agencies become more aware of the issues MNOs face, including business realities, commercial and societal goals, and the governance and compliance environment, they can structure their transactions in a more standard and effective way. And while there might not be a significant revenue uplift for MNOs participating in the D4D ecosystem in the near term,22 the emerging evidence base23 lays out a number of benefits that provide substantial value in the long run.
Figure 5: Mapping of data sharing opportunities for MNOs
Time period Data philanthropy
Data purchase/subscription
Insights monetization
Ongoing Develop a sustainable strategic relationship
Periodic Develop a sustainable partnership model
One-off Demonstrate a real applicable use case to generate MNO interest
X
X
X
USES CASES
HUMANITARIANDEVELOPMENT
COMMERCIAL

13Unlocking MNO data to enhance public services and humanitarian efforts
FIGURE 6: Underlying risk factors that influence MNOs’ pricing decisions about data
CONSIDERATIONS FOR AN MNO WHEN DECIDING IF AND HOW TO SHARE DATADIAL examined the considerations of MNOs in low- and middle-income countries. MNOs tend to demonstrate three key considerations when deciding if and how to share their data:
(1) Establish comfort with the data buyer/user and consider the use of the data. The MNO needs to understand the use of the data and the profile of the user/buyer before deciding whether they are comfortable sharing their data (by either direct transfer or via algorithmic access) with an external body. An important consideration at this stage is to examine what, if any, privacy protections and processes the requesting party has in place. Clarifying the specific data ask should drive the evaluation. For example, when evaluating privacy risks, the MNO must understand if the data ask is at the aggregate or individual level. If the data user/buyer is not the final recipient of the insights, then having the final recipient in place (e.g., the Ministry of Health) can be a key enabler of this transaction.
(2) Decide whether to structure a commercial agreement or share data pro-bono. In the case of a humanitarian application, an MNO may provide the data free of charge as an example of data philanthropy. Most other applications would likely lead to setting a price. GSMA’s Mobile Data for Social Good, published in June 2017, describes the continuum of applications from humanitarian, development, reporting and commercial along a scale of return on investments—from high social and low financial to high financial and low social, respectively. However, there is no set rule. In some development and reporting applications, MNOs may also decide to share their data pro-bono.
(3) Understand the cost (and determine the appropriate price, if applicable) given the risk tradeoff. Data preparation, cleansing, staging and delivery can take significant time and resources away from an operator’s core business. Even in data philanthropy use cases, there is a cost incurred by the MNO to share data. In these cases, the MNO has to be willing to incur the costs associated with employee time and any additional resources. When an MNO sets the price for its data, there are various factors that need to be considered. No amount of compensation could justify an MNO sharing data when there are serious concerns about operating risks such as data leaks and privacy. On the other hand, as a prerequisite for large-scale open and free MNO data (data philanthropy), there would have to be no operating or business risk (see Figure 6). Realistically, MNOs are looking to build TDaaS models and should welcome feedback from the nonprofit sector in creating innovative pricing models for providing data or insights about their customers.
Prerequisite forData philanthropy

digitalimpactallliance.org14
24 White paper of the Committee of Experts on a Data Protection Framework for India, https://innovate.mygov.in/wp-content/uploads/2017/11/Final_Draft_White_Paper_on_Data_Protection_in_India.pdf. 25 GSMA The Mobile Economy Report 2017.26 These penetration rates refer to unique mobile subscribers.27 The gender gap is calculated by subtracting the female phone ownership (percentage of the female population) from the male phone ownership (percentage of the male population) and dividing this number by the male phone ownership (percentage of the male population).28 GSMA Connected Women Report 2015: Bridging the gender gap: Mobile access and usage in low- and middle-income countries.
THE IMPACT OF REGULATIONS AND DATA LIMITATIONS ON D4D Stakeholders have much to gain from participation in the data for development sector, but it’s critical that they understand how policies and regulations, national governance frameworks, consumer perceptions, and data limitations can impact data access, use and sharing.
MNOs are held back by prevailing legal frameworksOne of the strongest deterrents for MNOs to make data available is regulatory concern. The regulatory environments for MNOs are considered stringent and in continuous flux due to the rapid pace of technological change, thereby complicating D4D sector participation. Countries are adopting a range of approaches to data privacy and ownership, exposing MNOs to legal uncertainty around how regulatory authorities would view these uses within existing laws.
For example, consent to collect, use and disclose personal information is required in the European Union and South Africa. However, in Australia consent is not directly a prerequisite for collecting personal information. Another type of regulation concerns the storage of data (i.e., data localization). In Vietnam, internet regulations require a range of internet service providers to maintain a copy of any information they hold within the country. But Canada does not explicitly require data to be stored locally. India is currently reviewing its laws on data localization and provisionally recognizes that a one-size-fits-all approach may not be appropriate.24
An unpredictable regulatory environment and strict data protection regimes can increase risk for an MNO wanting to provide data to the social-impact sector. This can be true even if the data requestor is the government. For example, if the Ministry of Health requests MNO data, the telecommunications regulator must be informed because they have legal authority over MNOs. In order for the use of data for development to truly scale within a country, regulators and policymakers must be key strategic partners.
Development agencies must consider the limitations of MNO dataFor digital data to be effective in development decision-making, it’s important for practitioners to understand the limitations and considerations of the data they are using. Due to the inherent biases of MNO data, it can’t be the single data source on population studies. While there has been a game-changing explosion in mobile services, many consumers in low-income markets still don’t have access to a mobile phone or can’t afford one. As of 2016, global mobile phone subscriber penetration was 65 percent, with great disparity between developed and developing countries (i.e., Europe averaged 84 percent and sub-Saharan Africa averaged 44 percent25,26). Furthermore, mobile penetration remains concentrated among the affluent even within emerging markets.
A 2015 study conducted by Altai Consulting and GSMA found the gender gap27 in mobile phone ownership in low- and middle-income countries was about 14 percent, or 202 million. In sub-Saharan Africa it was around 13 percent, and in South Asia the number jumped to 38 percent.28 Additionally, MNOs are not able to capture complete data about children, which is useful in humanitarian or crisis settings. While there are analytical methods that can be used to address the biases inherent in MNO data, the strength of this data lies in combining and verifying it with traditional data sources and programmatic data.

15Unlocking MNO data to enhance public services and humanitarian efforts
29 DIAL is working with a number of partners in developing a common learning agenda and will begin to actively solicit feedback from D4D ecosystem participants in HY1 2018.30 Note that this paper does not reference DIAL’s work in the geospatial sector. While there are significant opportunities in queuing from mobile and geospatial data together, documenting those analyses is beyond the scope of this document and will be covered in a subsequent DIAL publication.
CONCLUSIONEfforts are underway by a number of actors to bring about a more systematic and institutionalized implementation of data for development, which should result in a shift toward greater scalability, replicability and sustainability. However, two key requirements are needed to achieve this shift:
(1) A recognition of the shared value proposition . Governments and NGOs need to recognize the multiple uses of MNO data, identify common data asks and streamline requests of MNOs. While MNOs realize the social and, at times, commercial benefits of making their data available to the nonprofit sector, they need to fully commit to working with the sector to develop standardized, repeatable approaches.
(2) Alignment of priorities and coordination of activities among those working in the field. If implementers adopt a common learning agenda where data for development programs focus on answering common research questions and the results are made transparent, then insights can be more easily shared and best practices adopted.29
DIAL supports D4D actors and the broader civic community to address these ecosystem level challenges and systematically unlock MNO data for good. DIAL’s investments are structured to test various market, operational and governance models that support the ongoing use of MNO data to address societal challenges at scale. DIAL is funding a number of studies and open source development projects that provide standardized and scalable mechanisms, business models, metrics, tooling, and deployment approaches for making MNO data available. Through partnerships, DIAL aims to elevate existing efforts and accelerate the availability of mobile, geospatial30 and digital data-driven insights in a structured, privacy-aware manner.

digitalimpactallliance.org16
ANNEXMethodology for determining the relative usefulness of MNO data elements for government and NGO use
DIAL partnered with Delta Partners Group—a global advisory firm focused on the telecom, mobile, digital industry (TMD)—on an extensive evaluation to determine the most impactful data elements for use by governments and NGOs. The exercise first mapped the various kinds of data generated in the value chain (see Figure 7). Data was then reorganized into five broad insight categories:
1. Location data: ERP/Network (e.g., tower pinged, tower location, traffic per tower)
2. Profile data: CRM/ERP (e.g., unique ID, device type and any customer info)
3. Usage and spend data: Billing/DPI (e.g., Mins/MBs/SMS used, websites and apps accessed, top-up amounts)
4. Ambient information: ERP/Network (e.g., signal interferences, outages)
5. Third-party data: DPI (e.g., purchase history, social media, messaging apps, GIS location maps)
Ambient information and third-party data are typically harder to access due to low penetration of smartphones in low-income markets and were therefore excluded from this analysis. This left three types of MNO data: location data, which helps track population movements more efficiently; profile data, which provides more accurate information about users themselves; and usage and spend data, which provides further information about user activity which, when analyzed with other variables, can indicate changes in behavior patterns.
A library of 30 use cases (see Figure 9) were studied and grouped into 16 categories based on their use of particular data insights. Each of the use cases utilized different types and combinations of MNO data. For example, when usage and spend data is combined with location and user data in a food security use case, one can analyze the relationship between airtime recharge patterns and food security variables, creating a proxy measure of food security. This information can be used to measure food security and pre-empt food crises.
The resulting insight categories were:1 Location snapshot by profile2. Location snapshot3. Usage/spend over time4. Profile snapshot5. Usage snapshot
Figure 7: Data types generated within MNO systems

17Unlocking MNO data to enhance public services and humanitarian efforts
6. Location and usage/spend snapshot7. Location over time by profile8. Location over time9. Usage/spend over time by profile10. Usage/spend snapshot by profile11. Location and usage/spend over time by profile12. Location over time by usage/spend and profile13. Usage/spend over time by profile and location14. Usage and spend trends by profile and location (m-payments only)15. Location snapshot and usage (SMS/call) analysis16. Usage-based social circles
The 16 insight categories were then evaluated by three criteria to determine usefulness. The study based its analysis on applications in five sectors: economic development, humanitarian assistance, health care, education and agriculture. Common scoring was used to qualitatively estimate the use case insight categories, per the following rules:
Criteria Definition High Medium Low
Viability
An assessment of the efficacy of the data in addressing the development or humanitarian need vs. the risk of misuse of data. Insights were tagged in terms of relative risk associated with sharing underlying data (high viability being low risk and vice versa).
Aggregated and anonymized data used in the use cases
Anonymized, but individual-level data used in the use cases
Individual and identifiable data used in the use cases
Replicability
An indicator of reusability of the same insight across several different development needs and sectors. Replicability was measured as “high,” “medium” or “low” in relative terms based on identified applications in previous experiments across the insight categories.
>3 proven use cases
2-3 proven use cases
1 proven use case
Implementability
Assessed on a case-by-case basis on a variety of factors across the data lifecycle, from ingestion, transformation, storage, analysis and visualization/delivery. In general, more complex, compounded insights have lower implementability versus basic insights, which just utilize a single, straightforward dataset.
One major data field to be extracted per use case
Two data fields to be extracted per use case
2+ data fields to be extracted (including trend over time)
The results highlighted five priority insights on mobile users that can be relevant to government and NGO efforts, based on their viability, implementability and replicability. These included (I) location snapshot, (II) location over time, (III) usage/spend over time by profile and location, (IV) location snapshot by profile, and (V) location over time by profile. Figure 2 in the main paper indicates these elements as “top priority.”
Figure 8: Criteria for prioritization of MNO data insight categories

digitalimpactallliance.org18
I A
Figure 9: Selected use cases per insight category
Insight category Use case Development
challenge Solution
Profile snapshot
UID (health care records)
Fragmented records and duplicated identifiers make it hard to track health care history
Develop unique ID using mobile phone number for patients to aggregate health care records
UID (vaccination specific)
Patients do not follow vaccination schedule if they visit multiple health care centers
Develop unique ID using mobile phone number to track patients across different health care locations to ensure appropriate vaccinations are administered
UID (government records)
Limited means to cross-reference government records for individuals
Develop unique ID using mobile phone number for aggregating governmental records to keep track of populace
Location snapshot
Population estimation (immunization)
Incorrect picture of immunization penetration
Better understand immunization penetration rate by improving accuracy of population count (denominator) using telco subscriber estimates by location
Population estimation (literacy)
Incorrect estimate of literacy rate
Better assess literacy rates by improving accuracy of population count using telco subscriber estimates by location
Epicenter identification
Predicting locations of disease outbreak
Identify areas of particularly dense population based on tower static to proxy disease breakout areas
Health care network planning
Lack of visibility on where to put next clinic
Map hospital/clinic network with subscriber density map to identify areas with unmet demand
Education network planning
Lack of visibility on where to put next school (or understand need for virtual school)
Map school network with subscriber density map to identify areas with unmet demand
Usage snapshot Value segmentation Limited information on customer profiling
Leverage usage/spend levels to proxy value segmentation of selected data set
Location over time
Disease vector prediction
Inability to contain contagious diseases
Map migration patterns of people (all or identified patients) to determine likely direction of spreading diseases to direct treatment efforts
Immunization tracking
Ensuring people maintain immunization schedule (across migration seasons)
Track seasonal and nomadic migration trends to ensure proper immunization schedule if enforced across locations
Infrastructure planning (roads)
Determining the need and routes for road network expansion
Map migratory routes of people to ensure appropriate infrastructure is available along these routes
Infrastructure planning (urbanization)
Understanding which regions fall short on infrastructure capacity
Identify regions with an increasing influx of people and focus infrastructure improvements on them
Aid distribution Determining where to send aid during crises
Real-time mapping of change in customer location over disaster period can help identify which end locations relief should be provided to
SECTOR Economic development Health care Education Agriculture
1
2
3
4
5
6
7
8
9
10
11
12
13
14
Humanitarian
INSIGHT LEVEL Individual Aggregated
I
A
I
A
A
A
A
A
A
A
A
I
I
I
A

19Unlocking MNO data to enhance public services and humanitarian efforts
Insight category Use case Development
challenge Solution
Usage/spend over time Food security Predicting food crises
Correlation between recharge patterns and food security variables can be used to measure food security and pre-empt food crises
Location snapshot by profile
Enriched population mapping
Understanding demographic distribution
Plotting subscriber location based on profile elements
Location over time by profile
Farmer enablement Locating farmersIdentify farmer locations and optimal access routes based on mobile profiling and towers pinged
Health care efficacy Measuring efficacy of health care network
Plot time taken and distance travelled by patients to access health care center
Usage/spend snapshot by profile
Population segmentation
Understanding value distribution
Leverage usage/spend levels to proxy value segmentation and distribution of full population
Usage/spend over time by profile
Literacy rate validation
Inaccurate literacy estimates
Proxy literacy rate by ration of voice calls to text on an individual level
Credit worthiness Lack of proof or creditworthiness
Build a relative credit worthiness index based on spending and usage trends to help enable farmers
Location over time by usage/spend and profile
Enriched migration tracking
Understand types of migrants
Track change in locations for people segmented by value metrics
Usage/spend over time by profile and location
Agro-price discrimination
Farmers forced to pay prices beyond their means
Overlay farmer location with poverty mapping to enable (positive) price discrimination
Poverty estimationIdentify poverty levels of individuals and regions
Build and map poverty index based on customer profiling and usage across locations
Socio-economic profiling
Understanding and leveraging value distribution
Leverage usage/spend levels to proxy wealth quintiles and tailor communication as per identified preferences
Location and usage/spend over time by profile
Enriched behavior tracking
Understand types of migrants
Track change in locations for people segmented by value metrics evolution
Usage-based social circles Support system Determining where to
send aid during crises
In times of crisis, people are likely to move to locations where their social circles are historically tracked
Location snapshot and usage (SMS/ call) analysis
Tailored education Inefficient literacy programs
Tailor literacy programs to geo-fenced community as identified by common language
(m-payments) Usage and spend trends by profile and location
Supply chain management
Farmer supply chain inefficiencies
Better connect buyers and sellers to reduce supply chain inefficiencies and improve transparency
Financial inclusionIdentifying unbanked/underserved sections of society
Using MFS penetration as a proxy for banking services utilization
SECTOR Economic development Health care Education Agriculture
15
16
17
18
19
20
21
22
23
24
25
26
27
28
29
30
Humanitarian
I AINSIGHT LEVEL Individual Aggregated
A
I
A
A
A
I
A
A
I
A
I
I
A
A
I
A
I
A

digitalimpactalliance.org