university of the arts london carbon management plan responsibility – making it clear that saving...
TRANSCRIPT

University of the Arts London
Carbon Management Plan
Date: June 2017 Version number: 6 Owner: Ian Lane (Head of Sustainability) Approver: Steve Howe (Director of Estates)

2
Contents
Foreword 3
Management Summary 4
1. Introduction 9
2. Carbon Management Strategy 11
2.1 Context and drivers for Carbon Management 11
2.2 Strategic Themes 11
2.3 Targets and Objectives 13
3. Emissions Baseline and Projections 14
3.1 Scope 14
3.2 Baseline 14
3.3 Projections and Value at Stake 15
4. Carbon Management Projects 19
4.1 Existing Projects 19
4.2 Planned / funded projects 19
4.3 Near term projects 21
4.4 Medium to long term projects 21
5.1 Assumptions and the future funding of Higher Education 23
5.2 Benefits / savings – quantified and unquantified 23
6.1 Policy – embedding CO2 savings across your organisation 24
6.2 Responsibility – making it clear that saving CO2 is everyone’s job 24
6.3 Data Management – measuring the difference, measuring the benefit 24
6.4 Communication and Training – ensuring everyone is ready, willing and able
6.5 Procurement – engaging suppliers 27
6.6 Monitoring & Targeting – keeping track of progress 26
7.1 The Programme Board –strategic ownership and oversight 27
7.3 Continuity planning for key roles 28
7.4 Ongoing stakeholder management 28
7.5 Annual progress to the Executive Board 29
Embedding Matrix 30
Example of mechanical and electrical improvements proposed one building within the UAL portfolio. 30

3
Foreword
University of the Arts London Vice-Chancellor Nigel Carrington has signed the People & Planet
Green Education Pledge. People & Planet invited Vice-Chancellors and other associated education
organisations leaders to sign up to the declaration to commit to working towards a greener higher
education sector.
The pledge acknowledges that: “Education is critical to achieving the transition to a low carbon
economy and society. Teaching and learning are crucial to inspire and educate the next generation
of decision makers, business leaders and citizens, and equip them with the skills and knowledge
to deal with the challenges of climate change. Research and innovation helps us to understand the
many facets of climate change and will be central to developing ideas and technologies to mitigate
and adapt to climate change.”
The Carbon Management Plan supports this pledge and captures the University’s commitment to becoming a more sustainable institution. This plan is a live document and will update as our business activities change and will reflect accurately the carbon emissions we are responsible for.
Please view my presentation about what sustainability means to UAL in the context of sustainable development for the sector via- http://view6.workcast.net/?pak=5206429876747473&cpak=4032530792499480

4
Management Summary
The University of the Arts London (the University) has its origins in five previously independent art, design, fashion and media colleges, which were brought together to form the London Institute in 1986. The Wimbledon College of Art joined in 2006. The colleges were originally established from the 19th century to the early 20th century. In 2003, the London Institute received Privy Council approval for university status and was renamed the University of the Arts London in 2004. Six distinctive and distinguished Colleges make up the University:
Camberwell College of Arts Central Saint Martins College of Arts and Design Chelsea College of Art and Design London College of Communication London College of Fashion Wimbledon College of Art
Located within London, the Colleges are at the heart of their communities. Their close-knit and welcoming environments are a launch pad for your studies, which will also be supported by all the resources of the larger University and the wider London arts community. In 2015/6 over 19,000 students, from 114 countries made us Europe’s largest specialist arts and design University. Over 1,111 academics, research and technical staff are supported by more than 2,000 associate lecturers. Together they deliver a diverse range of courses at all levels from foundation and undergraduate to postgraduate and research. We are proud to have teaching staff who are themselves active professional artists, practitioners, designers, critics and theorists engaged in cutting-edge research. Sharing this diversity, knowledge and expertise with our students, we provide a unique learning experience to the creative leaders of tomorrow.

5
The University is committed to reducing its carbon emissions. A joint consultation between HEFCE, Universities UK and GuildHE on developing a carbon reduction target and strategy for higher education in England has been published with key emphasis placed on the higher education sector. The sector should:
Commit to reducing scope 1 and 2 emissions by 80 per cent by 2050 and by at least 34 per cent by 2020, against a 1990 baseline1. This translates into 43% from 2005 to 2020 needed to compensate for increases emissions in the Higher Education sector since 1990.
Commit to reducing scope 3 emissions in-line with Scope 1 & 2 emissions
Institutions are required to have carbon management plans and performance against these plans will be a factor in capital allocations from 2011. HEFCE requires the plan to be signed off by the governing body (the Executive Board, in the case of the University).
Scope 1, 2 & 3 emissions The University’s carbon baseline for 2011/12 has been re-calculated to be 12,423 tonnes of carbon dioxide emissions, covering Scope 1 & 2 emissions. The most up-to-date total carbon baseline, including Scope 3 emissions, for the University in 2015/16 is estimated to be 61,000 tonnes of carbon (please refer to HESA data for an exact breakdown of carbon emissions). Total emissions are likely to increase in the future without a Carbon Management Plan (CMP). The calculation of total emissions for the CMP may differ from other published baselines to satisfy our Carbon Reduction Commitment and Estate Management Records obligations. As before, version 6 of the CMP includes consumption from all our utility supply points which now total 124. As declared in version 5 of the CMP, UAL committed to policies and actions to reduce the University’s Scope 1 & 2 carbon emissions by 22% or 2,733 tonnes, by the end of academic year 2015/16.
UAL exceeded this target by 3% and has made a total reduction of 25.9% in
Scope 1 & 2 carbon emissions. This updated version of the Carbon Management Plan will outline policies and actions that will aspire to reduce emissions by 43% by 2020 for Scope 1, 2 & 3 emissions. Implementation of version 6 of the UAL CMP will cost the University £549,000 up until July 2020 (including operational costs). The total financial saving the CMP is anticipated to deliver is £1,080,000 by July 2020. It is worth restating that the UAL carbon 2010/11 baseline was audited in 2013 however the 2005/6 baseline (the first year all HEIs were asked to submit carbon footprints) cannot be verified. Indeed, the University didn’t submit a baseline in 2005 (https://www.hefce.ac.uk/media/hefce/content/pubs/2010/rd1410/rd14_10.pdf page B-5).
1 Scope 1 emissions are all direct Green House Gas (GHG) emissions. Scope 2 emissions are all indirect GHG emissions
from consumption of purchased electricity, heat or steam. Scope 3 emissions are other indirect emissions, such as the extraction and production of purchased materials and fuels, transport-related activities in vehicles not owned or controlled by the reporting entity, electricity-related activities not covered in Scope 2, outsourced activities, waste disposal, etc

6
With regard to Scope 1 & 2 emissions, the 2015/16 reduction achievement of 25.9% compared to the original baseline. Although it may be 2.8% below target UAL is confident of reducing its entire carbon footprint by 2020. This is considered realistic given the possible rationalisation of buildings occupied by the University in the medium term.
The University has identified 6 measures that will contribute to a reduction in carbon emissions and a series of enabling activities that will embed carbon management within the University. These include:
UAL is one of only 6 HEIs to have been awarded ISO50001 accreditation. This is an internationally recognised quality and environmental management system dedicated to energy efficiency. UAL monitors utility consumption and promotes energy efficiency across its portfolio of buildings. The scope of our ISO50001 system includes all learning, teaching and research activities as well as all administrative functions associated with UAL.
In November 2016, the university’s Executive Board approved the ‘UAL Sustainability Manifesto’ (please refer to Appendix C). After a year of consultation, this behavioural change programme will aim to promote positive interventions by each individual. Led by the Head of Sustainability and using an action-research approach to encourage all staff and students to be responsible for reducing carbon emissions by designing (and therefore owning) the interventions themselves.
The implementation of a Mechanical, Electrical and Plumbing Building Particulars Document that embeds energy efficiency and sustainability. In 2017/18 the university will invest over £1.9M on electrical and mechanical maintenance to ensure non-residential university buildings support our outstanding learning, teaching and research. To ensure the university maximises this opportunity, the Estates Department has introduced key design concepts to ensure that when mechanical and electrical assets are repaired or replaced best practice is followed and minimum standards of performance are delivered. This is also a huge
Chart 1.1: Breakdown of Scope 1 & 2 emissions 2011/12
CSM 28.60%
LCC 6.52%
LCF 22.78%
Chelsea 21.38%
CCA 8.90%
WCA 10.84%Secretariat 0.92%
Halls 0.06%
Baseline (by College)

7
opportunity to embed sustainability as the Estates Department invests in efficient equipment, negating the need for additional resources to be spent on retrofitting energy conservation measures to reduce our carbon footprint. This is an extension of what the Estates Department previously provided and produced positive results and UAL’s first ever BREEAM ‘outstanding’ building (http://www.carbonplan.co.uk/?case-study=wimbledon-college-of-arts ), which recently picked two further awards to its burgeoning collection from the Royal Institute of British Architects (https://www.architecture.com/awards-and-competitions-landing-page/awards/riba-regional-awards/riba-london-award-winners/2017/new-studios-wimbledon-college-of-arts). To maximise the usefulness of the document, all approved contractors will be expected to comply with the particular requirements when preparing any information that affects building engineering services. The document is available via (http://www.arts.ac.uk/media/arts/about-ual/sustainability/UAL-Mechanical-Electrical-Plumbing-Design-Particulars-v3-April-2017.pdf)
A new waste and recycling contract that continues to divert 100% of waste from landfill, send food waste to an anaerobic digester and recycle coffee cups via a dedicated service
A Travel Plan focused on safer cycling and walking. Public transport remains the primary mode of transport, as is the case of most non-campus based, urban universities
Working with Camden Council to explore the appropriateness of a consolidation service to reduce business travel and packaging for products the university purchases.
If we run our business as usual, what the University spends on energy might rise by as much as £301,000 over the next two years. As the market prices of energy increase and remain volatile, the best way to reduce the risk of substantial cost increases is to implement our ISO50001 system. Therefore, saving carbon not only contributes to our environmental sustainability agenda, but also makes good business sense. The interventions outlined above represent an attractive payback periods of between two years. This plan estimates that £454,000 of funding is required to implement this plan in full. In summary, the University has developed this Carbon Management Plan so as to:
Reduce energy consumption and expenditure on energy bills;
Allocate roles & responsibilities for implementing energy efficiency as part of the maintenance of mechanical, electrical and plumbing assets;
Establish an effective system of monitoring consumption and achieved savings (in-keeping
with the UAL Sustainability Manifesto and other strategic themes of the University); and,
Set an informed carbon reduction target and guide progress to meet the statutory requirements of the Carbon Reduction Commitment Energy Efficiency Scheme (CRC EES)2.
Scope 3 emissions The baseline carbon emissions for 2015/16 is available via https://www.hesa.ac.uk/data-and-analysis/publications/estates-15-16/definitions 2 The Carbon Reduction Commitment Energy Efficiency Scheme is a central government scheme designed to encourage large consumers of energy to reduce carbon emissions. Carbon allowances must be purchased to off-set total carbon emissions each year. The allowances are non-refundable and monies go directly back to the government.

8
The table above compares 2014/15 to 2015/16 carbon emissions. For ease of reference, this R-A-G table compares performance between both years.
Scope 3 emissions have been calculated to be just over 51,000 tonnes of carbon, which is less than the previous year.

9
1. Introduction
Sustainability issues, in particular climate change and the depletion of finite natural resources, have grown in importance over the last 20 years. University staff and students are aware of climate change issues whether it is through responding to statutory requirements in the workplace, studying the subject directly or simply as citizens of a global community. The previous government, keen to reduce national carbon emissions strengthened financial, legal and policy incentives. In addition HEFCE and GuildHE have made clear that Higher Education buildings must become sustainable. Rising costs for waste disposal, transport, raw materials, gas and electricity have also impacted on our institution. At the same time, corporate environmental reporting, benchmarking and league tables are also prominent in the HE sector as they have been in the private sector for many years.
The University continues to use processes developed by the Carbon Trust as the foundation for its CMP and respond to the climate change agenda. The University will over the next ten months ensure it has;
Mobilised a team of staff and students;
Established where it uses energy;
Calculated its carbon emissions;
Identified opportunities for reducing its impact by designing a cost effective strategy;
Developed these opportunities into a programme of energy efficiency projects which will be implemented by July 2020.
The process is owned by the Sustainability Advisory Panel who will monitor each of the five stages in turn (Figure 1.1).
A total of four Sustainability & Environment Project Board meetings are held each year.
Figure 1.1: The well recognised steps to developing a CMP

10
Moving successively through the five stage process will enable the University to target its main sources of carbon dioxide emissions through the most cost effective actions. The programme contains energy efficiency measures that address both electricity and gas consumption in the University’s portfolio buildings. Many of the mechanical and electrical opportunities to reduce carbon already captured will be implemented in the next four years. However, changes in how the University operates – changes that are essential to the overall success of the CMP will extend beyond the life of this document. A sub-group has been organised, the Sustainability Working Group, to review the Carbon Management Plan once per year. The Carbon Trust states CMPs approve cross-reference policies, strategies and plans that are relevant to the organisation. Such plans include Strategic Business Plans, for example.
Executive Board
Sustainability Advisory Panel
progress of the CMP is reported termly
Pro Vice Chancellors
Student Union President
College Deans
ability to make decisions that affect the implementation of the CMP
Figure 1.2: Ownership chart of the CMP

11
2. Carbon Management Strategy
2.1 Context and drivers for Carbon Management
The Climate Change Act 2008 is the UK’s first long term legally binding framework to tackle the dangers of climate change. This requires the UK to reduce CO2 emissions by 80% by 2050. This Act has required the University to register for the Carbon Reduction Commitment Energy Efficiency Scheme (CRC EES). From April 2012 the University will have to buy an annual carbon allowance for every tonne of carbon it emits. The University estimates £165,000 will be required annually to purchase the necessary amount of carbon allowances, until the scheme ceases in 2019. The University aspires to improve its reputational performance and will submit the required information for national drivers such as the People & Planet Green League for which it has moved from 127th to 61st to 37th in 2016.
International and national climate change policy is a substantial external driver that is encouraging Universities to address carbon management. Climate change and energy issues have continued to increase in political importance over recent years and climate change now benefits from almost constant mainstream media coverage. The Government’s Climate Change Strategy and Energy White Paper contain sequential carbon emission reduction targets for 2010, 2020 and 2050 and a target to increase renewable energy to 10% of electricity generation by 2010 and 20% by 2020. Other national drivers which impact upon the higher education sector include the Landfill Directive. This requires the UK to implement strategies to increase recycling rates and in turn restrict waste being committed to landfill. The cost to dispose to landfill currently resides at £65 a tonne.
The Energy Performance Building Directive has spawned a number of legal requirements to improve the efficiency of buildings. This has required the University to produce Display Energy Certificates (DECs) for all its buildings with a floor area greater than a 1,000m2. Each certificate must state how well a building performs in its energy consumption rating A to G. Similarly, the University will have to test and certify all air conditioning plant over 250kW from January 2009 and then from January 2011 all air cooling plant over 12kW. While this will add to annual compliance costs it will help maintain plant efficiencies and identify opportunities for improvement. In 2009 the University was required to provide DEC’s for 18 buildings. Of these, four buildings received a ‘C’ rating; eight were rated as ‘D’ and four received a ‘G’ rating.
2.2 Strategic Themes
The Higher Education sector as a whole will continue to experience a period of change and adjustment as institutions react to the new aspirations of the government and Brexit. Even before the new challenges of shared services and greater collaboration were mooted, the University of the Arts London had already begun to review its functions in order to provide better performance and efficiency. In 2016 UAL launched a strategic plan covering the period 2016-2022. This strategy aims to ensure that we become a world-class University with high levels of student engagement and satisfaction. For 2015-2022 we are focusing on four key strategic areas: Delivering transformative education requires us to ensure that all our students can reach their full potential. It requires us to work in partnership with them to develop and deliver an education that is responsive, responsible, imaginative and inspirational. Developing world-leading research and enterprise requires us to create and apply knowledge that develops our disciplines, makes a positive contribution to society and the economy, and generates new sources of income to support our academic ambition. Communication and collaboration requires us to place the University at the centre of the

12
debate about the future of arts, design, fashion and communication and to improve the ways in which we engage with academic, cultural and business partners, both in the UK and across the world. Building an inspirational environment requires us to have a world class physical environment and underlying infrastructure that supports our students and staff in their academic ambitions and increases our engagement with our wider communities. A key performance indicator of the last priority theme is UAL’s carbon footprint (http://www.arts.ac.uk/about-ual/strategy-governance/ual-strategy-2015-22/building-an-inspirational-environment/)
The report covers the period up to 2020. Each year, progress against the Medium Term Strategy is reported to the Executive Board. The KPI used here is carbon emitted per full time student. Between 2014 and 2015, UAL emitted 541.18kg of carbon per full time student when the sector median was 772.67kg. The reduction in carbon emissions appear to be the continuation of a trend of falling carbon emissions since 2013. The Estates Department is estimating that UAL will have emitted even less carbon for 16/17, with the emissions falling further to 508kg of carbon per full time student.

13
2.3 Targets and Objectives
The CMP is also expected to deliver:
1. Carbon savings of 7,125 tonnes from Scope 1 & 2 emissions by July 2020; 2. A carbon footprint of 75,000 tonnes by July 2020 3. A shared work programme with energy efficiency activity undertaken by a large number of
staff across the organisation; 4. A regular reporting procedure for energy consumption and carbon emissions, embedded in
ISO50001; 5. An organisational focus on energy efficiency that will enable the organisation to continue
reducing its carbon emissions into the future; 6. High levels of energy awareness amongst its staff;
The CMP requires a management framework that ensures the effective delivery of a number of energy saving projects. This will include:
1. Annual monitoring and annual reporting of the CMP to the Sustainability Advisory Panel
2. Quarterly review of the implementation of actions associated with the Sustainability Manifesto;
3. Greater awareness of energy consuming behaviour by all divisions and service areas;
4. Consideration of energy performance within all procurement decisions;
5. Inclusion of energy efficiency responsibilities within facilities and buildings management;
6. Development of energy efficiency specifications for capital projects;
7. Addressing the Carbon Reduction Commitment Energy Efficiency Scheme.
THE UNIVERSITY OF THE ARTS LONDON WILL REDUCE CARBON EMISSIONS FROM ITS ACTIVITIES BY 22% FROM
THE 2011/12 BASELINE BY July 2016
AND
43% BY MARCH 2020
14
3. Emissions Baseline and Projections
3.1 Scope
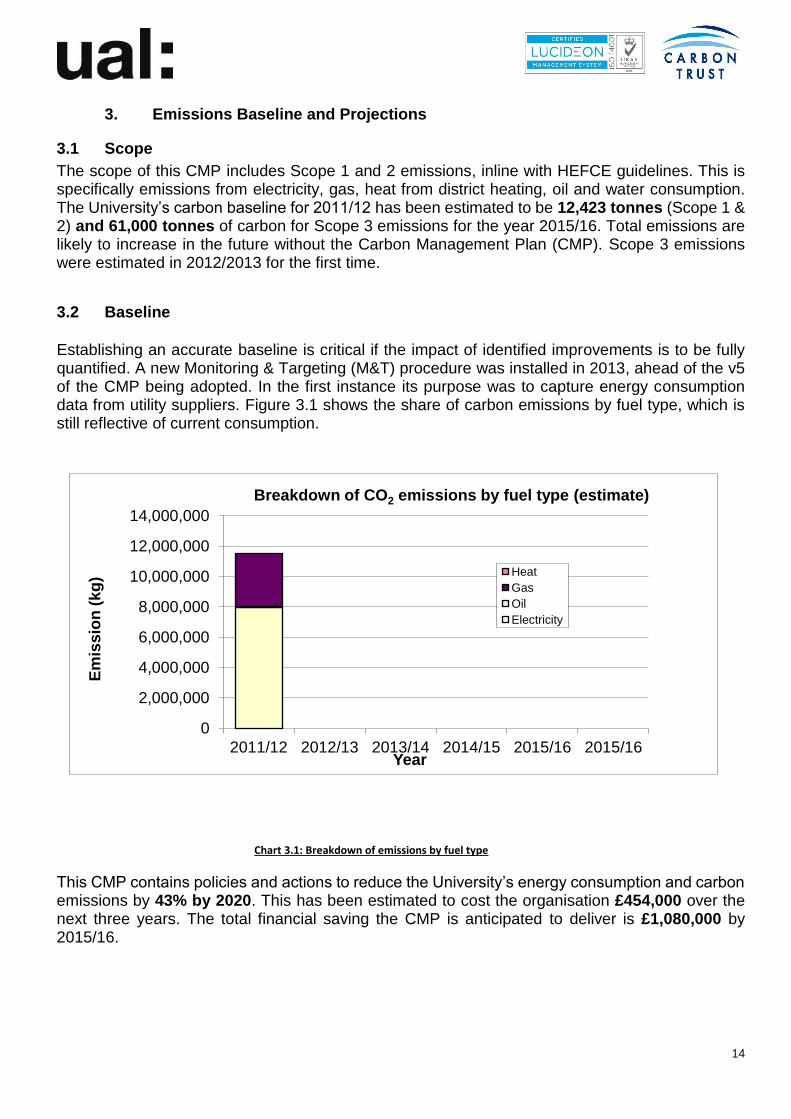
The scope of this CMP includes Scope 1 and 2 emissions, inline with HEFCE guidelines. This is specifically emissions from electricity, gas, heat from district heating, oil and water consumption. The University’s carbon baseline for 2011/12 has been estimated to be 12,423 tonnes (Scope 1 & 2) and 61,000 tonnes of carbon for Scope 3 emissions for the year 2015/16. Total emissions are likely to increase in the future without the Carbon Management Plan (CMP). Scope 3 emissions were estimated in 2012/2013 for the first time.
3.2 Baseline
Establishing an accurate baseline is critical if the impact of identified improvements is to be fully quantified. A new Monitoring & Targeting (M&T) procedure was installed in 2013, ahead of the v5 of the CMP being adopted. In the first instance its purpose was to capture energy consumption data from utility suppliers. Figure 3.1 shows the share of carbon emissions by fuel type, which is still reflective of current consumption. This CMP contains policies and actions to reduce the University’s energy consumption and carbon emissions by 43% by 2020. This has been estimated to cost the organisation £454,000 over the next three years. The total financial saving the CMP is anticipated to deliver is £1,080,000 by 2015/16.
Chart 3.1: Breakdown of emissions by fuel type
0
2,000,000
4,000,000
6,000,000
8,000,000
10,000,000
12,000,000
14,000,000
2011/12 2012/13 2013/14 2014/15 2015/16 2015/16
Em
iss
ion
(kg
)
Year
Breakdown of CO2 emissions by fuel type (estimate)
Heat
Gas
Oil
Electricity

15
Chart 3.2 shows the previous performance of carbon reduction activities for scope 1 & 2 emissions, as detailed in version 5 of the CMP. Also shown the rate of reduction required to meet the CIF2 target. Based on UAL’s performance from 2012 to 2017, the target is achievable.
Graph Legend:
Planned Reduction to 2015 (CMP)
Planned Reduction from 2015 to 2020
Equal reduction Line
Chart 3.2: Carbon emissions trajectory and targets from 2012 to 2020

16
Chart 3.2a shows the previous performance of carbon reduction activities for scope 1, 2 & 3. Also shown the rate of reduction required to meet the CIF2 target. Based on UAL’s performance from 2012 to 2017, the target is ambitious but realistic.
Chart 3.2a: Carbon footprint trajectory from 2012 to 2020

17
3.3 Projections and Value at Stake
The carbon ‘Value at Stake’ is defined as the difference between the Business-as-Usual (BaU) scenario and the carbon reduction target. Chart 3.3 below outlines the carbon reduction benefits of the carbon management programme, with regard to Scope 1 & 2 emissions. The red line predicts the business-as-usual trend of carbon dioxide emissions for the University. This includes a predicted increase in electricity of 1% per year and accounts for the future expansion of University, a 24-hour library service at some of our buildings and external commercial events. As can clearly be shown, this plan projects that carbon emissions will increase without any intervention to better manage emissions arising from buildings. The blue line in Chart 3.3 projects the reduction in carbon emissions that can be achieved if the University meets the 43% target. This chart also illustrates that when comparing inaction with meeting the target, the University is likely to emit an additional 7,047 tonnes of carbon over the next two years. The cumulative financial Value-at-Stake that the University would be confronted with under a ‘business-as-usual’ approach has also been considered (please refer to Chart 3.4). The buildings considered as part of this CMP cost in excess of £3.6M in terms of gas, electricity and fuel oil. This demonstrates that the financial Value-at-Stake associated with inactivity is £183,200 over the same three year period.
Chart 3.3: Carbon Value-at-Stake
-
1,000
2,000
3,000
4,000
5,000
6,000
7,000
8,000
9,000
10,000
2017/2018 2018/2019 2019/2020
Comparison of actual emissions with BAU increases and reduction targets predicted for scope 1 & 2 emissions
Actual emissions B-A-U targets Target
Cumulative Value at Stake by 2019/20: 5,346 t of carbon

18
The University of the Arts London CMP focuses on securing these energy, financial and carbon savings.
Chart 3.4: The Financial Value-at-Stake
3,350,000
3,400,000
3,450,000
3,500,000
3,550,000
3,600,000
3,650,000
3,700,000
3,750,000
2017/2018 2018/2019 2019/2020
Comparison of emissions with BAU increases and reduction targets - financial
Actual spend B-A-U targets Target

19
4. Carbon Management Projects
4.1 Existing Projects
This section outlines what UAL’s previous attempts to reduce carbon emissions were and their influence upon the identification of future projects. Large organisations have long been aware of the need to reduce carbon emissions although it is common that explicit internal drivers to promote carbon reduction may not have been present. In the case of the UAL, the role of promoting greater environmental awareness was split amongst our Colleges as part of the Sustainability Working Group. In August 2012 the Head of Sustainability was appointed to coordinate projects such as the Sustainability Committee (as was, now Sustainability Advisory Panel). The list of the projects that achieved a 25% reduction target is shown in Appendix B and includes details of payback, capex per tonne of saved, lifetime CO2 saving and cost effectiveness. The Estates Department will ensure that monies will be made available for the UAL Sustainability Manifesto between 2016 - 2022. Works classified as ‘Pre Planned Maintenance’ will be funded in the order of £1.9M per year and includes a variety of projects including reactive repairs, servicing of mechanical and electrical systems and replacing equipment that had reached the end of its useful life. Energy efficiency is included as part of these interventions as per the UAL MEP Building Particulars Document (please refer to the introduction for full details).
4.2 Planned / funded projects
Regarding Scope 3 emissions, the following short term actions have been agreed, with funding identified from existing budgets
Type Notes Actions
Business Travel (staff and students)
In comparison, UAL doesn’t emit a vast quantity of carbon from business travel.
Flights within the UK are prohibited
Staff Commute
As per the UAL Travel Plan.
No car parking is available at any University site.
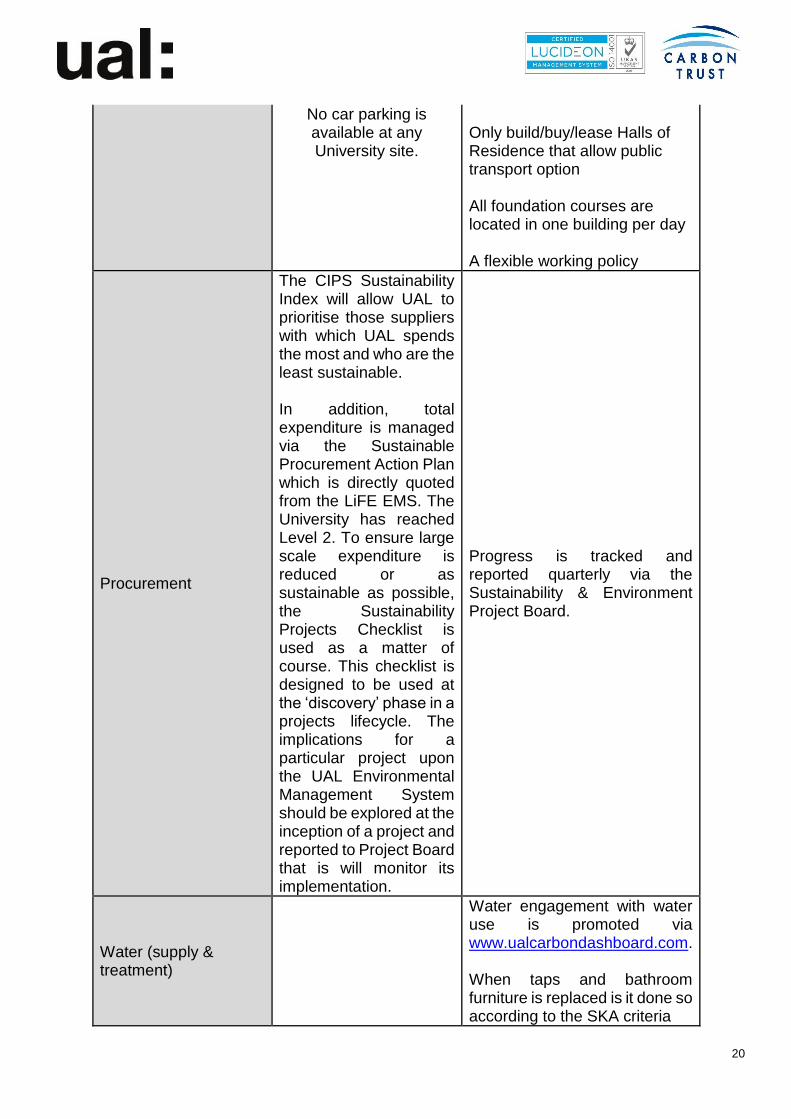
Promote safer cycling Ensure refurbishment projects include ‘transport’ within scope of the SKA assessment Only build/buy/lease Halls of Residence that allow public transport option All foundation courses are located in one building per day
Student Commute
As per the UAL Travel Plan.
Promote safer cycling Ensure refurbishment projects include ‘transport’ within scope of the SKA assessment
20
No car parking is available at any University site.
Only build/buy/lease Halls of Residence that allow public transport option All foundation courses are located in one building per day A flexible working policy
Procurement
The CIPS Sustainability Index will allow UAL to prioritise those suppliers with which UAL spends the most and who are the least sustainable. In addition, total expenditure is managed via the Sustainable Procurement Action Plan which is directly quoted from the LiFE EMS. The University has reached Level 2. To ensure large scale expenditure is reduced or as sustainable as possible, the Sustainability Projects Checklist is used as a matter of course. This checklist is designed to be used at the ‘discovery’ phase in a projects lifecycle. The implications for a particular project upon the UAL Environmental Management System should be explored at the inception of a project and reported to Project Board that is will monitor its implementation.
Progress is tracked and reported quarterly via the Sustainability & Environment Project Board.
Water (supply & treatment)
Water engagement with water use is promoted via www.ualcarbondashboard.com. When taps and bathroom furniture is replaced is it done so according to the SKA criteria

21
Waste
A new waste and recycling contract was tendered in 2013 with the expressed aim to achieve a recycling target of 80%. A zero-waste-to-landfill requirement was included to the contract. Construction waste will be managed by a site wide waste management plan, as per the ‘UAL Design Brief for Sustainability’.
New internal recycling and general waste bins to be distributed, branded with the meetthetide.com logo Compactors to be located at the two largest University sites Food waste bins to be located at every kitchen. Food waste sent to Grundons anaerobic digester. Hazardous waste boxes to distributed to every building
4.3 Near term projects (up to 2020)
ISO50001 will continue to ‘anchor in’ existing savings in utility consumption. The comprehensive nature of the system will mean that 500 tonnes of carbon savings is achievable each year. Monitoring and targeting is largely a revenue expense and therefore an extremely cost-effective tool to capture carbon savings. This role is responsibility of the Head of Sustainability but it is key that information is shared across the organisation. Building Managers, FM providers and catering providers will use and react to the energy consumption they are provided with. The introduction of the Mechanical, Electrical and Plumbing Building Particulars is forecast to reduce carbon emissions by 2,500 tonnes by 2020. A behavioural change programme, included as part of the Sustainability Manifesto will deliver 1,000 tonnes of carbon savings each year. The data centre migration project is expected to contribute an annual saving 200 tonnes of carbon per year. The disposal of building assets is expected to contribute 120 tonnes of carbon emissions. It should be noted that there is a further 274 tonnes of carbon that have been forecast to arise over the timeframe of version 6 of the CMP. This is the difference between the target and the projected increase in emissions (please refer to value-at-stake graphs). However, this variance is extremely difficult to predict and dependent on external factors. Although this approach is permissible by the Carbon Trust the amount of variance will be closely monitored in the annual review.
4.4 Medium to long term projects
The role of a consolidation centre will reduce the number of deliveries by road to our various buildings. Consolidated deliveries also reduce the amount of packaging that enters our premises

22
and will restrict of the volumes of waste that need to be disposed of. By implementing a managed procurement service alongside the use of consolidation centre, it is expected the amount of products purchased will reduce as there will be no need to over-order teaching materials and consumables (particularly paper), construction materials the waste associated with them. It has been estimated that is water consumption remains consistent, scope 3 emissions could be reduced by between 25,000 – 30,000 tonnes of carbon. In addition to the fact carbon emissions associated with construction will be deferred until 2022 (the relocation of the London College of Fashion and the London College of Communications, accounting for over two thirds of our estates) will mean the threat of increases to our carbon footprint is reduced. In-line with the Greater London Authorities push to promote safer cycling, we expect more students and staff to cycle to work, a trend that has been consistent for the past three years. By 2020, a further 5,000 – 5,500 tonnes of carbon could be saved by from the UAL carbon footprint.

5. Carbon Management Financing
5.1 Assumptions and the future funding of Higher Education
This Carbon Management Plan has been drafted against a background of uncertainty regarding the future funding of Higher Education. The total implementation costs are estimated to be £454,000.
5.2 Benefits / savings – quantified and unquantified
The 25.9% reduction in Scope 1 & 2 emissions are genuine reductions. The total number of buildings and floor space is broadly the same, the carbon intensity of scope 1, 2 and 3 emissions has not altered significantly and the university is broadly occupied as it was in 2012. 5.3 What has version 5 of the CMP achieved? After the CMP was first launched the University witnessed a spike in absolute carbon emissions from utility consumption in 2013. Firstly, the heating season witnessed temperatures that were below average for much longer. This resulted in above average gas consumption across the estate. This was compounded further by the fact the University’s administrative hub, High Holborn, is electrical heated. Also, there significant increases in consumption at Central Saint Martin’s College where the Building Management System were not commissioned properly resulting in the Heating Ventilation and Cooling equipment running 24 hours per day. Central Saint Martin’s consumes nearly half of all the electricity across the University. These issues have been corrected and reduction has been reduced by the following activities
- Better monitoring and targeting of utility consumption and cost - The introduction of a Heating & Cooling Policy - New burners installed at Millbank and the London College of
Communications, the two largest consumers of gas - New LED lighting installed at Millbank
These works were funded by the Energy Performance Contract and contributed an annual carbon reduction of 235 tonnes.

24
a. Actions to Embed Carbon Management into the University
6.1 Policy – embedding CO2 savings across your organisation
As part of the revision of the CMP process in late 2012, UAL considered how it previously performed against six environmental key performance indicators. The results are shown in Appendix A. What was clear is that the University had the ability and scope to increase its performance and therefore its environmental credentials. As part of the annual review of the CMP, it is necessary to re-run this exercise. The Sustainability Advisory Panel considers that within five years Level 5 in all areas should be achievable, championed by individuals of the Panel. A target has been set for 2020, also shown in Appendix A. The business case for improving overall performance will rest on the financial position of the University.
6.2 Responsibility – making it clear that saving CO2 is everyone’s job
The Sustainability Working group continues to meet every month to consider progress of the CMP, alongside process against the People & Planet Green League. The Sustainability Working Group monitors progress and reports to the Sustainability Advisory Panel. The Group ensures that progress is communicated effectively via the Board’s Communication Plan (available in the ‘About Us’ section of the University website). The membership of the Advisory Panel is as follows; Chair – Stephen Reid (UAL, CEO) Project Manager, Estates & Operations Steve Howe (Director of Estates) Project Manager, Learning, Teaching & Research Dilys Williams (Research Director, Centre for Sustainable Fashion, London College of Fashion) Project Managers, Business Engagement & Procurement Ian Lane (Head of Sustainability) Project Manager, Leadership Shared by all Project Managers Project Manager, Engagement Ana Oppenheim (SU Campaigns Officer) The Board is supported by Martin James (Director of Finance) and Edward Venning (Director of Communications)
6.3 Data Management – measuring the difference, measuring the benefit

25
The collection and analysis of the relevant energy, waste, water procurement and transport data will be coordinated by the Head of Sustainability, supported by the Energy & Environment Data Officer. Most of the recycling, waste, food waste data will rely on the University’s out-sourced waste contractor, catering and Facilities Management (FM) provider. Core to the management of the FM contract is the monitoring of Key Performance Indicators (KPI’s) which include the monitoring of energy and waste/recycling data.
6.4 Communication and Training – ensuring everyone is ready, willing and able
All energy consumption and carbon emissions resulting from the University’s estate are driven by the needs and actions of its people. Too often, however, such needs and actions remain completely unchallenged. As a result, there exists a huge potential for energy saving, if one can find techniques to engage and motivate large numbers of consumers on campus to challenge their habits and attitudes. Large-scale behaviour change does however require a very different skill-set to those traditionally found in facilities management circles. If one is to engage hundreds or thousands of people to make a real difference, it takes a concerted and imaginative scheme to succeed. Additional ideas to engage staff also include:
Sustainability Co-ordinators based at each of the Colleges. The role will be to coordinate efforts towards reducing energy consumption; increased recycling rates, improved awareness raising and standing in the People & Planet Green League;
Access to the Carbon Dashboard via the website www.ualcarbondashbaord.com. The Carbon Dashboard captures utility consumption and recycling data and presents the information in a user-friendly format. Each College will be encouraged to review consumption for their specific building(s) and used to challenge the Estates department, building users and relevant stakeholders when spikes in consumption occur. The information is also shared on College reception screens.
Follow the best practise models for coordinated communications as outlined in the People & People Green League;
Produce an up-to-date Communications Plan
Each College to be responsible for their individual Environmental Management System that contributes to a University-owned EMS. The University should have implemented the LiFE Environmental Management System to a ‘good’ standard by the end of 2014 and ISO140001. This should be devolved to each College thereafter to allow them to interpret what sustainability means to them, whilst adhering to minimum standard of performance across the organisation;
The Head of Sustainability meet separately with the Colleges to support and assist efforts to reduce carbon consumption. The Student Union should also be addressed and engaged on a regular basis.
6.5 Procurement – engaging suppliers The area where the University can lead by example in procurement terms is how it procures energy and efficiency equipment. At this time, value for money is driving most procurement decisions. However providing lifecycle analysis to accompany procurement decisions is an example of how added value can be extracted from any procurement process. Capturing
26
revenue savings generated from installing energy efficient equipment or diverting waste from landfill, for example, allows informed investment decisions to be reached. This should be underpinned by effective Sustainable Procurement Strategy and Environmental Management System. With regard specifically to energy, the University procures its energy supplies from a Public Sector Buying Organisation (PBO) called the Energy Consortium. Traditionally the University has procured fixed-term contracts for one or two years. The University is committed to exploring the use of flexible contracting as a mechanism for capturing savings that may occur in the wholesale energy market. The governance structure of such contracts can be arranged so that pre-agreed ‘lock-in’ rules are observed allowing the organisation to forecast revenue budgets and ensure enough funding is available. The University is also implementing the Charted Institute of Procurement Specialists Sustainability Index (https://cips-sustainabilityindex.com/). By the end of September 2014 the University will have appraised suppliers with whom the University spends £86M with each year. How each supplier scores in terms of economic, social and environmental sustainability will influence the minimum ‘mark out of hundred’ the University insists on in all future tenders or procurement frameworks.
6.6 Monitoring & Targeting – keeping track of progress
The Monitoring & Targeting procedures outlined earlier in this report will be the central source of consumption information. This will be complimented by the University’s finance system, Agresso. The monitoring, targeting and reporting of utility expenditure was audited by an independent third-party in June 2014. The management procedures in place were adjusted to be ‘substantial’ and no risks identified in how the service overall is being managed. These actions, combined with the UAL Carbon Dashboard has identified a £113k unclaimed rebate for gas costs from the disposal of 4 Red Lion Square, a £31k saving by applying the correct VAT values to UAL utility bills and £106k saving from reduced electricity consumption from buildings across the estate, including a reduction in Kings Cross costs for heat totalling £32k. Further savings of VAT are expected to be achieved through identifying previously incorrect VAT rates. In addition, the flexible energy contract continues to allow the University to take advantage of reductions in the wholesale energy market as and when they occur, rather than being tied-in to long-term fixed prices.

27
7 Programme Management of the CM Programme
7.1 The Programme Board –strategic ownership and oversight
The CMP is overseen by the Sustainability Advisory Panel (structure explained in Section 6). There is senior level representation from across the administrative and academic communities within the University. The Sustainability Committee reports through the University's Senior Management Teams. The Sustainability Advisory Panel responsibility is to ensure not only that there is top-level organisational support for the CMP, but that the aspirations of the carbon management team are realistic - i.e. that they are ambitious but not unrealistically so. In essence the Programme Board will be responsible for:
1. Championing and providing leadership on carbon management; 2. Setting and reviewing strategic direction and targets; 3. Setting the scope of the carbon management programme; 4. Approving carbon reduction projects; 5. Recommending budgetary spend required to achieve future savings projected
in the Plan; 6. Defining the terms of reference; 7. Monitoring progress in implementing the Plan; 8. Resolving any issues escalated to them by the Team; 9. Publicise the University's performance against the targets;
The Head of Sustainability has day to day contact with members of the Sustainability Committee and acts as the conduit between the Committee and the wider University. 7.2 Delivering projects The Sustainability Working Group is led by Ian Lane (Head of Sustainability). The Director of Estates, Steve Howe, is responsible for Capital Projects including the electrical and mechanical system located within all buildings across the University portfolio of assets. There are representatives of the Colleges, academic and student-facing communities in attendance. The Board will continue to meet every three months. Its primary role thus far has been to develop the Carbon Management Plan, with input into the project list. In addition to the formal meetings there is regular liaison between the Board and the wider University – an invaluable means of ensuring the smooth passage of the plans from inception to approval.

28
7.3 Continuity planning for key roles
The Advisory Panel will continue to meet and the CMP has been updated to reflect new structure and our response to Scope 3 emissions, as the Vice-Chancellor notes in his foreword, carbon reduction needs to become part of the culture, and the best way to achieve this is through a network of carbon ‘champions’ across the organisation. This process will be led through the Board. The University's Strategic Development Deputy Vice-Chancellor sits on the Executive Board and will ensure that carbon management remains a live issue at that level. The University's Strategic Development Deputy Vice-Chancellor will also be able to influence budget allocation decisions in future years. Table 7.2 outlines what will happen in the event key personnel leave the organisation or are reassigned. This will be reviewed annually along side progress against the agreed targets.
Role
Name Successor
Chair UAL CEO
University's Strategic Development Deputy Vice-Chancellor
Project co-Sponsor Head of College Office, CSM Elected member of Sustainability Advisory Panel
Committee Support Head of Sustainability Director of Estates
Finance Sponsor
Director of Finance Deputy Director of Finance
7.4 Ongoing stakeholder management
In addition to the day to day work of the Sustainability Working Group in their own areas, the internet, the intranet, UAL ‘meetthetide.com blog, the UAL Carbon Dashboard and all-staff briefings will continue to be used to keep everyone informed of progress towards the reduction target, and to publicise individual success stories led by the Colleges. In addition, sustainability within the University has a brand called meetthetide.com. This engagement tool is tailored to our students and staff, all of which come from the creative arts. meetthetide.com is a monthly design competition which students are encouraged to submit ideas via a web-portal. The works is appraised by an industry judging panel. However, meetthetide.com is far more than a neat competition. The logo (shown as the covering image on the CMP) is the brand for sustainability – it’s shown on reception screens, recycling bins and email banners.
Individual or Group
Infl
ue
nce
Imp
act
Their interest or issues Means of Communication
Table 7.2 Succession planning

29
Stephen Reid
H H Cost / budgets
Normal financial reporting procedures Executive Board Sustainability Committee meetthetide.com
Steve Howe
H H Cost / budgets Ensuring buildings are run effectively and efficiently Carbon Reduction Commitment HEFCE returns
Intranet Senior Management Team Business Change Programme Sustainability Committee CMT Representation at external events meetthetide.com
Dilys Williams H H Cost / budgets University reputation Ensuring buildings are run effectively and efficiently Carbon Reduction Commitment Achieving the aims of the Business Change Programme
Internet Senior Management Team Sustainability Committee Green League College Sustainability Group College show/events meetthetide.com
Antony Johnston
H H Curriculum Excellent reputation of the University is maintained
Sustainability Committee Green League Environmental Management System meetthetide.com
SU President H H Excellent reputation of the University is maintained
Sustainability Committee Green League Green Week Environmental Management System meetthetide.com
Influence: the level of influence on the successful outcome of the Programme - High (H), Medium (M) or Low (L) Impact: the level of impact that the Project will have on the person or group - High (H), Medium (M) or Low (L)
7.5 Annual progress to the Executive Board
Progress, supported by statistics, will be reported to the Executive Board once a year. Documenting the cost and all benefits from the Programme will include details such as;
Financial savings;
CO2 savings against the agreed target;
Intangible benefits, including as influencing the student body and staff.
The Senior Management Team holds quarterly meetings. This CMP will be presented to the Board in March 2013 with an accompanying presentation. It is expected that the Project Leader will provide the annual progress report in March 2014.
Table 7.3 Communications and key individuals

APPENDIX A
Embedding Matrix
APPENDIX B
Example of mechanical and electrical improvements proposed one building within the UAL portfolio.
APPENDIX B i
Mechanical and electrical improvements for 17/18
APPENDIX C
UAL Sustainability Manifesto

31
Appendix A: Carbon Management Matrix – Embedding
Review the status of the University in June 2016 Target attainment for 2020

32
APPENDIX B - Projects implemented between 2013-2016 APPENDIX B i - Mechanical and electrical improvements for 17/18
Selected
Opp Ref
Area Technology
category
Technology % applicable % opportunity Opportunity summary Status Emissions
source 1
Amount
saved
emissions
source 1
(kWh)
Emissions
source 2
Totals row
1 LIME GROVE Air conditioning Free cooling 50% 50%
Free cooling could apply to
25% of our LIME GROVE Estimated Cost Natural gas - Electricity (grid)
2 LIME GROVE BMS fine tuning BMS fine tuning 50% 50%
BMS fine tuning could apply
to 25% of our LIME GROVE Estimated Cost Natural gas 9,498 Electricity (grid)
3 LIME GROVE Building fabric Draught proofing 100% 50%
Draught proofing could
apply to 50% of our LIME
GROVE Estimated Cost Natural gas 64,583 Electricity (grid)
4 LIME GROVE Building fabric Loft insulation 100% 50%
Loft insulation could apply
to 50% of our LIME GROVE Estimated Cost Natural gas 32,292 Electricity (grid)
5 LIME GROVE Building fabric
Secondary
glazing 100% 50%
Secondary glazing could
apply to 50% of our LIME
GROVE Estimated Cost Natural gas 64,583 Electricity (grid)
6 LIME GROVE Heating - controls
Heating control
systems 100% 50%
Heating control systems
could apply to 50% of our
LIME GROVE Estimated Cost Natural gas 96,875 Electricity (grid)
7 LIME GROVE Heating - controls
Optimum start
controls 100% 50%
Optimum start controls
could apply to 50% of our
LIME GROVE Estimated Cost Natural gas 64,583 Electricity (grid)
8 LIME GROVE Heating - controls Sequencing 100% 50%
Sequencing could apply to
50% of our LIME GROVE Estimated Cost Natural gas 45,208 Electricity (grid)
9 LIME GROVE Heating - controls Zoning 100% 50%
Zoning could apply to 50%
of our LIME GROVE Estimated Cost Natural gas 32,292 Electricity (grid)
10 LIME GROVE
Heating - pipework
insulation
Pipework
insulation 100% 50%
Pipework insulation could
apply to 50% of our LIME
GROVE Estimated Cost Natural gas 26,593 Electricity (grid)
12 LIME GROVE
Heating -
replacement boilers
Upgrade to
condensing
boilers 100% 50%
Upgrade to condensing
boilers could apply to 50%
of our LIME GROVE Estimated Cost Natural gas 151,960 Electricity (grid)
13 LIME GROVE ICT
IT Management
software 50% 50%
IT Management software
could apply to 25% of our
LIME GROVE Estimated Cost Natural gas - Electricity (grid)
14 LIME GROVE ICT LCD flat screens 25% 50%
LCD flat screens could
apply to 12.5% of our LIME
GROVE Estimated Cost Natural gas - Electricity (grid)
15 LIME GROVE ICT
Printer
rationalisation 25% 50%
Printer rationalisation could
apply to 12.5% of our LIME
GROVE Estimated Cost Natural gas - Electricity (grid)
16 LIME GROVE ICT
Virtualisation/thi
n computers 100% 50%
Virtualisation/thin
computers could apply to
50% of our LIME GROVE Estimated Cost Natural gas - Electricity (grid)
17 LIME GROVE Lighting - controls
Automatic
lighting controls 100% 50%
Automatic lighting controls
could apply to 50% of our
LIME GROVE Estimated Cost Natural gas - Electricity (grid)
18 LIME GROVE Lighting - controls
Localised
lighting 25% 25%
Localised lighting could
apply to 6.25% of our LIME
GROVE Estimated Cost Natural gas - Electricity (grid)
19 LIME GROVE
Lighting -
replacement fittings
Retrofit/replace
lighting to T5 100% 50%
Retrofit/replace lighting to
T5 could apply to 50% of
our LIME GROVE Estimated Cost Natural gas - Electricity (grid)
20 LIME GROVE Misc
Awareness
raising campaign 100% 50%
Awareness raising
campaign could apply to
50% of our LIME GROVE Estimated Cost Natural gas 37,990 Electricity (grid)
21 LIME GROVE Misc
Equipment timer
controls 50% 50%
Equipment timer controls
could apply to 25% of our
LIME GROVE Estimated Cost Natural gas - Electricity (grid)
22 LIME GROVE Misc
Voltage
optimisation 50% 50%
Voltage optimisation could
apply to 25% of our LIME
GROVE Estimated Cost Natural gas - Electricity (grid)
23 LIME GROVE
Ventilation -
Variable speed
drives
Variable speed
drives 50% 50%
Variable speed drives could
apply to 25% of our LIME
GROVE Estimated Cost 0 - 0
24 LIME GROVE Steam Plant
Boiler TDS
blowdown
controls & boiler 50% 50%
Boiler TDS blowdown
controls & boiler RO plant
could apply to 25% of our Estimated Cost 0 3,799 0
25 LIME GROVE Steam Plant
Install boiler
economizers 100% 50%
Install boiler economizers
could apply to 50% of our
LIME GROVE Estimated Cost Natural gas 45,208 Electricity (grid)
26 LIME GROVE Misc M&T 100% 50%
M&T could apply to 50% of
our LIME GROVE Estimated Cost 0 760 0
27 LIME GROVE Misc
Heating &
cooling policy 100% 50%
Heating & cooling policy
could apply to 50% of our
LIME GROVE Estimated Cost 0 760 0

33
Appendix C – UAL Sustainability Manifesto (2016 – 2020)

34