university of san diego · joan b. kroc school of peace studies. financial statement presentation...
TRANSCRIPT

REPORT OF INDEPENDENT AUDITORS AND FINANCIAL STATEMENTS
FOR
UNIVERSITY OF SAN DIEGO
June 30, 2017 and 2016
Table of Contents PAGE Report of Independent Auditors 1–2 Financial Statements Statements of Financial Position 3 Statement of Activities – 2017 4 Statement of Activities – 2016 5 Statements of Cash Flows 6 Notes to Financial Statements 7–33

1
Report of Independent Auditors To the Board of Trustees University of San Diego Report on Financial Statements
We have audited the accompanying financial statements of the University of San Diego, which comprise the statements of financial position as of June 30, 2017 and 2016, the related statements of activities and cash flows for the years then ended, and the related notes to the financial statements. Management’s Responsibility for the Financial Statements
Management is responsible for the preparation and fair presentation of these financial statements in accordance with accounting principles generally accepted in the United States of America; this includes the design, implementation, and maintenance of internal control relevant to the preparation and fair presentation of financial statements that are free from material misstatement, whether due to fraud or error. Auditor’s Responsibility
Our responsibility is to express an opinion on these financial statements based on our audits. We conducted our audits in accordance with auditing standards generally accepted in the United States of America. Those standards require that we plan and perform the audits to obtain reasonable assurance about whether the financial statements are free from material misstatement. An audit involves performing procedures to obtain audit evidence about the amounts and disclosures in the financial statements. The procedures selected depend on the auditor’s judgment, including the assessment of the risks of material misstatement of the financial statements, whether due to fraud or error. In making those risk assessments, the auditor considers internal control relevant to the entity’s preparation and fair presentation of the financial statements in order to design audit procedures that are appropriate in the circumstances, but not for the purpose of expressing an opinion on the effectiveness of the entity’s internal control. Accordingly, we express no such opinion. An audit also includes evaluating the appropriateness of accounting policies used and the reasonableness of significant accounting estimates made by management, as well as evaluating the overall presentation of the financial statements. We believe that the audit evidence we have obtained is sufficient and appropriate to provide a basis for our audit opinion.

2
Opinion
In our opinion, the financial statements referred to above present fairly, in all material respects, the financial position of the University of San Diego as of June 30, 2017 and 2016, and the changes in its net assets and cash flows for the years then ended in accordance with accounting principles generally accepted in the United States of America.
San Diego, California October 18, 2017
See accompanying notes. 3
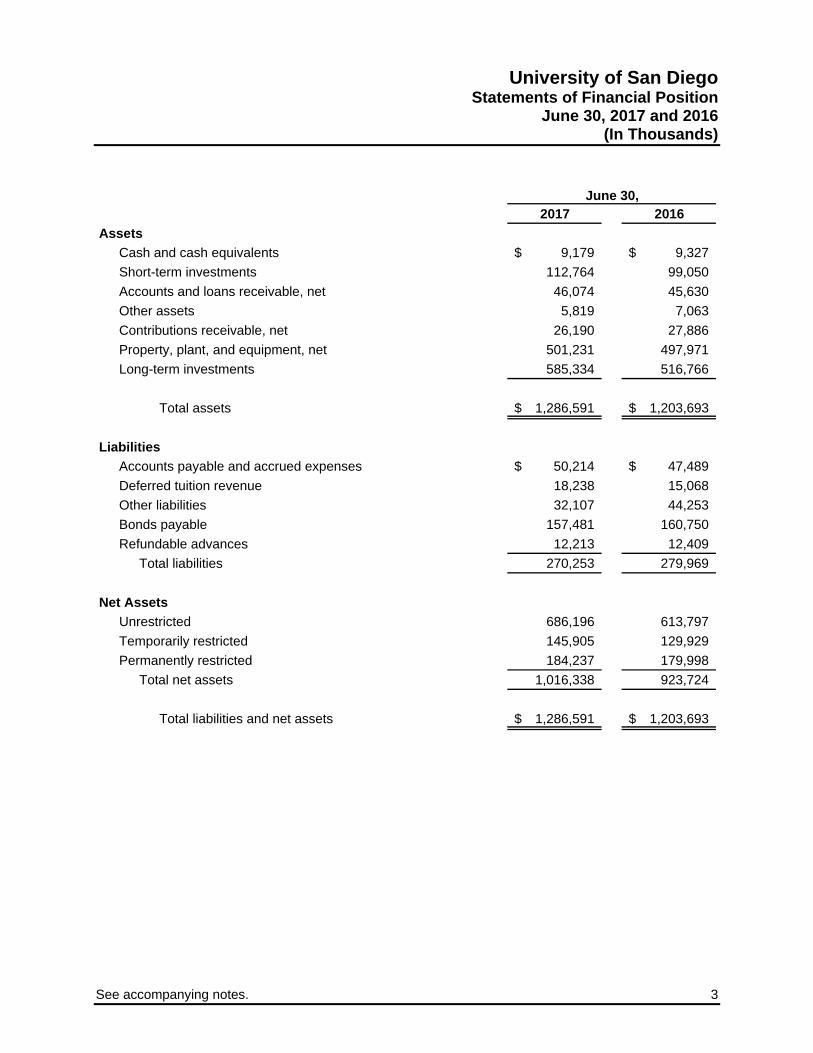
University of San Diego Statements of Financial Position
June 30, 2017 and 2016 (In Thousands)
2017 2016
Assets
Cash and cash equivalents 9,179$ 9,327$
Short-term investments 112,764 99,050
Accounts and loans receivable, net 46,074 45,630
Other assets 5,819 7,063
Contributions receivable, net 26,190 27,886
Property, plant, and equipment, net 501,231 497,971
Long-term investments 585,334 516,766
Total assets 1,286,591$ 1,203,693$
Liabilities
Accounts payable and accrued expenses 50,214$ 47,489$
Deferred tuition revenue 18,238 15,068
Other liabilities 32,107 44,253
Bonds payable 157,481 160,750
Refundable advances 12,213 12,409
Total liabilities 270,253 279,969
Net Assets
Unrestricted 686,196 613,797
Temporarily restricted 145,905 129,929
Permanently restricted 184,237 179,998
Total net assets 1,016,338 923,724
Total liabilities and net assets 1,286,591$ 1,203,693$
June 30,
4 See accompanying notes.
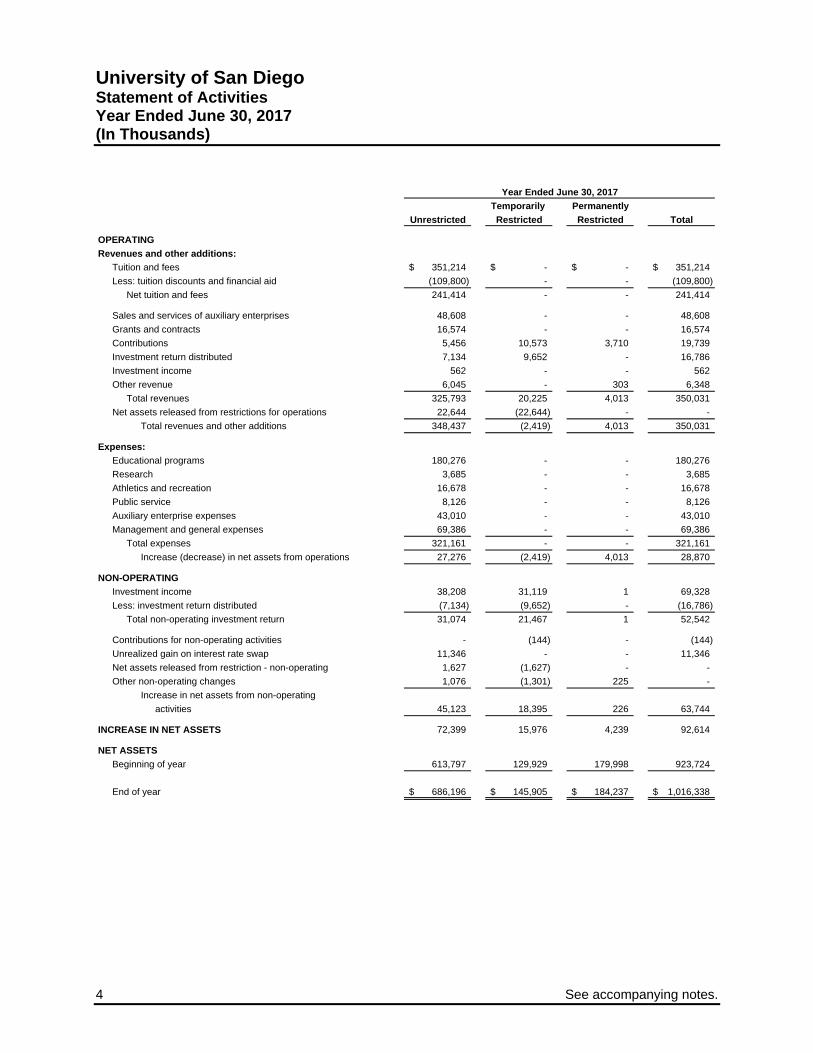
University of San Diego Statement of Activities Year Ended June 30, 2017 (In Thousands)
Temporarily Permanently
Unrestricted Restricted Restricted Total
OPERATING
Revenues and other additions:
Tuition and fees 351,214$ -$ -$ 351,214$
Less: tuition discounts and financial aid (109,800) - - (109,800)
Net tuition and fees 241,414 - - 241,414
Sales and services of auxiliary enterprises 48,608 - - 48,608
Grants and contracts 16,574 - - 16,574
Contributions 5,456 10,573 3,710 19,739
Investment return distributed 7,134 9,652 - 16,786
Investment income 562 - - 562
Other revenue 6,045 - 303 6,348
Total revenues 325,793 20,225 4,013 350,031
Net assets released from restrictions for operations 22,644 (22,644) - -
Total revenues and other additions 348,437 (2,419) 4,013 350,031
Expenses:
Educational programs 180,276 - - 180,276
Research 3,685 - - 3,685
Athletics and recreation 16,678 - - 16,678
Public service 8,126 - - 8,126
Auxiliary enterprise expenses 43,010 - - 43,010
Management and general expenses 69,386 - - 69,386
Total expenses 321,161 - - 321,161
Increase (decrease) in net assets from operations 27,276 (2,419) 4,013 28,870
NON-OPERATING
Investment income 38,208 31,119 1 69,328
Less: investment return distributed (7,134) (9,652) - (16,786)
Total non-operating investment return 31,074 21,467 1 52,542
Contributions for non-operating activities - (144) - (144)
Unrealized gain on interest rate swap 11,346 - - 11,346
Net assets released from restriction - non-operating 1,627 (1,627) - -
Other non-operating changes 1,076 (1,301) 225 -
Increase in net assets from non-operating
activities 45,123 18,395 226 63,744
INCREASE IN NET ASSETS 72,399 15,976 4,239 92,614
NET ASSETS
Beginning of year 613,797 129,929 179,998 923,724
End of year 686,196$ 145,905$ 184,237$ 1,016,338$
Year Ended June 30, 2017

See accompanying notes. 5
University of San Diego Statement of Activities
Year Ended June 30, 2016 (In Thousands)
Temporarily Permanently
Unrestricted Restricted Restricted Total
OPERATING
Revenues and other additions:
Tuition and fees 335,268$ -$ -$ 335,268$
Less: tuition discounts and financial aid (103,949) - - (103,949)
Net tuition and fees 231,319 - - 231,319
Sales and services of auxiliary enterprises 47,612 - - 47,612
Grants and contracts 16,716 - - 16,716
Contributions 4,632 18,584 3,543 26,759
Investment return distributed 6,188 8,979 - 15,167
Investment income 914 - - 914
Other revenue 5,023 - 290 5,313
Total revenues 312,404 27,563 3,833 343,800
Net assets released from restrictions for operations 19,080 (19,080) - -
Total revenues and other additions 331,484 8,483 3,833 343,800
Expenses:
Educational programs 171,373 - - 171,373
Research 4,387 - - 4,387
Athletics and recreation 16,085 - - 16,085
Public service 8,083 - - 8,083
Auxiliary enterprise expenses 42,959 - - 42,959
Management and general expenses 67,811 - - 67,811
Total expenses 310,698 - - 310,698
Increase in net assets from operations 20,786 8,483 3,833 33,102
NON-OPERATING
Investment income (10,619) (9,133) 25 (19,727)
Less: investment return distributed (6,188) (8,979) - (15,167)
Total non-operating investment return (16,807) (18,112) 25 (34,894)
Contributions for non-operating activities - 4,348 - 4,348
Unrealized loss on interest rate swap (13,684) - - (13,684)
Net assets released from restriction - non-operating 7,841 (7,841) - -
Other non-operating changes 491 (1,189) 257 (441)
(Decrease) increase in net assets from
non-operating activities (22,159) (22,794) 282 (44,671)
(DECREASE) INCREASE IN NET ASSETS (1,373) (14,311) 4,115 (11,569)
NET ASSETS
Beginning of year 615,170 144,240 175,883 935,293
End of year 613,797$ 129,929$ 179,998$ 923,724$
Year Ended June 30, 2016

6 See accompanying notes.
University of San Diego Statements of Cash Flows Years Ended June 30, 2017 And 2016 (In Thousands)
2017 2016OPERATING ACTIVITIES
Changes in net assets 92,614$ (11,569)$ Adjustments to reconcile changes in net assets to net cash provided by operating activities:
Depreciation and net amortization 16,979 16,968 Net amortization of bond premiums/discount and debt issuance cost (139) (139) Net provision for losses on receivables (15) 752 Net realized and unrealized (gain) loss on long-term investments (63,233) 24,008 Net unrealized (gain) loss on interest rate swap (11,346) 13,684 Loss on debt refunding - 441 Contributions restricted for long-term investments (4,111) (3,087) Contributions restricted for investment in property, plant, and equipment 144 (4,348) Proceeds from sale of donated securities 378 571 Changes in operating assets and liabilities:
Accounts and loans receivable (1,102) (1,384) Other assets 1,244 (753) Contributions receivable 1,696 2,510 Accounts payable and accrued expenses 1,744 (3,338) Deferred tuition revenue 3,170 1,079 Other liabilities (800) (1,079)
Net cash provided by operating activities 37,223 34,407
INVESTING ACTIVITIESProceeds from maturities/sales of investments 305,454 267,116 Purchases of investments (325,609) (290,011) Purchase of property, plant, and equipment (19,258) (23,031)
Net cash used in investing activities (39,413) (45,926)
FINANCING ACTIVITIESPrincipal payments on bonds payable (3,129) (3,159) Debt issuance costs - (288) Advances for government loan funds (196) (133) Net disbursements of student loans 673 311 Contributions restricted for long-term investments 4,111 3,087 Contributions restricted for investment in property, plant, and equipment (144) 4,348 Proceeds from sale of securities restricted for long-term investment or assets 727 3,829
Net cash provided by financing activities 2,042 7,904
DECREASE IN CASH AND CASH EQUIVALENTS (148) (3,615)
CASH AND CASH EQUIVALENTSBeginning of year 9,327 12,942
End of year 9,179$ 9,327$
Cash paid for interest 7,449$ 7,689$
Proceeds from bond issuance -$ 91,750$
Payments on bond refunding -$ (91,750)$
Years Ended June 30,
SUPPLEMENTAL DISCLOSURE OF CASH FLOW INFORMATION
SUPPLEMENTAL DISCLOSURES OF NON-CASH FINANCING ACTIVITIES

University of San Diego Notes to Financial Statements
7
Note 1 – Nature of Operation and Significant Accounting Policies The University of San Diego (the “University”) is an independent Catholic university chartered in 1949 under the nonprofit public benefit corporation law and is governed by its Board of Trustees (the “Board”). In 1972, the San Diego College for Women merged with the University of San Diego College for Men forming the University. The University includes a College of Arts and Sciences and six professional schools: the School of Business Administration; the Shiley-Marcos School of Engineering; the School of Leadership and Education Sciences; the School of Law; the Philip Y. Hahn School of Nursing and Health Science; and the Joan B. Kroc School of Peace Studies. Financial statement presentation – The University classifies its net assets as unrestricted, temporarily restricted, and permanently restricted based upon the following criteria: Unrestricted net assets represent expendable funds available for operations that are not otherwise
limited by donor restrictions. Temporarily restricted net assets consist of contributed funds subject to specific donor-imposed
restrictions, which are contingent upon a specific performance of a future event or a specific passage of time before the University may spend the funds.
Permanently restricted net assets are subject to irrevocable donor restrictions requiring that the assets
be maintained in perpetuity, primarily for generating investment income to fund current operations. Revenue recognition Tuition and fees – Student tuition and fees are recorded as revenue in the year during which the related
academic services are rendered. Student tuition and fees received in advance of services to be rendered are recorded as deferred tuition revenue.
Contributions – Contributions of cash, unconditional pledges, and other assets are recorded as revenue
in the period received and are classified as permanently restricted, temporarily restricted, or unrestricted based on donor stipulations. Contributions whose restrictions are met in the same period they are received are recorded as revenue in temporarily restricted net assets and as net assets released from restrictions. Unconditional pledges with terms greater than one year are initially recorded at fair value based on their estimated future cash flows. Conditional promises to give are not recognized until they become unconditional, that is, when the conditions on which they depend are substantially met. Gifts of assets other than cash are recorded at their estimated fair value.
Grants and contracts – Revenues from grants and contracts are reported as increases in unrestricted
net assets as allowable expenditures under such agreements are incurred.
University of San Diego Notes to Financial Statements
8
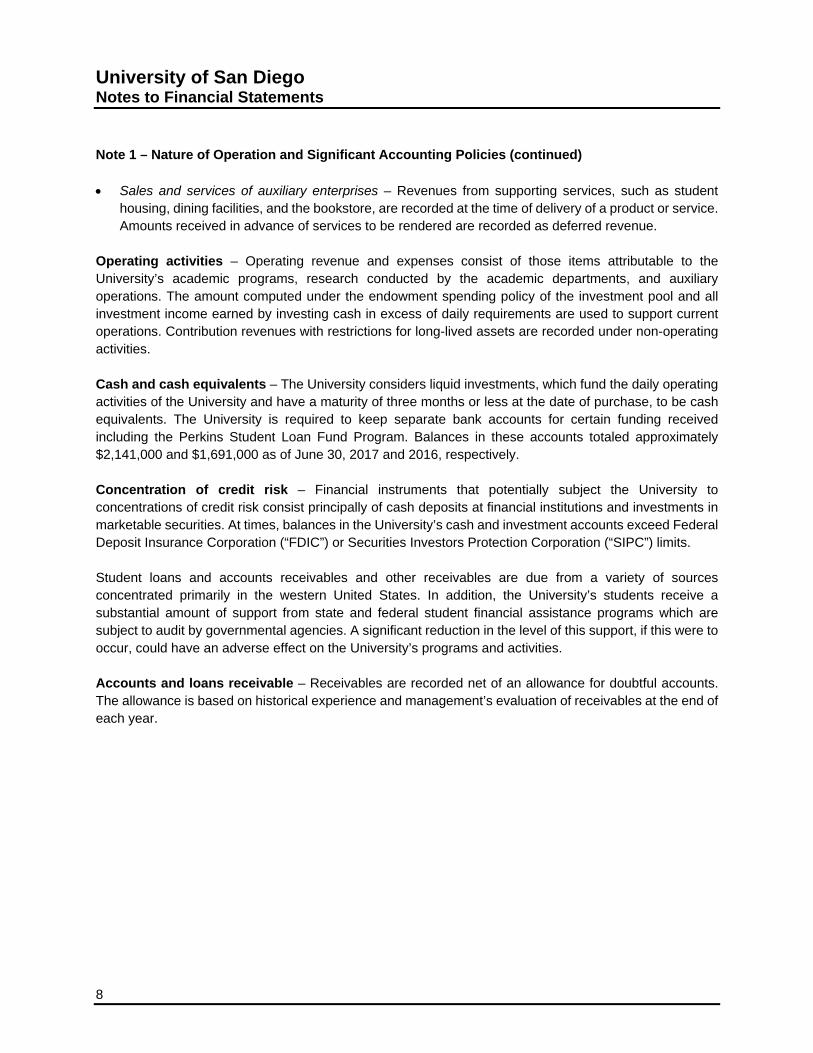
Note 1 – Nature of Operation and Significant Accounting Policies (continued) Sales and services of auxiliary enterprises – Revenues from supporting services, such as student
housing, dining facilities, and the bookstore, are recorded at the time of delivery of a product or service. Amounts received in advance of services to be rendered are recorded as deferred revenue.
Operating activities – Operating revenue and expenses consist of those items attributable to the University’s academic programs, research conducted by the academic departments, and auxiliary operations. The amount computed under the endowment spending policy of the investment pool and all investment income earned by investing cash in excess of daily requirements are used to support current operations. Contribution revenues with restrictions for long-lived assets are recorded under non-operating activities. Cash and cash equivalents – The University considers liquid investments, which fund the daily operating activities of the University and have a maturity of three months or less at the date of purchase, to be cash equivalents. The University is required to keep separate bank accounts for certain funding received including the Perkins Student Loan Fund Program. Balances in these accounts totaled approximately $2,141,000 and $1,691,000 as of June 30, 2017 and 2016, respectively. Concentration of credit risk – Financial instruments that potentially subject the University to concentrations of credit risk consist principally of cash deposits at financial institutions and investments in marketable securities. At times, balances in the University’s cash and investment accounts exceed Federal Deposit Insurance Corporation (“FDIC”) or Securities Investors Protection Corporation (“SIPC”) limits. Student loans and accounts receivables and other receivables are due from a variety of sources concentrated primarily in the western United States. In addition, the University’s students receive a substantial amount of support from state and federal student financial assistance programs which are subject to audit by governmental agencies. A significant reduction in the level of this support, if this were to occur, could have an adverse effect on the University’s programs and activities. Accounts and loans receivable – Receivables are recorded net of an allowance for doubtful accounts. The allowance is based on historical experience and management’s evaluation of receivables at the end of each year.

University of San Diego Notes to Financial Statements
9
Note 1 – Nature of Operation and Significant Accounting Policies (continued) Interest rate swap – In conjunction with the University’s November 2005 issuance of variable-rate demand revenue bonds, refunded in July 2015 with the issuance of the 2015 variable rate revenue bonds, the University entered into an interest-rate swap agreement with a financial institution counterparty. The purpose of this agreement is to swap the variable rate on underlying debt for a fixed rate of 3.513 percent for a period of 40 years. The University entered into the agreement to manage the risk associated with the cash flows attributable to interest payments on the debt and does not use this instrument for speculative purposes. The instrument’s fair value and changes therein are reported in the University’s unrestricted net assets. The value of the swap instrument represents the estimated receivable of or payable by the University to cancel the agreement at the reporting date, which is based on option pricing models that consider risks and market factors. The unrealized gain (loss) for the change in the swap agreement’s fair value was approximately $11,346,000 and ($13,684,000) for the years ended June 30, 2017 and 2016, respectively. The value of the swap instrument is a payable of approximately $27,131,000 and $38,477,000 recorded in other liabilities at June 30, 2017 and 2016, respectively. Refundable advances – The University serves as an agent for the federal government in administering the Perkins Student Loan Fund Program and the Nursing Faculty Loan Program. Amounts received in conjunction with these programs are recorded as refundable advances in the statements of financial position. Disbursements made to students in accordance with the federal program requirements are recorded as student loans receivable. Included in accounts and loans receivable at June 30, 2017 and 2016 are student loans receivable of approximately $14,694,000 and $15,156,000, respectively, related to these programs. Functional expense classifications – Expenses, including certain allocated expenses, are reported in major categories: educational programs, research, athletics and recreation, public service, auxiliary enterprise expenses, and management and general expenses. Auxiliary enterprises include, among others, student residence and board, food services, and the bookstore. Management and general expenses consist of general institutional support including expenses for fundraising. The University incurred fundraising expenses in the amount of approximately $8,401,000 during the year ended June 30, 2017, including approximately $6,074,000 in personnel expenses and approximately $2,327,000 in other expenses. The University incurred fundraising expenses in the amount of approximately $8,320,000 during the year ended June 30, 2016, including approximately $5,887,000 in personnel expenses and approximately $2,433,000 in other expenses. These expenses were incurred to support campaigns promoting charitable contributions including gifts directed toward the University’s endowment and capital projects.

University of San Diego Notes to Financial Statements
10
Note 1 – Nature of Operation and Significant Accounting Policies (continued) Earnings on permanently restricted endowments – Assets of the University’s individual endowment funds (the “Funds”) are generally maintained in pooled investment portfolios. Interest, dividends, and gains and losses in the investment pool are allocated on a monthly-average basis to the Funds in proportion to each Fund’s relative share in the investment pool, and are recorded in the Fund which is authorized to expend the earnings. The earnings on permanently restricted endowments are primarily recorded as temporarily restricted, in accordance with donor stipulations. In certain unique situations, a Fund’s earnings may be recorded as permanently restricted or unrestricted, in accordance with donor stipulations. Accumulated unspent earnings are reinvested and retained in the Funds to protect them against inflation over the long term. Expiration of donor-imposed restrictions – The expiration of a donor-imposed restriction on net assets is recognized in the period in which the restriction expires and at the time the related resources are reclassified to unrestricted net assets. Net assets are released from donor restrictions by incurring expenses satisfying the restricted purposes, by occurrences of events specified by the donors, or by the change of restrictions specified by the donors. Restrictions on gifts of cash or other assets received for the acquisition of long-lived assets are released when the long-lived assets are placed into service. Fair value of financial instruments – Fair value is defined as the price that would be received to sell an asset or paid to transfer a liability in an orderly transaction between market participants at the measurement date. The University classifies certain of its assets and liabilities based upon established fair value hierarchy that prioritizes the inputs to valuation techniques used to measure fair value. The hierarchy gives the highest priority to unadjusted quoted prices in active markets for identical assets or liabilities (Level 1 measurements) and the lowest priority to unobservable inputs (Level 3 measurements). The three levels of the fair value hierarchy are described below: Level 1 - Valuations based on unadjusted quoted prices in active markets for identical assets or liabilities
that the University has the ability to access at the measurement date; Level 2 - Valuations based on quoted prices in markets that are not active or for which all significant
inputs are observable, either directly or indirectly; and Level 3 - Valuations based on inputs that are unobservable and significant to the overall fair value
measurement. The University adopted the Financial Accounting Standards Board ("FASB") Accounting Standards Update ("ASU") 2015-07, Disclosures for Investment in Certain Entities That Calculate Net Asset Value per Share (or Its Equivalent), during the year ended June 30, 2016. Under the new guidance, investments measured using the net asset value per share (or its equivalent) practical expedient are not classified in the fair value hierarchy. The following describes these investments:
University of San Diego Notes to Financial Statements
11
Note 1 – Nature of Operation and Significant Accounting Policies (continued) Assets held at Net Asset Value (“NAV”) – Valuations based on fair value using the NAV per share (or its equivalent) of such investment funds as a practical expedient for fair value. The University has estimated the fair value of these funds by using the NAV provided by the fund’s managers. A financial instrument’s level within the fair value hierarchy is based on the lowest level of any input that is significant to the fair value measurement. The categorization of assets and liabilities within the hierarchy is based upon the pricing transparency and does not necessarily correspond to the University’s perceived risk of the assets and liabilities. The University has various processes and controls in place to ensure that fair value is reasonably estimated. The Finance Office, under supervision of the Vice President for Finance and Chief Financial Officer, sets the valuation policies and is responsible for the determination of fair value. Securities classified within Level 3 investments are based on valuations provided by external investment managers. The Investment Committee, in conjunction with the external investment advisors, monitors and analyzes the valuations of the investments four times during the academic year. The Investment Committee reports to the Board of Trustees. The valuations consider variables such as financial performance of the investment, recent sales prices of investments, and other pertinent information. Although the University uses its best judgment in determining the fair value of financial instruments, there are inherent limitations in any methodology. Future confirming events could affect the estimates of fair value and could be material to the financial statements. These events could also affect the amount realized upon liquidation of the instruments. Investments, in general, are subject to various risks including credit, interest, and overall market volatility risks. Due to the level of risk associated with certain investment securities, it is reasonably possible that changes in values of investment securities will occur in the near term and such changes could materially affect the amounts reported in the financial statements. Use of estimates – The preparation of financial statements in conformity with generally accepted accounting principles in the United States of America (“GAAP”) requires management to make estimates and assumptions that affect the reported amounts of assets and liabilities, disclosure of contingent assets and liabilities at the date of the financial statements, and the reported amounts of revenues and expenses during the reporting period. Actual results could differ from those estimates. Income taxes – The University is exempt from federal income tax under Section 501(c)(3) of the Internal Revenue Code (“IRC”) and Section 23701(d) of the California Revenue and Taxation Code. The University has no unrecognized tax benefits or liabilities as of June 30, 2017 and 2016. The University files an exempt organization return and applicable unrelated business income tax return in the U.S. federal jurisdiction and with the California Franchise Tax Board.
University of San Diego Notes to Financial Statements
12
Note 1 – Nature of Operation and Significant Accounting Policies (continued) Recently issued accounting standards – In February 2016, FASB issued ASU 2016-02, Leases (Topic 842). This guidance requires the recognition of rights and obligations arising from lease contracts, including existing and new arrangements, as assets and liabilities on the statement of financial position. The guidance is effective for annual reporting periods beginning after December 15, 2018. Management is currently evaluating the impact this will have on the University’s future financial statements. In August 2016, FASB issued ASU 2016-14, Not-for-Profit Entities (Topic 958): Presentation of Financial Statement for Not-for-Profit Entities. This guidance revises the not-for-profit reporting model. The guidance streamlines and clarifies net asset reporting, provides flexibility regarding the definition of reported operating subtotals, and imposes new reporting requirements related to expenses. The guidance is effective for fiscal years beginning after December 15, 2017. Management is currently evaluating the impact this will have on the University’s future financial statements. In November 2016, FASB issued ASU 2016-18, Statement of Cash Flows (Topic 230): Restricted Cash. The amendments in ASU 2016-18 are intended to minimize diversity in the classification and presentation of changes in restricted cash on the statement of cash flows. This ASU provides guidance to an organization’s management on how to classify and present changes in amounts generally described as restricted cash or restricted cash equivalents on the statement of cash flows and the related footnote disclosures. Management is currently evaluating the impact this will have on the University’s future financial statements. The University adopted the FASB ASU 2015-03, Interest—Imputation of Interest (Subtopic 835-30): Simplifying the Presentation of Debt Issuance Costs during the year ended June 30, 2017. Prior to the adoption of the ASU, the University’s policy was to present these loan origination fees in other assets on the statements of financial position, net of accumulated amortization. As required by the new guidance, the amendments were applied retrospectively to the year ended June 30, 2016. The University adopted FASB ASU 2014-15, Presentation of Financial Statements – Going Concern (Subtopic 205-40): Disclosures of Uncertainties about an Entity’s Ability to Continue as a Going Concern during the year ended June 30, 2017. ASU 2014-15 defines management’s responsibility to evaluate whether there is substantial doubt about an organization’s ability to continue as a going concern and to provide related footnote disclosures. The adoption of this ASU did not have a material impact on the accompanying financial statements.

University of San Diego Notes to Financial Statements
13
Note 2 – Investments Investments are reported at their fair values. The University follows a spending rule for its endowment funds, which provides for regular increases in spending while preserving the long-term purchasing power of the endowment. Earnings available for spending are shown in operating income, and the balance as non-operating income. The University pools certain investments from the various net asset categories. Interest, dividends, and gains and losses in the investment pool are all distributed to the appropriate net asset category. Distributions are based upon the carrying value of the various net asset categories’ assets when pooled; adjusted for purchases or gifts specifically identified to a given net asset category. Investments consist of the following at June 30 (in thousands):
2017 2016
Cash and cash equivalents 43,718$ 44,001$ Equities 226 203 Fixed income 58,319 51,584 Real estate 13,818 13,993 Pooled investments 582,017 506,035
Total 698,098$ 615,816$
Pooled investments consist of the following at June 30 (in thousands):
Cash and cash equivalents 18,909$ 11,062$ Fixed income 73,264 70,728 Equities 276,544 230,802 Real assets 34,248 33,648 Marketable alternatives 102,956 95,118 Non-marketable alternatives 76,096 64,677
Total 582,017$ 506,035$
University of San Diego Notes to Financial Statements
14
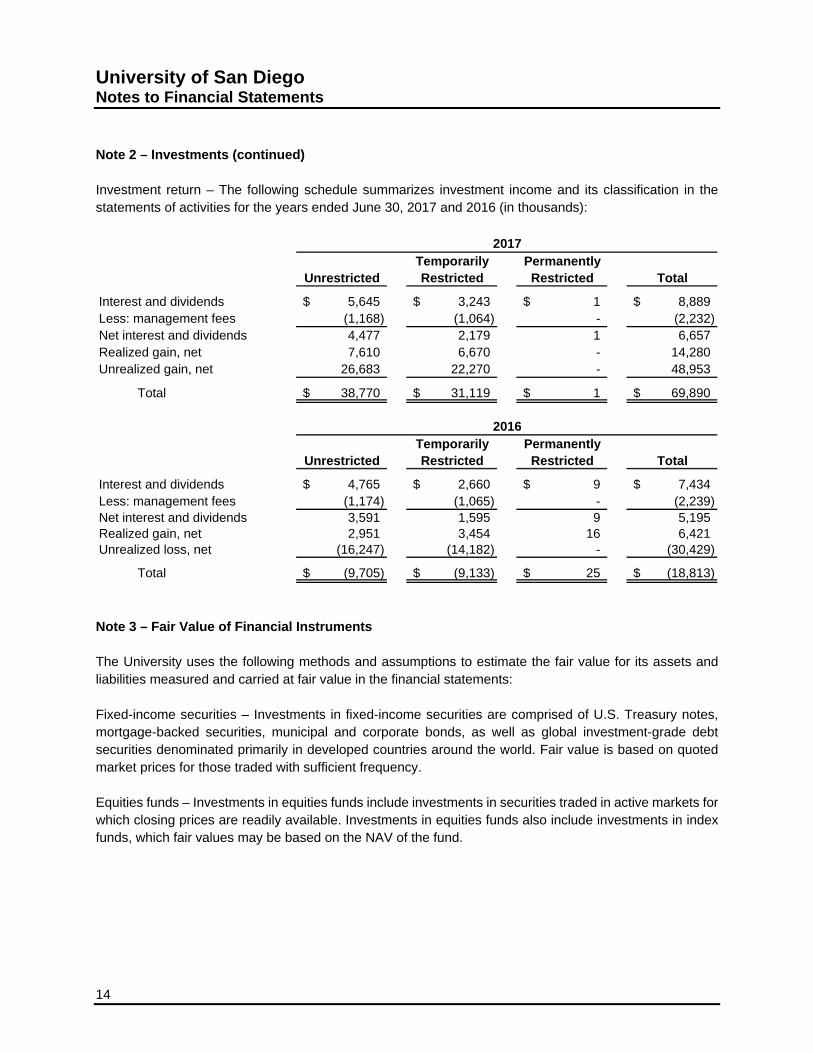
Note 2 – Investments (continued) Investment return – The following schedule summarizes investment income and its classification in the statements of activities for the years ended June 30, 2017 and 2016 (in thousands):
Temporarily PermanentlyUnrestricted Restricted Restricted Total
Interest and dividends 5,645$ 3,243$ 1$ 8,889$ Less: management fees (1,168) (1,064) - (2,232) Net interest and dividends 4,477 2,179 1 6,657 Realized gain, net 7,610 6,670 - 14,280 Unrealized gain, net 26,683 22,270 - 48,953
Total 38,770$ 31,119$ 1$ 69,890$
Temporarily PermanentlyUnrestricted Restricted Restricted Total
Interest and dividends 4,765$ 2,660$ 9$ 7,434$ Less: management fees (1,174) (1,065) - (2,239) Net interest and dividends 3,591 1,595 9 5,195 Realized gain, net 2,951 3,454 16 6,421 Unrealized loss, net (16,247) (14,182) - (30,429)
Total (9,705)$ (9,133)$ 25$ (18,813)$
2017
2016
Note 3 – Fair Value of Financial Instruments The University uses the following methods and assumptions to estimate the fair value for its assets and liabilities measured and carried at fair value in the financial statements: Fixed-income securities – Investments in fixed-income securities are comprised of U.S. Treasury notes, mortgage-backed securities, municipal and corporate bonds, as well as global investment-grade debt securities denominated primarily in developed countries around the world. Fair value is based on quoted market prices for those traded with sufficient frequency. Equities funds – Investments in equities funds include investments in securities traded in active markets for which closing prices are readily available. Investments in equities funds also include investments in index funds, which fair values may be based on the NAV of the fund.
University of San Diego Notes to Financial Statements
15
Note 3 – Fair Value of Financial Instruments (continued) Real estate – Investment in real estate includes various residential and commercial properties in San Diego, California. The University has estimated the real estate’s fair value by using market comparables and third-party appraisals. Real assets funds – Investments in real assets funds include funds, and funds of funds, which invest in various real assets. Fair value is based on quoted market prices for those traded on active markets. Several of these investments are either funds not actively traded in a public market or investments in limited partnerships, in which fair value is determined by the NAV of the funds as determined in good faith by the fund manager or general partner using the NAV as the practical expedient. Alternative investments – Investments in alternatives include funds of funds, hedge funds, and private equity funds for which no active market exists. The University has estimated the investments’ fair value by using the NAV provided by the funds’ managers. The University generally records alternative investments at NAV provided by the fund’s managers, as the managers have the greatest insight into the investments of their fund and the related industry. The University assesses the NAV and takes into consideration events such as suspended redemptions, imposition of gates, restructuring, secondary sales, and investor defaults to determine if an adjustment is necessary. Additionally, asset holdings are reviewed within the investment manager’s audited financial statements, as are interim financial statements and fund manager communications, for purposes of assessing valuation. The University’s determination of fair value is based upon the best available information provided by the investment manager and may incorporate management assumptions and best estimates after considering a variety of internal and external factors. Such value generally represents the University’s proportionate share of the partner’s capital of the investment partnerships as reported by their general partners. For these investments, the University has determined, through its monitoring activities, to rely on the fair value as determined by the investment managers. Beneficial interest in trust held by third parties – The University’s beneficial interest in trust assets are valued at fair value using the quoted market prices of the underlying securities and discounted when appropriate. If a quoted market price is not available, fair value is determined using the net present value of future distributions the University expects to receive over the term of the agreements. See Note 5. Interest-rate swap agreement – The fair value of the interest-rate swap agreement is the estimated amount the University would receive or pay to terminate the agreement at the reporting date, taking into consideration the current interest rates and creditworthiness of counterparties.

University of San Diego Notes to Financial Statements
16
Note 3 – Fair Value of Financial Instruments (continued) The following table discloses by level the fair value hierarchy for assets and liabilities at June 30, 2017:
Assets Held at
Net Asset Value 2017
Level 1 Level 2 Level 3 (or Equivalent) Total
Assets
Investment in:
Cash and cash equivalents 62,627$ -$ -$ -$ 62,627$
Fixed-income securities:
Domestic debt securities 24,524 - - 51,626 76,150
Government debt securities 15,149 - - - 15,149
Domestic and global securities 29,117 - - - 29,117
Global debt securities - - - 11,167 11,167
Equities funds:
Domestic equity securities 35,244 - - 85,092 120,336
International equity securities 21,218 - - 62,868 84,086
Emerging market equity securities 24,384 - - 23,475 47,859
Inflation sensitive equities 24,489 - - - 24,489
Real estate - 13,818 - - 13,818
Real assets funds 25,728 - - 8,520 34,248
Marketable alternatives:
Absolute return hedge funds - - - 37,883 37,883
Long/short hedge funds - - - 44,138 44,138
Diversifying hedge funds - - - 20,935 20,935
Non-marketable alternatives:
Venture capital - - - 19,995 19,995
Domestic private equity - - - 14,584 14,584
International private equity - - - 9,324 9,324
Distressed debt - - - 9,624 9,624
Energy and resources - - - 13,852 13,852
Real estate - - - 8,717 8,717
262,480 13,818 - 421,800 698,098
Beneficial interest in trust
held by third parties - - 5,413 - 5,413
Total fair value of assets 262,480$ 13,818$ 5,413$ 421,800$ 703,511$
Liabilities
Interest-rate swap agreement -$ 27,131$ -$ -$ 27,131$
(In Thousands)
University of San Diego Notes to Financial Statements
17
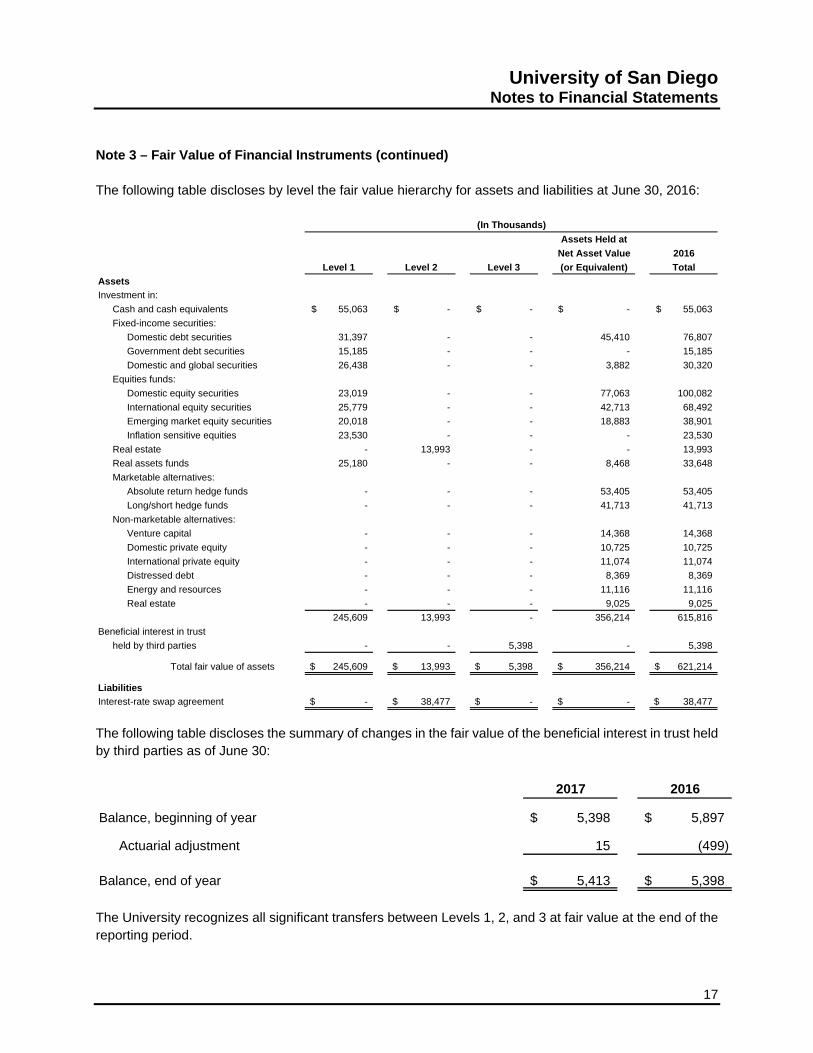
Note 3 – Fair Value of Financial Instruments (continued) The following table discloses by level the fair value hierarchy for assets and liabilities at June 30, 2016:
Assets Held at
Net Asset Value 2016
Level 1 Level 2 Level 3 (or Equivalent) Total
Assets
Investment in:
Cash and cash equivalents 55,063$ -$ -$ -$ 55,063$
Fixed-income securities:
Domestic debt securities 31,397 - - 45,410 76,807
Government debt securities 15,185 - - - 15,185
Domestic and global securities 26,438 - - 3,882 30,320
Equities funds:
Domestic equity securities 23,019 - - 77,063 100,082
International equity securities 25,779 - - 42,713 68,492
Emerging market equity securities 20,018 - - 18,883 38,901
Inflation sensitive equities 23,530 - - - 23,530
Real estate - 13,993 - - 13,993
Real assets funds 25,180 - - 8,468 33,648
Marketable alternatives:
Absolute return hedge funds - - - 53,405 53,405
Long/short hedge funds - - - 41,713 41,713
Non-marketable alternatives:
Venture capital - - - 14,368 14,368
Domestic private equity - - - 10,725 10,725
International private equity - - - 11,074 11,074
Distressed debt - - - 8,369 8,369
Energy and resources - - - 11,116 11,116
Real estate - - - 9,025 9,025
245,609 13,993 - 356,214 615,816
Beneficial interest in trust
held by third parties - - 5,398 - 5,398
Total fair value of assets 245,609$ 13,993$ 5,398$ 356,214$ 621,214$
Liabilities
Interest-rate swap agreement -$ 38,477$ -$ -$ $ 38,477
(In Thousands)
The following table discloses the summary of changes in the fair value of the beneficial interest in trust held by third parties as of June 30:
2017 2016
Balance, beginning of year 5,398$ 5,897$
Actuarial adjustment 15 (499)
Balance, end of year 5,413$ 5,398$
The University recognizes all significant transfers between Levels 1, 2, and 3 at fair value at the end of the reporting period.
University of San Diego Notes to Financial Statements
18
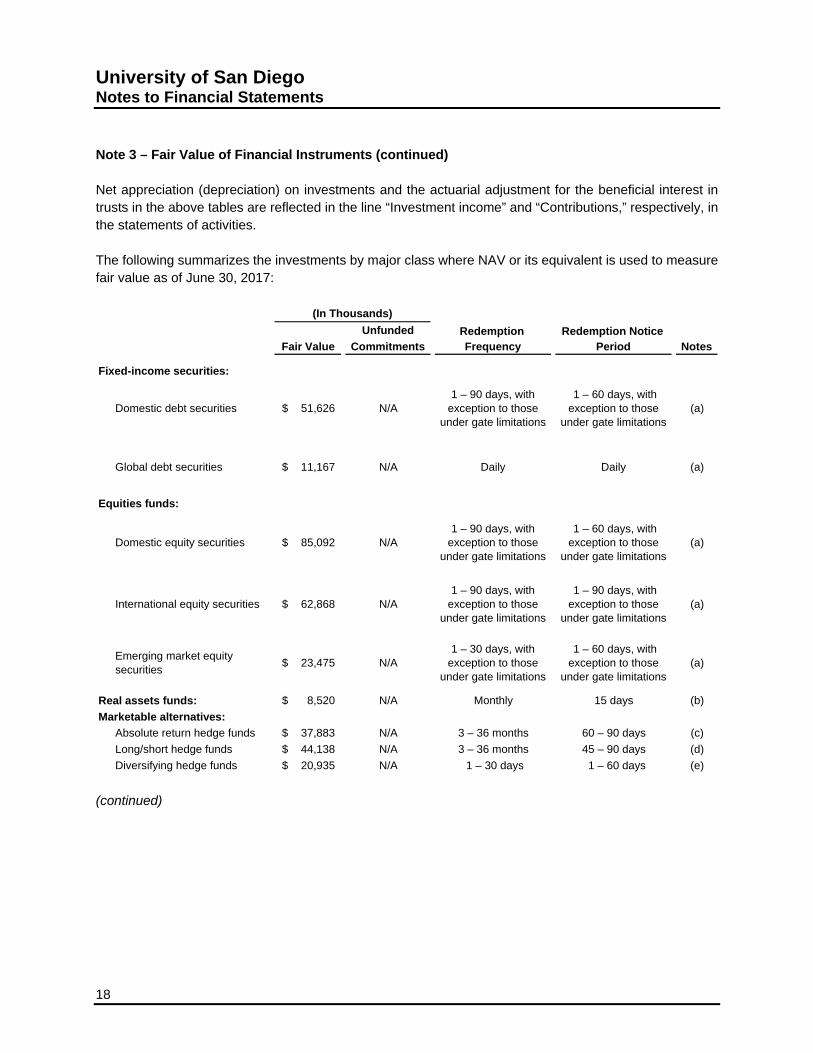
Note 3 – Fair Value of Financial Instruments (continued) Net appreciation (depreciation) on investments and the actuarial adjustment for the beneficial interest in trusts in the above tables are reflected in the line “Investment income” and “Contributions,” respectively, in the statements of activities. The following summarizes the investments by major class where NAV or its equivalent is used to measure fair value as of June 30, 2017:
Unfunded Redemption Redemption Notice Fair Value Commitments Frequency Period Notes
Fixed-income securities:
Domestic debt securities 51,626$ N/A1 – 90 days, with
exception to those under gate limitations
1 – 60 days, with exception to those
under gate limitations(a)
Global debt securities 11,167$ N/A Daily Daily (a)
Equities funds:
Domestic equity securities 85,092$ N/A1 – 90 days, with
exception to those under gate limitations
1 – 60 days, with exception to those
under gate limitations(a)
International equity securities 62,868$ N/A1 – 90 days, with
exception to those under gate limitations
1 – 90 days, with exception to those
under gate limitations(a)
Emerging market equity securities
23,475$ N/A1 – 30 days, with
exception to those under gate limitations
1 – 60 days, with exception to those
under gate limitations(a)
Real assets funds: 8,520$ N/A Monthly 15 days (b)
Marketable alternatives:
Absolute return hedge funds 37,883$ N/A 3 – 36 months 60 – 90 days (c)
Long/short hedge funds 44,138$ N/A 3 – 36 months 45 – 90 days (d)
Diversifying hedge funds 20,935$ N/A 1 – 30 days 1 – 60 days (e)
(In Thousands)
(continued)

University of San Diego Notes to Financial Statements
19
Note 3 – Fair Value of Financial Instruments (continued)
Unfunded Redemption Redemption Notice Fair Value Commitments Frequency Period Notes
Non-marketable alternatives:
Venture capital 19,995$ 18,754$ N/A – Redeemable
upon maturityN/A (f)
Domestic private equity 14,584$ 16,399$ N/A – Redeemable
upon maturityN/A (g)
International private equity 9,324$ 11,007$ N/A – Redeemable
upon maturityN/A (g)
Distressed debt 9,624$ 4,030$ N/A – Redeemable
upon maturityN/A (h)
Energy and resources 13,852$ 13,275$ N/A – Redeemable
upon maturityN/A (i)
Real estate 8,717$ 9,756$ N/A – Redeemable
upon maturityN/A (j)
(In Thousands)
(a) This category includes funds that consist of assets from several accounts which are blended together. These funds invest in U.S. debt and equities, international equities, as well as emerging markets. Less than 1 percent of the investments are not redeemable until liquidation by the fund manager.
(b) This category includes an investment in one real assets fund. Underlying investments are primarily real estate holdings in the public property markets throughout North America, Europe, and Asia Pacific.
(c) This category includes investments in various types of hedge funds using a total of 11 different fund managers. These funds are invested in absolute return strategies, including diversified arbitrage, event-driven arbitrage, and distressed funds. Less than 10 percent of the investments are not redeemable until liquidation by the fund manager. The remaining values are generally redeemable within one year, subject to certain gate limitations.
(d) This category includes investments in various types of hedge funds using a total of 8 different fund managers. These funds are invested in long and short strategies in both U.S. and global common stocks. Less than 1 percent of the investments are not redeemable until liquidation by the fund manager. The remaining values are generally redeemable within one year, subject to certain gate limitations.
(e) This category includes investments in various types of hedge funds using a total of 6 different fund managers. These funds are invested in diversifying strategies with lower correlation to equity markets including global macro and trend-following funds. Values are generally redeemable within sixty days, subject to certain gate limitations.
(f) This category includes investments in venture capital funds and funds of venture capital funds. Underlying investments are primarily private investments in early-stage companies.
(g) This category includes investments in private equity funds and private equity funds of funds in the U.S. and outside of the U.S. whose mandates include leveraged buyouts and growth equity investments in companies.
(h) This category includes investments in distressed debt funds and funds of funds. Underlying investments are primarily securities of companies or government entities that are already in default, under bankruptcy protection, or in distress and heading towards such a condition.
(i) This category includes funds, and a fund of funds, which invest in natural resources, commodities, and private energy in the U.S. and outside the U.S.
(j) This category includes funds, and a fund of funds, which invest in private real estate in the U.S. and outside the U.S.

University of San Diego Notes to Financial Statements
20
Note 4 – Accounts and Loans Receivable The following is a summary of receivables at June 30 (in thousands):
2017 2016
Student loans receivable 37,978$ 38,651$
Other receivables 7,039 7,180
Student accounts receivable for tuition and fees 7,394 6,151
52,411 51,982
Less allowance for doubtful accounts (6,337) (6,352)
Total 46,074$ 45,630$
The University’s student loans receivable consist of institutional and federally-sponsored loans due from both current and former students. Student loans and allowance for student loan doubtful accounts at June 30 are as follows (in thousands):
Institutional loans 23,284$ 23,495$
Federally-sponsored loans 14,694 15,156
37,978 38,651
Less allowance for doubtful accounts (5,823) (5,972)
Total 32,155$ 32,679$
Institutional loans are funded by donor funds restricted for student loan purposes. Federally-sponsored loans are funded by advances to the University primarily under the Federal Perkins Loan Program (the “Program”). Loans to students under the Program are subject to mandatory interest rates and significant restrictions, and loans issued under the Program can be assigned to the federal government in certain non-repayment situations. In these situations, the federal portion of the loan balance is guaranteed. Amounts received under the Program are ultimately refundable to the federal government in the event the University no longer participates in the Program and accordingly, have been reported as refundable advances in the statements of financial position. As of October 1, 2017, under Federal law, the University may no longer award new Perkins Loans to undergraduate students and may not make subsequent disbursements to undergraduate students after June 30, 2018. As of July 1, 2017, the University may not disburse Perkins loans to graduate students. The University provides home mortgage financing assistance to certain faculty. Notes receivable amounting to approximately $2,229,000 and $2,103,000 were outstanding at June 30, 2017 and 2016, respectively, and are collateralized by deeds of trust on properties concentrated in the region surrounding the University. No allowance for doubtful accounts has been recorded against these loans based on their collateralization and nature of the loans as forgivable. So long as there is no event of default as described in the promissory note, loans are forgiven over a five-year period. These amounts are included in other receivables in the summary of receivables tables above.

University of San Diego Notes to Financial Statements
21
Note 5 – Contributions Receivable Contributions receivable are expected to be received in the following periods at June 30 (in thousands):
2017 2016
Unconditional pledges:
Less than one year 3,187$ 3,155$
One to five years 3,320 3,750
More than five years 33,423 34,041
39,930 40,946
Less present value discount (2.4 percent
at June 30, 2017 and 1.8 percent at June 30, 2016) (9,249) (7,749)
Less allowance for uncollectibility (9,904) (10,709)
Net pledges receivable 20,777 22,488
Split-interest agreements - more than five years 5,413 5,398
Total 26,190$ 27,886$
At June 30, 2017 and 2016, an outstanding pledge from the same donor represented 34 percent and 35 percent, respectively, of the University's gross pledges receivable. Split-interest agreements are comprised of unitrusts and charitable gift annuities. The Finance Office, under the supervision of the Vice President for Finance and Chief Financial Officer, determines the fair value measurement policies and procedures for split-interest agreements. These policies and procedures are reassessed annually to determine if the current valuation techniques are still appropriate. At that time, the unobservable inputs used in the fair value measures are evaluated and adjusted, as necessary, based on current market conditions and other third-party information.
(In Thousands) Significant
Fair Value at Valuation Unobservable Range of
June 30, 2017 Technique Inputs Input Value
Beneficial interests in trust Discounted Discount Rate 2.40%
held by third parties 5,413$ Cash Flow Life Expectancy 4 to 35 years
Type
To determine the fair value of unitrust assets, the University determines net present value using a discount percentage and donor data. For charitable gift annuities, the assets are recorded at fair value and a liability is then recorded for the amount of the annuity payments based on the life of the donor. A decrease in the discount rate, a shorter life expectancy, and an increase in the fair value of the underlying assets will increase the recorded fair value of the unitrust; this change in fair value is recorded into revenue for the given year.

University of San Diego Notes to Financial Statements
22
Note 6 – Property, Plant, and Equipment Property, plant, and equipment consist of the following at June 30 (in thousands):
2017 2016
Land and improvements 51,088$ 51,028$
Buildings and improvements 539,429 535,713
Furniture, equipment, and capital leases 21,511 15,571
Library resources 52,762 52,121
Construction in progress 18,451 11,887
683,241 666,320
Less accumulated depreciation (186,072) (172,411)
497,169 493,909
Art collection 4,062 4,062
Total 501,231$ 497,971$
Property, plant, and equipment are stated at cost if purchased, or fair value at the date of donation, and are depreciated on a straight-line basis over their appropriate estimated useful lives. The estimated useful lives by asset type are 50 years for buildings; 40 years for building improvements and library resources; 7 years for furniture, equipment, and technology upgrades; and 3 years for capital lease assets. Depreciation expense totaled approximately $15,998,000 and $15,828,000 for the years ended June 30, 2017 and 2016, respectively. The art collection consists of various pieces of donated and purchased artwork, antique furniture, and artifacts whose value is expected to increase over time and, therefore, is not depreciated. Note 7 – Employee Benefits The University has a retirement healthcare program that pays a specified fixed amount to supplement the medical insurance payments made by retirees of the University. The University has internally designated specific investments toward covering this obligation. The following table sets forth the amount of obligation and assets as of June 30 (in thousands):
2017 2016
Fair value of designated assets 4,576$ 3,995$
Post-retirement benefit obligation 4,574 3,995
Over funded 2$ -$
The designated assets are included in short-term investments and the benefit obligation is included inaccounts payable and accrued expenses in the statements of financial position.
University of San Diego Notes to Financial Statements
23
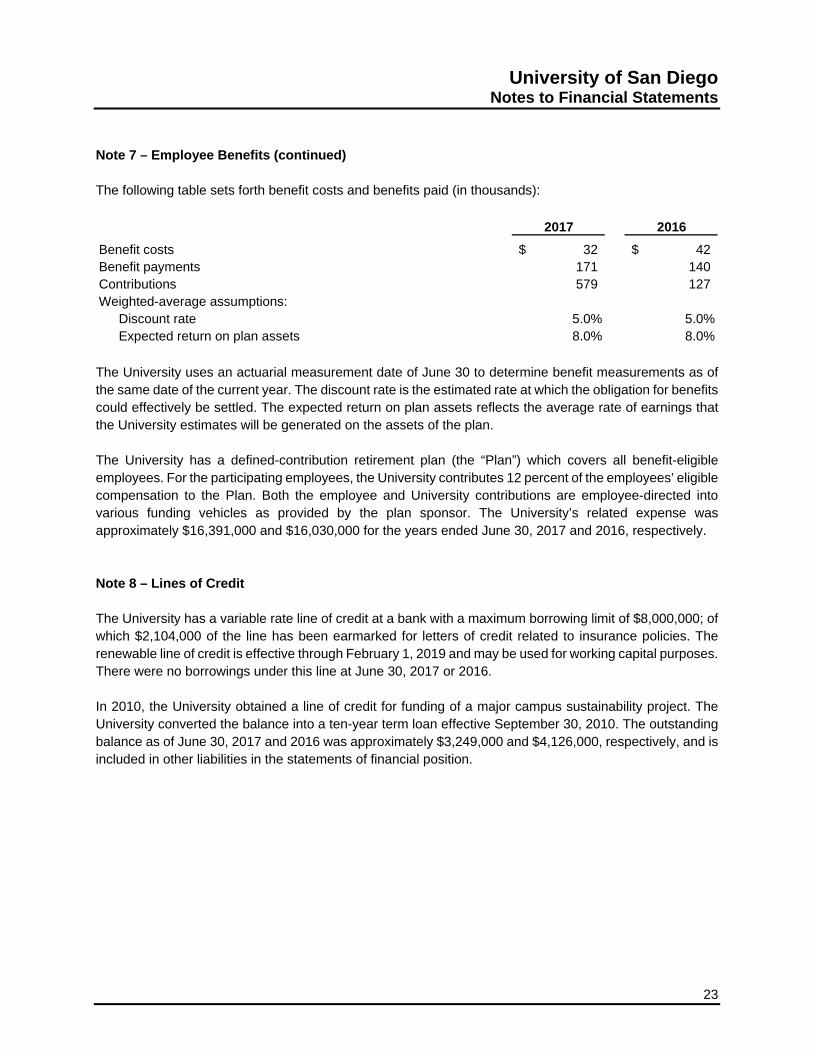
Note 7 – Employee Benefits (continued) The following table sets forth benefit costs and benefits paid (in thousands):
2017 2016
Benefit costs 32$ 42$ Benefit payments 171 140 Contributions 579 127 Weighted-average assumptions:
Discount rate 5.0% 5.0%Expected return on plan assets 8.0% 8.0%
The University uses an actuarial measurement date of June 30 to determine benefit measurements as of the same date of the current year. The discount rate is the estimated rate at which the obligation for benefits could effectively be settled. The expected return on plan assets reflects the average rate of earnings that the University estimates will be generated on the assets of the plan. The University has a defined-contribution retirement plan (the “Plan”) which covers all benefit-eligible employees. For the participating employees, the University contributes 12 percent of the employees’ eligible compensation to the Plan. Both the employee and University contributions are employee-directed into various funding vehicles as provided by the plan sponsor. The University’s related expense was approximately $16,391,000 and $16,030,000 for the years ended June 30, 2017 and 2016, respectively. Note 8 – Lines of Credit The University has a variable rate line of credit at a bank with a maximum borrowing limit of $8,000,000; of which $2,104,000 of the line has been earmarked for letters of credit related to insurance policies. The renewable line of credit is effective through February 1, 2019 and may be used for working capital purposes. There were no borrowings under this line at June 30, 2017 or 2016. In 2010, the University obtained a line of credit for funding of a major campus sustainability project. The University converted the balance into a ten-year term loan effective September 30, 2010. The outstanding balance as of June 30, 2017 and 2016 was approximately $3,249,000 and $4,126,000, respectively, and is included in other liabilities in the statements of financial position.
University of San Diego Notes to Financial Statements
24
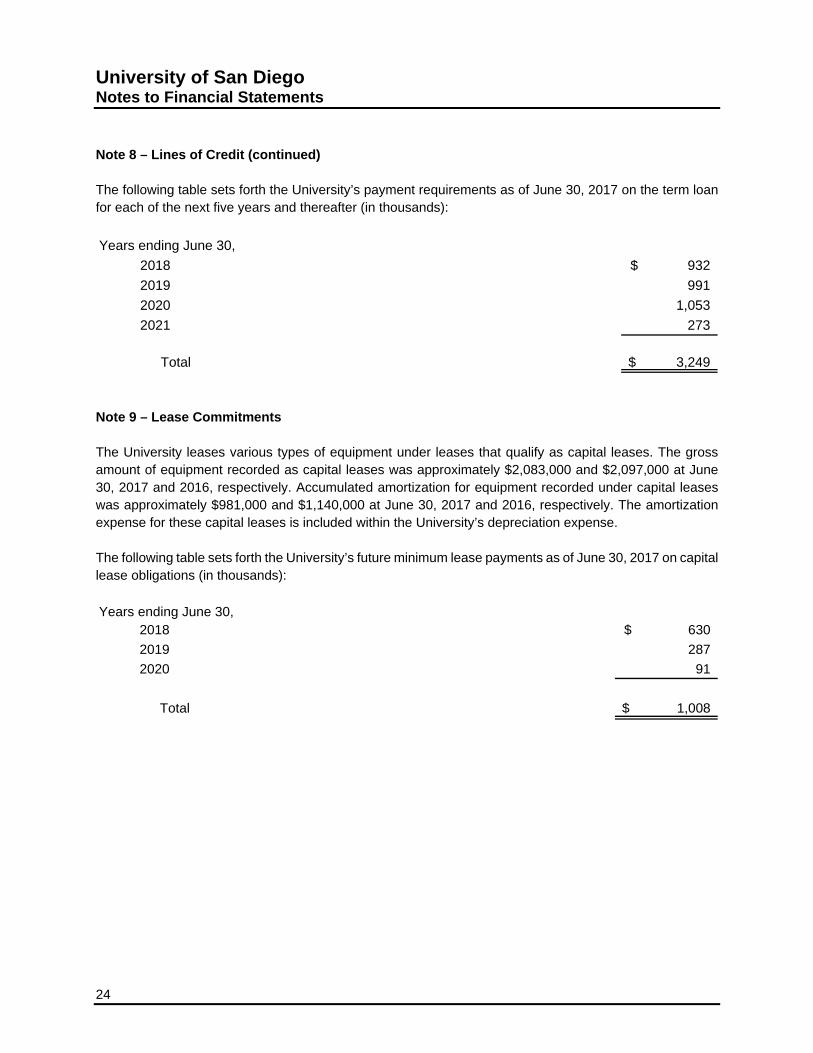
Note 8 – Lines of Credit (continued) The following table sets forth the University’s payment requirements as of June 30, 2017 on the term loan for each of the next five years and thereafter (in thousands):
Years ending June 30,
2018 932$
2019 991
2020 1,053
2021 273
Total 3,249$
Note 9 – Lease Commitments The University leases various types of equipment under leases that qualify as capital leases. The gross amount of equipment recorded as capital leases was approximately $2,083,000 and $2,097,000 at June 30, 2017 and 2016, respectively. Accumulated amortization for equipment recorded under capital leases was approximately $981,000 and $1,140,000 at June 30, 2017 and 2016, respectively. The amortization expense for these capital leases is included within the University’s depreciation expense. The following table sets forth the University’s future minimum lease payments as of June 30, 2017 on capital lease obligations (in thousands):
Years ending June 30,2018 630$
2019 287
2020 91
Total 1,008$
University of San Diego Notes to Financial Statements
25
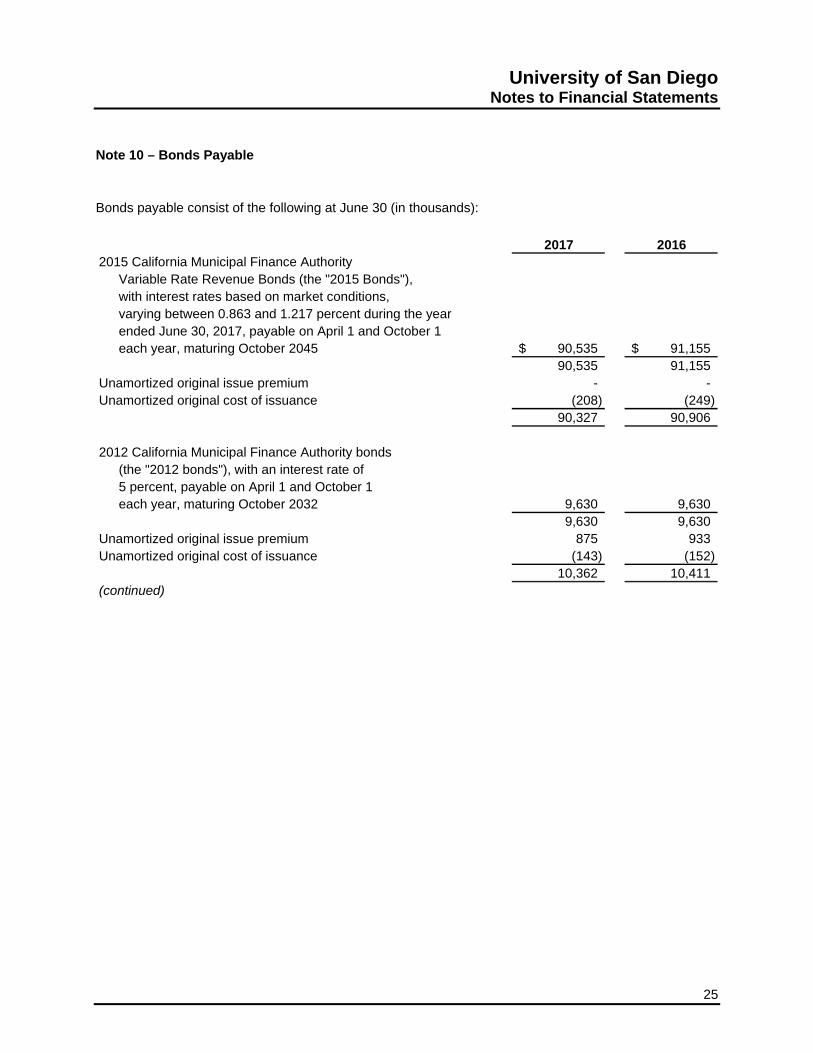
Note 10 – Bonds Payable Bonds payable consist of the following at June 30 (in thousands):
2017 20162015 California Municipal Finance Authority
Variable Rate Revenue Bonds (the "2015 Bonds"),with interest rates based on market conditions, varying between 0.863 and 1.217 percent during the year ended June 30, 2017, payable on April 1 and October 1 each year, maturing October 2045 90,535$ 91,155$
90,535 91,155 Unamortized original issue premium - - Unamortized original cost of issuance (208) (249)
90,327 90,906
2012 California Municipal Finance Authority bonds(the "2012 bonds"), with an interest rate of 5 percent, payable on April 1 and October 1each year, maturing October 2032 9,630 9,630
9,630 9,630 Unamortized original issue premium 875 933 Unamortized original cost of issuance (143) (152)
10,362 10,411 (continued)
University of San Diego Notes to Financial Statements
26
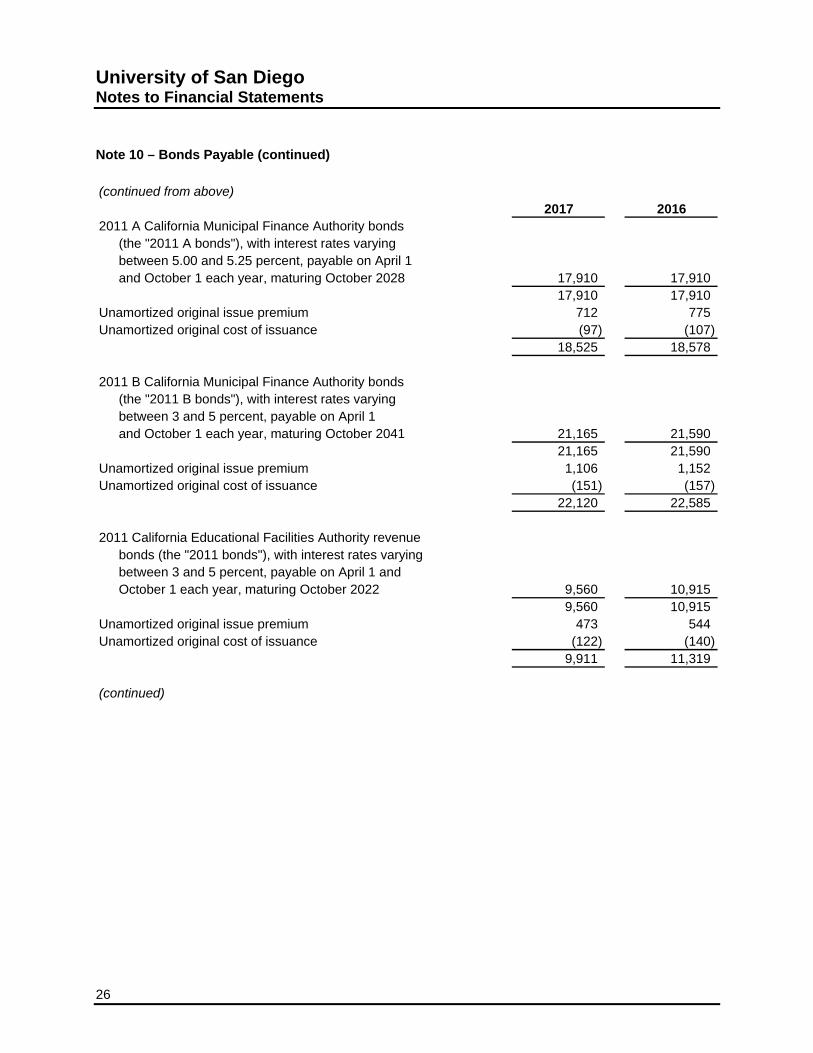
Note 10 – Bonds Payable (continued)
(continued from above)2017 2016
2011 A California Municipal Finance Authority bonds(the "2011 A bonds"), with interest rates varyingbetween 5.00 and 5.25 percent, payable on April 1 and October 1 each year, maturing October 2028 17,910 17,910
17,910 17,910 Unamortized original issue premium 712 775 Unamortized original cost of issuance (97) (107)
18,525 18,578
2011 B California Municipal Finance Authority bonds(the "2011 B bonds"), with interest rates varyingbetween 3 and 5 percent, payable on April 1 and October 1 each year, maturing October 2041 21,165 21,590
21,165 21,590 Unamortized original issue premium 1,106 1,152 Unamortized original cost of issuance (151) (157)
22,120 22,585
2011 California Educational Facilities Authority revenue bonds (the "2011 bonds"), with interest rates varying
between 3 and 5 percent, payable on April 1 andOctober 1 each year, maturing October 2022 9,560 10,915
9,560 10,915 Unamortized original issue premium 473 544 Unamortized original cost of issuance (122) (140)
9,911 11,319
(continued)

University of San Diego Notes to Financial Statements
27
Note 10 – Bonds Payable (continued)
(continued from above)2017 2016
1999 California Educational Facilities Authority revenue bonds (the "1999 bonds"), comprised of capital appreciation bonds with interest rates varying between 4.45 and 5.16 percent, with interest payable at the time they mature:
Capital appreciation bonds, due October 2009 through October 2024 6,410 7,139
6,410 7,139 Unamortized original issue discount (34) (37) Unamortized original cost of issuance (140) (151)
6,236 6,951
Total bonds payable 157,481$ 160,750$
The 2015, 2012, 2011 A, 2011 B, 2011, and 1999 bonds are secured by the University’s full faith and credit. The bond agreements place certain restrictive covenants on the University with which management believes the University has complied. Bond premiums, discounts and issuance costs are amortized using the straight-line method over the life of the bonds, which approximates the interest method. In July 2015, the University issued the 2015 Bonds through the California Municipal Financing Authority (“CMFA”) and borrowed $91,750,000 from US Bank under a direct purchase option. The 2015 Bonds mature in October 2045 and were issued for the sole purpose of refunding the 2005 Bonds to achieve future debt service savings. The University recorded a $441,000 loss from this refunding in other unrestricted non-operating changes on the statement of activities during the year ended June 30, 2016. The estimated fair value of the University’s bonds was approximately $174,457,000 and $181,328,000 at June 30, 2017 and 2016, respectively. Bonds payable are categorized as Level 2 within the fair value hierarchy discussed in Note 1. For the 2012, 2011 A, 2011 B, 2011, and 1999 bonds, the fair value was derived using estimated market prices on publicly-traded debt. The 2015 bonds are privately placed with a financial institution and management has determined the carrying value as of June 30, 2017 approximates the fair value of these bonds.
University of San Diego Notes to Financial Statements
28
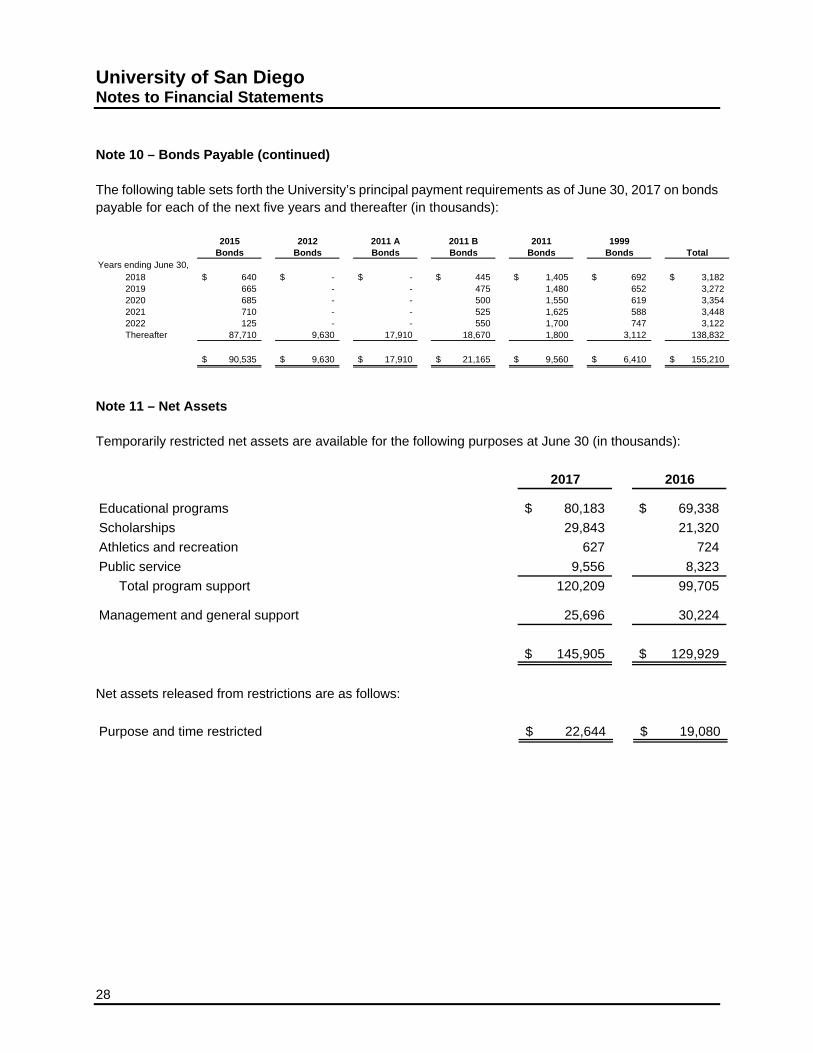
Note 10 – Bonds Payable (continued) The following table sets forth the University’s principal payment requirements as of June 30, 2017 on bonds payable for each of the next five years and thereafter (in thousands):
2015 2012 2011 A 2011 B 2011 1999Bonds Bonds Bonds Bonds Bonds Bonds Total
Years ending June 30,2018 640$ -$ -$ 445$ 1,405$ 692$ 3,182$ 2019 665 - - 475 1,480 652 3,272 2020 685 - - 500 1,550 619 3,354 2021 710 - - 525 1,625 588 3,448 2022 125 - - 550 1,700 747 3,122 Thereafter 87,710 9,630 17,910 18,670 1,800 3,112 138,832
90,535$ 9,630$ 17,910$ 21,165$ 9,560$ 6,410$ 155,210$
Note 11 – Net Assets Temporarily restricted net assets are available for the following purposes at June 30 (in thousands):
2017 2016
Educational programs 80,183$ 69,338$
Scholarships 29,843 21,320
Athletics and recreation 627 724
Public service 9,556 8,323
Total program support 120,209 99,705
Management and general support 25,696 30,224
145,905$ 129,929$
Net assets released from restrictions are as follows:
Purpose and time restricted 22,644$ 19,080$
University of San Diego Notes to Financial Statements
29
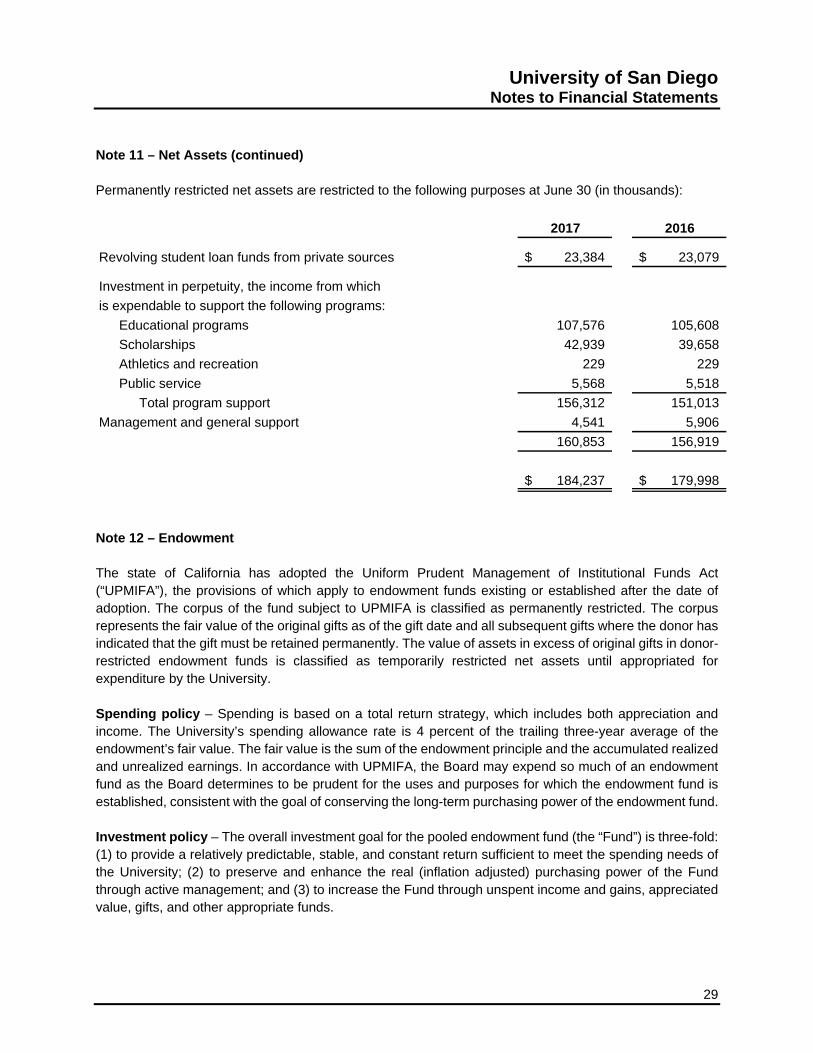
Note 11 – Net Assets (continued) Permanently restricted net assets are restricted to the following purposes at June 30 (in thousands):
2017 2016
Revolving student loan funds from private sources 23,384$ 23,079$
Investment in perpetuity, the income from which
is expendable to support the following programs:
Educational programs 107,576 105,608
Scholarships 42,939 39,658
Athletics and recreation 229 229
Public service 5,568 5,518
Total program support 156,312 151,013
Management and general support 4,541 5,906
160,853 156,919
184,237$ 179,998$
Note 12 – Endowment The state of California has adopted the Uniform Prudent Management of Institutional Funds Act (“UPMIFA”), the provisions of which apply to endowment funds existing or established after the date of adoption. The corpus of the fund subject to UPMIFA is classified as permanently restricted. The corpus represents the fair value of the original gifts as of the gift date and all subsequent gifts where the donor has indicated that the gift must be retained permanently. The value of assets in excess of original gifts in donor-restricted endowment funds is classified as temporarily restricted net assets until appropriated for expenditure by the University. Spending policy – Spending is based on a total return strategy, which includes both appreciation and income. The University’s spending allowance rate is 4 percent of the trailing three-year average of the endowment’s fair value. The fair value is the sum of the endowment principle and the accumulated realized and unrealized earnings. In accordance with UPMIFA, the Board may expend so much of an endowment fund as the Board determines to be prudent for the uses and purposes for which the endowment fund is established, consistent with the goal of conserving the long-term purchasing power of the endowment fund. Investment policy – The overall investment goal for the pooled endowment fund (the “Fund”) is three-fold: (1) to provide a relatively predictable, stable, and constant return sufficient to meet the spending needs of the University; (2) to preserve and enhance the real (inflation adjusted) purchasing power of the Fund through active management; and (3) to increase the Fund through unspent income and gains, appreciated value, gifts, and other appropriate funds.

University of San Diego Notes to Financial Statements
30
Note 12 – Endowment (continued) The return objective for the Fund, measured over a full market cycle, shall be inflation plus 5.5 percent, after the payment of all investment-related fees. In addition, the Fund should experience no greater risk (volatility and variability of return) than that of the market; the market being defined as the Fund’s relevant policy benchmarks. It is recognized that the achievement of a long-term, real return in excess of 5.5 percent per year will require a significant allocation to higher returning asset classes. To help moderate the volatility of the portfolio, the Fund will seek to achieve meaningful diversification across asset classes. In addition, the Fund will include significant allocations to asset classes that provide a meaningful hedge against deflation and inflation. Endowment net assets – The following represents a description of the endowment net asset composition by type of fund as of June 30, 2017 (in thousands):
Temporarily Permanently
Unrestricted Restricted Restricted Total
Donor-restricted endowment
fund (13)$ 109,891$ 160,853$ 270,731$
Board designated/quasi-
endowment funds 232,837 - - 232,837
Total endowment 232,824$ 109,891$ 160,853$ 503,568$
2017
The following represents a description of the endowment net asset composition by type of fund as of June 30, 2016 (in thousands):
Temporarily Permanently
Unrestricted Restricted Restricted Total
Donor-restricted endowment
fund (293)$ 89,754$ 156,919$ 246,380$
Board designated/quasi-
endowment funds 203,417 - - 203,417
Total endowment 203,124$ 89,754$ 156,919$ 449,797$
2016

University of San Diego Notes to Financial Statements
31
Note 12 – Endowment (continued) As a result of market declines, the fair value of certain donor-restricted endowments was less than the historical cost value of such funds by approximately $13,000 and $293,000 at June 30, 2017 and 2016, respectively. These losses have been recorded as reductions in unrestricted net assets. Future gains will be used to restore this deficiency in unrestricted net assets before any net appreciation above the historical cost value of such funds increases temporarily restricted net assets. The following represents the changes in endowment net assets for the year ended June 30, 2017 (in thousands):
Temporarily Permanently
Unrestricted Restricted Restricted Total
Net endowment assets,
beginning of year 203,124$ 89,754$ 156,919$ 449,797$
Investment return:
Investment income, net 1,805 2,174 - 3,979
Net appreciation 25,124 28,918 - 54,042
Total investment return 26,929 31,092 - 58,021
Contribution and other
revenue 10 22 3,710 3,742
Appropriation and other
expenditures (6,013) (9,608) - (15,621)
Other changes, including
transfers 8,774 (1,369) 224 7,629
Net endowment assets,
end of year 232,824$ 109,891$ 160,853$ 503,568$
2017

University of San Diego Notes to Financial Statements
32
Note 12 – Endowment (continued) The following represents the changes in endowment net assets for the year ended June 30, 2016 (in thousands):
Temporarily Permanently
Unrestricted Restricted Restricted Total
Net endowment assets,
beginning of year 209,229$ 107,600$ 153,155$ 469,984$
Investment return:
Investment income, net 1,602 1,599 9 3,210
Net (depreciation) appreciation (9,055) (10,695) 16 (19,734)
Total investment return (7,453) (9,096) 25 (16,524)
Contribution and other
revenue 15 554 3,543 4,112
Appropriation and other
expenditures (7,245) (9,304) - (16,549)
Other changes, including
transfers 8,578 - 196 8,774
Net endowment assets,
end of year 203,124$ 89,754$ 156,919$ 449,797$
2016
Note 13 – Commitments and Contingencies Loan programs – The University participates in certain alternative loan programs. No assets or liabilities are recorded by the University for amounts loaned to students under these programs. The University is contingently liable for a portion of the outstanding loans, and the amount of the contingency was approximately $1,281,000 and $1,290,000 at June 30, 2017 and 2016, respectively. Grants and contracts – Federal grant programs are subject to review by the grantor agencies, which could result in requests for reimbursement to grantor agencies for disallowed expenditures. Management believes it has adhered to the terms of its grants, and any disallowed expenditures resulting from such reviews would not have a material effect on the financial position of the University. Legal – The University is party to certain legal actions arising in the ordinary course of business. In the opinion of management, liabilities, if any, under these actions will not have a material impact on its financial position.
University of San Diego Notes to Financial Statements
33
Note 14 – Subsequent Events Subsequent events are events or transactions that occur after the statement of financial position date, but before the financial statements are available to be issued. The University recognizes in the financial statements the effects of all subsequent events that provide additional evidence about conditions that existed at the date of the statement of financial position, including the estimates inherent in the process of preparing the financial statements. The University’s financial statements do not recognize subsequent events that provide evidence about conditions that did not exist at the date of the statement of financial position, but arose after the statement of financial position date and before the financial statements are available to be issued. The University has evaluated subsequent events through October 18, 2017, which is the date the financial statements were available for issuance.