university of groningen action in the brain gazzola, valeria · and others, 2005; aziz-zadeh and...
TRANSCRIPT

University of Groningen
Action in the brainGazzola, Valeria
IMPORTANT NOTE: You are advised to consult the publisher's version (publisher's PDF) if you wish to cite fromit. Please check the document version below.
Document VersionPublisher's PDF, also known as Version of record
Publication date:2007
Link to publication in University of Groningen/UMCG research database
Citation for published version (APA):Gazzola, V. (2007). Action in the brain: shared neural circuits for action observation and execution s.n.
CopyrightOther than for strictly personal use, it is not permitted to download or to forward/distribute the text or part of it without the consent of theauthor(s) and/or copyright holder(s), unless the work is under an open content license (like Creative Commons).
Take-down policyIf you believe that this document breaches copyright please contact us providing details, and we will remove access to the work immediatelyand investigate your claim.
Downloaded from the University of Groningen/UMCG research database (Pure): http://www.rug.nl/research/portal. For technical reasons thenumber of authors shown on this cover page is limited to 10 maximum.
Download date: 05-06-2018

47
The observation and execution ofactions share motor and somato-
sensory voxels in all tested subjects:single subject analyses of unsmoothed fMRI
data
V. Gazzola, S. Caspers, and C. Keyserssubmitted
Introduction
Since the discovery of the first mirror neurons in the premotor cortex of the monkey (di Pellegrino and others, 1992; Gallese and others, 1996), substantial effort has been placed into determining which brain regions are part of the mirror neuron system (Fadiga and others, 1995; Grafton and others, 1996; Decety and others, 1997; Hari and others, 1998; Iaco-boni and others, 1999; Buccino and others, 2001; Gangitano and others, 2001; Iacoboni and others, 2001; Avikainen and others, 2002; Aziz-Za-deh and others, 2002; Fadiga and others, 2002; Kohler and others, 2002; Grezes and others, 2003; Heiser and others, 2003; Keysers and others, 2003; Aziz-Zadeh and others, 2004; Buccino and others, 2004a; Buccino and others, 2004b; Leslie and others, 2004; Bangert and others, 2005; Borroni and others, 2005; Calvo-Merino and others, 2005; Fogassi and others, 2005; Iacoboni and others, 2005; Molnar-Szakacs and others, 2005; Montagna and others, 2005; Mottonen and others, 2005; Nelissen and others, 2005; Aziz-Zadeh and others, 2006; Calvo-Merino and oth-ers, 2006; Cross and others, 2006; Dapretto and others, 2006; Gazzola and others, 2006; Hamilton and Grafton, 2006; Jackson and others, 2006; Molnar-Szakacs and others, 2006; Gazzola and others, 2007). Single cell recording is presently the only method that allows a definite proof of the presence of mirror neurons in a particular brain region.. Unfortunately, single cell recordings are slow and painstaking, requiring years to deter-mine if a brain area contains mirror neurons. It is therefore essential to use other methods to determine which brain areas might contain mirror neurons to guide single cell recordings. By testing human or primate sub-jects while executing actions and observing similar actions, functional magnetic resonance imaging (fMRI) can determine if the blood oxygen-level dependent (BOLD) signal within a certain voxel is augmented both during action observation and execution. If this is the case, the voxel can be said to be ‘shared’ by two processes: execution and observation. We
5
Neuroimaging studies of the mirror neuron system (MNS) examine if certain voxels in the brain are shared between action observa-tion and execution (shared voxels, sVx). Unfortunately, finding sVx in standard group analysis is not a guarantee that sVx exist in indi-vidual subjects. Using unsmoothed, single subject analysis we show sVx can be reliably found in all 16 investigated participants. Next to the ventral premotor (BA6/44) and inferior parietal cortex (area PF not PG) where mirror neurons (MNs) have been found in monkeys, sVx were reliably observed in dorsal premotor, supplementary motor, middle cingulate, somatosensory (BA3, BA2 and OP1), superior parietal, middle temporal cortex and cerebellum. For the premotor, somatosensory and parietal areas, sVx were more numerous in the left hemisphere. The hand representation of the primary motor cortex showed a reduced BOLD during hand action observation, possibly preventing undesired overt imitation. This study provides a more detailed description of the location and reliability of sVx, confirms the left hemispheric dominance of the shared circuit and points towards a number of candidate areas that could contain MNs but that have not yet been tested for their presence in monkeys.
will refer to such voxels as ‘shared voxels’ (sVx) instead of mirror voxels because sVx could but do not necessarily have to contain mirror neurons: they could contain (a) two distinct populations of neurons, one respond-ing only during motor execution and one only during action observation, (b) true mirror neurons, or (c) a combination of both.
If neuroimaging is done in humans and single cell recordings done in monkeys, three additional complications arise in going from neuroim-aging to single cell recording. First, it is not trivial to decide what area of the monkey’s brain is the homologue of a particular candidate area in the human brain. Second, not finding mirror neurons during single cell recordings in a brain region is not a proof of their absence, because it is not possible to record all neurons in a given area. Third, even if a brain area in monkeys could be shown not to contain mirror neurons, this area in humans may still contain them. Comparative fMRI studies using simi-lar paradigms in humans and monkeys (Nelissen and others, 2005), and single cell recording in neurological patients can help overcome some of these limitations.
To our knowledge, all fMRI studies investigating the mirror neurons system (MNS) so far have used conventional group analyses in which the data of each subject is smoothed, and the data from all subjects combined to provide a single map of sVx. In addition to the general limitations asso-ciated with fMRI, these analyses have two further problems. First, using smoothing, two neighboring but not overlapping populations of neurons, one for action observation and one for action execution, would seem-ingly overlap at their common border. Second, although many investiga-tors assume that random effect analyses identify effects that are present in all subjects, a voxel that in half the subjects is only involved in action observation and in the other half only in action execution, could seem to be involved in both task at the group level (see Fig. S1).
While fMRI cannot test whether an sVx contains mirror neurons, the problems associated with smoothing and group analyses can be over-

48
Chapter 5
come by using single subject analyses and unsmoothed data. Morrison et al. (Morrison and Downing, in press) have recently demonstrated the importance of this approach for the study of pain: using smoothed group data, they found that observing the pain of others and experiencing pain causes brain activations that overlap in the anterior cingulate cortex, con-firming previous findings (Singer and others, 2004; Botvinick and others, 2005; Jackson and others, 2005) but using unsmoothed single subject data half their subjects entirely failed to show sVx in the ACC, and the other half had only marginal overlaps between pain observation and execution. They concluded that a similar lack of sVx in single subjects may apply to the motor MNS.
We presented movies of hand actions to 16 healthy participants while recording their brain activity using fMRI. On a following day, we asked them to perform similar actions in the scanner. We will examine this data on a subject by subject basis, using unsmoothed data in order to examine whether sVx can be reliably identified in single subjects us-ing motor execution and observation. We will examine the spatial con-sistency of sVx between subjects and report and discuss all brain areas showing sVx in order to identify novel ‘candidate’ brain areas in which mirror neurons can be hunted for using single cell recordings in mon-keys. With the recent advent of cyto-architectonic probabilistic maps for key areas of the putative MNS (Geyer and others, 1996; Amunts and oth-ers, 1999; Geyer and others, 1999; Geyer and others, 2000; Grefkes and others, 2001; Eickhoff and others, 2005; Caspers and others, 2006; Choi and others, 2006; Eickhoff and others, 2006a) the current study will also aim to provide cytoarchitectonic labels to the locations containing most sVx. The use of these labels can facilitate the comparison between spe-cies and pave the way to a more systematic comparison of brain location between studies.
Materials and Methods
Subjects and general procedures
The current report examines the data presented in Gazzola (Gazzola and others, 2007) using different analysis methods. Subjects and procedures have already been fully described (Gazzola and others, 2007). Briefly: 16 healthy volunteers participated in the experiment (14 right and 2 left handed; 9 female and 7 male; mean age 31yrs ranging 25-45yrs; normal or corrected to normal vision; no history of neurological disorders) and were tested with three different categories of stimuli in three separate days. Day1: subjects viewed pictures of a human hand or objects on a table. As control conditions we used a scrambled version (scr) of the same pictures. Day2: subjects viewed movies with the same human hand inter-acting (i.e. grasping, moving, etc) with objects (the same objects and table showed in the pictures of day 1, e.g. a cup, a glass, etc) placed on a table (hand complex action: Hca). Control conditions included: hand simply moving on the table (hand movement: Hm) or the same hand simply rest-ing on the table (hand static: Hst) behind the objects used in Hca. Day1 and Day2 also contained stimuli involving a robotic agent, but these will not be analyzed in this manuscript. Day3: subjects executed mouth, hand and feet actions in the scanner, but only hand execution will be used here (hand execution: Hexe). To avoid biasing the processing of the stimuli based on the other conditions, the session order was kept constant across subjects, all subjects were informed about the content of the study and signed an informed consent on a day-by-day basis. Importantly subjects were therefore unaware of the fact they will need to execute actions in the scanner while watching the actions of others.
All experiments were approved by the Medical Ethical Commission (METc) of the University Medical Center Groningen (NL).
fMRI
Scanning was performed using a Philips Intera 3T Quaser, a synergy
SENSE head coil, 30 mT/m gradients and a standard single shot EPI with TE=30ms, TA=TR=2s, 39 axial slices of 3mm thickness, with no slice gap and a 3x3mm in plane resolution acquired to cover the entire brain and cerebellum.
General data processing
Data were preprocessed using SPM2 (http://www.fil.ion.ucl.ac.uk/spm/software/spm2). EPI images from all sessions were slice time cor-rected and realigned to the first volume of the second day of scanning. High quality T1 images were co-registered to the mean EPI image and segmented. The co-registered gray matter segment was normalized onto the MNI gray matter template and the resulting normalization parameters applied to all EPI images. For each individual, data were then analyzed voxel-by-voxel by applying a general linear model on the unsmoothed normalized data (unless specified otherwise). All conditions were mod-eled using a box-car function convolved with the hemodynamic response function (HRF). Additional predictors of no interest were modeled to ac-count for translation and rotation along the three possible dimensions as determined during the realignment procedure.
Standard random effects analysis after smoothing the same dataset are reported elsewhere (Gazzola and others, 2007). Random effect analy-sis on Hexe using unsmoothed data are reported below.
Subject-by-subject sVx
For each subject, at the first level of analysis and using a probability cut-offs of punc<0.001 (translating to t values ranging from 3.1 to 3.13 depend-ing on the number of repetition of each condition), we defined a voxel as sVx if the following three conditions were satisfied at the same time. (1) the t-value of the contrast Hca-Hst was above 3.10; (2) the maximum t-value during action executions with the right or left hand exceeded 3.13; (3) the t-value of the contrast ScramblePicture-Rest was below 3.10. In other words: (Hca-Hst>3.10) & (max(HexR,HexL)>3.13) & (scr-Rest<3.10). Since the motor execution task contained visual instructions, we exclusively masked with the scrambled pictures to restrict results to areas involved in motor execution and not responding to meaningless visual patterns. An equivalent analyses was performed for the contrast Hca-Hm: (Hca-Hm>3.10) & (max(HexR,HexL)>3.13) & (scr-Rest<3.10). The results of these logical ‘&’ are Boolean maps containing the value 1 when the conditions are satisfied and 0 when they are not.
Spatial consistency maps
To quantify how consistently a certain voxel was shared between sub-jects, we summed the 16 boolean sVx maps defined above (one for each subject). This results in maps (one for the contrast Hca-Hst and one for Hca-Hm) containing values ranging from 0 to 16 that quantify the num-ber of subjects for which that particular voxel is sVx (i.e. 0 = in none of the subjects that voxel was sVx; 16= for all subjects that voxel was sVx).
Likelyhood of x/16 subjects showing sVx in a certain voxel
How likely is it to find that x out of 16 subjects show sVx in a given voxel of the brain? According to a global null hypothesis, where a voxel is nei-ther motor nor visual, the likelihood for a single subject to show sVx by chance is 0.0012
. An alternative, and more conservative approach towards sVx is to assume the worst case scenario: a voxel is truly motor but not visual or truly visual but not motor (Nichols and others, 2005). Under this null hypothesis, the likelihood of classifying a voxel as sVx although it is either just motor or just visual is p<0.001. Using this most conservative approach, the likelihood of finding x out of 16 subjects to have sVx in a voxel can be estimated using the cumulative binomial distribution with 16 repetitions and a success probability of 0.001. This probability can be

Anatomy of the mirror neuron system
49
further Bonferroni corrected with a factor of 44294 (the number of voxels in the search volume of the brain). With these assumptions, finding 3 or more subjects showing sVx in a voxel is significant after Bonferroni correction at p<0.025). All consistency maps in this report will thus be thresholded using a threshold of 3 or more subjects needing to show sVx in a given voxel. Unfortunately, it is unclear how covariance of the signal between adjacent voxels, although minimized using unsmoothed data, af-fects this Bonferroni correction.
Likelyhood of x/n voxels in an area showing sVx properties:
Be xi the number of voxels showing sVx properties in subject i within a certain brain area A containing n voxels. Given the fact that the likeli-hood of a single voxel to be sVx by chance is at most 0.001 (see above), we can estimate the likelihood of finding xi or more sVx within the given brain area (under the null hypothesis that the area does not contain sVx at all) using the cumulative density function of the binomial distribution (B)with probability p=0.001 and number of events n (B(n,p). Given that the sum of two binomial distribution with parameters n and p is a bino-mial distribution with parameters 2n and p, the sum of the number of voxels found to be sVx in all subjects follows a binomial distribution with parameters 16n and p=0.001 , and the mean (over all 16 subjects) number of voxels ( x ) found to be sVx in a brain area with size n can be estimated using the cumulative density function of the binomial distribution with parameters 16n and p at the value of .It should be noted, that this estimation is only an approximation of the true likelihood because it assumes that neighboring voxels represent in-dependent measurements. For unsmoothed data, this assumption is more reasonable than for smoothed data, but this assumption is still violated due to intrinsic spatial correlation in the fMRI signal, resulting in a sys-tematic underestimation of the likelihood of finding x by chance.
Anatomical descriptions and regions of interest (ROI)
Anatomical description were, in the majority of the cases, performed based on the probabilistic cytoarchitectonic maps of the brain mapping group in Juelich, Germany (Geyer and others, 1996; Amunts and others, 1999; Geyer and others, 1999; Geyer and others, 2000; Grefkes and oth-ers, 2001; Geyer, 2003; Eickhoff and others, 2005; Caspers and others, 2006; Choi and others, 2006; Eickhoff and others, 2006a), as implemented in the SPM anatomy toolbox (http://www.fz-juelich.de/ime/spm_anatomy_toolbox; Eickhoff and others, 2005). In that approach, a max-imum probability map is created of all cytoarchitectonically identified brain areas (BA6,44,45,1,2,3,4; parietal operculum, inferior parietal lob-ule; primary visual areas; hippocampus and amygdala). Brain areas BA1-3 will be refered to as SI and OP1 as SII. Outside of these areas, 4 other re-gions were found to contain a significant number of sVx: MTG, SPL, cer-ebellum and SFG/MFG. For the MTG and SPL a rough definition of the borders was possible through the map of Brodmann areas (BA37 for the MTG and BA 5 and 7 for SPL) provided with MRIcro (xbrodmann.hdr; http://www.sph.sc.edu/comd/rorden/mricro.html ). No maps of the cerebellum were available and we therefore drew the maps using the mean anatomical image obtained by averaging the normalized 16 T1 im-ages. For the sVx falling outside of the cyto-architectonically defined BA6 (Geyer, 2003), in location anatomically described as SFG/MFG, defining additional ROIs is difficult as they still fall within regions that according to the atlas of Talairach and Tournoux (Talairach and Tournoux, 1988) would be described as BA6. We therefore simply refer to these locations as SFG/MFG.
The remaining locations are described macro anatomically (e.g. precentral gyrus, etc). This means that a reference to precentral gyrus indicates that the activation was in a sector of the precentral gyrus that did not fall within any of the cytoarchitectonically identified maximum
( )100.0,61(~61
1pnBx
ii (
( )100.0,61(~61)100.0,61(~61
1pnBxpnBx
ii )61 x
probability areas. Given that cytoarchitectonic maps are more reliable, a voxel that is attributable to a probabilistic cytoarchitectonic map with a probability of at least 40%, is always attributed to that map and not to the less reliable definition of the other areas. All but the cytoarchitectonically areas should be considered ‘putative’.
Localization and quantification of the overlaps
The spatial consistency maps only indicate for how many subjects a par-ticular voxel is sVx, but it does not indicate how many subjects have a sVx in a particular area (e.g. if the peak value in BA6 is 12, that means that for 12 subjects that voxel is sVx, but it does not mean that the other subjects do not have any sVx in BA6). To quantify how many subjects showed sVx in a particular area, without requiring that they have it in a particular voxel of that area, we counted, separately for the right and left hemisphere, how many sVx each subject had in the ROIs specified in section ‘Anatomical descriptions and regions of interests (ROI)’. We used the anatomy toolbox to obtain the number of mirror voxels that fell in the cyto-architectonic areas. We then exclusively masked the mirror activa-tion of each subject with a map containing all the regions included in the toolbox to obtain a map of the voxels that do not belong to these cyto-architectonically defined areas. Using the Nifti toolbox (http://www.mathworks.com/matlabcentral/fileexchange/loadFile.do?objectId=8797&objectType=File; http://nifti.nimh.nih.gov/) we then cal-culated how many of the remaining voxels were within the BA37, SPL, cerebellum and SFG/MFG. The remaining voxels were then regrouped under the label ‘other’.
We then calculated the average number of sVx for all the regions of interest to illustrate the contribution of each area to the putative mirror system. For BA6, BA44, BA45, M1, SI and IPL, we also calculated the proportion of the total area showing sVx properties (e.g. number of sVx in Area X divided by total number of voxels in Area X).
Finally, for each of these cytoarchitectonic defined areas (BA6, BA44, BA45, M1, SI and IPL) separately, we examined statistically whether the average number of sVx observed is likely to have occurred by chance as described above. For virtually all brain areas of Figures 3-5, the average number of sVx was substantially above chance level. The only exceptions were the rightOP2 and left PGa, which are indicated by arrows in the figures. We also examined within each group of areas (frontal, IPL and so-matosensory) whether the proportion of sVx differs between hemispheres using a 2 way repeated measurement ANOVA (area x hemisphere). For instance for the somatosensory areas, we entered the proportion of sVx (i.e. the number of sVx within each sub-area divided by the number of voxels within this subarea) for each subject into a repeated measurement ANOVA with 8 areas (BA1, BA2, BA3a, BA3b, OP1, OP2, OP3, OP4) x 2 hemispheres (Left, Right). If there was a significant main effect of hemi-sphere or a significant interaction area x hemisphere, we conducted LSD planned comparisons between right and left hemisphere for each brain area separately and report those areas where this difference was signifi-cant with stars in the Figure.
Determining the hand representation in M1
As detailed in the general data processing section, the unsmoothed data during motor execution was modeled using a general linear model with a separate predictor for right hand and left hand action execution. The parameter estimates of these predictors were entered into a second level analysis using a voxel-by-voxel t-test that tests if the average parameter estimate of the 16 subjects differs from zero (i.e. the standard SPM ran-dom effect procedure except that we did not smooth the data). The re-sulting t-map for right hand execution was masked with the location of the left M1 (area 4a and 4p) while the resulting t-map for the left hand execution was masked with the location of the right M1. The two masked activations were then superimposed on a single brain and thresholded at

50
Chapter 5
p<0.001 (t>3.73).
Results
Descriptive single subjects analysis
Figure 1 illustrates for 3 subjects (s4, s6 and s9) the areas that showed significant activation during the execution of hand actions in red (after exclusion of low level visual responses, see Methods. Hex), those involved in observation of actions compared to the observation of a static control in green (Hca-Hst) and those involved in both in yellow (sVx). Supple-mentary Figure 2-4 show the same results for all 16 subjects. While an extensive description of the areas involved in motor execution or obser-vation alone would go beyond the scope of this paper, motor execution consistently activated premotor (BA6, SMA, BA44), cingulate (ACC,
Subj4
Sub6
Sub9
Hca-HstOverlapMax(HexR,HexL)&~scr
Figure 1: Brain activity for 3 randomly selected single subjects. Activations are shown on 12 axial slices taken at locations shown on the sagital section at the bottom of the figure. Sec-tions are taken from the average T1 image of all 16 participants. Green voxels represent voxel where the contrast Hca-Hst was significant. Red voxels, those where the execution of hand actions using the right or the left hand was significant, but where the sight of scrambled images did not produce significant activations. Yellow voxels are those where both conditions are met (i.e. green and red).
MCC), prefrontal (SFG, MFG), motor (M1), primary and secondary so-matosensory, posterior parietal (SPL, precuneus, IPL), temporal (STG, MTG) cortices, insula, basal ganglia, thalamus, cerebellum and additional smaller clusters. Interestingly, MTG and STS were consistently activated despite the fact that subjects were unable to see their own actions. Dur-ing action observation, activation included: visual and visual association areas (V17/18, MOG, MTG, STG/S, ITG-fusiform), SPL, SI, SII, IPL, SPL, MCC, BA6, SFG, MFG, BA44, thalamus, cerebellum and other smaller clusters.
Most interestingly, sVx were consistently observed in all our 16 sub-jects. The sVx were generally not located at the border between distinct areas of red and green, but appear as islands within the red or the green. sVx are most prominent in: BA6, SFG, MFG, BA44, MCC, BA2, SPL, IPL and MTG.

Anatomy of the mirror neuron system
51
Spatial Consistency Maps
To examine how similar the distribution of sVx was between subjects, we determined for each voxel the number of subjects that showed sVx in that location. In such an analysis a value of 0 signifies that none of 16 subjects showed an sVx in that location and a value of 16 that all sub-jects had sVx in that location (see Method). Figure 2 left column shows the results of this analysis when contrasting the vision of actions against static (Hca-Hst) or movement (Hca-Hm) controls. Particularly consistent sVx location were observed in premotor, postcentral, parietal, temporal and cerebellar locations (see Table S1). For Hca-Hst the most consistent voxel (13/16 subjects) fell at the border between the SPL and SI (BA1) and for Hca-Hm (11/16) within SI (BA2). The next most consistent loca-tions were in the dorsal premotor cortex (BA6, Hca-Hst: 9/16, Hca-Hm: 6/16). To examine the impact of smoothing data, Figure 2 right column illustrates the results of the same analysis but using smoothed (6x6x6 mm full width at half maximum Gaussian kernel) data. The overall pattern is very similar but consistency is increased both in terms of peak (Hca-Hst: 16/16; Hca-Hm: 14/16) and extension of the highly consistent zones. Comparing the results of these consistency maps with traditional random effect analysis reveals that similar voxels are considered to be significant using the two approaches (Figure 2).
Proportion of Cyto-Architectonic areas showing sVx
The peak overlap in the above analysis using unsmoothed data in BA6 for the contrast Hca-Hst was 9/16. This does NOT mean that the remaining 7 out of 16 subjects do not show sVx in BA6 but only that within this very specific voxel, the remaining 7/16 do not. To directly examine how many individuals show sVx in BA6, we counted the number of sVx in each subject within the boundaries of the cytoarchitectonically defined BA6(Geyer, 2003), divided this sVx count by the total number of voxel
Unsmoothed Smoothed
Hca
-Hst
Hca
-Hm
0 16nr of subjects
RFX
t-value0 11
Figure 2: Consistency of sVx rendered on the average T1 image of all 16 subjects. Left and middle columns show the number of subjects showing sVx in each voxel using unsmoothed and smoothed data respectively. Only voxels where at least 3 subjects showed sVx are shown (p<0.025, bonferoni corrected, see ‘probabilistic considerations‛ in materials and methods). The right column shows the t-values of a traditional random effect analysis using smoothed data as in (Gazzola and others, 2007)
in BA6 and expressed the result in percent. The same analysis was per-formed for all other cyto-architectonically defined areas (BA 1, 2, 3a, 3b; OP 1-4; BA 4a, 4ap; BA 44, 45; hIP 1, 2; PF-proper, PFcm, PFop, PFt; PGa, PGp) for which at least one subject had an sVx. Figures 3-5 and Table 1 report the results of this analysis.
Frontal LobeFigure 3 and Table 1 indicate the proportion of sVx in the various motor and premotor areas. Areas BA44 and BA6 clearly played the most impor-tant and consistent role in the sVx, while area BA45 played a negligible role. The primary motor cortex (BA 4a, 4p) did show evidence of sVx but only at its borders with SI and the MCC, whereas the regions of 4a and 4p most involved in hand execution were deactivated (see last section of results). Comparing the right and left hemisphere revealed no significant lateralization for the contrast Hca-Hst, and only in BA44 (pLSD<10-4) and BA6 (pLSD<0.04) for the contrast Hca-Hm.
Somatosensory Areas of the Parietal LobeFigure 4 and Table 2 show the results of the same analysis for the somato-sensory areas. For both contrasts, left BA2 and both OP1 played the ma-jor roles in terms of sVx within the primary and secondary somatosensory cortex respectively.
The Inferior Parietal LobuleResults for the IPL are reported in Figure 5 and Table 1. Overall PF
was strongly involved in the sVx system while PG was not. For the con-trast Hca-Hst, PGa, PGp and PFm were clearly less involved than the re-mainder of the areas. In the contrast Hca-Hm PFop and PFt were clearly the most strongly involved areas.

52
Chapter 5
0
25
20
15
10
5
BA4p BA4a BA44 BA45 BA6
% o
f th
e ar
ea a
ctiv
ated
BA4p BA4a BA44 BA45 BA6
**
right hemisphereleft hemisphereaverage %
Hca-Hst Hca-Hm
*
Figure 3: Percentage of premotor and motor areas showing sVx properties. Each black dia-mond represents the value of a single subject in the left hemisphere, each gray one that in the right hemisphere. Open circles represent the average percentage and error bars, the standard error of the mean (sem) over the 16 subjects. Stars over square brackets repre-sent significant differences in the percentage of the areas showing sVx if the right and left hemisphere are compared using an LSD planned comparisons tests (*p<0.05, **p<0.001). For all areas, the number of voxels showing sVx exceed the number expected by chance.
Hca-Hst Hca-Hm
Hem Area Size Nr of subj. with at least 5 sVx in the area
Average nr of sVx for each area % Nr of subj. with at
least 5 sVx in the areaAverage nr of sVx
for each area %
motor
L 4p 594 9 16.6 2.8 7 13.3 2.2R 4p 479 11 18.0 3.7 6 9.4 2.0L 4a 1333 13 28.2 2.1 10 18.0 1.3R 4a 1232 9 38.3 3.1 8 23.3 2.1
premo-tor
L 44 1193 12 71.6 6.0 10 43.7 3.7R 44 895 9 42.8 4.8 5 7.7 0.6L 45 917 1 2.4 0.3 3 3.1 0.3R 45 1106 9 11.2 1.0 4 5.4 0.6L 6 4495 16 323.4 7.2 15 195.8 4.4R 6 4476 12 244.8 5.5 13 125.8 2.8
Table 1: Motor and premotor sVx. For each region the number of voxels contained in that region is given alongside, for both the contrast Hca-Hst and Hca-Hm, the number of subjects with at least 5 sVx in this area, the average number of sVx per subject and the proportion of the area showing sVx properties averaged over subjects.
Figure 4: Proportion of voxels in somatosensory areas showing sVx properties. Conventions as in Figure 3. Only for right OP2 (arrow) was the number of sVx below the number expected by chance.
0
60
50
40
30
20
10
% o
f th
e ar
ea a
ctiv
ated
BA1
right hemisphereleft hemisphere
BA2 BA3a BA3b OP1 OP2 OP3 OP4
average %
Hca-Hst
**
BA1 BA2 BA3a BA3b OP1 OP2 OP3 OP4
Hca-Hm**
*
0
50
40
30
20
10
% o
f th
e ar
ea a
ctiv
ated
Hca-Hm
0
60
50
40
30
20
10
% o
f th
e ar
ea a
ctiv
ated
hlP1 hlP2 PF PFcm PFm PFop PFt PGa PGp
Hca-Hst
*
**
*
*
hlP1 hlP2 PF PFcm PFm PFop PFt PGa PGp
*
**
0
60
50
40
30
20
10
% o
f th
e ar
ea a
ctiv
ated
right hemisphereleft hemisphereaverage %
Figure 5 (above): Proportion of voxels in the inferior parietal lobule showing sVx properties. Only for left PGa (arrow) was the number of sVx below that expected by chance. Conven-tions as in Figure 3.
Proportion of sVx contributed by each brain area
Figure 6 compares the relative contribution of the different brain regions to the total putative MNS. In addition to the cytoarchitectonically de-fined regions used above, we counted the number of sVx in the superior parietal lobule, the cerebellum, the middle temporal area (putative BA37) and the superior (SFG) and middle (MFG) frontal gyri based on macro anatomical landmarks (see method). These areas were included because of their prominence in the analyses of Figure 1 and 2. All other areas were pooled under the name ‘other’ because of the lack of reliable criteria for defining their borders.
Next to the ‘classic’ premotor, parietal and temporal (BA37) regions generally associated with the MNS, the somatosensory areas, the cerebel-lum and the middle and superior frontal gyri contribute very significantly to the total number of sVx. Within the IPL, PF and PFt contribute most. The rank order of contributors in Figure 6 differ from that in previous fig-ures (Fig. 3-5) because of differences in voxel number between areas (e.g. PF: 1924 voxels, PFop: 564 voxels), with Figure 3,4,5 plotting percentage of area activated, while Figure 6 plots the total contribution. The slice ‘Other’ includes mainly MCC, followed by thalamus, caudate and insular regions. Examination of the consistency maps indicates that of the other areas only the MCC is characterized by relatively consistent loci of activa-tion with a peak of 9 subjects showing sVx at the coordinates x = -10, y = -24, z = 40 (Hca-Hst) and 8 subjects at x = 14, y = -22, z = 44 (Hca-Hst). The low spatial consistency of the remaining ‘other’ sVx (peaks ≤ 3 sub-jetcs) suggests they may reflect idiosyncrasies or false positives.

Anatomy of the mirror neuron system
53
Reductions of BOLD signal in primary motor cortexWe also examined if certain voxels involved in motor execution demon-strated reductions in the BOLD signal during the observation of actions. We determined voxels showing significant (p<0.001) reductions of the BOLD signal in the contrasts Hca-Hst or Hca-Hm (i.e. t(Hca-Hst)<-3.10 or t(Hca-Hm)<-3.10), inclusively masked these maps with the motor ex-ecution mask (max(HexR,HexL)>3.13 & scr-Rest<3.10 as described in section ‘subject-by-subject sVx’), and computed consistency maps by counting for each voxel the number of subjects satisfying this criteria. The most consistent (≥3 subjects) reductions in BOLD were found in the primary motor cortex (M1, see Figure 7). We performed the same analy-sis looking for voxels where the BOLD is reduced compared to baseline. Results indicated that in all three visual conditions, M1 shows deacti-vated voxels but this deactivation was most consistent during the Hca condition. The number of deactivated voxels in M1 was larger during the Hca (average number of voxels=285±s.e.m.31, minimum=130) than during the Hst (162±33, min=0) or Hm (202±33, min=65) conditions. A Friedman ANOVA for repeated measurements with 3 conditions (Hca, Hst, Hm) confirmed the significance of this difference (p<0.009). Planned comparisons using the Friedman ANOVAs with only two conditions in-dicated that the effect was due to Hca showing more voxels than both Hst and Hm (Hca vs Hst: p<0.013, Hca vs Hm: p<0.013, Hst vs Hm: p>0.79). In M1, deactivation in the contrast Hca-Hst were found in all 16 subjects and deactivations in the contrast Hca-Hm were found in 15/16 subjects.
In addition, we determined the sector of M1 most recruited during action execution using a traditional random-effect analysis, and com-pared the location of the peak of this activation (red cross in Figure 7) with the location of the deactivations. The deactivations in Hca, Hca-Hst and Hca-Hm peak in a location of M1 that closely corresponds to the peak of the activation during hand execution, indicating that the hand region of M1 was deactivated during the vision of hand actions.
Hca-Hst Hca-Hm
Hem Area Size Nr of sub.j with at least 5 sVx in the area
Average nr of sVx for each area % Nr of Subj with at least
5 sVx in the areaAverage nr of sVx
for each area %
somato-sensory
L Area1 1031 14 127.2 12.3 14 95.2 9.2R Area1 870 13 125.2 14.4 13 65.0 7.5L Area2 943 16 304.6 32.3 16 208.1 22.1R Area2 1019 16 204.7 20.1 14 103.2 10.1L Area3a 538 14 30.0 5.6 10 19.2 3.6R Area3a 512 12 22.3 4.4 7 11.8 2.3L Area3b 735 16 75.0 10.2 12 49.8 6.8R Area3b 991 15 93.0 9.4 12 41.7 4.2L OP1 611 16 63.9 10.5 10 19.1 3.1R OP1 523 13 51.5 9.8 7 16.3 3.1L OP2 141 4 2.7 1.9 1 1.4 1.0R OP2 161 1 0.9 0.6 0 0.3 0.2L OP3 287 3 3.5 1.2 1 1.1 0.4R OP3 259 1 2.1 0.8 1 0.9 0.3L OP4 611 8 11.0 1.8 4 4.0 0.6R OP4 510 7 9.2 1.8 3 3.0 0.6
Table 2: Same as Table 1 but for somatosensory areas.
Hca-Hst Hca-Hm
Hem Area Size Nr of sub.j with at least 5 sVx in the area
Average nr of sVx for each area % Nr of Subj with at least
5 sVx in the areaAverage nr of sVx
for each area %
L hlP1 364 6 12.5 3.4 1 6.1 1.7inferior parietal R hlP1 169 1 1.2 0.7 1 1.4 0.8
L hlP2 234 6 10.9 4.7 5 3.6 1.5R hlP2 116 8 11.5 9.9 3 2.6 2.2L PF 1012 15 74.0 7.3 9 28.9 2.9R PF 912 13 63.9 7.0 4 5.7 0.6L PFcm 384 15 48.7 12.7 5 9.5 2.5R PFcm 323 11 27.5 8.5 1 0.7 0.2L PFm 510 5 4.2 0.8 1 1.1 0.2R PFm 856 8 12.2 1.4 2 1.6 0.2L PFop 289 15 38.9 13.4 9 19.5 6.8R PFop 274 11 18.7 6.8 4 3.2 1.2L PFt 403 16 105.1 26.1 14 59.9 14.9R PFt 440 14 60.0 13.7 10 17.1 3.9L PGa 764 1 1.4 0.2 0 0.2 0.0R PGa 1005 8 10.0 1.0 4 3.9 0.4L PGp 1086 10 15.5 1.4 8 10.3 0.9R PGp 1153 5 14.0 1.2 5 5.7 0.5
Table 2: Same as Table 1 but for somatosensory areas.
OtherBA37
SPL
BA1
BA2BA3a
BA3b
BA6
cerebellu
m
MFG
/SFG
BA44BA45
hlP1hlP2PFPFcmPFmPFop
PFtPGaPGp
OP1OP4
BA4aBA4p
OtherBA37
SPLcerebell
um
BA6
MFG/SFG
BA44
BA45 BA1
BA2BA3a
BA3bhlP1hlP2
PFPFcmPFmPFop
PFt PGaPGp
OP1OP4
BA4aBA4p
Hca-Hst
Hca-Hm
Figure 6 (right): Relative contribution to the total number of sVx in the brain. Areas OP2-3 are omitted because they contained less than 5 sVx. Each pie represents the total average number of sVx in the brain and each slice the proportion of total sVx contributed by a par-ticular area (left and right hemisphere combined).

54
Chapter 5
Discussion
With this paper, we aim to provide an unbiased description of the ar-eas that are involved both in observation and execution of actions. Fully aware that not all these areas might contain mirror neurons we use the term ‘shared voxels’ to reflect the duality of the activation without imply-ing the necessary existence of mirror neurons in these voxels. We used unsmoothed data and single subject analyses to examine whether the overlaps between action observation and execution found in previous studies were not simply an effect of smoothing data and pooling multiple subjects as suggested by Morrison and Downing (Morrison and Downing, in press). In addition, we examined how consistent these sVx are between subjects. Finally, we took advantage of the cytoarchitectonic maps (Geyer and others, 1996; Amunts and others, 1999; Geyer and others, 1999; Gey-er and others, 2000; Grefkes and others, 2001; Geyer, 2003; Eickhoff and others, 2005; Caspers and others, 2006; Choi and others, 2006; Eickhoff and others, 2006a) to introduce a more detailed and comparable descrip-tion of the area contributing to sVx.
Our results indicate that sVx can be clearly identified in all 16 single subjects even using unsmoothed data. This was true whether the contrast Hca-Hst or Hca-Hm was used to define voxels responding to the sight of actions. In general the sVx were not observed at the border between larger, distinct areas responding exclusively to action observation or ex-ecution, but as islands within areas responding to execution or obser-vation. For the case of actions we can therefore state that the overlaps
found in the group reflect sVx in the single subjects, confirming that the actions of other individuals reliably recruit parts of the voxels involved in executing similar actions even at the level of individual participants. This result is important, as the seminal examination of overlaps for the case of pain (Morrison and Downing, in press) has undermined the credibility of group analysis considered alone. A notable difference between Morrison and Downing’s and our experiment lies in the choice of statistical criteria for defining sVx. While they used relatively lenient thresholds of p<0.05 both at the group and single subject level, we used a criteria of p<0.001 at both levels. It may be that group analysis using stricter criteria reflect the situation in individual subjects more closely, as suggested by the striking similarity between the results of our single subject analysis and a tradi-tional random effect analysis (Figure 2).
Our results advance our understanding of the localization of shared circuits for action execution and observation in two ways. First, our re-sults confirm that the ventral premotor cortex and the inferior parietal lobe, known to contain mirror neurons in monkeys, show sVx in humans. Second, our results indicate that these ‘classic’ mirror neuron areas con-tribute only about 15% of the total number of sVx, indicating the urgent need to examine whether other brain areas may also contain mirror neu-rons. The main contributors towards the remaining 85% of the sVx were in rostro-caudal order: dorsal premotor, supplementary motor, superior parietal, temporal, primary and secondary somatosensory, dorsal middle
MaxCAmovR L in M1M1
-Hst -Hm -Hca-(Hca-Hst) -(Hca-Hm)
M1
y= -19
cross position: x= -48, y= -19, z= 76
MaxCAmovR L in M1
t-values
nr of subjects0 10
Lefthem.
Righthem.
Figure 7: Deactivations of the primary motor cortex. Top 2 rows: voxels showing a reduction of BOLD in the contrasts Hca-Hst, Hca-Hm or in the conditions Hst, Hm or Hca (latter 3 com-pared to baseline). Results have been masked using the motor execution mask as indicated in the text and only voxels where at least 3 subjects showed deactivations are shown (p<0.025 corrected). Outlines in the renders and coronal sections always represent the borders of area M1 (colors chosen for best visibility). Bottom row: location of M1 (4a and 4p) in red (left render and left coronal section) and the activations during hand execution that fell in M1 in hot colors (right render and right coronal, random effect, p<0.001, k≥10, t>3.73). The red cross is placed in the same location on all coronal sections to show the correspondence between the peak of motor activation and the peak of visual deactivation. Coronal sections (taken at y=-19, as illustrated by the black line on the dorsal view of the renders) and renders are of the average T1.

Anatomy of the mirror neuron system
55
the intraparietal sulcus. They confirmed the absence of MNs in the pos-terior IPL, but describe a number of neurons in the anterior bank of the intraparietal sulcus that responded both during the monkey’s own move-ments and the observation of the movements of others. The presence of sVx in hIP1 and hIP2 in our study suggests the presence of voxels with similar properties in humans. Our study further indicates the presence of as many sVx in the superior parietal lobule as in the IPL. They were located both in the rostral and caudal SPL, encompassing putative BA5 and 7, both of which have been considered to associate visual, somato-sensory and motor information with connections that would enable them to be recruited both during motor execution and observation. Single cell recording in the SPL will be needed to specify whether the SPL contains mirror neurons and if so, what aspect of the actions may be represented in this area. Alternatively, the SPL could be involved in more general as-pects of information processing that are common to action execution and observation, such as processing the spatial relationships between hands and objects, directing attention and gaze towards them etc.
Temporal sVx
While in monkeys, the superior temporal sulcus is known to contain neurons responding to the sight of actions (Puce and Perrett, 2003; Key-sers and Perrett, 2004), it has so far not been shown to contain mirror neurons (Keysers and Perrett, 2004). In contrast, neurons in the STS re-sponding to the sight of movement in a particular direction often reduce their firing rate if this movement is caused by the monkeys own actions (Hietanen and Perrett, 1993, 1996). A motor or kinestitic signal thus ap-pears to reach the STS but as an inhibition of the sensory consequences of the monkey’s own actions. The presence of sVx in the present study confirms earlier findings of motor and visual modulation of this area (e.g. (Iacoboni and others, 2001; Gazzola and others, 2006) and may reflect the increase of firing rate during action observation and the metabolic activity of inhibitory synapses during motor execution as we have argued previously (Keysers and Perrett, 2004; Gazzola and others, 2006; Gazzola and others, 2007) or the existence of true mirror neurons in this area in humans (Iacoboni and others, 2001). Further single cell recordings will help dissociate these alternatives.
Somatosensory sVx
While some neuroimaging studies have reported somatosensory activa-tions during the observation of actions in humans (Avikainen and others, 2002; Rossi and others, 2002; Grezes and others, 2003; Hasson and others, 2004; Oouchida and others, 2004; Mottonen and others, 2005; Cross and others, 2006; Gazzola and others, 2006; Molnar-Szakacs and others, 2006; Gazzola and others, 2007) and monkeys (Raos and others, 2004), the so-matosensory areas are not generally considered to be part of the MNS and single neurons in SI and SII have so far, to our knowledge, not been recorded during both action observation and execution. In our study, both SI (Geyer and others, 1999; Geyer and others, 2000; Grefkes and others, 2001) and SII (Eickhoff and others, 2006a) contained consistent sVx. Since we have used unsmoothed single subject data, the substantial number of sVx in the somatosensory areas cannot reflect the blurring of more posterior parietal activations into the adjacent somatosensory areas. Indeed, in single subjects, the somatosensory and posterior pa-rietal sVx are often separate clusters. In addition, somatosensory areas contained the most consistent voxel of the brain for the contrast Hca-Hm. Within the primary somatosensory cortex, area BA2 contained the largest number of sVx, with each and every subject showing sVx in this region(Grefkes and others, 2001) and significantly more sVx in the left hemisphere. BA2 represents the highest stage of processing within the primary somatosensory cortex, showing many characteristics of an as-sociative area: BA2 contains the neurons with the largest receptive fields and the most complex selectivity of the primary somatosensory areas
cingulate cortices and cerebellum. In contrast to the fact the these areas seem to contribute substantially more sVx than the classic mirror areas, and the fact that they have been found to be activated in action execution and observation in several studies, they have either not been discussed at all or with unease, due to the lack of single cell primate data. We suggest that rather then unease these areas should evoke curiosity to determine their role in action understanding, in particular through the use of single cell recordings. We will briefly discuss the main sVx contributing areas below. For all of these areas, it is important to remember that sVx can but do not have to contain mirror neurons.
Premotor sVx
In the monkey, of the premotor areas, only the ventral premotor cortex has so far been shown to contain mirror neurons. In this study we identi-fied 3 consistent loci of sVx in the frontal lobe.
The first is located ventraly and encompasses ventral BA6 (Geyer, 2003) and BA44 (Amunts and others, 1999) but not BA45 (Amunts and others, 1999). This cluster, for the contrast Hca-Hm had significantly larg-er proportions of voxels showing sVx properties in the left hemisphere.
The second was located on the dorsolateral surface of the frontal lobe. According to the cytoarchitectonic maps of Geyer (Geyer, 2003), this dorsal cluster has to be divided into a caudal part that falls within BA6 and a rostral part that falls within the caudal aspects of the MFG/SFG. The rostral sector though remains caudal and dorsal relative to the location of human FEF (Amiez and others, 2006) and is thought to be part of the functionally defined dorsal premotor cortex controlling hand and arm actions (Amiez and others, 2006). According to (Talairach and Tournoux, 1988) even the MFG/SFG part of this cluster remains within the borders of BA6, and previous studies have therefore generally re-ferred to the entire cluster as falling within BA6 (Molnar-Szakacs and others, 2006). We would therefore tend to attribute this cluster to the dorsal premotor cortex.
The third cluster fell within the mesial wall, ranging in the anterior-posterior direction from -10 to +20, thus probably encompassing both preSMA and SMA proper. Neither the lateral dorsal premotor cortex nor the supplementary motor cortex show activations during the observation of simple grasping actions in macaque monkeys (Nelissen and others, 2005). The hand actions in our study were sequences of motor acts (e.g. reaching towards and grasping a tea bag, lifting it from a cup, resting it on a plate and retracting the hand), while the monkey imaging studies used simple grasping. It thus remains to be investigated whether dorsal premo-tor and supplementary motor cortex are only recruited if the sequences of actions of sufficient complexity are observed and executed (Schubotz and von Cramon, 2002, 2003) or whether dorsal premotor activations during action observation are specific to humans.
Posterior parietal sVx
In the monkey, within the parietal lobe, until recently, only the inferior parietal lobule had been investigated for the presence of mirror neurons (Fogassi and others, 2005). In that study, mirror neurons were found in the rostral (area PF) but not caudal (PG) aspect of the inferior parietal lobule. In the light of the recent cytoarchitectonic maps of the human IPL (Caspers and others, 2006) our current findings fully confirms this distinction: about 10 times as many sVx were found in the PF complex compared to the PG complex. In addition, while PF contains voxels that show sVx properties in up to 10 subjects, PG contained sVx in at most 4 subjects in any given voxel. In general, the PF complex contained more sVx in the left than the right hemisphere.
Very recently, Fujii and colleagues (Fujii and others, in press) have investigate the interaction of two monkeys while simultaneously record-ing from their parietal and premotor cortices. Their coverage of the pa-rietal lobe included posterior aspects of the IPL and the anterior bank of

56
Chapter 5
(Kaas, 1993; Ruiz and others, 1995; Bodegard and others, 2001; Grefkes and others, 2001). It has been shown to process more abstract features than other primary somatosensory areas (e.g. orientation, movement di-rection, tridimentionality) and to integrate information relating our pro-prioception to the external environment (Kaas, 1993; Ruiz and others, 1995; Bodegard and others, 2001). BA2 also has strong connection with the posterior parietal lobe (Kaas, 1993) that is known to contain mirror neurons. Within the parietal operculum the cytoarchitectonic subdivi-sion OP1 (Eickhoff and others, 2006a) contained the largest number of sVx. This subdivision is considered the human equivalent of the primate area SII proper (Eickhoff and others, 2006b), which is known to have dense reciprocal connections with the ventral premotor cortex (Matelli and others, 1986) where mirror neurons have been found in the monkey. Both SII/OP1 and SI have been shown to respond during the experience and the observation of touch (Keysers and others, 2004; Blakemore and others, 2005). Single cell recordings though will be required to examine if the shared voxels in somatosensory areas truly reflect an activation of a neural representation similar to that occurring during action execution or whether it may simply reflect less specific modulations of attention to the body. The importance of somatosensory areas in the processing of the ac-tions of other people receives support for the examination of a emotional facial expressions. Somatosensory areas have been shown to be activated both during the execution and the observation of facial expressions (van der Gaag et al., in press) and lesions in these areas have been shown to reduce the capacity of an observer to label the facial expressions of other individuals (Adolphs and others, 2000). The fact that somatosensory ar-eas have been reported less consistently than premotor and parietal areas in neuroimaging studies on the observation of actions may also relate to differences in salience of somatosensation in the stimuli. Our stimuli in-volved the manipulation of various objects with different somatosensory and kinesthetic properties, ranging from the placing of a wooden lid on a box to removing a hot tea bag from a cup. Previous studies have often used stimuli with less variable somatosensory consequences, and may thus have induced more adaptation in somatosensory areas and therefore less reliable augmentations of the BOLD signal. Considering the dense connections between motor and somatosensory areas (Matelli and oth-ers, 1986; Liepert and others, 2003) this data might suggest that while observing the actions of other individuals, the brain transforms observed actions not only in the motor programs the observer would use to per-form a similar action, but also into the somatosensory representations of what it would feel like to perform a similar action (Keysers and Gazzola, 2006). Given that area 2 represents the position and movement of the limbs together with shape properties of the objects with which the hand interacts (Kaas, 1993; Ruiz and others, 1995; Bodegard and others, 2001), activations of this area during action observation and execution suggests that the brain of the observer shares the neural representation of both the proprioceptive aspects of the observed hand actions (what it would feel like to move the arm and hand in that way) and the tactile sensations of the observed object in the hand.
Combining the idea of motor and somatosensory simulation (Key-sers and Gazzola, 2006) bridges the gap between theories that privilege the motor components of simulation (Rizzolatti and Craighero, 2004) and those that privilege somatosensory components (Damasio, 1994). While several studies found somatosensory activations during the observation of actions, these findings have so far been generally ignored in reviews and discussions. We hope that the consistency of our single subject find-ings in somatosensory areas will contribute to change this peculiar situ-ation.
Primary motor sVx
While MEG and TMS studies have suggested that M1 is activated dur-ing the observation of actions (e.g. (Hari and others, 1998; Nishitani and Hari, 2000; Stefan and others, 2005) and 2DG autoradiography has dem-
onstrated that even monkeys show increased metabolism in M1 during action observation (Raos and others, 2004), only very few fMRI studies have reported M1 activations in humans(Cross and others, 2006). Indeed, our group analysis using smoothed data has reported significant reduc-tions in BOLD signal within M1 during action observation (Gazzola and others, 2007). Here we found a number of sVx activated during the vision of actions within M1, but they were located at the fringe of clusters that were clearly centered outside of M1, at the borders with S1 caudally and the MCC medially. Unlike OP1 for instance, that contributed a compara-ble number of sVx, the location of the primary motor sVx varied substan-tially from subjects to subjects. The highest number of subjects showing sVx in any given voxel in M1 was 4 and this peak overlap was found in the medial wall, forming a single cluster with the larger (~200 voxels) and more consistent sVx (peak voxel 9/16 subjects) in the MCC. This me-dial location would link the activations in M1 to the foot representation, which makes very little sense given the fact that subjects did not use their feet nor see the feet of other individuals in this part of the experiment. This lack of spatially consistent activations explains why random effect analyses of group data often fail to find significant M1 activations and raises the question of whether our M1 activations reflect false positives errors in the fMRI data.
In contrast, we found consistent voxels showing deactivations in M1 while subjects viewed hand actions, and these deactivated voxels were more numerous and more consistent for the hand actions compared to the control conditions. The location of these deactivations was consistent with the peak activation during hand action execution. This suggests, in accord with our group data (Gazzola and others, 2007), that the hand representation of M1 is selectively deactivated during the observation of hand actions. This selective deactivation could explain why, despite premotor and parietal activations, subjects usually do not spontaneously imitate the actions they observe. Overall, our data therefore suggest that M1 mainly shows a reduction of BOLD signal during action observation. The interpretation of BOLD signal reductions is problematic, as they can but do not have to reflect a reduction in neural activity within a particular region (Logothetis, 2003; Shmuel and others, 2006). The contrast between our result and those showing evidence for increased signal in this region (MEG: (Hari and others, 1998; Nishitani and Hari, 2000); 2DG: (Raos and others, 2004) ) further complicates the interpretation of our results.
An important question also regards the origin of such a poten-tial inhibition of M1. The SMA and MCC of the monkey has been shown to contain cells that modulate their activity depending on whether it is appropriate to execute an action in a particular context (Rizzolatti and others, 1990). The SMA and MCC also have connections with both the premotor and primary motor areas involved in the action execution, plac-ing it in privileged position to exert the modulatory influence that would be necessary to decouple M1 from the premotor cortex during action observation in order to avoiding the often inappropriate overt imitation of all observed actions.
Middle Cingulate Cortex
Due to the current lack of probabilistic cytoarchitectonic maps of the cin-gulate cortex and the variability of criteria used in the literature to deter-mine the borders between the MCC and other divisions of the cingulate cortex, it is difficult to determine where the middle cingulate cortex ends and the posterior cingulate cortex starts. We have therefore decided not to count the number of sVx in the MCC. Nevertheless, bilateral clusters of consistent sVx clearly fell in the ventral bank of the cingulate sulcus, at locations that place them within putative region 24dv (Vogt and Vogt, 2003) of the dorsal MCC. This sector of the MCC has dense reciprocal connections with the IPL and M1 (Vogt and Vogt, 2003) and controls the hand and arm in the monkey (Rizzolatti and others, 1990; Rizzolatti and others, 1996). In the monkey, this region seems to be involved in

Anatomy of the mirror neuron system
57
inhibiting potential actions if they are inappropriate (Rizzolatti and oth-ers, 1990; Rizzolatti and others, 1996). The presence of sVx in this region suggests that it also plays a role during action observation, and one might speculate that through its dense connections with M1, this region may be the source of our M1 BOLD reduction during action observation, thereby preventing the inappropriate imitation of observed actions.
Cerebellar sVx
A very significant proportions of the total number of sVx were found in the cerebellum. These sVx were found bilaterally in the lateral hemi-sphere of the cerebellum and in its sagital zone (vermis and intermediate cerebellum). Both set of sVx were located in the vicinity of those found in other studies of finger movements (Dimitrova and others, 2006). Both the lateral hemisphere, and the intermediate cerebellum are involved in cer-ebello-cerebral motor control loops (Thach and others, 1992) that inte-grate motor commands with (visual) sensory feedback. The lateral hemi-spheres are reciprocally connected with the premotor, primary motor and parietal association cortex through the dentate nucleus and the thalamus (Thach and others, 1992) and are particularly involved in the planning of actions. The intermediate cerebellar cortex also receives visual and motor input, but appears to be involved in a more automatic control of ongoing movement (Thach and others, 1992). Although the cerebellum has been reported to be recruited during action execution and observa-tion (Leslie and others, 2004; Calvo-Merino and others, 2006; Jackson and others, 2006; Gazzola and others, 2007), it has so far received very little attention in the MNS literature. This is somewhat surprising con-sidering the substantial attention it receives in the context of visuo-motor integration during motor control: both the sagittal and lateral cerebel-lum are thought to transform motor commands into expected sensory consequences (Desmurget and Grafton, 2000) and compare these with incoming sensory input to detect discrepancies and correct motor errors. The mirror system also integrates motor commands and visual input, and one might speculate that in the case of our experiment, activation dur-ing motor execution could thus primarily represent the forward model function of the cerebellum (Desmurget and Grafton, 2000), transforming motor commands into expected (visual) consequences. During action ob-servation, the sight of the hand actions of another individual might enter the same region of the cerebellum through the route normally devoted to the visual feedback of ones own hand actions. We hope that our data will further encourage the investigation of single neurons during action observation and execution in this structure and promote the inclusion of this structure in reviews of the neural substrates of action observation.
Lateralisation of sVx
SVx were reliably found both in the right and the left hemisphere of all our subjects, but for a number of cytoarchitectonic areas, sVx were more numerous in the left compared to the right hemisphere even after cor-recting for size differences between the areas in the two hemispheres: BA44, BA6, BA2 and the PF complex. There was only a single area for which sVx were more numerous in the right hemisphere (hIP2) compared to the left. Although a number of studies have reported stronger activa-tions in the left hemisphere of the human MNS during the observation of hand object interactions (Grafton and others, 1996; Decety and oth-ers, 1997; Hamilton and Grafton, 2006) our finding is, to our knowledge, the first quantitative demonstration of lateralization within the shared circuit for actions in humans. Left lateralization in the MNS is not sur-prising: all our movies contained right hand actions, and for the majority of individuals, including our participants, the hand actions seen in our stimuli would be performed with the right hand. A stronger involvement of the contralateral left hemisphere may then be a natural consequence of right hand prevalence. Indeed, there is evidence that the observation of right hand actions activates the left hemisphere and facilitates right
hand evoked muscle potentials, while the opposite is true for the vision of left hand actions (Aziz-Zadeh and others, 2002; Aziz-Zadeh and others, 2006). Also Fujii and colleagues found that, in the left premotor cortex of their monkeys, more neurons responded to movements of the right but not the left arm of the observed monkey than neurons showing the opposite preference (Fujii and others, in press). Given that monkeys do not have the population asymmetry for right-handedness that humans have, the prevalence of right hand representation in the left premotor cortex suggests that the premotor mirror system prevalently represents movements of the contralateral hand, in agreement with the human stud-ies. In contrast, in the anterior interparietal sulcus, they found as many neurons responding more to contralateral hand actions as neurons re-sponding more to ipsilateral hand actions, rendering our observation of slightly more numerous sVx in the right hIP2 less puzzling. It should be noted, that our lateralized findings are unlikely to be due to a lateralized visual input: the right hand entered the scene as often from the right as the left side of the screen, providing symmetrical visual input. Given that we live in a world in which most people are right handed, processing other individual’s action predominantly in the left hemisphere might be more economical than duplicating this processing in both hemispheres. Language may then be left lateralized because it is functionally related to a left lateralized mirror neuron system (Aziz-Zadeh and others, 2004; Rizzolatti and Craighero, 2004; Gazzola and others, 2006). Interestingly, lateralization within shared circuits is even more pronounced for the case of the sound of actions (Aziz-Zadeh and others, 2004; Gazzola and oth-ers, 2006).
General conclusion
By using unsmoothed data of 16 subjects analyzed separately during the observation and execution of hand actions, we confirm the presence of shared voxels in humans in brain areas known to contain mirror neu-rons in monkeys (ventral premotor cortex and rostral inferior parietal lobule) and provide evidence for shared voxels in other brain areas not yet examined in monkeys for the presence of mirror neurons, namely the dorsal premotor cortex, the supplementary motor areas, the somatosen-sory cortices, the cerebellum, the superior parietal lobule and the dorsal middle cingulate cortex . In all these areas, using methods that mini-mize the risk of finding overlaps between execution and observation by chance, we found reliable evidence for the fact that within the volume of a single functional voxel (27mm3) the BOLD signal was augmented both while observing hand actions (be it compared against a static baseline or a control movement) and while executing similar actions. In all of these regions, voxels showing these properties were found in the same location in more of our single subjects than would be expected by change. This finding by itself is no demonstration for the presence of mirror neurons in any of these brain areas: voxel contain millions of neurons, and in-creases of BOLD signal during action observation and execution could be the result of (a) separate populations of neurons responding exclu-sively during action observation or execution or (b) neurons responding similarly during action observation and execution or (c) a combination or both. Nevertheless, the present finding contributes to strengthening the evidence in favor of the existence of motor and somatosensory simulation during action observation. By localizing shared voxels using cytoarchi-tectonic maps and quantifying the consistency of the finding in individual subjects, we hope that the present study will stimulate single cell record-ings in at least the somatosensory, dorsal premotor, supplementary mo-tor and cerebellar regions during both action execution and observation in order to investigate the neural basis for shared activations in these areas and help investigate if mirror neurons are the basis of these shared activations. In addition, such single cell recordings would help address the important question of what is shared between execution and obser-vation in these brain areas: Is it a selective and detailed description of the motor plan and its somatosensory consequences as suggested by the

58
Chapter 5
original findings on mirror neurons in premotor and parietal areas, or a less detailed ‘priming’ of somatosensory and motor processes potentially relating to attention or imagination? Finally, we hope that this study will pave the way to a more general use of single subject data analysis within the investigation of simulation theories of social cognition.
Acknowledgement:
VG planed the functional study, conducted the experiments, analyzed the data and wrote the paper. CK helped at all stages. SC provided the cyto-architectonic maps for the IPL. The functional work was supported by an N.W.O. VIDI and a Marie Curie Excellence Grant to CK. We thank S. Eickhoff, and S. Geyer for the cytoarchitectonic maps; Anita Kuiper for help with scanning and our subjects for being willing to be scanned mul-tiple times. We thank L. Cerliani for useful comments on the manuscript. The cytoarchitectonic description of the IPL is funded by the National Institute of Biomedical Imaging and Bioengineering, the National Insti-tute of Neurological Disorders and Stroke, and the National Institute of Mental Health. Further support by the BMBF (BMBF 01GO0104), Brain Imaging Center West (BMBF 01GO0204) is gratefully acknowledged.
Reference ListAdolphs R, Damasio H, Tranel D, Cooper G, Damasio AR (2000) A role for somatosensory
cortices in the visual recognition of emotion as revealed by three-dimensional lesion mapping. J Neurosci 20: 2683-2690.
Amiez C, Kostopoulos P, Champod AS, Petrides M (2006) Local morphology predicts functional organization of the dorsal premotor region in the human brain. J Neurosci 26: 2724-2731.
Amunts K, Schleicher A, Burgel U, Mohlberg H, Uylings HB, Zilles K (1999) Broca’s region revisited: cytoarchitecture and intersubject variability. J Comp Neurol 412: 319-341.
Avikainen S, Forss N, Hari R (2002) Modulated activation of the human SI and SII cortices during observation of hand actions. Neuroimage 15: 640-646.
Aziz-Zadeh L, Iacoboni M, Zaidel E, Wilson S, Mazziotta J (2004) Left hemisphere motor facilitation in response to manual action sounds. Eur J Neurosci 19: 2609-2612.
Aziz-Zadeh L, Koski L, Zaidel E, Mazziotta J, Iacoboni M (2006) Lateralization of the human mirror neuron system. J Neurosci 26: 2964-2970.
Aziz-Zadeh L, Maeda F, Zaidel E, Mazziotta J, Iacoboni M (2002) Lateralization in motor facilitation during action observation: a TMS study. Exp Brain Res 144: 127-131.
Bangert M, Peschel T, Schlaug G, Rotte M, Drescher D, Hinrichs H, Heinze HJ, Altenmuller E (2005) Shared networks for auditory and motor processing in professional pianists: Evidence from fMRI conjunction. Neuroimage.
Blakemore SJ, Bristow D, Bird G, Frith C, Ward J (2005) Somatosensory activations during the observation of touch and a case of vision-touch synaesthesia. Brain 128: 1571-1583.
Bodegard A, Geyer S, Grefkes C, Zilles K, Roland PE (2001) Hierarchical processing of tactile shape in the human brain. Neuron 31: 317-328.
Borroni P, Montagna M, Cerri G, Baldissera F (2005) Cyclic time course of motor excitability modulation during the observation of a cyclic hand movement. Brain Res 1065: 115-124.
Botvinick M, Jha AP, Bylsma LM, Fabian SA, Solomon PE, Prkachin KM (2005) Viewing facial expressions of pain engages cortical areas involved in the direct experience of pain. Neuroimage 25: 312-319.
Buccino G, Binkofski F, Fink GR, Fadiga L, Fogassi L, Gallese V, Seitz RJ, Zilles K, Rizzolatti G, Freund HJ (2001) Action observation activates premotor and parietal areas in a somatotopic manner: an fMRI study. Eur J Neurosci 13: 400-404.
Buccino G, Lui F, Canessa N, Patteri I, Lagravinese G, Benuzzi F, Porro CA, Rizzolatti G (2004a) Neural circuits involved in the recognition of actions performed by nonconspecifics: an FMRI study. J Cogn Neurosci 16: 114-126.
Buccino G, Vogt S, Ritzl A, Fink GR, Zilles K, Freund HJ, Rizzolatti G (2004b) Neural circuits underlying imitation learning of hand actions: an event-related fMRI study. Neuron 42: 323-334.
Calvo-Merino B, Glaser DE, Grezes J, Passingham RE, Haggard P (2005) Action observation and acquired motor skills: an FMRI study with expert dancers. Cereb Cortex 15: 1243-1249.
Calvo-Merino B, Grezes J, Glaser DE, Passingham RE, Haggard P (2006) Seeing or doing? Influence of visual and motor familiarity in action observation. Curr Biol 16: 1905-1910.
Caspers S, Geyer S, Schleicher A, Mohlberg H, Amunts K, Zilles K (2006) The human inferior parietal cortex: cytoarchitectonic parcellation and interindividual variability. Neuroimage 33: 430-448.
Choi HJ, Zilles K, Mohlberg H, Schleicher A, Fink GR, Armstrong E, Amunts K (2006) Cytoarchitectonic identification and probabilistic mapping of two distinct areas within the anterior ventral bank of the human intraparietal sulcus. J Comp Neurol 495: 53-69.
Cross ES, Hamilton AF, Grafton ST (2006) Building a motor simulation de novo: observation of dance by dancers. Neuroimage 31: 1257-1267.
Damasio (1994) Descartes’ Error: Emotion, Reason, and the Human Brain. New York: Avon Books.
Dapretto M, Davies MS, Pfeifer JH, Scott AA, Sigman M, Bookheimer SY, Iacoboni M (2006) Understanding emotions in others: mirror neuron dysfunction in children with autism spectrum disorders. Nat Neurosci 9: 28-30.
Decety J, Grezes J, Costes N, Perani D, Jeannerod M, Procyk E, Grassi F, Fazio F (1997) Brain activity during observation of actions. Influence of action content and subject’s strategy. Brain 120 (Pt 10): 1763.
Desmurget M, Grafton S (2000) Forward modeling allows feedback control for fast reaching movements. Trends Cogn Sci 4: 423-431.
di Pellegrino G, Fadiga L, Fogassi L, Gallese V, Rizzolatti G (1992) Understanding motor events: a
neurophysiological study. Exp Brain Res 91: 176-180.Dimitrova A, de Greiff A, Schoch B, Gerwig M, Frings M, Gizewski ER, Timmann D (2006)
Activation of cerebellar nuclei comparing finger, foot and tongue movements as revealed by fMRI. Brain Res Bull 71: 233-241.
Eickhoff SB, Amunts K, Mohlberg H, Zilles K (2006a) The human parietal operculum. II. Stereotaxic maps and correlation with functional imaging results. Cereb Cortex 16: 268-279.
Eickhoff SB, Grefkes C, Zilles K, Fink GR (2006b) The Somatotopic Organization of Cytoarchitectonic Areas on the Human Parietal Operculum. Cereb Cortex.
Eickhoff SB, Stephan KE, Mohlberg H, Grefkes C, Fink GR, Amunts K, Zilles K (2005) A new SPM toolbox for combining probabilistic cytoarchitectonic maps and functional imaging data. Neuroimage 25: 1325-1335.
Fadiga L, Craighero L, Buccino G, Rizzolatti G (2002) Speech listening specifically modulates the excitability of tongue muscles: a TMS study. Eur J Neurosci 15: 399-402.
Fadiga L, Fogassi L, Pavesi G, Rizzolatti G (1995) Motor facilitation during action observation: a magnetic stimulation study. J Neurophysiol 73: 2608-2611.
Fogassi L, Ferrari PF, Gesierich B, Rozzi S, Chersi F, Rizzolatti G (2005) Parietal lobe: from action organization to intention understanding. Science 308: 662-667.
Fujii N, Hihara S, Iriki A (in press) Social cognition in premotor and parietal cortex. Social Neuroscience.
Gallese V, Fadiga L, Fogassi L, Rizzolatti G (1996) Action recognition in the premotor cortex. Brain 119 (Pt 2): 593-609.
Gangitano M, Mottaghy FM, Pascual-Leone A (2001) Phase-specific modulation of cortical motor output during movement observation. Neuroreport 12: 1489-1492.
Gazzola V, Aziz-Zadeh L, Keysers C (2006) Empathy and the Somatotopic Auditory Mirror System in Human. Current Biology 16: 1824-1829.
Gazzola V, Rizzolatti G, Wicker B, Keysers C (2007) The anthropomorphic brain: The mirror neuron system responds to human and robotic actions. Neuroimage.
Geyer S (2003) The Microstructural Border Between the Motor and the Cognitive Domain in the Human Cerebral Cortex. Wien: Springer.
Geyer S, Ledberg A, Schleicher A, Kinomura S, Schormann T, Burgel U, Klingberg T, Larsson J, Zilles K, Roland PE (1996) Two different areas within the primary motor cortex of man. Nature 382: 805-807.
Geyer S, Schleicher A, Zilles K (1999) Areas 3a, 3b, and 1 of human primary somatosensory cortex. Neuroimage 10: 63-83.
Geyer S, Schormann T, Mohlberg H, Zilles K (2000) Areas 3a, 3b, and 1 of human primary somatosensory cortex. Part 2. Spatial normalization to standard anatomical space. Neuroimage 11: 684-696.
Grafton ST, Arbib MA, Fadiga L, Rizzolatti G (1996) Localization of grasp representations in humans by positron emission tomography. 2. Observation compared with imagination. Exp Brain Res 112: 103-111.
Grefkes C, Geyer S, Schormann T, Roland P, Zilles K (2001) Human somatosensory area 2: observer-independent cytoarchitectonic mapping, interindividual variability, and population map. Neuroimage 14: 617-631.
Grezes J, Armony JL, Rowe J, Passingham RE (2003) Activations related to “mirror” and “canonical” neurones in the human brain: an fMRI study. Neuroimage 18: 928-937.
Hamilton AF, Grafton ST (2006) Goal representation in human anterior intraparietal sulcus. J Neurosci 26: 1133-1137.
Hari R, Forss N, Avikainen S, Kirveskari E, Salenius S, Rizzolatti G (1998) Activation of human primary motor cortex during action observation: a neuromagnetic study. Proc Natl Acad Sci U S A 95: 15061-15065.
Hasson U, Nir Y, Levy I, Fuhrmann G, Malach R (2004) Intersubject synchronization of cortical activity during natural vision. Science 303: 1634-1640.
Heiser M, Iacoboni M, Maeda F, Marcus J, Mazziotta JC (2003) The essential role of Broca’s area in imitation. Eur J Neurosci 17: 1123-1128.
Hietanen JK, Perrett DI (1993) Motion sensitive cells in the macaque superior temporal polysensory area. I. Lack of response to the sight of the animal’s own limb movement. Exp Brain Res 93: 117-128.
Hietanen JK, Perrett DI (1996) Motion sensitive cells in the macaque superior temporal polysensory area: response discrimination between self-generated and externally generated pattern motion. Behav Brain Res 76: 155-167.
Iacoboni M, Koski LM, Brass M, Bekkering H, Woods RP, Dubeau MC, Mazziotta JC, Rizzolatti G (2001) Reafferent copies of imitated actions in the right superior temporal cortex. Proc Natl Acad Sci U S A 98: 13995-13999.
Iacoboni M, Molnar-Szakacs I, Gallese V, Buccino G, Mazziotta JC, Rizzolatti G (2005) Grasping the intentions of others with one’s own mirror neuron system. PLoS Biol 3: e79.
Iacoboni M, Woods RP, Brass M, Bekkering H, Mazziotta JC, Rizzolatti G (1999) Cortical mechanisms of human imitation. Science 286: 2526-2528.
Jackson PL, Meltzoff AN, Decety J (2005) How do we perceive the pain of others? A window into the neural processes involved in empathy. Neuroimage 24: 771-779.
Jackson PL, Meltzoff AN, Decety J (2006) Neural circuits involved in imitation and perspective-taking. Neuroimage 31: 429-439.
Kaas JH (1993) The functional organization of somatosensory cortex in primates. Ann Anat 175: 509-518.
Keysers C, Gazzola V (2006) Towards a unifying neural theory of social cognition. Progress in Brain Research 156: 383-406.
Keysers C, Kohler E, Umilta MA, Nanetti L, Fogassi L, Gallese V (2003) Audiovisual mirror neurons and action recognition. Exp Brain Res 153: 628-636.
Keysers C, Perrett DI (2004) Demystifying social cognition: a Hebbian perspective. Trends Cogn Sci 8: 501-507.
Keysers C, Wicker B, Gazzola V, Anton JL, Fogassi L, Gallese V (2004) A touching sight: SII/PV activation during the observation and experience of touch. Neuron 42: 335-346.
Kohler E, Keysers C, Umilta MA, Fogassi L, Gallese V, Rizzolatti G (2002) Hearing sounds, understanding actions: action representation in mirror neurons. Science 297: 846-848.
Leslie KR, Johnson-Frey SH, Grafton ST (2004) Functional imaging of face and hand imitation: towards a motor theory of empathy. Neuroimage 21: 601-607.
Liepert J, Gorsler A, van Eimeren T, Munchau A, Weiller C (2003) Motor excitability in a patient with a somatosensory cortex lesion. Clin Neurophysiol 114: 1003-1008.
Logothetis NK (2003) The underpinnings of the BOLD functional magnetic resonance imaging signal. J Neurosci 23: 3963-3971.
Matelli M, Camarda R, Glickstein M, Rizzolatti G (1986) Afferent and efferent projections of the inferior area 6 in the macaque monkey. J Comp Neurol 251: 281-298.
Molnar-Szakacs I, Iacoboni M, Koski L, Mazziotta JC (2005) Functional segregation within pars opercularis of the inferior frontal gyrus: evidence from fMRI studies of imitation and action observation. Cereb Cortex 15: 986-994.
Molnar-Szakacs I, Kaplan J, Greenfield PM, Iacoboni M (2006) Observing complex action sequences: The role of the fronto-parietal mirror neuron system. Neuroimage 33: 923-935.

Anatomy of the mirror neuron system
59
Montagna M, Cerri G, Borroni P, Baldissera F (2005) Excitability changes in human corticospinal projections to muscles moving hand and fingers while viewing a reaching and grasping action. Eur J Neurosci 22: 1513-1520.
Morrison I, Downing P (in press) Organization of felt and seen pain responses in anterior cingulate cortex. Neuroimage.
Mottonen R, Jarvelainen J, Sams M, Hari R (2005) Viewing speech modulates activity in the left SI mouth cortex. Neuroimage 24: 731-737.
Nelissen K, Luppino G, Vanduffel W, Rizzolatti G, Orban GA (2005) Observing others: multiple action representation in the frontal lobe. Science 310: 332-336.
Nichols T, Brett M, Andersson J, Wager T, Poline JB (2005) Valid conjunction inference with the minimum statistic. Neuroimage 25: 653-660.
Nishitani N, Hari R (2000) Temporal dynamics of cortical representation for action. 97: 913.Oouchida Y, Okada T, Nakashima T, Matsumura M, Sadato N, Naito E (2004) Your hand
movements in my somatosensory cortex: a visuo-kinesthetic function in human area 2. Neuroreport 15: 2019-2023.
Puce A, Perrett D (2003) Electrophysiology and brain imaging of biological motion. Philos Trans R Soc Lond B Biol Sci 358: 435-445.
Raos V, Evangeliou MN, Savaki HE (2004) Observation of action: grasping with the mind’s hand. Neuroimage 23: 193-201.
Rizzolatti G, Craighero L (2004) The mirror-neuron system. Annu Rev Neurosci 27: 169-192.Rizzolatti G, Gentilucci M, Camarda RM, Gallese V, Luppino G, Matelli M, Fogassi L (1990)
Neurons related to reaching-grasping arm movements in the rostral part of area 6 (area 6a beta). Exp Brain Res 82: 337-350.
Rizzolatti G, Luppino G, Matelli M (1996) The classic supplementary motor area is formed by two independent areas. Adv Neurol 70: 45-56.
Rossi S, Tecchio F, Pasqualetti P, Ulivelli M, Pizzella V, Romani GL, Passero S, Battistini N, Rossini PM (2002) Somatosensory processing during movement observation in humans. Clin Neurophysiol 113: 16-24.
Ruiz S, Crespo P, Romo R (1995) Representation of moving tactile stimuli in the somatic sensory cortex of awake monkeys. J Neurophysiol 73: 525-537.
Schubotz RI, von Cramon DY (2002) A blueprint for target motion: fMRI reveals perceived sequential complexity to modulate premotor cortex. Neuroimage 16: 920-935.
Schubotz RI, von Cramon DY (2003) Functional-anatomical concepts of human premotor cortex: evidence from fMRI and PET studies. Neuroimage 20 Suppl 1: S120-131.
Shmuel A, Augath M, Oeltermann A, Logothetis NK (2006) Negative functional MRI response correlates with decreases in neuronal activity in monkey visual area V1. Nat Neurosci 9: 569-577.
Singer T, Seymour B, O’Doherty J, Kaube H, Dolan RJ, Frith CD (2004) Empathy for pain involves the affective but not sensory components of pain. Science 303: 1157-1162.
Stefan K, Cohen LG, Duque J, Mazzocchio R, Celnik P, Sawaki L, Ungerleider L, Classen J (2005) Formation of a motor memory by action observation. J Neurosci 25: 9339-9346.
Talairach J, Tournoux P (1988) Co-planar stereotaxic atlas of the human brain. New York: Thieme.
Thach WT, Goodkin HP, Keating JG (1992) The cerebellum and the adaptive coordination of movement. Annu Rev Neurosci 15: 403-442.
Vogt BA, Vogt L (2003) Cytology of human dorsal midcingulate and supplementary motor cortices. J Chem Neuroanat 26: 301-309.
0.1 0.1-0.2-0.1 0-0.1 0.1 0.1 0.9 0.7 1 0.8 0.6 0.8 0.9 1
0.9 0.8 1 0.8 0.9 0.8 0.9 1 0.1 0.2-0.1-0.1 0.1-0.1 0.1-0.1
Observation Execution
subj
grou
p1 (S
B1)
subj
grou
p2 (S
B2)Gr
oup
SB1 SB2 Group
colle
cted
val
ues
average s.e.m.Observation
SB1SB2Group
0.0420.050.16
average s.e.m.Execution
0.890.0120.45
0.030.040.16
t-test vs 00.5
3.2*10-7
0.001
t-test vs 05.79*10-9
0.390.0007
ba
c0
0.840.42
1
0.8
0.6
0.4
0.2
0
-0.2
Supplementary Figure 1: The problem of group analyses and the MNS. In certain cases, a voxel can appear to be significantly involved in action observation and action execution only because the analysis pools subjects for which the voxel is only involved in action observa-tion with subjects for which it is only involved in action execution. a) A hypothetical set of parameter estimates for a given voxel in two conditions (observation and execution) for 16 subjects. For the first 8 subjects, parameter estimates are around 0 for observation and around 1 for execution (subgroup 1). For the other 8 subjects the reverse is true. b) Average (±s.e.m.) parameter estimate during action observation (blue) and action execution (bor-deaux) for the two subgroups and the entire group of 16 subjects. c) Statistic table showing that subgroup 1 significantly activates this voxel during execution but not observation, and vice versa for subgroup 2. For neither of the subjects or groups does the voxel thus respond significantly (according to the t-test on parameter estimates used in traditional random effect group analysis). Nevertheless, if the entire group is considered, the voxel would be considered to be significantly involved both in action execution and observation.
Supplemental Material
Table S1
Hca-Hm
2053
11 -28 -46 54 L BA2 Inferior Parietal Lobule
8 -34 -36 62 L BA2 Postcentral Gyrus
-30 -56 58 L Superior Parietal Lobule
-34 -38 54 L BA2 Postcentral Gyrus
-56 -24 38 L IPC(PFt Inferior Parietal Lobule
7 -22 -50 70 L Superior Parietal Lobule
-54 -26 44 L BA2 Inferior Parietal Lobule
6 -16 -52 70 L BA1 Superior Parietal Lobule
-32 -40 66 L Postcentral Gyrus
-24 -58 64 L Superior Parietal Lobule
-22 -62 64 L Superior Parietal Lobule
5 -4 -58 64 L Precuneus
-18 -54 60 L Superior Parietal Lobule
-20 -56 58 L Superior Parietal Lobule
-36 -30 40 L BA3a Postcentral Gyrus
-36 -34 40 L Postcentral Gyrus
-40 -30 36 L IPC(PFt) Inferior Parietal Lobule
-62 -24 26 L IPC(PFop SupraMarginal Gyrus
4 -20 -44 62 L BA2 Superior Parietal Lobule
-22 -48 56 L BA2 Postcentral Gyrus
-44 -34 46 L BA2 Postcentral Gyrus
-52 -34 44 L IPC(PF Inferior Parietal Lobule
1010
8 24 -54 70 R Superior Parietal Lobule
28 -52 68 R Superior Parietal Lobule
42 -38 60 R BA1 Postcentral Gyrus
42 -32 50 R BA2 Postcentral Gyrus
7 42 -46 64 R Superior Parietal Lobule
28 -52 64 R Superior Parietal Lobule
6 24 -52 74 R Superior Parietal Lobule
24 -58 66 R Superior Parietal Lobule
44 -40 64 R BA1 Postcentral Gyrus
26 -56 64 R Superior Parietal Lobule
38 -40 56 R BA2 Inferior Parietal Lobule
34 -36 50 R BA2 Postcentral Gyrus
32 -32 48 R BA3a Postcentral Gyrus
48 -22 46 R BA2 Postcentral Gyrus
5 20 -60 70 R Superior Parietal Lobule
30 -46 66 R BA2 Postcentral Gyrus
36 -54 64 R Superior Parietal Lobule
28 -60 64 R Superior Parietal Lobule
36 -42 62 R BA1 Postcentral Gyrus
38 -32 60 R BA1 Postcentral Gyrus
34 -40 54 BA2 Postcentral Gyrus
4 14 -56 70 Superior Parietal Lobule
36 -38 68 BA1 Postcentral Gyrus
6 -54 64 Precuneus
8 -62 64 Precuneus
6 -52 60 R Precuneus

60
Chapter 5
492
6 -24 -6 70 L BA6 Superior Frontal Gyrus
5 -36 -10 62 L BA6 Precentral Gyrus
-16 -10 62 L BA6 SMA
4 -20 -16 72 L BA6 Precentral Gyrus
-26 -16 70 L BA6 Precentral Gyrus
-28 4 62 L Middle Frontal Gyrus
-40 -10 58 L BA6 Precentral Gyrus
-26 2 56 L Middle Frontal Gyrus
266
9 -48 -68 10 L Middle Temporal Gyrus
7 -54 -64 2 L Middle Temporal Gyrus
6 -48 -72 4 L Middle Occipital Gyrus
5 -46 -76 12 L Middle Occipital Gyrus
-50 -62 -4 L Middle Temporal Gyrus
-46 -66 -6 L Inferior Temporal Gyrus
4 -42 -72 12 L Middle Occipital Gyrus
-40 -62 6 L Middle Occipital Gyrus
194
5 -2 -16 48 L BA6 SMA
-2 -20 46 L BA6 Middle Cingulate Cortex
4 0 8 56 L SMA
0 6 48 L BA6 SMA
0 2 48 L BA6 SMA
4 2 44 R Middle Cingulate Cortex
-10 -20 42 L Middle Cingulate Cortex
-6 -24 42 L Middle Cingulate Cortex
189
6 30 -6 66 R BA6 Superior Frontal Gyrus
26 -10 58 R Superior Frontal Gyrus
5 28 -2 70 R Superior Frontal Gyrus
24 -4 70 R BA6 Superior Frontal Gyrus
34 -2 56 R Middle Frontal Gyrus
4 36 -8 70 R Superior Frontal Gyrus
38 -6 60 R Superior Frontal Gyrus
167
6 -22 -48 -20 L Cerebelum IV-V
-30 -46 -26 L Cerebelum VI
-28 -58 -26 L Cerebelum VI
5 -20 -60 -18 L Cerebelum VI
4 -16 -54 -16 L Cerebelum IV-V
-28 -42 -22 L Fusiform Gyrus
155
7 32 -48 -28 R Cerebelum VI
32 -52 -30 R Cerebelum VI
36 -52 -30 R Cerebelum VI
6 26 -52 -22 R Cerebelum VI
36 -42 -28 R Cerebelum VI
4 26 -66 -18 R Cerebelum VI
36 -54 -24 R Cerebelum VI
32 -42 -26 R Cerebelum VI
63
5 -50 10 38 L BA44 Precentral Gyrus
-52 14 24 L BA44 Inferior Frontal Gyrus
4 -56 10 24 L BA44 Inferior Frontal Gyrus
52
5 8 -78 -44 R Cerebelum VII
4 8 -74 -38 R Cerebelum Crus 2
40
5 -18 -76 48 L Superior Parietal Lobule
4 -8 -78 52 L Precuneus
32
4 -42 -78 18 L IPC(PGp Middle Occipital Gyrus
-42 -76 8 L Middle Occipital Gyrus
28
4 -20 -68 34 L Superior Occipital Gyrus
-22 -66 32 L Superior Occipital Gyrus
-22 -72 32 L Superior Occipital Gyrus
22
4 56 -62 8 R Middle Temporal Gyrus
52 -60 6 R Middle Temporal Gyrus
10
4 18 -26 42 R Middle Cingulate Cortex
Hca-Hst
4370
13 -30 -46 62 L SuperiorParietalLobule
12 -36 -44 58 L BA2 SuperiorParietalLobule
-32 -38 52 L BA2 PostcentralGyrus
11 -48 -28 40 L BA2 InferiorParietalLobule
10 -28 -46 54 L BA2 InferiorParietalLobule
-34 -34 48 L BA2 PostcentralGyrus
-42 -28 38 L BA2 InferiorParietalLobule
9 -34 -48 54 L BA2 InferiorParietalLobule
-52 -30 44 L BA2 InferiorParietalLobule
8 -34 -52 64 L SuperiorParietalLobule
-20 -52 60 L SuperiorParietalLobule
-32 -58 58 L SuperiorParietalLobule
-34 -56 56 L InferiorParietalLobule
-50 -32 50 L BA2 PostcentralGyrus
-36 -42 50 L InferiorParietalLobule
-52 -30 38 L IPC(PFt) InferiorParietalLobule
-48 -22 20 L OP1 RolandicOperculum
7 -16 -52 70 L SuperiorParietalLobule
-8 -56 70 L Precuneus
-34 -36 42 L PostcentralGyrus
-36 -34 40 L PostcentralGyrus
-56 -34 28 L IPC(PF) SupraMarginalGyrus
-52 -40 26 L SupraMarginalGyrus
-54 -24 24 L SupraMarginalGyrus
-46 -60 2 L MiddleTemporalGyrus
6 -26 -40 72 L BA1 PostcentralGyrus
-58 -32 36 L IPC(PF) SupraMarginalGyrus
-56 -16 34 L IPC(PFt) PostcentralGyrus
-50 -26 32 L IPC(PFt) SupraMarginalGyrus
-56 -16 30 L IPC(PFt) PostcentralGyrus
-60 -36 30 L IPC(PF) SupraMarginalGyrus
-44 -26 20 L OP1 RolandicOperculum
-56 -60 0 L MiddleTemporalGyrus
-54 -62 -4 L MiddleTemporalGyrus

Anatomy of the mirror neuron system
61
5 -24 -28 74 L PostcentralGyrus
-12 -52 70 L Precuneus
-20 -62 62 L SuperiorParietalLobule
-4 -62 60 L Precuneus
-56 -14 42 L BA1 PostcentralGyrus
-48 -34 24 L SupraMarginalGyrus
-52 -28 18 L OP1 SuperiorTemporalGyrus
-48 -72 16 L MiddleOccipitalGyrus
-44 -28 14 L OP1 RolandicOperculum
-58 -48 14 L SuperiorTemporalGyrus
-58 -52 14 L MiddleTemporalGyrus
-48 -52 8 L MiddleTemporalGyrus
-46 -62 -4 L MiddleTemporalGyrus
4 -10 -62 66 L Precuneus
-4 -66 64 L Precuneus
-26 -62 62 L SuperiorParietalLobule
-10 -64 56 L Precuneus
-36 -74 16 L MiddleOccipitalGyrus
-54 -24 12 L SuperiorTemporalGyrus
-46 -48 4 L MiddleTemporalGyrus
-38 -66 0 L MiddleOccipitalGyrus
2404
9 38 -36 60 R BA1 PostcentralGyrus
38 -42 60 R BA2 PostcentralGyrus
38 -38 56 R BA2 PostcentralGyrus
8 34 -50 68 R SuperiorParietalLobule
32 -56 64 R SuperiorParietalLobule
42 -40 56 R BA2 InferiorParietalLobule
46 -34 54 R BA2 PostcentralGyrus
60 -22 44 R BA2 PostcentralGyrus
54 -20 42 R BA2 PostcentralGyrus
50 -20 36 R BA3b PostcentralGyrus
7 34 -42 72 R BA1 PostcentralGyrus
30 -52 70 R SuperiorParietalLobule
36 -38 68 R BA1 PostcentralGyrus
34 -44 68 R BA1 PostcentralGyrus
36 -54 64 R SuperiorParietalLobule
42 -46 58 R SuperiorParietalLobule
38 -44 52 R BA2 InferiorParietalLobule
50 -22 46 R BA2 PostcentralGyrus
52 -18 44 R BA1 PostcentralGyrus
52 -16 34 R BA3b PostcentralGyrus
62 -30 22 R SuperiorTemporalGyrus
6 26 -52 72 R SuperiorParietalLobule
6 -58 64 R Precuneus
18 -56 62 R SuperiorParietalLobule
34 -48 60 R BA2 SuperiorParietalLobule
36 -52 58 R SuperiorParietalLobule
26 -56 58 R SuperiorParietalLobule
60 -22 36 R IPC(PFt) SupraMarginalGyrus
62 -30 34 R IPC(PF) SupraMarginalGyrus
64 -16 32 R BA1 PostcentralGyrus
5 26 -42 70 R BA1 PostcentralGyrus
2 -46 68 R BA3b PrecuneusAssigned
8 -56 60 R Precuneus
54 -28 58 R BA1 PostcentralGyrus
50 -30 58 R BA1 PostcentralGyrus
26 -46 58 R BA2 PostcentralGyrus
8 -48 56 R Precuneus
40 -50 56 R SuperiorParietalLobule
30 -52 56 R SuperiorParietalLobule
10 -56 56 R Precuneus
52 -24 52 R BA1 PostcentralGyrus
66 -24 26 R OP1 SupraMarginalGyrus
56 -34 26 R SupraMarginalGyrus
68 -26 24 R IPC(PF) SupraMarginalGyrus
56 -26 22 R RolandicOperculum
54 -28 20 R OP1 RolandicOperculum
66 -36 18 R IPC(PF) SuperiorTemporalGyrus
4 28 -42 76 R BA1 PostcentralGyrus
22 -48 76 R SuperiorParietalLobule
6 -54 70 R Precuneus
16 -66 64 R SuperiorParietalLobule
2 -50 58 R Precuneus
4 -54 58 R Precuneus
62 -26 42 R IPC(PF) SupraMarginalGyrus
44 -24 22 R OP1 RolandicOperculum
942
9 -28 -8 64 L BA6 SuperiorFrontalGyrus
7 -18 -10 66 L BA6 ParacentralLobule
-28 -8 50 L MiddleFrontalGyrus
5 -40 -12 56 L BA6 PrecentralGyrus
-42 -10 54 L BA6 PrecentralGyrus
4 -16 -10 74 L BA6 SuperiorFrontalGyrus
-12 2 72 L BA6 SuperiorFrontalGyrus
-8 2 72 L BA6 SMAAssigned
-16 6 70 L SuperiorFrontalGyrus
-10 2 68 L BA6 SMAAssigned
-18 -14 66 L BA6 ParacentralLobule
-24 2 58 L MiddleFrontalGyrus
-24 4 52 L MiddleFrontalGyrus
-46 -6 52 L BA6 PrecentralGyrus
-38 -8 50 L BA6 PrecentralGyrus
664
8 30 -2 66 R SuperiorFrontalGyrus
40 -4 62 R MiddleFrontalGyrus
28 -4 60 R SuperiorFrontalGyrus
7 26 0 68 R SuperiorFrontalGyrus
38 -6 60 R SuperiorFrontalGyrus
26 -4 52 R MiddleFrontalGyrus
6 24 -10 68 R BA6 SuperiorFrontalGyrus
36 -8 56 R PrecentralGyrus
46 -6 54 R BA6 MiddleFrontalGyrus
5 48 -2 56 R MiddleFrontalGyrus
26 2 54 R SuperiorFrontalGyrus
4 34 0 52 R MiddleFrontalGyrus
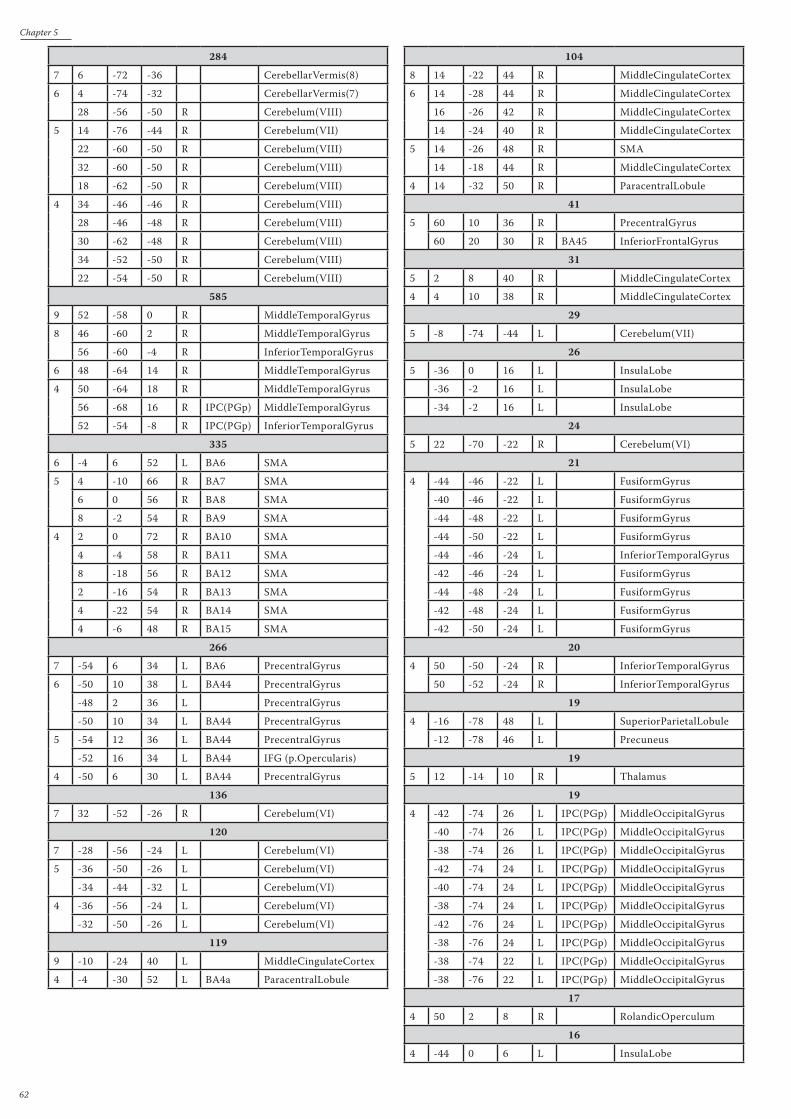
62
Chapter 5
284
7 6 -72 -36 CerebellarVermis(8)
6 4 -74 -32 CerebellarVermis(7)
28 -56 -50 R Cerebelum(VIII)
5 14 -76 -44 R Cerebelum(VII)
22 -60 -50 R Cerebelum(VIII)
32 -60 -50 R Cerebelum(VIII)
18 -62 -50 R Cerebelum(VIII)
4 34 -46 -46 R Cerebelum(VIII)
28 -46 -48 R Cerebelum(VIII)
30 -62 -48 R Cerebelum(VIII)
34 -52 -50 R Cerebelum(VIII)
22 -54 -50 R Cerebelum(VIII)
585
9 52 -58 0 R MiddleTemporalGyrus
8 46 -60 2 R MiddleTemporalGyrus
56 -60 -4 R InferiorTemporalGyrus
6 48 -64 14 R MiddleTemporalGyrus
4 50 -64 18 R MiddleTemporalGyrus
56 -68 16 R IPC(PGp) MiddleTemporalGyrus
52 -54 -8 R IPC(PGp) InferiorTemporalGyrus
335
6 -4 6 52 L BA6 SMA
5 4 -10 66 R BA7 SMA
6 0 56 R BA8 SMA
8 -2 54 R BA9 SMA
4 2 0 72 R BA10 SMA
4 -4 58 R BA11 SMA
8 -18 56 R BA12 SMA
2 -16 54 R BA13 SMA
4 -22 54 R BA14 SMA
4 -6 48 R BA15 SMA
266
7 -54 6 34 L BA6 PrecentralGyrus
6 -50 10 38 L BA44 PrecentralGyrus
-48 2 36 L PrecentralGyrus
-50 10 34 L BA44 PrecentralGyrus
5 -54 12 36 L BA44 PrecentralGyrus
-52 16 34 L BA44 IFG (p.Opercularis)
4 -50 6 30 L BA44 PrecentralGyrus
136
7 32 -52 -26 R Cerebelum(VI)
120
7 -28 -56 -24 L Cerebelum(VI)
5 -36 -50 -26 L Cerebelum(VI)
-34 -44 -32 L Cerebelum(VI)
4 -36 -56 -24 L Cerebelum(VI)
-32 -50 -26 L Cerebelum(VI)
119
9 -10 -24 40 L MiddleCingulateCortex
4 -4 -30 52 L BA4a ParacentralLobule
104
8 14 -22 44 R MiddleCingulateCortex
6 14 -28 44 R MiddleCingulateCortex
16 -26 42 R MiddleCingulateCortex
14 -24 40 R MiddleCingulateCortex
5 14 -26 48 R SMA
14 -18 44 R MiddleCingulateCortex
4 14 -32 50 R ParacentralLobule
41
5 60 10 36 R PrecentralGyrus
60 20 30 R BA45 InferiorFrontalGyrus
31
5 2 8 40 R MiddleCingulateCortex
4 4 10 38 R MiddleCingulateCortex
29
5 -8 -74 -44 L Cerebelum(VII)
26
5 -36 0 16 L InsulaLobe
-36 -2 16 L InsulaLobe
-34 -2 16 L InsulaLobe
24
5 22 -70 -22 R Cerebelum(VI)
21
4 -44 -46 -22 L FusiformGyrus
-40 -46 -22 L FusiformGyrus
-44 -48 -22 L FusiformGyrus
-44 -50 -22 L FusiformGyrus
-44 -46 -24 L InferiorTemporalGyrus
-42 -46 -24 L FusiformGyrus
-44 -48 -24 L FusiformGyrus
-42 -48 -24 L FusiformGyrus
-42 -50 -24 L FusiformGyrus
20
4 50 -50 -24 R InferiorTemporalGyrus
50 -52 -24 R InferiorTemporalGyrus
19
4 -16 -78 48 L SuperiorParietalLobule
-12 -78 46 L Precuneus
19
5 12 -14 10 R Thalamus
19
4 -42 -74 26 L IPC(PGp) MiddleOccipitalGyrus
-40 -74 26 L IPC(PGp) MiddleOccipitalGyrus
-38 -74 26 L IPC(PGp) MiddleOccipitalGyrus
-42 -74 24 L IPC(PGp) MiddleOccipitalGyrus
-40 -74 24 L IPC(PGp) MiddleOccipitalGyrus
-38 -74 24 L IPC(PGp) MiddleOccipitalGyrus
-42 -76 24 L IPC(PGp) MiddleOccipitalGyrus
-38 -76 24 L IPC(PGp) MiddleOccipitalGyrus
-38 -74 22 L IPC(PGp) MiddleOccipitalGyrus
-38 -76 22 L IPC(PGp) MiddleOccipitalGyrus
17
4 50 2 8 R RolandicOperculum
16
4 -44 0 6 L InsulaLobe

Anatomy of the mirror neuron system
63
Table S1: Consistent sVx for the contrasts Hca-Hst and Hca-Hm. Clusters are groups of contiguous voxels in which at least 3 subjects showed sVx (i.e. boneferoni corrected p<0.025). Each cluster is shown in a separate subtable, with the clustersize (in 2x2x2mm voxels) given as heading. Below the clustersize, all peaks are mentioned, with from left to right, the number of subjects showing sVx at the peak coordinates, the MNI coordinates (x,y,z), the hemisphere, the cytoarchitectonic area to which the peak is attributed according to the anatomy toolbox and the macroanatomical description of the location. Clusters are ordered by size, and peaks within the clusters by peak subject number.
15
4 50 6 52 R MiddleFrontalGyrus
46 4 52 R MiddleFrontalGyrus
48 4 52 R MiddleFrontalGyrus
50 4 52 R MiddleFrontalGyrus
15
4 64 12 16 R PrecentralGyrus
4 56 8 12 R BA44 InferiorFrontalGyrus
15
4 -22 -62 -46 L Cerebelum(VIII)
4 -18 -62 -46 L Cerebelum(VIII)
13
4 -50 10 2 L InferiorFrontalGyrus(p.Opercularis)
4 -52 10 0 L InferiorFrontalGyrus(p.Opercularis)
1jbuS
2jbuS
3jbuS
4jbuS
5jbuS
6jbuS
11
5 -6 -16 6 L Thalamus
11
4 -14 -52 -48 L Cerebelum(IX)
-12 -52 -48 L Cerebelum(IX)
-14 -54 -48 L Cerebelum(IX)
-14 -52 -50 L Cerebelum(IX)
10
4 30 -20 74 R BA6 PrecentralGyrus
32 -20 74 R BA7 PrecentralGyrus
32 -20 72 R BA8 PrecentralGyrus
Supplementary Figure 2: Activations of subjects 1-6 during action execution and observation.

64
Chapter 5
7jbuS
8jbuS
9jbuS
01jbuS
11jbuS
21jbuS
Supplementary Figure 3: Activations of subjects 7-12 during action execution and observation. Conventions as in Figure 1
31jbuS
41jbuS
51jbuS
61jbuS
tsH-acHpalrevO
rcs~&)LxeH,RxeH(xaM
Supplementary Figure 4: Activations of subjects 13-16 during action execution and observation. Conventions as in Figure 1