university of california economics 134 professor david ... · university of california economics...
TRANSCRIPT
UNIVERSITY OF CALIFORNIA Economics 134 DEPARTMENT OF ECONOMICS Spring 2018
Professor David Romer
LECTURE 7
MONETARY FACTORS IN THE GREAT DEPRESSION? FEBRUARY 7, 2018
I. MONETARY ARRANGEMENTS IN THE 1920S A. Early Federal Reserve B. Gold standard II. MONETARY CONTRACTION IN 1928 A. U.S. economy in the 1920s B. Fed tightens to stem stock market bubble C. Effect in the IS-LM model D. International repercussions III. MONETARY FACTORS AND THE 1929 PLUNGE A. Output plummets in late 1929 B. Fall in the real interest rate suggests a shift in IS curve C. Monetary policy immediately after the stock market crash IV. BANKING PANICS A. Four waves of panics B. Modeling the effect of a panic 1. Money market 2. IS-LM C. Role of a fall in expected inflation (to expected deflation) 1. Evidence of expected deflation 2. Source of expected deflation 2. Impact in IS-LM model D. Why didn’t the Federal Reserve act? V. GOLD STANDARD A. Transmission of Great Depression from U.S. to the rest of the world B. Was the Federal Reserve constrained by the gold standard? C. October 1931monetary shock

LECTURE 7 Monetary Factors in the
Great Depression
February 7, 2018
Economics 134 David Romer Spring 2018

Announcements
• Hand in Problem Set 1.
• Suggested answers will be posted on Friday.

I. MONETARY ARRANGEMENTS IN THE 1920S

Early Federal Reserve
• Still learning its job.
• Initially NY Fed was dominant.
• Famous head, Benjamin Strong, died in October 1928.
• Starting in 1929, conflict between NY Fed, Board of Governors, and other FR banks.
• Friedman and Schwartz argue Fed was dysfunctional in early 1930s.

Gold Standard
• System of fixed exchange rates.
• Price-specie flow mechanism: if prices fall in one country, gold (specie) will flow to that country leading to growth and inflation.
• Gold standard under pressure in 1920s. Many countries are low on gold reserves.
• U.S. unwilling to play managerial role.

II. MONETARY CONTRACTION IN 1928
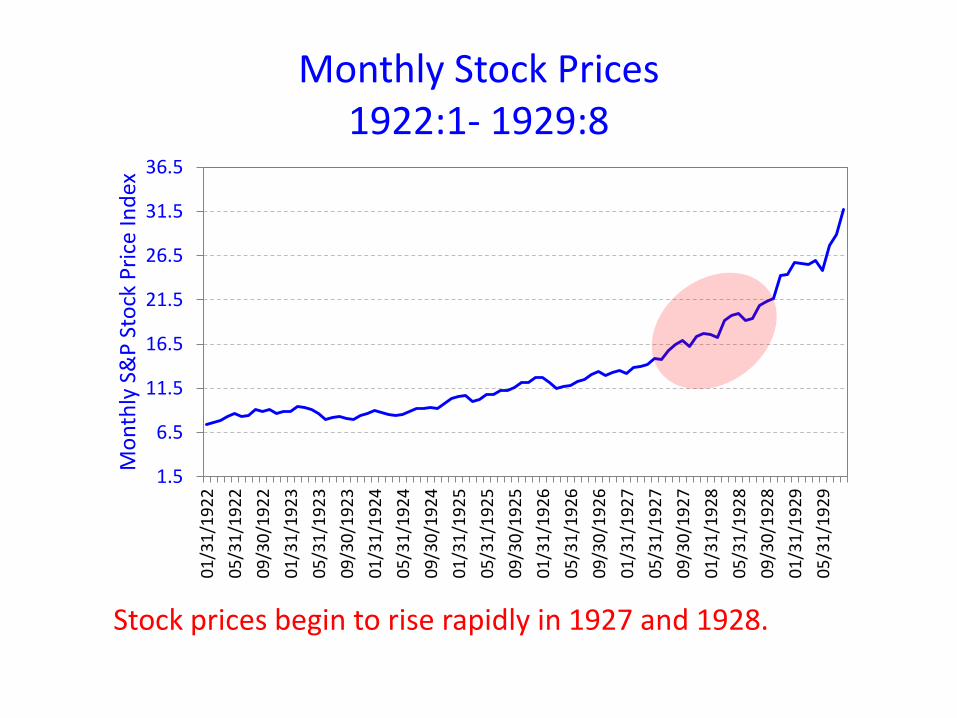
Stock prices begin to rise rapidly in 1927 and 1928.
1.5
6.5
11.5
16.5
21.5
26.5
31.5
36.5
01/3
1/19
2205
/31/
1922
09/3
0/19
2201
/31/
1923
05/3
1/19
2309
/30/
1923
01/3
1/19
2405
/31/
1924
09/3
0/19
2401
/31/
1925
05/3
1/19
2509
/30/
1925
01/3
1/19
2605
/31/
1926
09/3
0/19
2601
/31/
1927
05/3
1/19
2709
/30/
1927
01/3
1/19
2805
/31/
1928
09/3
0/19
2801
/31/
1929
05/3
1/19
29
Mon
thly
S&
P St
ock
Pric
e In
dex
Monthly Stock Prices 1922:1- 1929:8

High-powered money fell in 1928.
Source: James Hamilton, Journal of Monetary Economics, July 1987.

Which framework to use – IS-MP or IS-LM?
• IS-LM because the Fed in the 1920s was closer to a money targeter than to following an interest rate rule.

The Effects of Decline in M in the Money Market Diagram
M/P
i M0/P
L(i,Y)
i0
M1/P
i’

The Effects of Decline in M in the IS-LM Diagram
Y
r LM0
IS0
r0
LM1
r1
Y1 Y0

Nominal interest rates rose in 1928 and early 1929.
Commercial Paper Rate
0
1
2
3
4
5
6
7
8
9
01/0
3/19
2008
/07/
1920
03/1
2/19
2110
/15/
1921
05/2
0/19
2212
/23/
1922
07/2
8/19
2303
/01/
1924
10/0
4/19
2405
/09/
1925
12/1
2/19
2507
/17/
1926
02/1
9/19
2709
/24/
1927
04/2
8/19
2812
/01/
1928
07/0
6/19
2902
/08/
1930
09/1
3/19
3004
/18/
1931
11/2
1/19
3106
/25/
1932
01/2
8/19
3309
/09/
1933
04/1
4/19
3411
/17/
1934
06/2
2/19
3501
/25/
1936
08/2
9/19
36
Perc
ent

Business cycle peak was in August 1929.
Monthly Industrial Production in the U.S.

International Repercussions
• Other countries have to tighten along with the U.S. to prevent gold outflows.
• Effect is important, but not huge.
III. MONETARY FACTORS AND THE 1929 PLUNGE

If the decline in Y were due to further monetary contraction, would expect r to rise.
Y
r LM0
IS0
r0
LM1
r1
Y1 Y0

Nominal and real interest rates in fact fell sharply in late 1929 and early 1930.
Commercial Paper Rate
0
1
2
3
4
5
6
7
8
9
01/0
3/19
2008
/07/
1920
03/1
2/19
2110
/15/
1921
05/2
0/19
2212
/23/
1922
07/2
8/19
2303
/01/
1924
10/0
4/19
2405
/09/
1925
12/1
2/19
2507
/17/
1926
02/1
9/19
2709
/24/
1927
04/2
8/19
2812
/01/
1928
07/0
6/19
2902
/08/
1930
09/1
3/19
3004
/18/
1931
11/2
1/19
3106
/25/
1932
01/2
8/19
3309
/09/
1933
04/1
4/19
3411
/17/
1934
06/2
2/19
3501
/25/
1936
08/2
9/19
36
Perc
ent
Sept. 1929

Explaining the fall in Y and r in late 1929 IS likely shifted back.
Y
r LM0
IS0
r0
Y0 IS1
r1
Y1

IV. BANKING PANICS

Deposits in suspended banks surged during panics.
Source: Friedman and Schwartz, A Monetary History of the United States, 1963

The Effects of a Banking Panic in the Market for High-Powered Money
M/P
i M0/P
L0(i,Y)
i0
L1(i,Y)
i1
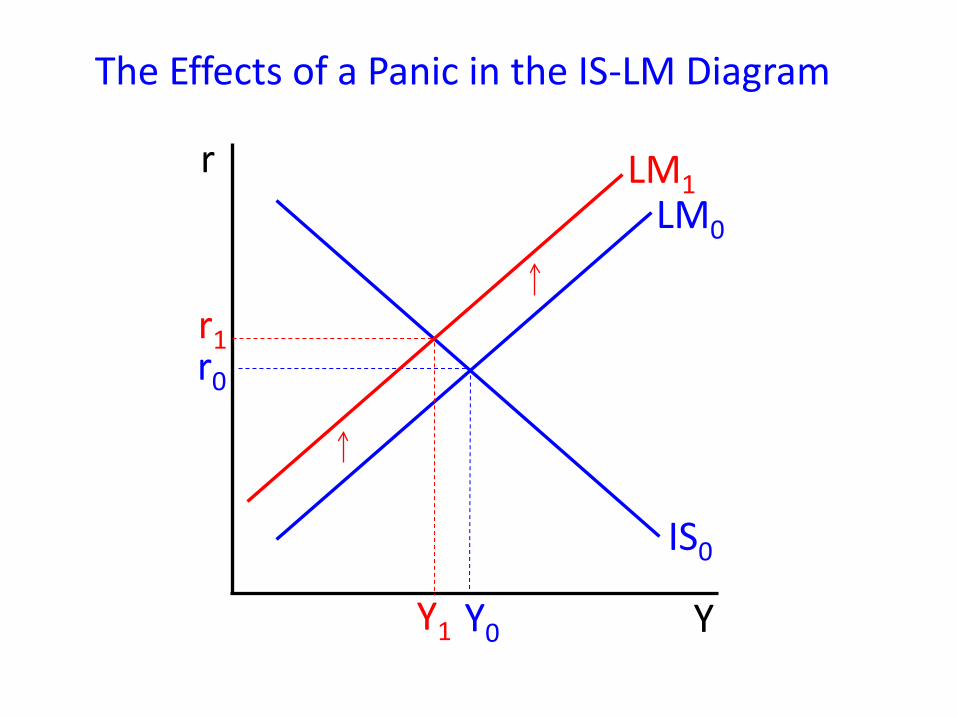
The Effects of a Panic in the IS-LM Diagram
Y
r LM0
IS0
r0
LM1
r1
Y1 Y0
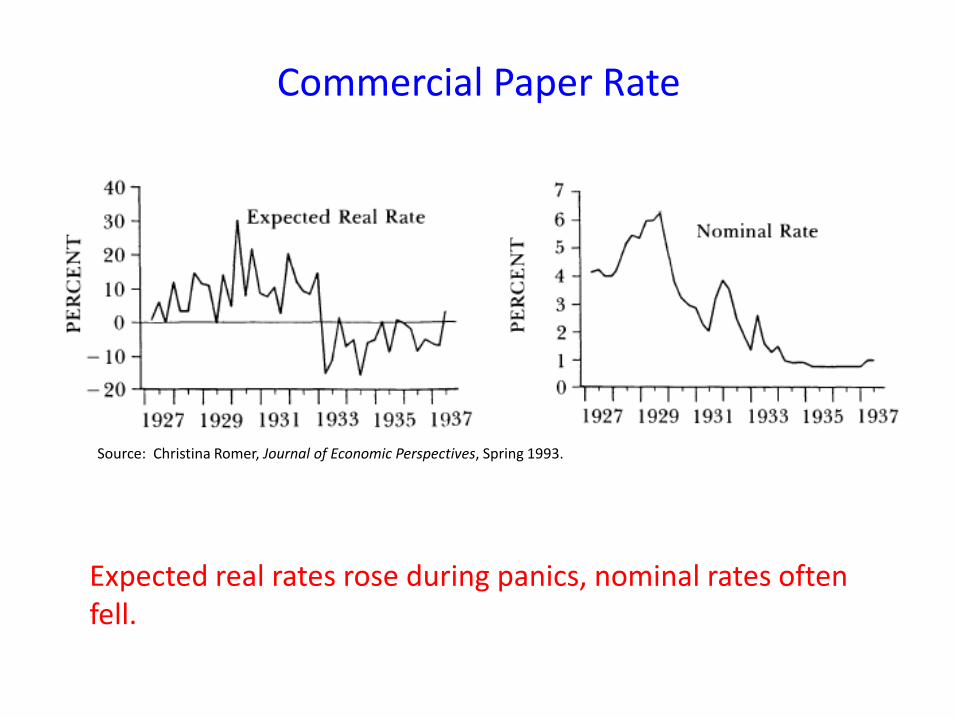
Expected real rates rose during panics, nominal rates often fell.
Commercial Paper Rate
Source: Christina Romer, Journal of Economic Perspectives, Spring 1993.
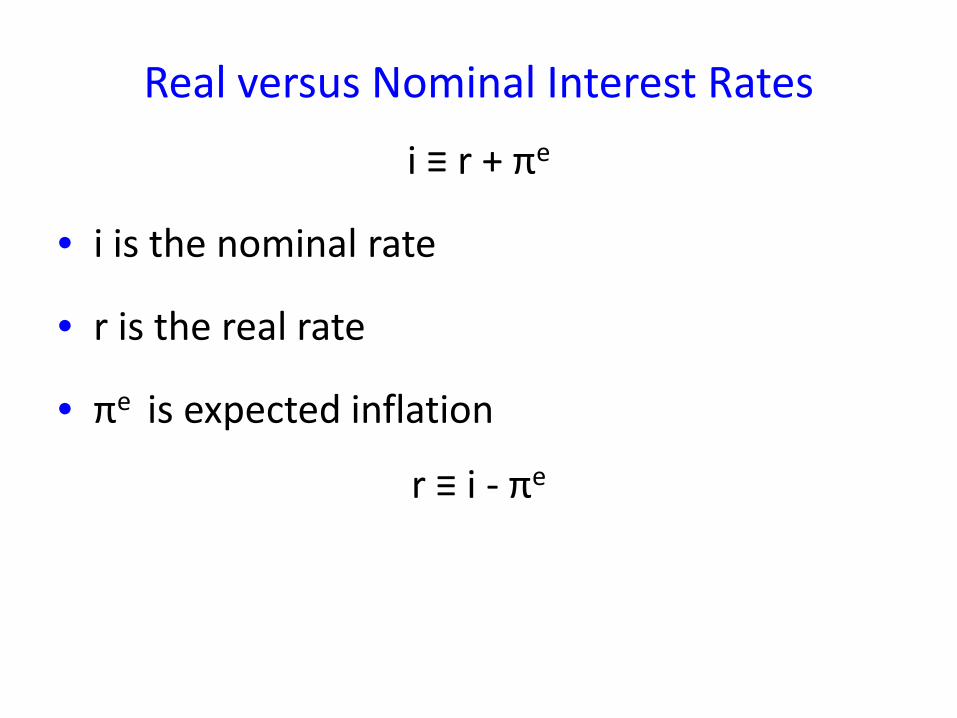
Real versus Nominal Interest Rates
i ≡ r + πe
• i is the nominal rate
• r is the real rate
• πe is expected inflation
r ≡ i - πe

How could we measure expectations of inflation?
• Newspapers or popular accounts.
• Use evidence from futures markets.
• Forecast inflation using data available at the time (lagged inflation, perhaps the money stock, etc.).

There was a large fall in expected inflation in 1930 and 1931.
Source: Stephen Cecchetti, American Economic Review, March 1992.

Narrative Evidence from Business Week
• Expected deflation after mid-1930.
• Monetary developments and Fed policy were a key source of expectations of deflation.
• “Our idle gold hoard piles up without increasing the means of payment by credit expansion because of paralysis of banking policy, thus prolonging price deflation” (4/29/31, cover).

Expected Inflation in IS-LM
Y
r LM0
IS0
r0
Y0
LM (in terms of i and Y)
πe
We subtract off πe from each point on the LM curve in terms of i and Y to get the LM curve in terms of r and y.

Fall in Expected Inflation in IS-LM
Y
r LM0 (π0𝑒)
IS0
r0
Y0
LM (in terms of i) LM1 (π1𝑒)
π0𝑒 > π1𝑒> 0
π0𝑒
π1𝑒
LM curve shifts up by the fall in πe.
π0𝑒 - π1𝑒

Effect of a Fall in Expected Inflation in IS-LM
• A fall in πe shifts the LM curve (in terms of r and Y) up.
• The LM curve shifts up by the fall in πe (π0𝑒 – π1𝑒).

Impact of the Large Fall in Expected Inflation (From Expected Inflation to Expected Deflation in 1931)
Y
r LM0
IS0
r0
Y0
LM1
π0𝑒 - π1𝑒
Y1
r1

What happens to i when there is a fall in expected inflation?
• i = r + πe
• r rises, which tends to increase i.
• πe falls, which tends to decrease i.
• r rises by less than πe falls, so i falls.
• A fall in expected inflation (to expected deflation) can help explain why real rates rose and nominal rates fell in the early 1930s.

Why didn’t the Federal Reserve do more to stop the panics?
• Power struggle/ power vacuum within the Federal Reserve System.
• Bad model of the economy.
• Gold standard.

V. GOLD STANDARD

The gold standard was the key transmission mechanism of U.S. shocks to the rest of the world.

Was the gold standard a constraint on Federal Reserve action?
• Eichengreen says Fed couldn’t expand M to deal with panics because it would call into question the U.S. commitment to the gold standard. Gold would flow out.
• Friedman and Schwartz disagree. U.S. had huge gold reserves.

Federal Reserve engaged in monetary expansion during the Open Market Purchase Program in the spring of 1932.
Change in Federal Reserve Holdings of U.S. Government Securities
Source: Hsieh and Romer, Journal of Economic History, March 2006.

Expectations of devaluation actually fell following the Open Market Purchase Program.
Expected Devaluation of the Dollar
Source: Hsieh and Romer, Journal of Economic History, March 2006.

October 1931
• One of Friedman and Schwartz’s crucial episodes.
• Britain went off the gold standard in September 1931.
• Federal Reserve raised the discount rate 200 basis points to stem gold outflow.
• Pretty clearly another contractionary monetary shock.

Source: Friedman and Schwartz, A Monetary History of the United States, 1963
Discount Rate

Effect of the rise in the discount rate (and fall in high-powered money) in October 1931
Y
r LM0
IS0
r0
LM1
r1
Y1 Y0

VI. CONCLUSIONS