university malaya original literary work...
TRANSCRIPT

ii
UNIVERSITY MALAYA
ORIGINAL LITERARY WORK DECLARATION
Name of candidate: Khor Goot Heah
Matrix Number: HHC 090007
Name of Degree: Doctor of Philosophy
Title of Thesis (“this work”): Methylation Profiling in Oral Squamous Cell Carcinoma
Field of study: Molecular Biology
I do solemnly and sincerely declare that:
1) I am the sole author/writer of this Work;
2) This work is original;
3) Any use of any work in which copyright exists was done by way of fair dealing and for
permitted purposes and any excerpt or extract form, or reference to or reproduction of
any copyright work has been disclosed expressly and sufficiently and the title of the
Work and its authorship has been acknowledged in this Work;
4) I do not have any actual knowledge nor do I ought reasonably to know that the making of
this Work constitutes an infringement of any copyright work;
5) I hereby assign all and ever rights in the copyright to this Work to the University of
Malaya (“UM”), who henceforth shall be of the owner of the copyright in this Work and
that any reproduction or use in any form or by any means whatsoever is prohibited
without the written consent of UM having been first had and obtained;
6) I am fully aware that if in the course of making this Work I have infringed any copyright
whether internationally or otherwise, I may be subject to legal action or any other action
as may be determined by UM.
Candidate’s signature Date
Subscribed and solemnly declared before
Witness’ signature
Name: Date
Designation:
iii
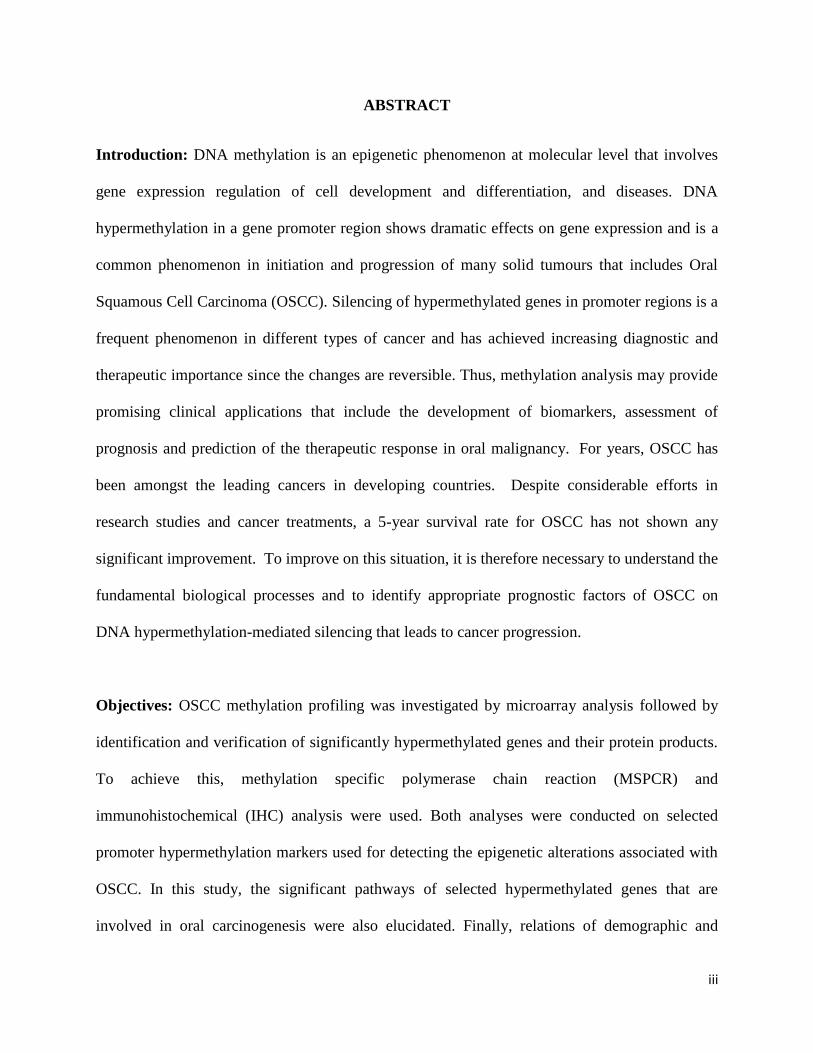
ABSTRACT
Introduction: DNA methylation is an epigenetic phenomenon at molecular level that involves
gene expression regulation of cell development and differentiation, and diseases. DNA
hypermethylation in a gene promoter region shows dramatic effects on gene expression and is a
common phenomenon in initiation and progression of many solid tumours that includes Oral
Squamous Cell Carcinoma (OSCC). Silencing of hypermethylated genes in promoter regions is a
frequent phenomenon in different types of cancer and has achieved increasing diagnostic and
therapeutic importance since the changes are reversible. Thus, methylation analysis may provide
promising clinical applications that include the development of biomarkers, assessment of
prognosis and prediction of the therapeutic response in oral malignancy. For years, OSCC has
been amongst the leading cancers in developing countries. Despite considerable efforts in
research studies and cancer treatments, a 5-year survival rate for OSCC has not shown any
significant improvement. To improve on this situation, it is therefore necessary to understand the
fundamental biological processes and to identify appropriate prognostic factors of OSCC on
DNA hypermethylation-mediated silencing that leads to cancer progression.
Objectives: OSCC methylation profiling was investigated by microarray analysis followed by
identification and verification of significantly hypermethylated genes and their protein products.
To achieve this, methylation specific polymerase chain reaction (MSPCR) and
immunohistochemical (IHC) analysis were used. Both analyses were conducted on selected
promoter hypermethylation markers used for detecting the epigenetic alterations associated with
OSCC. In this study, the significant pathways of selected hypermethylated genes that are
involved in oral carcinogenesis were also elucidated. Finally, relations of demographic and

iv
clinicopathological characteristics along with these signature genes were conducted for
prognostic purposes of OSCC.
Materials and methods: Genome-wide analysis of 4 normal oral mucosa and 20 OSCC tissues
were conducted using Illumina methylation microarray. The specified differential genes were
selected from a gene list and their methylation statuses and protein expressions were further
verified by an independent cohort sample of 40 OSCC samples. Lastly, statistical analysis
conducted on demographic, clinicopathological data and gene hypermethylations for OSCC
prognostication.
Results: Unsupervised hierarchical clustering of methylation data revealed distinct methylation
patterns between the normal and the tumour tissues. For tumour tissues, high frequencies of
promoter hypermethylation were found in p16, DDAH2, DUSP1, PIKCR3, TP73, MEF2D,
RRM2 and CELSR3 genes in the MSPCR analysis; whereas low positive immunostaining of
DDAH2, DUSP1, MEF2D and RRM2 were demonstrated in the IHC analysis. Notably, an
inverse correlation was observed between hypermethylations and protein expressions of DDAH2,
DUSP1, MEF2D and RRM2. In addition to that, significant association was found between p16
and TP73 hypermethylation with patients’ tumour site, and CELSR3 and TP73 hypermethylation
with patients’ invasive stages. Furthermore, DDAH2 and CELSR3 hypermethylation, and RRM2
expression were correlated significantly with patients’ age. Finally, gender showed a significant
difference in the survival rate with 24.2% for males and 46.5% for females.

v
Conclusions: Multiple candidate genes were identified using computational and gene-specific
validation approaches in this study. The results provide a new insight into the molecular basis of
promoter hypermethylation and prognostic values of OSCC. Nevertheless, the identified
candidate genes revealed from the present research are worth making further investigations on
oral carcinogenesis.

vi
Abstrak
Pengenalan: Metilasi DNA adalah suatu fenomena epigenetik di peringkat molekul yang
melibatkan ekspresi gen dalam pembangunan dan pembahagian sel-sel, dan penyakit.
Hipermetilasi DNA dalam penganjur gen telah menunjukkan kesan dramatik ke atas gen regulasi
dan merupakan fenomena biasa dalam perkembangan banyak tumor pepejal termasuk karsinoma
sel skuamus mulut (OSCC). Penyenyapan dalam proses hipermetilasi adalah satu mekanisme
yang kerap berlaku dalam pelbagai jenis kanser dan menjadi semakin penting dalam bidang
diagnostik dan terapeutik kerana metilasi merupakan proses tindakbalas berbalik. Oleh itu,
analisis metilasi boleh menyediakan aplikasi klinikal yang menjamin, termasuk penemuan
penanda-penanda baru, penilaian prognosis dan pemberian terapeutik pada kanser mulut. Sejak
beberapa tahun yang dulu, OSCC telah menjadi salah satu kanser utama di negara-negara yang
sedang berkembang. Walaupun pelbagai usaha dalam penyelidikan dan pengubatan barah
berkembang telah dibuat , kadar kelangsungan hidup 5 tahun untuk pesakit-pesakit OSCC masih
tidak bertambah baik. Bagi memperbaiki keadaan ini, adalah perlu untuk memahami proses
biologi asas pada DNA hipermetilasi dalam penganjur gene yang merupakan punca kanser.
Objektif: Penyiasatan profil metilasi OSCC dijalankan oleh analisis microarray, diikuti dengan
pengenalan dan pengesahan status perbezaan gen metilasi yang signifikan dan ekspresi protein
menggunakan metilasi khusus “polymerase chain reaction” (MSPCR) dan immunohistokimia
(IHC) analisis. Kedua-dua analisis telah dijalankan ke atas gen-gen terpilih untuk mengesan
perubahan epigenetik yang berkaitan dengan OSCC. Dalam kajian ini, laluan sel-sel penting
untuk gen hipermetilasi yang terlibat dalam karsinogenesis mulut juga dijelaskan. Akhir sekali,

vii
hubungan ciri-ciri demografi dan klinikopathologikal dengan gen-gen penanda telah diadakan
untuk tujuan ramalan OSCC.
Material dan cara:
Untuk mengenal pasti kelainan metilasi DNA yang berkaitan dengan OSCC, kita menyiasat
analisis keseluruhan genom keatas 4 mukosa mulut biasa dan 20 tisu OSCC, dengan
menggunakan Illumina metilasi microarray. Status metilasi dan ekspresi protein untuk calon-
calon gen telah disahkan oleh sampel kohort berbeza daripada 40 sampel tumor. Akhir sekali,
analisis secara statistik juga dijalankan keatas data demografi dan klinikopathologika, dan tanda-
tanda hipermetilasi untuk nilai prognostik bagi pesakit OSCC.
Keputusan: Kelompok hierarki tanpa pengawasan data metilasi mendedahkan pola metilasi
berbeza antara tisu normal dan tisu tumor. Dalam kajian tisu tumor, frekuensi tinggi dalam
penganjur hipermetilasi ditemui pada gen-gen P16, DDAH2, DUSP1, PIKCR3, TP73, MEF2D,
RRM2, BCL2 dan CELSR3 dalam MSPCR analisis, begitu juga perwarnaan imuno dalam IHC
analisis yang rendah bagi DDAH2, DUSP1, MEF2D dan RRM2 telah ditunjukkan. Hubungan
songsang antara hipermetilasi dan imunoreaktiviti untuk DDAH2, DUSP1, MEF2D dan RRM2
telah dikesan dalam kajian ini. Tambahan pula, hubungan yang ketara ditemui antara
hipermetilasi P16 dan TP73 dengan lokasi tumor, hipermetilasi CELSR3 dan TP73 dengan
pesakit peringkat invasif. Tambahan pula, hipermetilasi bagi DDAH2 dan CELSR3, and RRM2
ekspresi adalah berkait rapat dengan ketara dengan usia pesakit. Akhir sekali, jantina
menunjukkan perbezaan yang signifikan dalam kadar jangkaan hidup dengan 24.2% bagi lelaki
dan 46.5% untuk wanita.

viii
Kesimpulan: Pelbagai calon gen telah dikenal pasti menggunakan pendekatan pengesahan
pengiraan dan gen khusus dalam kajian ini. Keputusan ini juga menyediakan wawasan baru ke
dalam asas molekul hIpermetilasi penganjur dan nilai prognostik OSCC. Lagipun, calon-calon
gen yang dikenal pasti dari kajian ini adalah bernilai untuk siasatan lanjut mengenai
karsinogenesis mulut.

ix
ACKNOWLEDGEMENTS
First and foremost, I would like to thank God for giving me the strength, patience and health
throughout the study tenure. I would like to express my deepest gratitude to my main supervisors,
Prof. Dr Thong Kwai Lin and Prof Dr Rosnah Mohd. Zain for their generous guidance,
enthusiastic supervision and constant encouragement. This also applies to my co-supervisor,
Associate Prof. Dr Gabriele Ruth Anisah Froemming for her continuous supports and invaluable
advices.
I appreciate the encouragement that I have received from my Dean of the Faculty of Dentistry,
Universiti Teknologi MARA (UiTM), Prof Dr Mohamed Bin Ibrahim Hassan. I would like to
acknowledge the grants, PS001/2010A and PV046-2011B provided by the University of Malaya,
600-RMI/DANA/5/3/RIF (633/2012) by the UiTM. and the Fundamental Research Grant
Scheme (FRGS) of the Ministry of Higher Education, Malaysia.
Many thanks to Asst. Prof Dr. Tan Aik Choon from the school of medicine, University of
Colorado, Denver, USA for his time and invaluable help in the microarray data analysis. I am
grateful to Dr Mariam Mohamad of Population Health and Preventive Medicine Department,
Medical Faculty, UiTM for her invaluable advice in the statistical analysis.
I would like to thank IMMB staffs and members who knowingly and unknowing-led me through
the life-challenges to our ability to thrive. Thank you to the OCRCC team for their support
despite the tight working schedule, especially to Nabilah, Karen Ng and Vincent Chong.
My deepest gratitude and special heartfelt thanks to my husband, Ir Teoh Teik Seng, my
wonderful sons, Teoh Khai Ping and Teoh Khai Jieh, and my loving daughter, Teoh Xian Ying
for being patient and supportive during my study. I am so lucky to have them with me all the
time sharing the great moments in our life. This thesis is dedicated to them.

x
LIST OF CONTENTS Page No.
i. COVER PAGE
ii. ORIGINAL LITERARY WORK DECLARATION
iii. ABSTRACT
iv. ACKNOWLEDGEMENTS
v. LIST OF CONTENTS
vi. LIST OF FIGURES
vii. LIST OF TABLES
viii. LIST OF APPENDICES
ix. LIST OF ABBREVIATIONS
ii
iii
ix
x
xvi
xx
xxi
xxii
CHAPTER 1 INTRODUCTION
1.1 Background of the study
1.2 Rationale of the study
1.3 Significance of the study
1.4 Objectives of the study
CHAPTER 2 LITERARURE REVIEW
2.1 Oral cancer
2.1.1 The world scene
2.1.2 The Malaysian scene
1
1
3
4
5
6
6
6
7

xi
2.2 Carcinogenesis
2.3 Cancer staging and grading
2.4 Cancer prognosis
2.5 Risk factors of oral cancer
2.5.1 Lifestyle factors - Tobacco and betel quid chewing
2.5.1.1 Tobacco and betel quid chewing
2.5.1.2 Excessive alcohol consumption and mouthwash
2.5.2 Infectious factors
2.5.3 Genetic instability
2.5.4 Diet and nutrition
2.5.5 Host defences
2.5.6 Chemical carcinogenic substances
2.6 Molecular alterations in cancers
2.6.1 Oncogenes
2.6.2 Tumour suppressor genes
2.7 Epigenetic biomarkers for cancers
2.8 Cancer therapy
2.9 Epigenetic
2.9.1 Significance of epigenetic studies
2.9.2 Epigenetic interaction
2.9.2.1 Epigenetic and aging
2.9.2.2 Epigenetic and gender
2.9.2.3 Epigenetic and diets
8
9
10
10
11
11
12
13
15
15
16
17
18
18
19
20
22
24
25
26
26
26
26
xii
2.9.3 DNA methylation
2.9.3.1 DNA methylation mechanism
2.9.4 CpG islands
2.9.4.1 CpG methylation
2.9.4.2 DNA nucleotide methylatransferases
2.9.5 Effects of DNA methylation on gene transcription
2.10 Histone modifications
2.11 High throughput methylation analysis
2.11.1 Microarray
2.11.2 DNA methylation microarrays
2.11.3 Cytosine microarray
2.11.4 Microarray application in oral cancers
2.12 Methylation analysis
2.12.1 Bisulfite-conversion based method
2.12.2 Gene-specific methylation analysis
2.12.3 Methylation-specific polymerase chain reaction
2.12.4 Methylation-sensitive restriction enzymes methods
2.12.5 Methylation-sensitive high-resolution melting
2.13 Immunohistochemistry
2.13.1 Technical aspect of immunohistochemistry
CHAPTER 3 MATERIALS AND METHODS
3.1 Study design
27
28
29
31
32
34
35
35
37
37
38
39
40
40
42
43
44
44
45
46
47
47

xiii
3.2 Study population
3.3 DNA extraction
3.3.1 Snap frozen tissues
3.3.2 Formalin fixed paraffin embedded tissues
3.3.3 Bisulfite converted DNA
3.4 Microarray assay
3.4.1 Microarray data analysis
3.4.1.1 Genome Studio data analysis
3.4.1.2 Partek Genomic Suite and Genego, MetacoreTM
analysis
3.5. Methylation-specific polymerase chain reaction analysis
3.5.1 Statistical analysis for comparisons between patients’ demographic profiles
and clinicopathological characteristics
3.5.2 Survival analysis
3.6 Immunohistochemical analysis
3.6.1 Protocol for detection of protein expression of selected genes using IHC
3.6.1.1 Dewaxing, deparafinization and rehydration
3. 6.1.2 Antigen retrieval
3. 6.1.3 Blocking
3. 6.1.4 Staining
3. 6.1.5 Counterstaining
3. 6.1.6. Tissue preservation
3. 6.2 Image scoring analysis of protein expressions of selected genes in IHC
stained specimens
3.6.3 Statistical analysis of protein expressions of selected genes
48
48
48
49
50
51
52
52
53
54
55
57
57
59
59
59
59
60
60
61
62

xiv
CHAPTER 4 RESULTS
4.1 Methylation microarray analysis
4.1.1 Study population
4.1.2 Illumina’s Genome Studio software analysis
4.1.3 Partek Genomic Suite assay
4.1.4 Signalling pathway analysis of hypermethylated genes of OSCC
4.2 Methylation-specific polymerase chain reaction analysis
4.2.1 Demographic and clinicopathological parameters of OSCC
4.2.2 Association between patients’ demographic profiles, clinicopathological data
and methylation status
4.3 Survival analysis
4.4 Immunohistochemical analysis
4.4.1 Association between gene hypermethylation levels and protein expressions of
DDAH2, DUSP1, MEF2D and RRM2.
4.4.2 Correlation between protein expressions of DDAH2, DUSP1, MEF2D and
RRM2
4.4.3 Correlation between patients’ age and protein expressions of DDAH2,
DUSP1, MEF2D and RRM2.
CHAPTER 5 DISCUSSIONS
5.1 Methylation microarray analysis
5.2 Partek Genomic Suite assay
5.3 Methylation-specific polymerase chain reaction analysis
63
63
63
63
67
73
76
82
82
86
98
106
106
106
107
107
110
111

xv
5.4 Significant signaling pathway analysis of hypermethylated genes of MEF2D and
RRM2
5.4.1 MEF2D
5.4.2 RRM2
5.5 Survival analysis
5.6 Immunohistochemical analysis
5.6.1 Association of protein expression of DDAH2, DUSP1, MEF2D and RRM2
5.7 Association of gene hypermethylation levels with protein expression of
DDAH2, DUSP1, MEF2D and RRM2
5.8 Demographic profiles, clinicopathological characteristics, gene
hypermethylations and protein expressions of OSCC
5.9 Limitations of study
119
120
120
121
122
124
124
126
129
CHAPTER 6 CONCLUSIONS AND RECOMMENDATIONS
6.1 Conclusions
6.2 Recommendations
131
131
134
BIBIOGRAPHY
137

xvi
LIST OF FIGURES Page No.
Figure 2.1 Illustration of de novo methylation and maintenance methylation
processes
29
Figure 2.2
Schematic drawing of methylated CpG
30
Figure 2.3
Schematic drawing of cytosine methylation
32
Figure 2.4
Schematic drawing of known members of the DNMT super-family
34
Figure 2.5 Schematic chemical conversion of DNA methylation analysis 42
Figure 3.1 Project workflow 47
Figure 4.1 The line plot shows unsupervised hierarchical clustering of probes
of normal tissues and clinical samples
64
Figure 4.2 Mean methylation value difference between normal tissues with
different stages of OSCC cases
65
Figure 4.3.1 Histogram of group methylation profiles of p16 alleles average β
value between normal and 4 pathological stages
65
Figure 4.3.2 Histogram of group methylation profiles of DDAH2 alleles
average β value between normal and 4 pathological stages
66
Figure 4.3.3 Histogram of group methylation profiles of DUSP1 alleles average
β value between normal and 4 pathological stages
66
Figure 4.4 Heatmap methylation frequency of differentially methylated genes
in OSCC
68
Figure 4.5 Principle Component Analyses segregated the normal samples
from tumor samples
69
xvii
Figure 4.6 Scatter plot of fold change of normal and tumour tissues with gene
locus
69
Figure 4.7 Distribution chart of p value with locus for hypomethylated genes
and hypermethylated genes
70
Figure 4.8.1 Representative of Partek Genomic Suite visualization of P16 gene
in normal and four pathological stages
70
Figure 4.8.2 Representative of Partek Genomic Suite visualization of DUSP1
gene in normal and four pathological stages
71
Figure 4.8.3 Representative of Partek Genomic Suite visualization of DDAH2
gene in normal and four pathological stages
71
Figure 4.8.4 Representative of Partek Genomic Suite visualization of PIKC3R5
gene in normal and four pathological stages 72
Figure 4.8.5 Representative of Partek Genomic Suite visualization of CELSR3
gene in normal and four pathological stages
72
Figure 4.8.6 Representative of Partek Genomic Suite visualization of BCL2
gene in normal and four pathological stages
73
Figure 4.9.1 Representative agarose gel electrophoretic images of methylation
status for gene of p16 in methylation control and tumour samples
76
Figure 4.9.2
Representative agarose gel electrophoretic images of methylation
status for gene of DDAH2 in methylation control and tumour
samples
77
Figure 4.9.3
Representative agarose gel electrophoretic images of methylation
status for gene of DUSP1 in methylation control and tumour
samples
77
Figure 4.9.4
Representative agarose gel electrophoretic images of methylation
status for gene of CELSR3 in methylation control and tumour
samples
78
Figure 4.9.5
Representative agarose gel electrophoretic images of methylation
status for gene of PIK3R5 in methylation control and tumour
samples
78
Figure 4.9.6 Representative agarose gel electrophoretic images of methylation
status for gene of TP73 in methylation control and tumour samples 79
Figure 4.9.7
Representative agarose gel electrophoretic images of methylation
status for gene of MEF2D in methylation control and tumour
sample.
79
xviii
Figure 4.9.8 Representative agarose gel electrophoretic images of methylation
status for gene RRM2 in methylation control and tumour samples
80
Figure 4.9.9
Representative agarose gel electrophoretic images of methylation
status for gene of BCL2 in methylation control and tumour
samples
80
Figure 4.10 Overall survival rate in OSCC patients showed in Kaplan-Meier
curve
89
Figure 4.11.1 Relative survival of ethnicity demonstrated in Kaplan-Meier
survival curve
89
Figure 4.11.2 Relative survival of age demonstrated in Kaplan-Meier survival
curve 90
Figure 4.11.3 Relative survival of gender demonstrated in Kaplan-Meier survival
curve 90
Figure 4.11.4 Relative survival of habits demonstrated in Kaplan-Meier survival
curve 91
Figure 4.11.5 Relative survival of tumour sites demonstrated in Kaplan-Meier
survival 91
Figure 4.11.6 Relative survival of pathological stages demonstrated in Kaplan-
Meier survival curve
92
Figure 4.11.7 Relative survival of invasive front demonstrated in Kaplan-Meier
survival curve
92
Figure 4.11.8 Relative survival of tumour grading demonstrated in Kaplan-Meier
survival curve
93
Figure 4.11.9 Relative survival of p16 methylation demonstrated in Kaplan-
Meier survival curve
93
Figure 4.11.10 Relative survival of DDAH2 methylation demonstrated in Kaplan-
Meier survival curve
94
Figure 4.11.11 Relative survival of DUSP1 methylation demonstrated in Kaplan-
Meier survival curve
94
Figure 4.11.12 Relative survival of CELSR3 methylation demonstrated in
Kaplan-Meier survival curve
95

xix
Figure 4.11.13 Relative survival of PIK3R5 methylation demonstrated in Kaplan-
Meier survival curve
95
Figure 4.11.14 Relative survival of TP73 methylation demonstrated in Kaplan-
Meier survival curve
96
Figure 4.11.15 Relative survival of MEF2D methylation demonstrated in Kaplan-
Meier survival curve
96
Figure 4.11.16 Relative survival of RRM2 methylation demonstrated in Kaplan-
Meier survival curve
97
Figure 4.11.17 Relative survival of BCL2 methylation demonstrated in Kaplan-
Meier survival curve
97
Figure 4.12.1 Negative immunostaining of DDAH2 shows in cytoplasm of the
tumour cells 99
Figure 4.12.2 Positive immunostaining of DDAH2 shows in the cytoplasm of the
normal epithelium 99
Figure 4.12.3 Positive staining of DDAH2 was detected in the cytoplasm of the
tumour cells 100
Figure 4.12.4 Negative cytoplasmic immunostaining of DUSP1 shows in the
tumour cells 100
Figure 4.12.5 Positive cytoplasmic immunostaining of DUSP1 shows in the
normal epithelium 101
Figure 4.12.6 Positive DUSP1 cytoplasmic staining was detected in the tumour
cells 101
Figure 4.12.7 Negative MEF2D nuclear staining shows in the tumour cells 102
Figure 4.12.8 Positive MEF2D nuclear staining shows in the normal epithelium 102
Figure 4.12.9 Positive MEF2D nuclear staining was detected in the tumour cells 103
Figure 4.12.10 Negative RRM2 cytoplasmic staining shows in the tumour cells 103

xx
Figure 4.12.11 Positive RRM2 cytoplasmic staining shows in the normal
epithelium 104
Figure 4.12.12 Positive RRM2 cytoplasmic staining was detected in the tumour
cells 104
LIST OF TABLES
Page No
Table 2.1
TNM clinical staging categories with 5-year survival rate for cancer
9
Table 3.1 Details of primers used in methylation-specific polymerase chain reaction
56
Table 3.2
Details of antibodies used in immunohistochemical assay
58
Table 4.1
Significant biological pathway associated with hypermethylated genes of
OSCC
75
Table 4.2
Methylation status and percentage for methylated genes
81
Table 4.3
Demographic profiles, clinicopathological characteristics and gene
methylations of OSCC patients
84
Table 4.4
Survival analysis of patients’ demographic profiles, clinicopathological
characteristics, and genes’ hypermethylation status
87
Table 4.5
Status and percentage of immunostaining for hypermethylated genes
105

xxi
LIST OF APPENDICES
Page No
Appendix A
Protocol of Haematoxylin and Eosin Staining
156
Appendix B
Primer design criteria
157
Appendix C
Protocol of immunohistochemical staining: Labelled Streptavidin
Biotin
157
Appendix D
Details of 34 promoter-associated hypermethylated genes of
OSCC with UCSC gene accession and CpG Island (Illumina’s
Genome Studio software)
158
Appendix E
Details of 89 promoter hypermethylated genes of OSCC with
island location and p value (Partek Genomic Suite software)
160
Appendix F
Correlation between protein expression and patients’ age
163
Appendix G List of publications and conference proceedings 164

xxii
LIST OF ABBREVIATIONS
5-MCs 5-Methylcytosines
A Adenine
ANOVA One-way analysis of variance
ASR Age standard ratio
BCL2 B-cell lymphoma 2
C Cytosine
Calmodulin Calcium-bound calmodulin 2
CaMK Calcium/calmodulin-dependent kinase
CELSR3 Cadherin EGF LAG seven-pass G-type receptor 3
CH3- Methyl
COBRA Combined bisulfite restriction analysis
CpG Cytosine-Guanine
DAB Diaminobenzidine
DAPK Death associated protein kinase
dd Dideoxynucleotides
DDAH2 Dimethylarginine dimethylaminohydrolase 2
ddH2O Double distilled water
ddNTPs Dideoxynucleotide triphosphate
DNMTs DNA nucleotide methyltransferases
DNP 2,4-dinitrophenol
dNTPs Deoxynucleoside triphosphates
xxiii
dRNs Deoxyribonucleotides
DUSP Dual specificity phosphatase
EBV Epstein–Barr virus
EGCG Epigallocatechin-3–gallate
FDR False discovery rate
FFPE Formalin fixed paraffin embedded
G Guanine
GSTP1 Glutathione S-transferase gene
H&E Haematoxylin and Eosin
H2O2 Hydrogen peroxide
HDACs Histone deacetylases
HNSCC Head and neck squamous cell carcinoma
HP1 Heterochromatin protein 1
HRP Horseradish peroxidase
lincRNAs Large intergenic non- coding RNAs
MAPKs Mitogen-activated protein kinase
MCs Methylcytosines
MEF2D Myocyte Enhancer Factor 2D
MGMT Methylguanine-DNA methyltransferase
Mins Minutes
ml Mililiter
mM Mili Molar

xxiv
MOCDTBS Malaysia Oral Cancer Database and Tissue Bank System
MS-HRM Methylation-sensitive high-resolution melting
MSPCR Methylation-specific polymerase chain reaction
MS-SNuPE Methylation-sensitive single nucleotide primer extension
nc RNAs Non-coding RNAs
NCR National Cancer Registry
ng Nanogram
NORs Nucleolar organizing regions
NTP Nucleoside triphosphate
OCRCC Oral Cancer Research and Coordinating Centre
OSCC Oral Squamous Cell Carcinoma
p101 PI3K regulation class IB
PCA Principle Component Analyses
PCP Planar cell polarity
Pik3r5 Phosphoinositide-3-kinase, regulatory subunit 5
piRNAs PIWI-interacting RNAs
RefSeq Reference sequence
RR Ribonucleotide reductase
RRM2 Ribonucleotide reductase small subunit M2
RT-PCR Real-time polymerase chain reaction
SAM S-Adenosyl-L-Methionin
SCC Squamous cell carcinoma

xxv
snoRNAs Small nucleolar RNAs
SPSS Statistical Package for Social Sciences
T Thymine
TBS Tris phosphate buffer
TP 73 Tumour protein 73
TSS Transcription start site
T-UCRs Transcribed ultra-conserved regions
U Uracil
ul Microliter
µg Microgram
μm Micrometer
USA United States of America
VEGF Vascular endothelial growth factor
WHO World Health Organization