universiti putra malaysia time-uncertainty analysis … filetime-uncertainty analysis by using...
TRANSCRIPT
UNIVERSITI PUTRA MALAYSIA
TIME-UNCERTAINTY ANALYSIS BY USING SIMULATION IN PROJECT SCHEDULING NETWORKS
ANWAR MOHAMMED OMER
FK 1999 39

TIME-UNCERTAINTY ANALYSIS BY USING SIMULATION IN PROJECT SCHEDULING NETWORKS
By
ANWAR MOHAMMED OMER
Thesis Submitted in Partial Fulfilment of the Requirements for the Degree of Master of Civil Engineering
in the Faculty of Engineering Universiti Putra Malaysia
December 1999

Dedicated to my late mother, Mariam Mohd A I-A dar,
May Allah (s. w.t) rest her soul in peace.
11
Abstract of thesis presented to the Senate of Universiti Putra Malaysia in partial fulfilment of the requir�ments for the degree of Master of Science
Time-Uncertainty Analysis by Using Simulation in Project Scheduling Networks
By
Anwar Mohammed Omer
December 1 999
Chairman : L. Jawahar Nesan, Ph.D.
Faculty : Engineering
Risks are inherently present In all construction projects. Quite often,
construction projects fail to achieve their time quality and budget goals. Risk
management is a subject, which has grown in popularity during the last decade. It is
a formal orderly process for systematically identifying, analysing and responding to
risks associated with construction projects so as to reduce the effects of these risks
to an acceptable level. Risk analysis is primarily concerned with evaluating
uncertainties. The purpose of risk analysis is to enable a decision-maker to take an
appropriate response in advance against a possible occurrence of a problem. In this
study, Monte Carlo simulation as a tool of risk analysis was used.
The merge event bias as one of the essential problems associated with
PERT is discussed, along with models and approaches developed by other
III
researchers, namely, Probabilistic Network Evaluation Technique (PNET
algorithm), Modified PNET, Back-Forward Uncertainly Estimation procedure
(BFUE) and concept based on the robust reliability idea. These developed
approaches are more reliable in planning construction projects compared to PERT
because they attempt to handle the merge event bias problem.
In addition, this study demonstrates a number of benefits. the most
significant among them being that: ( 1 ) Formal risk management tec1miques are
rarely used in construction. Dealing with risk management in construction is now
essential for minimizing losses and to enhance profitability. (2) It is very dangerous
to rely only on PERT/CPM conventional techniques in scheduling projects. (3) To
use floats, as stated by traditional resource allocation method, is not practicable. (4)
For a project network, the likelihood completion date of a project is exactly equal
to the product of the probabilities of each path, separately, with respect to a project
completion date. Using simulation now validates this statement. (5) The
computation error of a project likelihood completion date is less than 10 percent if
a path of a float greater than twice the larger standard deviation of this mentioned
path and the critical path is dropped from the calculation, and (6) An effective risk
response framework is introduced to help contractors systematically manage the
risk in scheduling their projects.
iv
Abstrak tesis yang dikemukakan kepada Senat Universiti Putra Malaysia sebagai memenuhi sebahagian daripada keperluan untuk Ijazah Master Sains
Pengerusi
Fakulti
Analisis Waktu-Taktentu Dengan Menggunakan Simulasi Dalam Jaring Projek Penjadualan
Oleh
Anwar Mohamad Omar
Disember 1 999
: L. Jawahar Nesan, Ph.D
: Kejuruteraan
Risiko wujud secara semulajadi dalam projek-projek pembinaan. Projek
pembinaan seringkali gagal mencapai kualiti masa dan peruntukan yang telah
ditetapkan. Pengurusan risiko merupakan suatu subjek yang berkembang dengan
popular sejak dekad yang lepas. Ia merupakan proses formal yang teratur bagi
pengenalpastian secara sistematik, analisis dan respon terhadap risiko yang
berkaitan dengan projek-projek pembinaan serta untuk mengurangkan kesan risiko-
risiko ini kepada paras yang sepatutnya. Analisis risiko sangat penting dalam
menilai ketidaktentuan. Tujuan analisis risiko ialah untuk membolehkan pembuat
keputusan memberi respon sebaik-baiknya dengan lebih awal bagi mengelakkan
v
masalah yang akan wujud. Dalam kajian ini, simulasi Monte Carlo sebagai alat
untuk analisis risiko telah diguna kan.
'The merge event bias' yang merupakan masalah utama berkaitan dengan
PERT dibincangkan bersama model-model dan pendekatan yang dibangunkan oleh
para penyelidik, ialah, 'Probabilistic Network Evaluation Technique (PNET
algorithm), Modified PNET, Back-Forward Uncertainly Estimation procedure
(BFUE)' dan konsep berasaskan idea yang bemas dan boleh dipercayai .
Pendekatan yang berkembang ini lebih dirujuk dalam merancang projek-projek
pembinaan berbanding PERT kerana ia cuba menyelesaikan masalah 'merge event
bias'.
Di samping itu, kaj ian ini juga menunjukkan beberapa kebaikan dan yang
paling signifikan antaranya yakni : (1 ) teknik-teknik pengurusan risiko yang formal
jarang digunakan dalam pembinaan. Berurusan dengan pengurusan pembinaan
yang berisiko kini ternyata dapat meminimum kerugian dan rnempertingkat
keuntungan. (2) merbahaya sekiranya bergantung hanya kepada teknik PERT/CPM
yang konvensional dalam menjadual projek. (3) rnenggunakan jalur lebih rnasa
seperti dinyatakan dengan kaedah penumpuan sumber tradisional . (4) bagi suatu
jaring projek, tarikh rnatang kebolehjadian suatu projek ialah sarna dengan hasil
dari peluang pada setiap jalur secara terpisah dengan merujuk kepada tarikh rnatang
projek. Kenyataan ini kini telah disahkan dengan penggunaan simulasi. (5) ralat
penghitungan dari tarikh matang kebolehjadian suatu projek hanya kurang daripada
vi

1 0 peratus jika suatu jalur lebih masa adalah lebih besar daripada dua kali ganda
simpangan baku terbesar dari jalur terse but dan jalur genting dikesampingkan dari
penghitungan, dan (6) rangka kerja respon berisiko yang efektif diperkenalkan bagi
membantu para kontraktor mengurus secara sistematik risiko-risiko dalam
penjadualan projek-projek merka.
VII
ACKNOWLEDGEMENTS
Praise to ALLAH (S.W.T) for giving me the strength and patience to
complete this work. My deepest appreciation and sincere gratitude to Chairman of
my Supervisory Committee, Dr. L. lawahar Nesan for his valuable suggestion,
guidance and encouragement during all stages of this study. I am also very grateful
to other members of my Supervisory Committee, Assoc. Prof. Dr. Mohd Razali, the
Deputy Dean of Faculty of Engineering and Ir. Salahuddin, General Manager of
housing Research Center, for their kind co-operation and helpful comments.
I would like to expand my thanks to my friends, Faiz El-faki and Ehlam
abdulhadi for their effective and strong support. I am also grateful to all Executive
Managers of my current Employer (N.G.C) in Saudi Arabia for giving me this
chance to pursue my masters degree. Finally, I am really indebted to my parents,
especially my mother who passed away during the final stage of this study, for their
continuous prayers and real supports, my heartfelt thanks and warmest gratitude go
to them.
viii

I certify that an Examination Committee met on 31 December 1999 to conduct the final examination of Anwar Mohammed Orner on his Master of Science thesis entitled "Time-Uncertainty Analysis by Using Simulation in Project Scheduling Networks" in accordance with Universiti Pertanian Malaysia (Higher Degree) Act 1980 and Universiti Pertanian Malaysia (Higher Degree) Regulation 1981. The Committee recommends that the candidate be awarded the relevant degree. The Committee Members for the candidate are as follows:
ABDUL AZIZ ABDUL SAMAD, PhD. Associate Professor Faculty of Engineering Universiti Putra Malaysia (Chainnan)
JA WAllAR L NESAN, PhD.
Faculty of Engineering Universiti Putra Malaysia (Member)
MOB». RAZALI ABD. KADIR, PhD. Associate ProfessorlDeputy Dean Faculty of Engineering Universiti Putra Malaysia (Member)
SALAHUDDIN HASHIM, M.Sc. Faculty of Engineering Universiti Putra Malaysia (Member)
M��HAYIDIN'Ph.D. ProfessorlDeputy Dean of Graduate School Universiti Putra Malaysia
Date: II 7 JAN �ouo
JX

This thesis submitted to the Senate of Universiti Putra Malaysia and was accepted as partial fulfilment of the requirements for the degree of Master of Science.
KAMIS A WANG, Ph.D. Associate ProfessorlDean of Graduate School Universiti Putra Malaysia
Date: 1 0 FEB leOn
x

DECLARATION
I hereby declare that the thesis is based on my original work except for quotations and citations, which have been duly acknowledged. I also declare that this thesis has not been previously or concurrently submitted for any other degree at UPM or any
other institutions.
Signed
Anwar Mohammed Omer
Date: 1"7-(01/20(> 0
xi

TABLE OF CONTENTS
Page DEDICATION......... ..................... ... ........................ ...... ............ 11 ABSTARCT....... . ... ... . . . . . . . ....................................................... ... III ABSTRAK . . . . . . . . . . . . . . . . . . . . . . . . . . . . . . . . . . . . . . . . . . . . . . . . . . . . . . . . . . . . . . . . . . . . . . . . . . . . . . ... v AKNOWLEDGEMENTS.............................................................. Vlll APPROVAL SHEETS.................................................................. IX DECLARATION FORM . .. . . . . . . . ... . . . . . ... . ..... . . . ... . . . . ... ... . . . . . . . . . ..... . . . ... Xl LIST OF TABLES.............................. . . . . . . . . . . . . . . . . . . . . . . . . . . . . . . . . . .. . . . . . . xiv LIST OF FIGURES..................................................................... XVI
CHAPTER
I INTRODUCTION ..................................................... 1
Contents of the Thesis . . . . . . . . . ...... . .... . . . . . . . . ... . . . . . ....... . ...... 3 Problem Background . . . . . . .... .... . . . . ... . . . . . . . .... ... ... . . . . .. . . ..... 6 Scope of the Study . . . . . . . . . . . . . . . . . . . . . . . . . . . . . . . . . . . . . . . . . . . . . . . . . . . . . . 9 The Objective of Study . . . '" . . . . . . . . . . . . . . . . . . . . . . . . . . . . . . . . . . . . . . . . . . 1 1 Risk and Uncertainty . . . . . . . . . . . . . . . . . . . . . . . . . . . . . . . . . . . . . . . . . . . . . . . . . . . 1 2 Risk Management . . . . . . . . . . . . . . . . . . . . . . . . . . . . . . . . . . . . . . . . . . . . . . . . . . . . . . 1 4
Risk Identification . .... . ... . . .... . . . .. . . . . . .... ... . . .... . . . ..... , 1 6 Risk Analysis . . . . . . . . .. . . . . .. . . . . . . . . . . .... . . . . . . .. . .. ... . . . . . ... 1 8 Benefits of Risk Analysis .. . . . . .. . . . . ... . . . . . . . . . . ....... . . . .... 1 9 Risk Response . . . . . . . . . ....... .... . . . . . . . .. . . . . . . . .. ............. 20
Risk in Construction Projects ....... . . . ... . . .. . . . ..... . . . ... . .. . .... 22
II RISK MANAGEMNT IN CONSTRUCTION ................... 24 Introduction . .. . . . . . . . . . . . . . . . . . . . . . . . . . . . . . . . . . . . . . . . . . . . . . . . . . . . . . . . . . . . 24 PERT Network . . . . . . . . . . . . . . . . . . . . . . . . . . . . . . . . . . . . . . . . . . . . . . . . . . . . . . . . . . . 27
Problems with PERT. . . . . . . . . . . . . . . . . . . . . . . . . . . . . . . . . . . . . . . . . . . 29 Merge Event Bias . . . . . . . . . . . . . . . . . . . . . . . . . . . . . . . . . . . . . . . .. . . . . . . . . . . . . . . 32
PNET Algorithm . . . . . . . . . . . . . . . . . . . . . .. . . . .. . . . ... . . . . .. . . . . . .. 34 BFUE Approach . . . ... . . . . . . . . . . . . . . . . . . .. . . . . . . . . . . . . . . . . . . . . . 42
CIM Model . . . . ... ..... ...... . ....... . . ... .... . . .. ...... ... . . . . . . . . . . .. . .. 48 Computation Error in CIM . . . ... .. . . . ... . ... . . . .... . . . . . . . . . . . 53
Sensitivity Analysis. . . . . . . . . . . . . . . . . . . . . . . .. ... . . . . . . . . .. . . . . . . . . . . . . . . . 55 TAPAS Approach . . . . . . ... . . .. . . . . . . . .. . . . . . ..... . ..... . . .... ... . . . . . . . 57 Risk Management Framework . . . . . . . . . . . . . . . . . . . . . . . . . . . . . . . . . . . . . . . . 59 Simulation Model . . . ...... . ..... . ..... . . . . . ..... . . . ..... . . . . .. . . . . . .... . 63 Robust Reliability . . . . . . .. . . .. . . . . . . . . . . . . . . . . . . . . . . . . . . . . . . . . . . . . . . . . . . . 67 Risk Analysis Softwares ... ....... . .. . . . . . . . . . . . . . . . . . . . . . . . . . . . . . . . . . . . 71
DynRisk . . . . ... . . . . .. . ............... . . . . . . . . . . . ... . . ... ... . . .... 71 VISIER ... . . . . .... . . . . . . . ...... . . ..... . . . . . . . . . . . . . . . .... . .. . ..... 72
xii
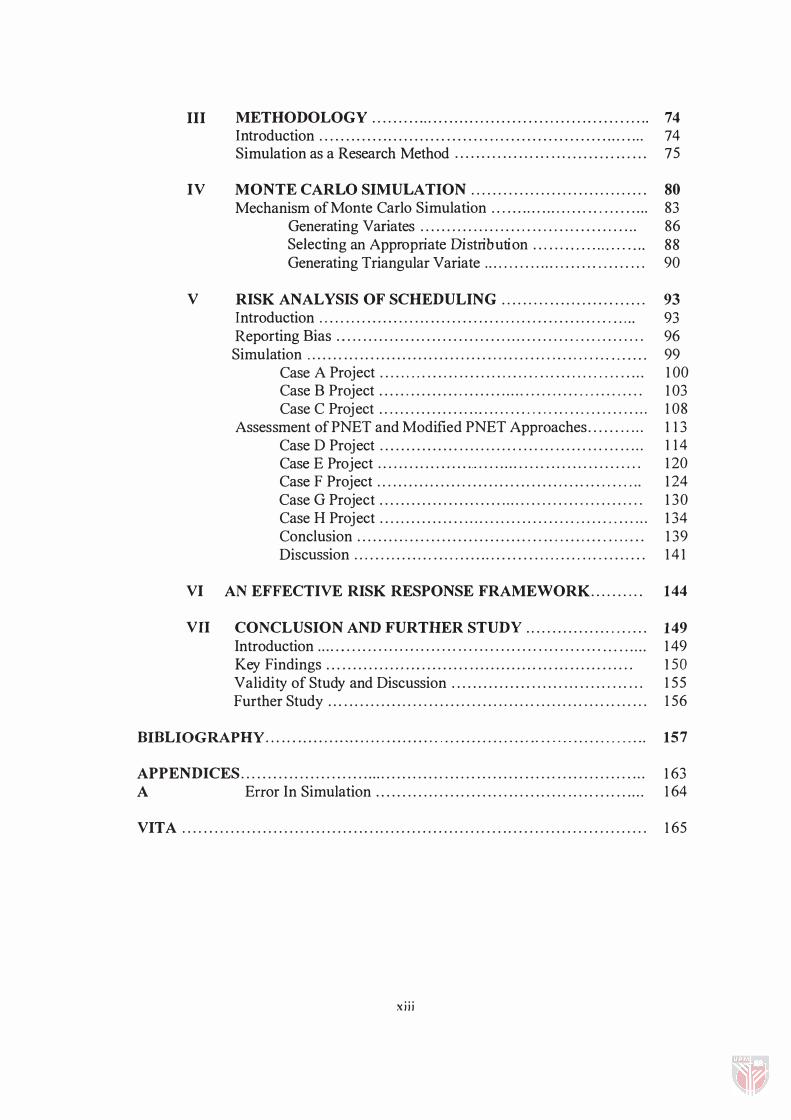
III METHODOLOGy......... ... . . . . . . . . . . . . . . . . . . . . . . . . . . . . . . . . . . . . . . . . . 74 Introduction . . . . . . . . . . . . . . . . . . . . . . . . . . . . . . . . . . . . . . . . . . . . . . . . . . . . . ... . . . ... 74 Simulation as a Research Method . . . . . . .. . . . . . . . . . . ... . . . . . . . . . . .. . . . 75
IV MONTE CARLO SIMULATION ................................. 80 Mechanism of Monte Carlo Simulation . .. . . . .. . . . . . . . . . . . . .. . . . . . . . .. 83
Generating Variates . . . . . . . . .. . . . . . . . . . . . . . . . . ... . . . . . . . . . ... 86 Selecting an Appropriate Distribution . . . ... ... ....... . . .... 88 Generating Triangular Variate . . .. . . . . . .. ... . . . .. . . . .. . . . . . .. 90
V RISK ANALYSIS OF SCHEDULING ......... ...... ...... . ..... 93 Introduction . . . . . . . . . . . . . . .. .. . . . . .. . . . . .. . . . . . . . . . . . . . . . . . . . . . .. .. . ... . 93 Reporting Bias .. ... . . . . . . . . . . .. . . . . . . . . . . . . . . . .......................... 96 Simulation .. . . . . . . . . .. . . . . . . . . . . . .. . . .. . . .. . . . . . . .. . .. . . . .. .. . . . . " . .. .... 99
Case A Project . . . . . ... . . . . . . . .. . . . . . . . . . . . .. ... .. . . . . .... . . . . ... 100 Case B Project . . . . . . . . . . . . . . . . . . . . . . . ........................... 103 Case C Project . . . . . .. . . ... . . . . . ... . .. . . . . . .. .. . . . . . ..... . . . . . . . .. 108
Assessment of PNET and Modified PNET Approaches . . . . . . ..... 113 Case D Project . . . . . . . . . . . . . . . ........... . ... ... ..... . ... . . . ..... 114 Case E Project . .. . . .. . . . . . . . . . . . ,' . . . . .... . . . . . . . . . . . . . . . . . . . . . . . 120 Case F Project . . . . . . . . . . . . . . . . . . . . . . . . . . . . . . . . . . . .. . . . . . . . . . .. . . 124 Case G Project . . . . . . . . . . . . . . . . . . . . . . . ........................... 130 Case H Project . . . . . . . . . . . . . . . . ................................ ... 134 Conclusion . . . . . . . . . . . . . . . . . . . . . . . . . . . . . . . . . . . . .. . . . . . . . .. . . . . . . . 139 Discussion . . . . .. . . . . . . . .. . . . .. . . . . .. . . . . . . . . . . . .... . .. . . . .. .. . . . . 141
VI AN EFFECTIVE RISK RESPONSE FRAMEWORK.......... 144
VII CONCLUSION AND FURTHER STUDy....................... 149 Introduction . . . . . . . . . . . . . . . . . . . . . . . . . . . . . . . . . . . . . . . . . . . . . . . . . . . . . . . . . . . .... 149 Key Findings . . . ........................ ............. ... ... ... ... ...... ISO Validity of Study and Discussion . . . . . . . . . . . . . . . ...... ... ...... . .. ... 155 Further Study . . . . . . .... . . . . . .................. ...... ......... .... .. ... ... 156
BIBLIOGRAPHY . . . . . . . . . . . . . . . .. . . .... . . . . . . . . '" ..................... '" ... . .. . . . ..... 157
APPENDICES....................................... ...... ......... ... ... ............ ..... 163 A Error In Simulation . . . . .. . .. . .. .. .. .. .. . .. .. . .. .. .. .. .. .. . .. .. .. .. .... 164
VITA . . . . . . . . . . . . . . . . . . . . . . . . . . . . . . . . . . . . . . . . . . . . . . . . . . . . . . . . . . . . . . . . . . . . . . . . . . . . . . . . . . . . . . . 165
xiii
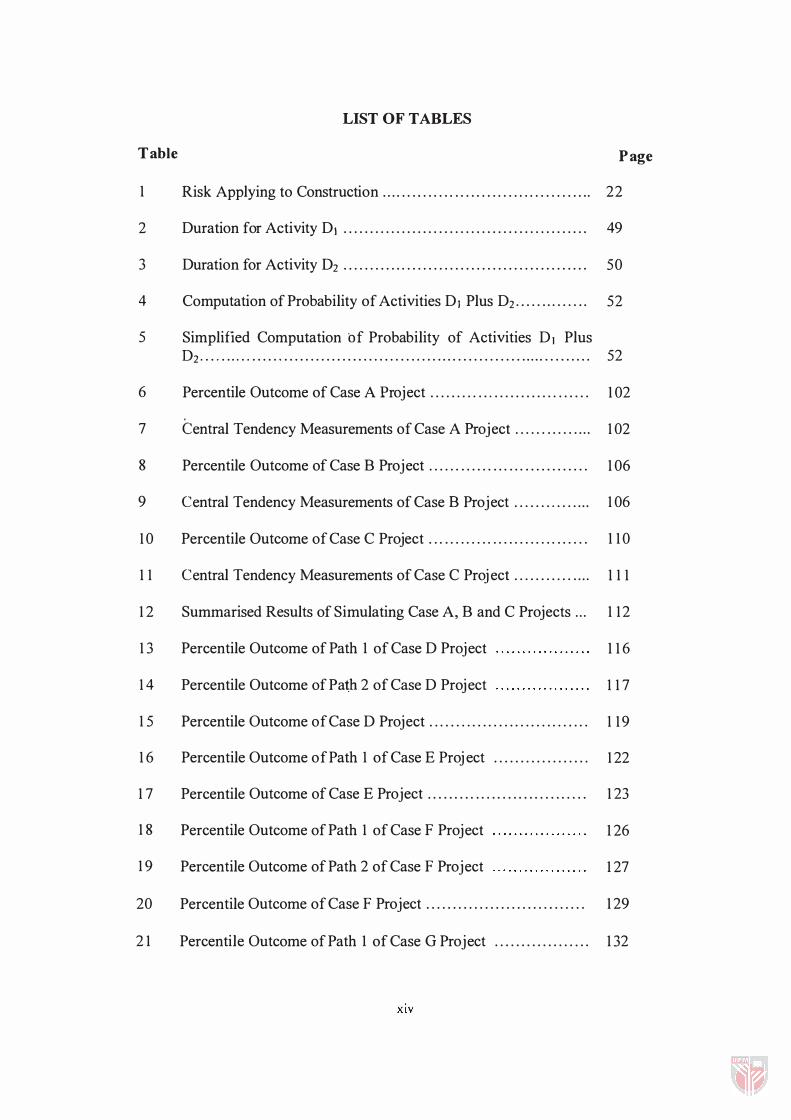
LIST OF TABLES
Table Page
1 Risk Applying to Construction . . . . . . . . . . . . . . . . . . . . . . . . . . . . . . . . . . . . . . . . 22
2 Duration for Activity DJ . . . . . . . . . . . . . . . . . . . . . . . . . . . . . . . . . . . . . . . . . . . . . . 49
3 Duration for Activity D2 . . . . . . . . . . . . . . . . . . . . . . . . . . . . . . . . . . . . . . . . . . . . . . 50
4 Computation of Probability of Activities D) Plus D 2 . . . . . . . . . . . . . . 52
5 Simplified Computation of Probability of Activities D) Plus D 2 . . . . . . . . . . . . . . . . . . . . . . . . . . . . . . . . . . . . . . . . . . . . . . . . . . . . . . . . . . . . . . . . . . . . . . . . . . . 52
6 Percentile Outcome of Case A Project . . . . . . . . . . . . . . . . . . . . . . . . . . . . . . 1 02
7 Central Tendency Measurements of Case A Project . . . . . . . . . . . . . . . 1 02
8 Percentile Outcome of Case B Project . . . . . . . . . . . . . . . . . . . . . . . . . . . . . . 1 06
9 Central Tendency Measurements of Case B Project . . . . . . . . . . . . . . . 1 06
1 0 Percentile Outcome of Case C Project . . . . . . . . . . . . . . . . . . . . . . . . . . . . . . 1 1 0
1 1 Central Tendency Measurements of Case C Project . . . . . . . . . . . . . . . 1 1 1
1 2 Summarised Results of Simulating Case A, B and C Projects . . . 1 1 2
1 3 Percentile Outcome of Path 1 of Case D Project 1 16
1 4 Percentile Outcome of PaUI 2 of Case D Project 1 1 7
1 5 Percentile Outcome of Case D Project . . . . . . . . . . . . . . . . . . . . . . . . . . . . . . 1 1 9
16 Percentile Outcome of Path 1 of Case E Proj ect . . . . . . . . . . . . . . . . . . 1 22
1 7 Percentile Outcome of Case E Project . . . . . . . . . . . . . . . . . . . . . . . . . . . . . . 1 23
1 8 Percentile Outcome of Path 1 of Case F Project 1 26
1 9 Percentile Outcome of Path 2 of Case F Project 1 27
20 Percentile Outcome of Case F Project . . . . . . . . . . . . . . . . . . . . . . . . . . . . . . 1 29
2 1 Percentile Outcome of Path 1 of Case G Project . . . . . . . . . . . . . . . . . . 1 32
XIV

22 Percentile Outcome of Case G Project . . . . . . . . .. . . . . . . . . . . . . . . . . . . . . 133
23 Percentile Outcome of Path 1 of Case H Project . . . . . . . . . . . . . . . . . . 136
24 Percentile Outcome of Case H Project . . . . . . . . . . . . . . . . . . . . . . . . . . . . . . 137
25 Summarised Results of Simulation Case D, E, F, G and H Project . . . . . . . . . . . . . . . . . . . . . . . . . . . . . . . . . . . . . . . . . . . . . .. . . . . . . . . . . . . . . . . . . . . . 138
xv
LIST OF FIGURES
Figure Page
1 Risk Management Cycle. . . . . . . . . . . . . . . . . . . . . . . . . . . . . . . . . . . . . . . . . . . . . . . 1 5
2 Project Duration Assuming a Varity of Critical Routes Through the Network . . . . . . . .. . . . . . .. . ... .... . . . ..... . . . . ...... . . . . . . . . . . . . . ... . . . 29
3 Discrete Probability Tree for Activity D\. . . . . . . . . . . . . . . . . . . . . . . . . . . 49
4 Rectangular Histogram for Activity D\. . . . . . . . . . . . . . . . . . . . . . . . . . . . . . . 49
5 Discrete Probability Tree for Activity D2 . . . . . . . . . . . . . . . . . . . . . . . . . . 50
6 Rectangular Histogram for Activity D2 . . . . . . . . . . . . . . . . . . . . . . . . . . . . 5 1
7 Probability Tree for Activity 0\ Plus D2 . . . . . . . . . . . . . . . . . . .. . .. . . . . 5 1
8 The Independent Addition of D\ Plus D2 . . . . . . . . . . . . . . . . . . . . . . . . . . . 54
9 Probability Density Distribution for D\ Plus D2 . . . . . . . . . . . . . . . . . . .. 55
10 Example of a 70% Contour on a Sensitivity Diagram. . . . . . . . . . . . . 57
1 1 Risk Identification Process Framework. . . . . . . . . . . . . . . . . . . . . . . . . . . . . . 6 1
12 Risk Analysis and Evaluation Process Framework. . . . . . . . . . . . . . . . 62
13 Objectives of Response Management Strategies . . . . . . . . . . . . . . . . .. . 62
14 Risk Simulation Methodology . . . . . . . . . . . . . . . . . . . . . . . . . . . . . . . . . . . . . . . . 65
15 Simulation Modeling Process . . . . . . . . . . . . . . . . . . . . . . . ... . . . . . . .. . . . . . . . 66
16 Flow Diagram of Monte Carlo Simulation. . . . . . . . . . . . . . . . . . . . . . . ... 85
17 Transforming a Random Number into Duration. . . .. . . . . . . . . . . . . . .. 88
18 Risk and Conservative Forecasts . .. . . . . . . . .. . . . . . . . . . . . . . . . . . . . . . . . . . 98
19 PERT Diagram of Case A Project. . . . . . . .. . . . . . . . . . . . . . . . . . . . . . . . . . . . 100
20 Histogram of Case A Project. . . . . . . . . . . . . . . . . . . . . . . . . . . . . . . . . . . . . . . . . . 101
2 1 Cumulative Distribution Function of Case A Project . . . . . . . . . .. . .. 1 0 1
xvi
22 PERT Diagram of Case B"Project. . . . . . . . . . . . . . . . . . . . . . . . . . . . . . . . . . . .. 104
23 Histogram of Case B Project . . . . . . . . . . . . . . . . . . . . . . . . . . . . . . . . . . . . . . . '" 1 05
24 Cumulative Distribution Function of Case B Project . . . . . . . . . . . . . . 105
25 The Relative Criticality of Case B Project Activities . . . . . . . . . . . . . . 107
26 PERT Diagram of Case C Project. . . . . .. . . . . . . . . . . . . . . . . . . . . . . . . . . . . . . 109
27 Histogram of Case C Project. . . . . . . . . . . . . . . . . . .. . . . . . . . . . . . . . . . . . . . . . . 109
28 Cumulative Distribution Function of Case C Project . . . . . . . . . . . . . . 110
29 PERT Diagram of Case D Project . . . . . . . . . . . . . . . . . . . . . . . . . . . . . . . . . . . . . 1 14
30 Histogram of Path 1 of Case D Project . . . . . . . . . . . . . . . . . . . . . . . . . . . .. . 115
3 1 Cumulative Distribution Function of Path 1 of Case D Project . . 1 1 5
32 Histogram of Path 2 of Case D Project . . . . . . . . . . . . . . . . . . . . . . . . . . . 1 16
33 Cumulative Distribution Function of Path 2 of Case D Project . . 1 17
34 Histogram of Case D Project . . . . . . . . . . . . . . . . . . . . . . . . . . . . . . . . . . . . . . . . . . 1 18
35 Cumulative Distribution Function of Case D Project. . . . . .. . . . . . . . 1 1 8
36 PERT Diagram of Case E Project . . . . . . . . . . . . . . . . . . . . . . . . . . . . . . . . . . . . . 120
37 Histogram of Path 1 of Case E Project. . . . . . . . . . . . . . . . . . . . . . . . . . . .. . 12 1
38 Cumulative Distribution Function of Path 1 of Case E Project . . 12 1
39 Histogram of ease E Project. . . . . . . . . . . . . ............................. 122
40 Cumulative Distribution Function of Case E Project. . . . . . . . . . . . . . 123
4 1 PERT Diagram of Case F Project. . . . . . . . . . . . . . . . . . . .. . . . . . .. . . . . . .. . . 124
42 Histogram of Path 1 of Case F Project. . . . . . . . . . . . . . . . . . . . . . . . . . . . . . 125
43 Cumulative Distribution Function of Path 1 of Case F Project . . 125
44 Histogram of Path 2 of Case F Project . . . . . . . . . . . . . . . . . . . . . . . . . .. 126
xvii

45 Cumulative Distribution Function of Path 20f Case F Project . . 127
46 Histogram of Case F Project . . . . . . . . . . . . . . . . . . . . . . . . . . . . . . . . . . . . . . . . . . 128
47 Cumulative Distribution F:unction of Case F Project . . . . . . . . . . . . . . 128
48 PERT Diagram of Case G Project . . . . . . . . . . . . . . . . . . . . . . . . . . . . . . . . . . . . . 130
49 Histogram of Path 1 of Case G Project . . . . . . . . . . . . . . . . . . . . . . . . . . . . . . 13 1
50 Cumulative Distribution Function of Path 1 of Case G Project . . 13 1
5 1 Histogram of Case G Project . . . . . . . . . . . . . . . . . . . . . . . . . . . . . . . . . . . . . . . . . . 132
52 Cumulative Distribution Function of Case G Project . . . . . . . . . . . . . 133
53 PERT Diagram of Case H Project . . . . . . . . . . . . . . . . . . . . . . . . . . . . . . . . . . . . . 134
54 Histogram of Path 1 of Case H Project . . . . . . . . . . . . . . . . . . . . . . . . . . . . . . 135
55 Cumulative Distribution Function of Path 1 of Case H Project . . 135
56 Histogram of Case H Project . . . . .. . . . . . . . . .. . . . . . . . . . . . . . . . . . . . . . . . . . . 136
57 Cumulative Distribution Function of Case H Project . . . . . . . . . . . . . 137
58 Objective of Response Management Strategies For a Risk Associated in Scheduling . . . . . . . . . . . . . . . . . . . . . . . . . . . . . . . . . . . . . . . . . . . . . . 148
xviii
CHAPTER 1
INTRODUCTION
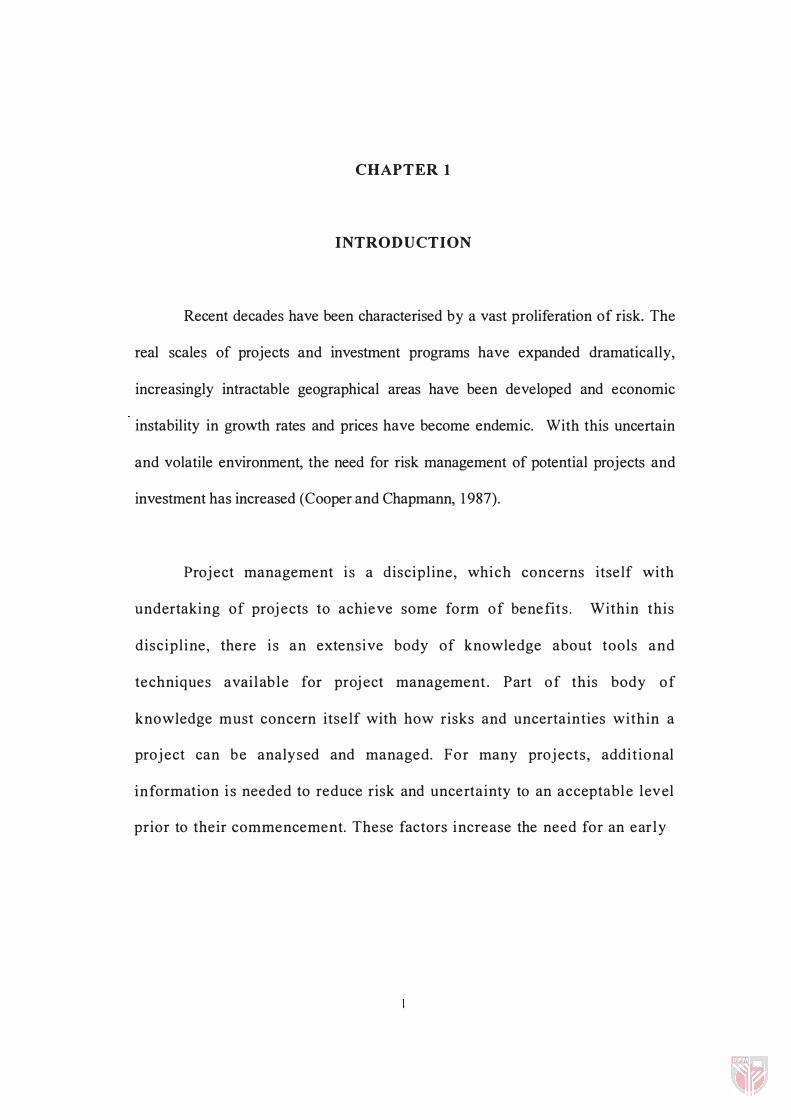
Recent decades have been characterised by a vast proliferation of risk. The
real scales of projects and investment programs have expanded dramatically,
increasingly intractable geographical areas have been developed and economic
instability in growth rates and prices have become endemic. With this uncertain
and volatile environment, the need for risk management of potential projects and
investment has increased (Cooper and Chapmann, 1987).
Proj ect management is a discipline, which concerns itself with
undertaking of proj ects to achieve some form of benefits . Within this
discipline, there is an extensive body of knowledge about tools and
techniques available for proj ect management . Part of this body of
knowledge must concern itself with how risks and uncertainties within a
proj ect can be analysed and managed. For many proj ects, additional
information i s needed to reduce risk and uncertainty to an acceptable level
prior to their commencement. These factors increase the need for an early

2
assessment of the uncertainties and risks, which affect the proj ect before
large sums of money are irrevocably committed (Cooper and Chapmann,
1 987) .
A proj ect risk is an implication of the existence of significant
uncertainties about the level of the proj ect performance. A source of risk
i s any factor that can affect a proj ect performance, and risk arises when
this effect is both uncertain and significant in its impact on the proj ect
performance . It fol ,lows that the definition of proj ect obj ectives and
performance criteria has a fundamental influence on the level of proj ect
risk .
Experience from many proj ects indicates poor performance in
terms of achieving time and cost targets (Perry, 1986) . Many cost and
time overruns all occur due to either unforeseen events, which may or may
not have been possible for experienced professionals to anticipate, or
foreseen events for which uncertainty was appropriately accommodated. It
is suggested that a significant improvement to project performance may
result from a greater attention allotted to the whole process of risk
management (Perry, 1986) .
Laufer and Tucker ( 1 988) concluded that uncertainty i s not an
exceptional state in the otherwise predictable process of construction
3
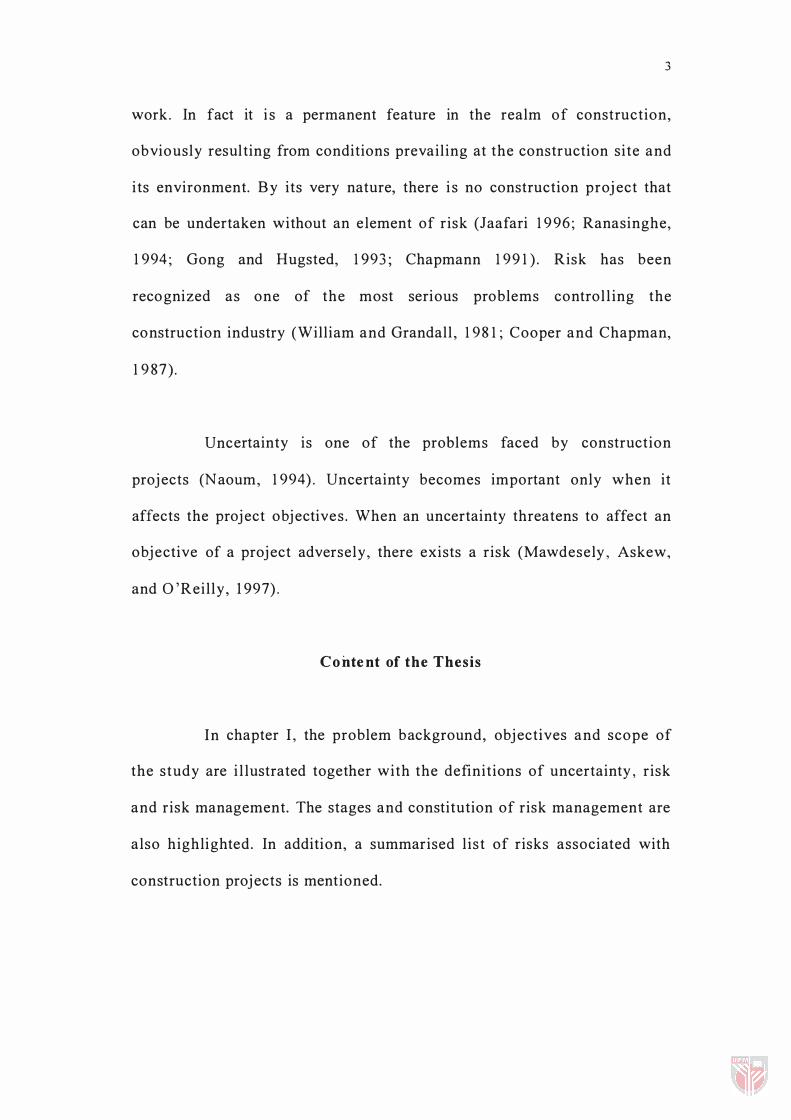
work . In fact it i s a permanent feature in the realm of construction,
obviously resulting from conditions prevailing at the construction site and
its environment. By its very nature, there i s no construction project that
can be undertaken without an element of risk (Jaafari 1996 ; Ranasinghe,
1994 ; Gong and H ugsted, 1993 ; Chapmann 199 1) . Risk has been
recognized as one of the most serious problems control l ing the
construction industry (William and Grandall , 198 1; Cooper and Chapman,
1987) .
Uncertainty is one of the problems faced by construction
proj ects (Naoum, 1994) . Uncertainty becomes important only when it
affects the proj ect obj ectives . When an uncertainty threatens to affect an
obj ective of a proj ect adversely, there exists a risk (Mawdesely, Askew,
and O'Reilly, 1 997) .
Content of the Thesis
In chapter I, the problem background, obj ectives and scope of
the study are i l lustrated together with the definitions of uncertainty, risk
and risk management. The stages and constitution of risk management are
also highlighted. In addition, a summarised l ist of risks associated with
construction proj ects is mentioned.
4
Chapter I I presents problems associated with the conventional
PER T technique . The models and approaches developed to handle the
merge event bias, which is the recognised problem of PERT, are also
highlighted. A risk management framework known, as Construction Risk
Management System (CRMS) is discussed as a logical substitute for
tradi tional intuitive procedures currently used by most contractors. Also,
the development of a simulation model i s mentioned . This model is used
to estimate the performance of the proj ect obj ectives under the occurrence
of the perceived r�sks . In addition to that, softwares recently developed to
analyse risks associated with construction proj ects are also presented.
Chapter I I I i l lustrates the methodology used in this study, whish
i s mainly based on simulation. S imulation i s used in this study to test the
standard PERT technique so as to explore the uncertainty and to quantify
the risk associated with proj ect schedul ing. Also, simulation i s used to
ascertain whether there are any discrepancies in using the standard PERT
technique in scheduling construction projects. In addition, simulation is
used to assess the PNET and modified PNET approaches, which are
developed to handle the merge event bias problem of conventional PERT
technique. The PNET and modified PNET approaches are discussed in
detail s in chapter I I .
In chapter IV, Monte Carlo simulation as a stochastic computer
model, which is used in this study is discussed. The generation variates
and the mechanism of Monte Carlo concept are also i l lustrated. In
addition to that, the selection of an appropriate distribution based on the
concept of Monte Carlo is also interpreted.
Chapter V consists of two sections. In the first section, three
case studies are presented using a simple scheduling project. Monte Carlo
:"imulation is used to simulate the standard PERT technique so as to
explore and quantify the opportunity or risk associated with a proj ect
schedul ing . The magnitudes of bias of the three proj ect networks are
calculated. Moreover, the relative critical ity of each activity in multiple
path networks is indicated and hence the highest risk activities can be
clearly nominated . The results and conclusions of the analysis are also
presented.
In the second section, five case studies are presented. Monte Carlo
simulation is used in this section to evaluate the following statements:
First, "for a project network, the likelihood completion date of a project is
exactly equal to the product of the probabilities of each path, seperately, with
respect to a project completion date" ; and
6
Second, "In a project network, if a path has a float greater than twice the
larger standard deviation of this path and the critical path is dropped from the
calculation of a project likelihood completion date, the bias correction in caculating
the likelihood completion date of a project will be less than a few percent and can
be ignored."
In chapter VI, an effective risk response framework is intruduced to manage
the risk associated with time scheduling in construction projects. This framework
can be seen as a logical substitute for the traditional procedures currently used by
contractors.
Chapter VII is the last chapter In this study . It mainly
concentrates on conclusion, validity of the study and suggestion for
further study .
Problem Background
PERT/CPM techniques are very common and widely adopted
management tools currently used in the processes of project planning and
contro l . These techniques have been widely accepted as the project
planning tool s in the construction industry . Despite of the use of these
techniques, experience shows that construction projects fai l to achieve
their defined objectives with .respect to time and cost (.Taafari, 1 996; Gong