universita’ degli studi “roma tre” scuola...
TRANSCRIPT

UNIVERSITA’ DEGLI STUDI “ROMA TRE”
SCUOLA DOTTORALE IN GEOLOGIA DELL’AMBIENTE E DELLE RISORSE
(SDIGAR)
SEZIONE GEOLOGIA DELLE RISORSE NATURALI
- XXVI CICLO-
A crystal-chemical study of cordierite, synthesis and
stability at variable H2O and CO2 concentration:
geological and technological applications
PhD Candidate
Francesco Radica
Advisor: Prof. Giancarlo Della Ventura Co-advisors : Dr. Fabio Bellatreccia
Dr. Carmela Freda
Thesis reviewers: Dr. Gianluca Iezzi and Dr. Jannick Ingrin
Defense committee: Prof. G. Diego Gatta, Dr. Roberto Sulpizio and Dr. Luca Aldega
Head of the Doctoral School: Prof. Claudio Faccenna
A.A. 2014/2015

AI MIEI NONNI
“Though we cannot SEE angles, we can INFER them, and this with great
precision. Our sense of touch, stimulated by necessity, and developed by long
training, enables us to distinguish angles far more accurately than your sense of
sight, when unaided by a rule or measure of angles.”
―Edwin Abbott Abbott, Flatland: A Romance of Many Dimensions―
Table of contents
Acknowledgments ..................................................................................................................................... i
Abstract ................................................................................................................................................... iii
Riassunto .................................................................................................................................................. v
Introduction ............................................................................................................................................ 1
1. Structural details of cordierite and beryl and their relevance on technology ............................ 1
2. The petrological relevance of cordierite ..................................................................................... 4
3. Advances in FTIR micro-spectroscopy ......................................................................................... 7
Summary ............................................................................................................................................... 10
Section I: Structural and spectroscopic characterization of cordierite (Chapters 1 and 2). ............. 10
Section II: In-situ HT-IR spectroscopy and kinetic study of CO2 expulsion from cordierite (Chapters 3
and 4). ............................................................................................................................................... 13
Section III: Experimental diffusion of CO2 in cordierite and beryl at different PTt conditions
(Chapter 5). ....................................................................................................................................... 17
Section IV: The diffusion of volatiles in hourglass zoned beryl, the coordination environment of H2O
in low-water samples and comments on the geological storage of CO2 in beryl (Chapters 6, 7 and
8). ...................................................................................................................................................... 21
Chapter 1: Quantitative analysis of H2O and CO2 in cordierite using polarized FTIR spectroscopy .. 25
Abstract ............................................................................................................................................. 25
1. Introduction .............................................................................................................................. 26
2. Samples and analytical methods ............................................................................................... 28
3. X-ray diffraction, optical properties and microchemistry ......................................................... 30
4. Single-crystal FTIR spectroscopy ............................................................................................... 33
5. Interpretation of polarized FTIR spectra ................................................................................... 36
6. The distribution of H2O and CO2 in the studied samples .......................................................... 40
7. Calibration of a molar absorption coefficient to quantify H2O and CO2 in cordierite using FTIR
spectroscopy ..................................................................................................................................... 42
8. Conclusions ............................................................................................................................... 45
Acknowledgements ........................................................................................................................... 47
Chapter 2: Spectroscopy and X-ray structure refinement of sekaninaite from Dolnì Bory (Czech
Rep.) ...................................................................................................................................................... 48
Abstract ............................................................................................................................................. 49
1. Introduction .............................................................................................................................. 49
2. Analytical methodology ............................................................................................................ 51
3. Chemical composition ............................................................................................................... 54
4. Single-crystal X-ray results ........................................................................................................ 55
5. Optical properties...................................................................................................................... 58
6. FTIR spectroscopy...................................................................................................................... 58
7. FTIR band assignment ............................................................................................................... 62
8. Unpolarized Raman spectroscopy ............................................................................................. 63
9. Calibration of a molar absorption coefficients of H2O and CO2 in sekaninaite ......................... 64
10. Conclusions ........................................................................................................................... 65
Acknowledgements ........................................................................................................................... 66
Chapter 3: HT-FTIR micro-spectroscopy of cordierite I: the CO2 absorbance as a function of T from
in situ and quenched experiment ........................................................................................................ 67
Abstract ............................................................................................................................................. 67
1. Introduction .............................................................................................................................. 68
2. Studied samples ........................................................................................................................ 70
3. Experimental methods .............................................................................................................. 72
4. FTIR spectra of the studied cordierite sections: preliminary considerations on the H2O and CO2
bands ................................................................................................................................................. 73
5. Experimental Results ................................................................................................................. 75
5.1 In situ HT-FTIR measurements: the (001) section ................................................................... 75
5.2 In situ HT-FTIR measurements: the (010) section ................................................................... 78
5.3 Measurements at RT on quenched samples ........................................................................... 80
5.4 The intensity variation of in situ vs quenched data ................................................................ 81
6. Discussion .................................................................................................................................. 83
6.1 The thermal behavior of CO2 bands ........................................................................................ 83
6.2 The effect of channel orientation on volatile loss ................................................................... 85
7. Conclusions ............................................................................................................................... 87
Chapter 4: HT-FTIR micro-spectroscopy of cordierite II: the diffusion kinetics of CO2 ...................... 89
Abstract ............................................................................................................................................. 89
1. Introduction: ............................................................................................................................. 90
2. Studied sample .......................................................................................................................... 91
3. Experimental methods .............................................................................................................. 92
3.1 FTIR polarized-light isothermal heating experiments ....................................................... 93
4. Polarized-light FTIR spectroscopy of cordierite and band assignment ..................................... 95
5. Results ....................................................................................................................................... 98
5.1 Isothermal heating experiments ....................................................................................... 98
5.2 Reaction kinetics ............................................................................................................. 101
6. Discussions: Kinetic of CO2 extraction ..................................................................................... 109
7. Conclusions ............................................................................................................................. 113
Chapter 5: Kinetics of incorporation of CO2 in cordierite and beryl: an FTIR-FPA spectroscopy study
............................................................................................................................................................. 114
Abstract ........................................................................................................................................... 114
1. Introduction ............................................................................................................................ 115
1.1 Cordierite and beryl: structural details ........................................................................... 119
2. Experimental and analytical procedure .................................................................................. 121
2.1 Starting materials ............................................................................................................ 121
2.2 Experimental procedure .................................................................................................. 125
2.3 Analytical methods .......................................................................................................... 127
3. Results ..................................................................................................................................... 130
3.1 Run products ................................................................................................................... 130
3.2 CO2 diffusion in cordierite and beryl: preliminary considerations .................................. 133
3.3 CO2 contents .................................................................................................................... 134
4. Diffusion coefficients of CO2 for cordierite and beryl ............................................................. 138
5. Discussion ................................................................................................................................ 142
5.1 The solubility of CO2 in cordierite and beryl ................................................................... 142
5.2 The effect of fractures on the CO2 content ..................................................................... 144
5.3 The CO2 diffusion in microporous structures .................................................................. 146
6. Conclusions ............................................................................................................................. 148
Chapter 6: The diffusion of CO2 and H2O in a synthetic sector-zoned beryl: a multi-analytical study
............................................................................................................................................................. 149
Abstract ........................................................................................................................................... 149
1. Introduction ............................................................................................................................ 150
2. Materials and Methods ........................................................................................................... 152
3. Results ..................................................................................................................................... 155
3.1 TOF-SIMS mapping .......................................................................................................... 155
3.2 Polarized-light FTIR spectra, band assignment, and volatile contents ........................... 156
3.2 Polarized-light FPA imaging ............................................................................................. 159
4. Discussion ................................................................................................................................ 161
4.1 Hourglass zoning and CO2 diffusion ................................................................................ 161
4.2 The role alkali ions on the H2O diffusion ......................................................................... 165

Chapter 7: Speciation and diffusion profiles of H2O in water-poor beryl: Comparison with cordierite
............................................................................................................................................................. 167
Abstract ........................................................................................................................................... 167
1. Introduction ............................................................................................................................ 168
2. Experimental methods and studied materials ........................................................................ 169
3. FTIR-FPA imaging ..................................................................................................................... 172
4. Polarized FTIR measurements ................................................................................................. 173
5. The coordination of H2O in beryl and cordierite ..................................................................... 178
6. Conclusions ............................................................................................................................. 181
Chapter 8: The permanent storage of CO2 in mesoporous minerals: experiments with beryl ....... 183
Abstract ........................................................................................................................................... 183
Acknowledgments ........................................................................................................................... 190
Final Remarks...................................................................................................................................... 191
References .......................................................................................................................................... 196

i
ACKNOWLEDGMENTS
This project couldn’t have been accomplished without the help of many precious people that
have accompanied me through these years of work and amusement.
First and foremost, I want to express all my gratitude to my supervisor Prof. Giancarlo Della
Ventura who guided and supported me during these years, in particular during the last year
for helping me with my terrible English and trying to decipher my thoughts and express them
in the text.
My sincere gratitude goes to my co-supervisors for their precious help: Fabio Bellatreccia for
his advices and for fulfilling my continuous doubts and solving my problems with great
patience, and to Carmela Freda for introducing me to the world of experimental petrology.
A special thanks goes to Matteo Masotta, who transferred me all the secrets of the
QuickPress, for the great time spent inside and outside the INGV laboratory and for being a
good friend.
I’m deeply indebted to all people that supported me during the experiments and the analysis
at INGV: Piergiorgio Scarlato, Valeria Misiti, Silvio Mollo, Andrea Cavallo, Elisabetta del Bello,
Serena Granati and all people gravitating or passing by the HP-HT laboratory for helping me
out with advices and joyful company.
Sincere thanks are due to several people I met at INFN-LNF: Claudio Marcelli, Mariangela
Cestelli Guidi, Antonio, Agostino, Diego Sali, for solving all problems I had with the FTIR
spectrometer …and the OPUS software.
A special thanks goes to Dr. Gianfelice Cinque and all people at Diamond Light Source for
their help with the synchrotron-beam work.
Heartfelt regards are due to Prof. Harald Behrens for his willingness to hosting me in
Hannover, and to all people I met during my stay in Germany: Sara, Juan Carlos, Simone,
Gabriele, Paola and so on.
Thanks to Dr. Mikey Gunter (Moscow, Idaho) transmitted me the secrets and the beauty of
optical mineralogy and in particular of the use of the spindle stage to orient the crystals for

ii
FTIR polarized-light measurements; most of this thesis would have been impossible without
this elegant, unfortunately almost lost, technique.
I’m very grateful to Prof. Simon Harley (University of Edinburgh) for the SIMS data, Prof.
Frank Hawthorne (University of Manitoba, Winnipeg) for the LA-ICP-MS analysis, Giuseppe
Chita (IC-CNR, Bari) and Francesco Capitelli (CNR, Roma) for X-ray data collection, Dr. Luca
Tortora (Roma Tre University) for the TOF-SIMS maps, Vincenzo Mangione (Roma Tre
University) for the help with the optical profilometer and Massimo Piccinini (Porto Conte
Ricerche, Alghero) for the Raman spectra.
Thanks to Mr. R. Pagano and Dr M. D. Welch (Natural History Museum, London) for
providing some of the studied cordierite samples, while Dr. B. Rondeau (Nantes) and Dr. J.J.
Chiappero (Museum National d'Histoire Naturelle, Paris) gently provided the beautiful and
hystorical emeralds which have been used for the experiments.
A very special thanks goes to Dr. Gianluca Iezzi (Università G. D’Annunzio, Chieti), Dr. Jannick
Ingrin (Univerité Lille 1, Lille) and Prof. Charles Geiger (University of Salzburg, Salzburg) for
their careful revision of a preliminary draft of my Thesis and for their precious suggestions.
Thanks to all people I met during these years of travelling and conferencing, especially to
Ruggero, hope to see you soon.
Un grandissimo ringraziamento va ai miei vecchi e nuovi colleghi/amici che mi hanno
accompagnato e mi hanno dato forza in questi anni, in special modo Stefano (preparati per
agosto!), Umberto, Fabietto, Lidia, una serie infinita di Gabriele, Marco e Andrea, Ines,
Ileana, Giorgia, Silvia, Roberta, Chiara, Alessandro, Riccardo, Martina e Francesco. Se ho
dimenticato qualcuno sono una pessima persona.
Un grazie di cuore va ai miei genitori, a mio fratello e specialmente ai miei nonni che sono
venuti a mancare in questi anni, grazie per l’amore che mi donate quotidianamente in terra
e dal Cielo.
Ovviamente un ringraziamento speciale va ai miei amici storici e recenti, non mi dilungherò
nei nomi - sarebbero troppi e, per come sto combinato adesso, sicuramente dimenticherei
qualcuno - vi basti sapere che il vostro nome è nascosto dietro questi quadratini
□□□□□□□□□□□□□.
…ad maiora!

iii
ABSTRACT
Cordierite is a relatively widespread mineral, having a peculiar ability to trap H2O and
CO2 up to very high pressure and temperature. This is a unique property for a rock forming
silicate, and has a significant role in the mineralogical equilibria in HT and UHT
metamorphism (Harley and Thompson, 2004). In this work, great attention was paid to the
study of the diffusion mechanisms of carbon dioxide inside these channel-like structures.
Considering that carbon dioxide is probably one of the major responsible for long-term
climate change on Earth (IPCC, 2005), the ability of these minerals to entrap CO2 could
provide insights for future research for the permanent CO2 storage in minerals.
The aim of this Thesis was to investigate the diffusion of CO2 across cordierite, and
address possible implications from both a geological and a technological point of view. The
work was completed by the parallel study of beryl, which is structurally correlated to
cordierite.
The text is divided into four major sections:
1) In the first section (Chapter 1 and 2) I introduce the issues related to the
qualitative and quantitative analysis of H2O and CO2 in cordierite by means of Fourier-
Transform Infrared Spectroscopy (hereafter FTIR). In detail I show the crystal-chemical and
spectroscopic study of chemically different samples, from an almost Mg-cordierite end-
member to its Fe-analogue sekaninaite. Additionally I will discuss the calibration of the molar
absorption coefficient ε, an indispensable coefficient for quantitative measurement in FTIR
micro-spectroscopy. Both these chapters have been published in first-rank mineralogical and
petrological journals and are thus reported here as they are published.
2) In the second section (Chapter 3 and 4) I’ll focus in mechanism of outward CO2
diffusion: to this purpose, oriented single-crystal cordierite slabs were heated by using a

iv
heating-stage under the FTIR microscope and investigated using in situ FTIR µ-spectroscopy.
Part of this study was done using a synchrotron-light source (SR-FTIR) to improve the signal-
to-noise ratio and attain higher spatial resolution in the data. In this section I studied in
particular the absorbance variation at constant temperature as a function of time, and
evaluated the kinetic and diffusion parameters for CO2 expulsion from the matrix.
3) In the third section (Chapter 5) I discuss the mechanism of inward diffusion of CO2
within the structural channel of cordierite and beryl under different pressure, temperature
and time conditions. The experimental work was done using a piston cylinder apparatus. In
this section I’ll make extensive use of high resolution single-crystal FTIR Focal Planar Array
(FTIR-FPA) imaging to characterize possible inhomogeneity in the CO2/H2O across the
samples, and identify the possible pathways for CO2 diffusion. As it will be shown, the
spectroscopic imaging was also necessary to locate the analytical spots for CO2
measurements in the sample.
4) The last part (Chapter 6, 7 and 8) covers additional features observed during the
work. In particular, chapter 6 deals with a multidisciplinary study of a peculiar diffusion
pattern of CO2 across an hourglass zoned beryl. This chapter relates on advances in
techniques such as Time Of Flight Secondary Ion Mass Spectroscopy (TOF-SIMS) chemical
imaging, polarized light FPA imaging and High Resolution SR-FTIR mapping. Chapter 7 deals
with changes in coordination environment and physical state of H2O in low-water beryl and
cordierite. Chapter 8 eventually presents a summary of the work and illustrates the
technological applications of CO2 diffusion in beryl.
v
RIASSUNTO
La cordierite è un minerale abbastanza diffuso che ha la capacità di intrappolare H2O
and CO2 anche ad altissime pressioni e temperature. Questa è una proprietà unica per un
silicato diffuso nelle rocce che gioca un ruolo fondamentale negli equilibri mineralogici nel
metamorfismo di alta o altissima temperatura (Harley and Thompson, 2004). In questo
lavoro ci siamo dedicati allo studio approfondito dei meccanismi di diffusione nell’anidride
carbonica all’interno di strutture cristalline a “canale”. Inoltre, considerando che l’anidride
carbonica è uno delle principali cause dei cambiamenti climatici terrestri a lungo termine
(IPCC, 2005), la capacità di questi minerali di intrappolare la CO2 potrebbe fornire spunti per
future ricerche sullo stoccaggio permanente della CO2 nei minerali.
Lo scopo di questa tesi è quindi quello di studiare la diffusione della CO2 nella
cordierite, e individuare le possibili implicazioni da un punto di vista geologico e tecnologico.
Il lavoro è stato arricchito con lo studio in parallelo della diffusione della CO2 nel berillo, che
è strutturalmente correlato alla cordierite.
Il lavoro di tesi è suddiviso in quattro sezioni principali:
1) Nella prima sezione (Capitoli 1 e 2) introduco le problematiche relative all’analisi
qualitativa e quantitativa di H2O e CO2 nella cordierite attraverso la Spettroscopia Infrarosso
a Trasformata di Fourier (più comunemente FTIR). In particolare illustro lo studio
cristallochimico e spettroscopico di campioni di variegata composizione chimica, a partire da
cordieriti di Mg fino all’analogo estremo ferrifero sekaninaite. Inoltre illustrerò la messa a
punto della calibrazione del coefficiente di assorbimento molare ε, un parametro
indispensabile per misure quantitative in micro-spettroscopia FTIR. Entrambi i capitolo sono

vi
stati pubblicati su riviste di mineralogia e petrologia di alto impatto e qui riportati come da
pubblicazione.
2) La seconda sezione (Capitoli 3 e 4) è focalizzata sui meccanismi di espulsione della
CO2: a questo proposito sono state riscaldate delle lamelle orientate provenienti da cristalli
singoli di cordierite attraverso un tavolino riscaldante installato direttamente su di un
microscopio FTIR ed analizzati tramite micro-spettroscopia FTIR in situ. Parte dello studio è
stato condotto utilizzando una sorgente di luce di sincrotrone (SR-FTIR) in modo da
aumentare il rapporto segnale-rumore e raggiungere una migliore risoluzione spaziale. In
questa sezione ho studiato in dettaglio la variazione degli assorbimenti in funzione del
tempo a temperatura costante, e ho ricavato i parametri cinetici e di diffusione per
l’estrazione della CO2 dai canali strutturali della cordierite.
3) Nella terza sezione (Capitolo 5) discuto il meccanismo di diffusione della CO2
attraverso i canali strutturali di cordierite e berillo riequilibrate a varie condizioni di
pressione, temperatura e tempo. La procedura sperimentale è stata condotta usando un
apparato di tipo piston-cylinder. In questa sezione farò uso intensivo di imaging FTIR
bidimensionale (FTIR-FPA) ad alta risoluzione su cristallo singolo per individuare possibili
inomogeneità nella distribuzione di H2O/CO2 nei campioni trattati, ed identificare i possibili
percorsi di diffusione della CO2. Inoltre l’imaging FTIR è indispensabile per localizzare i punti
analitici per la misura quantitativa della CO2.
4) Nell’ultima parte del manoscritto (Capitoli 6, 7 e 8) discuterò ulteriori
problematiche incontrate durante il lavoro di tesi. In particolare, il capitolo 6 illustrerà uno
studio multidisciplinare su di un peculiare percorso di diffusione della CO2 osservato in un
berillo zonato a clessidra. Questo capitolo illustra alcune tra le tecniche più innovative
nell’analisi mineralogica come le mappe composizionali in Time Of Flight Secondary Ion Mass
Spectroscopy (TOF-SIMS), imaging FTIR-FPA in luce polarizzata e mappatura SR-FTIR and
altissima risoluzione. Il capitolo 7 è focalizzato sulle variazioni di coordinazione e speciazione
dell’H2O in berilli e cordieriti con poca acqua. Infine il capitolo 8 riporta un riassunto
dell’intero lavoro svolto e illustra le implicazioni tecnologiche della diffusione della CO2 nel
berillo.
Introduction
1
INTRODUCTION
1. Structural details of cordierite and beryl and their relevance on
technology
Carbon dioxide (CO2) generated by the combustion of fossil fuels is by far the most
abundant greenhouse gas; its reduction in the atmosphere is therefore a primary
environmental concern. Due to several reasons, it can be easily understood that fossil fuels
will continue to play a significant role in the world’s economy at least in the following
decades, thus emphasis must be placed on improving methods to decrease the amount of
CO2 dispersed in the environment. The reduction of CO2 from the atmosphere can be
achieved by efficiency improvements in power plants, use of alternative energy
technologies, sequestration of CO2, or some combination of these methods. Up to the
present, several techniques have been considered, and these include: 1) forestation, where
CO2 is removed from the atmosphere by biological activity; 2) aquifer storage, in which CO2
is injected into terrestrial aquifers where it is trapped hydro-dynamically; 3) deep sea
storage, where CO2 is injected into the ocean at approximately 3,000 meter depths, where it
is believed to remain stable; and 4) mineral carbonation, in which CO2 is reacted with
minerals to form solid carbonates. This final form of sequestration is the most efficient
method, because the carbonates are stable over geologic time periods (millions of years),
rather than the hundreds to thousands of years of stability expected for the first three forms
of sequestration. This process is however highly expensive and energy consuming, therefore
research in material science has focused in the last decade at developing technically feasible
processes for mineral sequestration of carbon dioxide alternative to carbonation.
Actually, many minerals contain carbon as a major to trace constituent, however the
carbon content analysed in naturally occurring silicates is traditionally assigned to CO32-
Introduction
2
groups in the structure, whereas the possible presence of molecular CO2 in these phases is
almost completely ignored. Up to the present, the only accepted CO2-bearing minerals are
beryl (Wood and Nassau, 1967) and cordierite (Armbruster and Bloss, 1980, Della Ventura et
al., 2009, 2012). Indeed these two isostructural minerals are able to trap CO2 because of
their peculiar structural channels.
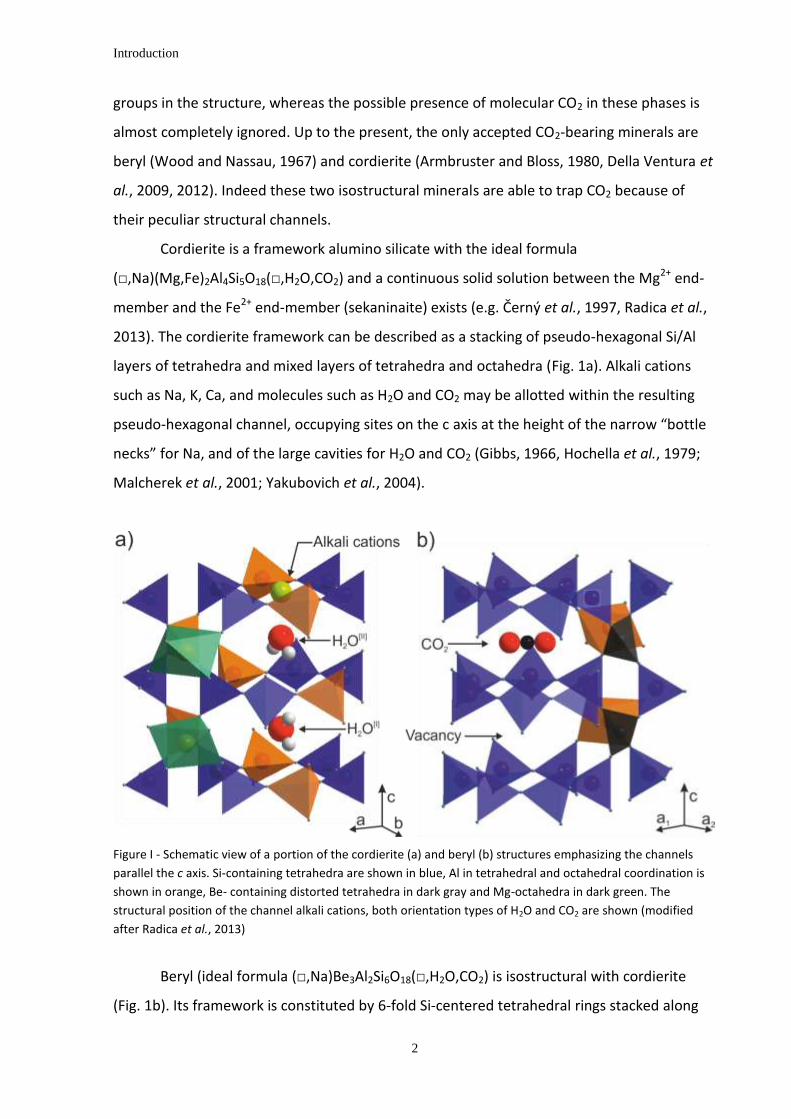
Cordierite is a framework alumino silicate with the ideal formula
(□,Na)(Mg,Fe)2Al4Si5O18(□,H2O,CO2) and a continuous solid solution between the Mg2+ end-
member and the Fe2+ end-member (sekaninaite) exists (e.g. Černý et al., 1997, Radica et al.,
2013). The cordierite framework can be described as a stacking of pseudo-hexagonal Si/Al
layers of tetrahedra and mixed layers of tetrahedra and octahedra (Fig. 1a). Alkali cations
such as Na, K, Ca, and molecules such as H2O and CO2 may be allotted within the resulting
pseudo-hexagonal channel, occupying sites on the c axis at the height of the narrow “bottle
necks” for Na, and of the large cavities for H2O and CO2 (Gibbs, 1966, Hochella et al., 1979;
Malcherek et al., 2001; Yakubovich et al., 2004).
Figure I - Schematic view of a portion of the cordierite (a) and beryl (b) structures emphasizing the channels
parallel the c axis. Si-containing tetrahedra are shown in blue, Al in tetrahedral and octahedral coordination is
shown in orange, Be- containing distorted tetrahedra in dark gray and Mg-octahedra in dark green. The
structural position of the channel alkali cations, both orientation types of H2O and CO2 are shown (modified
after Radica et al., 2013)
Beryl (ideal formula (□,Na)Be3Al2Si6O18(□,H2O,CO2) is isostructural with cordierite
(Fig. 1b). Its framework is constituted by 6-fold Si-centered tetrahedral rings stacked along

Introduction
3
the c axis. The hexagonal rings are interconnected parallel to [001] by distorted Be-centered
tetrahedra. Al occupies the octahedral sites (Gibbs et al., 1968). Beryl also has structural
channels running along the c axis that can contain alkali cations and volatile molecules
(Wood and Nassau, 1968).
Extra-framework H2O groups occur in the structural channels with the molecular
plane parallel to (100). In both cordierite and beryl H2O can be oriented in two different
ways: type I H2O (hereafter H2O[I]) has its H–H vector oriented parallel to the c axis, and type
II H2O (H2O[II]) has its H–H vector normal to the c axis (parallel to the b axis in cordierite). H2O
groups of the latter type are locally associated with channel cations (Goldmann et al., 1977;
Hawthorne and Černý, 1977). Winkler et al. (1994) proposed that H2O[I] in synthetic Mg-
cordierite is rotationally disordered about [001] and that a purely static description is
inappropriate to describe its behavior in the channel cavity. They proposed a model whereby
the H...H vector remains parallel to [001] and the H2O molecule rotates in two different
positions about its center of mass with an estimated hopping time of about 6 picoseconds at
room temperature; this feature however cannot be observed by using FTIR spectroscopy.
The linear CO2 molecules are systematically oriented normal to the c axis and parallel to the
crystallographic a axis for cordierite (Aines and Rossman, 1984;Kolesov and Geiger, 2000;
Khomenko and Langer, 2005).
The molecular dimension of H2O is 2.8 X 3.2 X 3.7 Å and CO2 is 2.8 X 2.8 X 5.0 Å
(Wood and Nassau, 1968). However the CO2 molecule barely fits inside the cage, so once
inside it tends to be wedged to the structure behaving as a “plug” (Aines and Rosmann,
1984; Vry et al., 1990). On the opposite, the smaller H2O polar molecules are bonded to the
structure mainly by electrostatic interactions with the structural oxygens (H2O[I]) and alkali
cations (H2O[II]).
Additionally, because of its thermal and mechanical properties, cordierite is used in
industrial applications such as high-tech ceramics or as a catalyst in petroleum industry.
Beryl is a pegmatitic mineral and has a lower thermal and baric stability; it is well known for
providing some of the most notable gemstones, such as the varieties emerald (green),
aquamarine (light-blue), heliodor (yellow) or bixbite (red).

Introduction
4
2. The petrological relevance of cordierite
This PhD Thesis work has been mainly focused on cordierite because it represents the
only case of a widespread microporous mineral (pore size under 2 nm, Rouquérol et al.,
1994; McCusker et al., 2001) that is able to trap significant amounts of molecular H2O and
CO2 (Schreyer and Yoder 1964; Mirwald et al., 1979; Newton and Wood, 1979; Armbruster
and Bloss 1982; Kurepin 1985) under extreme geological (P, T) conditions. Cordierite stability
extends from the amphibolite facies to ultra-high temperature metamorphism to crustal
anatexis conditions (Mirwald and Schreyer, 1977; Vry et al.,1990; Carrington and Harley,
1996; Smith 1996; Kalt 2000; Harley et al., 2002; Bertoldi et al., 2004; Sarkar et al., 2010).
The analysis of the volatile constituents of cordierite can used to determine the composition
of the fluid pahse during crystallization (Vry et al., 1990; Carrington and Harley, 1996; Harley
et al.,2002; Kurepin, 2010). H2O and CO2 contents affect the stability of cordierite (Schreyer
1985; Carey 1995; Harley et al., 2002). Therefore, a quantitative determination of its channel
constituents is crucial in petrologic studies.
Among the wide range of cordierite occurrences, the most investigated is the ultra
high-temperature metamorphism of pelitic rocks. Dehydration melting of biotite-bearing
pelites with moderate to high XMg variations (XMg/XMg+Fe >0.5) is often controlled by
cordierite-forming reactions in migmatites and leuco-granites at 200–700 MPa and 700–900°
C (Fitzsimons, 1996; Harley et al., 2002). Thus understanding the role of cordierite as an H2O
and CO2 bearing phase is essential for understanding melting processes and for
thermodynamic calculation of fluid activities during these events (Harley and Thompson,
2004). Kurepin (2010) made calculations of the dependence of H2O and CO2 contents in
cordierite as a function of P, T and fluid composition for the aforementioned P-T conditions,
and his thermodynamic model showed a non-ideality of thermodynamic behavior of H2O
and CO2 mixing. In addition evaluation of the H2O and CO2 activities showed that cordierites
in high temperature and pressure assemblages were formed under fluid-saturated
conditions over a wide range of H2O/CO2 ratios (Vry et al., 1990; Kurepin, 2010).
In order to understand these mechanisms, several experimental studies on the
solubility of volatile components in cordierite have been performed, in particular H2O
(Schreyer and Yoder 1964; Mirwald et al., 1979, Harley and Carrington, 2001 among the

Introduction
5
others), CO2 (Armbruster and Bloss, 1982, Armbruster, 1985; Le Breton and Schreyer, 1993),
and mixed H2O – CO2 (Johannes and Schreyer 1981; Thompson et al., 2001).
As a result of these studies, there is agreement that pressure exerts a stronger
influence on the solubility of both H2O and CO2 than does temperature. Both H2O and CO2
contents slightly decrease with increasing temperature, while increasing pressure favors
higher concentrations (e.g. Fig. 2, modified after Harley and Thompson, 2004). It is
important to note that the maximum H2O content obtained at 700 MPa is about 2.4 wt.%,
which is close to the maximum theoretical value of 2.9 wt.% or 1 molecule per formula unit
in the channel (Deer et al., 2004). The maximum calculated value for CO2 is about 2.2 wt.%
(Deer et al., 2004) corresponding to about 0.3 molecules per formula unit.
Figure 2 – (a) Pressure – temperature phase diagram of the isopleths of H2O (expressed in wt.%) for XMg = 0.75
cordierite coexisting with pure H2O fluid, as calculated by Harley and Carrington (2001); (b) isopleths of CO2
(expressed in wt.%) for XMg = 0.80 cordierite in a pure fluid after Thompson et al., (2001) and Harley et al.,
(2002).
Studies on XCO2, where XCO2 = CO2/(CO2+H2O), partitioning between melt and
cordierite have shown that H2O tends to be incorporated preferentially into the cordierite
structure, while CO2 preferentially remains in the melt (Fig. 3b and Johannes and Schreyer,
1981). This behavior is only slightly changed at higher temperatures (Harley and Carrington,
2001), while XCO2 increases with increasing pressure, facilitating CO2 uptake (Johannes and
Schreyer, 1981). Moreover, increasing XCO2 decreases significantly the amount of H2O+CO2
diffused into the mineral. In particular, there is a decrease of H2O (Fig. 3a) probably because
the presence of CO2 obstructs its diffusion to the channel ways. This behavior, which is
observed also in natural samples (Vry et al., 1990), can be explained by the configuration of

Introduction
6
the CO2 molecule inside the channels. Another factor that decreases the total amount of
diffused fluids is the alkali content within the structural channels (Johannes and Schreyer,
1981; Vry et al., 1990). There is evidence suggesting that CO2 (and possibly alkali cations)
may act as plugs in the channel ways obstructing inward and outward molecule diffusion,
drastically slowing down the time of degassing and re-equilibration in case of pressure drop
(Johannes and Schreyer, 1981; Kalt, 2000). This behavior complicates the possibility to
predict the diffused molecules coexisting with mixed H2O and CO2 fluids, although a
theoretical approach has been attempted by Kurepin (2010).
Figure 3 (a) variation of the volatile composition in cordierite (XMg = 0.68) channels with fluid-saturated,
intermediate H2O - CO2 fluid composition. The lines show the calculated values atThompson et al. (2001).
Squares = H2O, triangles = CO2, circles = total number of molecules per formula unit (modified after Thompson
et al., 2001). (b) partition curves showing XCO2 fractioning between cordierite and coexisting fluid at 500 MPa
and 600°C fort two different synthetic cordierites A and B (modified after Johannes and Schreyer, 1981).
The experiments were performed with small cordierite grains as starting materials
(about 200 µm in Armbruster and Bloss, 1982 and Armbruster, 1985; 125-250 µm in
Thompson et al., 2001) in order to maximize the surface-to-volume ratio, and were carried
out for a long duration (up to a few weeks) in order to achieve fluid/mineral equilibration.
However there is still no agreement on the results, among the different authors. For
instance, Johannes and Schreyer (1981) obtained different results as a function of different
starting material (Fig. 2b) or grain size of cordierite, and Le Breton and Schreyer (1993)
observed a nonlinear behavior of the CO2 contents between 15 minutes to 3 weeks
experimental runs. Major problems arise with CO2 diffusion, because its “sluggish” nature
delays or even prevents sample saturation. Thus, the study of the run products cannot be
addressed by conventional bulk methods, such as coulometric tritation (Armbruster and
Introduction
7
Bloss, 1982; Johannes and Schreyer, 1981) or powder FTIR spectroscopy (Vry et al., 1990) or
single spot micro-analytical techniques, such as SIMS (secondary ion mass spectrometry)
(Thompson et al., 2001), which do not allow characterizing the inhomogeneous distribution
of the target element. For this reason, we have predominantly used, in this Thesis, single-
crystal FTIR spectroscopy to examine the run products, and have developed in particular
novel FTIR procedures to characterize the sample inhomogeneities.
3. Advances in FTIR micro-spectroscopy
Several times during this introduction we mentioned that FTIR micro-spectroscopy
was chosen as a principal probing tool, and the reason is that FTIR is one of the main tool in
Earth Science able to deal with light and crucial elements like H (both as H2O and OH-) and C
(both as CO2 and CO32- groups). Several complementary techniques were developed in the
last decades to overcome some of the most common issues occurring in Earth Science.
1) Focal Plane Array (FPA) FTIR imaging and FTIR mapping are extremely important
imaging techniques capable of detecting and quantify the distribution of an absorber across
a sample. In Earth Science materials these techniques are useful to examine the possible
inhomogeneity of natural samples, such as chemical zoning, but also melt/fluid inclusions,
structural defect of the occurrence of included micro-phases. Several works have been
devoted to this topic, in particular Della Ventura et al. (2010, 2014) revised the data in
literature and illustrated the possibilities offered by imaging techniques in Earth Science.
During the present Thesis I made extensive use of this technique, in particular each
experimental sample was preliminary analyzed through 2D FTIR FPA imaging in order to
locate the most suitable spots for CO2 quantitative measurement.
Polarized-light FTIR single spot analysis (Libowitzky and Rossman, 1996) was used for
quantitative measurements and to define the orientation of the absorbers in the samples. In
addition in Chapter 6 I describe the results of FPA imaging done on oriented single crystals
using polarized radiation (Fig. 4a); this is the first time that polarized imaging is applied in
Earth Science and the data show that this technique opens interesting scenarios: for instance
the work presented in chapter 6 shows how it is possible to map in detail the distribution of
absorbers with different orientation in the same section.

Introduction
8
In this work I also illustrate the possibilities offered by synchrotron-light FTIR
mapping. In FTIR spectroscopy the increased brilliance of a synchrotron source translates
into improved signal to noise ratio in 2D FPA imaging and thus in a higher spatial resolution
for spot measurements and mapping (Della Ventura et al., 2014). In Figure 4 I reported for
comparison the contour map of CO2 distribution in the same area of a thermally-treated
beryl sample obtained using a conventional Globar source (Fig. 4b) and a synchrotron source
(Fig. 4c).
Figure 4 – (a) FTIR-FPA contour map of CO2 distribution collected for Ec in a beryl sample treated at 800 °C
and 500 MPa, 4 days. (b) Enlargement of (a) showing the CO2 distribution obtained with conventional light,
spot size 20 x 20 µm, sampling step 10 µm, and (c) obtained with synchrotron light with spot size 10 x 10 µm,
sampling step 5 µm. Chromatic scale is proportional to the CO2 content, units are arbitrary. See Chapter 6.
2) In-situ FTIR techniques were developed to study phase equilibria and kinetic
process at extreme pressures and temperatures using diamond anvil cells (DAC) and heating
stages (Koch-Müller et al., 2003, Iezzi et al., 2006, 2009, Keppler and Smyth, 2006;
Hawthorne et al., 2007, Welch et al., 2007, Della Ventura et al., 2010, 2014). In Chapter 3
and 4 of this Thesis I will describe the CO2 absorbance variations in cordierite up to 1200 °C
and the kinetic of CO2 expulsion from the structural channels. In-situ high temperature
measurements up to 1200 °C could be performed for the first time using a modified heating
stage capable to operate at extreme temperatures directly under the IR microscope (Fig. 5a).
Introduction
9
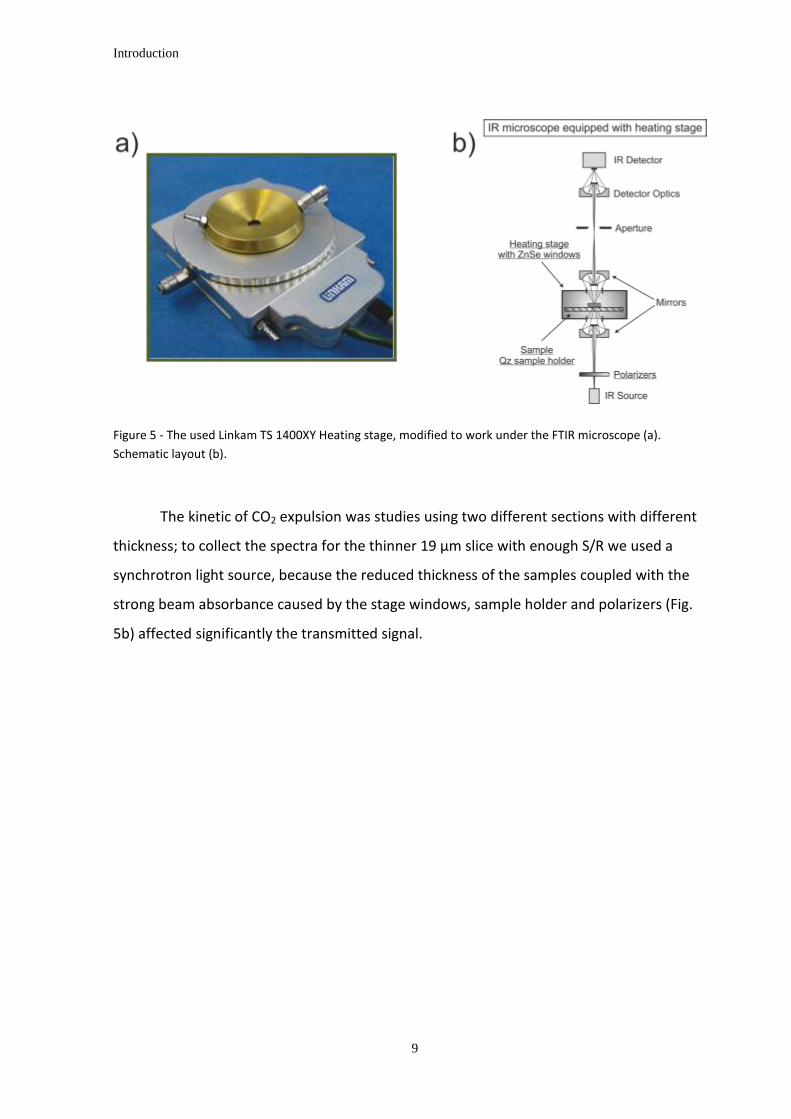
Figure 5 - The used Linkam TS 1400XY Heating stage, modified to work under the FTIR microscope (a).
Schematic layout (b).
The kinetic of CO2 expulsion was studies using two different sections with different
thickness; to collect the spectra for the thinner 19 µm slice with enough S/R we used a
synchrotron light source, because the reduced thickness of the samples coupled with the
strong beam absorbance caused by the stage windows, sample holder and polarizers (Fig.
5b) affected significantly the transmitted signal.

Introduction
10
SUMMARY
Section I: Structural and spectroscopic characterization of cordierite
(Chapters 1 and 2).
Eight different cordierite samples (Chapter 1) from different localities and geological
occurrences were chosen to cover a wide range in H2O/CO2 ratio.
Single-crystal X-ray diffraction data were collected on optically clean grains free from
inclusions and alteration products at CNR Istituto di Cristallografia (Bari) with a Nonius Kappa
CCD area detector diffractometer, revealing all samples to be orthorhombic Cccm. Major
oxides were analysed by EMPA while H and C were quantified by SIMS (secondary ion mass
spectrometry). Accordingly, the Si:Al ratio is close to 5:4; XMg ranges from 76.31 to 96.63;
extraframework K and Ca are negligible, with Na up to 0.84 apfu. SIMS shows H2O up to 1.52
and CO2 up to 1.11 wt%.
Figure 1 - Selected single-crystal polarized-light FTIR spectra of cordierite along the principal optical directions,
peak identification after Della Ventura et al., (2009).

Introduction
11
Optically transparent single-crystals were oriented using the spindle-stage and
examined by FTIR micro-spectroscopy under polarized light. The observed bands were
assigned to water molecules in two different orientations H2O[I] and H2O[II], and to CO2
molecules in the structural channels (Fig. 1). Prior to the quantitative analyses, the samples
were examined for their water and carbon dioxide distribution using a focal-plane-array (FPA)
of detectors. The evidence was that at the µm-scale the distribution of H and C in cordierite
were significantly inhomogeneous, particularly for H2O, whose zoning within the crystal can be
strongly affected by the geological history of the mineral after its formation.
The core of this work was the quantitative calibration of H2O and CO2 in cordierite
based on single-crystal FTIR micro-spectroscopy (Fig. 1), based on the Beer-Lambert
relationship.
Figure 2 - Relationship between the analysed (SIMS) CO2 content and the integrated absorption coefficient
(ai=Ai/t) for the studied cordierites. The calibration curve provides the specific absorption coefficient (ε) to be
used in the Beer-Lambert equation for the spectroscopic quantitative analysis of CO2 in cordierite.
For H2O the integrated molar coefficients for type I and type II water molecules were
calculated separately and turned out to be [I]ε = 5000 ± 1000 l∙mol-1∙cm-2 and [II]ε = 13200 ± 500
l∙mol-1∙cm-2, respectively. For CO2 the integrated coefficient is εCO2 = 19000 ± 1000 l∙mol-1∙cm-2.
The same procedure just illustrated was then applied to the Fe end-member of the cordierite
group, sekaninaite (Chapter 2). Additionally single crystal X-ray refinement, laser ablation
mass-spectroscopy for Li+ and Raman spectroscopy characterization were performed.
Introduction
12
Electron-micro-probe analysis shows the sample to be close to the Fe end-member [XFe =
Fe/(Fe+Mg) = 94%) with significant Mn (1.48 wt.%); laser ablation mass-spectrometry
showed the presence of 0.42 wt.% Li2O. H2O and CO2 contents (1.48 and 0.17 wt.%,
respectively) were determined via secondary-ion mass-spectrometry (SIMS). X-ray site
occupancy refinement suggested that the lack of monovalent charge at the octahedral site
due to the presence of Li+, is counter-balanced by the presence of Na+ in the channel.
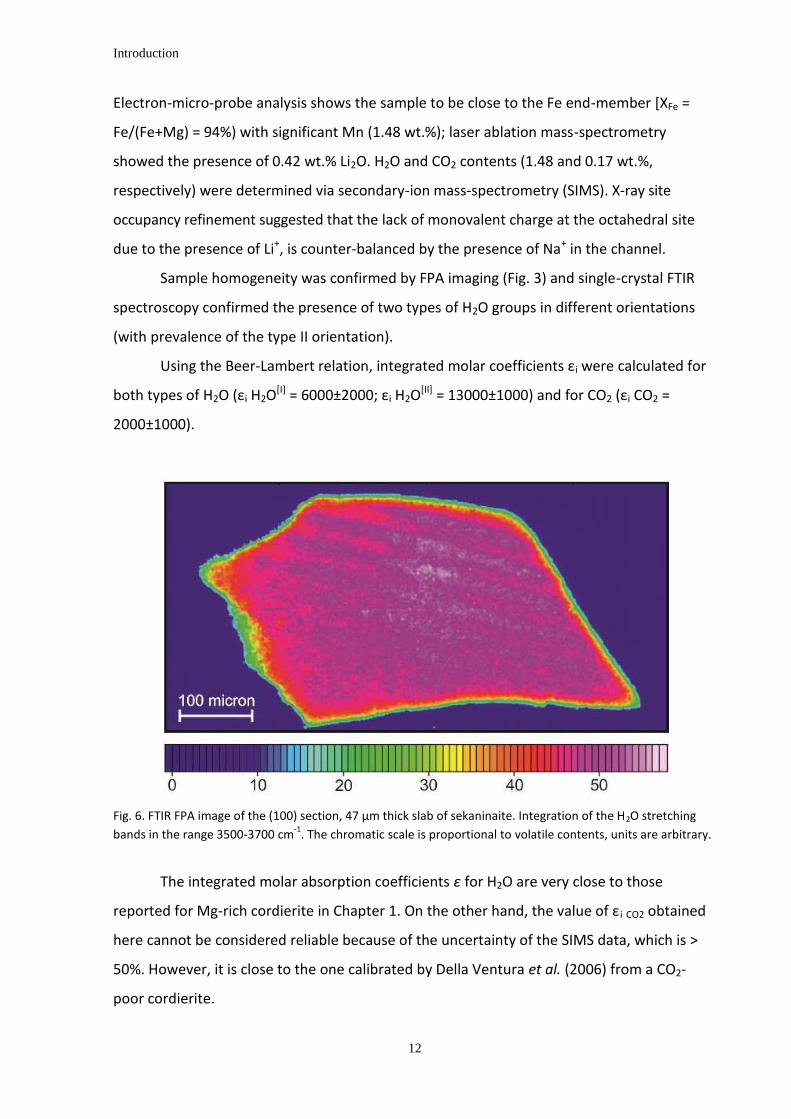
Sample homogeneity was confirmed by FPA imaging (Fig. 3) and single-crystal FTIR
spectroscopy confirmed the presence of two types of H2O groups in different orientations
(with prevalence of the type II orientation).
Using the Beer-Lambert relation, integrated molar coefficients εi were calculated for
both types of H2O (εi H2O[I] = 6000±2000; εi H2O[II] = 13000±1000) and for CO2 (εi CO2 =
2000±1000).
Fig. 6. FTIR FPA image of the (100) section, 47 µm thick slab of sekaninaite. Integration of the H2O stretching
bands in the range 3500-3700 cm-1
. The chromatic scale is proportional to volatile contents, units are arbitrary.
The integrated molar absorption coefficients ε for H2O are very close to those
reported for Mg-rich cordierite in Chapter 1. On the other hand, the value of εi CO2 obtained
here cannot be considered reliable because of the uncertainty of the SIMS data, which is >
50%. However, it is close to the one calibrated by Della Ventura et al. (2006) from a CO2-
poor cordierite.

Introduction
13
Section II: In-situ HT-IR spectroscopy and kinetic study of CO2
expulsion from cordierite (Chapters 3 and 4).
In this section I will describe the in situ HT-FTIR micro-spectroscopy of cordierite and
will evaluate the kinetic and diffusion parameters of CO2 expulsion as a function of
increasing T. Experiments were performed using a Linkam TS 1400 XY heating stage at LNF-
INFN and at beamline B22, Diamond Light Source laboratory Oxford (UK). Fragments of two
natural cordierites, BM 96512 from Cabo de Gata (Almaria region, Spain) and Rp 3237 from
Kragero (Arendal region, Norway) were used.
In a first series of step-heating experiments, the (001) section of cordierite Rp 3237
was heated up to 1000 °C with a rate of 20 °C/min and FTIR spectra were collected for every
step. At the end of the run, the sample was allowed to cool down to RT and a spectrum was
measured, than was heated up at 1100 °C (rate 100 °C/min) and then cooled down again at
RT; spectra were collected at 1100 °C and at RT. A second series of experiments was
performed heating up the (010) section with a rate of 100 °C/min up to 600 °C;
measurements were performed every 100°C during the ramp. Then the sample was cooled
down to RT and heated up again up to 600 °C with a rate of 100 °C/min. The same procedure
was repeated at 800, 900, 1000, 1100 and 1200 °C. FTIR spectra were collected at RT and at
any target temperature every 50 °C. After each experiment FPA-FTIR images were collected
to check for the homogeneity of residual CO2.
In-situ measurements on (001) oriented sections that up to T > 800 °C there is a
significant intensity increase of the CO2 stretching mode at 2348 cm-1, followed by a sudden
decrease for T > 900°C; the absorbance is virtually zero at 1000°C (Fig. 7a). On the opposite,
the integrated absorbance (Ai) of the CO2 (ν3 + ν1) combination mode at 3708 cm-1 (Fig. 7a) is
almost constant up to about 450 °C, then decrease up to 850 °C. For higher T the intensity
decreases with a much faster rate; the band disappears at 950°C. Similar trends for the (010)
section cut out from the same cordierite crystal (Fig. 7c).
The evolution of the H2O absorbance as a function of increasing T is extremely
different to that of CO2 (Fig. 7a and b, in purple), and shows a linear and constant decrease
of 50% of the intensity up to 800°C; in the 800°-900°C range there is a sudden drop and at
950°C the sample is completely anhydrous. Similarly to what observed for CO2, the data
collected on quenched samples show a different scenario: the integrated H2O absorbance is

Introduction
14
constant up to 800°C and suddenly drops in the 800-900°C range. At 1000° the sample is
completely anhydrous
Figure 7 - (a) Sample Rp 3237 (001) section: integrated absorbance variation (ART% in %) of H2O (purple
triangles), CO2 stretching mode (filled orange squares) and CO2 combination mode (open orange squares).
Sample Rp 3237_14 (010) section: integrated absorbance variation (ART% in %) of H2O (b) and CO2 (c)
absorptions. In (b) and (c) the intensities measured after quencing the sample are given for comparison
(dashed black lines). The shaded areas represent the estimated error on ART%.
Several authors (e.g. Keppler and Bagdassorov, 1993; Yamagishi et al., 1997; Zhang et
al., 2007; Tokiwai and Nakashima, 2010b) revised recently the absorbance in minerals and
glasses in HT-FTIR spectroscopy and showed that the intensity measured during in situ data
collection is not related to the concentration of the target absorber via the same Beer-
Lambert relationship calibrated at room-T. This feature is shown in Figure 7, where it is
evident that in situ FTIR data collection does not provide a real estimate of the CO2 and H2O
behavior in cordierite as a function of increasing T. In particular, based on the Beer-Lambert
relationship, assuming no or negligible change in the sample thickness across the studied T
range, the trends of Figure 7 suggest a significant change in the molar absorption
coefficients ε for both volatile species at varying T.
Interestingly, as already observed for H2O/OH in several mineral species (Zhang et al.,
2007) the temperature dependence of the principal modes is different from that of multi-
phonon bands (Fig. 7a and c open squares).
Continuous heating experiments were performed on (001) oriented BM 96512
cordierite slabs. Two fragments were double-polished at 60 µm and 19 µm, respectively and
broke up into four pieces each. Four fragments of the same 60 µm thick section were heated
to 850, 900, 950 and 1000 °C (heating rate 100°C/min) and kept at the target T for two
hours. Polarized spectra were collected using conventional light with both E//a and E//b at
RT before the experiment, and at the target T, every 5 minutes for the first hour and every
10 minutes for the second hour of isothermal heating. Additional four fragments of the same
Introduction
15
19 µm thick BM 96512 slab were heated to 825, 850, 900 and 1000 °C (heating rate
100°C/min) at different annealing times. For this second set of samples, spectra were
collected using synchrotron light exclusively along the a crystallographic direction at RT and
at the target T every 5 minutes. This experimental layout was necessary to get a better S/N
because the reduced thickness of the samples coupled with the strong beam absorbance
caused by the stage windows, sample holder and polarizers affected significantly the
transmitted signal.
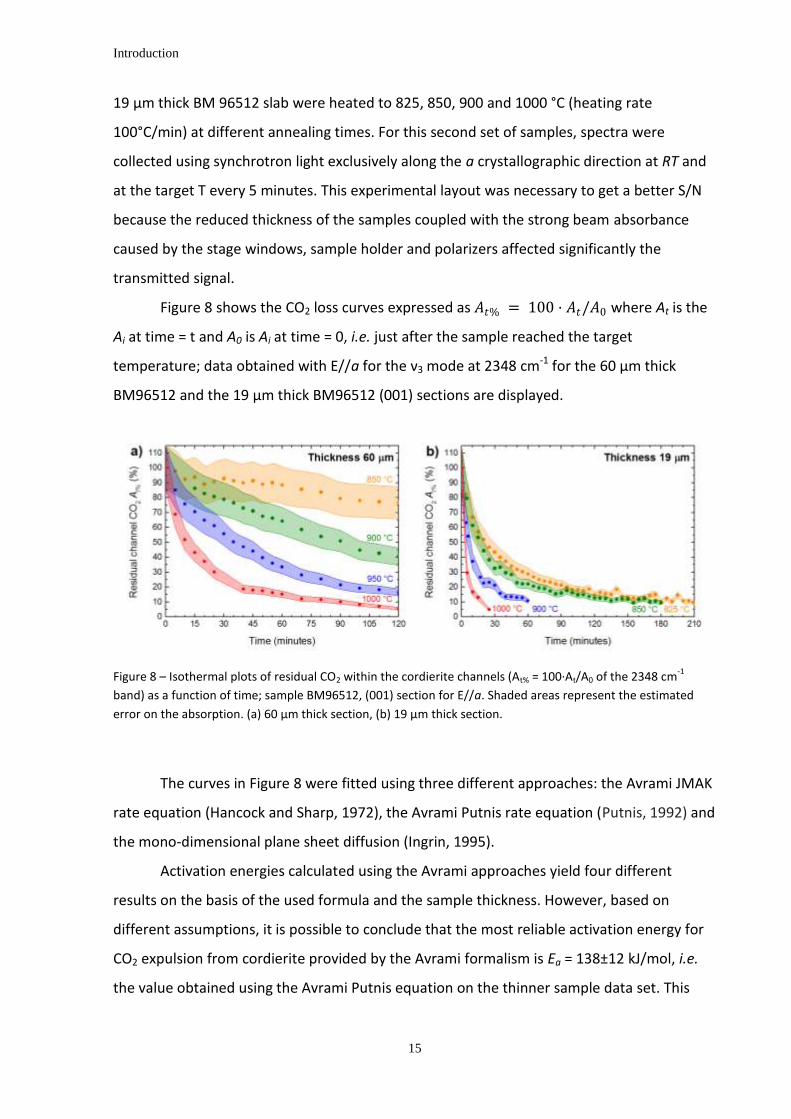
Figure 8 shows the CO2 loss curves expressed as 𝐴𝑡% = 100 · 𝐴𝑡/𝐴0 where At is the
Ai at time = t and A0 is Ai at time = 0, i.e. just after the sample reached the target
temperature; data obtained with E//a for the ν3 mode at 2348 cm-1 for the 60 µm thick
BM96512 and the 19 µm thick BM96512 (001) sections are displayed.
Figure 8 – Isothermal plots of residual CO2 within the cordierite channels (At% = 100·At/A0 of the 2348 cm-1
band) as a function of time; sample BM96512, (001) section for E//a. Shaded areas represent the estimated
error on the absorption. (a) 60 µm thick section, (b) 19 µm thick section.
The curves in Figure 8 were fitted using three different approaches: the Avrami JMAK
rate equation (Hancock and Sharp, 1972), the Avrami Putnis rate equation (Putnis, 1992) and
the mono-dimensional plane sheet diffusion (Ingrin, 1995).
Activation energies calculated using the Avrami approaches yield four different
results on the basis of the used formula and the sample thickness. However, based on
different assumptions, it is possible to conclude that the most reliable activation energy for
CO2 expulsion from cordierite provided by the Avrami formalism is Ea = 138±12 kJ/mol, i.e.
the value obtained using the Avrami Putnis equation on the thinner sample data set. This

Introduction
16
value is very close to those obtained by previous authors for the dehydration of cordierite
(Giampaolo and Putnis, 1989).
Using the mono-dimensional plane sheet diffusion approach it was possible to
evaluate both the diffusion coefficient D and the activation energy Ea for CO2 in cordierite.
Results confirmed that this approach is not influenced by sample thickness variation and
fitted data for both sample set yield a value of –logD0 = 4.4±0.7 m2/sec and Ea = 204±15
kJ/mol.
Introduction
17
Section III: Experimental diffusion of CO2 in cordierite and beryl at
different PTt conditions (Chapter 5).
In this section I examined the interaction of cordierite with a CO2–rich fluid under
different experimental P, T, t conditions and evaluated the diffusion coefficients within the
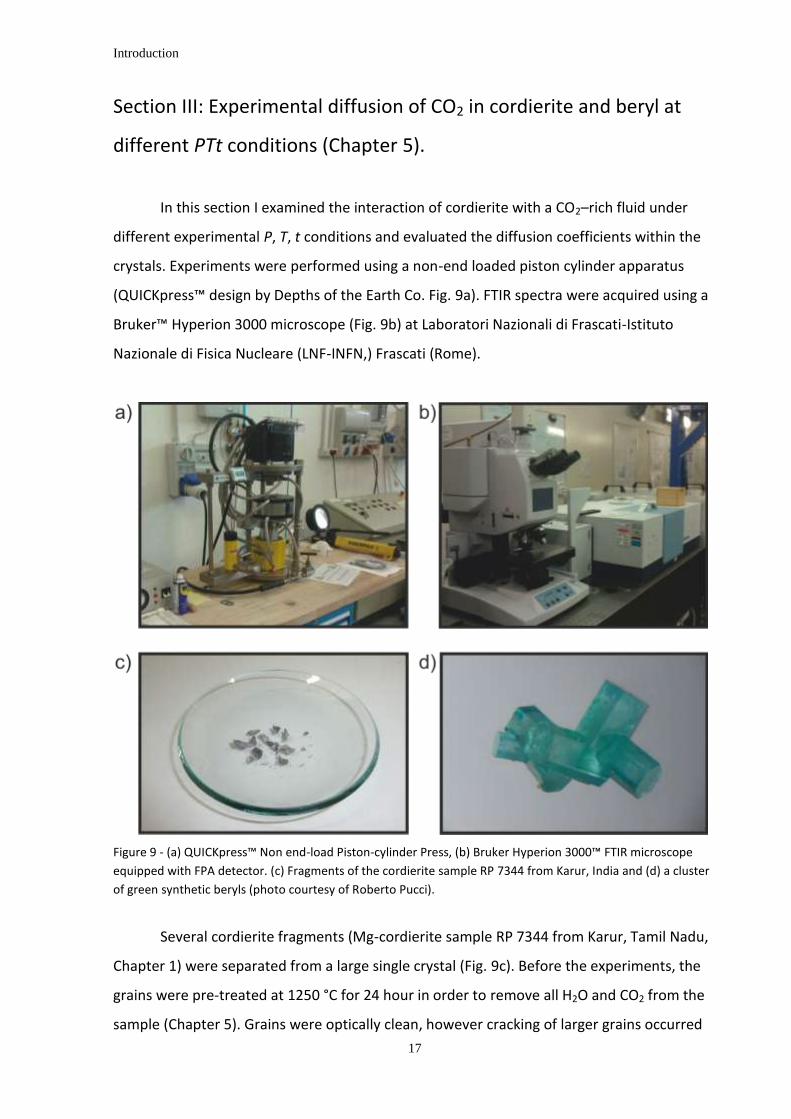
crystals. Experiments were performed using a non-end loaded piston cylinder apparatus
(QUICKpress™ design by Depths of the Earth Co. Fig. 9a). FTIR spectra were acquired using a
Bruker™ Hyperion 3000 microscope (Fig. 9b) at Laboratori Nazionali di Frascati-Istituto
Nazionale di Fisica Nucleare (LNF-INFN,) Frascati (Rome).
Figure 9 - (a) QUICKpress™ Non end-load Piston-cylinder Press, (b) Bruker Hyperion 3000™ FTIR microscope
equipped with FPA detector. (c) Fragments of the cordierite sample RP 7344 from Karur, India and (d) a cluster
of green synthetic beryls (photo courtesy of Roberto Pucci).
Several cordierite fragments (Mg-cordierite sample RP 7344 from Karur, Tamil Nadu,
Chapter 1) were separated from a large single crystal (Fig. 9c). Before the experiments, the
grains were pre-treated at 1250 °C for 24 hour in order to remove all H2O and CO2 from the
sample (Chapter 5). Grains were optically clean, however cracking of larger grains occurred
Introduction
18
during the heat-treatment. Beryl samples are from the very first flux-grown synthetic
emeralds made by P.G. Hautefueille and A. Perrey in 1888 in Paris (Bellatreccia et al., 2008);
samples show a perfect prismatic hexagonal habitus with a maximum length of 1 mm and
width of 0.5 mm (Fig. 9d).
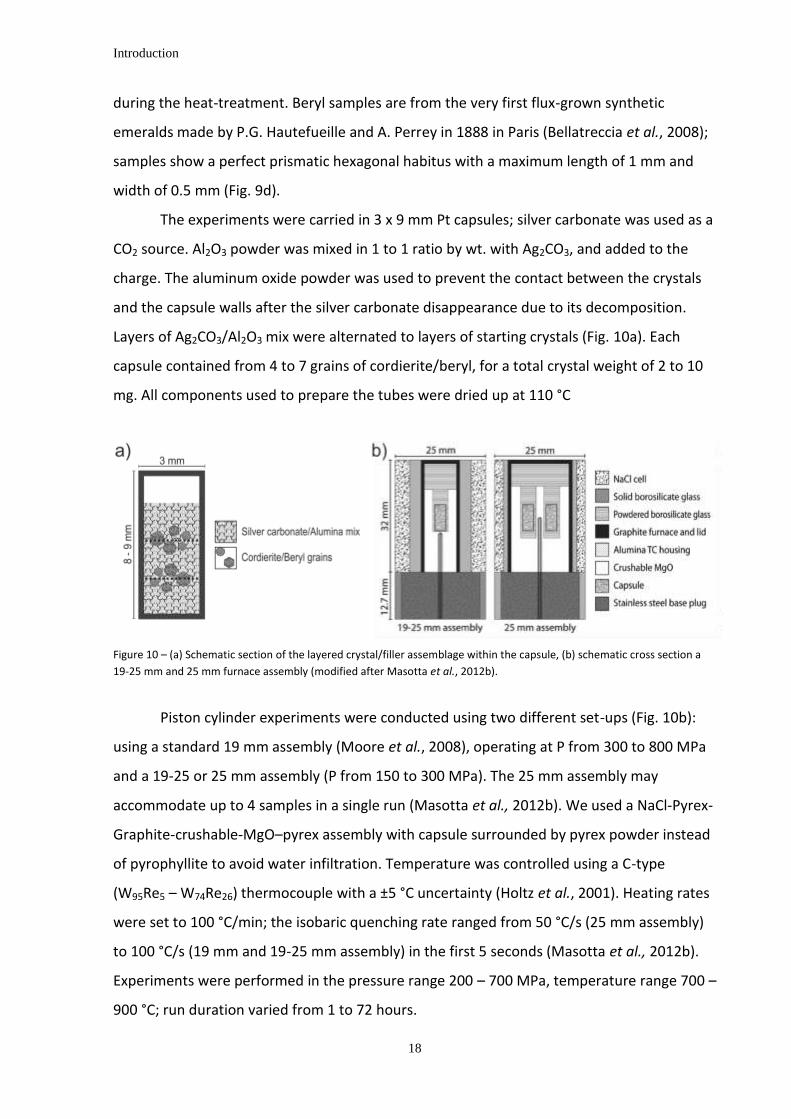
The experiments were carried in 3 x 9 mm Pt capsules; silver carbonate was used as a
CO2 source. Al2O3 powder was mixed in 1 to 1 ratio by wt. with Ag2CO3, and added to the
charge. The aluminum oxide powder was used to prevent the contact between the crystals
and the capsule walls after the silver carbonate disappearance due to its decomposition.
Layers of Ag2CO3/Al2O3 mix were alternated to layers of starting crystals (Fig. 10a). Each
capsule contained from 4 to 7 grains of cordierite/beryl, for a total crystal weight of 2 to 10
mg. All components used to prepare the tubes were dried up at 110 °C
Figure 10 – (a) Schematic section of the layered crystal/filler assemblage within the capsule, (b) schematic cross section a
19-25 mm and 25 mm furnace assembly (modified after Masotta et al., 2012b).
Piston cylinder experiments were conducted using two different set-ups (Fig. 10b):
using a standard 19 mm assembly (Moore et al., 2008), operating at P from 300 to 800 MPa
and a 19-25 or 25 mm assembly (P from 150 to 300 MPa). The 25 mm assembly may
accommodate up to 4 samples in a single run (Masotta et al., 2012b). We used a NaCl-Pyrex-
Graphite-crushable-MgO–pyrex assembly with capsule surrounded by pyrex powder instead
of pyrophyllite to avoid water infiltration. Temperature was controlled using a C-type
(W95Re5 – W74Re26) thermocouple with a ±5 °C uncertainty (Holtz et al., 2001). Heating rates
were set to 100 °C/min; the isobaric quenching rate ranged from 50 °C/s (25 mm assembly)
to 100 °C/s (19 mm and 19-25 mm assembly) in the first 5 seconds (Masotta et al., 2012b).
Experiments were performed in the pressure range 200 – 700 MPa, temperature range 700 –
900 °C; run duration varied from 1 to 72 hours.

Introduction
19
Figure 11 - (left) Unpolarized single-crystal spectra of a cordierite before and after treated at 900 °C and 500 MPa for 1 hour
(CRD_Pr 15). (right) Unpolarized single-crystal spectra of a beryl before and after treated at 800 °C and 500 MPa for 10 hour
(Pa_340 t).
Preliminary FTIR single spot measurements confirmed that H2O and CO2 had been
diffused in the samples (Fig. 11), however an evident heterogeneity in carbon dioxide
absorbance was observed. Therefore all samples were carefully examined by FPA to locate
the area suitable for analytical spots. In particular FPA imaging revealed that the CO2
diffusion in both cordierite and beryl proceeds exclusively along the structural channels (Fig.
12). FPA images also showed a strong enhancement of the CO2 diffusion along cracks.
On the basis of these results we located the most suitable area for the analytical
spots avoided measurements close to fractures; the beam size was kept as small as possible,
usually at 20x20 µm2 and the highest absorbance values were selected as representative of
the CO2 content of the sample.
The CO2 contents were calculated from polarized FTIR spectra using the Beer-
Lambert relationship using the procedure described in Della Ventura et al. (2010).
Final data shows that T plays only a minor role on the CO2 diffusion for both
cordierite and beryl, while pressure has a significant effect. In particular, beryl shows a steep
increase in CO2 content from 200 MPa to 500 MPa and from 500 MPa to 700 MPa. The CO2
contents in cordierite, on the other side, show only a minor increase from 200 MPa to 500
MPa, with a significant jump from 500 MPa to 700 MPa.

Introduction
20
Figure 12 - FPA image and FTIR diffusion profile of beryl Pa_340 d bis treated at 800°C and 500 MPa for 24
hours.
The diffusion coefficient (D) for beryl was obtained by fitting the concentration
profiles (Fig. 12) using a simple mono dimensional equation (Crank, 1975, Zhang and
Cherniak, 2010):
𝐶 = 𝐶0 ∙ 𝑒𝑟𝑓𝑐 𝑥
2 𝐷𝑡
where C is the concentration at depth x (m) from the sample rim, C0 is the maximum
concentration, D is the diffusion coefficient (m2/s), t is the time duration (s), and erfc is the
complementary error function. Obtained D values range from 7.6E-13 to 6.3E-14 for
cordierite, and 1.1E-14 to 9.5E-14 for beryl.
Activation energy (Ea) and pre-exponential factor (-logD0) were determined fitting the
data on the basis of the Arrhenius equation.
log 𝐷 = log 𝐷0 − 𝐸𝑎/𝑅 ∙ ln(10) ∙ 1/𝑇
Mean activation energy (Ea) for beryl data is 122±15 kJ/mol with a pre-exponential (-
logD0) factor of 7.2±0.7.
Introduction
21
Section IV: The diffusion of volatiles in hourglass zoned beryl, the
coordination environment of H2O in low-water samples and
comments on the geological storage of CO2 in beryl (Chapters 6, 7
and 8).
Chapters 6 and 7 deal with some particular features observed during the present
Thesis, i.e. the role of chemical inhomogeneity in the diffusion of CO2 in beryl, and the
coordination environment of H2O in the channels.
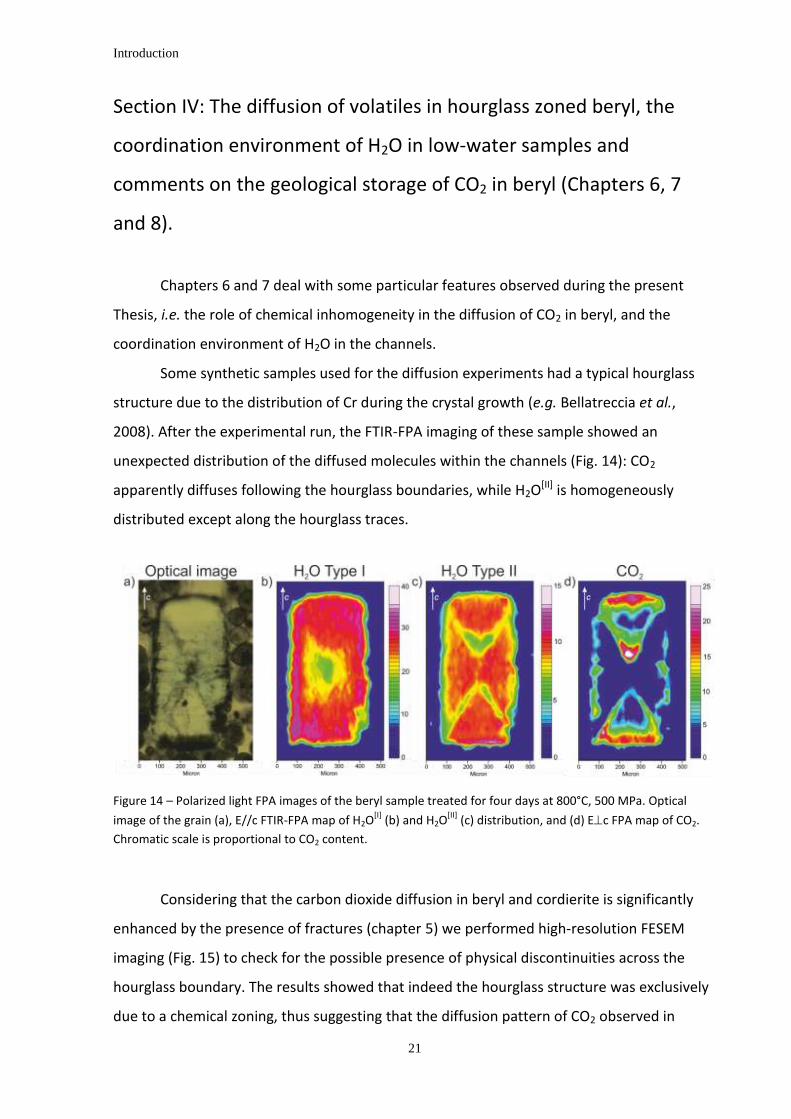
Some synthetic samples used for the diffusion experiments had a typical hourglass
structure due to the distribution of Cr during the crystal growth (e.g. Bellatreccia et al.,
2008). After the experimental run, the FTIR-FPA imaging of these sample showed an
unexpected distribution of the diffused molecules within the channels (Fig. 14): CO2
apparently diffuses following the hourglass boundaries, while H2O[II] is homogeneously
distributed except along the hourglass traces.
Figure 14 – Polarized light FPA images of the beryl sample treated for four days at 800°C, 500 MPa. Optical
image of the grain (a), E//c FTIR-FPA map of H2O[I]
(b) and H2O[II]
(c) distribution, and (d) Ec FPA map of CO2.
Chromatic scale is proportional to CO2 content.
Considering that the carbon dioxide diffusion in beryl and cordierite is significantly
enhanced by the presence of fractures (chapter 5) we performed high-resolution FESEM
imaging (Fig. 15) to check for the possible presence of physical discontinuities across the
hourglass boundary. The results showed that indeed the hourglass structure was exclusively
due to a chemical zoning, thus suggesting that the diffusion pattern of CO2 observed in

Introduction
22
Figure 14 must be related to a kind of defect fast-path diffusion mechanism (Zhang et al.,
2006).
Figure 15 – Field Emission SEM pictures of the treated beryl sample in correspondence of the “hourglass”
structure in a fracture free area. (a) EDS chemical mapping of Cr3+
zoning. (b) topological Secondary Electron
(SE) images of the highlighted area. The red dashed line indicates the limit of the “hourglass” sector zoning.
TOF-SIMS chemical maps showed K is enriched along the hourglass boundary, while
Na is depleted. Considering that H2O[II] is preferentially associated Na+ cations inside the
channels it is reasonable to infer that H2O[II] depletion along the hourglass discontinuity is
the result of the increased K+ content at the expense of Na occurring along these chemical
boundary.
As explained in chapter 5, the HT/HP experiments aimed at the CO2 diffusion across
cordierite and beryl were done using a piston-cylinder apparatus, where the pressure was
mechanically and not hydrothermally increased. The infrared spectra of the run products, as
expected, showed the presence of significant CO2 but also of minor H2O; due to the
experimental conditions, this water content must be related to moisture present in the
starting products used for the synthesis, thus its bulk amount is very low. Single-spot spectra
collected along profiles parallel to the c crystallographic axis show subtle changes as a
function of the distance from the crystal edge; these changes can be correlated to a
progressive change in the H2O coordination environment in the channel (Fig. 16), as a
response to the varying H2O/alkali content. In particular, the data show that when 2·H2O >
Na+ apfu, H2O can assume both type I and type II orientation; in the latter case, each Na
cation coordinates two H2O[II] molecules (doubly coordinated H2O). If 2·H2O < Na+ apfu, than

Introduction
23
H2O[II] molecules are singly coordinated to each Na cation. The same type of feature is
observed and commented for the structurally related cordierite.
Figure 16 – Concentration trend of selected peak for sample Pa 340_o treated at 800 °C. Peak intensity were scaled to the
maximum intensity. A schematic representation of the configuration of water molecules inside the structural channels of
beryl, as the overall water content decreases in given above.
The implication of this finding is that H2O in beryl and in cordierite is trapped in the
structural channel following very different bonding environments, and this has a significant
consequence on the diffusion rates (both inward and outward) obtained in experiments and
hence on the calculation of thermodynamic properties from the observed data. For
cordierite in particular, considering it is widely used in metamorphic petrology as an
Introduction
24
indicator of the fluid system in equilibrium with the rock, the different diffusion mechanisms
of water and CO2 could affect the closing temperatures modeled on the basis of field studies.
Chapter 8 reports a short paper in press on the Rendiconti Online della Società
Geologica Italiana discussing problems related to the permanent storage of carbon dioxide
in microporous minerals.
Chapter 1: Quantitative analysis of H2O and CO2 in cordierite using polarized FTIR spectroscopy
25
PUBLISHED ON CONTRIBUTION TO MINERALOGY AND PETROLOGY (JULY 2012)
DOI 10.1007/s00410-012-0779-8
CHAPTER 1
QUANTITATIVE ANALYSIS OF H2O AND CO2 IN CORDIERITE USING
POLARIZED FTIR SPECTROSCOPY
Giancarlo Della Ventura1,2,3, Francesco Radica1, Fabio Bellatreccia1,2, Andrea
Cavallo3, Francesco Capitelli4 and Simon Harley5
1Dipartimento di Scienze Geologiche, Università Roma Tre, Largo S. Leonardo Murialdo 1, I-
00146 Roma, Italy
2LNF-INFN, Via E. Fermi 40, Frascati (Roma), Italy
3INGV, Via di Vigna Murata 605, Roma, Italy
4Institute of Crystallography, CNR, Via Salaria Km 29,300, 00016 Monterotondo, Roma (Italy)
5School of GeoSciences, University of Edinburgh, Kings Buildings, West Mains Road,
Edinburgh EH9 3JW, Scotland, UK
Abstract
We report a FTIR (Fourier-transform infrared) study of a set of cordierite samples from
different occurrence and with different H2O/CO2 content. The specimens were fully
characterized by a combination of techniques including optical microscopy, single-crystal X-

Chapter 1: Quantitative analysis of H2O and CO2 in cordierite using polarized FTIR spectroscopy
26
ray diffraction, EMPA (electron micro probe analysis), SIMS (secondary ion mass
spectrometry), and FTIR spectroscopy. All cordierites are orthorhombic Ccmm. According to
the EMPA data, the Si:Al ratio is always close to 5:4; XMg ranges from 76.31 to 96.63 and
additional octahedral constituents occur in very small amounts. Extraframework K and Ca
are negligible, while Na reach values up to 0.84 apfu. SIMS shows H2O up to 1.52 and CO2 up
to 1.11 wt%.
Optically transparent single-crystals were oriented using the spindle-stage and
examined by FTIR micro-spectroscopy under polarized light. On the basis of the polarizing
behaviour, the observed bands were assigned to water molecules in two different
orientations and to CO2 molecules in the structural channels. The IR spectra also show the
presence of small amounts of CO in the samples. Refined integrated molar absorption
coefficients were calibrated for the quantitative microanalysis of both H2O and CO2 in
cordierite based on single-crystal polarized-light FTIR spectroscopy. For H2O the integrated
3 modes) were calculated
separately and are [I] -1∙cm-2 and [II] -1∙cm-2,
respectively. For CO2 CO2 = 19000 ± 2000 l∙mol-1∙cm-2.
Key words: cordierite, EMPA and SIMS, polarised FTIR spectroscopy, quantitative H2O and
CO2 analysis.
1. Introduction
Cordierite, ideally (Mg,Fe)2Al4Si5O18, is a unique case of a microporous mineral
stable under geological conditions spanning from the amphibolite facies to UHT
metamorphism to crustal anatexis (Vry et al. 1990; Carrington and Harley 1995, 1996;
Smith 1996; Kalt 2000; Harley et al. 2002; Bertoldi et al. 2004). Because of its
structural channels, cordierite is able to trap H2O and CO2 (Schreyer and Yoder 1964;
Armbruster and Bloss 1980; Kurepin 1985; Schreyer 1985; Carey 1995), but also
hydrocarbons (Zimmermann 1981; Mottana et al. 1983; Khomenko and Langer 1999),
CO (Khomenko and Langer 2005; Della Ventura et al. 2009), Ar (Armbruster 1985;
Schreyer 1985) and N2 (Armbruster 1985; Cesare et al. 2007). For this reason, the

Chapter 1: Quantitative analysis of H2O and CO2 in cordierite using polarized FTIR spectroscopy
27
analysis of the volatile constituents of cordierite can be a very useful tool to define
the composition of coexisting fluids during its formation (e.g. Vry et al. 1990; Visser et
al. 1994; Carrington and Harley 1996; Kalt 2000; Harley et al. 2002). Moreover, H2O
and CO2 contents may significantly affect the stability of cordierite (e.g. Schreyer
1985; Carey 1995; Harley et al. 2002), therefore the quantitative evaluation of the
channel constituents is crucial in petrologic studies.
The microanalysis of light elements like hydrogen and carbon is still extremely
complex (e.g. Rossman, 2006); due to their low atomic number these elements cannot be
easily studied by electron microprobe; moreover H and C are very poor X-rays scatterers
hence they cannot be studied with conventional X-rays diffraction methods.
On the other hand, infrared spectroscopy is an efficient technique to detect the
volatile components within the structural pores of cordierite (Farrell and Newnham 1967;
Goldman et al. 1977; Aines and Rossman 1984; Le Breton 1989; Kolesov and Geiger 2000;
Khomenko and Langer 2005; Rigby et al. 2008, Della Ventura et al. 2009); coupled with well-
tested methods for volatile quantification like secondary ion mass spectroscopy (e.g.
Thompson et al. 2001), it can be a simple yet powerful tool for sample volatile quantification
(Della Ventura et al. 2009). In addition, IR has the distinguishing advantage of providing
information on the closest structural environment of the target element, its molecular
arrangement (for example OH vs H2O, CO2 vs CO3) and the orientation of the molecules
within the structure. Moreover, by using the modern techniques of FTIR imaging with the bi-
dimensional focal plane array of detectors (FPA), enables detection of the zoning of volatile
species across the studied sample.
Despite the large number of studies, a calibration for unambiguous infrared
quantitative analysis of H2O and CO2 in cordierite is still lacking. The quantitative
determination of an absorber (c, concentration) in a mineral is based on the Beer-Lambert
law: c = Ai /(t i), where Ai (cm-1) = integrated absorbance, t (cm) = sample thickness and i
(cm-2 per mol H2O/L) = integrated molar absorption coefficient. Ai and t are measured, but
the i coefficient must be calibrated for any mineral matrix by combining an independent
method. Libowitzky and Rossman (1996) definitively showed that for quantitative purposes
the measurement of the absorbance in anisotropic minerals must be obtained summing-up
the integrated absorbance along the three principal optical directions. For orthorhombic
cordierite thus Ai = Ax + Ay + Az.

Chapter 1: Quantitative analysis of H2O and CO2 in cordierite using polarized FTIR spectroscopy
28
For H2O, the only molar absorption coefficient available for cordierite has been
calibrated by Goldman et al. (1977) using linear (peak height) intensity data, while the only
coefficient available for CO2 has been recently calibrated by Della Ventura et al. (2009) on
one cordierite crystal from a partially melted graphite-bearing granulitic enclave within the
dacitic lava dome of El Hoyazo (SE Spain). According to Della Ventura et al. (2009) several
problems are involved in the analysis of cordierite, primarily the possible zoning of H2O/CO2
in the sample and the widespread presence of inclusions or alteration products even in
apparently gemmy crystals.
We address in this paper the calibration for a reliable analysis in cordierite by
studying a set of samples from different occurrences.
2. Samples and analytical methods
Eight different cordierite samples (Table 1) from different localities and geological
occurrences were chosen for this work such as to cover a wide range in the H2O/CO2 ratio.
The crystals used for the spectroscopic data collection were previously fully characterized
using a multidisciplinary approach.
Table 1- Sample labels and occurrence of the studied samples.
Sample Occurrence
BM 96512 Cabo de Gata, Almaria Region, Spain
8/90 Serre Massiff, Calabria, Italy
RIG Unknown
BB3a Brattstrand Bluffs, Prydz Bay, Antarctica
Rp 7344 Karur, Tamil Nadu, India
Rp 5578 Tsihombe, Madagascar
Rp 3237 Kragero, Arendal, Norway
Rp 7045 Region de Bekily, Madagascar
Single-crystal X-ray diffraction data were collected on optically clean grains free from
inclusions and alteration products at CNR Istituto di Cristallografia (Bari) with a Nonius Kappa
CCD area detector diffractometer, using Mo-K radiation ( = 0.71073 Å). Cell refinement and
data reduction was performed via EvalCCD (Duisenberg et al. 2003) and absorption correction via

Chapter 1: Quantitative analysis of H2O and CO2 in cordierite using polarized FTIR spectroscopy
29
SADABS (Sheldrick 1996).
The structures were solved through the Direct Methods procedure of SIR2008 (Burla et al.
2007), within the orthorombic space group Cccm, and refined by a full-matrix least-square
techniques based on F2 using SHELX-97 (Sheldrick 1997).
The electron microprobe analyses (EMPA) were done using a Joel JXA 8200 WD-ED at
the Istituto Nazionale di Geofisica e Vulcanologia (INGV), Roma. Working conditions were 15
kV accelerating voltage, 7 nA sample current, 5 µm beam diameter, counting times: 10
seconds on the peak and 5 seconds on the background on both sides of the peak. The
standards, spectral lines and crystals used were: albite (NaKα, TAP), pargasite (CaKα, PET),
wollastonite (SiKα, PET), k-feldspar (KKα, PET), kyanite (AlKα, TAP), pargasite (MgKα, TAP),
augite (FeKα, LIF), titan oxyde (TiKα, LIF) and spessartine (MnKα, LIF). Data correction was
performed using the ZAF method. Sample homogeneity was verified collecting several spots
per crystal.
The H2O and CO2 contents were quantified by SIMS (secondary-ion-mass-
spectrometry) using a Cameca IMS4f ion microprobe at EMMAC, the University of
Edinburgh. Procedures follow those described in previous cordierite studies from the
Edinburgh laboratory (Harley and Carrington 2001; Thompson et al. 2001; Harley et al.
2002). A 2.58 cm diameter analysis block incorporating the studied samples, and two
standard cordierite grains (ANMH with XMg = 0.89; H2O = 1.54 wt%; and CO2 = 0.7 wt% and
8/90 with XMg = 0.75; H2O = 0.81 %; and CO2 = 1.31 wt%: Thompson et al. 2001) was
prepared, coated with gold, and inserted into the IMS4f sample change chamber for
overnight pump-down prior to in-situ SIMS analysis. Negative secondary ions 1H, 12C and 28Si
were measured at an energy offset of 75 V and energy window of 19 eV, under operating
conditions of 4500 V secondary beam voltage and 8 nA and 10 kV for the primary beam of O-
ions. Under these conditions the primary ion beam sputters an elliptical analysis pit with
long diameter 25-30 µm and maximum depth of 3 µm. All analyses involved a 3 minute burn-
in time followed by 20 cycles of 5 second counts for each isotope. The mean isotope ratios of
1H/28Si and 12C/28Si for the last 10 cycles in each analysis has been taken as the final results,
thereby avoiding surface contamination. Analyses expressed as isotopic ratios of 1H/28Si and
12C/28Si were converted to wt% H2O or CO2 by comparison with the calibration lines
produced from fitting two standards analysed several times throughout the same analytical
session.

Chapter 1: Quantitative analysis of H2O and CO2 in cordierite using polarized FTIR spectroscopy
30
FTIR spectra were acquired with a Nicolet Magna 760 spectrophotometer, equipped
with a NicPlan Microscope, a KBr beamsplitter and a liquid nitrogen-cooled MCT detector at
University Roma Tre. Polarized spectra were collected using a gold-wire grid polarizer on a
ZnSe substrate. The nominal resolution was 4 cm-1 and 128 scans were averaged for both
spectrum and background. Several fragments from each specimen were oriented using a
spindle stage (Bloss 1981) fitted on a polarizing microscope following the procedure of
Gunter et al. (2004). The fragments were transferred on glass slides and doubly polished to
thickness variable from 20 to 190 µm. Sample thickness was measured with a Leica DCM 3D
optical profilometer, at LIME (Laboratorio Interdipartimentale di Microscopia Elettronica),
Università Roma Tre; vertical resolution was < 15 nm in confocal mode (20X lens, NA = 0.50)
and < 4 nm in interferometric mode (50X lens, NA = 0.50); final thickness was averaged for
the whole surface of the sample. FTIR maps were collected at INFN (Istituto Nazionale di
Fisica Nucleare) of Frascati (Roma) using a Bruker® Hyperion 3000 IR microscope equipped
with a computer-controlled, motorized sample stage and an MCT detector. Single spot
spectra were collected using a beam size varying from 50 to 200 µm, on a grid up to several
mm2. FTIR images for some selected areas were acquired using a 64×64 pixel focal plane
array (FPA) of detectors. By using a 15X objective each image covers an area of 170 × 170
µm2 with a spatial resolution of ∼ 5 µm (Della Ventura et al. 2010). For both maps and
images the nominal resolution was set at 8 cm−1, and 128 scans were averaged for each
spectrum and background.
3. X-ray diffraction, optical properties and microchemistry
Single-crystal X-ray diffraction showed all samples to be orthorhombic Cccm; refined
cell parameters are listed in Table 2.
Table 2 also give selected microchemical data, where all oxides are from EMPA,
except H2O and CO2 which are from SIMS; the resulting crystal-chemical formulae were
calculated on the basis of 18 oxygen atoms. For all samples the Si:Al ratio is always close to
the stoichiometric 5:4 value (Table 2) thus excluding additional cations, such as Be and Li
(Schreyer et al. 1979, Sokol et al. 2010) at the four-fold coordinated sites. Fe has been
considered as Fe2+ (Goldman et al. 1977, Geiger et al. 2000); Mg and Fe are the main

Chapter 1: Quantitative analysis of H2O and CO2 in cordierite using polarized FTIR spectroscopy
31
octahedral occupants, with the XMg (= Mg/Mg+Fe) ranging from 76.31 to 96.63. Additional
elements occur in very low amounts; Ti and Mn are always < 0.01 apfu, except in sample
BM96512 where Mn ≈ 0.03 apfu. K and Ca occur in very minor amounts (< 0.01 apfu) while
Na may reach values as high as 0.84 apfu (sample Rp7344, Table 2). SIMS shows that the
studied samples contain variable H2O and CO2. H2O, in particular, is extremely low in sample
BB3a from Antarctica (Fitzsimons 1996; Thompson et al. 2001) and is > 0.50 apfu in sample
RP7344 from Tamil Nadu (Bertoldi et al. 2004; Lal et al. 1984) (Table 2). This latter sample
shows also the lowest content in carbon dioxide, while the highest CO2 content is recorded
in specimen 8/90 from the high-grade metamorphic rocks of Calabria (Italy). As expected, no
relationship between H2O and CO2 contents is observed.
Table 2 - Microchemical analysis, crystal-chemical formula, cell parameters, density and optical properties for the studied cordierites.
Sample BM 96512 8/90 RIG BB3a RP 7344 RP 5578 RP 3237 RP 7045
Chemical analysis (wt.%)
SiO2 49.10 48.33 49.61 48.27 49.65 49.43 49.55 49.19
Al2O3 33.10 32.83 33.50 32.91 33.11 32.78 33.01 33.33
MgO 10.04 9.48 12.94 8.45 13.20 11.94 12.49 10.79
FeO 5.21 6.35 0.75 8.33 1.06 2.52 1.86 4.49
TiO2 0.03 0.04 0.05 0.04 0.02 0.00 0.00 0.06
MnO 0.34 0.05 0.03 0.06 0.01 0.05 0.02 0.12
CaO 0.04 0.01 0.01 0.01 0.02 0.02 0.00 0.01
Na2O 0.15 0.10 0.19 0.03 0.43 0.17 0.24 0.05
K2O 0.03 0.00 0.02 0.12 0.01 0.00 0.00 0.01
H2O 0.62 0.81* n.a. 0.175 1.52 0.91 0.9 0.37
CO2 0.51 1.3* n.a. 0.74 0.22 1.11 1.01 0.69
Total 99.16 99.31 97.10 99.14 99.25 98.94 99.06 99.11
Crystal chemical formula (apfu)
Si 5.005 4.990 4.998 4.979 4.996 5.028 5.014 4.991
Al 3.977 3.994 3.977 4.000 3.926 3.930 3.937 3.986
Σ Tetrahedra 8.982 8.984 8.975 8.979 8.922 8.958 8.951 8.976
Mg 1.525 1.459 1.944 1.300 1.979 1.811 1.884 1.632
Fe 0.444 0.548 0.063 0.718 0.089 0.215 0.157 0.381
Ti 0.002 0.003 0.004 0.003 0.002 0.000 0.000 0.005
Mn 0.029 0.004 0.002 0.005 0.001 0.004 0.001 0.011
Σ Octahedra 2.001 2.015 2.013 2.026 2.071 2.030 2.042 2.028
Ca 0.004 0.001 0.001 0.002 0.003 0.002 0.000 0.001
Na 0.029 0.021 0.036 0.007 0.084 0.033 0.047 0.011
K 0.004 0.001 0.003 0.015 0.001 0.000 0.000 0.001
Σ Channels 0.037 0.022 0.040 0.024 0.087 0.035 0.047 0.013
n(H2O) 0.211 0.277 n.a. 0.060 0.510 0.309 0.305 0.124
m(CO2) 0.070 0.184 n.a. 0.105 0.031 0.154 0.139 0.096
Σ Volatiles 0.282 0.461 n.a. 0.165 0.541 0.463 0.444 0.220
**H2O[II] 0.138 0.234 n.a. 0.013 0.335 0.238 0.210 0.097
**H2O[I] 0.073 0.043 n.a. 0.047 0.175 0.071 0.095 0.027
XcrdCO2 0.25 0.40 n.a. 0.63 0.06 0.33 0.31 0.44

Chapter 1: Quantitative analysis of H2O and CO2 in cordierite using polarized FTIR spectroscopy
32
Cell parameters (Å)
a 17.135(7) 17.118(1) 17.103(1) 17.170(1) 17.020(1) 17.033(3) 17.085(2) 17.132(2)
b 9.781(5) 9.764(3) 9.759(1) 9.766(2) 9.751(1) 9.734(1) 9.721(1) 9.758(1)
c 9.343(7) 9.408(1) 9.451(4) 9.339(1) 9.380(1) 9.368(1) 9.353(1) 9.380(1)
Densitiy (g/cm3) 2.602(4) 2.612(6) 2.5752(4) 2.630(8) 2.577(1) 2.584(1) 2.58(3) 2.597(2)
Optic sign Positive Positive Positive Positive Negative Positive Positive Positive
2Vx (°) 90(3) 102.9(9) 103.4(4) 91(1) 63.15(8) 96(1) 90.3(9) 96.3(7)
Note: H2O and CO2 from SIMS, all other elements from EMPA; crystal-chemical formulae in atoms per formula unit (apfu) calculated on the basis of 18 oxygen pfu. For cell parameters, densities and optical 2Vx angle estimated standard errors on the last digit are given in brackets. n.a.: not analyzed. ** calculated as explained in the text. * Data from Thompson et al. (2001).
Table 2 also gives the 2Vx optic axis angles measured using the spindle stage (e.g.
Gunter et al. 2004); all samples are optically positive, except cordierite RP7344 which, having
the lowest CO2 content, is negative (Table 2a). The relationship between the 2Vx optical axis
angle and the CO2 content in the cordierite channel has been investigated experimentally by
Armbruster and Bloss (1982) who found a linear trend between all optical parameters and
the gas (both CO2 and H2O) content in the channels. The data reported in Table 2a are in
agreement with these results of Armbruster and Bloss (1982) and show that the CO2 content
indeed has a strong effect of the physical properties of cordierite.
Table 3 - Site populations (apfu) on the basis of the X-ray single-crystal refined site scattering for selected atoms. Errors in brackets. Thermal parameters for H2O and CO2 were considered all isotropic (Uiso) and fixed at values known from the literature (e.g. Malcherek et al. 2001) to avoid refinement instability. Δ = Difference between the microchemical and X-ray derived apfu
Sample BM96512 8/90 RIG BB3a RP 7344 RP 5578 RP 3237 RP 7045
Mg 1.564(8) 1.504(8) 2 1.328(8) 1.984(10) 1.858(10) 1.92(2) 1.660(8)
Fe2+
0.436(8) 0.496(8) - 0.672(8) 0.016(10) 0.142(10) 0.08(2) 0.340(8)
Na+ 0.042(8) 0.03(1) 0.04(1) 0.05(1) 0.15(1) 0.05(1) 0.05(2) 0.014(9)
OH2O 0.048(8) 0.08(3) 0.09(3) - 0.10(1) 0.06(6) - 0.057(5)
CCO2 0.09(2) 0.23(2) 0.29(2) 0.16(2) 0.11(1) 0.25(2) 0.25(3) 0.10(1)
Δ = apfuEPMA+SIMS - apfuXR-SCR
Mg 0.039 0.045 0.056 0.028 0.005 0.047 0.04 0.028
Fe2+
-0.008 -0.052 - -0.046 -0.073 -0.073 -0.08 -0.041
Na+ 0.013 0.01 0.004 0.04 0.07 0.02 0.003 0.003
OH2O -0.163 -0.20 - - -0.41 -0.25 - -0.067
CCO2 0.02 0.05 - 0.06 0.08 0.10 0.11 0.004
Site occupancy refinements (Table 3) were performed from X-ray single-crystal data
considering Mg and Fe at the same crystallographic site 8g (total site occupancy factor, s.o.f = 1),
Ow (the water oxygens) at the 4a site, C at the 4a site with the carbon-dioxide oxygens at the 8g
site (constraining their s.o.f. to be equal), and channel Na at the 4c site (Armbruster 1985;

Chapter 1: Quantitative analysis of H2O and CO2 in cordierite using polarized FTIR spectroscopy
33
Malcherek et al. 2001). Comparison of EMP+SIMS values with site occupancies refined from
XRD shows an excellent agreement between the two sets of data: Mg2+ contents obtained
from XRD are slightly overestimated by 0,056 apfu, while Fe2+ is underestimated by roughly
the same amount and Na+ contents are similar within esds. Interestingly, the XRD-refined
CO2 contents are slightly overestimated (Table 3) but still in excellent agreement with SIMS
data. On the other side, the agreement for water is rather poor, with H2O underestimated by
as much as 0.41 molecules pfu (Table 3).
4. Single-crystal FTIR spectroscopy
Figure 1 - Non-polarized single-crystal FTIR spectra of samples 8/90 (top) and RP7344 (bottom). Regions 1 and 2 (see text) are highlighted; bending and combination modes at 1635 and 5270 cm
-1, respectively, are arrowed.
The linear absorption coefficient is defined as linear absorbance / thickness (A/t).
Figure 1 shows two typical unpolarized-light spectra collected on a doubly-polished
fragment. The pattern consists of several bands which have been grouped for simplicity in

Chapter 1: Quantitative analysis of H2O and CO2 in cordierite using polarized FTIR spectroscopy
34
two regions, from 3900-3300 cm-1 (region 1) and 2600-2000 cm-1 (region 2), respectively. In
both regions intense and relatively sharp peaks are present. Additional peaks relevant to the
present discussion occur around 1635 cm-1 and in the 4000-6000 cm-1 range. As it will be
discussed below, these bands are related, respectively, to the bending mode and to the
combination of the stretching and the bending modes of the H2O molecule(s). Furthermore a
cursory examination of the unpolarized spectra of Figure 1 shows that the single-crystal FTIR
spectrum provides an immediate picture of the relative volatile content for samples with
different H2O/CO2 contents (RP7344, bottom: high-water and low CO2; 8/90, top: rich in
both H2O and CO2).
The polarized-light spectra collected for cordierite RP5578 are displayed in Figure 2.
In region 1 (Fig. 2a, left) the most intense peaks are observed for E // c, centred at 3689 and
3575 cm-1. A broad and relatively intense band is present at 3630 cm-1 in the E // b spectrum,
while the main features present in the E // a spectrum are the very sharp peak at 3708 cm-1
and a sharp and weak band at 3595 cm-1.
Figure 2A - Single-crystal polarized-light FTIR spectra of cordierite RP 5578 collected on oriented (010), 33 μm thick and (100), 34 μm thick, sections; left = region 1 and right = region 2. Spectra scaled to thickness and vertically displaced for clarity. The weak band at 2134 cm
-1 (inset) is from sample RP 7045, 72 μm thick section;
the linear absorption coefficient of the band is 2 cm-1
.
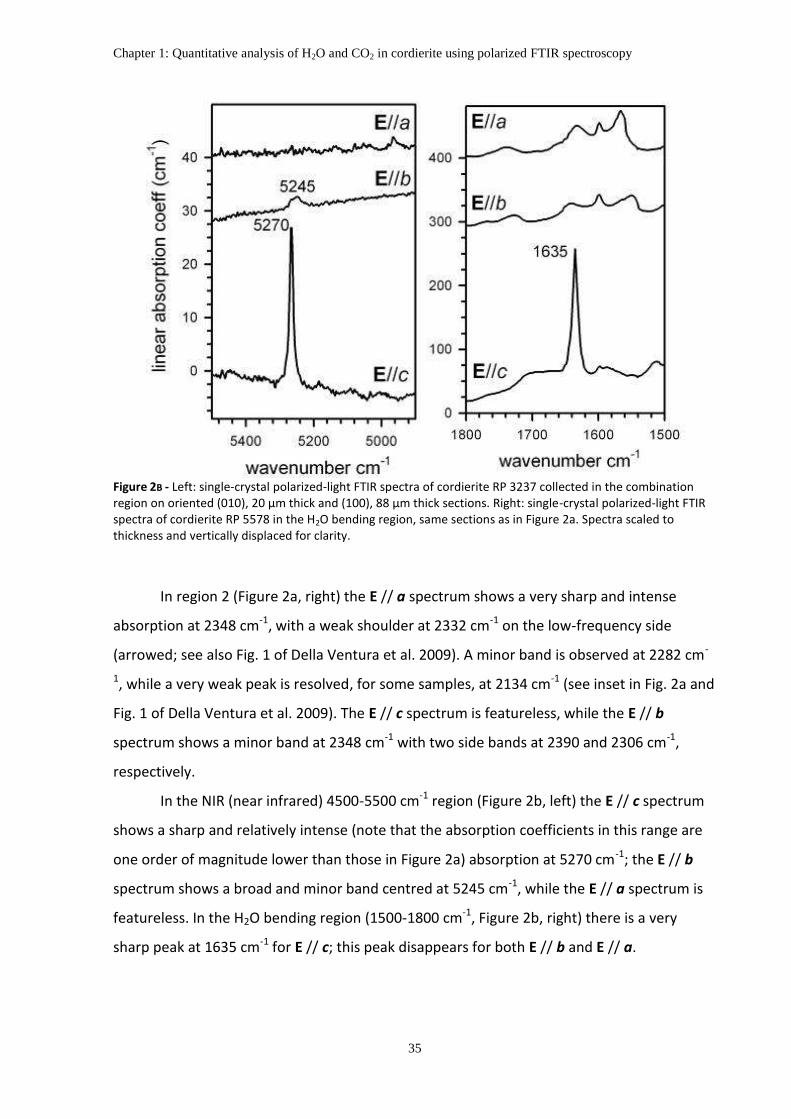
Chapter 1: Quantitative analysis of H2O and CO2 in cordierite using polarized FTIR spectroscopy
35
Figure 2B - Left: single-crystal polarized-light FTIR spectra of cordierite RP 3237 collected in the combination region on oriented (010), 20 μm thick and (100), 88 μm thick sections. Right: single-crystal polarized-light FTIR spectra of cordierite RP 5578 in the H2O bending region, same sections as in Figure 2a. Spectra scaled to thickness and vertically displaced for clarity.
In region 2 (Figure 2a, right) the E // a spectrum shows a very sharp and intense
absorption at 2348 cm-1, with a weak shoulder at 2332 cm-1 on the low-frequency side
(arrowed; see also Fig. 1 of Della Ventura et al. 2009). A minor band is observed at 2282 cm-
1, while a very weak peak is resolved, for some samples, at 2134 cm-1 (see inset in Fig. 2a and
Fig. 1 of Della Ventura et al. 2009). The E // c spectrum is featureless, while the E // b
spectrum shows a minor band at 2348 cm-1 with two side bands at 2390 and 2306 cm-1,
respectively.
In the NIR (near infrared) 4500-5500 cm-1 region (Figure 2b, left) the E // c spectrum
shows a sharp and relatively intense (note that the absorption coefficients in this range are
one order of magnitude lower than those in Figure 2a) absorption at 5270 cm-1; the E // b
spectrum shows a broad and minor band centred at 5245 cm-1, while the E // a spectrum is
featureless. In the H2O bending region (1500-1800 cm-1, Figure 2b, right) there is a very
sharp peak at 1635 cm-1 for E // c; this peak disappears for both E // b and E // a.

Chapter 1: Quantitative analysis of H2O and CO2 in cordierite using polarized FTIR spectroscopy
36
5. Interpretation of polarized FTIR spectra
The correct assignment of the bands observed in the spectra of cordierite is a critical
point when attempting to use the absorbance data for quantitative purposes. This issue has
been addressed by Della Ventura et al. (2009) who critically revised the existing literature on
the interpretation of the IR spectra of cordierite. Their conclusions will be used as a guide in
the following text, and will be augmented with the analysis of the entire wavenumber range
extending from 6000 cm-1 (NIR) to 1500 cm-1 (MIR).
The structural environment of the H2O and CO2 molecules in cordierite is shown in
Figure 3. Based on all previous spectroscopic and crystal-structural studies (see Della
Ventura et al. 2009 for a list of references) the H2O molecules may be oriented in two
different ways within the structural channels: (I) with their H-H direction parallel to the c-axis
(Figure 3 left); these are termed “type I” (nomenclature introduced by Goldman and
Rossman 1977) water molecules (hereafter H2O[I]). (II) with their H-H direction perpendicular
to the c-axis; these are termed “type II” water molecules (hereafter H2O[II]). This second type
is invariably associated with alkali cations (e.g. Goldman and Rossman 1977; Vry et al. 1990)
in the channel (Figure 3 center). The carbon dioxide molecule is oriented perpendicular to
the c-axis (Figure 3 right), dominantly parallel to the a-axis (Armbruster and Bloss 1982).
Figure 3 - The structural environment of the channel constituents in cordierite: (left) type I water, (center) type II water, (right) CO2.

Chapter 1: Quantitative analysis of H2O and CO2 in cordierite using polarized FTIR spectroscopy
37
The polarization behaviour of the fundamental modes of the water molecules in
cordierite is a function of the orientation of the molecule with respect the crystallographic
axis. As shown by Goldman et al. (1977), the 3 antisymmetric stretching is polarized along
the H...H direction, while 1 and 2 (symmetric stretching and bending, respectively) are
polarized along the molecular two-fold axis; combining both information we may obtain the
orientation of the molecular plane. The reference point for the interpretation of the spectra
of Figure 2 is the powder spectrum of CO2 and alkali-free synthetic Mg-cordierite (Paukov et
al. 2007), which consists of two bands: a very intense peak at 3689 cm-1, and a minor peak at
3595 cm-1. Given the controlled chemistry of the sample, the former can be unambiguously
assigned to the 3 mode of H2O[I], while the latter can be assigned to the 1 mode of the
same H2O[I] molecule. The splitting between these two components [Δ( 3 - 1) = 94 cm-1]
suggests that H2O[I] occurs in cordierite as a relatively free, unbound molecule (Geiger and
Kolesov 2002). In Figure 2a, the intense peak at 3689 cm-1 for E // c is thus assigned to the 3
vibration of H2O[I]. The 1 mode of the same H2O[I] molecule at 3595 cm-1 is observed as a
very weak absorption in the E // b spectrum. A weak component at ~ 3595 cm-1 is also
present in the E // a spectrum (Figure 2). Following Della Ventura et al. (2009) this is
assigned to a combination mode of CO2.
Based on the data available in the literature (e.g. Goldman et al. 1977; Kolesov and
Geiger 2000), H2O[II] is characterized by a 3 antisymmetric stretching at ~ 3630 cm-1
associated with a 1 symmetric stretching at ~ 3575 cm-1. Hence, the broad absorption at
3630 cm-1 for E // b (Figure 2a) is assigned to the 3 mode of H2O[II], while the well defined
peak at 3575 cm-1 for E // c is assigned to the 1 mode of the same H2O[II] molecule. The
splitting between these two bands [Δ( 3 - 1) = 55 cm-1] is lower than that observed for H2O[I]
suggesting that H2O[II] is involved in some sort of bonding with the closest atoms.
In the combination region, the most intense peak at 5270 cm-1 is polarized for E // c
hence it is assigned to the ( 3 + 2) combination mode of H2O[I], while the minor but
resolvable band centred at 5245 cm-1, polarized for E // b, is assigned to the ( 3 + 2)
combination mode of H2O[II] (see also Goldman et al. 1977). In accordance with this
interpretation, the integrated intensity of the 3689 cm-1 is linearly correlated with the
intensity of the 5270 cm-1 band (Figure 4a), while the integrated intensity of the 3630 cm-1 is
linearly correlated with the intensity of the 5245 cm-1 band (Figure 4b).
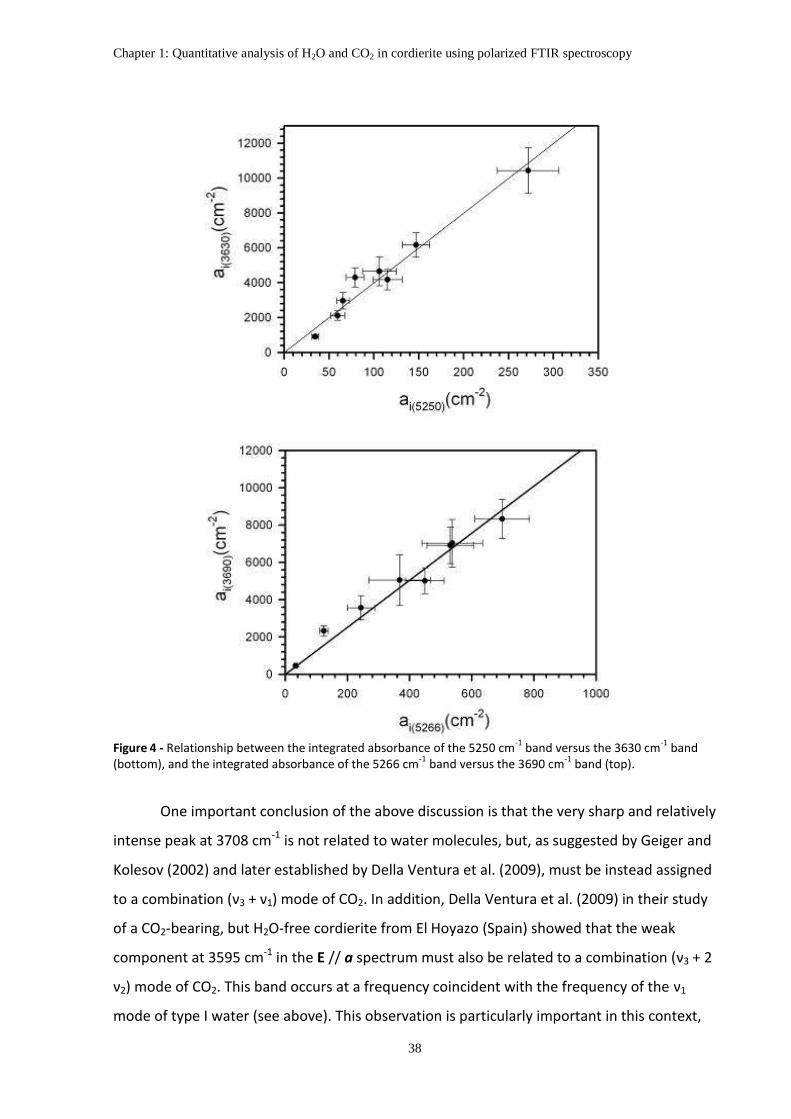
Chapter 1: Quantitative analysis of H2O and CO2 in cordierite using polarized FTIR spectroscopy
38
Figure 4 - Relationship between the integrated absorbance of the 5250 cm
-1 band versus the 3630 cm
-1 band
(bottom), and the integrated absorbance of the 5266 cm-1
band versus the 3690 cm-1
band (top).
One important conclusion of the above discussion is that the very sharp and relatively
intense peak at 3708 cm-1 is not related to water molecules, but, as suggested by Geiger and
Kolesov (2002) and later established by Della Ventura et al. (2009), must be instead assigned
to a combination (ν3 + ν1) mode of CO2. In addition, Della Ventura et al. (2009) in their study
of a CO2-bearing, but H2O-free cordierite from El Hoyazo (Spain) showed that the weak
component at 3595 cm-1 in the E // a spectrum must also be related to a combination (ν3 + 2
ν2) mode of CO2. This band occurs at a frequency coincident with the frequency of the ν1
mode of type I water (see above). This observation is particularly important in this context,

Chapter 1: Quantitative analysis of H2O and CO2 in cordierite using polarized FTIR spectroscopy
39
because all studies dealing with the spectroscopic H2O/CO2 determination in cordierite,
particularly those done using powder data (e.g. Vry et al. 1990; Kalt 2000; Rigby et al. 2008
and references therein), have been based on the Goldman et al. (1977) model, whereby all
bands in the 3900-3300 cm-1 range were assigned to H2O.
In the 2600-2000 cm-1 region (Figure 2a, right), the most intense band at 2348 cm-1 is
assigned to the ν3 antisymmetric stretching mode of the 12C16O2 molecule (Khomenko and
Langer 2005). The minor bands at 2282 and 2134 cm-1, which are observed in single-crystal
and powder spectra of CO2-rich cordierites (e.g. Le Breton 1989), have the same polarisation
behaviour as the main band at 2348 cm-1. Their interpretation has been discussed recently
by Khomenko and Langer (2005) who concluded that the former band can be assigned to the
vibration of a 13C16O2 carbon dioxide molecule, while the latter can be assigned to the
vibration of a 12C16O carbon monoxide molecule, also aligned along the a crystallographic
axis. Thus the IR spectrum of cordierite potentially provides information on both the
composition and the isotopic signature of molecular carbon entrapped into the structural
channels. Assignment of the two side bands at 2390 and 2306 cm-1 observed in the E // b
spectrum is still unclear; according to Aines and Rossman (1984), these bands may be
related to librational, sum and difference motions of the CO2 molecule on the (001) plane.
Final band assignments are summarized in Table 4.
Table 4 - Position, assignment and polarization for various peaks in the cordierite spectra.
Wavelength (cm-1) Molecule Mode Polarization
1635 H2O[II] bending ν2 c
2134 12C16O stretch ν3 a
2282 13C16O2 antisym stretch ν3 a
2348 12C16O2 antisym stretch ν3 a
3575 H2O[II] sym stretch ν1 c
3595 H2O[I] sym stretch ν1 b
3595 12C16O2 combination ν3 + 2ν2 a
3630 H2O[II] antisym stretch ν3 b
3689 H2O[I] antisym stretch ν3 c
3708 12C16O2 combination ν3 + ν1 a
5245 H2O[II] combination ν3 + ν2 b
5270 H2O[I] combination ν3 + ν2 c

Chapter 1: Quantitative analysis of H2O and CO2 in cordierite using polarized FTIR spectroscopy
40
6. The distribution of H2O and CO2 in the studied samples
Recent work done on several microporous materials such as leucite (Della
Ventura et al. 2008) or minerals of the haüyine-sodalite group (Bellatreccia et al.
2009) has shown that water, but also carbon dioxide, can be zoned across the crystal.
For cordierite in particular Della Ventura et al. (2009) have shown that the distribution
of water may be complicated by the diffuse presence of alteration products or by
fractures and cracks due to the geological history after the mineral formation, even in
samples which are apparently optically clean. The possible inhomogeneous
distribution of H2O and CO2 across the samples is obviously an important issue in
quantitative micro-analytical work, therefore as a preliminary step we collected
several FTIR maps and FPA images to test for the homogeneity of the crystals used for
single-spot quantitative analyses. As discussed by Della Ventura et al. (2010), there
are essentially two experimental set-ups in spectroscopic imaging: (1) FTIR mapping
which is performed by integrating the signal from successive locations of the
specimen surface; in this case a large number of single-spot spectra are collected by
displacing the sample step-by-step using a motorized stage. The final resolution of the
map depends on the single-spot size, which cannot be reduced below few tenths of
µm2 in conventional (globar) light (typically 20-50 µm2), and on the grid-size. The
advantage of this technique is that one can obtain maps of large areas (several mm2)
with a very good signal/noise ratio. The major disadvantage, besides the relatively
poor lateral resolution (the single-spot size), is the large time needed to collect a map
(up to hours for mm-sized maps). (2) FTIR imaging. In this case the whole image is
obtained in a single data collection by using a bi-dimensional array of detectors (FPA).
The number of pixels (the detectors) and their effective size will depend on the FPA
type and the microscope objective. Typical arrays range from the 64×64 channels,
providing 4096 individual spectra to 256×256 or 1024×1024 formats. Such arrays are
coupled with 15X or 36X objectives, thus the physical dimensions of a single pixel is in
the range 2.5 to 5 μm2. The area covered in each data collection is in the order of 200-
400 μm2. Using this technique a resolution close to the diffraction limit can be
attained, and the time needed to collect an image may scale down to few minutes
(Della Ventura et al. 2010).
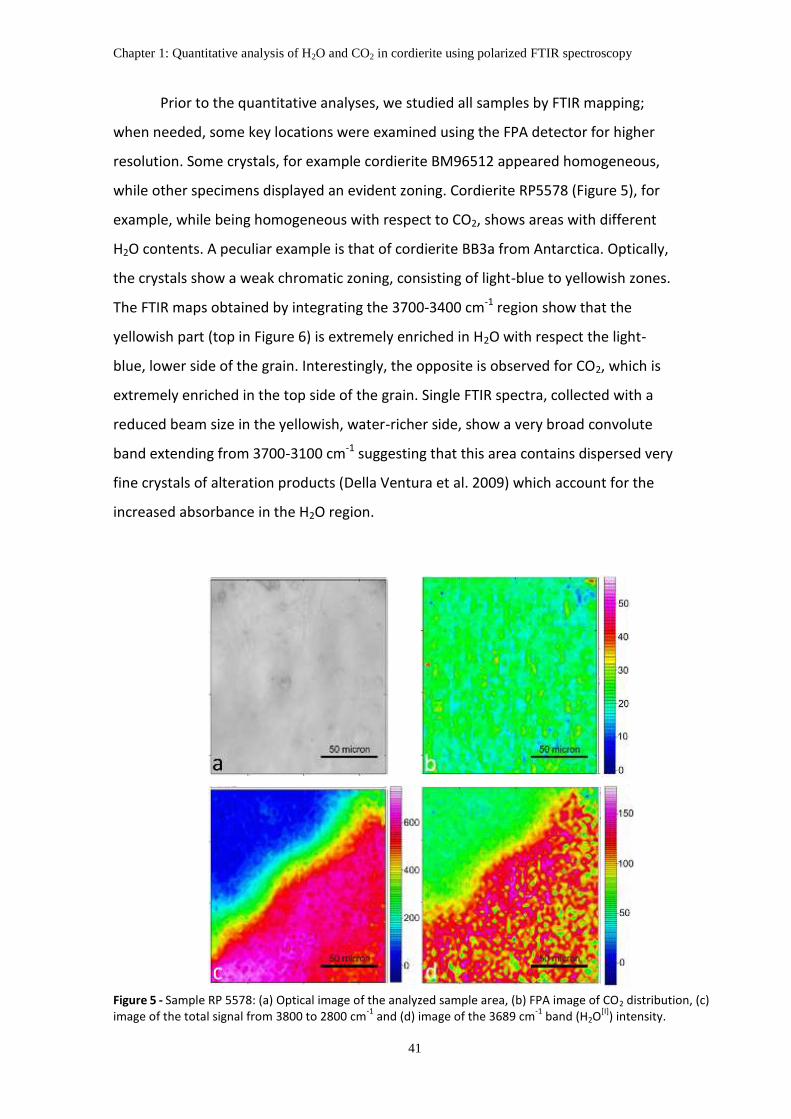
Chapter 1: Quantitative analysis of H2O and CO2 in cordierite using polarized FTIR spectroscopy
41
Prior to the quantitative analyses, we studied all samples by FTIR mapping;
when needed, some key locations were examined using the FPA detector for higher
resolution. Some crystals, for example cordierite BM96512 appeared homogeneous,
while other specimens displayed an evident zoning. Cordierite RP5578 (Figure 5), for
example, while being homogeneous with respect to CO2, shows areas with different
H2O contents. A peculiar example is that of cordierite BB3a from Antarctica. Optically,
the crystals show a weak chromatic zoning, consisting of light-blue to yellowish zones.
The FTIR maps obtained by integrating the 3700-3400 cm-1 region show that the
yellowish part (top in Figure 6) is extremely enriched in H2O with respect the light-
blue, lower side of the grain. Interestingly, the opposite is observed for CO2, which is
extremely enriched in the top side of the grain. Single FTIR spectra, collected with a
reduced beam size in the yellowish, water-richer side, show a very broad convolute
band extending from 3700-3100 cm-1 suggesting that this area contains dispersed very
fine crystals of alteration products (Della Ventura et al. 2009) which account for the
increased absorbance in the H2O region.
Figure 5 - Sample RP 5578: (a) Optical image of the analyzed sample area, (b) FPA image of CO2 distribution, (c) image of the total signal from 3800 to 2800 cm
-1 and (d) image of the 3689 cm
-1 band (H2O
[I]) intensity.
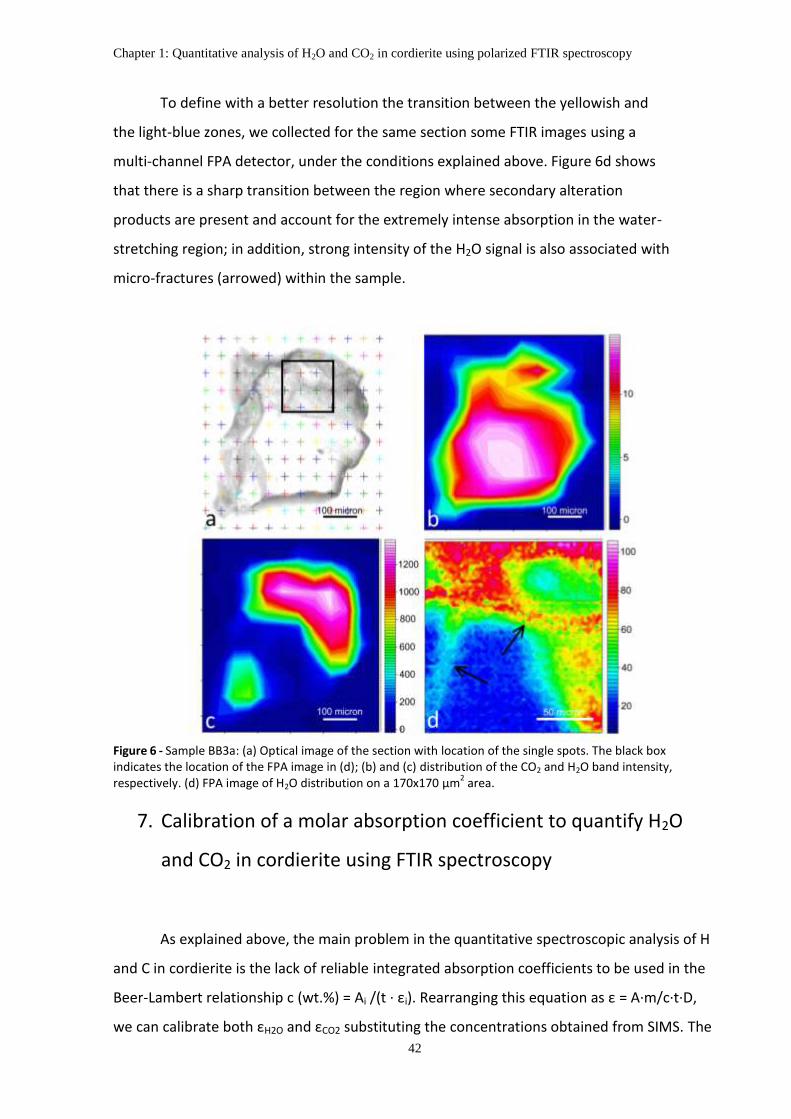
Chapter 1: Quantitative analysis of H2O and CO2 in cordierite using polarized FTIR spectroscopy
42
To define with a better resolution the transition between the yellowish and
the light-blue zones, we collected for the same section some FTIR images using a
multi-channel FPA detector, under the conditions explained above. Figure 6d shows
that there is a sharp transition between the region where secondary alteration
products are present and account for the extremely intense absorption in the water-
stretching region; in addition, strong intensity of the H2O signal is also associated with
micro-fractures (arrowed) within the sample.
Figure 6 - Sample BB3a: (a) Optical image of the section with location of the single spots. The black box indicates the location of the FPA image in (d); (b) and (c) distribution of the CO2 and H2O band intensity, respectively. (d) FPA image of H2O distribution on a 170x170 μm
2 area.
7. Calibration of a molar absorption coefficient to quantify H2O
and CO2 in cordierite using FTIR spectroscopy
As explained above, the main problem in the quantitative spectroscopic analysis of H
and C in cordierite is the lack of reliable integrated absorption coefficients to be used in the
Beer-Lambert relationship c (wt.%) = Ai /(t · εi). Rearranging this equation as ε = A·m/c·t·D,
we can calibrate both εH2O and εCO2 substituting the concentrations obtained from SIMS. The

Chapter 1: Quantitative analysis of H2O and CO2 in cordierite using polarized FTIR spectroscopy
43
m factor in this formula is needed for the conversion of the concentration from wt% to mol l-
1; for H2O m = 1.8 (Beran et al. 1993), for CO2 m = 4.401 (Della Ventura et al. 2009). The
density D (in g/cm3, Table 2a) was calculated as 0.0036X2 + 0.00394X + 2.573 (Goldman et al.
1977) where X = (total Fe in wt% from Table 2a), while Ai was obtained by summing up the
single absorbances measured along the three optical directions (Libowitzky and Rossman,
1996).
For H2O, one difficulty arises from the fact that SIMS provides the total water content
in the sample, while FTIR (see above) provides two different H2O signals due to the two
water types, which are resolved at different frequency (3689 vs 3630 cm-1). According to
Libowitzky and Rossman (1997), εH2O is a function of the wavenumber, thus two εH2O are
expected for the two water types. To solve this problem, we calculated for each sample the
relative amounts of H2O[I] and H2O[II] assuming that each alkali cation located within the
structural channels is locally associated with two H2O[II] molecules. This relationship has been
proposed by several authors (e.g. Goldman and Rossman 1977; Vry et al. 1990) and is also
verified in this study, as it is apparent in Figure 7, where there is a well-defined linear trend
connecting the total alkali content (Na+K+Ca) from EMPA, and the integrated absorbance of
the 3630 cm-1 band assigned to H2O[II]. Therefore, H2O[II] was set to be H2O[II] = 2·(Na,K,Ca)ch
and H2O[I] = H2Otot - H2O[II] (Table 2a). εH2O coefficients were finally calculated for both water
types, independently (Table 5).
Table 5 - Integrated and linear molar absorption coefficients and errors calibrated for different modes of cordierite
Integrated (l∙mol-1∙cm-2) Linear (l∙mol-1∙cm-1)
Mode εi σεi εl σεl
ν3 (H2O[I]) 5200 700 400 100
ν3 (H2O[II]) 13000 3000 240 50
ν3 (H2O[I] + H2O[II]) 6700 600 260 20
ν3 + ν2 (H2O[I]) 420 60 22 7
ν3 + ν2 (H2O[II]) 340 80 8 2
ν3 (CO2) 19000 2000 1000 100
For CO2, again SIMS provides the total carbon content only, while FTIR spectra show
(Figure 2a) that some of the examined cordierites contain also some carbon monoxide; from
the intensity of the CO band (2134 cm-1), its amount can, however, be estimated to be so
small that the error introduced in the calculation of the molar absorption coefficient can be
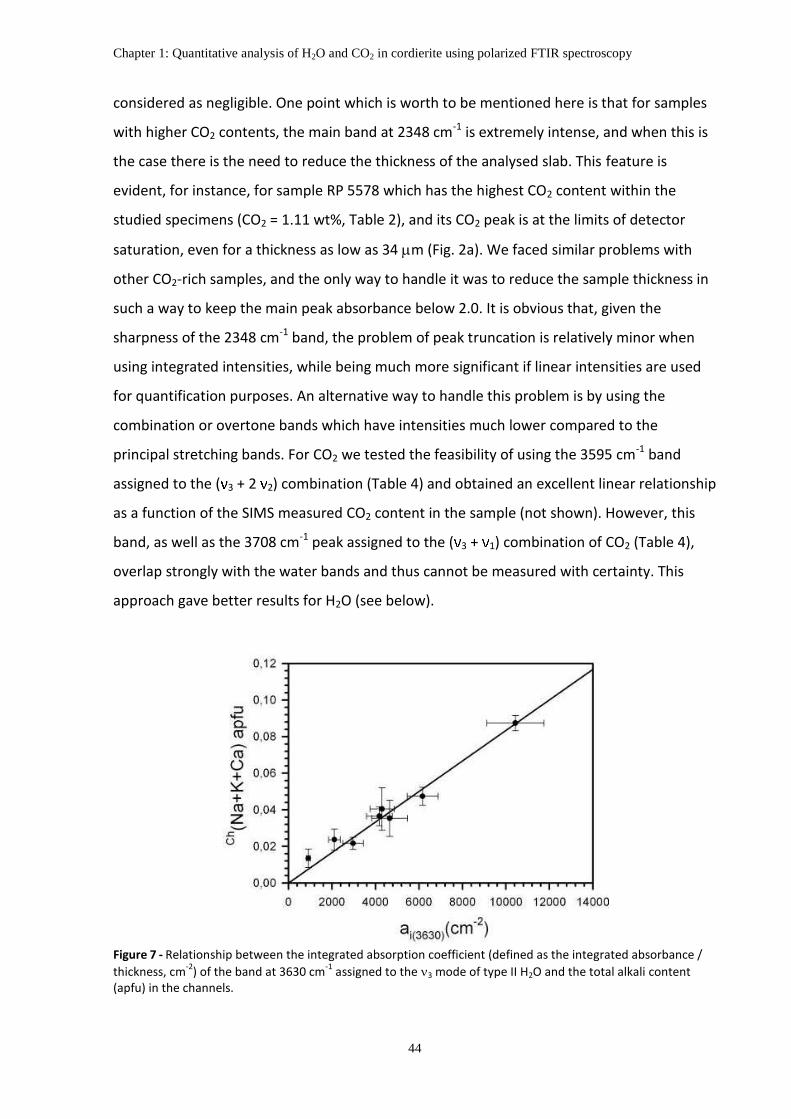
Chapter 1: Quantitative analysis of H2O and CO2 in cordierite using polarized FTIR spectroscopy
44
considered as negligible. One point which is worth to be mentioned here is that for samples
with higher CO2 contents, the main band at 2348 cm-1 is extremely intense, and when this is
the case there is the need to reduce the thickness of the analysed slab. This feature is
evident, for instance, for sample RP 5578 which has the highest CO2 content within the
studied specimens (CO2 = 1.11 wt%, Table 2), and its CO2 peak is at the limits of detector
saturation, even for a thickness as low as 34 m (Fig. 2a). We faced similar problems with
other CO2-rich samples, and the only way to handle it was to reduce the sample thickness in
such a way to keep the main peak absorbance below 2.0. It is obvious that, given the
sharpness of the 2348 cm-1 band, the problem of peak truncation is relatively minor when
using integrated intensities, while being much more significant if linear intensities are used
for quantification purposes. An alternative way to handle this problem is by using the
combination or overtone bands which have intensities much lower compared to the
principal stretching bands. For CO2 we tested the feasibility of using the 3595 cm-1 band
assigned to the ( 3 + 2 2) combination (Table 4) and obtained an excellent linear relationship
as a function of the SIMS measured CO2 content in the sample (not shown). However, this
band, as well as the 3708 cm-1 peak assigned to the ( 3 + 1) combination of CO2 (Table 4),
overlap strongly with the water bands and thus cannot be measured with certainty. This
approach gave better results for H2O (see below).
Figure 7 - Relationship between the integrated absorption coefficient (defined as the integrated absorbance /
thickness, cm-2
) of the band at 3630 cm-1
assigned to the 3 mode of type II H2O and the total alkali content (apfu) in the channels.
Chapter 1: Quantitative analysis of H2O and CO2 in cordierite using polarized FTIR spectroscopy
45
For H2O we calculated the absorption coefficients for the principal 3 stretching and
the combination bands. In addition to the integrated coefficient, we also calculated, for all
bands, the linear molar absorption coefficient, which makes use of the linear intensity
instead of the peak area. In some paper, particularly in earlier works, the linear intensity (Al)
was in fact used in the Beer-Lambert equation for quantitative purposes.
Figure 8 shows the relationship between the integrated intensity of the bands at
3689, 3630 and 2348 cm-1 assigned to H2O[I], H2O[II] and CO2, respectively against the relative
SIMS amounts (wt%). Specific molar absorption coefficients (ε) for each sample were
obtained on the basis of the Beer-Lambert relationship; the error associated with each
measurement was calculated using the classical statistics of error propagation (e.g.,
Bellatreccia et al. 2005) considering that the uncertainty on A is ~ 10% (Libowitzky and
Rossman 1997), on the sample thickness (t) is < 2 µm, the standard deviation of the density
(D) is 2% and the accuracy of SIMS analysis is better than 10%. Average final coefficients and
errors for the different bands are summarized in Table 5. Note that in Table 5 we list also the
molar absorption coefficients for the combination ( 3 + 2 2) bands of type I and II H2O which
can be resolved in the NIR region for thicker sample slabs.
8. Conclusions
We provide in this paper the first integrated molar absorption coefficient for H2O in
cordierite based on polarized measurements on oriented crystal sections. Those provided by
Goldman et al. (1977) were calibrated using linear (peak height) intensity data. They found
very similar values for type I (ε = 204 l∙mol-1∙cm-1) and type II (ε = 269 l∙mol-1∙cm-1) H2O, and
concluded that, considering the analytical error, both types of H2O molecules have the same
molar absorption coefficient. We show here that the two water molecules are characterized
by significantly different ε coefficients, and this difference is particularly evident when
dealing with integrated absorbance (Table 5). In this latter case, even considering the error
in the measurement, the εi coefficient for type II H2O is more than double than that obtained
for type I H2O. The logical consequence of this feature is that careful quantification of H2O in
cordierite by FTIR spectroscopy requires measuring the different bands due to the different

Chapter 1: Quantitative analysis of H2O and CO2 in cordierite using polarized FTIR spectroscopy
46
types of channel water. In Table 5 we also give the value of the ε coefficient calculated on
the basis of the total H2O[I] + H2O[I] band intensity versus the total SIMSH2O content. This
value can be used for a simplified spectroscopic quantification of the total H2O content in
the examined cordierite sample.
Figure 8 - Relationship between the integrated absorption coefficient (defined as the integrated absorbance/thickness, ai = Ai/t in cm
-2) of the band at 3689 cm
-1 (top), at 3630 cm
-1 (medium) and 2348 cm
-1
(bottom) versus the H2O[I]
, H2O[II]
and CO2 contents (apfu) obtained by SIMS, respectively.
Chapter 1: Quantitative analysis of H2O and CO2 in cordierite using polarized FTIR spectroscopy
47
For CO2, the εCO2 calibrated in this work [19000 l/(mol cm2)] is significantly different
from that obtained recently [~ 11000 l/(mol cm2)] by Della Ventura et al. (2009). The value
obtained here however is an average of measurements done on 8 samples spanning a
relatively large CO2 variation, while the value presented by Della Ventura et al. (2009) was
obtained on a single sample only. For this reason, we consider our data to be more reliable.
Powder infrared spectroscopy has been widely used in petrological studies as an
analytical method for H2O and CO2 in cordierite (e.g. Vry et al. 1990). However, as discussed
by Libowitzky and Rossman (1996) such a procedure cannot provide the absolute
quantitative determination of water and/or carbon dioxide. The calibration presented in this
study, on the other side, allows a high level of accuracy in the determination of both
molecules.
-scale the
distribution of H and C in this mineral may be significantly inhomogeneous, and this feature
must be taken into account when collecting analytical data for petrological purposes. This
feature is probably less important for carbon molecules than it is for H2O, whose distribution
within the crystal can be strongly affected by the geological history of the mineral after its
formation.
Acknowledgements
Financial support was provided by COFIN 2009 to GDV. Thanks are due to V. Mangione
(Lime, Roma) for assisting with optical profilometer measurements. H. Keppler (Bayreuth)
and an anonymous referee helped in clarifying some aspects of the text.

Chapter 2: Spectroscopy and X-ray structure refinement of sekaninaite from Dolnì Bory (Czech Rep.)
48
PUBLISHED ON MINERALOGICAL MAGAZINE (JUNE 2013)
DOI: 10.1180/minmag.2013.07 7.4.08
CHAPTER 2
SPECTROSCOPY AND X-RAY STRUCTURE REFINEMENT OF
SEKANINAITE FROM DOLNÌ BORY (CZECH REP.)
Francesco Radica1, Francesco Capitelli2, Fabio Bellatreccia1,3, Giancarlo Della
Ventura1,3,4, Andrea Cavallo4, Massimo Piccinini5 and Frank C. Hawthorne6
1Dipartimento di Scienze Geologiche, Università degli Studi Roma Tre, Largo S. Leonardo
Murialdo 1, 00146 Roma, Italy
2Istituto di Cristallografia, Consiglio Nazionale delle Ricerche (CNR), Via Salaria Km 29,300,
00016 Monterotondo, Rome, Italy
3Laboratori Nazionali di Frascati - Istituto Nazionale di Fisica Nucleare (LNF – INFN), Via E.
Fermi 40, 00044 Frascati (Rome), Italy
4Istituto Nazionale di Geofisica e Vulcanologia (INGV), Via di Vigna Murata 605, 00143 Roma,
Italy
5Porto Conte Ricerche s.r.l., Strada Provinciale 55 Km 8,400, 07041 Alghero (Sassari), Italy
6Department of Geological Sciences, University of Manitoba, Winnipeg, Manitoba R3T 2N2,
Canada
Chapter 2: Spectroscopy and X-ray structure refinement of sekaninaite from Dolnì Bory (Czech Rep.)
49
Abstract
The crystal chemistry of sekaninaite from Dolnì Bory, Czech Republic, was characterized by a
multi-methodological approach. Particular emphasis was put on the characterization of the
channel constituents (i.e. H2O and CO2). Electron-micro-probe analysis shows the sample to
be close to the Fe end-member [XFe = Fe/(Fe+Mg) = 94%) with significant Mn (1.48 wt.%)
present; laser ablation mass-spectrometry showed the presence of 0.42 wt.% Li2O. H2O and
CO2 contents (1.48 and 0.17 wt.%, respectively) were determined via secondary-ion mass-
spectrometry (SIMS). Sample homogeneity was checked by FTIR imaging using a microscope
equipped with an FPA detector. Single-crystal FTIR spectroscopy confirmed the presence of
two types of H2O groups in different orientations (with prevalence of the type II orientation),
and that CO2 is oriented preferentially normal to the crystallographic c axis. Using the Beer-
Lambert relation, integrated molar coefficients εi were calculated for both types of H2O (εi
H2O[I] = 6000±2000; εi H2O[II] = 13000±1000) and for CO2 (εi CO2 = 2000±1000).
Key words: sekaninaite, crystal-structure refinement, EMPA + SIMP analysis, FTIR
spectroscopy
1. Introduction
Sekaninaite is the Fe2+ dominant member of the cordierite group (Cěrný et al., 1997).
The first occurrence of this mineral was reported by Sekanina (1928) in the pegmatites of
Dolnì Bory; however, it was definitively described as a new mineral species by Staněk and
Miškovský (1964, 1975). Cordierites are framework alumino-silicates with the ideal formula
(□,Na)(Mg,Fe)2Al4Si5O18(□,H2O,CO2) = XM2T9O18Y and form a continuous solid solution
between the Mg2+ end-member (cordierite s.s.) and the Fe2+ end-member (sekaninaite). The
main structural feature of these minerals is the presence of 6-fold rings of tetrahedra
stacked along the c crystallographic axis. These rings form cavities that can accommodate
large cations such as Na+, K+ and molecules such as H2O and CO2. The sekaninaite framework
can be described as a stacking of pseudo-hexagonal Si/Al layers of tetrahedra and mixed

Chapter 2: Spectroscopy and X-ray structure refinement of sekaninaite from Dolnì Bory (Czech Rep.)
50
layers of tetrahedra and octahedra (Fig. 1). Alkali cations, H2O and CO2 fill the resulting
pseudo-hexagonal channel, occupying sites on the c axis at (0, 0, 0) for Na, and (0, 0, ¼) for
H2O and CO2 (Hochella et al., 1979; Malcherek et al., 2001; Yakubovich et al., 2004). The
chemical composition of the framework has the ideal formula 4 Al apfu and 5 Si apfu. Due to
the high concentration of alkali cations within the channels (Cěrný et al., 1997; Yacobuvich et
al., 2004), charge balance may be restored by Be2+ substitution at the tetrahedrally
coordinated sites (Armbruster and Irouschek, 1983; Yacobuvich et al., 2004) or Li+ at the
octahedrally coordinated sites (Cěrný et al., 1997; Gottesmann and Förster, 2004). Unlike
cordierite, sekaninaite is not a widespread mineral, and usually occurs in the albite zone of
pegmatitic rocks (Staněk and Miškovský, 1964, Orlandi and Pezzotta, 1994; Guastoni el al.,
2004). Other occurrences of sekaninaite were reported in altered bauxitic lithomarges
(Ryback et al., 1988) and in Fe-rich pyrometamorphosed rocks (Sharygin et al., 2009; Grapes
et al., 2010).
Figure - 1 Schematic view of a portion of the sekaninaite structure which includes the channel parallel along the c axis. Si-containing tetrahedra are shown in dark grey and Al-containing tetrahedra are shown in light grey. The structural position of Na and both orientation types of H2O are shown in the channels.
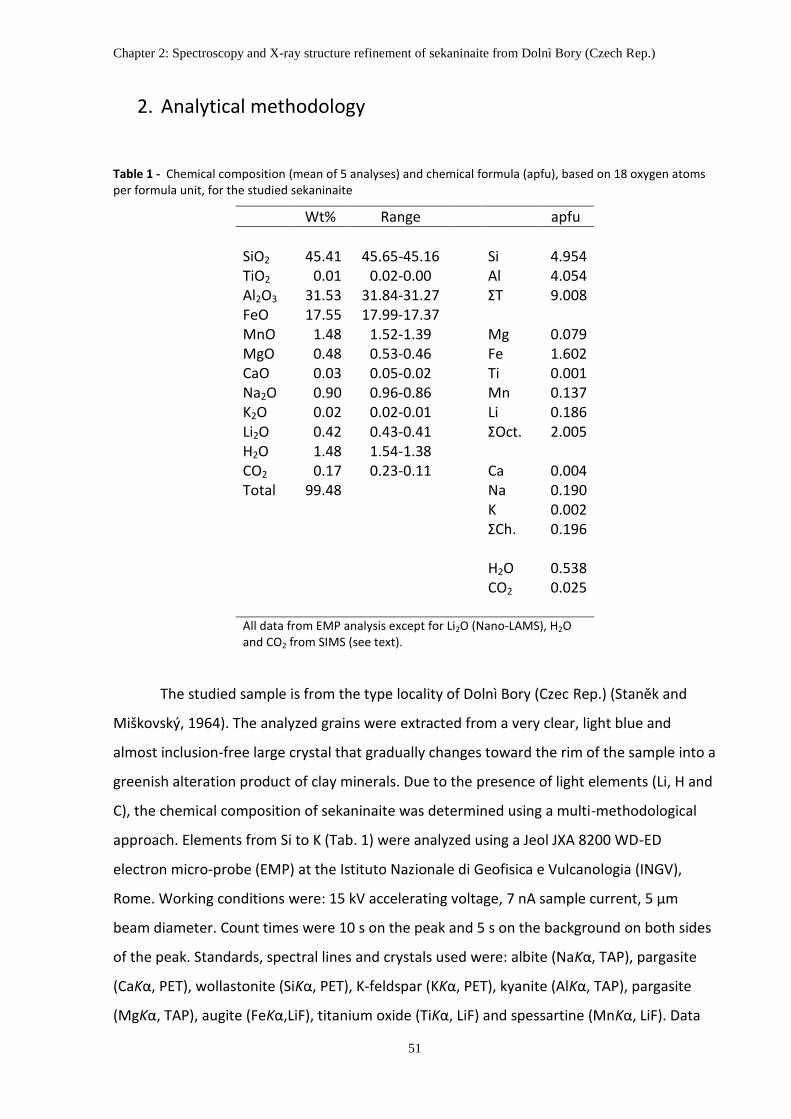
Chapter 2: Spectroscopy and X-ray structure refinement of sekaninaite from Dolnì Bory (Czech Rep.)
51
2. Analytical methodology
Table 1 - Chemical composition (mean of 5 analyses) and chemical formula (apfu), based on 18 oxygen atoms per formula unit, for the studied sekaninaite
Wt% Range apfu
SiO2 45.41 45.65-45.16 Si 4.954 TiO2 0.01 0.02-0.00 Al 4.054 Al2O3 31.53 31.84-31.27 ΣT 9.008 FeO 17.55 17.99-17.37 MnO 1.48 1.52-1.39 Mg 0.079 MgO 0.48 0.53-0.46 Fe 1.602 CaO 0.03 0.05-0.02 Ti 0.001 Na2O 0.90 0.96-0.86 Mn 0.137 K2O 0.02 0.02-0.01 Li 0.186 Li2O 0.42 0.43-0.41 ΣOct. 2.005 H2O 1.48 1.54-1.38 CO2 0.17 0.23-0.11 Ca 0.004 Total 99.48 Na 0.190 K 0.002 ΣCh. 0.196 H2O 0.538 CO2 0.025 All data from EMP analysis except for Li2O (Nano-LAMS), H2O and CO2 from SIMS (see text).
The studied sample is from the type locality of Dolnì Bory (Czec Rep.) (Staněk and
Miškovský, 1964). The analyzed grains were extracted from a very clear, light blue and
almost inclusion-free large crystal that gradually changes toward the rim of the sample into a
greenish alteration product of clay minerals. Due to the presence of light elements (Li, H and
C), the chemical composition of sekaninaite was determined using a multi-methodological
approach. Elements from Si to K (Tab. 1) were analyzed using a Jeol JXA 8200 WD-ED
electron micro-probe (EMP) at the Istituto Nazionale di Geofisica e Vulcanologia (INGV),
Rome. Working conditions were: 15 kV accelerating voltage, 7 nA sample current, 5 µm
beam diameter. Count times were 10 s on the peak and 5 s on the background on both sides
of the peak. Standards, spectral lines and crystals used were: albite (NaKα, TAP), pargasite
(CaKα, PET), wollastonite (SiKα, PET), K-feldspar (KKα, PET), kyanite (AlKα, TAP), pargasite
(MgKα, TAP), augite (FeKα,LiF), titanium oxide (TiKα, LiF) and spessartine (MnKα, LiF). Data

Chapter 2: Spectroscopy and X-ray structure refinement of sekaninaite from Dolnì Bory (Czech Rep.)
52
correction was done using the ZAF method. Sample homogeneity was verified by collecting
many points per crystal. Lithium was determined by laser ablation inductively coupled
plasma mass spectrometry (LA-ICP-MS) at the Department of Geological Sciences, University
of Manitoba (Winnipeg), using a Merchantek New Wave UP213 laser ablation system. The
data were collected from three spots with a Nd: YAG laser, beam diameter of 50 μm, 10 Hz
repetition rate, about 5 J/cm2 fluence, 30 s background acquisition and 50 s ablation time. Li
was standardized against NIST SRM 610.
H2O and CO2 were quantified by secondary-ion mass spectrometry (SIMS) using a
Cameca IMS4f ion microprobe at the Edinburgh Materials and Micro Analysis Centre,
University of Edinburgh. Sputtered secondary ions 1H, 12C and 28Si were measured with an
energy offset of 75 V and an energy window of 19 eV, under operating conditions of 4500 V
secondary-beam voltage and 8 nA and 10 kV for the primary beam of O− ions. Under these
conditions, the primary-ion beam sputters an elliptical area with long diameter 25–30 µm
and maximum depth of 3 µm. All analyses involved a 3 minute burn-in time followed by 20
cycles of 5 s counts for each isotope. The mean isotope ratios 1H/28Si and 12C/28Si for the last
10 cycles in each analysis were taken as the final results in order to avoid surface
contamination. Analyses expressed as isotopic ratios of 1H/28Si and 12C/28Si were converted
to wt.% H2O or CO2 by comparison with the calibration lines produced from fitting two
standards analyzed several times throughout the same analytical session. The standards
used were the samples ANMH (XMg = 0.89; H2O = 1.54 wt%; and CO2 = 0.7 wt%, Thompson et
al., 2001) and 8/90 (labeled 81-90 XMg = 0.75; H2O = 0.81 %; and CO2 = 1.31 wt%, Thompson
et al., 2001).
X-ray diffraction data were collected at the Istituto di Cristallografia, Bari, with a
Nonius Kappa CCD area-detector diffractometer (Tab. 2); data collection: COLLECT (Nonius,
1998); cell refinement and data reduction: EvalCCD (Duisenberg et al., 2003), absorption
correction: SADABS (Sheldrick, 2008).The structure was solved through the Direct Methods
procedure of SIR2008 (Burla et al., 2007) in the orthorhombic space group Cccm (n. 66), with
the following unit-cell constants: a = 17.2340(15), b = 9.8457(18), c = 9.3463(18) Å, and
refined by full-matrix least-squares based on F2, SHELXL-97 (Sheldrick, 2008); final R indices
were, for *I>2σ(I)+ R1 = 0.0178 and wR2 =0.0490, and for all data R1 = 0.0186 and wR2 =
0.0499.

Chapter 2: Spectroscopy and X-ray structure refinement of sekaninaite from Dolnì Bory (Czech Rep.)
53
Table 2 - Crystal data and structure refinement data for sekaninaite from Dolnì Bory
Micro-Raman spectra were collected at Porto Conte Ricerche s.r.l., Alghero (Sassari),
using a Bruker Senterra Raman microscope equipped with a 532 nm laser operated at 50
mW; 10 acquisitions of 5 s each were accumulated, with a spectral resolution set at 3 to 5
cm-1 (100x lens, NA = 0.9). Raw data were slightly smoothed.
FTIR spectra were acquired with a Nicolet Magna 760 spectrophotometer, equipped
with a NicPlan Microscope, a KBr beamsplitter and a liquid nitrogen-cooled MCT detector at
the Dipartimento di Scienze Geologiche, Università Roma Tre. The polarized spectra were
collected using a gold-wire-grid polarizer on a ZnSe substrate. The nominal resolution is 4
cm-1 and 128 scans were averaged for both spectrum and background. The samples for
polarized IR measurements were oriented using a polarizing microscope equipped with a
spindle-stage; the program ExcalibrW (Bloss, 1981; Gunter et al., 2005) was used to process
Temperature 293(2) K Radiation, Wavelength Mo-Kα, 0.71073 Å Crystal system, Orthorhombic Space group Cccm Unit cell dimensions a = 17.2340(15) Å b = 9.8457(18) Å c = 9.3463(18) Å Volume 1585.9(4) Å3
Z 16 Calculated density 2.726 Mg∙m-3
Absorption coefficient 2.315 mm-1
F(000) 1279 Crystal size 0.25 x 0.25 x 0.12 mm Theta range for data collection 5.25° to 27.52° Limiting indices -22 ≤ h ≤ 22, -12 ≤ k ≤ 12, -12 ≤ l ≤ 10 Reflections collected / unique 9441 / 942 [Rint = 0.0297] Completeness to theta 96.6 % (theta = 27.52°) Max. and min. transmission 0.7686 and 0.5953 Refinement method* Full-matrix least-squares on F2
Data / restraints / parameters 942 / 1 / 84 Goodness-of-fit on F2 1.162 Final R indices [I>2σ(I)] R1 = 0.0178, wR2 = 0.0490 R indices (all data) R1 = 0.0186; wR2 = 0.0499 Extinction coefficient 0.0092(4) Largest diff. peak and hole 0.348 and -0.416 e∙Å-3
*SHELXL-97 weighting scheme applied: w
-1=[s
2(Fo
2)+(0.0179P)
2+3.4870P] where P=[(Fo
2+2Fc
2)/3]

Chapter 2: Spectroscopy and X-ray structure refinement of sekaninaite from Dolnì Bory (Czech Rep.)
54
the extinction data and to determine the 2V values. The oriented fragments were
transferred to glass slides and doubly polished to thickness below 100 µm. Sample thickness
was checked with a Leica DCM 3D optical profilometer at the Laboratorio
Interdipartimentale di Microscopia Elettronica (LIME), Università Roma Tre. The nominal
vertical resolution was less than 15 nm in confocal mode (20X lens, NA = 0.50) and less than
4 nm in interferometric mode (50X lens, NA = 0.50); sample thickness was averaged for the
whole surface of the slab.
FTIR images were collected at the Laboratori Nazionali di Frascati-Istituto Nazionale
di Fisica Nucleare (LNF-INFN,) Frascati (Rome) using a Bruker® Hyperion 3000 IR microscope
equipped with a 64×64-pixel focal-plane array (FPA) of liquid nitrogen-cooled MCT detectors.
Using a 15X objective, each image covers an area of 170 X 170 µm2 with a nominal spatial
resolution of ~5 µm (Della Ventura et al., 2010). The nominal resolution was set at 4 cm−1
and 64 scans were averaged for each spectrum and background.
Refractive indexes were determined by the double-variation method (Su et al., 1987,
Gunter et al., 2004) using standard Cargille liquids as reference.
3. Chemical composition
Figure 2 - Sum of channel cation charges versus Be + Li charges. Cross: this work, diamonds: samples from Dolnì Bory (Cěrný et al., 1997); the regression line for these latter samples is reported.
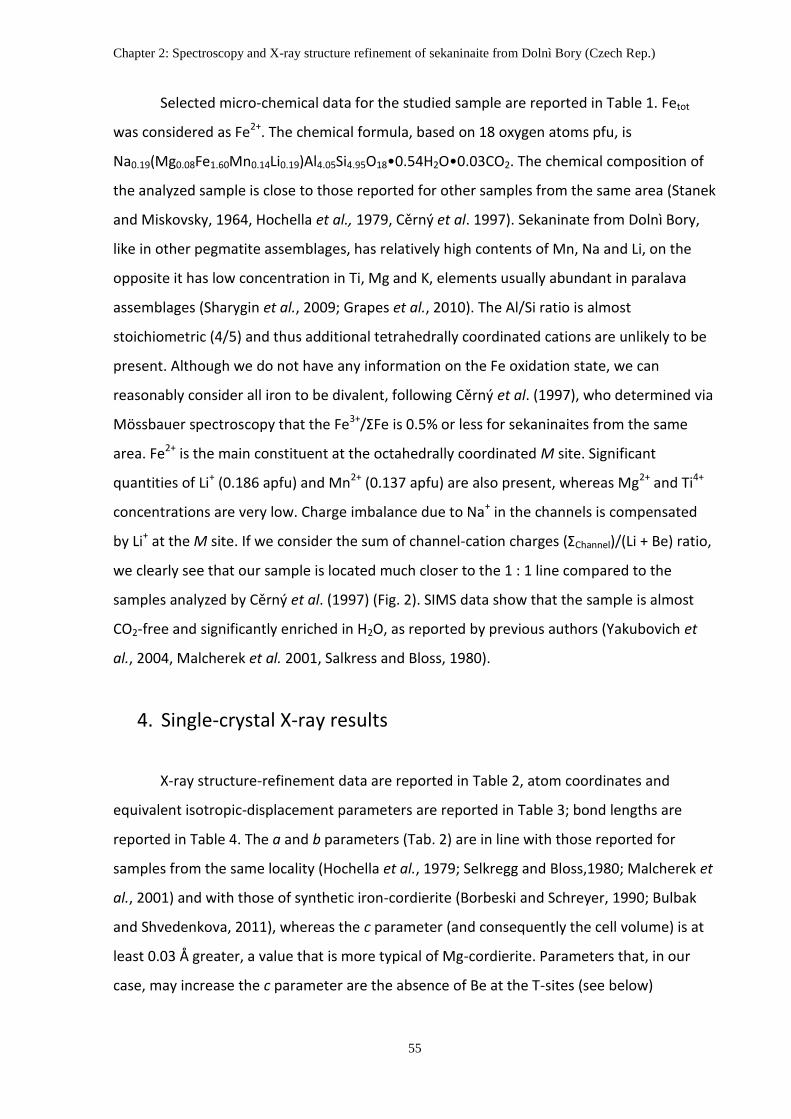
Chapter 2: Spectroscopy and X-ray structure refinement of sekaninaite from Dolnì Bory (Czech Rep.)
55
Selected micro-chemical data for the studied sample are reported in Table 1. Fetot
was considered as Fe2+. The chemical formula, based on 18 oxygen atoms pfu, is
Na0.19(Mg0.08Fe1.60Mn0.14Li0.19)Al4.05Si4.95O18•0.54H2O•0.03CO2. The chemical composition of
the analyzed sample is close to those reported for other samples from the same area (Stanek
and Miskovsky, 1964, Hochella et al., 1979, Cěrný et al. 1997). Sekaninate from Dolnì Bory,
like in other pegmatite assemblages, has relatively high contents of Mn, Na and Li, on the
opposite it has low concentration in Ti, Mg and K, elements usually abundant in paralava
assemblages (Sharygin et al., 2009; Grapes et al., 2010). The Al/Si ratio is almost
stoichiometric (4/5) and thus additional tetrahedrally coordinated cations are unlikely to be
present. Although we do not have any information on the Fe oxidation state, we can
reasonably consider all iron to be divalent, following Cěrný et al. (1997), who determined via
Mössbauer spectroscopy that the Fe3+/ΣFe is 0.5% or less for sekaninaites from the same
area. Fe2+ is the main constituent at the octahedrally coordinated M site. Significant
quantities of Li+ (0.186 apfu) and Mn2+ (0.137 apfu) are also present, whereas Mg2+ and Ti4+
concentrations are very low. Charge imbalance due to Na+ in the channels is compensated
by Li+ at the M site. If we consider the sum of channel-cation charges (ΣChannel)/(Li + Be) ratio,
we clearly see that our sample is located much closer to the 1 : 1 line compared to the
samples analyzed by Cěrný et al. (1997) (Fig. 2). SIMS data show that the sample is almost
CO2-free and significantly enriched in H2O, as reported by previous authors (Yakubovich et
al., 2004, Malcherek et al. 2001, Salkress and Bloss, 1980).
4. Single-crystal X-ray results
X-ray structure-refinement data are reported in Table 2, atom coordinates and
equivalent isotropic-displacement parameters are reported in Table 3; bond lengths are
reported in Table 4. The a and b parameters (Tab. 2) are in line with those reported for
samples from the same locality (Hochella et al., 1979; Selkregg and Bloss,1980; Malcherek et
al., 2001) and with those of synthetic iron-cordierite (Borbeski and Schreyer, 1990; Bulbak
and Shvedenkova, 2011), whereas the c parameter (and consequently the cell volume) is at
least 0.03 Å greater, a value that is more typical of Mg-cordierite. Parameters that, in our
case, may increase the c parameter are the absence of Be at the T-sites (see below)

Chapter 2: Spectroscopy and X-ray structure refinement of sekaninaite from Dolnì Bory (Czech Rep.)
56
(Yakubovich et al., 2004) and the presence of H2O and CO2 (Tab. 1) in the channels
(Armbruster and Bloss, 1982).
Table 3 - Wyckoff site, atom coordinates, equivalent-displacement parameters (Å2), and site- occupancy factors
(SOF) of sekaninaite from Dolnì Bory.
Site Wyckoff symbol
x/a y/b z/c U(eq) s.o.f.
T1 4b 0 1/2 1/4 0.0136(2) T2 8l 0.18999(4) 0.07921(7) 0 0.01273(17) T3 8l 0.13471(4) 0.76594(7) 0 0.01270(17) T4 8k 1/4 1/4 0.25011(8) 0.01421(18) T5 8l 0.04972(4) 0.30757(7) 0 0.01298(18) M 8g 0.33688(2) 0 1/4 0.01448(18) 0.873(5) Fe +
0.035(5) Mg + 0.09 Li*
O1 16m 0.24402(7) 0.89508(12) 0.35809(13) 0.0166(3) O2 16m 0.06074(7) 0.58523(13) 0.34885(14) 0.0165(3) O3 16m 0.82705(7) 0.69477(12) 0.35782(14) 0.0167(3) O4 8l 0.04328(10) 0.7543(2) 0 0.0210(4) O5 8l 0.11931(10) 0.18336(19) 0 0.0209(4) O6 8l 0.16213(10) -0.07670(18) 0 0.0204(4) O7 8g 0.0580(6) 0 1/4 0.069 0.03* O8w 4a 0 0 1/4 0.101(6) 0.62(3) O +
0.03* C Na 4c 0 0 0 0.035(4) 0.203(10)
Equivalent isotropic U is defined as 1/3 of the trace of the orthogonalised Uij tensor. Na and O8w refined with isotropic displacement parameters. C and O7 isotropic displacement parameters fixed at Malcherek et al. (2001) values. *s.o.f. fixed for Li at nano-LAMS (Tab. 1) and for CO2 at SIMS (Tab. 1) values.
In sekaninaite, the framework consists of five T tetrahedra (Cohen et al., 1977;
Armbruster, 1986). Three T-sites (T2, T3 and T5) form the six-membered pseudo-hexagonal
ring and the remaining two T-sites (T1 and T4) connect the rings into a chain which extends
parallel to the c crystallographic axis. Al occupies the T4 and T5 site (two of the six
tetrahedra of the ring are occupied by Al) and the remaining sites (T1, T2 and T3) are
occupied by Si (Fig. 1). Be, if present, usually occurs at the T4 site, according to the
substitution Na+ + Be2+ → Al3+. This substitution leads to a decrease of the mean T4-O
distance (Tab. 4) as observed by Armbruster (1986). On the other hand, substitution of Mg
for Fe leads to shortening of the T4-O distance (Malcherek et al. 2001). Figure 3 shows the
T4-O distances from various refinements in the literature as a function of XMg (Fig. 3a) and Be
at the T4 site (wt%) (Fig. 3b); samples with more than 1% Be at the T4 site (corresponding to
~ 0.02 apfu) are represented by circles. As we may observe from Figure 3a, samples with
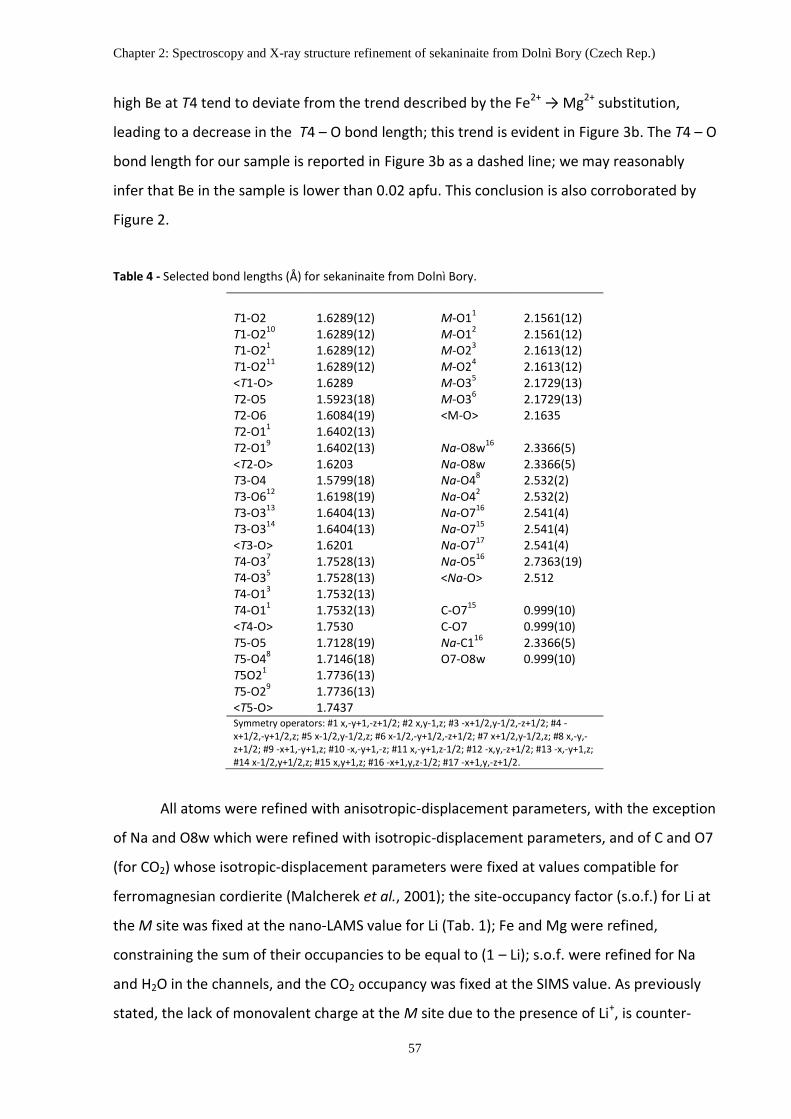
Chapter 2: Spectroscopy and X-ray structure refinement of sekaninaite from Dolnì Bory (Czech Rep.)
57
high Be at T4 tend to deviate from the trend described by the Fe2+ → Mg2+ substitution,
leading to a decrease in the T4 – O bond length; this trend is evident in Figure 3b. The T4 – O
bond length for our sample is reported in Figure 3b as a dashed line; we may reasonably
infer that Be in the sample is lower than 0.02 apfu. This conclusion is also corroborated by
Figure 2.
Table 4 - Selected bond lengths (Å) for sekaninaite from Dolnì Bory.
T1-O2 1.6289(12) M-O1
1 2.1561(12)
T1-O210
1.6289(12) M-O12
2.1561(12) T1-O2
1 1.6289(12) M-O2
3 2.1613(12)
T1-O211
1.6289(12) M-O24
2.1613(12) <T1-O> 1.6289 M-O3
5 2.1729(13)
T2-O5 1.5923(18) M-O36
2.1729(13) T2-O6 1.6084(19) <M-O> 2.1635 T2-O1
1 1.6402(13)
T2-O19
1.6402(13) Na-O8w16
2.3366(5) <T2-O> 1.6203 Na-O8w 2.3366(5) T3-O4 1.5799(18) Na-O4
8 2.532(2)
T3-O612
1.6198(19) Na-O42
2.532(2) T3-O3
13 1.6404(13) Na-O7
16 2.541(4)
T3-O314
1.6404(13) Na-O715
2.541(4) <T3-O> 1.6201 Na-O7
17 2.541(4)
T4-O37
1.7528(13) Na-O516
2.7363(19) T4-O3
5 1.7528(13) <Na-O> 2.512
T4-O13
1.7532(13) T4-O1
1 1.7532(13) C-O7
15 0.999(10)
<T4-O> 1.7530 C-O7 0.999(10) T5-O5 1.7128(19) Na-C1
16 2.3366(5)
T5-O48
1.7146(18) O7-O8w 0.999(10) T5O2
1 1.7736(13)
T5-O29
1.7736(13) <T5-O> 1.7437 Symmetry operators: #1 x,-y+1,-z+1/2; #2 x,y-1,z; #3 -x+1/2,y-1/2,-z+1/2; #4 -x+1/2,-y+1/2,z; #5 x-1/2,y-1/2,z; #6 x-1/2,-y+1/2,-z+1/2; #7 x+1/2,y-1/2,z; #8 x,-y,-z+1/2; #9 -x+1,-y+1,z; #10 -x,-y+1,-z; #11 x,-y+1,z-1/2; #12 -x,y,-z+1/2; #13 -x,-y+1,z; #14 x-1/2,y+1/2,z; #15 x,y+1,z; #16 -x+1,y,z-1/2; #17 -x+1,y,-z+1/2.
All atoms were refined with anisotropic-displacement parameters, with the exception
of Na and O8w which were refined with isotropic-displacement parameters, and of C and O7
(for CO2) whose isotropic-displacement parameters were fixed at values compatible for
ferromagnesian cordierite (Malcherek et al., 2001); the site-occupancy factor (s.o.f.) for Li at
the M site was fixed at the nano-LAMS value for Li (Tab. 1); Fe and Mg were refined,
constraining the sum of their occupancies to be equal to (1 – Li); s.o.f. were refined for Na
and H2O in the channels, and the CO2 occupancy was fixed at the SIMS value. As previously
stated, the lack of monovalent charge at the M site due to the presence of Li+, is counter-

Chapter 2: Spectroscopy and X-ray structure refinement of sekaninaite from Dolnì Bory (Czech Rep.)
58
balanced by the presence of Na+ in the channel; H atoms of the H2O group could not be
detected due to the low concentration of H2O in the sample (Tab. 1); Fe s.o.f. value is slightly
over estimated due to the contribute of Mn. Further details of the crystal structure
refinements can be obtained from the Fachinformationszentrum Karlsruhe, 76344
Eggenstein-Leopoldshafen, Germany, (fax: +49 7247-808-666; e-mail: crysdata@fiz-
karlsruhe.de) on quoting the depository number CSD-425930. The list of Fo/Fc data is
available from the author up to one year after the publication has appeared.
Figure 3 - T4-O bond lengths for various cordierite samples vs (a) the magnesium number (XMg) and (b) the % Be at the T4 site. Triangles indicate the samples with % Be in T4 > 1; the star and the dashed line represents our sample. Data from Hochella et al. 1979; Armbruster et al. 1986; Malcherek et al. 2001, Yakubovich et al. 2004.
5. Optical properties
The studied sekaninaite is biaxial negative. The measured 2VX value is 64±2°,
refractive indexes are α = 1.5640(4), β = 1.5740(4) and γ = 1.5784(4). These values are
slightly lower (by 0.004) than those reported by Salkregg and Bloss (1980), probably due to a
higher H2O and Fe contents in the latter.
6. FTIR spectroscopy
The single-crystal unpolarized infrared spectrum of sekaninaite (Fig. 4) can be divided
into two main regions: (I) 3900 – 3300 cm-1 where absorption bands are due to H2O

Chapter 2: Spectroscopy and X-ray structure refinement of sekaninaite from Dolnì Bory (Czech Rep.)
59
stretching modes (Goldman et al., 1977), and (II) 2600 – 2000 cm-1 where absorption bands
are related to the antisymmetric stretching mode of CO2. As shown by Geiger and Kolesov
(2002) and Della Ventura et al. (2009, 2012) for CO2-rich samples, the combination modes of
CO2 are also observed, overlapping with H2O bands in region I. Additional peaks due H2O
modes also occur around 1600 cm-1 (bending) and 5250 cm-1 (combination) (Della Ventura et
al., 2012).
Figure 4 - Single-crystal unpolarized-light infrared spectrum of sekaninaite. The two regions from 3900 to 3300 cm
-1 and from 2600 to 2000 cm
-1 are highlighted. H2O bending mode at 1635 cm
-1, H2O bending first overtone
mode at 3241 cm-1
and H2O combination mode about 5260 cm-1
are arrowed.
The polarized spectra in the 4000 – 3200 cm-1 range are given in Figure 5a (right).
Where the electric vector E is parallel to the crystallographic axis c (E||c), two sharp peaks
are observed, the more intense centered at 3575 cm-1, and the weaker at 3689 cm-1. The
E||b spectrum has a very broad peak at about 3630 cm-1 with a pronounced shoulder at
3575 cm-1. The E||a spectrum shows a broad and very weak multi-component absorption
with maxima at 3630 cm-1 and 3595 cm-1.

Chapter 2: Spectroscopy and X-ray structure refinement of sekaninaite from Dolnì Bory (Czech Rep.)
60
Figure 5a - Single-crystal polarized-light infrared spectra of sekaninaite in the ranges 5300-5200 cm-1
(left) and 4000-3200 cm
-1 (right). Spectra were collected on (010) 43 µm thick and (100) 47 µm thick oriented slabs.
Figure 5b - Single-crystal polarized-light infrared spectra of sekaninaite in the CO2 antisymmetric stretching mode region (left) and H2O
[II] bending mode (right). Spectra were collected on the same slabs of Fig. 3b except
for the E ||b spectrum, which was collected from a (001) 168 µm thick slab.
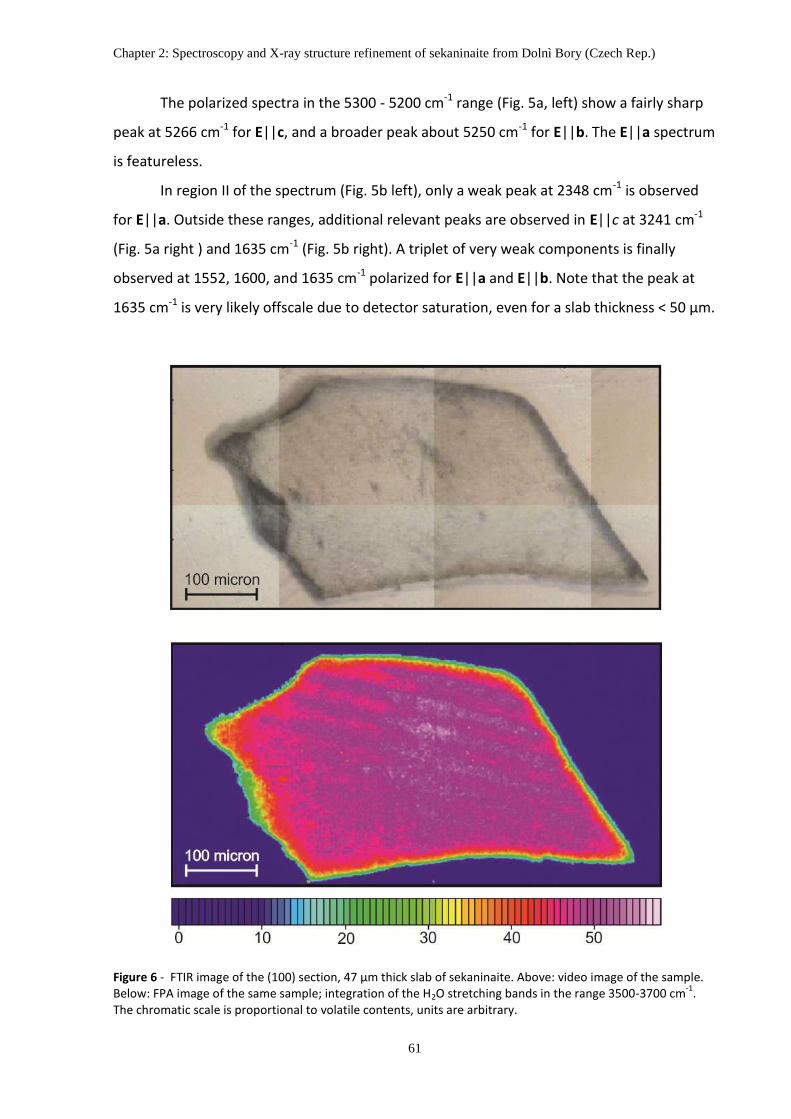
Chapter 2: Spectroscopy and X-ray structure refinement of sekaninaite from Dolnì Bory (Czech Rep.)
61
The polarized spectra in the 5300 - 5200 cm-1 range (Fig. 5a, left) show a fairly sharp
peak at 5266 cm-1 for E||c, and a broader peak about 5250 cm-1 for E||b. The E||a spectrum
is featureless.
In region II of the spectrum (Fig. 5b left), only a weak peak at 2348 cm-1 is observed
for E||a. Outside these ranges, additional relevant peaks are observed in E||c at 3241 cm-1
(Fig. 5a right ) and 1635 cm-1 (Fig. 5b right). A triplet of very weak components is finally
observed at 1552, 1600, and 1635 cm-1 polarized for E||a and E||b. Note that the peak at
1635 cm-1 is very likely offscale due to detector saturation, even for a slab thickness < 50 μm.
Figure 6 - FTIR image of the (100) section, 47 µm thick slab of sekaninaite. Above: video image of the sample. Below: FPA image of the same sample; integration of the H2O stretching bands in the range 3500-3700 cm
-1.
The chromatic scale is proportional to volatile contents, units are arbitrary.

Chapter 2: Spectroscopy and X-ray structure refinement of sekaninaite from Dolnì Bory (Czech Rep.)
62
FPA images of selected sample areas were collected to check for possible
inhomogeneity in the volatile distribution across the studied crystals (Della Ventura et al.,
2012). Figure 6 shows that there is no significant variation in the H2O contents for the whole
sample. Imaging of CO2 distribution was not possible because the CO2 anti-symmetric
stretching peak could not be distinguished from the noise in the FPA data due to the low
concentration of CO2. However CO2 homogeneity was checked by collecting several random
spots on the slab, and the results always gave the same value within esd.
7. FTIR band assignment
Although there are several spectroscopic (FTIR + Raman) works on the channel
volatile constituents of Mg-rich cordierite in the literature (Goldman et al., 1977, Geiger and
Kolesov, 2002, Della Ventura et al., 2009, 2012), polarized data for Fe-rich cordierite are rare
(Kolesov and Geiger, 2000). According to these works, it is now well-established that extra-
framework H2O groups occur in the structural channels of cordierite with the molecular
plane parallel to (100). However, H2O can be oriented in two different ways: type I H2O
(hereafter H2O[I]) has its H–H vector oriented parallel to the c axis, and type II H2O (H2O[II])
has its H–H vector parallel to the b axis. H2O groups of the latter type are bonded to locally
associated channel Na cations as in beryl (Hawthorne and Černý, 1977, Sherriff et al., 1991).
The linear CO2 molecules are oriented parallel to the crystallographic a axis (Khomenko and
Langer, 2005, Aines and Rossman, 1984).
The band assignment given below follows the criteria proposed by Goldman et al.
(1977), Geiger and Kolesov (2002) and Della Ventura et al., (2009), based on single-crystal
infrared polarized-light determination on oriented slabs of Mg-rich cordierite. However, as
we will see from the band positions and polarization behavior, these criteria are also suitable
for sekaninaite.
The peak at 3689 cm-1 (Fig. 5a right ), polarized for E||c, is assigned to the anti-
symmetric stretching mode 3 of H2O[I]; the corresponding symmetric stretching mode ( 1) in
Mg-cordierite is observed at 3595 cm-1 (Paukov et al., 2006) and is polarized for E||b. In the
spectra collected for sekaninaite studied here, this component cannot be resolved due to
the very high intensity of the 3630 cm-1 peak (Fig. 5a). The broad band at 3630 cm-1 polarized
in E||b is assigned to the antisymmetric stretching mode 3 of H2O[II]. The corresponding
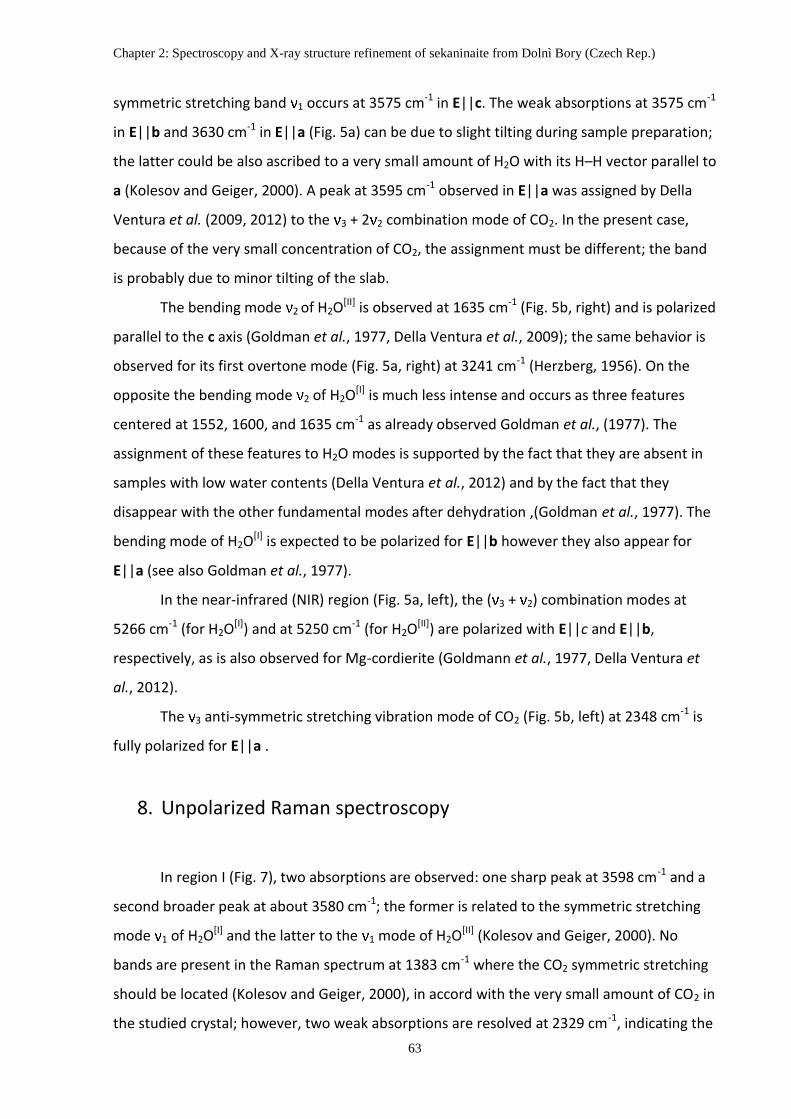
Chapter 2: Spectroscopy and X-ray structure refinement of sekaninaite from Dolnì Bory (Czech Rep.)
63
symmetric stretching band 1 occurs at 3575 cm-1 in E||c. The weak absorptions at 3575 cm-1
in E||b and 3630 cm-1 in E||a (Fig. 5a) can be due to slight tilting during sample preparation;
the latter could be also ascribed to a very small amount of H2O with its H–H vector parallel to
a (Kolesov and Geiger, 2000). A peak at 3595 cm-1 observed in E||a was assigned by Della
Ventura et al. (2009, 2012) to the 3 + 2 2 combination mode of CO2. In the present case,
because of the very small concentration of CO2, the assignment must be different; the band
is probably due to minor tilting of the slab.
The bending mode 2 of H2O[II] is observed at 1635 cm-1 (Fig. 5b, right) and is polarized
parallel to the c axis (Goldman et al., 1977, Della Ventura et al., 2009); the same behavior is
observed for its first overtone mode (Fig. 5a, right) at 3241 cm-1 (Herzberg, 1956). On the
opposite the bending mode 2 of H2O[I] is much less intense and occurs as three features
centered at 1552, 1600, and 1635 cm-1 as already observed Goldman et al., (1977). The
assignment of these features to H2O modes is supported by the fact that they are absent in
samples with low water contents (Della Ventura et al., 2012) and by the fact that they
disappear with the other fundamental modes after dehydration ,(Goldman et al., 1977). The
bending mode of H2O[I] is expected to be polarized for E||b however they also appear for
E||a (see also Goldman et al., 1977).
In the near-infrared (NIR) region (Fig. 5a, left), the ( 3 + 2) combination modes at
5266 cm-1 (for H2O[I]) and at 5250 cm-1 (for H2O[II]) are polarized with E||c and E||b,
respectively, as is also observed for Mg-cordierite (Goldmann et al., 1977, Della Ventura et
al., 2012).
The 3 anti-symmetric stretching vibration mode of CO2 (Fig. 5b, left) at 2348 cm-1 is
fully polarized for E||a .
8. Unpolarized Raman spectroscopy
In region I (Fig. 7), two absorptions are observed: one sharp peak at 3598 cm-1 and a
second broader peak at about 3580 cm-1; the former is related to the symmetric stretching
mode 1 of H2O[I] and the latter to the 1 mode of H2O[II] (Kolesov and Geiger, 2000). No
bands are present in the Raman spectrum at 1383 cm-1 where the CO2 symmetric stretching
should be located (Kolesov and Geiger, 2000), in accord with the very small amount of CO2 in
the studied crystal; however, two weak absorptions are resolved at 2329 cm-1, indicating the

Chapter 2: Spectroscopy and X-ray structure refinement of sekaninaite from Dolnì Bory (Czech Rep.)
64
presence of N2 and at 2916 cm-1, indicating the presence of CH4 (Cesare et al., 2007) in the
sample.
Figure 7 - Background-corrected Raman spectrum of sekaninaite. The symmetric stretching modes for both types of H2O are indicated; intensity in arbitrary units.
9. Calibration of a molar absorption coefficients of H2O and CO2 in
sekaninaite
The Beer-Lambert law, C = A /(t · ε), can be used to quantify H2O and CO2 from
polarized FTIR spectroscopy in cordierite (Della Ventura et al., 2009, 2012). In this relation,
the molar absorption coefficient ε is matrix specific and must be calibrated by combining the
spectroscopic measurements with a second independent analytical method. Rearranging the
above equation, ε = (A · k) / (t · D · C), where C(wt.%) is the concentration of the target
molecule, A is the infrared absorbance, t is the slab thickness in cm, D is the value of the
sample density (g/cm3) and k is a conversion factor needed to convert from wt% to mol·l-1;
for H2O, k = 1.8 (Beran et al., 1993) and for CO2, k = 4.401 (Della Ventura et al., 2009).
C(wt.%) was determined using SIMS, and the absorbance A was calculated as the total
integrated absorbance Ai (cm-1) = Ax + Ay + Az, where Ax, Ay and Az are the integrated
absorptions in each polarization direction (Libowitzky and Rossman, 1996). The peak areas
were obtained for each component using the data calculation routine built in the
spectrometer software; the background was modeled as linear. Using this method, it is
possible to quantify up to a few ppm of H2O or CO2 in the sekaninaite channels, but also
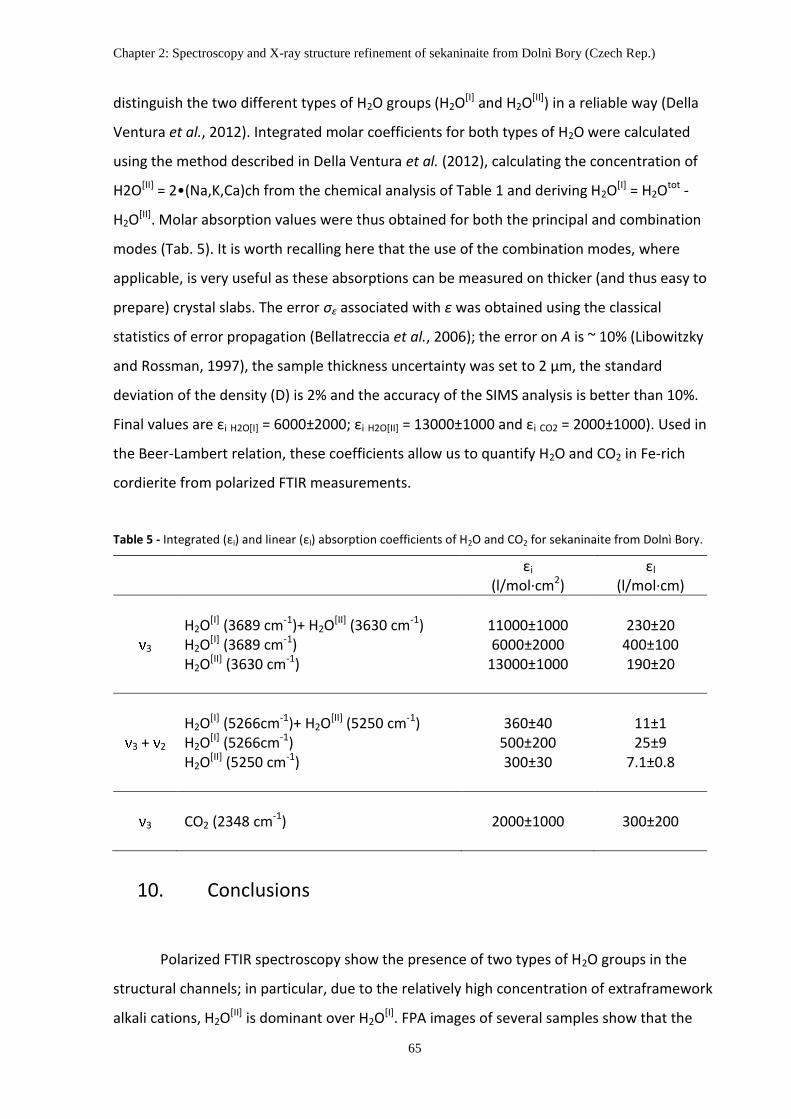
Chapter 2: Spectroscopy and X-ray structure refinement of sekaninaite from Dolnì Bory (Czech Rep.)
65
distinguish the two different types of H2O groups (H2O[I] and H2O[II]) in a reliable way (Della
Ventura et al., 2012). Integrated molar coefficients for both types of H2O were calculated
using the method described in Della Ventura et al. (2012), calculating the concentration of
H2O[II] = 2•(Na,K,Ca)ch from the chemical analysis of Table 1 and deriving H2O[I] = H2Otot -
H2O[II]. Molar absorption values were thus obtained for both the principal and combination
modes (Tab. 5). It is worth recalling here that the use of the combination modes, where
applicable, is very useful as these absorptions can be measured on thicker (and thus easy to
prepare) crystal slabs. The error σε associated with ε was obtained using the classical
statistics of error propagation (Bellatreccia et al., 2006); the error on A is ~ 10% (Libowitzky
and Rossman, 1997), the sample thickness uncertainty was set to 2 µm, the standard
deviation of the density (D) is 2% and the accuracy of the SIMS analysis is better than 10%.
Final values are εi H2O[I] = 6000±2000; εi H2O[II] = 13000±1000 and εi CO2 = 2000±1000). Used in
the Beer-Lambert relation, these coefficients allow us to quantify H2O and CO2 in Fe-rich
cordierite from polarized FTIR measurements.
Table 5 - Integrated (εi) and linear (εl) absorption coefficients of H2O and CO2 for sekaninaite from Dolnì Bory.
εi
(l/mol·cm2) εl
(l/mol·cm)
3
H2O[I] (3689 cm-1)+ H2O[II] (3630 cm-1) 11000±1000 230±20 H2O[I] (3689 cm-1) 6000±2000 400±100 H2O[II] (3630 cm-1) 13000±1000 190±20
3 + 2
H2O[I] (5266cm-1)+ H2O[II] (5250 cm-1) 360±40 11±1 H2O[I] (5266cm-1) 500±200 25±9 H2O[II] (5250 cm-1) 300±30 7.1±0.8
3 CO2 (2348 cm-1) 2000±1000 300±200
10. Conclusions
Polarized FTIR spectroscopy show the presence of two types of H2O groups in the
structural channels; in particular, due to the relatively high concentration of extraframework
alkali cations, H2O[II] is dominant over H2O[I]. FPA images of several samples show that the

Chapter 2: Spectroscopy and X-ray structure refinement of sekaninaite from Dolnì Bory (Czech Rep.)
66
sample from Dolnì Bory has an homogeneous H2O distribution, unlike most cordierites
where many different factors such as fractures, inclusions and secondary alteration may
cause very strong inhomogeneity in H2O concentration across a crystal (Della Ventura et al.,
2012). Sekaninaite from Dolnì Bory contains small amounts of CO2 and, as shown by Raman
spectra, trace amounts of N2 and CH4.
The integrated molar absorption coefficients ε for H2O are very close to those
reported for Mg-rich cordierite by Della Ventura et al. (2012). On the other hand, the values
i CO2 obtained here cannot be considered very reliable because of the uncertainty of the
SIMS value (which is more than the 50%). However, this value is close to that obtained by
Della Ventura et al. (2006) from a CO2-poor cordierite. This suggests that the molar
coefficient of CO2 may be dependent on bulk concentration; however, this point needs
additional experimental evidence for absolute confirmation.
Acknowledgements
We thank Mr. Renato Pagano for providing the studied sample, Vincenzo Mangione for the help with
the optical profilometer, Giuseppe Chita (IC-CNR, Bari) for X-ray data collection and Simon Harley (University of
Edinburgh) for providing the SIMS data for H and C.
Chapter 3: HT-FTIR micro-spectroscopy of cordierite I: the CO2 absorbance as a function of T from in situ and
quenched experiments
67
CHAPTER 3
HT-FTIR MICRO-SPECTROSCOPY OF CORDIERITE.
I: THE CO2 ABSORBANCE AS A FUNCTION OF T FROM IN SITU AND
QUENCHED EXPERIMENTS
Abstract
In this work we address the evolution of the intensity of the CO2 bands in cordierite,
by comparing data obtained from in situ vs. quenching measurements. A natural well
characterized cordierite from Kragero (Arendal region, Norway) was studied up to 1200 °C
using a heating stage fitted on a FTIR microscope. Two different oriented sections (001) and
(010), respectively, were examined in order to check the effect of the channel orientation on
the CO2 release from the matrix. Spectra collected in-situ show that increasing temperatures
induces an increase of peak width for all CO2-related bands. The effects on the integrated
absorbance Ai are different for the different bands. Most notably, the integrated intensity Ai
of the anti-symmetric stretching mode (3) increase up to 800 °C, then progressively
decreases to 1000/1200°C, depending on the orientation of the channels respect to the slab
surface. Data obtained on quenched sample reveals that there is no variation in the band
intensity for T < 900 °C. Because CO2 is not expected to change its molecular configuration
during heating, the absorbance increase during in situ measurements may be related to an
increase in the molar absorption coefficient ε.

Chapter 3: HT-FTIR micro-spectroscopy of cordierite I: the CO2 absorbance as a function of T from in situ and
quenched experiments
68
Combined In situ and quenched FTIR data revealed that the CO2 loss from the
cordierite matrix starts around 800 °C and is strongly dependent to the thickness and shape
of the examined samples. In more details, it is favored for small and tabular shaped grains;
while for large and prismatic shaped grains the volatile loss is greatly reduced. Fracturing
along direction normal to [001] direction multiplies the diffusion interfaces and enhances
the CO2 loss.
1. Introduction
Microporous minerals are important materials from both a geological and a
technological point of view because their structure may permanently host or exchange,
under certain circumstances, both useful or hazardous molecular species (Ferraris and
Merlino, 2005). Changes in the environmental conditions, such as temperature, pressure
fH2O, fCO2 or fO2, may deeply affect both the structural parameters of the matrix and the
stability of trapped molecules. In this context, cordierite plays a key role since it represents
the only case of a relatively common microporous mineral able to trap significant amounts
of molecular H2O and CO2 (Armbruster and Bloss, 1982) under extreme geological
conditions, spanning from the amphibolite facies to ultra-high temperature metamorphism
to crustal anatexis (Vry et al., 1990). The analysis of volatiles in cordierite can be a very
useful tool to define the composition of coexisting fluids during its formation and/or
subsequent metasomatism and alteration, thus a deeper knowledge of their diffusion
mechanism through the structure is crucial in petrologic studies (Carrington and Harley,
1996). Moreover, a better definition of the ability of cordierite to exchange molecules with
coexisting fluids may have implications for technological applications in environmental
studies, such as in CO2 sequestration processes.
Cordierite, with an ideal crystal-chemical formula (Mg,Fe)2Al4Si5O18·nH2O,mCO2, can
be regarded as a framework silicate (Gibbs, 1966) whose structure consists of 6-fold pseudo-
hexagonal Si/Al tetrahedral rings stacked perpendicular the c-crystallogaphic axis. These ring
are held together vertically by tetrahedral Si/Al chain (Gibbs, 1966, Yakubovich et al., 2004).
The resulting structure has a very low thermal expansion coefficient (Hocella and Brown,
1986; Bruno and Vogel, 2008) and, because of this, cordierite has important applications in
ceramic industry. Mg end-member compositions shows no polymorphic changes up to about

Chapter 3: HT-FTIR micro-spectroscopy of cordierite I: the CO2 absorbance as a function of T from in situ and
quenched experiments
69
1400° C; for higher T, cordierite reverts to the hexagonal form indialite (Kitamura and Hiroi,
1982) by a first-order displacive transition. The framework arrangement creates a series of
interconnected cages or channels, running along the c crystallographic axis; inside these
channels alkali cations and/or volatile molecules, notably CO2 and H2O, are typically allotted
(Gibbs, 1966, Goldmann et al., 1977, Della Ventura et al., 2010, 2012). Based on polarized-
light infrared spectroscopy, previous authors showed that the linear CO2 molecule is
oriented orthogonally to the c crystallographic axis and parallel to the a axis (Armbruster and
Bloss, 1982). H2O molecules may occur in two different orientations, i.e. with their H-H
direction parallel to the c axis (type I water, H2O[I]) or parallel to the b axis (type II water,
H2O[II]) (Wood and Nassau, 1968, Goldmann et al., 1977), the latter type being associated to
alkali cations inside the structural channels (Della Ventura et al., 2012).
Several studies pointed out that the content of volatile constituents within the
cordierite channels is strongly dependent on the composition of coexisting fluids during
crystal growth (Vry et al., 1990; Carrington and Harley, 1996; Harley et al.,2002; Kurepin,
2010), thus making this mineral an important tool to model the geological process of
formation; in addition, H2O and CO2 contents may also affect the stability of cordierite itself
(Schreyer 1985; Carey 1995; Harley et al., 2002). Therefore the qualitative evaluation of
kinetic behavior of channel constituents is crucial in petrologic studies. Several authors in
the past have examined the thermodynamic properties of cordierite during dehydration
(Giampaolo and Putnis, 1989; Carey, 1993; Carey, 1995; Paukov et al., 2007; Dachs and
Geiger, 2008), however no data are known so far for the possible processes of CO2
desorption, i.e. the extraction of CO2 from the structure as a function of T.
In this context, micro FTIR spectroscopy not only may provide quantitative information on
the behavior of H and C during heat treatments, but may be a valuable tool to study the
kinetics of the process, as it has been proven to be the case in a wide variety of minerals like
sulfates (Putnis et al., 1990, Carbone et al., 2008), zeolites (Bish and Carey, 2001), and micas
(Tokiwai and Nakashima, 2010a).
Quantitative FTIR spectroscopy is based on the Beer-Lambert relationship which, in
its simplified form, is: A = ε·t·C. This equation relates the absorbance of a molecule (A) in the
FTIR transmission spectra to its concentration (C) in a sample of thickness (t) via a constant
known as the molar absorption coefficient, ε. The absorption coefficient is matrix dependent
(Libowitzky and Rossman, 1996) and must be calibrated for any mineral and type of bands
Chapter 3: HT-FTIR micro-spectroscopy of cordierite I: the CO2 absorbance as a function of T from in situ and
quenched experiments
70
or, alternatively, evaluated using empirical curves (Paterson, 1982, Libowitzky and Rossman,
1996). However, several authors (e.g. Keppler and Bagdassorov, 1993; Yamagishi et al.,
1997; Zhang et al., 2007; Tokiwai and Nakashima, 2010b) revised recently the absorbance
changes in minerals and glasses during HT-FTIR experiments and showed that the absorption
coefficients measured during in situ data collection change with T. In addition, Zhang et al.
(2007) observed recently that, in a variety of minerals, in situ absorbance trends of the same
molecular species obtained using HT-FTIR spectroscopy may differ for the different modes
(i.e. stretching vs bending or multiphonon bands). The implication of these studies is that
one cannot extract quantitative information from in situ HT-FTIR spectra without an accurate
preliminary study of the absorbance variation with temperature (Tokiwai and Nakashima,
2010b). In fact, the reason for the change in the molar absorption coefficient ε as a function
of T is still not completely understood.
Although the behavior of H2O has attracted significant attention, no studies have so
far addressed this problem for CO2 although carbon dioxide is an important constituent of
silicate melts (Watson et al., 1982; Watson, 1991; Behrens et al., 2009), and minerals such as
beryl (e.g. Wood and Nassau, 1968), cordierite (e.g. Khomenko and Langer, 2005, Della
Ventura et al., 2012), feldspathoids (Della Ventura et al., 2006, 2008, Bellatreccia et al.,
2009) or various forms of silica (Kolesov and Geiger, 2003). In this work we address the
behavior of carbon dioxide absorption in the MIR range for cordierite as a function of
temperature and sample orientation. We address in particular the temperature dependence
of the CO2 bands by comparing the intensities obtained during in situ and quenching
experiments, to investigate the effects of temperature on the molar absorption coefficient ε.
2. Studied samples
Clear and inclusion-free fragments, with a pale blue-violet color were extracted from
a large crystal of cordierite Rp 3237 from Kragero (Arendal region, Norway). Chemical
composition, crystal-chemical formula, cell parameters, density and optical properties of this
sample are given in Della Ventura et. al. (2012); for sake of simplicity, a summary of data is
reported in Table 1; full explanation of the analytical methods can be found in Della Ventura
et. al. (2012). This sample was chosen because it is very poor in Fe and has an octahedral
composition very close to that of a Mg-end member (Tab. 1).

Chapter 3: HT-FTIR micro-spectroscopy of cordierite I: the CO2 absorbance as a function of T from in situ and
quenched experiments
71
Table 1 - Microchemical analysis, crystal-chemical formula, cell parameters, density and optical properties for cordierite RP 3237. Data from Della Ventura et. al. (2012). Crystal-chemical formula based on 18 oxygen atoms p.f.u.
oxides (wt.%) St. Dev. formula
SiO2 49.55 0.19 Si 5.01
Al2O3 33.01 0.10 Al 3.94
MgO 12.49 0.12 Σ Tetrahedra 8.95
FeO 1.86 0.14 Mg 1.88
TiO2 0.00 0.00 Fe 0.16
MnO 0.02 0.02 Ti 0.00
CaO 0.00 0.00 Mn 0.00
Na2O 0.24 0.03 Σ Octahedra 2.00
K2O 0.00 0.01 Ca 0.00
H2O 0.904 0.04 Na 0.05
CO2 1.005 0.01 K 0.00
Total 99.06 Σ Channels 0.05
n(H2O) 0.31
m(CO2) 0.14
Σ Volatiles 0.45
**H2O[II] 0.10
**H2O[I] 0.21
XcrdCO2 0.31
Cell parameters (Å)
a 17.085
(2)
b 9.721 (1)
c 9.353 (1)
Densitiy (g/cm3) 2.58 (3)
Optic sign Positive
2Vx (°) 90.3 (9)
The H2O and CO2 contents were quantified by SIMS (secondary-ion-mass-
spectrometry) using a Cameca IMS4f ion microprobe at EMMAC, the University of
Edinburgh. Procedures follow those described in previous cordierite studies from the
Edinburgh laboratory (Harley and Carrington, 2001; Thompson et al., 2001; Harley et al.,
2002, Della Ventura et. al., 2012). The crystal-chemical formula, based on 18 oxygen atoms
pfu is Na0.05(Mg1.89Fe0.16)Al3.97Si5O18·0.31H2O·0.14CO2. Fetot was considered as Fe2+.

Chapter 3: HT-FTIR micro-spectroscopy of cordierite I: the CO2 absorbance as a function of T from in situ and
quenched experiments
72
Preliminary FTIR imaging confirmed an homogeneous distribution of H2O and CO2 across the
sample (Della Ventura et. al., 2012).
Selected crystal fragments were oriented on (001) and (010) using a polarizing
microscope equipped with a spindle-stage; the extinction data were processed using the
program ExcalibrW (Bloss, 1981; Gunter et al., 2005). Crystallographic orientation was based
on the optical orientation a = Z, b = Y and c = X (Deer et al., 2004). The fragments were
transferred from the spindle-stage to glass slides and doubly polished. Table 2 gives the final
thickness together miscellaneous information for both slabs used in this work; sample
thickness was measured using an electronic micrometer with ±5 µm uncertainty and
checked using the interference fringes in the FTIR spectra, using the formula t = 1/[2·n∙(ν1-
ν2)] where t is sample thickness in cm, n = 1.535 is the refractive index and (ν1- ν2) is the
distance between two adjacent fringes in cm-1 (Pistorius and DeGrip, 2006).
Table 2 – Miscellaneous data for the studied sections.
label Thickness (µm) Approximate lateral dimensions (µm)
Crystallographic orientation
Optical directions on plane
RP 3237_11 77 300 x 250 (001) Y Z
RP 3237_14 39 500 x 250 (010) X Z
3. Experimental methods
HT-FTIR measurements up to 1200 °C were performed using a Linkam TS 1400 XY
heating stage. The cordierite slabs were oriented on the horizontal plane using a polarizing
microscope and then carefully transferred on a quartz sample holder, which allows good
transparency for the MIR domain down to 2070 cm-1. The sample holder was inserted into a
17 mm ceramic crucible for the heating runs. Temperature was measured using a type S Pt-
10% Rh/Pt thermocouple placed close to the sample; the accuracy was ±1°C according to the
manufacturer. Heating ramps were set using a digital controller.
HT-FTIR spectra were acquired using a Bruker™ Hyperion 3000 microscope equipped
with a KBr-broadband beamsplitter, a 15 X objective and a liquid nitrogen-cooled MCT
detector at Laboratori Nazionali di Frascati-Istituto Nazionale di Fisica Nucleare (LNF-INFN,
Frascati, Rome). The nominal resolution was set at 4 cm-1 and 128 scans were averaged for

Chapter 3: HT-FTIR micro-spectroscopy of cordierite I: the CO2 absorbance as a function of T from in situ and
quenched experiments
73
both spectrum and background, for a total collecting time of about 30 seconds. FTIR images
were collected using a 64 x 64 pixel focal-plane array (FPA); the nominal resolution was set
at 4 cm−1 and 64 scans were averaged for each spectrum and background. With this set up
each image covers an area of 170 µm x 170 µm with a nominal spatial resolution of ~5 µm
(Della Ventura et al., 2010, 2014).
Two different types of step-heating measurement were performed. In the first series
of experiments, the (001) section was heated up to 1000 °C with a rate of 20 °C/min; FTIR
spectra were collected for every step. At the end of the run, the sample was allowed to cool
down to RT and a spectrum was measured, than was heated up to 1100 °C (rate 100 °C/min)
and then cooled down again at RT; spectra were collected at 1100 °C and at RT. Background
spectra were collected at the beginning of the experiment and at RT. The second series of
experiments was performed heating up the (010) section with a rate of 100 °C/min up to 600
°C; measurements were performed every 100°C during the ramp. Then the sample was
cooled down to RT and heated up again up to 600 °C with a rate of 100 °C/min. The same
procedure was repeated at 800, 900, 1000, 1100 and 1200 °C. FTIR spectra were collected at
RT and every 50 °C during the ramp. In any case, cooling rates were about 200°C/minute
down to 200 °C, additional 5 minutes were necessary to cool down from 200 °C to RT.
Background spectra were collected before each measurement. After each experiment FPA-
FTIR images were collected in order to check the homogeneity of residual CO2 distribution.
We stress that all FTIR spectra on each slab were collected in the same point. A relatively
large spot size (150 µm) was preferred in order to obtain a better average of the CO2
content. Indeed, as we will see later, major variations may in fact occur at a smaller scale.
4. FTIR spectra of the studied cordierite sections: preliminary
considerations on the H2O and CO2 bands
Figure 2 compares the unpolarized-light FTIR spectra of cordierite Rp 3237 collected for
both (001) and (010) sections; spectra are scaled to thickness (for peak assignment refer to
Tab. 3). Notably, even under unpolarized light, the spectra are significantly different, and
partly reflect the polarizing behavior of the respective orientations. For instance, the (001)

Chapter 3: HT-FTIR micro-spectroscopy of cordierite I: the CO2 absorbance as a function of T from in situ and
quenched experiments
74
spectrum contains all absorption that are expected to be most intense for E//a and E//b,
while absorptions that are expected to be strongly polarized per E//c, i.e. the ν3 mode of
H2O[I] at 3689 cm-1 (e.g. Della Ventura et al., 2010) are very weak. Moreover in the (010)
section, the librational bands of CO2 at 2391 and 2306 cm-1, which are expected to be
polarized for E//b (Tab. 3), are completely absent.
Figure 2 – Unpolarized light RT FTIR spectra of cordierite Rp 3237; top (001) section, and bottom (010) section. H2O and CO2 peak positions are reported (for peak assignment see Tab. 3); spectra scaled to thickness. A schematic representation of the channel orientation for each slab is reported.
These two sections were chosen such as to check for the effect of the channel
orientation on the CO2 release from the matrix; as a matter of fact, as schematically shown
in Figure 2, the preferential escape path for the evolving gas, which is expected parallel to
the structural channels (Fukuda and Shinoda, 2011) is oriented on the shorter (001) or
longer (010) dimension of the sample, respectively.
Assignment of the several bands present on the spectra of cordierite can be based on
a large number of unpolarized and polarized-light FTIR studies, see in particular Geiger and
Kolesov (2002), Khomenko and Langer (2005), Della Ventura et al. (2009, 2012) and Radica et
al. (2013).
To help following the discussion below, Table 3 gives a summary of the most relevant
H2O and CO2 absorptions in the MIR (medium infrared) range, and their polarization
directions.

Chapter 3: HT-FTIR micro-spectroscopy of cordierite I: the CO2 absorbance as a function of T from in situ and
quenched experiments
75
Table 3 – Position, assignment and polarization direction of H2O and CO2 bands of cordierite; note that CO2
antisymmetric stretching ν3 mode presents residual absorptions per E//b. For explanations and references see text.
Molecule Mode Peak position (cm-1) Polarization direction
12C16O2 Antisym stretch ν3 2348 E//a Antisym stretch ν3 + lib 2391 E//b Antisym stretch ν3 - lib 2306 E//b combination ν3 + ν1 3708 E//a combination ν3 + 2ν2 3595 E//a 13C16O2 Antisym stretch ν3 2282 E//a 12C16O18O Antisym stretch ν3 2332 E//a H2O[I] bending ν2 1635, 1600, 1560 E//a, E//b sym stretch ν1 3689 E//c Antisymm stretch ν3 3595 E//b H2O[II] bending ν2 1634 E//c sym stretch ν1 3575 E//c Antisym stretch ν3 3630 E//b
5. Experimental Results
5.1 In situ HT-FTIR measurements: the (001) section
Figure 3 shows selected unpolarized-light HT-FTIR spectra collected in situ on the
(001), 77 µm thick, section. In this orientation the structural channels are directed normal to
the sample surface (Fig. 2). At room T, five peaks are observed in the principal CO2 stretching
region (Fig. 3b): three of these are related to the anti-symmetric stretching mode of CO2 and
its isotopes (2348 cm-1: 12C16O2, 2332 cm-1: 12C16O18O, and 2282 cm-1: 13C16O2, Khomenko and
Langer, 2005, Della Ventura et al., 2009) and two are assigned to librational sideband peaks
at 2391 and 2306 cm-1 and are symmetrically sited at ±43 cm-1 from the principal ν3 anti-
symmetric stretching peak at 2348 cm-1. The temperature increase induces a general
broadening of all five bands and an increase in band area (Ai). At higher temperatures the
2391 and 2306 cm-1 bands shift respectively to lower and to higher energies, converging
toward the principal 2348 cm-1 band. At 400 °C we observe a doublet with maxima at 2358
cm-1 and at 2317 cm-1, caused by overlapping of the former 2348-2391 and 2332-2306 cm-1
components. The 2282 cm-1 peak due to the isotope 13C16O2 is still resolved on the lower
frequency side of this broad band. For T > 900 °C there is a sudden decrease in intensity of
the absorption which is virtually zero at 1000°C.
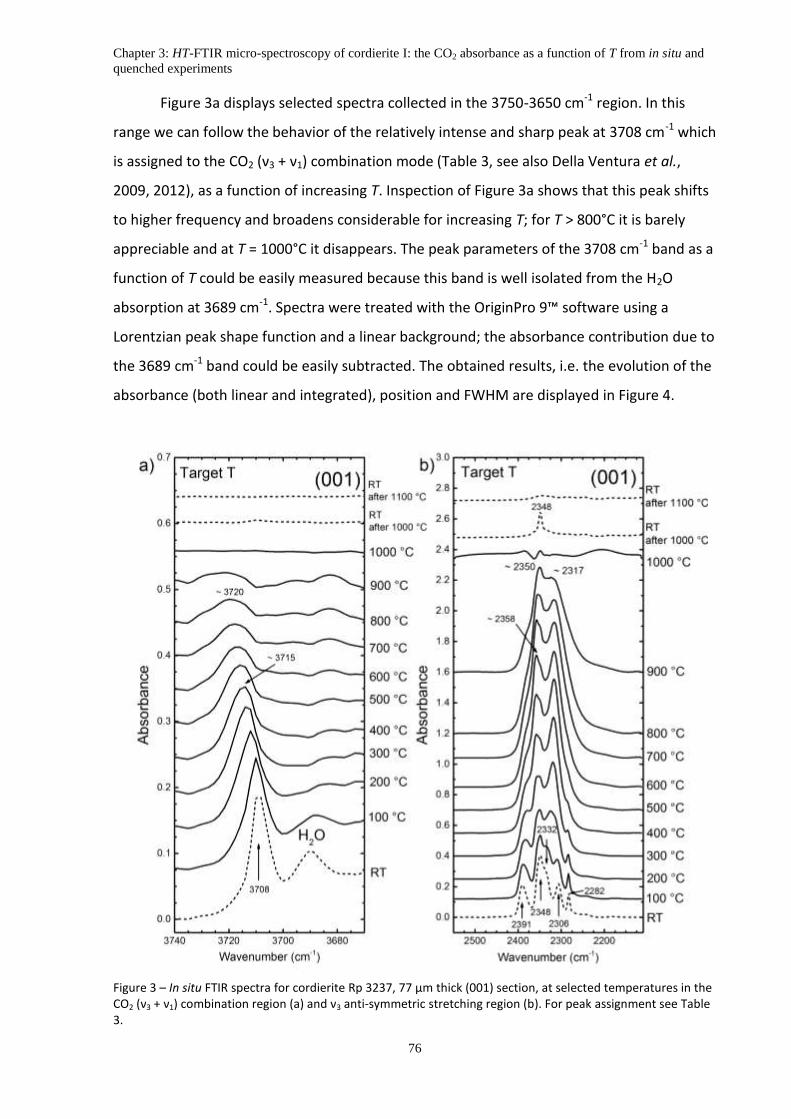
Chapter 3: HT-FTIR micro-spectroscopy of cordierite I: the CO2 absorbance as a function of T from in situ and
quenched experiments
76
Figure 3a displays selected spectra collected in the 3750-3650 cm-1 region. In this
range we can follow the behavior of the relatively intense and sharp peak at 3708 cm-1 which
is assigned to the CO2 (ν3 + ν1) combination mode (Table 3, see also Della Ventura et al.,
2009, 2012), as a function of increasing T. Inspection of Figure 3a shows that this peak shifts
to higher frequency and broadens considerable for increasing T; for T > 800°C it is barely
appreciable and at T = 1000°C it disappears. The peak parameters of the 3708 cm-1 band as a
function of T could be easily measured because this band is well isolated from the H2O
absorption at 3689 cm-1. Spectra were treated with the OriginPro 9™ software using a
Lorentzian peak shape function and a linear background; the absorbance contribution due to
the 3689 cm-1 band could be easily subtracted. The obtained results, i.e. the evolution of the
absorbance (both linear and integrated), position and FWHM are displayed in Figure 4.
Figure 3 – In situ FTIR spectra for cordierite Rp 3237, 77 µm thick (001) section, at selected temperatures in the CO2 (ν3 + ν1) combination region (a) and ν3 anti-symmetric stretching region (b). For peak assignment see Table 3.

Chapter 3: HT-FTIR micro-spectroscopy of cordierite I: the CO2 absorbance as a function of T from in situ and
quenched experiments
77
The integrated absorbance (Ai) (Fig. 4a) is almost constant up to about 450 °C, then
decrease up to 850 °C. For higher T the intensity decreases with a much faster rate; the band
disappears at 950°C. This trend is the result of a decreasing peak height (Fig. 4c) and a
simultaneous increasing peak broadening (Fig 4d): the FWHM in fact increases from 6 cm-1 to
about 18 cm-1 and finally decreases for T > 850°C. The peak position (Fig. 3 and Fig. 4b) shifts
almost linearly to higher energies, from 3708 cm-1 at RT to 3715 cm-1 at 400 °C, up to about
3720 cm-1 at 850 °C. Note that for this section the H2O 3 peak at 3689 cm-1 (Fig. 2, top
curve) is no longer resolved from the background for T > 200 °C because of extreme peak
broadening (Fig. 3a). The evolution of the 3595 cm-1 peak cannot be followed in the
unpolarized spectra because of its very weak intensity. As already stated, at 1000 °C no CO2
bands are observed in the higher frequency range, however, after quenching the sample to
RT (Fig. 3b), a weak CO2 band at 2348 cm-1 shows up, suggesting that at 1000°C weak
amounts of carbon dioxide are still present in the sample. This band definitively disappears
from the spectrum collected on the quenched sample only for T > 1100° C (Fig. 3b top
dashed curves).
Figure 4 – Integrated absorbance (a), peak position (b), peak height (c) and peak FWHM (d) for the 3708 cm-1
CO2 combination mode for cordierite Rp 3237, measured on the (001) oriented section. The dashed line at 850 °C is a guide for the eye and denotes the temperature at which the CO2 band starts to decrease drastically.

Chapter 3: HT-FTIR micro-spectroscopy of cordierite I: the CO2 absorbance as a function of T from in situ and
quenched experiments
78
5.2 In situ HT-FTIR measurements: the (010) section
As expected, trends similar to those described for the (001) section are observed for
the (010) section cut out from the same cordierite crystal (Fig. 5). In the H2O stretching
region (Fig. 5 left) the 3708 cm-1 combination mode of CO2 decreases in intensity, broadens
and shifts to higher frequency, up to 3717 cm-1 at 900°C. The 3595 cm-1 CO2 combination
mode, which has a weak intensity and is strongly overlapped with the H2O bands may be
resolved exclusively at the lower temperatures (Fig. 2, lower curve).
Figure 5 – Selected unpolarized light in situ HT-FTIR spectra collected on the (010) section of cordierite Rp 3237 in the CO2 ν3 + ν1 combination region (a) and CO2 stretching region (b). Note that interference fringes are present in the spectra of the CO2 stretching region. For peak assignment see Table 3 and text.
A linear intensity decrease and peak broadening are also observed for the type II H2O
band at 3689 cm-1 (ν3) and 3575 cm-1 (ν1) however in this case both peaks shift to lower

Chapter 3: HT-FTIR micro-spectroscopy of cordierite I: the CO2 absorbance as a function of T from in situ and
quenched experiments
79
frequencies (Fig. 5a). Because the CO2 stretching region for this section is much better
resolved due to the absence in the spectra of the librational modes (see above), the peak
parameters (intensity, position and FWHM) of the principal 2348 cm-1 band (Fig. 5b) could be
easily obtained and monitored as a function of T, using the data calculation routine built in
the spectrometer software. Figure 6 shows that the integrated absorbance (Ai) of the 2348
cm-1 peak increases up to 850 °C (Fig. 6a) as a result of the simultaneous and significant
linear increase of the peak FWHM (Fig. 6d); on the other side, the peak height is constant up
to 900 °C (Fig. 6c). For T > 850 °C all parameters show a sudden drop (Fig. 6). The peak
position does not show any clear behavior; around 400 °C the tip of the peak flattens (Fig. 5)
and the peak position cannot be properly measured (Fig. 6b). The CO2 absorptions
disappears completely at 1200 °C.
Figure 6 – Integrated absorbance (a), peak position (b), peak height (c) and peak FWHM (d) for the 2348 cm-1
CO2 anti-symmetric stretching mode collected on the (010) section for cordierite Rp 3237. The dashed line at 850 °C is a guide for the eye and denotes the temperature at which the CO2 band starts to vanish drastically.

Chapter 3: HT-FTIR micro-spectroscopy of cordierite I: the CO2 absorbance as a function of T from in situ and
quenched experiments
80
5.3 Measurements at RT on quenched samples
Figure 7–FTIR spectra of cordierite Rp 3237, (010) section, collected at RT after heating the sample at the target temperature, in the CO2 ν3 + ν1 combination region (a) and CO2 stretching region (b), respectively. Interference fringes are observed for of the CO2 stretching region. For peak assignment see Table 3 and text.
The FTIR spectra collected on the same sections after quenching the sample reveal a
totally different situation from that described above. In Figure 7 the FTIR spectra collected
on the (010) section in the same spectral range displayed in Figure 5 are displayed.
Comparison on these Figures reveals that (1) no band shift or band broadening are retained
after cooling the sample at RT; (2) the intensity of the CO2 bands is constant up to 900°C,
and, more importantly (3) some CO2 (as it is well visible in the 2500-2400 cm-1 region) is still
present in the sample heated up to 1200 °C (Fig. 7b). A point to note is that the CO2 peak
measured at RT after the sample has been heated a T > 900°C is sharper that the same peak
measure on the untreated crystal. In fact, a closer inspection of the spectra suggests that, for
T > 900°C, a second component at lower frequency, which is unresolved at RT, preferentially
disappears. This point is presently still not completely understood; one reasonable
hypothesis is that at higher concentrations, the CO2 molecules interact to give (at least) two
different local coordination environments, characterized by a slightly different vibrational
frequency. For lower CO2 concentrations, at T > 900°C, this interaction is removed, and only
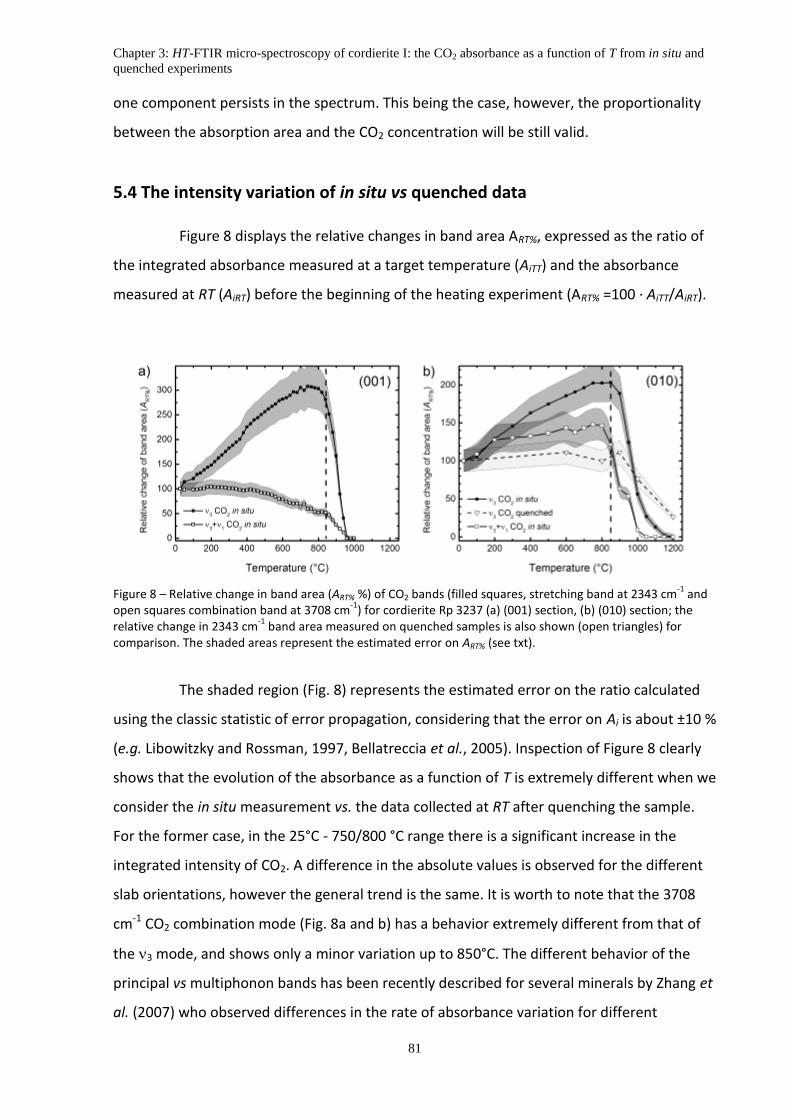
Chapter 3: HT-FTIR micro-spectroscopy of cordierite I: the CO2 absorbance as a function of T from in situ and
quenched experiments
81
one component persists in the spectrum. This being the case, however, the proportionality
between the absorption area and the CO2 concentration will be still valid.
5.4 The intensity variation of in situ vs quenched data
Figure 8 displays the relative changes in band area ART%, expressed as the ratio of
the integrated absorbance measured at a target temperature (AiTT) and the absorbance
measured at RT (AiRT) before the beginning of the heating experiment (ART% =100 · AiTT/AiRT).
Figure 8 – Relative change in band area (ART% %) of CO2 bands (filled squares, stretching band at 2343 cm-1
and open squares combination band at 3708 cm
-1) for cordierite Rp 3237 (a) (001) section, (b) (010) section; the
relative change in 2343 cm-1
band area measured on quenched samples is also shown (open triangles) for comparison. The shaded areas represent the estimated error on ART% (see txt).
The shaded region (Fig. 8) represents the estimated error on the ratio calculated
using the classic statistic of error propagation, considering that the error on Ai is about ±10 %
(e.g. Libowitzky and Rossman, 1997, Bellatreccia et al., 2005). Inspection of Figure 8 clearly
shows that the evolution of the absorbance as a function of T is extremely different when we
consider the in situ measurement vs. the data collected at RT after quenching the sample.
For the former case, in the 25°C - 750/800 °C range there is a significant increase in the
integrated intensity of CO2. A difference in the absolute values is observed for the different
slab orientations, however the general trend is the same. It is worth to note that the 3708
cm-1 CO2 combination mode (Fig. 8a and b) has a behavior extremely different from that of
the 3 mode, and shows only a minor variation up to 850°C. The different behavior of the
principal vs multiphonon bands has been recently described for several minerals by Zhang et
al. (2007) who observed differences in the rate of absorbance variation for different
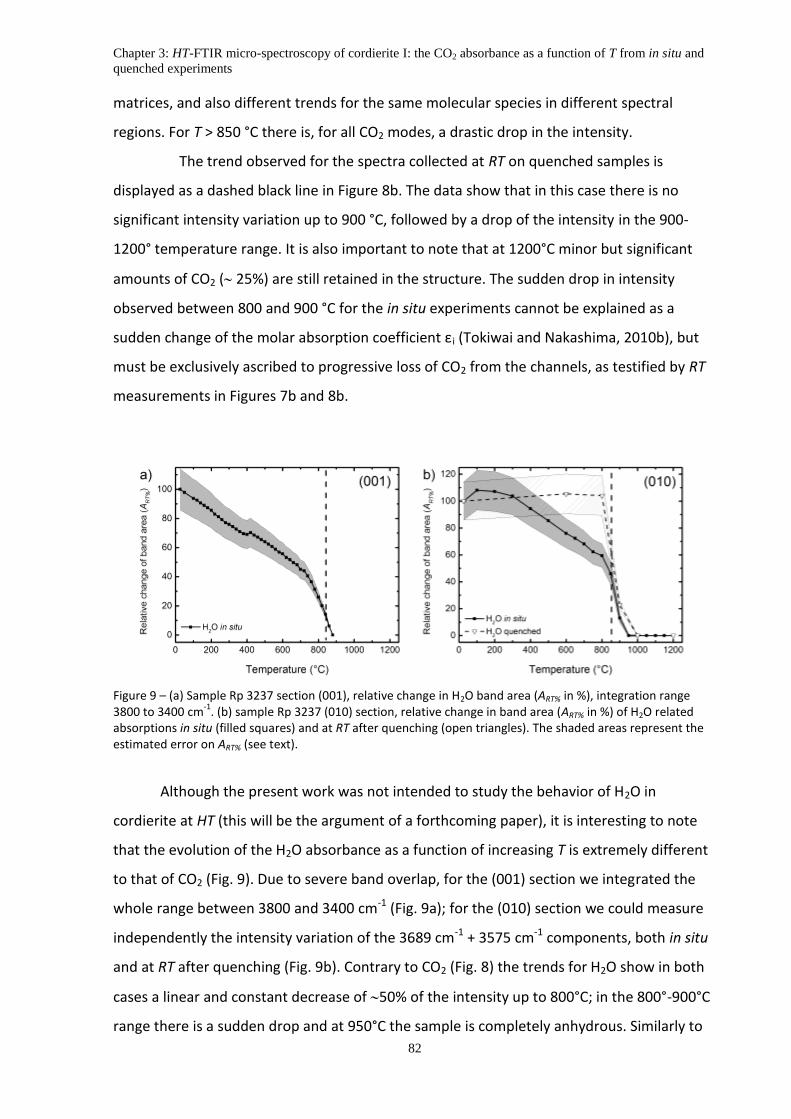
Chapter 3: HT-FTIR micro-spectroscopy of cordierite I: the CO2 absorbance as a function of T from in situ and
quenched experiments
82
matrices, and also different trends for the same molecular species in different spectral
regions. For T > 850 °C there is, for all CO2 modes, a drastic drop in the intensity.
The trend observed for the spectra collected at RT on quenched samples is
displayed as a dashed black line in Figure 8b. The data show that in this case there is no
significant intensity variation up to 900 °C, followed by a drop of the intensity in the 900-
1200° temperature range. It is also important to note that at 1200°C minor but significant
amounts of CO2 ( 25%) are still retained in the structure. The sudden drop in intensity
observed between 800 and 900 °C for the in situ experiments cannot be explained as a
sudden change of the molar absorption coefficient εi (Tokiwai and Nakashima, 2010b), but
must be exclusively ascribed to progressive loss of CO2 from the channels, as testified by RT
measurements in Figures 7b and 8b.
Figure 9 – (a) Sample Rp 3237 section (001), relative change in H2O band area (ART% in %), integration range 3800 to 3400 cm
-1. (b) sample Rp 3237 (010) section, relative change in band area (ART% in %) of H2O related
absorptions in situ (filled squares) and at RT after quenching (open triangles). The shaded areas represent the estimated error on ART% (see text).
Although the present work was not intended to study the behavior of H2O in
cordierite at HT (this will be the argument of a forthcoming paper), it is interesting to note
that the evolution of the H2O absorbance as a function of increasing T is extremely different
to that of CO2 (Fig. 9). Due to severe band overlap, for the (001) section we integrated the
whole range between 3800 and 3400 cm-1 (Fig. 9a); for the (010) section we could measure
independently the intensity variation of the 3689 cm-1 + 3575 cm-1 components, both in situ
and at RT after quenching (Fig. 9b). Contrary to CO2 (Fig. 8) the trends for H2O show in both
cases a linear and constant decrease of 50% of the intensity up to 800°C; in the 800°-900°C
range there is a sudden drop and at 950°C the sample is completely anhydrous. Similarly to

Chapter 3: HT-FTIR micro-spectroscopy of cordierite I: the CO2 absorbance as a function of T from in situ and
quenched experiments
83
what observed for CO2, the data collected on quenched samples show a different scenario:
the integrated H2O absorbance (proportional to the amount of water in the sample) is
constant up to 800°C and suddenly drops in the 800-900°C range. At 1000° the sample is
completely anhydrous.
6. Discussion
6.1 The thermal behavior of CO2 bands
6.1.1 Temperature dependence of peak position and width
Figure 4a shows a significant frequency shift of both ν3 (3689 cm-1) and ν1 (3575 cm-1)
type I H2O peaks of about 15 cm-1; this result is consistent with previous studies and has
been assigned to a temperature dependence of the H2O vibrational constants (Kolesov,
2008; Fukuda and Shinoda, 2008 and 2011). On the other side, no systematic shift with
temperature is observed for the CO2 absorptions at 2348 or 2332 cm-1, from -200 °C
(Khomenko and Langer, 2005) to 1000 °C (this work, Fig. 5b and Fig. 6b). This issue was
studied by Olijnyk et al. (1988) who observed that the principal vibrational modes in solid
CO2 do not show any shift with T, but are strongly influenced by pressure changes (see also
Hanson and Jones, 1981). Our data, however, show a significant shift, from 3708 to 3720 cm-
1, for the (ν3 + ν1) combination mode (Fig. 4 and 5).
We also observed a significant peak broadening of all CO2-related bands upon
heating (Fig. 4 and 6), in particular of the 2332 cm-1 peak which is well resolved only below -
200 °C, where its FWHM is just 5-6 cm-1 (Khomenko and Langer, 2005).
6.1.2 Temperature dependence of integrated absorbance (Ai)
In the introduction we mentioned the change in the molar absorption coefficients ε
with temperature for the OH molecular species, that has been recently addressed by several
authors (Zhang et al., 2007, Fukuda and Shinoda, 2008 and 2011, Tokiwai and Nakashima,
2010b). Tokiwai and Nakashima (2010b), during their in-situ FTIR study on muscovite
dehydration, identified two distinct stages of intensity decrease: at lower temperatures, they
observed a progressive and linear decrease in the Ai; at higher temperatures the Ai decrease

Chapter 3: HT-FTIR micro-spectroscopy of cordierite I: the CO2 absorbance as a function of T from in situ and
quenched experiments
84
was steeper and non-linear. The authors imputed the decrease of Ai at low T exclusively to
the effect of the change of molar absorption coefficient ε with temperature; whereas at high
T there is an effective dehydration of the mineral. A similar trend may be easily recognized
for H2O in cordierite (Fig. 9), where it is possible to distinguish two different trends: 1) a
linear (or quasi-linear) Ai decrease from RT to 700 °C (001 section, Fig. 9a) and 800 °C (010
section Fig. 9b), and 2) a steeper Ai decrease for higher T. Quenched data collected at RT on
the (010) lamella (Fig. 9b dashed line) clearly proves that up to 800 °C there is no loss of H2O
from the sample, while for higher temperatures, the H2O content drops drastically. Based on
the Beer-Lambert relationship given above, assuming negligible change in the sample
thickness across the studied T range, and considering no H2O loss as evidenced by the
quenched measurements, the decreasing trend of Figure 9 for the in situ measurements
must be assigned to a decrease of ε. On the other side, the sudden and fast Ai decrease for T
> 800°C may be imputed to the dehydration process.
Interestingly, a similar but reverse trend may be observed for the integrated
absorbance of the anti-symmetric CO2 stretching mode at low T (Fig. 8). From RT to 700 °C
it is possible to observe a first stage characterized by a strong linear increase of Ai, followed
by an intermediate stage ( 100 °C) with no variation of the integrated absorbance. Then
there is a second stage characterized by a strong decrease of Ai up to 1200 °C. Quenched
data reveal that CO2 loss occurs exclusively above 900 °C. Thus the Ai increase in the first
stage may be imputed exclusively to an increase in the molar absorption coefficient ε with
temperature, while in the second stage the Ai decrease may be imputed exclusively to CO2
loss. Note that during the intermediate stage both effects of ε increase and CO2 loss may be
balanced with the result of no or small Ai variation.
In previous HT-FTIR studies, all done on H2O/OH spectroscopy, a decrease of the
integrated absorbance Ai has been systematically observed (see Prasad et al., 2005,
Bonaccorsi et al., 2007; Zhang et al., 2006, 2007; Tokiwai and Nakashima, 2010, among the
others), whereas for CO2 we obtain a completely opposite trend, i. e. an increase of Ai with
temperature. Such behavior has been so far observed (Zhang et al., 2007) only for the
overtone modes of some phyllosicates, although, as they discussed in their work, multi-
phonon processes cannot be directly compared to single phonon processes.
At present we have no explanation for the odd behavior of CO2 related absorbance
trends, however examination of Figure 8 suggests that: 1) the apparent increase of CO2

Chapter 3: HT-FTIR micro-spectroscopy of cordierite I: the CO2 absorbance as a function of T from in situ and
quenched experiments
85
absorbance up to 800 °C is due to an increase with temperature of ε; 2) CO2 loss begins
around 750/800 °C depending on the investigated slab; and 3) as already observed for
H2O/OH in several mineral species (Zhang et al., 2007) the temperature dependence of the
principal modes is different from that of multi-phonon bands (Fig. 9a).
6.2 The effect of channel orientation on volatile loss
There are two points to consider when modeling H2O and CO2 devolatilization in
cordierite: (1) as shown by Fukuda et al. (2009) and by Radica et al. (this Thesis) for beryl,
the volatile diffusion occurs much faster along the structural channels along the [001]
crystallographic direction, and (2) as shown by Aines and Rossmann (1984), CO2 does not
change its molecular configuration during heating, suggesting that the CO2 loss can be
considered as a simple diffusion, although with a much slower rate than H2O (chapter 4).
Considering these points, we may infer that in cordierite (and beryl) the CO2 loss must be
strongly affected by both particle size and the shape of the studied sample, i.e. the length of
the escape path. To check for these issues, we used for our experiments two different
crystallographic orientations: the (001), 77 m thick slab, to simulate the diffusion
mechanism for small or tabular shaped grains (although cordierite does not occur as tabular
crystals, see for example Deer et al., 2004), where the maximum diffusion pathway is 34 µm,
i.e. half slab thickness. On the opposite, the (010) slab, was used to model the case of large
or prismatic grains (typical growth habit of cordierite, Deer et al., 2004), where the mean
diffusion pathway is about 120 µm, corresponding to half the mean slab dimension along the
c axis.
The differences between the two orientations may be observed comparing the in-situ
intensities in Figures 8a and 8b. In both samples we observe an inversion in the absorption
trends starting at 750/800 °C (Fig. 8). For the (001) slab (Fig. 8a) a sudden decrease of the
absorbance occurs between 820 and 950 °C; at 950-1000°C Ai is zero. On the other hand, in
the (010) slab the CO2 decrease occurs only for T > 900 °C; at 1000°C there is still a significant
intensity in the spectra, and the absorbance disappears only at 1200 °C. Note that the
experimental duration between the two HT treatments are comparable. Small differences
related to slab orientation may be observed also for sample dehydration (Fig. 9). In addition,
the dehydration temperatures observed in this work are at least 100 °C, for the (001) slab,

Chapter 3: HT-FTIR micro-spectroscopy of cordierite I: the CO2 absorbance as a function of T from in situ and
quenched experiments
86
and 200 °C, for the (010) slab, higher than those reported by Aines and Rossman (1984) (600
°C), or by Lepezin and Melenevsky (1977), who gave a range for the beginning of
dehydration of 500 - 700 °C.
Quenched data show that only for the (001) slab all CO2 is lost at 1100 °C (Fig. 3b top
dashed curve), while for the (010) slab the average CO2 content of the grain decreases rather
slowly and, at 1200°C, the sample still retains 26% of the starting CO2 (Fig. 8b dashed line).
The H2O content, on the other hand, drops drastically down to the 20 % between 800 and
900 °C (Fig. 9b dashed line).
Figure 10 – Parallel polars light (PPL) optical microscope image and superimposed FPA image of the residual distribution of CO2 in the (010) cordierite section after the heating experiment; CO2 poor areas presented diffuse fracturing. Chromatic scale (in cm
-1) is proportional to CO2 content. The dashed square indicates the
spot for FTIR in-situ measurements. White arrows indicate fractures developed during the heating.
To sum up, in the (001) oriented lamella or in thin and tabular cordierite grains both
CO2 and H2O desorption proceeds smoothly even when T increases with a very fast rate; on
the other side, for thicker or prismatic cordierite grains, as simulated by the (010) lamella,
both CO2 desorption and dehydration occur at higher temperatures, at least 50/100 °C
higher than in the (001) sample. In other words, the difference in diffusion path length has a
significant effect on the temperatures of CO2 and H2O desorption. Because volatile
molecules are known to diffuse faster along the channel direction, it follows that longer
heating times are necessary to extract all volatile molecules from the core of the grain (see
also Chapter 4). With this respect, we also noticed that additional diffusion interfaces, such
as cracks or fractures, may significantly promote outward diffusion. In Figure 10 we display
Chapter 3: HT-FTIR micro-spectroscopy of cordierite I: the CO2 absorbance as a function of T from in situ and
quenched experiments
87
the FTIR-FPA contour map of residual CO2 in the (010) oriented lamella after the heating
experiment. As opposite to single spot measurements that are specifically designed to probe
a great portion of the heat-treated slab (dashed square in Figure 10), the higher spatial
resolution of FPA image revealed an extremely inhomogeneous distribution of residual CO2.
Optical analysis revealed the presence of several 20 µm long fractures oriented normal to
the c direction (arrowed in Figure 10). Notably the fractured area did not show any residual
CO2, suggesting a strong role of the fractures in enhancing the loss of carbon dioxide from
the matrix.
7. Conclusions
FTIR spectroscopy is one of the most effective methods in Earth and material Science
to study in-situ the effects of high pressures and temperatures for elements like H and C
(Koch-Müller et al., 2003, Iezzi et al., 2006, 2009, Keppler and Smyth, 2006; Hawthorne et
al., 2007, Welch et al., 2007, Della Ventura et al., 2010, 2014), however increasing evidence
shows that quantitative studies using in-situ HT-FTIR spectroscopy are complicated by
several factors. First of all, similarly to previous studies done for H2O/OH (Yamagishi et al.,
1997, Zhang et al., 2006, 2007; Tokiwai and Nakashima, 2010), the present work shows that
the molar absorption coefficient ε for CO2 in cordierite is strongly dependent on T. In
addition, the temperature dependence of the principal modes may be strongly different
compared to the multi-phonon modes.
In-situ FTIR spectra also revealed that CO2 desorption is strongly dependent on the
grain size, thickness of the sample and orientation of the studied section. We observed that
volatile loss is favored for small and tabular grains (below 100 µm in thickness); on the
opposite, because volatile flux in cordierite occurs preferentially along the structural channel
parallel to the c crystallographic axis and through the crystal interfaces normal to [001],
volatile loss is hindered for large sized and prismatic crystals. In this type of grains H2O and
CO2 may be retained inside the sample for higher temperatures. Because of these reasons
the process of CO2 desorption from cordierite cannot be ascribed to a first order reaction,
where the decrease rate of CO2 is proportional exclusively to CO2 concentration, but,
because long distance transport is involved, CO2 desorption must be described as a diffusion
Chapter 3: HT-FTIR micro-spectroscopy of cordierite I: the CO2 absorbance as a function of T from in situ and
quenched experiments
88
process (see also Chapter 4). Additionally sample fracturing along the direction normal to
the c axis may multiply the diffusion interfaces thus favoring both H2O and CO2 loss.
Comparing H2O and CO2 loss curves it is also possible to infer that from a qualitative
point of view H2O diffuses faster than CO2 inside cordierite structural channels.
We wonder if combination of the size/orientation effect, the different diffusion rates,
and the role of crystal fracturing may be responsible for the scatter of dehydroxylation data
observed in the literature.

Chapter 4: HT-FTIR micro-spectroscopy of cordierite II: the diffusion kinetics of CO2
89
CHAPTER 4
HT-FTIR MICRO-SPECTROSCOPY OF CORDIERITE.
II: THE DIFFUSION KINETICS OF CO2
Abstract
In-situ high temperature FTIR micro-spectroscopy is a powerful tool to study the
kinetic processes of minerals at extreme environmental conditions. In recent years
additional techniques were implemented in order to improve spectral quality and resolution,
in particular synchrotron light (SR-FTIR) sources may provide high S/N (signal-to-noise) data
allowing to extract reliable quantitative information. In this work we performed several
isothermal heating experiments on (001) oriented sections of a CO2-rich natural cordierite, a
mineral with a great geological and technological relevance. The slices were heat-treated up
to 1000 °C using a Linkam TS 1400XY heating stage. Single-crystal were heated to the target
temperature; the intensity of the ν3 anti-symmetric stretching mode of CO2 at 2348 cm-1 was
monitored as a function of heating time. The resulting curves of residual CO2 were modeled
using different approaches to evaluate the kinetic process of CO2 desorption and diffusion
coefficients. In particular, two different versions of the Avrami equations were found to be
significantly sensitive to the sample thickness. On the other side, the mono-dimensional
plane sheet diffusion approach was found to be more suitable to deal with the examined

Chapter 4: HT-FTIR micro-spectroscopy of cordierite II: the diffusion kinetics of CO2
90
purely diffusive process. Fitting of the diffusion coefficients in the Arrhenius space yielded –
logD0 = 4.4±0.7 m2/sec and Ea = 204±15 kJ/mol.
1. Introduction:
Cordierite, ideally (Mg,Fe)2Al4Si5O18, consists structurally of pseudo-hexagonal rings
of Si/Al tetrahedra stacked along the c crystallographic axis. These rings are linked both
laterally and vertically by corner-sharing four-membered tetrahedral chain to give a
framework of tetrahedra (Gibbs, 1966). Within this framework there are sites for (Mg, Fe2+)
ions in octahedral coordination that share two edges with one Al, and one edge with a Si
tetrahedron. The stacking generates a channel-like open structure running parallel to the c
crystallographic axis, where narrower “bottlenecks” (about 2.5 Å in diameter) alternates to
large “cages” (about 5.4 Å along b and 6.0 Å parallel to a) (Armbruster and Bloss, 1982).
Alkaline cations (like Na+, K+ and Ca++) and molecular groups (H2O and CO2) may be present
in significant amounts within the cordierite structural channels. The highest value so far
reported for H2O in the literature is about 2.4 wt.% (Deer et al., 2004), which is very close to
the maximum theoretical value of 1 molecule per formula unit in the channel. The highest
observed CO2 content is about 2.2 wt.% corresponding to about 0.3 molecules per formula
unit. Most notably, water and carbon dioxide are located in the wider parts of the structural
channels. Hydrocarbons (Zimmermann, 1981; Mottana et al., 1983; Khomenko and Langer,
1999), CO (Khomenko and Langer 2005; Della Ventura et al., 2009 ), Ar (Armbruster, 1985;
Schreyer, 1985), N2 (Armbruster, 1985; Cesare et al., 2007), Cs (Hawthorne and Černý, 1977,
Daniels, 1992) and Fe (Goldmann et al., 1977) were also reported inside the structural
channels. The linear CO2 molecules are oriented orthogonally to the c axis, parallel to the a
crystallographic axis (Aines and Rossman, 1984; Khomenko and Langer, 2005). Extra-
framework H2O groups occur in the structural channels with the molecular plane parallel to
(100). However, H2O may occur in two different orientations: in type I H2O (hereafter H2O[I])
the H–H vector is oriented parallel to the c axis, in type II H2O (H2O[II]) the H–H vector is
rotated by 90°, parallel to the b axis (Goldmann et al., 1977). H2O molecules of the latter
orientation are bonded locally to channel alkali cations in a 2:1 ratio (Goldmann et al., 1977).

Chapter 4: HT-FTIR micro-spectroscopy of cordierite II: the diffusion kinetics of CO2
91
The potential use of cordierite as a water and carbon dioxide fugacity indicator in
rocks has generated much interest in the thermodynamics and structural properties of the
gases contained in its channels (Vry et al., 1990; Carrington and Harley, 1996). While there
are several studies concerning the thermodynamic parameters of cordierite dehydration
(Giampaolo and Putnis, 1989; Carey, 1993; Carey, 1995; Paukov et al., 2007; Dachs and
Geiger, 2008), almost no experimental works were devoted to the kinetics of CO2 expulsion
from cordierite and/or cordierite-like structures (Radica et al., chapter 3), partly due to the
higher temperatures involved in this process. However several authors pointed out that the
CO2 content in the system not only has a significant influence on the cordierite crystallization
(Harley et al.,2002; Kurepin, 2010), but it also affects the H2O diffusivity out of the structural
channels because, for size reason, CO2 act as a plug in the larger cages (Aines and Rossman,
1984; Vry et al., 1990; Radica et al., this Thesis)
Cordierite is also of interest as a model for extremely small channel zeolite-like
minerals (McCrusker, 2005) and for the behavior of water and carbon dioxide trapped in
small cavities (Aines and Rossman, 1984).
2. Studied sample
In-situ isothermal heating experiments were performed on fragments of a natural
cordierite BM 96512 from Cabo de Gata (Almaria region, Spain). The fragments were clear
and inclusion-free, with a violet to dark blue color. Chemical composition, crystal-chemical
formula, cell parameters, density and optical properties are given in Della Ventura et. al.
(2012); for sake of simplicity, a summary of data is reported in Table 1. In particular, the H2O
and CO2 contents were quantified by SIMS (secondary-ion-mass-spectrometry) using a
Cameca IMS4f ion microprobe at EMMAC, the University of Edinburgh. Procedures follow
those described in previous cordierite studies from the Edinburgh laboratory (Harley and
Carrington, 2001; Thompson et al., 2001; Harley et al., 2002; Della Ventura et al., 2012).
Fetot was considered as Fe2+. The crystal-chemical formula, based on 18 oxygen atoms p.f.u.
is Na0.03(Mg1.52Fe0.44)Al3.98Si5O18·0.21H2O·0.07CO2. Preliminary FTIR imaging confirmed an
homogeneous distribution of H2O and CO2 across the sample (Della Ventura et. al., 2012).

Chapter 4: HT-FTIR micro-spectroscopy of cordierite II: the diffusion kinetics of CO2
92
Table 1 - Microchemical analysis, crystal-chemical formula, cell parameters, density and optical properties for
cordierite studied here. Data from Della Ventura et. al. (2012). Crystal-chemical formula is based on 18 oxygen
atoms p.f.u.
BM 96512 St. Dev.
Chemical analysis (wt.%) SiO2 49.10 0.31 Al2O3 33.10 0.25 MgO 10.04 0.13 FeO 5.21 0.12 TiO2 0.03 0.04 MnO 0.34 0.07 CaO 0.04 0.02 Na2O 0.15 0.02 K2O 0.03 0.01 H2O 0.62 0.08 CO2 0.51 0.08 Total 99.17 Crystal chemical formula (apfu) Si 5.01 Al 3.98 Σ Tetrahedra 8.98 Mg 1.53 Fe 0.44 Ti 0.00 Mn 0.03 Σ Octahedra 2.00 Ca 0.00 Na 0.03 K 0.00 Σ Channels 0.04 n(H2O) 0.21 m(CO2) 0.07 Σ Volatiles 0.28 **H2O
[II] 0.08 **H2O
[I] 0.13 XcrdCO2 0.25 Cell parameters (Å) a 17.135 (7) b 9.781 (5) c 9.343 (7) Densitiy (g/cm3) 2.602 (4) Optic sign Positive 2Vx (°) 90 (3)
3. Experimental methods
In-situ heating experiments were performed on cordierite fragments using a high
temperature Linkam TS 1400 XY heating stage. Selected crystal fragments were oriented
using a polarizing microscope equipped with a spindle-stage; the extinction data were
processed using the program ExcalibrW (Bloss, 1981; Gunter et al., 2005). Crystallographic
orientation was based on the optical orientation a = Z, b = Y and c = X (Deer et al., 2004). The
fragments were transferred from the spindle-stage to glass slides and doubly polished.
Chapter 4: HT-FTIR micro-spectroscopy of cordierite II: the diffusion kinetics of CO2
93
Sample thickness was measured using an electronic micrometer with ±5 µm uncertainty and
checked using the interference fringes in the FTIR spectra, using the formula t = 1/[2·n∙(ν1-
ν2)] where t is sample thickness in cm, n is the refractive index and (ν1- ν2) is the distance
between two adjacent fringes in cm-1 (Pistorius and DeGrip, 2006). Doubly polished
fragments were oriented on the horizontal plane using a polarizing microscope and carefully
transferred on a quartz sample holder (FTIR frequency cut below 2070 cm-1). The sample
holder was inserted into a 17 mm ceramic crucible for the heating runs. Temperature was
measured using a calibrated type S Pt-10% Rh/Pt thermocouple placed close to the sample;
the accuracy was ±1°C according to the manufacturer. Heating ramps were programmed
using a digital controller.
Conventional light HT-FTIR spectra were acquired using a Bruker™ Hyperion 3000
microscope equipped with a KBr-broadband beamsplitter and a liquid nitrogen-cooled MCT
detector at Laboratori Nazionali di Frascati-Istituto Nazionale di Fisica Nucleare (LNF-INFN)
Frascati (Rome). Synchrotron light HT FTIR spectra were collected at beamline B22, Diamond
Light Source laboratory Oxford (UK). Polarized spectra were collected using a gold-wire-grid
polarizer on a ZnSe substrate. A spot size of 50 µm using a 15 X objective was used for data
collection in conventional light, while a spot size close to 20 µm with a 20 X objective was
used in synchrotron light; the nominal resolution was 4 cm-1 and 128 scans were averaged
for both spectrum and background, for a total collecting time of about 30 seconds. FTIR
images were collected using a 64 x 64 pixel focal-plane array (FPA), using a 15 X objective;
the nominal resolution was set at 4 cm−1 and 64 scans were averaged for each spectrum and
background. With this set up each image covers an area of 170 µm x 170 µm with a nominal
spatial resolution of ~5 µm (Della Ventura et al., 2010, 2014).
3.1 FTIR polarized-light isothermal heating experiments
In order to study the kinetic of CO2 diffusion within cordierite at high T, two sets of
experiments were performed on (001) slabs. This orientation was chosen to ensures a
homogenous outward diffusion of CO2 across the entire slab surface considering that CO2
diffuses much faster along the structural channels oriented parallel to the c crystallographic
direction (Fig. 1, see Chapter 3). Diffusion through the prismatic faces can be neglected
because, as it has already been verified for the structurally related beryl, it is at least two
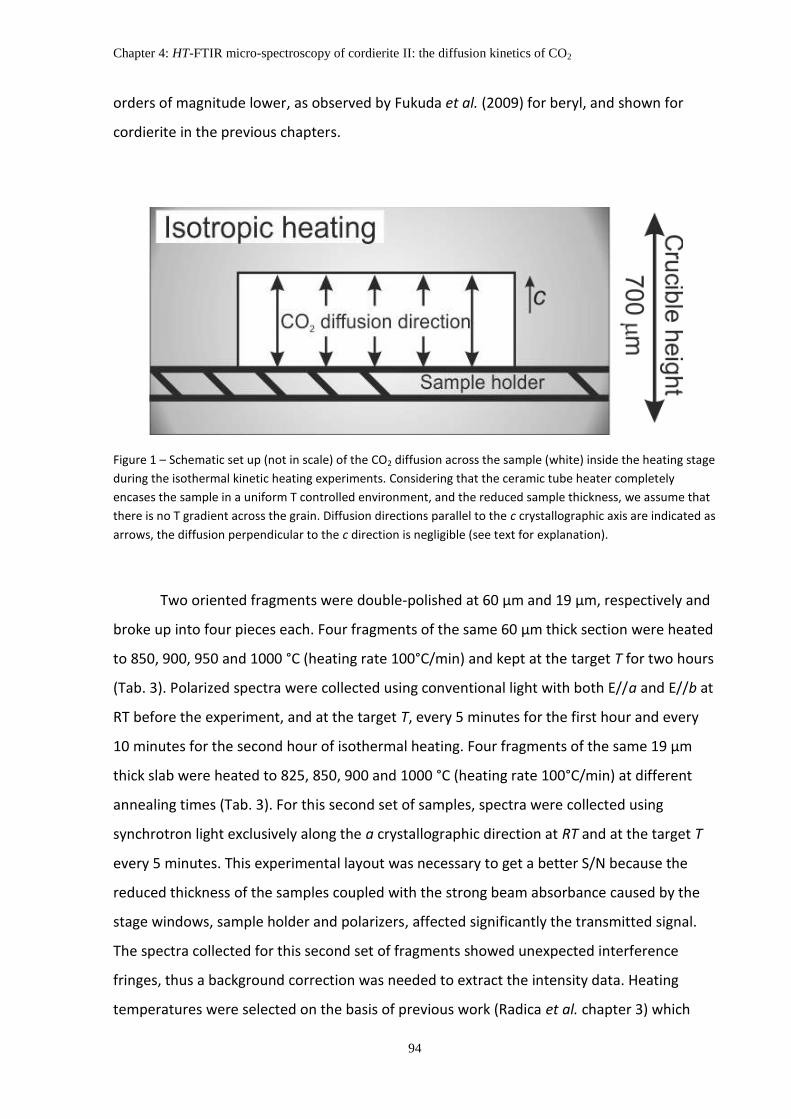
Chapter 4: HT-FTIR micro-spectroscopy of cordierite II: the diffusion kinetics of CO2
94
orders of magnitude lower, as observed by Fukuda et al. (2009) for beryl, and shown for
cordierite in the previous chapters.
Figure 1 – Schematic set up (not in scale) of the CO2 diffusion across the sample (white) inside the heating stage
during the isothermal kinetic heating experiments. Considering that the ceramic tube heater completely
encases the sample in a uniform T controlled environment, and the reduced sample thickness, we assume that
there is no T gradient across the grain. Diffusion directions parallel to the c crystallographic axis are indicated as
arrows, the diffusion perpendicular to the c direction is negligible (see text for explanation).
Two oriented fragments were double-polished at 60 µm and 19 µm, respectively and
broke up into four pieces each. Four fragments of the same 60 µm thick section were heated
to 850, 900, 950 and 1000 °C (heating rate 100°C/min) and kept at the target T for two hours
(Tab. 3). Polarized spectra were collected using conventional light with both E//a and E//b at
RT before the experiment, and at the target T, every 5 minutes for the first hour and every
10 minutes for the second hour of isothermal heating. Four fragments of the same 19 µm
thick slab were heated to 825, 850, 900 and 1000 °C (heating rate 100°C/min) at different
annealing times (Tab. 3). For this second set of samples, spectra were collected using
synchrotron light exclusively along the a crystallographic direction at RT and at the target T
every 5 minutes. This experimental layout was necessary to get a better S/N because the
reduced thickness of the samples coupled with the strong beam absorbance caused by the
stage windows, sample holder and polarizers, affected significantly the transmitted signal.
The spectra collected for this second set of fragments showed unexpected interference
fringes, thus a background correction was needed to extract the intensity data. Heating
temperatures were selected on the basis of previous work (Radica et al. chapter 3) which

Chapter 4: HT-FTIR micro-spectroscopy of cordierite II: the diffusion kinetics of CO2
95
showed a strong decrease in channel CO2 content around 850 °C. In all cases the lateral
dimension of the sample was significantly larger than the beam size.
Table 3 – Isothermal kinetic heating experiments details.
Sample slab (orientation 001) Thickness (µm) Annealing temperature (°C) Annealing time (min) Light source
BM 96512_T 850 60 850 120 Conventional BM 96512_T 900 60 900 120 Conventional BM 96512_T 950 60 950 120 Conventional BM 96512_T 1000 60 1000 120 Conventional BM 96512_T3 825 19 825 210 Synchrotron BM 96512_T3 850 19 850 180 Synchrotron BM 96512_T3 900 19 900 60 Synchrotron BM 96512_T3 1000 19 1000 30 Synchrotron
4. Polarized-light FTIR spectroscopy of cordierite and band
assignment
The correct assignment of the absorption peaks in cordierite spectra is a crucial point
when using the absorbance data for quantitative purposes (Della Ventura et al., 2012, Radica
et al., 2013). In Figure 2 we display the single-crystal polarized infrared spectra of sample BM
96512 collected at RT. H2O and CO2 absorptions are present in 4 different regions of the
spectrum: (a) the H2O combination region around 5250 cm-1 (Della Ventura et al., 2012) (b)
the 3900 – 3300 cm-1 region where the H2O stretching modes (Goldman et al., 1977) and the
combination modes of CO2 are observed (Geiger and Kolesov, 2002); Della Ventura et al.,
2009, 2012); (c) the antisymmetric stretching (2600 – 2000 cm-1) region of CO2 (Geiger and
Kolesov, 2002) and (d) the H2O bending region around 1600 cm-1 (Della Ventura et al., 2012).
Selected polarized spectra in the 3800 – 3200 cm-1 range are given in Figure 2b.
When the electric vector E is parallel to the crystallographic axis c (E//c), two sharp peaks are
observed, one centered at 3575 cm-1, and the other at 3689 cm-1; a third weaker peak is
observed at 3242 cm-1. The E//b spectrum features a very broad peak centered about 3630
cm-1 with a shoulder around 3595 cm-1. The E//a spectrum shows a broad and weak multi-
component absorption with maxima at 3630 cm-1 and 3575 cm-1; two sharper peaks are
present at 3708 and 3595 cm-1. The polarized spectra in the 5300 - 5200 cm-1 range (Fig. 2a)
features a fairly sharp peak at 5266 cm-1 for E//c, and a very broad peak about 5250 cm-1 for
E//b. The E//a spectrum is featureless. In Figure 2c the E//a spectrum in the CO2 region

Chapter 4: HT-FTIR micro-spectroscopy of cordierite II: the diffusion kinetics of CO2
96
consists of a very sharp and intense absorption centered at 2348 cm-1, with a weak shoulder
at 2332 cm-1 on the low-frequency side. A minor band is observed at 2282 cm-1. The E//c
spectrum is featureless, while the E//b spectrum shows a minor band at 2348 cm-1 with two
side bands at 2391 and 2306 cm-1, respectively. In the H2O bending region relevant peaks are
observed in E//c at 1634 cm-1 (Fig. 2d). At 1560, 1600, and 1635 cm-1 polarized for E//a and
E//b a triplet of weak components may be observed.
Figure 2 - Single-crystal polarized-light infrared spectra of BM 96512 cordierite collected at RT in the ranges
5300-5200 cm-1
(a), 3800-3200 cm-1
(b), in the CO2 antisymmetric stretching mode region (c) and H2O bending
mode (d). Spectra were collected on (010) oriented 33 µm thick (E//a and E//c) and (100) oriented 50 µm thick
(E//b) oriented slabs. Spectra are scaled to thickness. Band assignment is reported, *=see description in the
text.

Chapter 4: HT-FTIR micro-spectroscopy of cordierite II: the diffusion kinetics of CO2
97
The vibrational (FTIR and Raman) spectrum is well characterized due to the many
spectroscopic works published in the literature (e.g. Goldman et al., 1977, Geiger and
Kolesov, 2002, Khomenko and Langer, 2005, Della Ventura et al. 2009, 2012 and references
therein). For the band assignment used in this work we follow the work of Della Ventura et
al. (2009, 2012), who critically revised the existing literature on the interpretation of the IR
spectra of cordierite, and also extending the spectrum analysis to the entire wavenumbers
range from 6000 cm-1 (NIR) to 1500 cm-1 (MIR).
Accordingly, the peak at 3689 cm-1 (Fig. 2b), polarized for E//c, is assigned to the anti-
symmetric stretching mode ν3 of H2O[I]; the corresponding symmetric stretching mode (ν1) in
Mg-cordierite is observed at 3595 cm-1 (Paukov et al., 2007) and is polarized for E//b (Fig. 2b)
The splitting between these two components *Δ(ν3- ν1)=94 cm-1] suggests that H2O[I] occurs
in cordierite as a relatively free, unbound molecule (Geiger and Kolesov, 2002). The broad
band at 3630 cm-1 polarized in E//b is assigned to the antisymmetric stretching mode ν3 of
H2O[II]. The corresponding symmetric stretching band ν1 occurs at 3575 cm-1 in E//c. The
absorptions at 3575 cm-1 for E//b and 3630 cm-1 for E//a (Fig. 2b) may be the result of slight
tilting during sample preparation; the latter could be also ascribed to a very small amount of
H2O with its H–H vector parallel to the a crystallographic axis (Kolesov and Geiger, 2000).
The peaks at 3708 and 3595 cm-1, observed for E//a, are assigned respectively to the ν3 + ν1
and ν3 + 2ν2 combination mode of CO2 (Della Ventura et al., 2009, 2012).
The 1634 cm-1 peak (Fig. 2d) polarized parallel to the c axis is assigned to the bending mode
(ν2) of H2O[II] (Goldman et al., 1977, Della Ventura et al., 2009); the same polarization
behavior is observed for its first overtone (Fig. 2b) at 3242 cm-1 (Herzberg, 1956). On the
opposite, the bending mode ν2 of type I H2O is much less intense and occurs as three
features centered at 1560, 1600, and 1635 cm-1 (Radica et al., 2013). The assignment of
these features to H2O modes is supported by the fact that they are absent in samples with
low water contents (Della Ventura et al., 2009) and by the fact that they disappear with the
other fundamental modes after dehydration (Goldman et al., 1977). The bending modes of
H2O[I] are expected to be polarized for E//b, however they also appear for E//a (see also
Goldman et al., 1977).
In the NIR region (Fig. 2a), the 5266 cm-1 peak polarized for E//c and the 5250 cm-1 polarized
for E//b are assigned to the (ν3 + ν2) combination modes respectively of H2O[I] and H2O[II]
(Della Ventura et al., 2012).
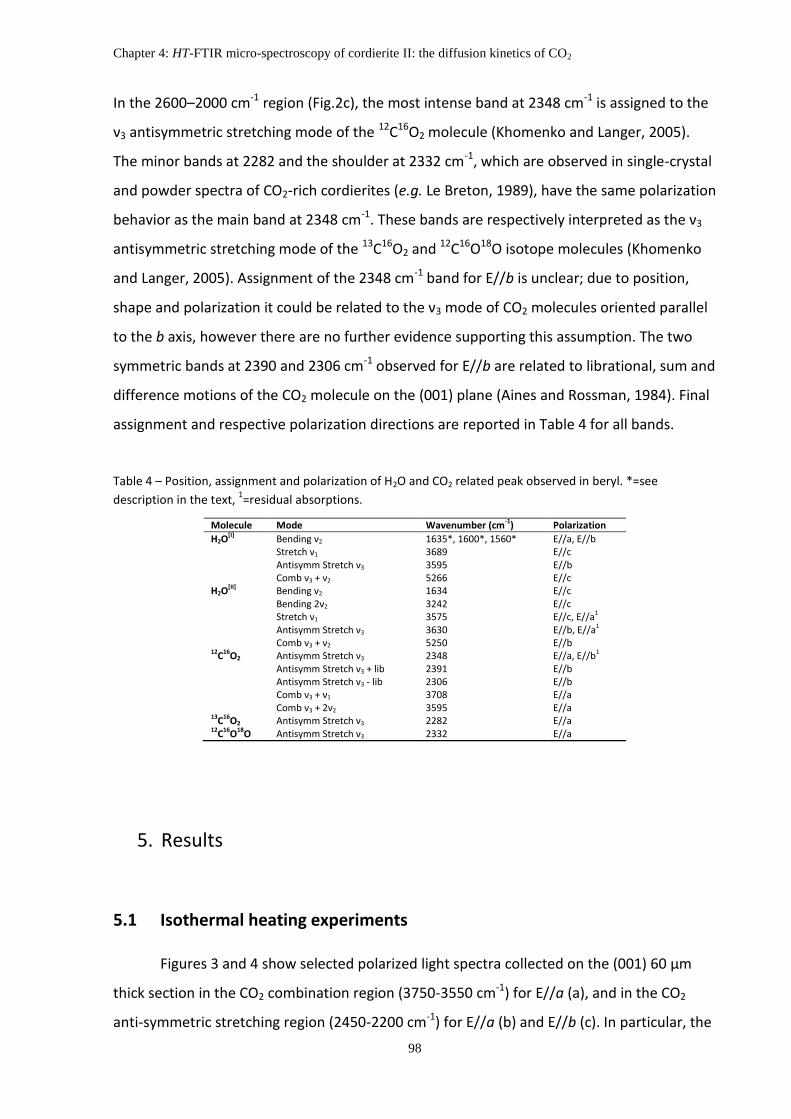
Chapter 4: HT-FTIR micro-spectroscopy of cordierite II: the diffusion kinetics of CO2
98
In the 2600–2000 cm-1 region (Fig.2c), the most intense band at 2348 cm-1 is assigned to the
ν3 antisymmetric stretching mode of the 12C16O2 molecule (Khomenko and Langer, 2005).
The minor bands at 2282 and the shoulder at 2332 cm-1, which are observed in single-crystal
and powder spectra of CO2-rich cordierites (e.g. Le Breton, 1989), have the same polarization
behavior as the main band at 2348 cm-1. These bands are respectively interpreted as the ν3
antisymmetric stretching mode of the 13C16O2 and 12C16O18O isotope molecules (Khomenko
and Langer, 2005). Assignment of the 2348 cm-1 band for E//b is unclear; due to position,
shape and polarization it could be related to the ν3 mode of CO2 molecules oriented parallel
to the b axis, however there are no further evidence supporting this assumption. The two
symmetric bands at 2390 and 2306 cm-1 observed for E//b are related to librational, sum and
difference motions of the CO2 molecule on the (001) plane (Aines and Rossman, 1984). Final
assignment and respective polarization directions are reported in Table 4 for all bands.
Table 4 – Position, assignment and polarization of H2O and CO2 related peak observed in beryl. *=see
description in the text, 1=residual absorptions.
Molecule Mode Wavenumber (cm-1) Polarization
H2O[I] Bending ν2 1635*, 1600*, 1560* E//a, E//b
Stretch ν1 3689 E//c Antisymm Stretch ν3 3595 E//b Comb ν3 + ν2 5266 E//c H2O
[II] Bending ν2 1634 E//c Bending 2ν2 3242 E//c Stretch ν1 3575 E//c, E//a1 Antisymm Stretch ν3 3630 E//b, E//a1 Comb ν3 + ν2 5250 E//b 12C16O2 Antisymm Stretch ν3 2348 E//a, E//b1 Antisymm Stretch ν3 + lib 2391 E//b Antisymm Stretch ν3 - lib 2306 E//b Comb ν3 + ν1 3708 E//a Comb ν3 + 2ν2 3595 E//a 13C16O2 Antisymm Stretch ν3 2282 E//a 12C16O18O Antisymm Stretch ν3 2332 E//a
5. Results
5.1 Isothermal heating experiments
Figures 3 and 4 show selected polarized light spectra collected on the (001) 60 µm
thick section in the CO2 combination region (3750-3550 cm-1) for E//a (a), and in the CO2
anti-symmetric stretching region (2450-2200 cm-1) for E//a (b) and E//b (c). In particular, the

Chapter 4: HT-FTIR micro-spectroscopy of cordierite II: the diffusion kinetics of CO2
99
spectra displayed in Figure 3 are those collected at room T before the experiments, (dashed
lines) and in situ just after reaching the target T indicated on the figure (solid lines). High
temperature polarized measurements confirms the trends observed in Radica et al. (chapter
3): the ν3 + ν1 combination peak clearly broadens and shifts to higher frequency, at about
3720 cm-1, while, for T > 850°C, the ν3 + 2ν2 combination peak of CO2 at 3595 cm-1 and the
H2O absorptions at 3630 and 3575 cm-1 disappear. A weak shoulder can be observed around
3680 cm-1 (Fig. 3a). In the 2450-2200 cm-1 region, the 2348 cm-1 and the 2332 cm-1
components broadens without shifting. Note that at high T, the 2332 cm-1 peak intensity is
almost comparable with that of the 2348 cm-1 peak. The 2282 cm-1 peak is hidden under the
low-frequency tail of the broadened 2348-2332 cm-1 band (Fig. 3b). For E//b the high
temperature behavior of the CO2 sidebands is observed. In particular we observe the
convergence of both components at 2391 and 2306 cm-1 toward the central 2348 cm-1 band,
with a major shift (30 cm-1) observed for the 2391 cm-1 band, due to a ν3 + libration mode
(Aines and Rossman, 1984) with respect the 2306 cm-1 (ν3 – libration mode), whose shift is 9
cm-1 (Fig. 3c).
Figure 3 – Conventional light polarized FTIR spectra in (a) the CO2 combination region for E//a, and anti-
symmetric stretching region for (b) E//a, and (c) E//b; sample BM96512, 60 µm thick (001) section. Dashed line:
RT spectrum before the heating experiments. HT spectra collected in situ just after reaching the target T (time
= 0 min). Peak position at RT and at selected T are indicated. For peak assignments see Table 4 and text.
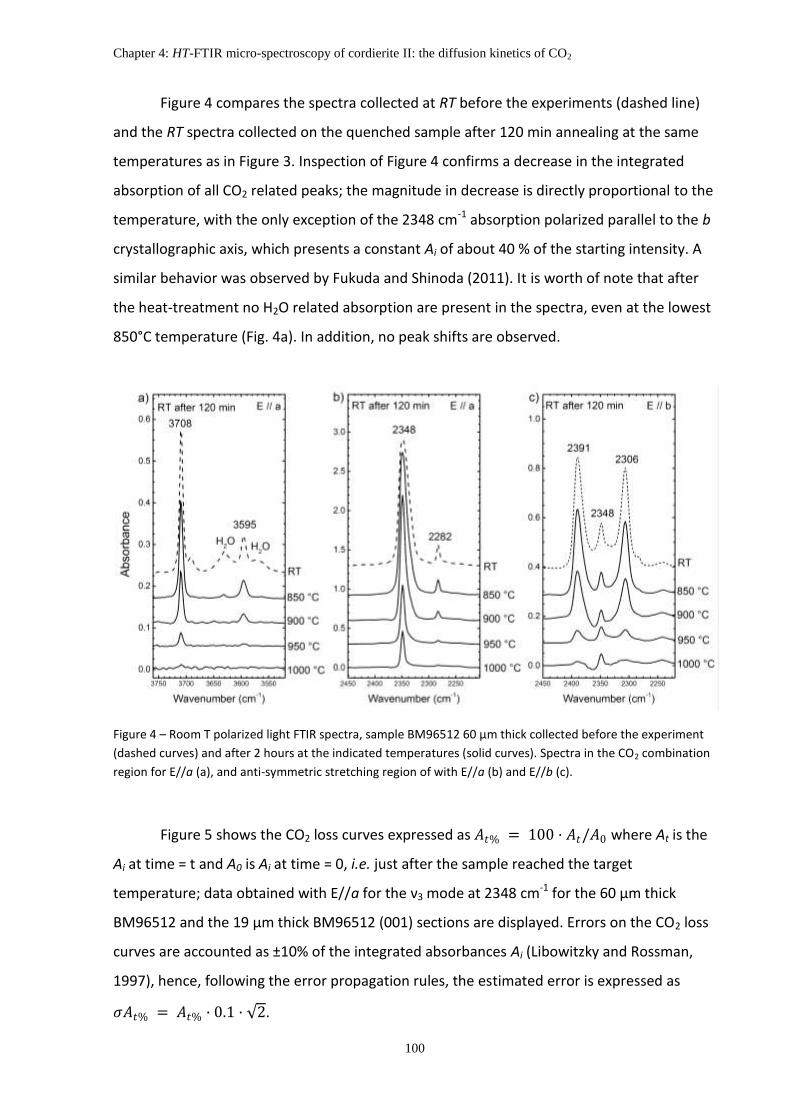
Chapter 4: HT-FTIR micro-spectroscopy of cordierite II: the diffusion kinetics of CO2
100
Figure 4 compares the spectra collected at RT before the experiments (dashed line)
and the RT spectra collected on the quenched sample after 120 min annealing at the same
temperatures as in Figure 3. Inspection of Figure 4 confirms a decrease in the integrated
absorption of all CO2 related peaks; the magnitude in decrease is directly proportional to the
temperature, with the only exception of the 2348 cm-1 absorption polarized parallel to the b
crystallographic axis, which presents a constant Ai of about 40 % of the starting intensity. A
similar behavior was observed by Fukuda and Shinoda (2011). It is worth of note that after
the heat-treatment no H2O related absorption are present in the spectra, even at the lowest
850°C temperature (Fig. 4a). In addition, no peak shifts are observed.
Figure 4 – Room T polarized light FTIR spectra, sample BM96512 60 µm thick collected before the experiment
(dashed curves) and after 2 hours at the indicated temperatures (solid curves). Spectra in the CO2 combination
region for E//a (a), and anti-symmetric stretching region of with E//a (b) and E//b (c).
Figure 5 shows the CO2 loss curves expressed as 𝐴𝑡% = 100 · 𝐴𝑡/𝐴0 where At is the
Ai at time = t and A0 is Ai at time = 0, i.e. just after the sample reached the target
temperature; data obtained with E//a for the ν3 mode at 2348 cm-1 for the 60 µm thick
BM96512 and the 19 µm thick BM96512 (001) sections are displayed. Errors on the CO2 loss
curves are accounted as ±10% of the integrated absorbances Ai (Libowitzky and Rossman,
1997), hence, following the error propagation rules, the estimated error is expressed as
𝜎𝐴𝑡% = 𝐴𝑡% · 0.1 · 2.

Chapter 4: HT-FTIR micro-spectroscopy of cordierite II: the diffusion kinetics of CO2
101
Figure 5 – Isothermal plots of residual CO2 within the cordierite channels (At% = 100·At/A0 of the 2348 cm-1
band) as a function of time; sample BM96512, (001) section with E//a. Shaded areas represent the estimated
error on the absorption. (a) 60 µm thick section, (b) 19 µm thick section.
5.2 Reaction kinetics
5.2.1 Avrami rate equations
Figure 5 shows that for T > 800°C the CO2 content decreases significantly as a
function of time. As a first step, we modeled the results of Figure 5 by using the same
formalism employed by previous authors for their dehydration experiments (Hancock and
Sharp, 1972; Giampaolo and Putnis, 1989), i.e. by assuming that CO2 loss from cordierite may
be described as a first order reaction. In such a case, the rate is exclusively proportional to
the concentration of CO2, because no chemical reactions are involved during CO2 loss other
than simple desorption. A first order reaction follows the general Avrami formula (Avrami,
1939, 1940, 1941) of exponential decay:
𝑦 = 1 − exp −𝑓 𝑡 or 𝐴𝑡 = 𝐴0 ∙ exp −𝑓 𝑡 (1)
where y = 1 - At/ A0 is the fraction of CO2 lost at time = t (min), At is the integrated
absorbance (Ai) at time = t, A0 is Ai at time = 0 and f(t) is a time dependent exponential
function. f(t) is usually described by two parameters k and m. The coefficient k, the rate
constant, describes the way the decrease depends on the concentration of the reactant. The
exponential factor m is an empirical factor used to model the reaction mechanism. Curves
with the same value of m are isokinetic and indicate that the reaction type does not change
within the examined range of temperature or fraction loss. The kinetic parameter k may be

Chapter 4: HT-FTIR micro-spectroscopy of cordierite II: the diffusion kinetics of CO2
102
used, via the Arrhenius equation, to calculate the activation energy Ea (kJ/mol) of the
process leading to CO2 loss from the structural channels:
𝑘 = 𝐴 ∙ exp −𝐸𝑎
𝑅𝑇
(2a)
Linearized:
ln 𝑘 = ln𝛼 − 𝐸𝑎 𝑅𝑇
(2b)
where R is the universal gas constant (kJ/mol K), T is the temperature in K and α is the
frequency factor.
Because various equations can fit the same data set equally well, very different
values of the empirical activation energy can be derived from the same experiments. Thus
the activation energy is only meaningful in terms of the rate equation used to fit the data. In
order to test for the best model to describe the CO2 loss form cordierite, we fitted our data
(Fig. 6) with two of the most commonly used equations in kinetic studies for minerals:
𝐴𝑡 = 𝐴0 ∙ exp(−𝑘 · 𝑡𝑚 )
(3a)
Hereafter referred as Avrami JMAK (Avrami, 1939, 1940, 1941; Hancock and Sharp, 1972;
Carbone et al., 2008), and:
𝐴𝑡 = 𝐴0 ∙ exp[− 𝑘 · 𝑡 𝑚 ]
(3b)
referred as Avrami Putnis (Giampaolo and Putnis, 1989, Putnis et al., 1990, Putnis, 1992). It is
important to note that in the latter formula the rate constant k has always the dimension of
t-1, while in the former case the dimension of k is t-m and thus depends on the fitted curve.
Figure 6 shows the results of fitting the above equations to the experimental data for
the v3 anti-symmetric stretching mode of CO2 for both sections 60 µm and 19 µm thick,
respectively; fitted parameters are compared in Table 5. Figure 7 shows the values of the
fitted parameters in the Arrhenius space. The activation energies Ea calculated from the

Chapter 4: HT-FTIR micro-spectroscopy of cordierite II: the diffusion kinetics of CO2
103
Arrhenius equation (equation 2b above) for each of the aforementioned datasets are
reported in Table 6.
Table 5 – Avrami JMAK and Avrami Putnis fitted values and its associated errors (σ). lnk and R2 are also
reported.
Avrami JMAK Avrami Putnis
BM 96512 60 µm thick
Temp (°C) m σ m k σ k lnk σ lnk R2 m σ m k σ k lnk σ lnk R2
1000 0.54 0.03 2.14E-01 3.00E-02 -1.54 0.14 0.984 0.54 0.03 5.78E-02 7.50E-03 -2.85 0.13 0.976
950 0.80 0.03 4.13E-02 6.40E-02 -3.19 0.15 0.995 0.80 0.03 1.84E-02 7.60E-04 -4.00 0.04 0.995
900 0.97 0.04 8.68E-03 1.91E-03 -4.75 0.22 0.995 0.96 0.05 7.60E-03 1.50E-04 -4.88 0.02 0.994
850 1.17 0.40 8.80E-04 2.10E-03 -7.04 2.39 0.661 1.18 0.22 2.47E-03 5.70E-04 -6.00 0.23 0.917
BM 96512 19 µm thick
Temp (°C) m σ m k σ k lnk σ lnk R2 m σ m k σ k lnk σ lnk R
2
1000 0.58 0.07 4.55E-01 1.10E-01 -0.79 0.24 0.971 0.58 0.07 2.60E-01 6.50E-02 -1.35 0.25 0.971
900 0.46 0.05 3.50E-01 7.30E-02 -1.05 0.21 0.950 0.46 0.05 1.00E-01 2.00E-02 -2.30 0.20 0.951
850 0.42 0.05 2.80E-01 4.50E-02 -1.27 0.16 0.953 0.42 0.03 5.00E-02 1.00E-02 -3.00 0.20 0.956
825 0.51 0.06 1.55E-01 5.80E-02 -1.86 0.37 0.958 0.51 0.02 3.00E-02 9.00E-03 -3.51 0.30 0.960
Figure 6 – Evolution of integrated CO2 absorbance (ν3 anti-symmetric stretching mode) as a function of time for
the experimental data set collected for the BM 96512 60 µm thick (a, b) and 19 µm thick (c, d). Curves are fitted
by Avrami JMAK equation (left column) and Avrami Putnis (right column) for each temperature.

Chapter 4: HT-FTIR micro-spectroscopy of cordierite II: the diffusion kinetics of CO2
104
Table 6 – Arrhenius equation parameters and activation energies Ea for each of the dataset obtained via
Avrami JMAK and Avrami Putnis equation.
Avrami JMAK Avrami Putnis
BM 96512 60 µm
ln A 36.5±1.2 18.1±1.4
Ea/R 48.5±1.5 26.9±1.7
Ea (kJ/mol) 403±12 224±14
BM 96512 19 µm
ln A 3.9±1.9 11.8±1.2
Ea/R 5.9±2.2 16.6±1.4
Ea (kJ/mol) 49±16 138±12
Figure 7 – Arrhenius plots for cordierite BM 96512, 60 µm thick (a, b) and 19 µm thick (c, d).
Examination of Table 6 shows that two different sets of results are obtained when using the
two (JMAK vs Putnis) equations, suggesting that the Avrami formalism is not suitable to
describe the CO2 desorption along the structural channels. This point will be discussed in
more details below.

Chapter 4: HT-FTIR micro-spectroscopy of cordierite II: the diffusion kinetics of CO2
105
5.2.2 Mono-dimensional plane sheet diffusion
In the previous paragraph, we showed that the process of CO2 loss in cordierite is not
related exclusively to the starting CO2 content, but depends strongly on the shape and size
of the examined sample. Therefore, we modeled the data on the basis of a mono-
dimensional diffusion from a plane sheet of finite thickness (Fig. 8), using the equation
(Carlslaw and Jeager, 1959; Crank, 1975; Ingrin, 1995; Tokiwai and Nakashima, 2010a):
𝐴𝑡 = 𝐴0 ∙ 8
2𝑛 + 1 2𝜋2 ∙ exp
−𝐷 2𝑛 + 1 2𝜋2𝑡
𝐿2
∞
𝑛=0
(4)
where At is the Ai at time = t, A0 is Ai at time = 0, D is the diffusion coefficient in m2/sec, t is
the time in sec and L is sample thickness in m, n is the index of summation.
Figure 8 – Schematic diagram of a mono-dimensional diffusion from a plane sheet with thickness of L and initial
concentration of A0. After time t, CO2 integrated absorbance decrease to At due to surface diffusion. The actual
CO2 distribution inside the sample is described by the black line. Modified after Ingrin et al. (1995).
In order to apply equation (4) the following consideration were done: 1) the CO2
concentration C may be replaced by the integrated absorbances Ai, because the CO2 content
and its absorbance in the FTIR spectrum are related by the Beer-Lambert equation; 2) any
CO2 at the crystal surface was removed using a gentle flow of N2 in the microscope chamber;
3) the diffusion normal to the slab surface is homogeneous, because the CO2 diffusion occurs
exclusively along the c crystallographic direction (Fukuda et al., 2009; Radica et al. Chap. 3);
moreover FPA images collected after the experiments on the 60 µm thick section, confirmed
an homogenous distribution of residual CO2 (Fig. 9).
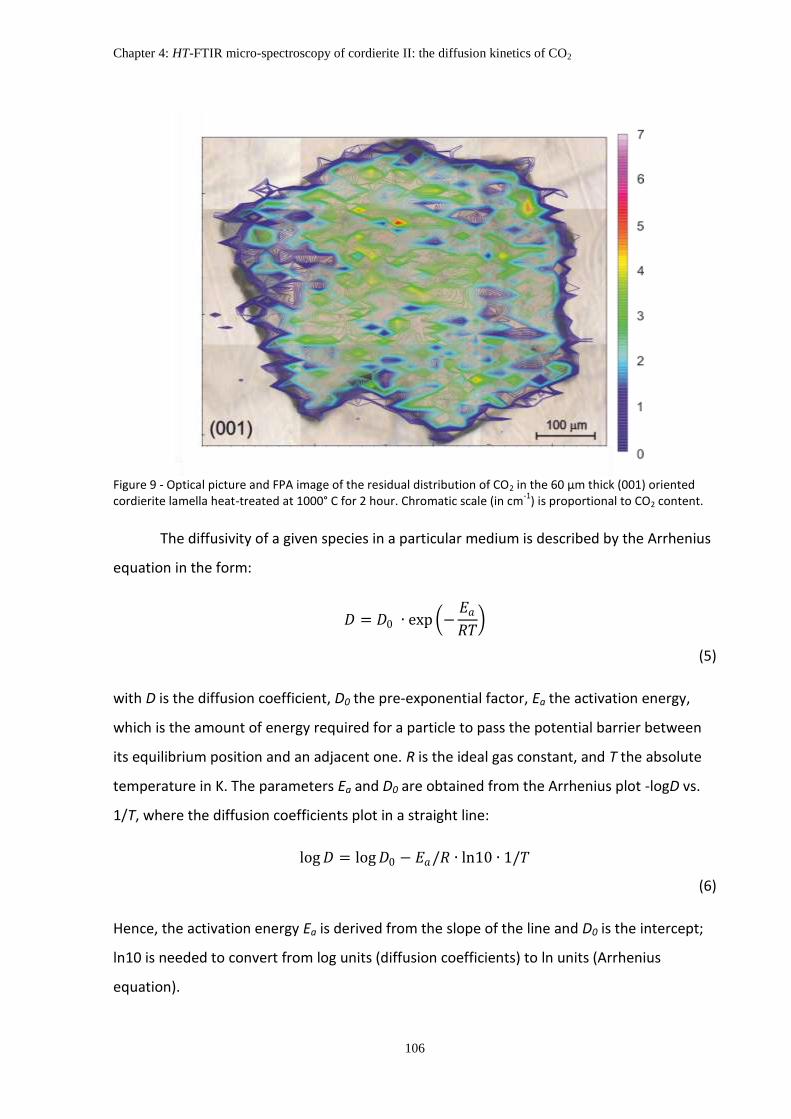
Chapter 4: HT-FTIR micro-spectroscopy of cordierite II: the diffusion kinetics of CO2
106
Figure 9 - Optical picture and FPA image of the residual distribution of CO2 in the 60 µm thick (001) oriented cordierite lamella heat-treated at 1000° C for 2 hour. Chromatic scale (in cm
-1) is proportional to CO2 content.
The diffusivity of a given species in a particular medium is described by the Arrhenius
equation in the form:
𝐷 = 𝐷0 ∙ exp −𝐸𝑎
𝑅𝑇
(5)
with D is the diffusion coefficient, D0 the pre-exponential factor, Ea the activation energy,
which is the amount of energy required for a particle to pass the potential barrier between
its equilibrium position and an adjacent one. R is the ideal gas constant, and T the absolute
temperature in K. The parameters Ea and D0 are obtained from the Arrhenius plot -logD vs.
1/T, where the diffusion coefficients plot in a straight line:
log𝐷 = log𝐷0 − 𝐸𝑎/𝑅 ∙ ln10 ∙ 1/𝑇
(6)
Hence, the activation energy Ea is derived from the slope of the line and D0 is the intercept;
ln10 is needed to convert from log units (diffusion coefficients) to ln units (Arrhenius
equation).
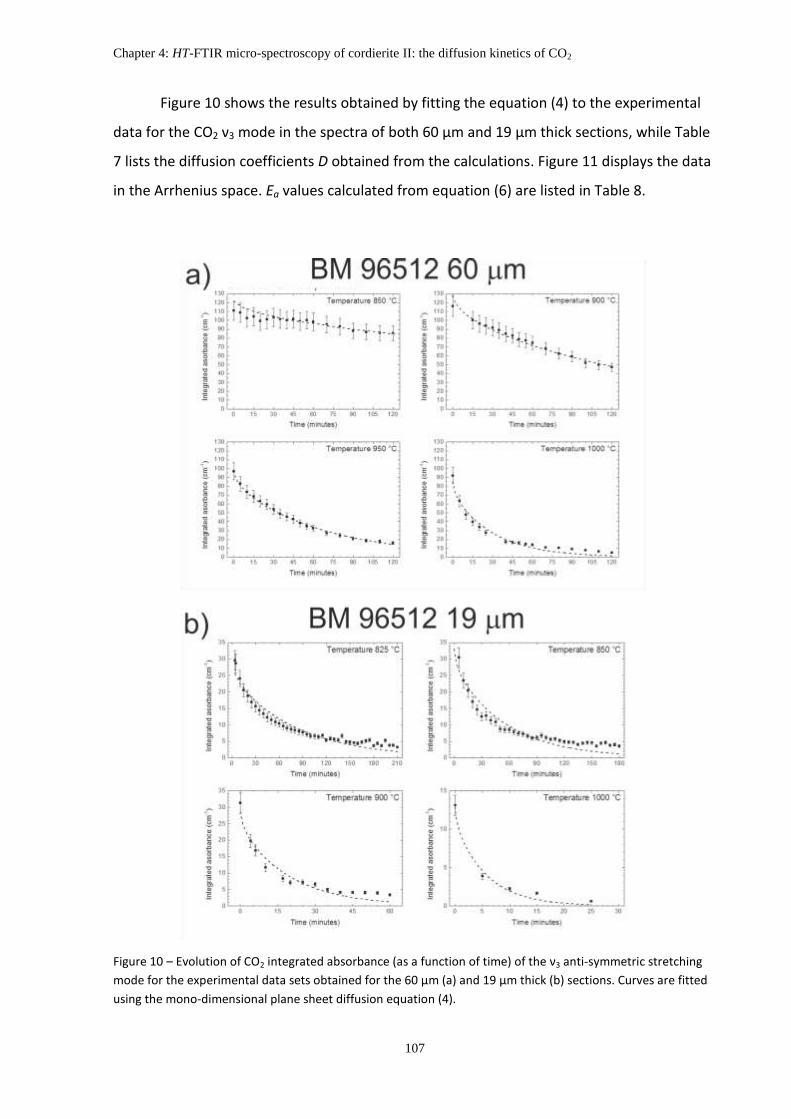
Chapter 4: HT-FTIR micro-spectroscopy of cordierite II: the diffusion kinetics of CO2
107
Figure 10 shows the results obtained by fitting the equation (4) to the experimental
data for the CO2 ν3 mode in the spectra of both 60 µm and 19 µm thick sections, while Table
7 lists the diffusion coefficients D obtained from the calculations. Figure 11 displays the data
in the Arrhenius space. Ea values calculated from equation (6) are listed in Table 8.
Figure 10 – Evolution of CO2 integrated absorbance (as a function of time) of the ν3 anti-symmetric stretching
mode for the experimental data sets obtained for the 60 µm (a) and 19 µm thick (b) sections. Curves are fitted
using the mono-dimensional plane sheet diffusion equation (4).
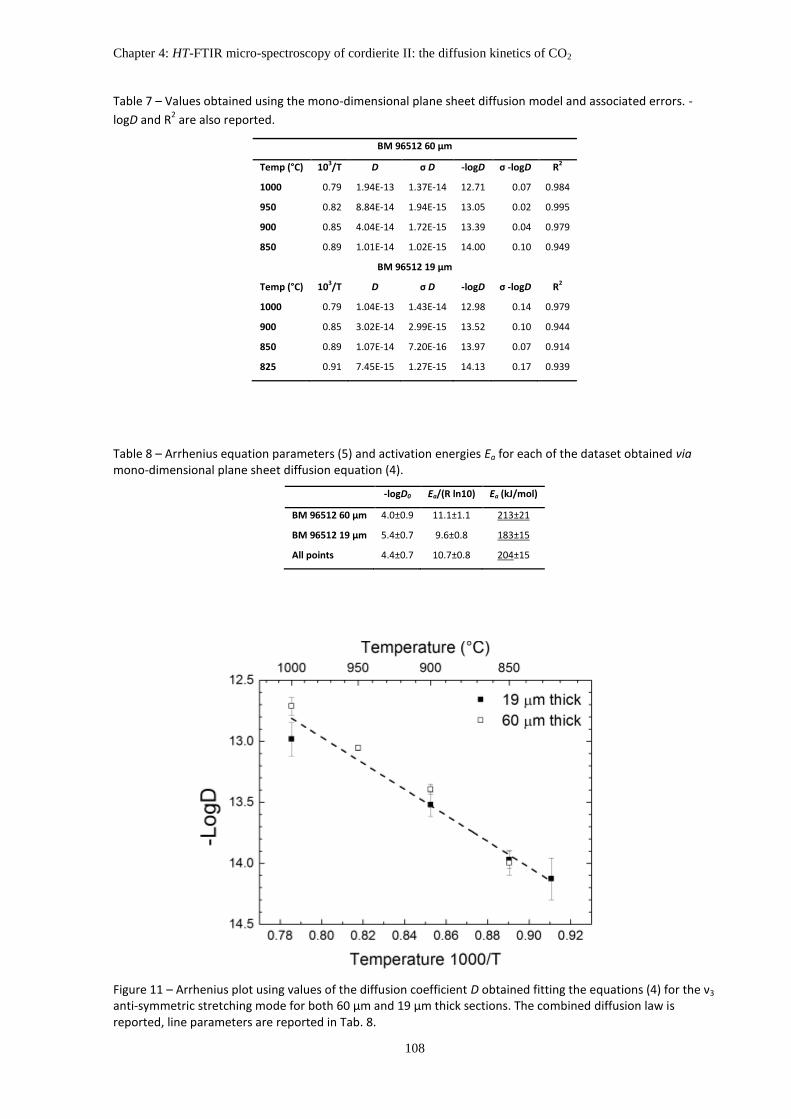
Chapter 4: HT-FTIR micro-spectroscopy of cordierite II: the diffusion kinetics of CO2
108
Table 7 – Values obtained using the mono-dimensional plane sheet diffusion model and associated errors. -
logD and R2 are also reported.
BM 96512 60 µm
Temp (°C) 103/T D σ D -logD σ -logD R2
1000 0.79 1.94E-13 1.37E-14 12.71 0.07 0.984
950 0.82 8.84E-14 1.94E-15 13.05 0.02 0.995
900 0.85 4.04E-14 1.72E-15 13.39 0.04 0.979
850 0.89 1.01E-14 1.02E-15 14.00 0.10 0.949
BM 96512 19 µm
Temp (°C) 103/T D σ D -logD σ -logD R2
1000 0.79 1.04E-13 1.43E-14 12.98 0.14 0.979
900 0.85 3.02E-14 2.99E-15 13.52 0.10 0.944
850 0.89 1.07E-14 7.20E-16 13.97 0.07 0.914
825 0.91 7.45E-15 1.27E-15 14.13 0.17 0.939
Table 8 – Arrhenius equation parameters (5) and activation energies Ea for each of the dataset obtained via mono-dimensional plane sheet diffusion equation (4).
-logD0 Ea/(R ln10) Ea (kJ/mol)
BM 96512 60 µm 4.0±0.9 11.1±1.1 213±21
BM 96512 19 µm 5.4±0.7 9.6±0.8 183±15
All points 4.4±0.7 10.7±0.8 204±15
Figure 11 – Arrhenius plot using values of the diffusion coefficient D obtained fitting the equations (4) for the ν3 anti-symmetric stretching mode for both 60 µm and 19 µm thick sections. The combined diffusion law is reported, line parameters are reported in Tab. 8.

Chapter 4: HT-FTIR micro-spectroscopy of cordierite II: the diffusion kinetics of CO2
109
6. Discussions: Kinetic of CO2 extraction
The kinetic of CO2 expulsion from cordierite channels in the temperature range from 825
°C to 1000 °C was calculated using the integrated absorbance (Ai) changes in the MIR region.
Isothermal heating experiments were performed on oriented cordierite slabs doubly
polished along the direction normal to the c crystallographic axis; FTIR spectra were
collected in situ. Hereafter we discuss the differences on the calculated activation energies
(Ea) of CO2 expulsion on the basis of the used analytical approach or the effects of the
sample thickness.
1) From Table 6 we observe that, when using the Avrami approach, calculation of the
activation energies Ea on the basis of two different equations (JMAK and Putnis),
yields very different values, spanning from 403 kJ/Mol to 49 kJ/Mol. The differences
are not only related to the different analytical approach, but mostly to the different
sample thickness. The value calculated with the Avrami JMAK equation are in fact
reduced by almost one order of magnitude for the thinner sample with respect the
thicker one, while those calculated using the Avrami Putnis equation are only halved.
2) Data reported in Table 8 suggest that when using the mono-dimensional diffusion
model, the thickness has no effect on the resulting D0 or Ea values, thus confirming
that, unlike to what observed for H2O in muscovite (Tokiwai and Nakashima, 2010a)
the CO2 diffusion in cordierite can be well described by this formalism.
3) In the previous section we mentioned that the m parameter in the Avrami equation
is dependent of the reaction mechanism (Putnis et al., 1990). Examination of Figure
12 shows two distinct trends between the m values obtained for the different
sections: the values fitted for the 60 µm thick sample in fact decrease progressively
as a function of T, suggesting a progressive change of the expulsion mechanism. On
the other hand, those fitted using the data collected on the 19 µm thick sample are
constant in the whole T range considered. Considering that the two experimental
sets of data differ just for the thickness of the studied crystal slab, and that in this
temperature range no significant change in CO2 expulsion mechanism are expected
(also see point 2 above), we may conclude that the m values in the Avrami approach
are sensitive to the sample thickness. In addition, because the m values are constant
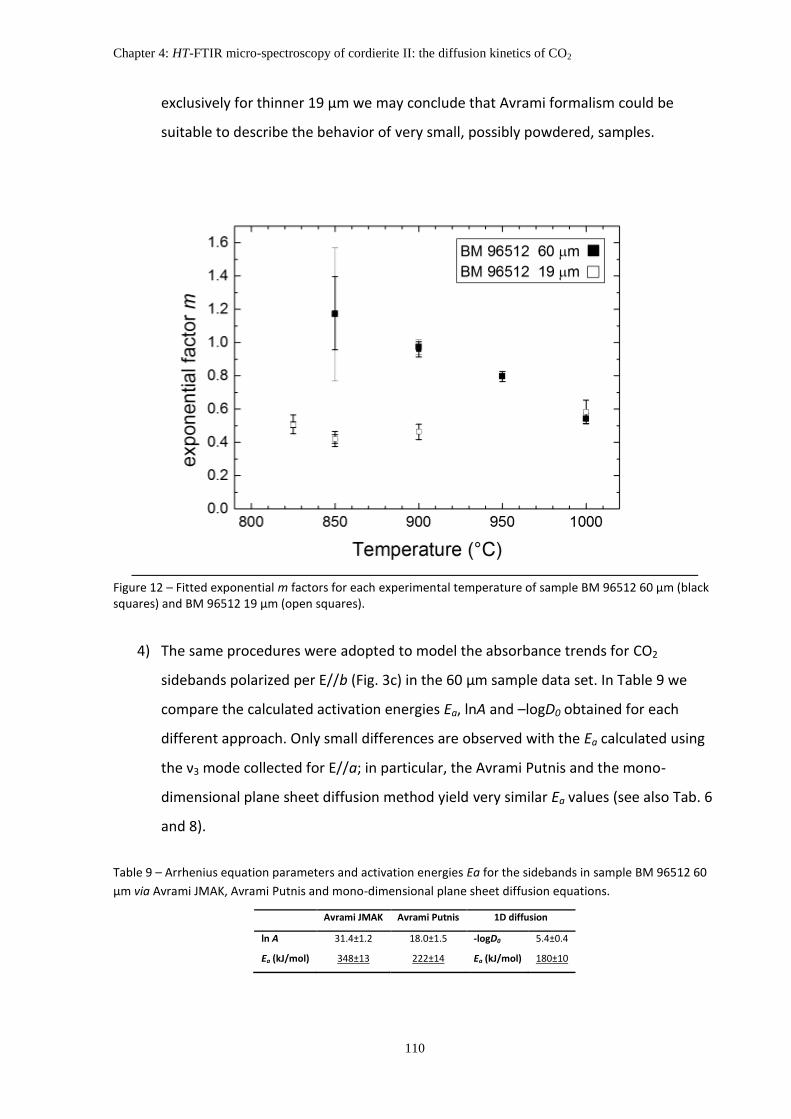
Chapter 4: HT-FTIR micro-spectroscopy of cordierite II: the diffusion kinetics of CO2
110
exclusively for thinner 19 µm we may conclude that Avrami formalism could be
suitable to describe the behavior of very small, possibly powdered, samples.
Figure 12 – Fitted exponential m factors for each experimental temperature of sample BM 96512 60 µm (black squares) and BM 96512 19 µm (open squares).
4) The same procedures were adopted to model the absorbance trends for CO2
sidebands polarized per E//b (Fig. 3c) in the 60 µm sample data set. In Table 9 we
compare the calculated activation energies Ea, lnA and –logD0 obtained for each
different approach. Only small differences are observed with the Ea calculated using
the ν3 mode collected for E//a; in particular, the Avrami Putnis and the mono-
dimensional plane sheet diffusion method yield very similar Ea values (see also Tab. 6
and 8).
Table 9 – Arrhenius equation parameters and activation energies Ea for the sidebands in sample BM 96512 60
µm via Avrami JMAK, Avrami Putnis and mono-dimensional plane sheet diffusion equations.
Avrami JMAK Avrami Putnis 1D diffusion
ln A 31.4±1.2 18.0±1.5 -logD0 5.4±0.4
Ea (kJ/mol) 348±13 222±14 Ea (kJ/mol) 180±10

Chapter 4: HT-FTIR micro-spectroscopy of cordierite II: the diffusion kinetics of CO2
111
Scattering of the Ea values confirms that the Avrami approach cannot be used to
evaluate the kinetic parameters of CO2 extraction. However, based on the above
assumptions, it is possible to infer that the most reliable activation energy for CO2 expulsion
from cordierite provided by the Avrami formalism is Ea = 138±12 kJ/mol, i.e. the value
obtained using the Avrami Putnis equation on the thinner sample data set. Note that this
value is very close to those obtained by previous authors for the dehydration of cordierite
(Giampaolo and Putnis, 1989; Lepezin and Melenevsky, 1977; Zimmermann, 1981).
Figure 13 – Arrhenius diagram of various diffusion coefficients D for different silicates or silicate melts for H2O
and CO2. Numerical values and references in Tab. 10.
We calculated also the diffusion coefficient D and Ea for CO2 in cordierite using the
mono-dimensional plane-sheet diffusion approach (Crank, 1995). We discussed in the
previous paragraph how CO2 likely diffuses across cordierite through a simple diffusion
mechanism for temperatures between 825 and 1000 °C. Diffusion coefficients of volatile
molecular species in silicates are expected to be tightly related to the molecule dimension
and the diffusing structure. It is also widely accepted that for more compact silicate
structures and/or larger molecules diffusing rates are smaller and activation energies larger.
As we may observe from Figure 13 the diffusing rates calculated for CO2 in cordierite (this

Chapter 4: HT-FTIR micro-spectroscopy of cordierite II: the diffusion kinetics of CO2
112
work) are almost one order of magnitude lower then H2O diffusion coefficients calculated in
the isotructural beryl (Fukuda et al., 2009).
It is difficult to draw a direct comparison between our data and the diffusion
coefficients available in the literature for minerals; the reason is that, beryl and cordierite
behave as microporous structures trapping H and C as H2O and CO2 molecules, while the vast
majority of the existing data have been collected on minerals where H is present as an OH-
group. Moreover no data are available for CO2 diffusion in minerals (excluding C diffusion in
carbonates, e. g. Anderson, 1972; Labotka et al., 2000). Thus in the next paragraph we are
forced to compare our data with those derived for basically different processes.
Figure 18 and Table 6 give selected examples of diffusion rates for the most common
hydrous minerals. In Figure 18 we may observe that the diffusion coefficients measured for
CO2 in beryl are close to the OH- diffusion coefficients obtained in other ring silicates like
tourmaline (Desbois and Ingrin, 2007), layer silicates like muscovite (Graham, 1981),
amphiboles like kaersutite (Ingrin and Blanchard 2000), or in disilicates like epidote (Graham,
1981). However, it is important to note that structural OH- probably diffuses inside these
structures in the form of H+ (Zhang et al., 2010) thus the diffusing species is much smaller
compared to molecular CO2 and H2O.
Our data suggest that the structural channels of cordierite and beryl act more likely
as fast paths for the mobility of large molecular groups compared to similar silicate
structures, and for this reason the diffusing behavior is more similar (in terms of diffusion
coefficients, not in the mechanism) to the one typically observed for grain boundary
diffusion, such as, for example, H2O in quartzite (Farver and Yund, 1991) or to the behavior
of CO2 in non-crystalline materials, like silicate melts (Watson et al., 1982; Watson, 1991).
Table 10 – Comparison of the experimental data for H2O and CO2 diffusion in various silicate minerals and melts
found in the literature.
Mineral Diffusing
molecule
T (°C) P (MPa) Ea (kJ/mol) logD0
(m2/s)
Reference
Rhyolite CO2 800-1100 1000 75 -7.2 Watson, 1991
Basalt CO2 1350-1500 1500 195 -3.4 Watson et al., 1982
Muscovite D/H2O, D2O 450-750 200 or 400 121 -8.0 Graham, 1981
Epidote D/H2O, D2O 250-650 200 or 400 90 -7.4 Graham, 1981 in Ingrin and Blanchard, 2006
Kearsutite D/D2 600-900 0.1 104±12 -8.7 Ingrin and blanchard, 2000
Tourmaline (par c)
D/Ar, D2 700-800 0.1 106.3±36.8 -9.8 Desbois and ingrin, 2007
Quarzite H2O 450 -800 100 113 -7.6 Farver and Yund, 1991
Beryl H2O 500 -700 50 -150 133 -6.6 Fukuda et al., 2009

Chapter 4: HT-FTIR micro-spectroscopy of cordierite II: the diffusion kinetics of CO2
113
7. Conclusions
In this work we evaluate the kinetic parameters and diffusion rates of CO2 along the
structural channels of cordierite for increasing thermal conditions. High-quality polarized-
light in-situ HT-FTIR data up to 1000 °C could be obtained for very thin samples thanks to the
increased brilliance of a synchrotron radiation light source (SR-FTIR, Della Ventura et al.,
2014), compensating for the degradation of the IR signal resulting from the use of a polarizer
and the heating stage.
Isothermal heating experiments were performed on (001) oriented cordierite slabs
that ensure a homogeneous CO2 desorption out from the slab surface (Radica et al. chapter
3). Inspection of the spectra collected at high-T shows a significant peak broadening of all
CO2 peaks, while no peak shift were observed for the ν3 mode at 2348 cm-1. Polarized
spectra collected at RT after the heating experiments for the 60 µm thick sample confirms a
decrease in the integrated absorption of all CO2 peaks; the magnitude of decrease is directly
proportional to the temperature. No H2O bands are present in the spectra after the heat-
treatments, indicating that, differently from CO2, for T > 850°C H2O is totally lost from the
cordierite matrix.
Because no changes in CO2 speciation occur during desorption, CO2 loss can be
described as a simple diffusion mechanism. The mono-dimensional plane-sheet diffusion
approach is not influenced by thickness; calculated activation energies are larger, about
204±15 kJ/mol. Measured diffusion coefficients (D) for CO2 along the structural channels are
almost two order of magnitude lower than those for H2O in the isostructural beryl, and very
close to those of H+ in hydrated minerals or CO2 in silicate melts.
Chapter 5: Kinetics of incorporation of CO2 in cordierite and beryl: an FTIR-FPA spectroscopy study
114
CHAPTER 5
KINETICS OF INCORPORATION OF CO2 IN CORDIERITE AND
BERYL: AN FTIR-FPA SPECTROSCOPY STUDY
Abstract
In this work, we address experimentally the diffusion of CO2 into cordierite and beryl,
two isostructural microporous rock-forming minerals, using FTIR spectroscopy coupled with
FPA (focal-plane-array of detectors) imaging. Fragments of a natural, almost Mg end-
member cordierite and CO2-free synthetic beryl were used as starting materials; the
cordierite crystallites were degassed before the experiments. Starting crystals were treated
in a CO2-saturated atmosphere at different pressure, temperature and time conditions, using
a non end-loaded piston-cylinder apparatus. Ag-carbonate was used as the source for carbon
dioxide. After the high pressure experiments, the recovered crystals were oriented using a
spindle stage, cut and doubly polished, and analyzed using polarized micro-FTIR
spectroscopy to study the distribution of CO2 across the sample and quantify its
concentration. The IR data show that pressure plays a major role on the incorporation of
gaseous CO2 in both cordierite and beryl, whereas the effect of temperature is limited. The
spectroscopic data show that the diffusion of CO2 occurs preferentially along the structural
channels parallel the c-axis direction. Diffusion coefficients (D) for beryl were calculated
using the monodimensional diffusion equations; obtained values are in the order of 10-14
m2/s between 700 – 900°C. Fitting of the diffusion coefficients in the Arrhenius plot yielded –
logD0 = 7.2±0.7 m2/sec and an activation energy Ea = 122±15 kJ/mol. Sample cracks formed
Chapter 5: Kinetics of incorporation of CO2 in cordierite and beryl: an FTIR-FPA spectroscopy study
115
during the high pressure experiments were found to enhance significantly the gas diffusion
within the samples.
1. Introduction
Microporous and mesoporous minerals are important from both a geological and a
technological viewpoint. Initially these attributes were only referred to zeolites, however in
the last decade the IUPAC nomenclature was extended to non-zeolitic minerals (McCusker et
al., 2001; McCusker, 2005). Among these phases, cordierite plays a key role because it
represents the only case of a widespread microporous mineral (pore size under 2 nm,
Rouquérol et al., 1994; McCusker et al., 2001) that is able to trap significant amounts of
molecular H2O and CO2 (Schreyer and Yoder 1964; Mirwald et al., 1979; Newton and Wood,
1979; Armbruster and Bloss 1982; Kurepin 1985) under extreme geological (P, T) conditions.
Cordierite stability extends from the amphibolite facies to ultra-high temperature
metamorphism to crustal anatexis conditions (Mirwald and Schreyer, 1977; Vry et al.,1990;
Carrington and Harley, 1996; Smith 1996; Kalt 2000; Harley et al., 2002; Bertoldi et al., 2004;
Sarkar et al., 2010). The analysis of the volatile constituents of cordierite can used to
determine the composition of the fluid pahse during crystallization (Vry et al., 1990;
Carrington and Harley, 1996; Harley et al.,2002; Kurepin, 2010). H2O and CO2 contents affect
the stability of cordierite (Schreyer 1985; Carey 1995; Harley et al., 2002). Therefore, a
quantitative determination of its channel constituents is crucial in petrologic studies.
Among the wide range of cordierite occurrences, the most investigated is the ultra
high-temperature metamorphism of pelitic rocks. Dehydration melting of biotite-bearing
pelites with moderate to high XMg variations (XMg/XMg+Fe >0.5) is often controlled by
cordierite-forming reactions in migmatites and leuco-granites at 200–700 MPa and 700–900°
C (Fitzsimons, 1996; Harley et al., 2002). Thus understanding the role of cordierite as an H2O
and CO2 bearing phase is essential for understanding melting processes and for
thermodynamic calculation of fluid activities during these events (Harley and Thompson,
2004). Kurepin (2010) made calculations of the dependence of H2O and CO2 contents in
cordierite as a function of P, T and fluid composition for the aforementioned P-T conditions,
and his thermodynamic model showed a non-ideality of thermodynamic behavior of H2O
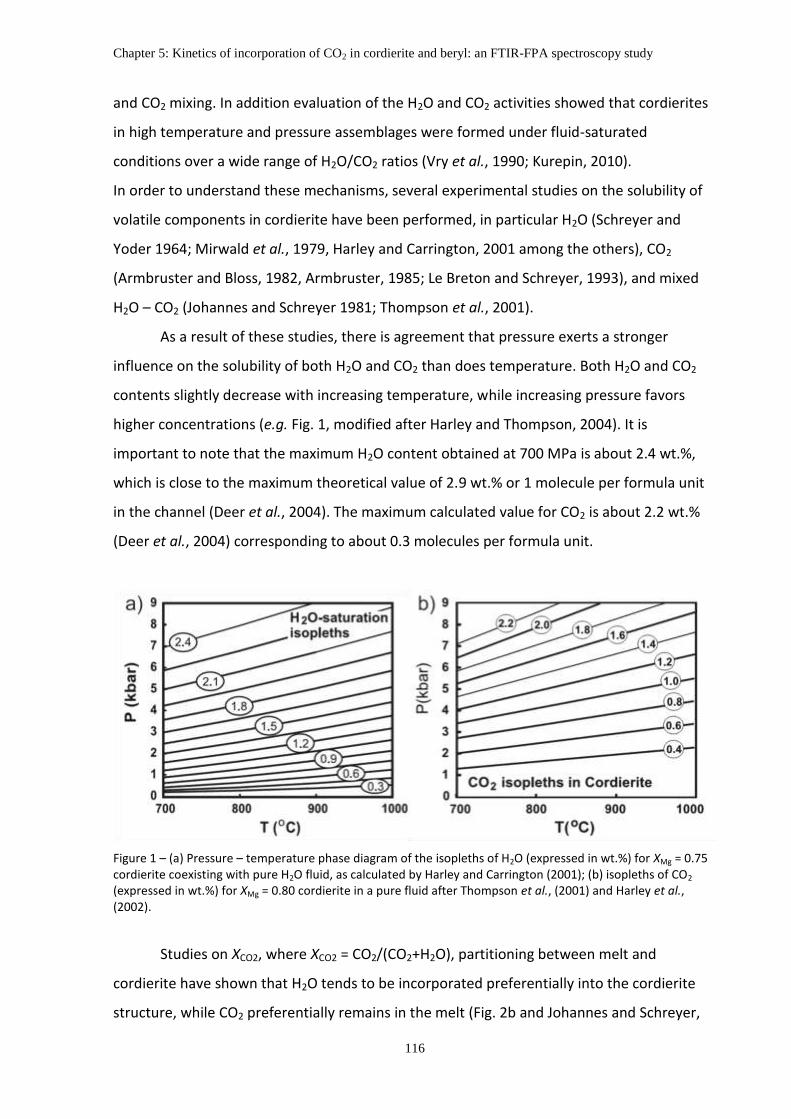
Chapter 5: Kinetics of incorporation of CO2 in cordierite and beryl: an FTIR-FPA spectroscopy study
116
and CO2 mixing. In addition evaluation of the H2O and CO2 activities showed that cordierites
in high temperature and pressure assemblages were formed under fluid-saturated
conditions over a wide range of H2O/CO2 ratios (Vry et al., 1990; Kurepin, 2010).
In order to understand these mechanisms, several experimental studies on the solubility of
volatile components in cordierite have been performed, in particular H2O (Schreyer and
Yoder 1964; Mirwald et al., 1979, Harley and Carrington, 2001 among the others), CO2
(Armbruster and Bloss, 1982, Armbruster, 1985; Le Breton and Schreyer, 1993), and mixed
H2O – CO2 (Johannes and Schreyer 1981; Thompson et al., 2001).
As a result of these studies, there is agreement that pressure exerts a stronger
influence on the solubility of both H2O and CO2 than does temperature. Both H2O and CO2
contents slightly decrease with increasing temperature, while increasing pressure favors
higher concentrations (e.g. Fig. 1, modified after Harley and Thompson, 2004). It is
important to note that the maximum H2O content obtained at 700 MPa is about 2.4 wt.%,
which is close to the maximum theoretical value of 2.9 wt.% or 1 molecule per formula unit
in the channel (Deer et al., 2004). The maximum calculated value for CO2 is about 2.2 wt.%
(Deer et al., 2004) corresponding to about 0.3 molecules per formula unit.
Figure 1 – (a) Pressure – temperature phase diagram of the isopleths of H2O (expressed in wt.%) for XMg = 0.75 cordierite coexisting with pure H2O fluid, as calculated by Harley and Carrington (2001); (b) isopleths of CO2 (expressed in wt.%) for XMg = 0.80 cordierite in a pure fluid after Thompson et al., (2001) and Harley et al., (2002).
Studies on XCO2, where XCO2 = CO2/(CO2+H2O), partitioning between melt and
cordierite have shown that H2O tends to be incorporated preferentially into the cordierite
structure, while CO2 preferentially remains in the melt (Fig. 2b and Johannes and Schreyer,

Chapter 5: Kinetics of incorporation of CO2 in cordierite and beryl: an FTIR-FPA spectroscopy study
117
1981). This behavior is only slightly changed at higher temperatures (Harley and Carrington,
2001), while XCO2 increases with increasing pressure, facilitating CO2 uptake (Johannes and
Schreyer, 1981). Moreover, increasing XCO2 decreases significantly the amount of H2O+CO2
diffused into the mineral. In particular, there is a decrease of H2O (Fig. 2a) probably because
the presence of CO2 obstructs its diffusion to the channel ways. This behavior, which is
observed also in natural samples (Vry et al., 1990), can be explained by the configuration of
the CO2 molecule inside the channels. Another factor that decreases the total amount of
diffused fluids is the alkali content within the structural channels (Johannes and Schreyer,
1981; Vry et al., 1990). There is evidence suggesting that CO2 (and possibly alkali cations)
may act as plugs in the channel ways obstructing inward and outward molecule diffusion,
drastically slowing down the time of degassing and re-equilibration in case of pressure drop
(Johannes and Schreyer, 1981; Kalt, 2000). This behavior complicates the possibility to
predict the diffused molecules coexisting with mixed H2O and CO2 fluids, although a
theoretical approach has been attempted by Kurepin (2010).
Figure 2 (a) variation of the volatile composition in cordierite (XMg = 0.68) channels with fluid-saturated, intermediate H2O - CO2 fluid composition. The lines show the calculated values at Thompson et al. (2001). Squares = H2O, triangles = CO2, circles = total number of molecules per formula unit (modified after Thompson et al., 2001). (b) partition curves showing XCO2 fractioning between cordierite and coexisting fluid at 500 MPa and 600°C fort two different synthetic cordierites A and B (modified after Johannes and Schreyer, 1981).
The experiments were performed with small cordierite grains as starting materials
(about 200 µm in Armbruster and Bloss, 1982 and Armbruster, 1985; 125-250 µm in
Thompson et al., 2001) in order to maximize the surface-to-volume ratio, and were carried
out for a long duration (up to a few weeks) in order to achieve fluid/mineral equilibration.
However there is still no agreement on the results, among the different authors. For
Chapter 5: Kinetics of incorporation of CO2 in cordierite and beryl: an FTIR-FPA spectroscopy study
118
instance, Johannes and Schreyer (1981) obtained different results as a function of different
starting material (Fig. 2b) or grain size of cordierite, and Le Breton and Schreyer (1993)
observed a nonlinear behavior of the CO2 contents between 15 minutes to 3 weeks
experimental runs. Major problems arise with CO2 diffusion, because its “sluggish” nature
delays or even prevents sample saturation. Thus, the study of the run products cannot be
addressed by conventional bulk methods, such as coulometric titration (Armbruster and
Bloss, 1982; Johannes and Schreyer, 1981) or powder FTIR spectroscopy (Vry et al., 1990) or
single spot micro-analytical techniques, such as SIMS (secondary ion mass spectrometry)
(Thompson et al., 2001), which do not allow characterizing the inhomogeneous distribution
of the target element.
The aim of this work is to examine the interaction of cordierite single grains with a
CO2–rich fluid under different experimental P, T and t conditions and to determine the
diffusion behavior of CO2 within the crystals at controlled P-T conditions. In particular, we
performed several short duration experiments on relatively large samples (max dimension 2
mm across) in order to observe the diffusion behavior of CO2 in the early stages of the
experiment. Along to cordierite, we investigated the behavior of isostructural beryl that is
also known to trap significant amounts of H2O and CO2 inside its channels (e.g. Wood and
Nassau, 1968). Differently from the used cordierite fragments, the beryl crystals had a
perfect prismatic hexagonal habit that make easier the orientation of the crystal recovered
after the run, and to evaluate the anisotropy of diffusion coefficients. Based on previous
literature data, we expected neither saturation nor sample homogenization with respect the
CO2 content. Therefore we made extensive use of FPA imaging to preliminarily characterize
the run products and to locate the single-spot analyses for quantitative measurements.
Recent works on cordierite (Della Ventura et al., 2009, 2012) and other microporous
minerals of the haüyine-sodalite group (Bellatreccia et al., 2009) or feldspathoids such as
leucite (Della Ventura et al., 2008) have shown that FTIR-imaging is crucial when dealing with
volatile or channel constituents which may be strongly zoned across the samples. Moreover,
several experimental studies (e.g. Zhang et al., 2006; Watson and Baxter, 2007) have shown
that growth imperfections and/or stress induced deformations may lead to preferential
“fast–paths” complicating the diffusion behavior across apparently homogeneous crystals.

Chapter 5: Kinetics of incorporation of CO2 in cordierite and beryl: an FTIR-FPA spectroscopy study
119
1.1 Cordierite and beryl: structural details
Cordierite is a framework alumino silicate with the ideal formula
(□,Na)(Mg,Fe)2Al4Si5O18(□,H2O,CO2) and a continuous solid solution between the Mg2+ end-
member and the Fe2+ end-member (sekaninaite) exists (e.g. Černý et al., 1997, Radica et al.,
2013). The cordierite framework can be described as a stacking of pseudo-hexagonal Si/Al
layers of tetrahedra and mixed layers of tetrahedra and octahedra (Fig. 3a). Alkali cations
such as Na, K, Ca, and molecules such as H2O and CO2 may be allotted within the resulting
pseudo-hexagonal channel, occupying sites on the c axis at the height of the narrow “bottle
necks” for Na, and of the large cavities for H2O and CO2 (Gibbs, 1966, Hochella et al., 1979;
Malcherek et al., 2001; Yakubovich et al., 2004).
Figure 3 - Schematic view of a portion of the cordierite (a) and beryl (b) structures emphasizing the channels parallel the c axis. Si-containing tetrahedra are shown in blue, Al in tetrahedral and octahedral coordination is shown in orange, Be- containing distorted tetrahedra in dark gray and Mg-octahedra in dark green. The structural position of the channel alkali cations, both orientation types of H2O and CO2 are shown (modified after Radica et al., 2013)
Beryl (ideal formula (□,Na)Be3Al2Si6O18(□,H2O,CO2) is isostructural with cordierite
(Fig. 3b). Its framework is constituted by 6-fold Si-centered tetrahedral rings stacked along
the c axis. The hexagonal rings are interconnected parallel to [001] by distorted Be-centered
tetrahedra. Al occupies the octahedral sites (Gibbs et al., 1968). Beryl also has structural

Chapter 5: Kinetics of incorporation of CO2 in cordierite and beryl: an FTIR-FPA spectroscopy study
120
channels running along the c axis that can contain alkali cations and volatile molecules
(Wood and Nassau, 1968).
Extra-framework H2O groups occur in the structural channels with the molecular
plane parallel to (100). In both cordierite and beryl H2O can be oriented in two different
ways: type I H2O (hereafter H2O[I]) has its H–H vector oriented parallel to the c axis, and type
II H2O (H2O[II]) has its H–H vector normal to the c axis (parallel to the b axis in cordierite). H2O
groups of the latter type are locally associated with channel cations (Goldmann et al., 1977;
Hawthorne and Černý, 1977). Winkler et al. (1994) proposed that H2O[I] in synthetic Mg-
cordierite is rotationally disordered about [001] and that a purely static description is
inappropriate to describe its behavior in the channel cavity. They proposed a model whereby
the H...H vector remains parallel to [001] and the H2O molecule rotates in two different
positions about its center of mass with an estimated hopping time of about 6 picoseconds at
room temperature; this feature however cannot be observed by using FTIR spectroscopy.
The linear CO2 molecules are systematically oriented normal to the c axis and parallel to the
crystallographic a axis for cordierite (Aines and Rossman, 1984;Kolesov and Geiger, 2000;
Khomenko and Langer, 2005).
The molecular dimension of H2O is 2.8 X 3.2 X 3.7 Å and CO2 is 2.8 X 2.8 X 5.0 Å
(Wood and Nassau, 1968). However the CO2 molecule barely fits inside the cage, so once
inside it tends to be wedged to the structure behaving as a “plug” (Aines and Rosmann,
1984; Vry et al., 1990). On the opposite, the smaller H2O polar molecules are bonded to the
structure mainly by electrostatic interactions with the structural oxygens (H2O[I]) and alkali
cations (H2O[II]).
The maximum H2O and CO2 content in both cordierite and beryl is constrained by the
available space in the channels that corresponds roughly to 1 molecule per formula unit
(about 2.5 - 2.9 wt% of H2O or about 6.9 - 7.1 wt% of CO2; Deer et al., 2004). While the
theoretical maximum water content has been observed in nature for both minerals (2.90
wt%, in a cordierite-biotite gneiss: Fediuk, 1971; 2.68 wt.% in a pegmatite beryl: Erämetsä et
al., 1973), the highest CO2 contents so far recorded of only 1.97 wt. % (0.26 molecules p.f.u.)
was observed for a cordierite occurring in a granulite from Cauchon Lake (Vry et al., 1990).
Cordierites with high CO2 and CO are typically found in granulitic facies rocks, while in
amphibolite facies H2O specimens prevails (Zimmerman, 1981).

Chapter 5: Kinetics of incorporation of CO2 in cordierite and beryl: an FTIR-FPA spectroscopy study
121
2. Experimental and analytical procedure
2.1 Starting materials
Figure 4 - (left) Fragments of the cordierite sample RP 7344 from Karur, India and (right) a cluster of green synthetic beryls (photo courtesy of Roberto Pucci).
For the experiments described here, cordierite RP 7344 (Fig. 4 left) from Karur, Tamil
Nadu (India) were used as starting material; the crystals were provided by Mr. Renato
Pagano. The fragments are clear and inclusion-free, with a color from pale blue-violet with
yellow nuances, typical of its pleochroic nature. The sample composition, crystal-chemical
formula, cell parameters, density and optical properties of this sample can be found in Della
Ventura et. al. (2012) and are reported In Table 1 for simplicity. Chemical data collected over
three analytical points.
Fetot was considered as Fe2+ allotted in the octahedral sites. However we remark that
some Fe2+ can be also present in the tetrahedral site (Geiger et al., 2000). The chemical
formula, based on 18 oxygen atoms p.f.u. is Na0.08(Mg1.98Fe0.09)Al3.93Si5O18·0.51H2O·0.03CO2;
due to the very high magnesium number (XMg = 95.6%) the selected sample can be
considered as a Mg end-member of the Mg-Fe cordierite series. Untreated cordierite
presents significant H2O and very low CO2. Preliminary FTIR analysis confirmed an
homogeneous distribution of H2O and CO2 across the sample (Della Ventura et. al., 2012)
and showed that water is mostly present as H2O[II] because of the high Na contents in the
structural channels (Della Ventura et. al., 2012).

Chapter 5: Kinetics of incorporation of CO2 in cordierite and beryl: an FTIR-FPA spectroscopy study
122
Table 1 - Microchemical analysis, crystal-chemical formula, cell parameters, density and optical properties for the cordierite (from Della Ventura et. al., 2012) and beryl samples (from Bellatreccia et al., 2008) used for the experiments. The beryl density was recalculated on the basis of the composition and cell parameters. Crystal-chemical formulae were recalculated based on 18 oxygen atoms p.f.u. for cordierite and 36 oxygen atoms p.f.u. for beryl.
Cordierite St. Dev. Beryl St. Dev.
Chemical analysis (wt.%)
SiO2 49.65 0.05 SiO2 65.91 0.49
Al2O3 33.11 0.37 TiO2 0.04 0.05
MgO 13.20 0.25 Al2O3 18.80 0.23
FeO 1.06 0.10 Cr2O3 1.77 0.44
TiO2 0.02 0.04 MgO 0.02 0.02
MnO 0.01 0.00 FeO 0.02 0.02
CaO 0.02 0.02 ZnO 0.04 0.06
Na2O 0.43 0.04 BeO 13.95 0.06
K2O 0.01 0.01 Na2O 0.06 0.02
H2O 1.52 0.02 K2O 0.06 0.02
CO2 0.22 0.02 F 0.12 0.09
Total 99.25 Total 100.79 0.53
Crystal chemical formula (apfu)
Si 4.996 Si 11.802
Al 3.926 AlIV 0.198
Σ Tetrahedra 8.922 Be 6.000
Mg 1.979 Σ Tetrahedra 18.000
Fe 0.089 Ti 0.002
Ti 0.002 AlVI 3.770
Mn 0.001 Cr 0.252
Σ Octahedra 2.071 Mg 0.005
Ca 0.003 Fe 0.003
Na 0.084 Zn 0.005
K 0.001 Σ Octahedra 4.037
Σ Channels 0.087 Na 0.010
n(H2O) 0.510 K 0.012
m(CO2) 0.031 Σ Channels 0.022
Σ Volatiles 0.541 F 0.065
**H2O[II] 0.335
**H2O[I] 0.175
XcrdCO2 0.06
Cell parameters (Å) Cell parameters (Å)
a 17.020(1) a 9.2264(25)
b 9.751(1) c 9.1904(2)
c 9.380(1) c/a 0.9961
Densitiy (g/cm3) 2.577(1) Densitiy (g/cm3) 2.657(1)
Optic sign Negative Optic sign Negative
2Vx (°) 63.15(8)
Beryl samples are part of the very first Li2O and MoO3 flux-grown synthetic emeralds,
made by P.G. Hautefueille and A. Perrey in 1888 in Paris (Bellatreccia et al., 2008) and
currently kept in the mineralogical collection of the Muséum National d'Histoire Naturelle,
Paris. The crystals were obtained after 15 days of growth at 800°C, because higher
temperatures lead to formation of phenakite (Hautefeuille and Perrey, 1888, 1890). Beryl

Chapter 5: Kinetics of incorporation of CO2 in cordierite and beryl: an FTIR-FPA spectroscopy study
123
crystals show a perfect prismatic hexagonal habitus with a maximum length of 1 mm and
width of 0.5 mm (Bellatreccia et al., 2008).
Figure 5 – Crossed polarizers optical microscope picture of a 1 mm long and 0.2 mm wide, double-polished beryl slab (Pa_340 d bis). The dark part at the center of the grain consists of molybdenum inclusions (Bellatreccia et al., 2008). Tiny inclusions, remnants of the natural beryl seeds used for the synthesis are observable at the left side.
The used batch consists of fairly large (max. dimensions 1 mm X 0.5 mm) emerald-
green hexagonal prismatic beryls. Close examination of these samples reveals the presence
of tiny dark inclusions (EDS spectra indicates the presence of molybdenum, Bellatreccia et
al.. 2008) and beryl seeds within the grains (Fig. 5). Cracks may occasionally be present.
A crystal-chemical study for these beryls is reported in Bellatreccia et al. (2008) and
data are summarized in Table 1. Chemical data collected over six analytical points. The
crystal-chemical formula (Be calculated by stoichiometry) based on 36 oxygen atoms p.f.u. is
Na0.02K0.01(Al3.77Cr0.23)Be6Al0.18Si11.82O36·F0.12 (Bellatreccia et al., 2008). Octahedral Al was
calculated as: AlVI = Altot – AlIV where AlIV = 12 – Si (all elements in apfu), i.e. assuming that all
aluminum exceeding the amount needed to fill the tetrahedral rings is allotted to the
octahedral sites. The final composition is close to the stoichiometric composition except for
the Cr2O3 content which ranges from 1.45 to 2.95 wt.%, the Cr being responsible for the
characteristic emerald green color. The c/a ratio of 0.9961 (Bellatreccia et al., 2008) is typical

Chapter 5: Kinetics of incorporation of CO2 in cordierite and beryl: an FTIR-FPA spectroscopy study
124
of normal-type beryls (Aurisicchio et al., 1988) characterized by the substitution of Al3+ →
Me2+ at the octahedral site. Normal beryls usually compensates the charge unbalance with
alkali cations inside the structural channels and may show both type of water where the
H2O[II]/ H2O[I] ratio depends on the Na in the channels (Aurisicchio et al., 1994). Following the
classification proposed by Hawthorne and Černý (1977), the studied synthetic beryl may be
considered as “alkali-free beryl” (total alkali ≤ 0.1 Wt.%), with a composition similar to those
occurring inside vugs of predominantly graphic pegmatites and schlieren and pocket-type
bodies in granites.
As expected, preliminary FTIR single-crystal unpolarized spectra of untreated samples
showed no CO2 related absorptions at around 2360 cm-1, however small traces of H2O,
indicated by the weak absorptions at 3643 and 3587 cm-1, are present (Fig. 6).
Figure 6 - Unpolarized single-crystal FTIR spectrum of untreated beryl Pa340. The regions corresponding to the stretching vibrations modes of CO2 and H2O are indicated in brackets. No CO2 related absorptions at around 2360 cm
-1 are present. Small traces of H2O are indicated by the weak absorptions at 3643 and 3587 cm
-1.

Chapter 5: Kinetics of incorporation of CO2 in cordierite and beryl: an FTIR-FPA spectroscopy study
125
2.2 Experimental procedure
Several cordierite fragments with size ranging from 1.5 to 0.2 mm were separated
from a large single crystal. Before the experiments the fragments were blown through an
abrasive cylinder to remove sharp edges and then the grains were pre-treated at 1250 °C for
24 hour in order to remove all H2O and CO2 from the sample (Chapter 3). Grains showed no
evident variation in color or clarity, however cracking of larger grains occurred during the
heat-treatment.
The experiments were carried in 3 x 9 mm Pt capsules; silver carbonate was used as a
CO2 source to saturate the system with carbon dioxide during HT/HP treatment. As a matter
of fact Ag2CO3 decomposes according to the 2Ag2CO3 → 2Ag2O + 2CO2 reaction at 210 °C,
yielding a theoretical CO2 content ≈16 wt.%. Al2O3 powder (Al2O3 = 99.72 wt.%, SiO2 = 0.07
wt.%, others = 0.21 wt.%) was mixed in 1 to 1 ratio by wt. with Ag2CO3, and added to the
charge. The aluminum oxide powder was used to prevent the contact between the crystals
and the capsule walls after the silver carbonate disappearance due to its decomposition.
Layers of Ag2CO3/Al2O3 mix were alternated to layers of starting crystals (Fig. 7a). Explorative
runs were performed to check different setups (Tab. 2, experiments QP1-12, QP1-14 and
QP1-15); these trials lead to capsule failure. Capsules containing both beryl and cordierite or
exclusively beryl or cordierite (Tab. 2) were prepared; each capsule contained from 4 to 7
grains, for a total crystal weight of about 2 to 10 milligram of sample. All components used
to prepare the tubes were dried up at 110 °C in order to avoid water contamination. The
capsules were crimped and welded on both sides. After each run the capsule, if possible, was
pierced to check the presence of CO2 in excess.
Table 2 - Experimental conditions and set up.
Code
experiment
Set up Sample Mineral Temperature (°C) Pressure
(MPa)
Time Note
QP1-12 QP 25 Crd_pr 1 Cordierite 750 200 4 Al2O3 and Ag2CO3
not mixed
" QP 25 Crd_pr 2 Cordierite 750 200 4 “
" QP 25 Crd_pr 3 Cordierite 750 200 4 “
" QP 25 Crd_pr 4 Cordierite 750 200 4 Ag2CO3 only
QP1-13 QP 19-25 Crd_pr 5 Cordierite 900 200 24
QP1-14 QP 19-25 Crd_pr 6 Cordierite 900 200 42 Ag2CO3/Al2O3 =
2/1
QP1-15 QP 19-25 Crd_pr 7 Cordierite 900 250 4 Failed

Chapter 5: Kinetics of incorporation of CO2 in cordierite and beryl: an FTIR-FPA spectroscopy study
126
QP1-22 QP 19-25 Crd_pr 8 Cordierite 800 150 48
QP1-23 QP 19-25 Crd_pr 9 Cordierite 800 200 24
QP34-50 QP 19 Crd_pr 10 Cordierite 800 500 43
QP1-26 QP 25 Crd_pr 12 Cordierite 700 200 24
" QP 25 Pa_340 b Beryl 700 200 24
QP1-25 QP 25 Crd_pr 13 Cordierite 700 200 2
" QP 25 Pa_340 a Beryl 700 200 2
QP34-52 QP 19 Crd_pr 14 Cordierite 900 500 4<t<20
QP34-53 QP 19 Crd_pr 15 Cordierite 900 500 1
QP1-32 QP 19-25 Pa_340 c Beryl 900 220 24
QP34-55 QP 19 Crd_pr 16 Cordierite 700 500 24
QP34-56 QP 19 Crd_pr 17 Cordierite 900 500 24
QP34-59 QP 19 Crd_pr 18 Cordierite 800 350 24
QP34-60 QP 19 Crd_pr 19 Cordierite 800 500 24
QP34-57 QP 19 Pa_340 d Beryl 700 500 24
QP34-58 QP 19 Pa_340 e Beryl 900 500 24
QP1-45 QP 19-25 Pa_340 f Beryl 900 200 72
QP1-61 QP 19 Pa_340 g Beryl 900 500 24
QP1-67 QP 19 Crd_pr 20 Cordierite 800 500 48
QP1-49 QP 25 Crd_pr 22/Pa_340 h Cordierite/Beryl 800 200 20 Rerun
" QP 25 Crd_pr 25/Pa_340 k Cordierite/Beryl 800 200 20 Rerun
QP34-68 QP 19 Crd_pr 23/Pa_340 i Cordierite/Beryl 800 500 24
QP34-69 QP 19 Crd_pr 24/PA_340 J Cordierite/Beryl 800 500 24
QP34-70 QP 19 Crd_pr 29/Pa_340 o Cordierite/Beryl 800 700 10
QP34-71 QP 19 Crd_pr 27/Pa_340 m Cordierite/Beryl 800 700 48
QP1-53 QP 25 Crd_pr 26/Pa_340 l Cordierite/Beryl 800 200 24
" QP 25 Crd_pr 30/Pa_340 p Cordierite/Beryl 800 200 24
QP1-54 QP 19-25 Crd_pr 28/Pa_340 n Cordierite/Beryl 800 200 48
QP34-72 QP 19 Crd_pr 31/Pa_340 q Cordierite/Beryl 800 500 > 33
QP34-74 QP 19 Crd_pr 32/Pa_340 r Cordierite/Beryl 700 700 24
QP34-75 QP 19 Crd_pr 33/Pa_340 s Cordierite/Beryl 900 700 24
QP34-77 QP 19 Crd_pr 34/Pa_340 t Cordierite/Beryl 800 500 10
QP1-78 QP 19 Crd_pr 21 Cordierite 700 500 24
QP1-102 QP 19 Crd_pr 48/Pa_340 z Cordierite/Beryl 800 700 24
All experiments were performed using a non-end loaded piston cylinder apparatus
(QUICKpress™ design by Depths of the Earth Co.) at the HP-HT Laboratory of Experimental
Volcanology and Geophysics of Instituto Nazionale di Geofisica e Vulcanologia (INGV, Rome,
Italy). Experiments were conducted using two different set-ups (Tab. 2): experiments coded
QP34-xx were performed using a standard 19 mm assembly (Moore et al., 2008) with an
oxygen fugacity set at NNO +2 (Freda et al., 2008, Masotta et al., 2012a) and pressure
ranging from 300 to 800 MPa. Experiments coded QP1-xx in a 19-25 and 25 mm assemblies
with comparable oxygen fugacity and pressure ranging from 150 to 300 MPa; the 25 mm

Chapter 5: Kinetics of incorporation of CO2 in cordierite and beryl: an FTIR-FPA spectroscopy study
127
assembly may accommodate up to 4 samples in a single run (Fig. 7b, modified after Masotta
et al., 2012b). We used a NaCl-Pyrex-Graphite-crushable-MgO–pyrex assembly with capsule
surrounded by pyrex powder instead of pyrophyllite powder to avoid water infiltration.
Temperature was controlled using a factory calibrated C-type (W95Re5 – W74Re26)
thermocouple with a ±5 °C uncertainty (Holtz et al., 2001). Error on pressure of ±25 MPa is
associated with the piston cylinder NaCl calibration method (Baker, 2004, Masotta et al.,
2012b). Heating rates were set to 100 °C/min; the isobaric quenching rate ranged from 50
°C/s (25 mm assembly) to 100 °C/s (19 mm and 19-25 mm assembly) in the first 5 seconds
(Masotta et al., 2012b). Experiments were performed in the pressure range 200 – 700 MPa,
temperature range 700 – 900 °C; run duration varied from 1 to 72 hours.
Figure 7 – (a) Schematic section of the layered crystal/filler assemblage within the capsule, (b) schematic cross section a 19-25 mm and 25 mm furnace assemblies (modified after Masotta et al., 2012b).
2.3 Analytical methods
BSE-SEM images were collected at INGV using a field emission scanning electron
microscope (FE-SEM) Jeol 6500F equipped with an energy-dispersive (EDS) detector.
Samples were coated with Au before the analysis.
FTIR spectra were acquired using a Bruker™ Hyperion 3000 microscope equipped
with a KBr-Broadband beamsplitter and a liquid nitrogen-cooled MCT detector at Laboratori
Nazionali di Frascati-Istituto Nazionale di Fisica Nucleare (LNF-INFN,) Frascati (Rome).
Polarized spectra were collected using a gold-wire-grid FTIR polarizer on a ZnSe substrate.
The spot size was variable; a 15x objective and a conventional light source (Globar) was
employed, with a nominal resolution of 4 cm-1 averaging 128 scans for both spectrum and
background. The FTIR images were collected with the same device using a 64 x 64 pixel focal-
Chapter 5: Kinetics of incorporation of CO2 in cordierite and beryl: an FTIR-FPA spectroscopy study
128
plane array (FPA) of liquid nitrogen-cooled MCT detectors. Using a 15x objective, each image
covers an area of 170 µm x 170 µm with a nominal spatial resolution of ~5 µm (Della
Ventura et al., 2010, 2014). The nominal resolution was set at 4 cm−1 and 64 scans were
averaged for each spectrum and background.
For polarized IR measurements, the cordierite samples were oriented on (010) using
a polarizing microscope equipped with a spindle-stage; the program ExcalibrW (Bloss, 1981;
Gunter et al., 2005) was used to process the extinction data. Beryl samples were oriented
(hk0) using the external hexagonal prismatic morphology. The oriented fragments were
transferred to glass slides and doubly polished to thickness usually below 400 µm.
Sample thickness was checked using an electronic micrometer with ±5 µm
uncertainty and double checked using the interference fringes in the FTIR spectra, based on
the formula t = 1/*2∙n∙(ν1- ν2)] where t is sample thickness in cm, n = 1.535 is the refractive
index and (ν1- ν2) is the distance between two adjacent fringes in cm-1 (Pistorius and DeGrip,
2006). For some samples, thickness were also checked with a Leica DCM 3D optical
profilometer at the Laboratorio Interdipartimentale di Microscopia Elettronica (LIME),
Università Roma Tre. The nominal vertical resolution was less than 15 nm in confocal mode
(20X lens, NA = 0.50) and less than 4 nm in interferometric mode (50X lens, NA = 0.50);
sample thickness was averaged for the whole surface of the slab.
The CO2 content of run samples were calculated from polarized FTIR spectra using
the Beer-Lambert relationship, C = (A ∙ k) /(t ∙ D ∙ ε), where εi (l mol-1 cm-2) is the molar
absorption coefficient, C (wt.%) is the concentration of the target molecule, A is the
measured absorbance, t is the slab thickness in cm, D is the value of the sample density
(g/cm3) and k is a conversion factor needed to convert from wt% to mol·l-1; for CO2, k = 4.401
(Della Ventura et al., 2009, 2012). A was calculated as total integrated absorbance Ai (cm-1) =
Ax + Ay + Az for trimetric cordierite and Ai (cm-1) = 2Ax + Az, for dimetric beryl, where Ax, Ay
and Az are the integrated absorptions along each polarization direction (Libowitzky and
Rossman, 1996). The peak areas were obtained for each component using the data
calculation routine built in the spectrometer software; the background was modeled as
linear. Using this method, it is possible to quantify even few ppm of CO2 in the channels
(Della Ventura et al., 2009). Integrated absorbance values were obtained for the principal ν3
anti-symmetric stretching modes of CO2 (Fig. 8) at 2348 cm-1 polarized for E//a for cordierite
(Della Ventura et al., 2009) and at 2360 cm-1 polarized for Ec for beryl (Charoy et al., 1996).
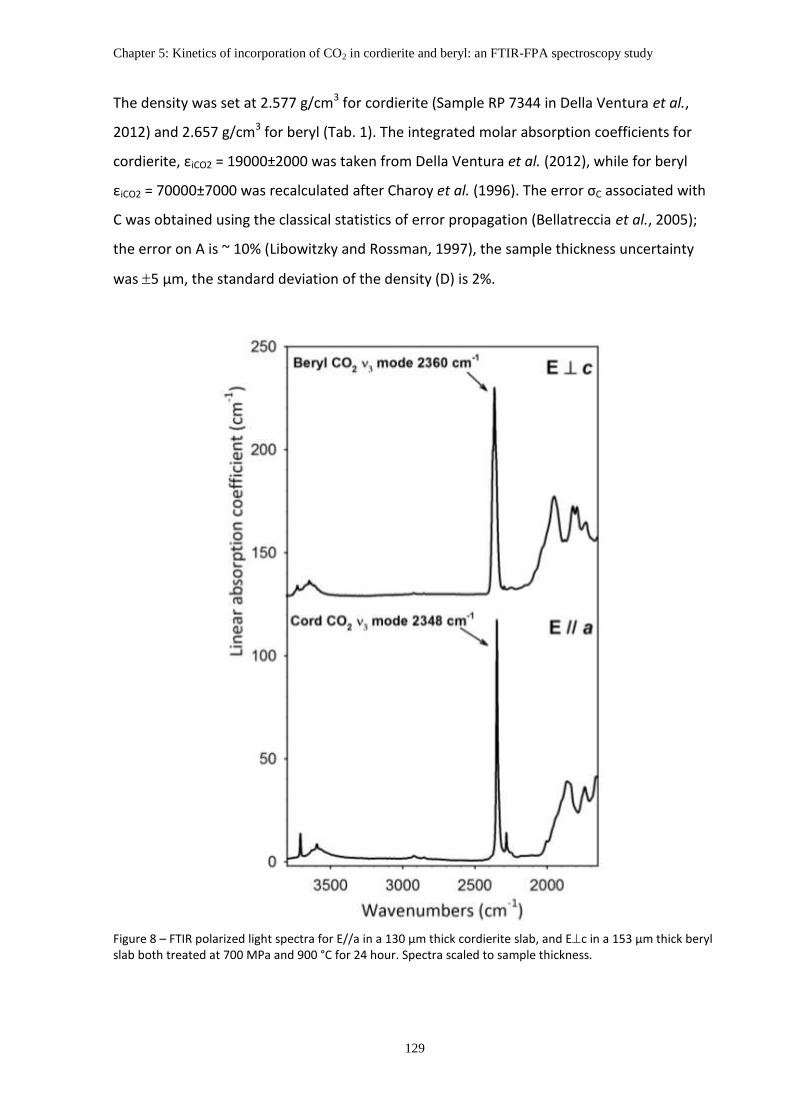
Chapter 5: Kinetics of incorporation of CO2 in cordierite and beryl: an FTIR-FPA spectroscopy study
129
The density was set at 2.577 g/cm3 for cordierite (Sample RP 7344 in Della Ventura et al.,
2012) and 2.657 g/cm3 for beryl (Tab. 1). The integrated molar absorption coefficients for
cordierite, εiCO2 = 19000±2000 was taken from Della Ventura et al. (2012), while for beryl
εiCO2 = 70000±7000 was recalculated after Charoy et al. (1996). The error σC associated with
C was obtained using the classical statistics of error propagation (Bellatreccia et al., 2005);
the error on A is ~ 10% (Libowitzky and Rossman, 1997), the sample thickness uncertainty
was 5 µm, the standard deviation of the density (D) is 2%.
Figure 8 – FTIR polarized light spectra for E//a in a 130 µm thick cordierite slab, and Ec in a 153 µm thick beryl slab both treated at 700 MPa and 900 °C for 24 hour. Spectra scaled to sample thickness.
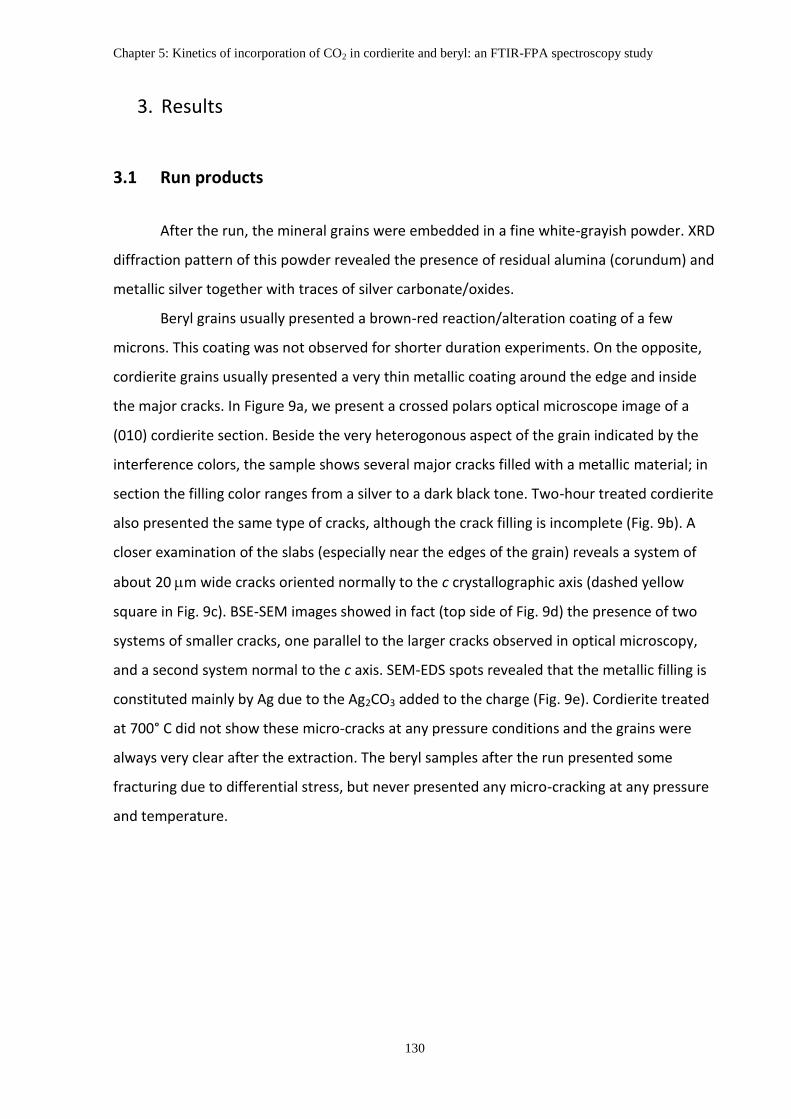
Chapter 5: Kinetics of incorporation of CO2 in cordierite and beryl: an FTIR-FPA spectroscopy study
130
3. Results
3.1 Run products
After the run, the mineral grains were embedded in a fine white-grayish powder. XRD
diffraction pattern of this powder revealed the presence of residual alumina (corundum) and
metallic silver together with traces of silver carbonate/oxides.
Beryl grains usually presented a brown-red reaction/alteration coating of a few
microns. This coating was not observed for shorter duration experiments. On the opposite,
cordierite grains usually presented a very thin metallic coating around the edge and inside
the major cracks. In Figure 9a, we present a crossed polars optical microscope image of a
(010) cordierite section. Beside the very heterogonous aspect of the grain indicated by the
interference colors, the sample shows several major cracks filled with a metallic material; in
section the filling color ranges from a silver to a dark black tone. Two-hour treated cordierite
also presented the same type of cracks, although the crack filling is incomplete (Fig. 9b). A
closer examination of the slabs (especially near the edges of the grain) reveals a system of
about 20 m wide cracks oriented normally to the c crystallographic axis (dashed yellow
square in Fig. 9c). BSE-SEM images showed in fact (top side of Fig. 9d) the presence of two
systems of smaller cracks, one parallel to the larger cracks observed in optical microscopy,
and a second system normal to the c axis. SEM-EDS spots revealed that the metallic filling is
constituted mainly by Ag due to the Ag2CO3 added to the charge (Fig. 9e). Cordierite treated
at 700° C did not show these micro-cracks at any pressure conditions and the grains were
always very clear after the extraction. The beryl samples after the run presented some
fracturing due to differential stress, but never presented any micro-cracking at any pressure
and temperature.

Chapter 5: Kinetics of incorporation of CO2 in cordierite and beryl: an FTIR-FPA spectroscopy study
131
Figure 9 – (a) Crossed polars light (XPL) picture of a (010) 130 µm thick cordierite slab (Crd_pr 33, 700 Mpa, 900° C, 24 hours): in the top part of the sample there is a large brown area corresponding to a crack completely filled with silver/silver carbonate particles. (b) XPL picture of a (010) 127 µm thick cordierite slab (Crd_pr 13, 200 Mpa, 700° C, 2 hours): the highlighted area corresponds to a crack partially filled by Ag probably due to the short duration of the experiment. (c) XPL picture of a (010) 292 µm thick cordierite slab (Crd_pr 18, 350 Mpa, 800° C, 24 hours): the sample presents diffuse small cracks perpendicular to the c crystallographic direction (dashed yellow square). (d) BSE-SEM image of a (010) 110 µm thick cordierite slab (Crd_pr 5, 200 Mpa, 900° C, 24 hours showing additional systems of cracks 2 µm wide, perpendicular and parallel to the c axis, respectively (dashed yellow square). EDS spectra of (e) spot 1 (crack) and (f) spot 2 (cordierite) indicated in Figure 9d.

Chapter 5: Kinetics of incorporation of CO2 in cordierite and beryl: an FTIR-FPA spectroscopy study
132
The formation of these systems of micro-fractures may be due to the different response of
beryl and cordierite to thermal shocks. Hochella and Brown (1986) observed that, during
heating, the channel structure of cordierite contracts along the c axis due to a twisting of the
tetrahedral framework, partially driven by the octahedral site expansion along the a and b
axis (see also Khosrovani and Sleight, 1999). This mechanism is enhanced for high XMg, as it is
the case of the samples studied here (Tab. 1 and solid line in Fig. 10a). On the opposite, the
thermal expansion of the Be tetrahedra and Al octahedra in beryl is less pronounced than in
cordierite, and this prevents the shortening along the c axis. Indeed Morosin (1972)
observed that a small degree of Cr3+ → Al3+ substitution, as in emeralds, causes expansion in
both a and c axis (dashed line Fig. 10b).
Figure 10 – Selected thermal expansion curves for cordierite and indialite (a), and for beryl and emerald (b) (from Hochella and Brown, 1986). The White Well cordierite (Fig 10a, solid lines) is a natural almost Mg end-member containing alkali cations in the channels with a composition similar to our starting sample. The gem quality beryl curve (Fig 10b, dashed lines) contains small amounts of Cr.
The set of fractures parallel to the c crystallographic direction along the (010) and (100)
cleavage planes may be due to the thermal expansion along the a and b crystallographic
directions. On the other hand, the set of micro-cracks oriented normal to the c
crystallographic axis may be caused by the local stress caused by contraction along the c
axis. When this stress overrides the lattice strength, probably for T > 700 °C, an extension
fracture occurs along the (001) cleavage plain (Coulomb, 1776). The presence of cracking is
random, and is not preferentially related to specific T or P conditions. This process may be
favored by the fluid circulation inside the cracks; in our case, the fluid circulation is
witnessed by the silver carbonate filling the voids. This is a notable point to consider: the fact
that the cracks are filled by Ag indicates that they developed during the experiment, and not

Chapter 5: Kinetics of incorporation of CO2 in cordierite and beryl: an FTIR-FPA spectroscopy study
133
as a consequence of the decompression at the end of the run. One may argue that in such a
case the cracks could have provided a favorable path for the CO2 diffusion across the sample.
However, considering that the fractures are all filled by Ag, we consider this possibility as
unlikely. In addition, we note that only cordierite is affected by this phenomenon, while
beryl did not show any evidence of cracking. In the following, the diffusion coefficients that
will be discussed were obtained mostly on the beryl samples.
3.2 CO2 diffusion in cordierite and beryl: preliminary considerations
The main problem in experimental studies on CO2 (as well as H2O) diffusion in
minerals is the difficulty to quantify the amount of carbon dioxide (and hydrogen) but also
its distribution within the matrix. Carbon can be quantitatively analyzed only using SIMS;
besides the non-easy access to this facility, few SIMS laboratories are equipped to work with
this element, the analysis of which requires non-conventional cautions and standardization.
In addition, as already shown by Della Ventura et al. (2009, 2012) and Bellatreccia et al.
(2009) in microporous minerals, CO2 is frequently zoned, and the lack of the zoning patterns
may significantly alter the data and their interpretation. Preliminary FTIR-FPA imaging for
CO2 revealed an extreme heterogeneity in carbon dioxide concentrations across the crystals,
thus each sample was carefully examined by FPA to locate the area suitable for analytical
spots (Fig. 11).
Selected FPA images are given in Figure 11. The interpretation of those relative to
beryl (Fig 11c, 11d) is much easier due to the well-developed morphology of the samples; it
is evident that the CO2 diffusion proceeds exclusively from the basal (001) pinacoids through
the crystal, following the structural channel. A similarly observation was reported by Fukuda
et al. (2009) for H2O diffusion in beryl. For cordierite, due to the strongly irregular shape of
the grains, the interpretation of the images given in Figures 11a and 11b is less
straightforward. Considering that cordierite is isostructural with beryl, however, it is likely
that also in this case the CO2 diffusion proceeds along the channels parallel to the c
crystallographic direction (see also Chapter 3). Figure 11b, in particular, shows the strong
enhancement of the CO2 diffusion along a cracks well evident in the center of the grain. An
additional source of uncertainty, for cordierite, is the fact that, under high T and PH2O
conditions, it has the strong tendency to give reaction rims (e.g. Deer et al., 2004) typically
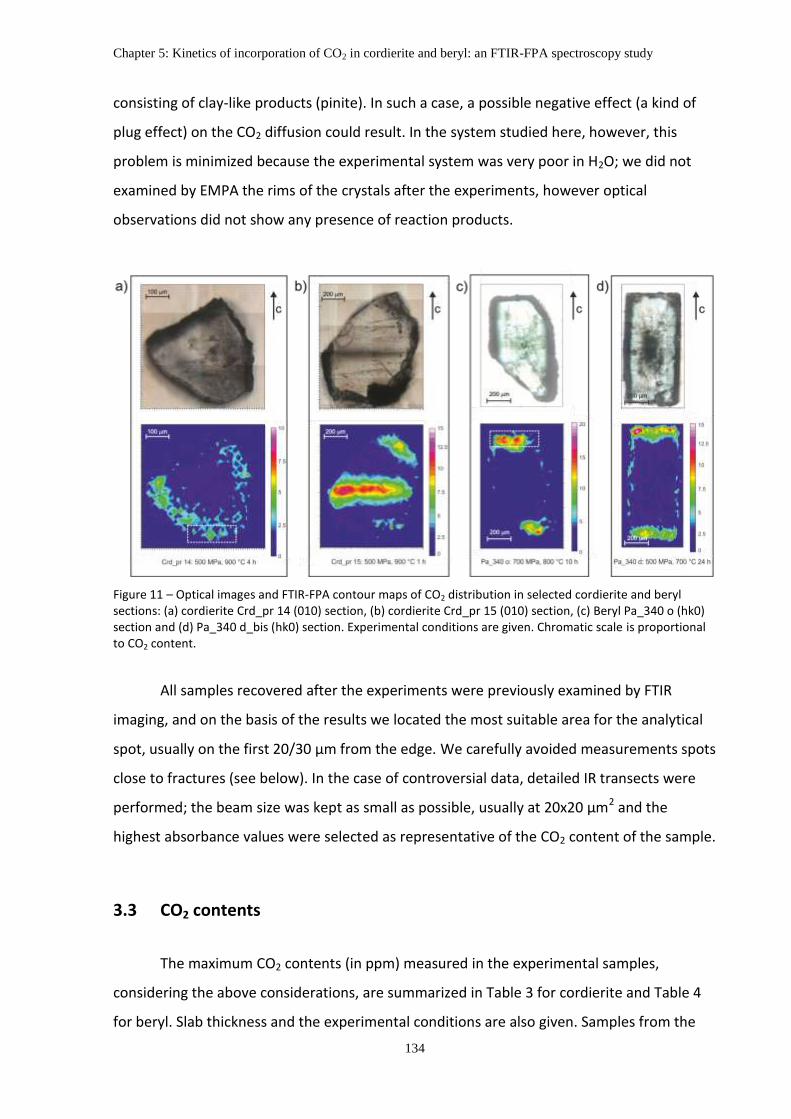
Chapter 5: Kinetics of incorporation of CO2 in cordierite and beryl: an FTIR-FPA spectroscopy study
134
consisting of clay-like products (pinite). In such a case, a possible negative effect (a kind of
plug effect) on the CO2 diffusion could result. In the system studied here, however, this
problem is minimized because the experimental system was very poor in H2O; we did not
examined by EMPA the rims of the crystals after the experiments, however optical
observations did not show any presence of reaction products.
Figure 11 – Optical images and FTIR-FPA contour maps of CO2 distribution in selected cordierite and beryl sections: (a) cordierite Crd_pr 14 (010) section, (b) cordierite Crd_pr 15 (010) section, (c) Beryl Pa_340 o (hk0) section and (d) Pa_340 d_bis (hk0) section. Experimental conditions are given. Chromatic scale is proportional to CO2 content.
All samples recovered after the experiments were previously examined by FTIR
imaging, and on the basis of the results we located the most suitable area for the analytical
spot, usually on the first 20/30 µm from the edge. We carefully avoided measurements spots
close to fractures (see below). In the case of controversial data, detailed IR transects were
performed; the beam size was kept as small as possible, usually at 20x20 µm2 and the
highest absorbance values were selected as representative of the CO2 content of the sample.
3.3 CO2 contents
The maximum CO2 contents (in ppm) measured in the experimental samples,
considering the above considerations, are summarized in Table 3 for cordierite and Table 4
for beryl. Slab thickness and the experimental conditions are also given. Samples from the

Chapter 5: Kinetics of incorporation of CO2 in cordierite and beryl: an FTIR-FPA spectroscopy study
135
same capsule prepared multiple times are indicated with brackets. Measurements indicated
with F were performed on fractures in order to compare the fracture contents with those at
the grain edges. The presence of brown-red coating (RC) in beryls and Ag crack filling (HF, SF)
in cordierite is also reported. Failed capsule featuring pale white solid filling are indicated
with WM.
Table 3 – CO2 contents (in ppm) obtained for the studied cordierites. Integration range 2300-2400 cm-1
, εi=19000±2000. Sample thickness estimated standard error (ESE) is reported in brackets. Sample thicknesses with ESE = ±5 µm were obtained using an electronic micrometer, sample thicknesses with ESE < ±5 µm were obtained using the optical profilometer. F = analytical spot on fracture, HF = Heavy filled cracks , SF = Slightly filled cracks, WM = White solid mass, 1 = grain with diffuse fracturing, 2 = calculation performed on unpolarized FTIR spectrum.
Sample Thickness Pressure (MPa) Temperature (°C) Time (h) Maximum
measured CO2
concentration
(ppm)
σConcentration
CO2(ppm)
Note
Crd_pr 5 153 (5) 200 900 24 316 49 HF
Crd_pr 8 152 (5) 200 800 48 237 36 SF
Crd_pr 12 (F) 171 (5) 200 700 24 388 59 SF, F
Crd_pr 12 171 (5) 200 700 24 146 22 SS
Crd_pr 13 127 (5) 200 700 2 142 22
Crd_pr 14 110 (5) 500 900 4<t<20 334 52 SF
Crd_pr 15 241 (5) 500 900 1 111 17
Crd_pr 15 (F) 241 (5) 500 900 1 1455 221 F
Crd_pr 16 196 (5) 500 700 24 187 28 SF
Crd_pr 17 224 (1) 500 900 24 405 61 HF
Crd_pr 18 (F) 292 (2) 350 800 24 476 72 SF, F
Crd_pr 18 292 (5) 350 800 24 268 40 SF
Crd_pr 19 (F) 324 (1) 500 800 24 928 139 SF, F
Crd_pr 19 324 (1) 500 800 24 307 46 SF
Crd_pr 20 84 (5) 500 800 48 405 65 HF
Crd_pr 22 (F) 185 (5) 200 800 20 1346 205 1, WM
Crd_pr 25 (F) 237 (5) 200 800 20 1017 154 1
Crd_pr 23 (F) 140 (5) 500 800 24 936 145 HF, F
Crd_pr 23 140 (5) 500 800 24 425 66 HF
Crd_pr 24 90 (5) 500 800 24 418 67 HF
Crd_pr 29 (F) 175 (5) 700 800 10 2419 370 SF, F
Crd_pr 29 175 (5) 700 800 10 939 144 SF
Crd_pr 27 99 (5) 700 800 48 308 49 WM
Crd_pr 26 81 (5) 200 800 24 158 26 WM
Crd_pr 30 198 (5) 200 800 24 285 43 HF
Crd_pr 28 160 (5) 200 800 48 364 56 WM
Crd_pr 31 (bis) 75 (5) 500 800 > 33 4449 731 F, WM
Crd_pr 32 (bis) 53 (5) 700 700 24 1022 181
Crd_pr 33 130 (5) 700 900 24 1622 252 HF

Chapter 5: Kinetics of incorporation of CO2 in cordierite and beryl: an FTIR-FPA spectroscopy study
136
Crd_pr 33 (F) 130 (5) 700 900 24 2834 440 HF, F
Crd_pr 34 95 (5) 500 800 10 438 70 SF
Crd_pr 34 (F) 95 (5) 500 800 10 2102 335 SF, F
Crd_pr 48 108 (5) 700 800 24 885 139 HF
Crd_pr 48 (F) 108 (5) 700 800 24 2766 435 HF, F
Crd_pr 21 88 (5) 500 700 24 183 29 SF
Table 4 –CO2 content (in ppm) measured for the studied beryl samples. Integration range 2300-2406 cm-1
, εi=70000±7000. Estimated standard error (ESE) on sample thickness is reported in brackets. Sample thicknesses with ESE = ±5 µm were obtained using an electronic micrometer, sample thicknesses with ESE < ±5 µm were obtained using the optical profilometer. F = analytical spot on fracture, RC = Reddish Coating, WM = White solid mass, 1 = eroded grain edge.
Sample name Thickness (µm) Pressure (MPa) Temperature (°C) Time (h) Maximum
measured CO2
concentration
(ppm)
σConcentration
CO2(ppm)
Note
Pa_340 a 243.2 (0.6) 200 700 2 65 9
Pa_340 b 194.5 (0.7) 200 700 24 82 12
Pa_340 c (340) 92 (2) 200 900 24 69 10
Pa_340 c (88) 101.2 (0.4) 200 900 24 72 11
Pa_340 c (380) 380 (5) 200 900 24 80 12
Pa_340 d (bis) 125 (5) 500 700 24 699 106 RC
Pa_340 e (bis) 101 (1) 500 900 24 829 122 RC
Pa_340 f 252 (5) 200 900 72 89 13
Pa_340 g (bis) 77 (5) 500 900 24 1434 211 F
Pa_340 h 240 (5) 200 800 20 nd nd WM
Pa_340 k 248 (5) 200 800 20 527 78 RC, F
Pa_340 i (bis) 89 (5) 500 800 24 1046 164 F
Pa_340 j 220 (5) 500 800 24 679 101
Pa_340 o 188 (5) 700 800 10 1071 159 RC
Pa_340 m 147 (5) 700 800 48 nd nd WM
Pa_340 l 68 (5) 200 800 24 nd nd WM
Pa_340 p 241 (5) 200 800 24 176 26 RC
Pa_340 n (bis) 180 (5) 200 800 48 nd nd WM
Pa_340 q 180 (5) 500 800 > 33 nd nd WM
Pa_340 t 118 (5) 500 800 10 1320 201 F
Pa_340 t (bis) 152 (5) 500 800 10 515 77 RC
Pa_340 s 106 (5) 700 900 24 2489 383 RC, F
Pa_340 s (bis) 101 (5) 700 900 24 1531 237 RC
Pa_340 r 107 (5) 700 700 24 1795 276
Pa_340 z 125 (5) 700 800 24 1211 184 RC
CO2 concentration measured for the 24 hour experiment for both cordierite and beryl
are plotted in Figure 12 as a function of temperature (a and c) and as a function of pressure
(b and d).
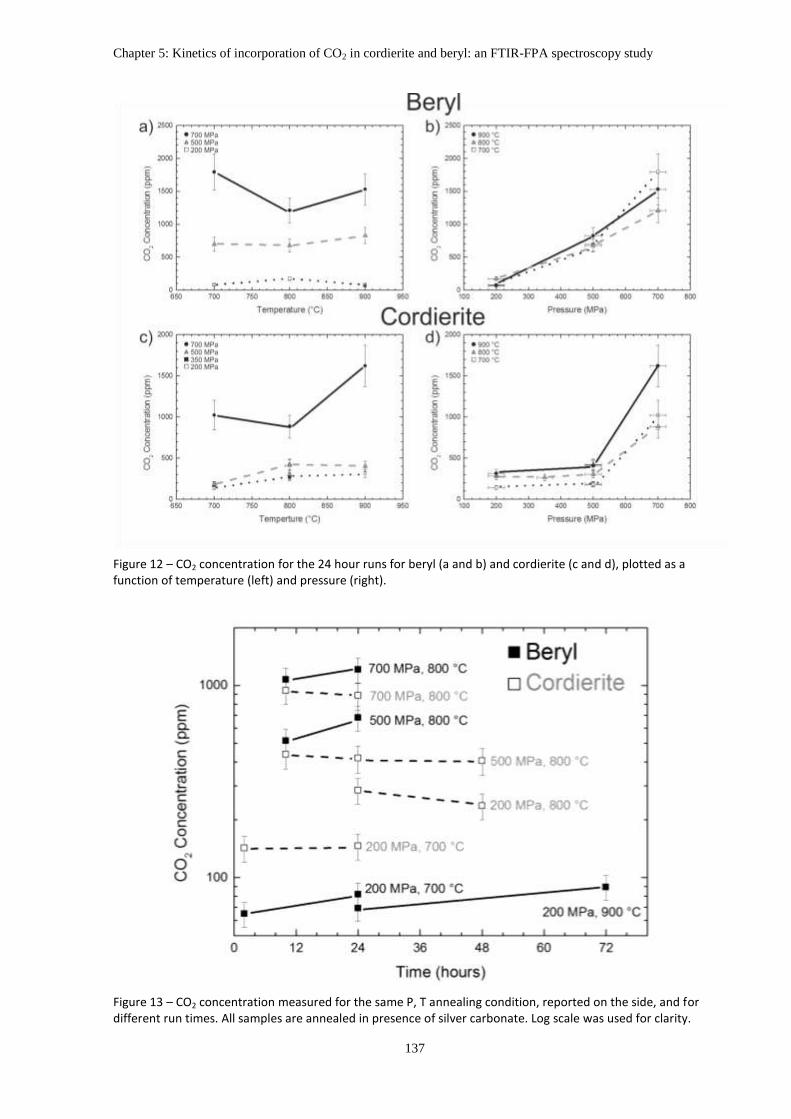
Chapter 5: Kinetics of incorporation of CO2 in cordierite and beryl: an FTIR-FPA spectroscopy study
137
Figure 12 – CO2 concentration for the 24 hour runs for beryl (a and b) and cordierite (c and d), plotted as a function of temperature (left) and pressure (right).
Figure 13 – CO2 concentration measured for the same P, T annealing condition, reported on the side, and for different run times. All samples are annealed in presence of silver carbonate. Log scale was used for clarity.

Chapter 5: Kinetics of incorporation of CO2 in cordierite and beryl: an FTIR-FPA spectroscopy study
138
Inspection of Figure 12 shows that T plays only a minor role on the CO2 solubility for
both cordierite and beryl. Major variations are observed with pressure. In particular, beryl
shows a steep increase in CO2 content from 200 MPa to 500 MPa and from 500 MPa to 700
MPa. The CO2 contents in cordierite, on the other side, show only a smaller increase from
200 MPa to 500 MPa, than from 500 MPa to 700 MPa.
Figure 13, shows the effect of the annealing time on the CO2 amount incorporated in
cordierite and beryl. The logarithmic scale was chosen for clarity. Longer duration
experiments had only a slight effect on the amount of CO2. At least over the first 72 hours all
samples treated with different run times present a concentration variable within the error
bars.
4. Diffusion coefficients of CO2 for cordierite and beryl
The early work on diffusive mass transport was undertaken at the end of the 19th
century by the German physiologist Adolf Fick (Zhang and Cherniak, 2010), who related the
diffusive mass flux (J) to the variation of the concentration of a component (C) in space (x)
times the negative of a diffusion coefficient (D) (Fick’s first law 𝐽 = −𝐷(𝜕𝐶 𝜕𝑥) ). However
in diffusion studies, it is often necessary to determine how a concentration profile evolves
with time given the initial concentration distribution. For this purpose it is necessary to
describe how the concentration is related to both space and time (t), i.e. the C(x,t) function,
which is expressed by the Fick's second law of diffusion: 𝜕𝐶 𝜕𝑡 = 𝐷 𝜕2𝐶 𝜕𝐶2 .
Diffusion is a temperature-dependent phenomenon, where the increased kinetic
energy associated with higher temperature improves atoms mobility. In the site-jumping
model, the diffusivity (D) is proportional to the jump frequency (Zhang and Cherniak, 2010),
and varies with T-1 in log-linear fashion. The diffusivity of a given species in a particular
medium is described by the Arrhenius equation:
𝐷 = 𝐷0 × exp −𝐸𝑎
𝑅𝑇
where D is the diffusion coefficient, D0 the pre-exponential factor, Ea the activation energy,
which is the amount of energy required for a particle to overcome the potential barrier

Chapter 5: Kinetics of incorporation of CO2 in cordierite and beryl: an FTIR-FPA spectroscopy study
139
between its equilibrium position and an adjacent one. R is the ideal gas constant, and T is
the absolute temperature in K. The parameters Ea and D0 are derived from the Arrhenius
plot relating log(D) vs 1/T, in which the diffusion coefficients plot on a straight line described
by:
log 𝐷 = log 𝐷0 − 𝐸𝑎/𝑅 ∙ ln(10) ∙ 1/𝑇
The activation energy Ea is calculated from the slope of the line and D0 is the
intercept on the ordinate axis.
As shown above, both structural considerations and our FTIR imaging clearly shows
that the diffusion proceeds from the (001) crystal face into the grain. In order to obtain the
diffusion coefficient (D), the CO2 concentration profiles (Fig. 14) were fitted by a simple
mono dimensional diffusion equation (Crank, 1975, Zhang and Cherniak, 2010):
𝐶 = 𝐶0 ∙ 𝑒𝑟𝑓𝑐 𝑥
2 𝐷𝑡
where C is the concentration at depth x (m) from the sample rim, C0 is the maximum
concentration, D is the diffusion coefficient (m2/s), t is the time duration (s), and erfc is the
complementary error function. C0 and D parameters were fitted using the OriginPro 9™
software. FTIR-FPA images were collected before each FTIR diffusion profile in order to find
the most suitable analytical areas. CO2 contents in beryl were measured along traverses
parallel to the c-axis usually from the middle of the (001) edge. Diffusion through the
prismatic faces can be neglected because it is at least two order of magnitude slower
(Fukuda et al., 2009). Diffusion profiles in cordierite grains were also performed along
traverses parallel to the c-axis, on grains oriented using the spindle stage as explained above.
C and C0 where fitted on data profiles obtained by integrating the principal ν3 anti-symmetric
stretching modes of CO2 at 2348 cm-1 polarized for E//a for cordierite and at 2360 cm-1
polarized for Ec for beryl (Fig. 8). In order to reduce border effects and/or slab surface
unevenness, C and C0 were scaled to the 1880 cm-1 peak area, corresponding to a lattice
overtone (Aines and Rossman, 1984), whose intensity and shape is dependent only of
sample thickness and orientation. This expedient was possible because D is dependent on
the C/C0 ratio and not on their absolute values.

Chapter 5: Kinetics of incorporation of CO2 in cordierite and beryl: an FTIR-FPA spectroscopy study
140
Figure 14 - (a, b) selected CO2 diffusion profiles obtained for the antisymmetric stretching mode along the c crystallographic axis direction. (c) Example of a diffusion profile obtained across two fractures about 115 µm and 190 µm from the crystal edge. In (a) and (b) the dashed lines are the fitted curves; open squares in (b) are data points excluded from fitting (see text). Below each profile the corresponding FPA CO2 image is displayed where the analytical transect is indicated by a dashed red line.
Figure 14 (a and b) shows the most common situation where, due to slight
underestimation of the CO2 content close to the crystal rim, a deviation from the ideal
inverse error-function (erfc) trend of a component diffusing inside a matrix (Zhang and
Cherniak, 2010) is typically observed. In such a case the concentration profiles were fitted
excluding these points (Fig. 14b), as suggested by Fukuda et al. (2009). The third example
(Fig. 14c) shows the case of an analytical transect across a fracture. In such a case multiple
maxima located in correspondence of the fracture(s) are observed. Obviously these profiles
could not be used for the D determination. Below each diffusion profile we reported the
optical images and FPA CO2 contour maps of the areas where the FTIR transects (dashed red
line) were collected.
Table 5 – Diffusion coefficients for CO2 along the structural channels of beryl and cordierite.
Sample Pressure
(MPa)
Temperature
(°C)
Time
(h)
D
(m2/sec)
1000/T
(K)
Log D
Pa_340 j 500 800 24 6.2E-14 0.93 -13.21
Pa_340 d (bis) 500 700 24 2.4E-14 1.7E-14 1.03 -13.62 -13.76
Pa_340 r 700 700 24 1.9E-14 1.1E-14 1.03 -13.72 -13.97
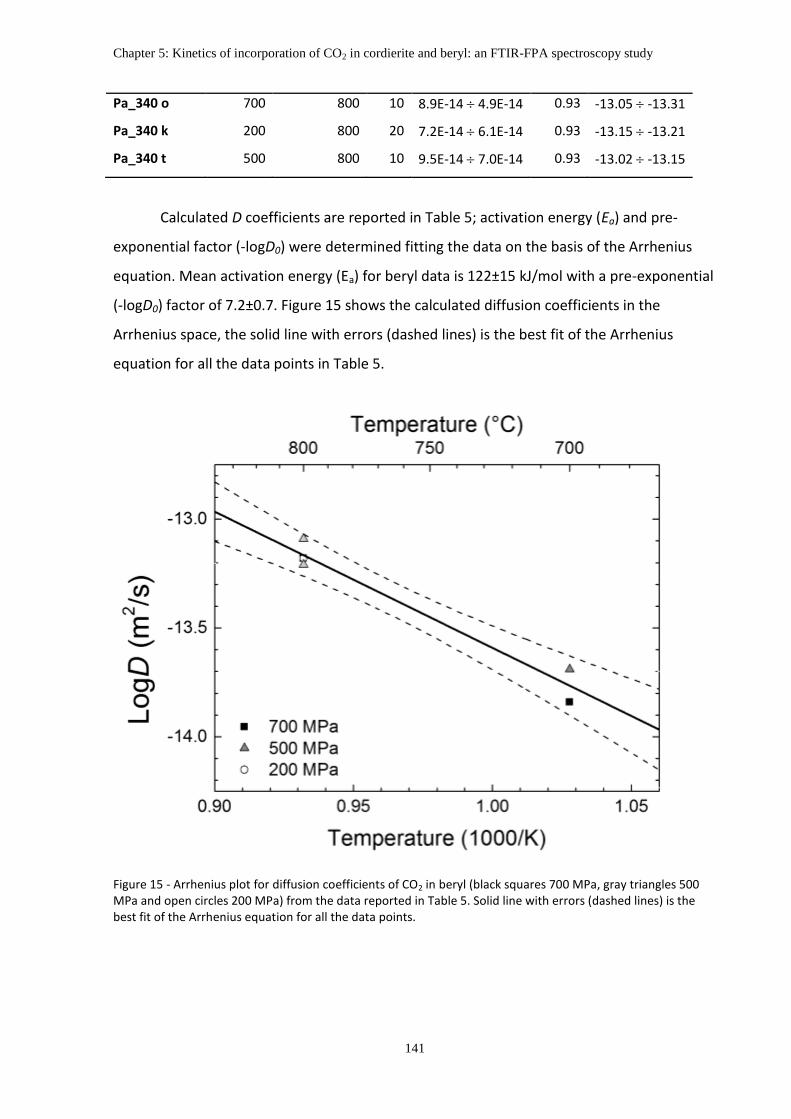
Chapter 5: Kinetics of incorporation of CO2 in cordierite and beryl: an FTIR-FPA spectroscopy study
141
Pa_340 o 700 800 10 8.9E-14 4.9E-14 0.93 -13.05 -13.31
Pa_340 k 200 800 20 7.2E-14 6.1E-14 0.93 -13.15 -13.21
Pa_340 t 500 800 10 9.5E-14 7.0E-14 0.93 -13.02 -13.15
Calculated D coefficients are reported in Table 5; activation energy (Ea) and pre-
exponential factor (-logD0) were determined fitting the data on the basis of the Arrhenius
equation. Mean activation energy (Ea) for beryl data is 122±15 kJ/mol with a pre-exponential
(-logD0) factor of 7.2±0.7. Figure 15 shows the calculated diffusion coefficients in the
Arrhenius space, the solid line with errors (dashed lines) is the best fit of the Arrhenius
equation for all the data points in Table 5.
Figure 15 - Arrhenius plot for diffusion coefficients of CO2 in beryl (black squares 700 MPa, gray triangles 500 MPa and open circles 200 MPa) from the data reported in Table 5. Solid line with errors (dashed lines) is the best fit of the Arrhenius equation for all the data points.

Chapter 5: Kinetics of incorporation of CO2 in cordierite and beryl: an FTIR-FPA spectroscopy study
142
5. Discussion
In this chapter we address an old problem, i.e. the diffusion of CO2 across minerals of
geological relevance, in the present case cordierite and beryl, using a modern methodology,
such as FTIR micro-spectroscopy coupled with imaging (Della Ventura et al., 2014), to
characterize the distribution and the amount of gas inside the sample. Because of the non-
conventional procedure set up and used during this work, in this section we will discuss the
problems and the advantages of this methodology by comparing the data obtained during
our work with those obtained by previous authors.
5.1 The solubility of CO2 in cordierite and beryl
Tables 3 and 4 summarize the CO2 contents measured in the first 20 µm from the
(001) edge of cordierite and beryl treated samples, inferred to represent the maximum
content diffused into the phase. For cordierite, our experiments are in agreement with
previous studies in showing that the CO2 solubility within the mineral increases as a function
of pressure, while temperature has only a minor effect. However while our data indicate a
slightly increase in CO2 for increasing T, previous authors (e.g. Johannes and Schreyer, 1981,
Harley and Thompson, 2004) observed a slight but significant opposite trend. Figure 13 in
addition shows that the CO2 contents are not influenced by the duration of the experiment,
opposite to what found by Le Breton and Schreyer (1993), at least in the range from 2 hours
to 3 days. This last finding is in agreement with the work of Johannes and Schreyer (1981)
who concluded that equilibration can be obtained even after just 1 hour. No literature data
are available for the experimental solubility of CO2 in beryl; however, due to the close
structural similarities between the two minerals, we obtain trends similar to those observed
for cordierite (Fig. 12).
A notable point is that, in comparison with the literature data, we observed a large
difference in the absolute CO2 content incorporated into cordierite, which is more than one
order of magnitude lower. For instance, Johannes and Schreyer (1981) and Armbruster and
Bloss (1982) reported, for cordierites treated at 500 MPa and 800°C, CO2 contents in the 1 –
2 wt. % range, while under the same conditions we measured a CO2 content of ~ 0.04 wt. %.
Chapter 5: Kinetics of incorporation of CO2 in cordierite and beryl: an FTIR-FPA spectroscopy study
143
Armbruster and Bloss (1982) reported values as high as 3.13 wt% CO2 in the White Well
cordierite treated at 600°C, 600 MPa for 4 weeks. This point is extremely important, thus
considering that we are comparing completely different experimental and analytical
techniques, below we will discuss some factors that may explain such differences.
1) The cordierite used here as a starting material has significant amounts of alkaline
cations (Tab. 1) in its structural channels; Vry et al. (1990) observed that in natural cordierite
the total content of CO2 + alkali cations may induce a volatile deficiency of both H2O + CO2
during equilibration with the surrounding fluid because of a “plug effect” affecting the
diffusion rate of the relatively large CO2 molecule from the fluid into the mineral. However,
while Johannes and Schreyer (1981) used synthetic and thus alkali-free crystals as starting
material for their experiments, Armbruster and Bloss (1982) used a natural cordierite from
White Well containing 0.05 Na apfu, thus the alkali content alone cannot explain such a huge
discrepancy.
2) One problem could be looked for in the sample handling and preparation for the
analyses. Figure 9 shows that the thermal/baric treatment of the sample during the
experiments induces development of a series of micro-fractures close to the edges of the
cordierite crystals. These micro-fractures may induce the formation of a CO2-rich (see above)
but fragile external layer which could be removed during sample slicing and polishing for
FTIR analyses. In order to test for this hypothesis, and check the effect of longer fluid-
mineral interaction time, we performed some longer duration (10 days) experiments at 500
MPa, 800 °C, adding silver oxalate (Ag2C2O4) to the charge and using a Tuttle-type H2O cold
seal pressure vessel (CSPV) at Institut für Mineralogie, Leibniz Univerität Hannover
(Germany). The choice of this alternative experimental set up was due to the fact that such
long duration experiments could not be performed with the used Quickpress, where the
experiment duration is limited to few (1-3) days. The results are displayed in Figure 16a
where we show the FPA image of CO2 distribution in cordierite. From this image it is possible
to observe that the outer zone of the grain consists of 150/200 µm thick strongly fractured
layer, presenting a fairly high CO2 content, while the core of the grain is almost CO2 free.
Because of this thick layer it was not possible to orient the grain by optical means and
consequently determine the actual CO2 content by using polarized data. However, using
unpolarized data we can estimate a rough content in this layer of at least 0.42±0.09 wt.%.
Figure 16b displays the FPA contour map of CO2 in a synthetic beryl treated at the same P,T,t

Chapter 5: Kinetics of incorporation of CO2 in cordierite and beryl: an FTIR-FPA spectroscopy study
144
conditions. Contrary to cordierite, synthetic emeralds did not develop significant thermally
induced micro-fractures along the grain edges. Figure 16b shows that the 10 days treated
beryl still presents a prismatic hexagonal habitus and no thick alteration layers were formed;
CO2 diffusion occurred, as usual, from the (001) pinacoidal face of the grain and along cracks
(dashed line). This “edge effect” may thus strongly affect the CO2 content measured for the
experimentally-treated grains as well as the diffusion of CO2 into cordierite.
Figure 16 – FTIR – FPA image of the CO2 distribution in cordierite Crd_pr 38 (left) and beryl Pa_340 v (right) treated with a CSPV for 10 days at 500 MPa and 800 °C. The beryl crystal is oriented parallel to c-crystallographic axis; white dashed line are cracks. The cordierite sample is randomly oriented, the white dashed line marks the boundary of the altered layer.
5.2 The effect of fractures on the CO2 content
The second most notable feature from Tables 3 and 4 is the difference between the
data measured at the edges of the grain and those measured in correspondence of fractures
(labeled with “F” in the notes). CO2 contents observed in correspondence of fractures may
be several times higher than the value calculated at the edge of the grain, this effect is more
pronounced in cordierite samples than in beryl samples, where the CO2 content measured
on fractures are rarely higher than the CO2 content measured on the edges. An example is
reported in Figure 17. Sample Crd_pr 25 and Crd_pr 30 were treated at the same conditions
(200 MPa and 800 °C for 24 hours), however sample Crd_pr 25 was re-run after a thermal
shock due to a technical problem occurred during the heating ramp; after the experiment,
optical examination of the grains revealed the presence of diffuse fracturing across the
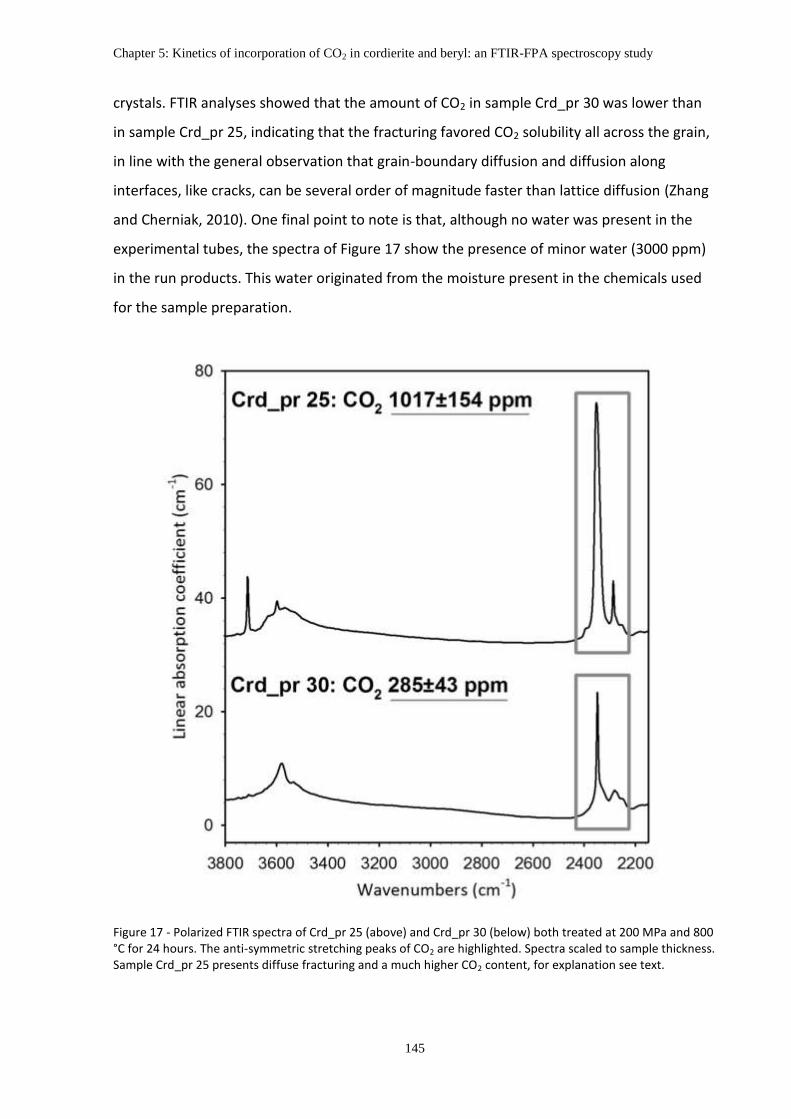
Chapter 5: Kinetics of incorporation of CO2 in cordierite and beryl: an FTIR-FPA spectroscopy study
145
crystals. FTIR analyses showed that the amount of CO2 in sample Crd_pr 30 was lower than
in sample Crd_pr 25, indicating that the fracturing favored CO2 solubility all across the grain,
in line with the general observation that grain-boundary diffusion and diffusion along
interfaces, like cracks, can be several order of magnitude faster than lattice diffusion (Zhang
and Cherniak, 2010). One final point to note is that, although no water was present in the
experimental tubes, the spectra of Figure 17 show the presence of minor water (3000 ppm)
in the run products. This water originated from the moisture present in the chemicals used
for the sample preparation.
Figure 17 - Polarized FTIR spectra of Crd_pr 25 (above) and Crd_pr 30 (below) both treated at 200 MPa and 800 °C for 24 hours. The anti-symmetric stretching peaks of CO2 are highlighted. Spectra scaled to sample thickness. Sample Crd_pr 25 presents diffuse fracturing and a much higher CO2 content, for explanation see text.
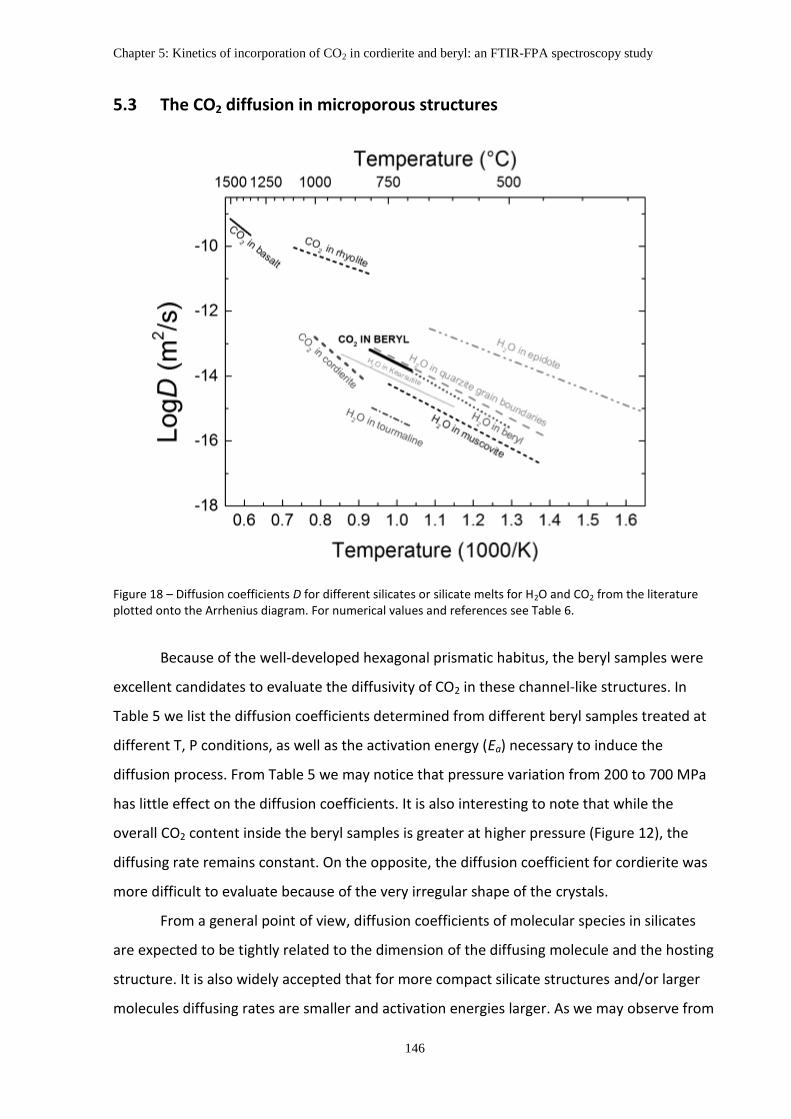
Chapter 5: Kinetics of incorporation of CO2 in cordierite and beryl: an FTIR-FPA spectroscopy study
146
5.3 The CO2 diffusion in microporous structures
Figure 18 – Diffusion coefficients D for different silicates or silicate melts for H2O and CO2 from the literature plotted onto the Arrhenius diagram. For numerical values and references see Table 6.
Because of the well-developed hexagonal prismatic habitus, the beryl samples were
excellent candidates to evaluate the diffusivity of CO2 in these channel-like structures. In
Table 5 we list the diffusion coefficients determined from different beryl samples treated at
different T, P conditions, as well as the activation energy (Ea) necessary to induce the
diffusion process. From Table 5 we may notice that pressure variation from 200 to 700 MPa
has little effect on the diffusion coefficients. It is also interesting to note that while the
overall CO2 content inside the beryl samples is greater at higher pressure (Figure 12), the
diffusing rate remains constant. On the opposite, the diffusion coefficient for cordierite was
more difficult to evaluate because of the very irregular shape of the crystals.
From a general point of view, diffusion coefficients of molecular species in silicates
are expected to be tightly related to the dimension of the diffusing molecule and the hosting
structure. It is also widely accepted that for more compact silicate structures and/or larger
molecules diffusing rates are smaller and activation energies larger. As we may observe from

Chapter 5: Kinetics of incorporation of CO2 in cordierite and beryl: an FTIR-FPA spectroscopy study
147
Figure 18 the diffusing rates calculated for CO2 (this work) and H2O (Fukuda et al., 2009) in
beryl are very close, even though CO2 molecule are larger than the H2O molecule (the overall
dimension of H2O is 2.8 x 3.2 x 3.7 Å and for CO2 is 2.8 x 2.8 x 5.0 Å: Wood and Nassau,
1968). On the other hand, the CO2 diffusion coefficients for beryl (this work) are greater than
the diffusion coefficient calculated for the outward CO2 diffusion from the cordierite
channels (chapter 4). In addition, Vry et al. (1990) observed that, in cordierite, the inward
diffusion is quicker than outward diffusion. These authors concluded that the difference
between inward and outward diffusion rates may be caused by alkali cations and CO2 itself,
that, acting as plugs in the channel, preferentially slows down the outward volatile
diffusions.
It is difficult to draw a direct comparison between our data and the diffusion
coefficients available in the literature for minerals; the reason is that, beryl and cordierite
behave as microporous structures trapping H and C as H2O and CO2 molecules, while the vast
majority of the existing data have been collected on minerals where H is present as an OH-
group. Moreover no data are available for CO2 diffusion in minerals (excluding C diffusion in
carbonates, e. g. Anderson, 1972; Labotka et al., 2000). Thus in the next paragraph we are
forced to compare our data with those derived for basically different processes.
Figure 18 and Table 6 give selected examples of diffusion rates for the most common
hydrous minerals. In Figure 18 we may observe that the diffusion coefficients measured for
CO2 in beryl are close to the OH- diffusion coefficients obtained in other ring silicates like
tourmaline (Desbois and Ingrin, 2007), layer silicates like muscovite (Graham, 1981),
amphiboles like kaersutite (Ingrin and Blanchard 2000), or in disilicates like epidote (Graham,
1981). However, it’s important to note that structural OH- probably diffuses inside these
structures in the form of H+ (Zhang et al., 2010) thus the diffusing species is much smaller
compared to molecular CO2 and H2O.
Our data suggest that the structural channels of cordierite and beryl act more likely
fast paths for the mobility of large molecular groups compared to similar silicate structures,
and for this reason the diffusing behavior is more similar to the one typically observed for
grain boundary diffusion, such as, for example, H2O in quartzite (Farver and Yund, 1991) or
to the behavior of CO2 in non-crystalline materials, like silicate melts (Watson et al., 1982;
Watson, 1991).
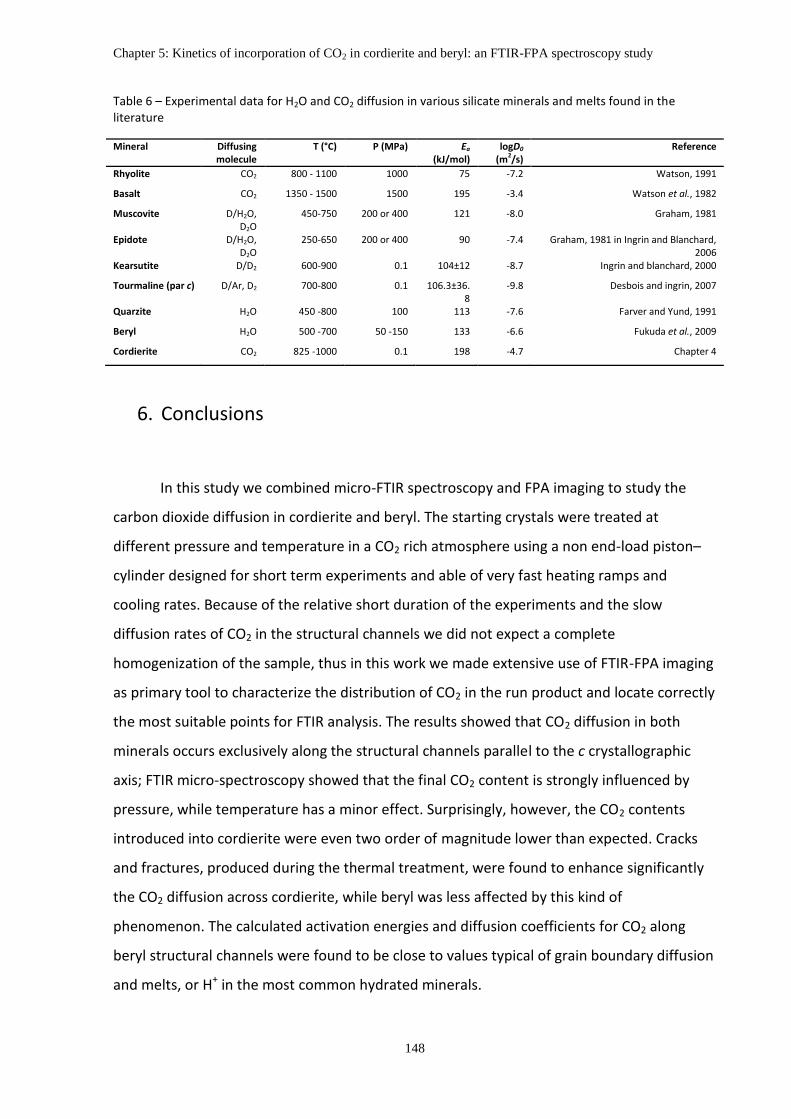
Chapter 5: Kinetics of incorporation of CO2 in cordierite and beryl: an FTIR-FPA spectroscopy study
148
Table 6 – Experimental data for H2O and CO2 diffusion in various silicate minerals and melts found in the literature
Mineral Diffusing molecule
T (°C) P (MPa) Ea (kJ/mol)
logD0 (m2/s)
Reference
Rhyolite CO2 800 - 1100 1000 75 -7.2 Watson, 1991
Basalt CO2 1350 - 1500 1500 195 -3.4 Watson et al., 1982
Muscovite D/H2O, D2O
450-750 200 or 400 121 -8.0 Graham, 1981
Epidote D/H2O, D2O
250-650 200 or 400 90 -7.4 Graham, 1981 in Ingrin and Blanchard, 2006
Kearsutite D/D2 600-900 0.1 104±12 -8.7 Ingrin and blanchard, 2000
Tourmaline (par c) D/Ar, D2 700-800 0.1 106.3±36.8
-9.8 Desbois and ingrin, 2007
Quarzite H2O 450 -800 100 113 -7.6 Farver and Yund, 1991
Beryl H2O 500 -700 50 -150 133 -6.6 Fukuda et al., 2009
Cordierite CO2 825 -1000 0.1 198 -4.7 Chapter 4
6. Conclusions
In this study we combined micro-FTIR spectroscopy and FPA imaging to study the
carbon dioxide diffusion in cordierite and beryl. The starting crystals were treated at
different pressure and temperature in a CO2 rich atmosphere using a non end-load piston–
cylinder designed for short term experiments and able of very fast heating ramps and
cooling rates. Because of the relative short duration of the experiments and the slow
diffusion rates of CO2 in the structural channels we did not expect a complete
homogenization of the sample, thus in this work we made extensive use of FTIR-FPA imaging
as primary tool to characterize the distribution of CO2 in the run product and locate correctly
the most suitable points for FTIR analysis. The results showed that CO2 diffusion in both
minerals occurs exclusively along the structural channels parallel to the c crystallographic
axis; FTIR micro-spectroscopy showed that the final CO2 content is strongly influenced by
pressure, while temperature has a minor effect. Surprisingly, however, the CO2 contents
introduced into cordierite were even two order of magnitude lower than expected. Cracks
and fractures, produced during the thermal treatment, were found to enhance significantly
the CO2 diffusion across cordierite, while beryl was less affected by this kind of
phenomenon. The calculated activation energies and diffusion coefficients for CO2 along
beryl structural channels were found to be close to values typical of grain boundary diffusion
and melts, or H+ in the most common hydrated minerals.
Chapter 6: The diffusion of CO2 and H2O in a synthetic sector-zoned beryl: a multi-analytical study
149
CHAPTER 6
THE DIFFUSION OF CO2 AND H2O IN A SYNTHETIC SECTOR-
ZONED BERYL:
A MULTI-ANALYTICAL STUDY
Abstract
In this work we investigate the strong inhomogeneous distribution of CO2 and H2O
across a synthetic beryl characterized by a peculiar hourglass structure due to the Cr
distribution during the crystal growth. The sample was treated at 800°C, 500 MPa, in a CO2-
rich atmosphere. A combination of analytical techniques and, in particular, polarized-light
FPA imaging, revealed an additional pathway of carbon dioxide diffusion along the zoning
discontinuity. Using high-resolution synchrotron-light mapping it was possible to distinguish
between the enhancement of the CO2 diffusion along the hourglass trace and a fracture in
the grain. High-resolution FESEM images revealed that no physical discontinuities are
present in the matrix, at least at the scale of tenth of nanometers. Therefore, the hourglass
zone boundary may be considered as a planar defect possibly due to the mismatch induced
by the different growth rates of each sector. The H2O diffusion follows an extremely
different pattern: combining TOF-SIMS and FTIR-FPA a significant depletion of H2O[II] along
the hourglass boundary where a significant amount of Na was replaced by K.

Chapter 6: The diffusion of CO2 and H2O in a synthetic sector-zoned beryl: a multi-analytical study
150
1. Introduction
Diffusion of hydrogen-oxygen species in minerals as a function of T and P has been
addressed by numerous experimental studies (e.g. Ingrin and Blanchard, 2006; Watson and
Baxter, 2007; Farver, 2010 and references therein) due to the extremely important
consequences that this processes may have in Earth Science systems. Accordingly, diffusion
may occur in three different ways: (i) intra-crystalline (volume), (ii) grain boundary (Fukuda
et al., 2009) and (iii) planar defects diffusion (Zhang et al., 2006). Intra-crystalline diffusion is
the slower mechanism, whereas grain boundary and planar defects act as fast-pathways for
the travelling of ions or molecular species across the mineral (e.g. Zhang et al., 2006).
Several rock forming minerals are structurally characterized by atomic arrangements which
leave free space to the molecular diffusivity in the form of connected cavities or channels:
notable examples are the zeolite-type feldspathoids, and ring silicates such as beryl and
cordierite. Diffusion along these connected structural cavities is typically faster than the
volume diffusion. In other words there is evidence that diffusivity along structural channels
can be assimilated to fast mobility diffusion. In this work we address some particular aspects
of the diffusivity of CO2 in beryl, after the more general experimental work described in
chapter 5 of this Thesis. The chapter deals in particular with a peculiar diffusion pattern
observed for an hourglass-zoned crystal.
Figure 1 – a) Schematic view of beryl crystal structures parallel to the crystallographic c axis. Blue = Si
tetrahedra; orange = Al sites and gray = Be sites. b) Schematic section of beryl channel parallel to [0001],
modified after Fukuda and Shinoda (2011). c) Sketch of the hourglass zoning inside a beryl (modified after
Hollister, 1970)

Chapter 6: The diffusion of CO2 and H2O in a synthetic sector-zoned beryl: a multi-analytical study
151
Beryl is a relatively rare rock-forming mineral, and is found as an accessory
constituent in pegmatites, in cavities of granitic rocks and occasionally in metamorphic rocks
(Deer et al., 1986). A rare occurrence in a volcanic syenitic ejectum has also been reported
(Della Ventura et al., 2000). It is structurally a ring silicate with ideal formula Be3Al2Si6O18,
consisting of six-member hexagonal rings of tetrahedra. The vertical stacking of these rings
forms a succession of interconnected cages arranged along the c axis (Fig. 1a). The cages
have a maximum diameter of about 5.0 Å and a minimum diameter of 2.8 Å (Gibbs et al.,
1968); channel height is about 4.7 Å (Fukuda and Shinoda, 2011).
Figure 1b shows a schematic section of the structural channel parallel to [001], where
different atoms and/or molecular groups may be hosted. H2O and CO2 are the main
constituents in beryl channels (Wood and Nassau, 1968, Aines and Rossman, 1984) and are
located in the wider sites of the channels (2a position in Fig. 1b). Larger ions like Cs+ and K+
(Hawthorne and Černý, 1977) and possibly OH groups (Wickersheim and Buchanan, 1959,
Aurisicchio et al., 1994) may also be located in the 2a position, while smaller cations like Na+
(Wood and Nassau, 1968) occur at the narrower 2b site (Fig. 1b).
Polarized FTIR data show that the linear CO2 molecules are oriented orthogonally to
the c axis (Wood and Nassau, 1968; Aines and Rossman, 1984). Extra-framework H2O occur
in the structural channels with the molecular plane parallel to (100) and may present two
different orientations (Fig. 1b): in type I H2O (hereafter H2O[I]) the H–H vector is oriented
parallel to the c axis and in type II H2O (H2O[II]) the H–H vector is rotated by 90° orthogonally
to the c axis (Wood and Nassau, 1968, Bellatreccia et al., 2008). H2O molecules of this latter
type are locally bonded to alkali cations sited in the 2b position (Goldmann et al., 1977;
Hawthorne and Černý, 1977).
H2O and CO2 diffusion in beryl has been recently studied by Fukuda et al. (2009) and
in this thesis (chapter 5); the available data show without doubt that mobility of molecules
across the mineral occurs exclusively along the structural channels.
In this work we describe the crystal-chemistry of one beryl grain recovered from one
of the CO2 diffusion experiments described in chapter 5 of this Thesis. Preliminary FTIR-FPA
data showed a peculiar inhomogeneity of CO2 and H2O in this sample, thus the crystal has
been characterized in detail using a multidisciplinary approach. The volatile distribution, in
particular, has been studied by high-resolution synchrotron-radiation (SR) FTIR-FPA imaging
under polarized light. The data clearly demonstrate that careful determination of the
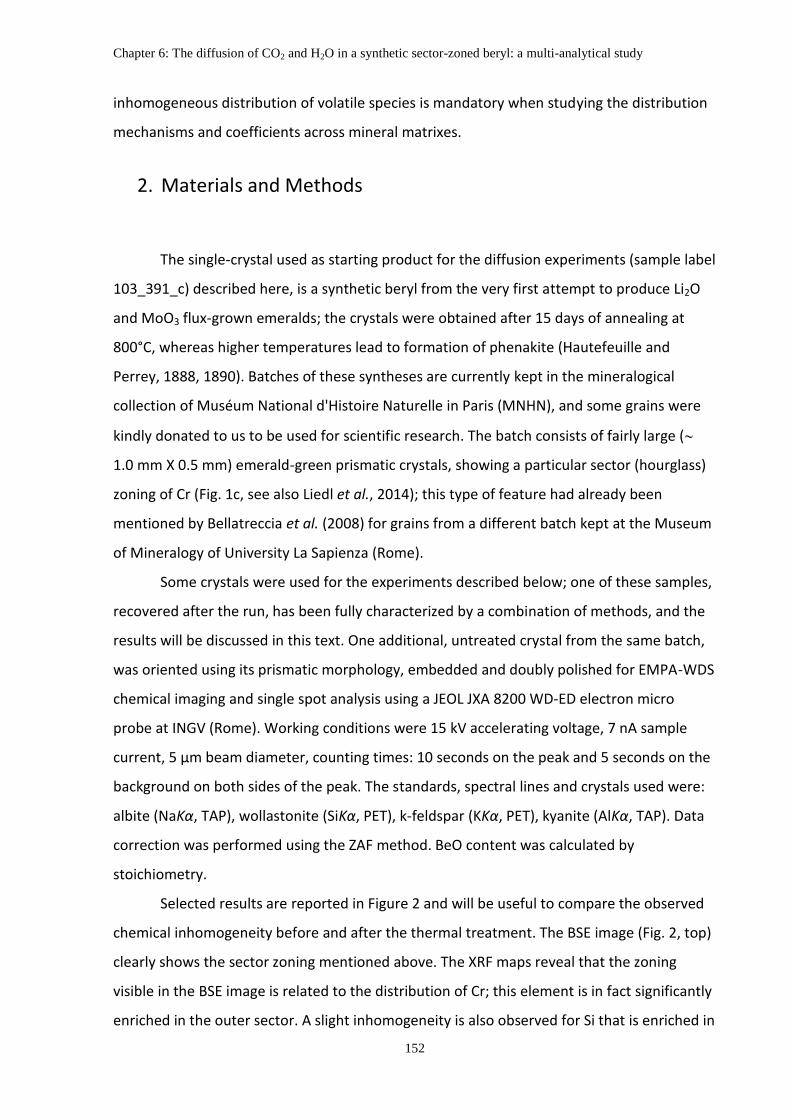
Chapter 6: The diffusion of CO2 and H2O in a synthetic sector-zoned beryl: a multi-analytical study
152
inhomogeneous distribution of volatile species is mandatory when studying the distribution
mechanisms and coefficients across mineral matrixes.
2. Materials and Methods
The single-crystal used as starting product for the diffusion experiments (sample label
103_391_c) described here, is a synthetic beryl from the very first attempt to produce Li2O
and MoO3 flux-grown emeralds; the crystals were obtained after 15 days of annealing at
800°C, whereas higher temperatures lead to formation of phenakite (Hautefeuille and
Perrey, 1888, 1890). Batches of these syntheses are currently kept in the mineralogical
collection of Muséum National d'Histoire Naturelle in Paris (MNHN), and some grains were
kindly donated to us to be used for scientific research. The batch consists of fairly large (
1.0 mm X 0.5 mm) emerald-green prismatic crystals, showing a particular sector (hourglass)
zoning of Cr (Fig. 1c, see also Liedl et al., 2014); this type of feature had already been
mentioned by Bellatreccia et al. (2008) for grains from a different batch kept at the Museum
of Mineralogy of University La Sapienza (Rome).
Some crystals were used for the experiments described below; one of these samples,
recovered after the run, has been fully characterized by a combination of methods, and the
results will be discussed in this text. One additional, untreated crystal from the same batch,
was oriented using its prismatic morphology, embedded and doubly polished for EMPA-WDS
chemical imaging and single spot analysis using a JEOL JXA 8200 WD-ED electron micro
probe at INGV (Rome). Working conditions were 15 kV accelerating voltage, 7 nA sample
current, 5 µm beam diameter, counting times: 10 seconds on the peak and 5 seconds on the
background on both sides of the peak. The standards, spectral lines and crystals used were:
albite (NaKα, TAP), wollastonite (SiKα, PET), k-feldspar (KKα, PET), kyanite (AlKα, TAP). Data
correction was performed using the ZAF method. BeO content was calculated by
stoichiometry.
Selected results are reported in Figure 2 and will be useful to compare the observed
chemical inhomogeneity before and after the thermal treatment. The BSE image (Fig. 2, top)
clearly shows the sector zoning mentioned above. The XRF maps reveal that the zoning
visible in the BSE image is related to the distribution of Cr; this element is in fact significantly
enriched in the outer sector. A slight inhomogeneity is also observed for Si that is enriched in
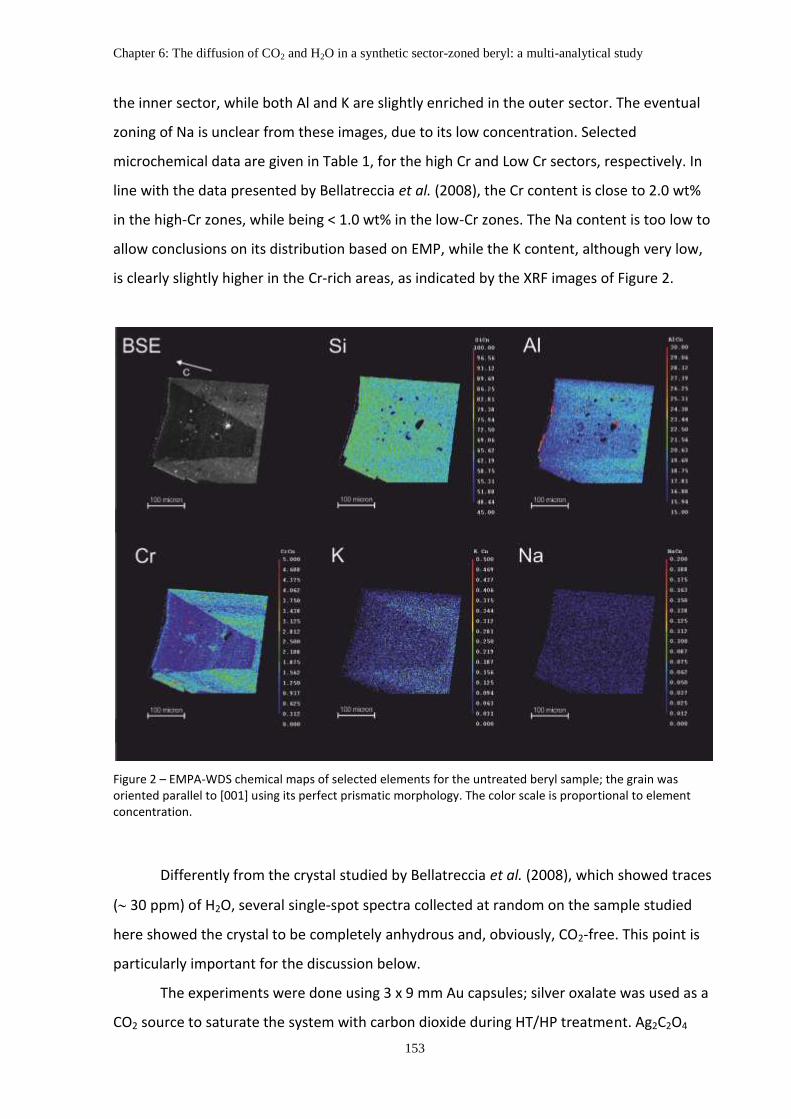
Chapter 6: The diffusion of CO2 and H2O in a synthetic sector-zoned beryl: a multi-analytical study
153
the inner sector, while both Al and K are slightly enriched in the outer sector. The eventual
zoning of Na is unclear from these images, due to its low concentration. Selected
microchemical data are given in Table 1, for the high Cr and Low Cr sectors, respectively. In
line with the data presented by Bellatreccia et al. (2008), the Cr content is close to 2.0 wt%
in the high-Cr zones, while being < 1.0 wt% in the low-Cr zones. The Na content is too low to
allow conclusions on its distribution based on EMP, while the K content, although very low,
is clearly slightly higher in the Cr-rich areas, as indicated by the XRF images of Figure 2.
Figure 2 – EMPA-WDS chemical maps of selected elements for the untreated beryl sample; the grain was oriented parallel to [001] using its perfect prismatic morphology. The color scale is proportional to element concentration.
Differently from the crystal studied by Bellatreccia et al. (2008), which showed traces
( 30 ppm) of H2O, several single-spot spectra collected at random on the sample studied
here showed the crystal to be completely anhydrous and, obviously, CO2-free. This point is
particularly important for the discussion below.
The experiments were done using 3 x 9 mm Au capsules; silver oxalate was used as a
CO2 source to saturate the system with carbon dioxide during HT/HP treatment. Ag2C2O4

Chapter 6: The diffusion of CO2 and H2O in a synthetic sector-zoned beryl: a multi-analytical study
154
decomposes into 2Ag + 2CO2 at 140 °C, yielding a theoretical CO2 content ≈29 wt.%. Al2O3
powder (Al2O3 = 99.72 wt.%, SiO2 = 0.07 wt.%, others = 0.21 wt.%) was mixed in 1 to 1 ratio
by wt with Ag2C2O4, and added to the charge. The aluminum oxide powder was used to
prevent the contact between the crystals and the capsule walls after the silver oxalate
disappearance due to its decomposition, and helped to dissipate the differential stress that
may arise during the experiment. All components used to prepare the tubes were dried up in
oven at 110 °C in order to avoid moisture contamination, however, despite this precaution,
FTIR data (see below) revealed significant H2O in the sample after the run.
Table 1 - Microchemical analysis for the beryl in Figure 2, data points were collected in the high Cr sector (HighCr) and low Cr sector (lowCr and lowCr2). Crystal-chemical formulae were recalculated based on 18 oxygen atoms p.f.u. The tetrahedral site-population was constrained to be 9 apfu, Be was calculated by stoichiometry
HighCr lowCr lowCr2
SiO2 62.44 63.87 65.09
Al2O3 20.15 19.59 19.34
Cr2O3 1.80 0.91 0.70
BeO 13.55 13.62 13.76
Na2O 0.01 0.02 0.00
K2O 0.09 0.06 0.04 Total 98.04 98.06 98.92 Si 5.756 5.859 5.909 AlIV 0.240 0.140 0.090
Be 3.001 3.001 3.001 Σ Tetrahedra 8.997 9.001 9.000 AlVI 1.950 2.118 2.069
Cr 0.131 0.066 0.050 Σ Octahedra 2.081 2.183 2.119 Na 0.001 0.004 0.001 K 0.010 0.007 0.004 Σ Channels 0.012 0.010 0.005
The experiments were performed using an externally heated vessel at Institut für
Mineralogie, Leibniz Univerität Hannover (Germany). The temperature uncertainty at the
sample position is estimated to be ±10 °C and pressure was automatically controlled to be
within 5 MPa (Behrens, 2010); oxygen fugacity within the vessel was close to NNO. The
sample was treated at 800 °C and 500 MPa for 4 days. The X-ray diffraction pattern of the
Chapter 6: The diffusion of CO2 and H2O in a synthetic sector-zoned beryl: a multi-analytical study
155
powder added within the tube revealed the presence of residual alumina (corundum) and
metallic silver, together with traces of silver oxide. The beryl sample was separated from the
residual powder, oriented using its perfect prismatic morphology, embedded in epoxy resin
and doubly polished to 63 µm; sample thickness was determined using an electronic
micrometer with ±5 µm uncertainty.
Preliminary FTIR spectra were acquired using a Bruker™ Hyperion 3000 microscope
equipped with a KBr broadband beamsplitter and a liquid nitrogen-cooled MCT detector at
Laboratori Nazionali di Frascati-Istituto Nazionale di Fisica Nucleare (LNF-INFN,) Frascati
(Rome). High-resolution spectra were acquired at beamline B22, Diamond Light Source
Laboratory (Oxford, UK) using a similar set up except a synchrotron FTIR source instead a
Globar source. The polarized spectra were collected using a gold-wire-grid polarizer on a
ZnSe substrate. A 15 x objective in conventional light and 36 x objective in synchrotron light
were employed; the nominal resolution was 4 cm-1 and 128 scans were averaged for both
spectrum and background. FTIR images were collected with a 64 x 64 pixel focal-plane array
(FPA) of liquid nitrogen-cooled MCT detectors. The nominal resolution was set at 4 cm−1 and
64 scans were averaged for each spectrum and background; each image covers an area of
170 µm x 170 µm with a nominal spatial resolution of ∼ 5 µm (Della Ventura et al., 2010,
2014).
Time of Flight – Secondary Ion Mass Spectroscopy (TOF – SIMS) data were collected
on a ION – TOF TOF.SIMS 5™ mass-spectrometer at Dipartimento di Matematica e Fisica,
University of Roma Tre, using a ToF-SIMS V instrument equipped with a 30 keV Bi liquid
metal ion gun (BiLMIG). Sample surface sputtering procedure was performed before the
measurements.
3. Results
3.1 TOF-SIMS mapping
Figure 3 shows the distribution of selected chemical components across the beryl
extracted from the vessel after the T/P treatment, obtained by TOF-SIMS imaging. Inspection
of Figure 3a shows that the crystal has a well evident hourglass growth structure, which is
visible in optical microscopy under both parallel and crossed polars. Figure 3b indicates that,

Chapter 6: The diffusion of CO2 and H2O in a synthetic sector-zoned beryl: a multi-analytical study
156
as already discussed above, the hourglass zoning is essentially due to the Cr3+ distribution
across the crystal; in particular comparing Figure 3a and Figure 3b it is possible to observe
that the Cr3+ zoning is also the main responsible for the difference in birefringence in the
different sides of the grain: higher birefringence (darker-yellow colors in Fig. 3a) is associated
with higher Cr content, while a lower Cr content is associated with a lower birefringence
(pale yellow/white in Fig. 3a). Such a distribution has been recently characterized in 3D by
Liedl et al. (2014) on a crystal from the same batch and later used for microchemical
analyses (see below) using -CT X-ray tomography.
Figure 3 – XPL (a) and TOF-SIMS images (b to d) of the studied beryl sample after the experimental run. The color scale is proportional to the element contents from red (high) to blue (low).
Figure 3c and 3d show a peculiar distribution of K+ and Na+ which indicates that,
despite these elements are present as accessory constituents inside the structural channels,
their content also is inhomogeneously distributed and follows the hourglass pattern; in
agreement with XRF images (Fig. 2), TOF-SIMS data show that the K content is slightly higher
in the outer sector while Na seems to be inversely correlated to K (compare Fig. 3c with Fig.
3d).
3.2 Polarized-light FTIR spectra, band assignment, and volatile contents
Figure 4 shows selected single-crystal polarized-light FTIR spectra collected for the
treated sample close to the (001) edge of the grain, were the maximum CO2 (and H2O)
content is expected (this thesis, chapter 5). The single-crystal polarized infrared spectrum of
beryl has been studied by several authors, after the early work of Wood and Nassau (1967,
1968) and Aines and Rossman (1984) who clearly showed that the beryl channels may in fact
host H2O in two different orientations, and CO2 molecules. A detailed analysis of the beryl
spectrum is behind the scope of the present work and will be given in chapter 7, thus we will
describe briefly only those absorptions that will be used for the measurements discussed
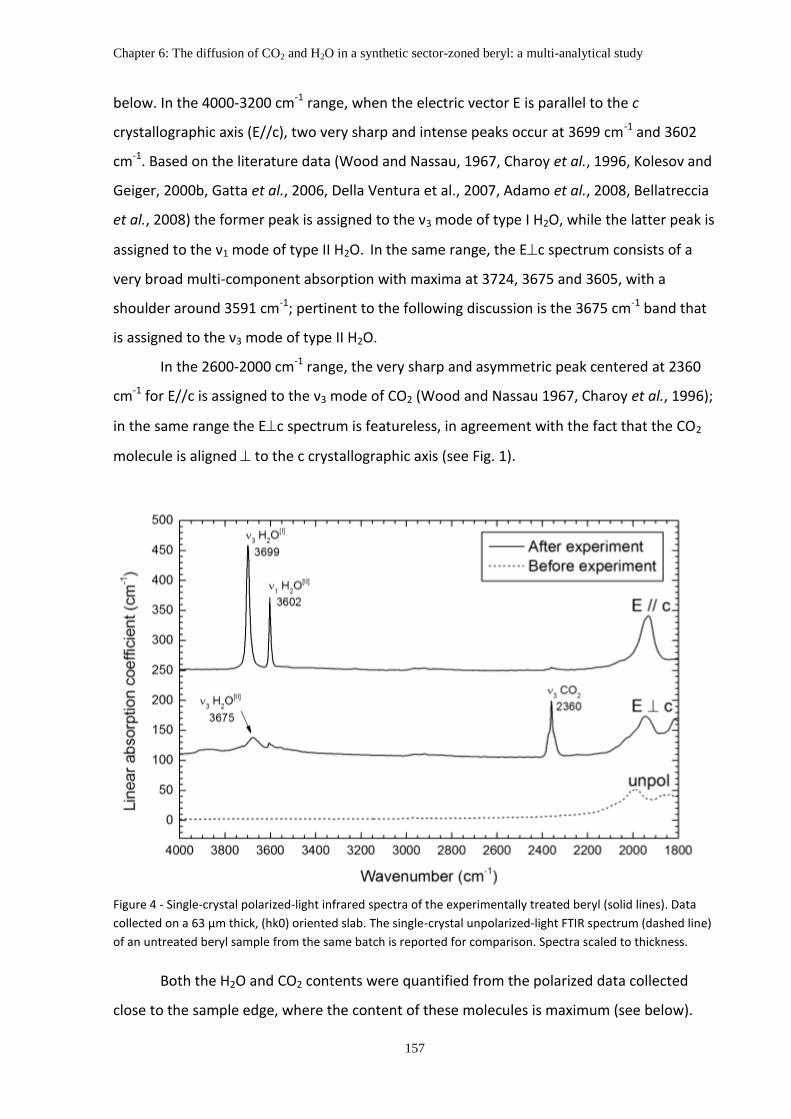
Chapter 6: The diffusion of CO2 and H2O in a synthetic sector-zoned beryl: a multi-analytical study
157
below. In the 4000-3200 cm-1 range, when the electric vector E is parallel to the c
crystallographic axis (E//c), two very sharp and intense peaks occur at 3699 cm-1 and 3602
cm-1. Based on the literature data (Wood and Nassau, 1967, Charoy et al., 1996, Kolesov and
Geiger, 2000b, Gatta et al., 2006, Della Ventura et al., 2007, Adamo et al., 2008, Bellatreccia
et al., 2008) the former peak is assigned to the ν3 mode of type I H2O, while the latter peak is
assigned to the ν1 mode of type II H2O. In the same range, the Ec spectrum consists of a
very broad multi-component absorption with maxima at 3724, 3675 and 3605, with a
shoulder around 3591 cm-1; pertinent to the following discussion is the 3675 cm-1 band that
is assigned to the ν3 mode of type II H2O.
In the 2600-2000 cm-1 range, the very sharp and asymmetric peak centered at 2360
cm-1 for E//c is assigned to the ν3 mode of CO2 (Wood and Nassau 1967, Charoy et al., 1996);
in the same range the Ec spectrum is featureless, in agreement with the fact that the CO2
molecule is aligned to the c crystallographic axis (see Fig. 1).
Figure 4 - Single-crystal polarized-light infrared spectra of the experimentally treated beryl (solid lines). Data
collected on a 63 µm thick, (hk0) oriented slab. The single-crystal unpolarized-light FTIR spectrum (dashed line)
of an untreated beryl sample from the same batch is reported for comparison. Spectra scaled to thickness.
Both the H2O and CO2 contents were quantified from the polarized data collected
close to the sample edge, where the content of these molecules is maximum (see below).
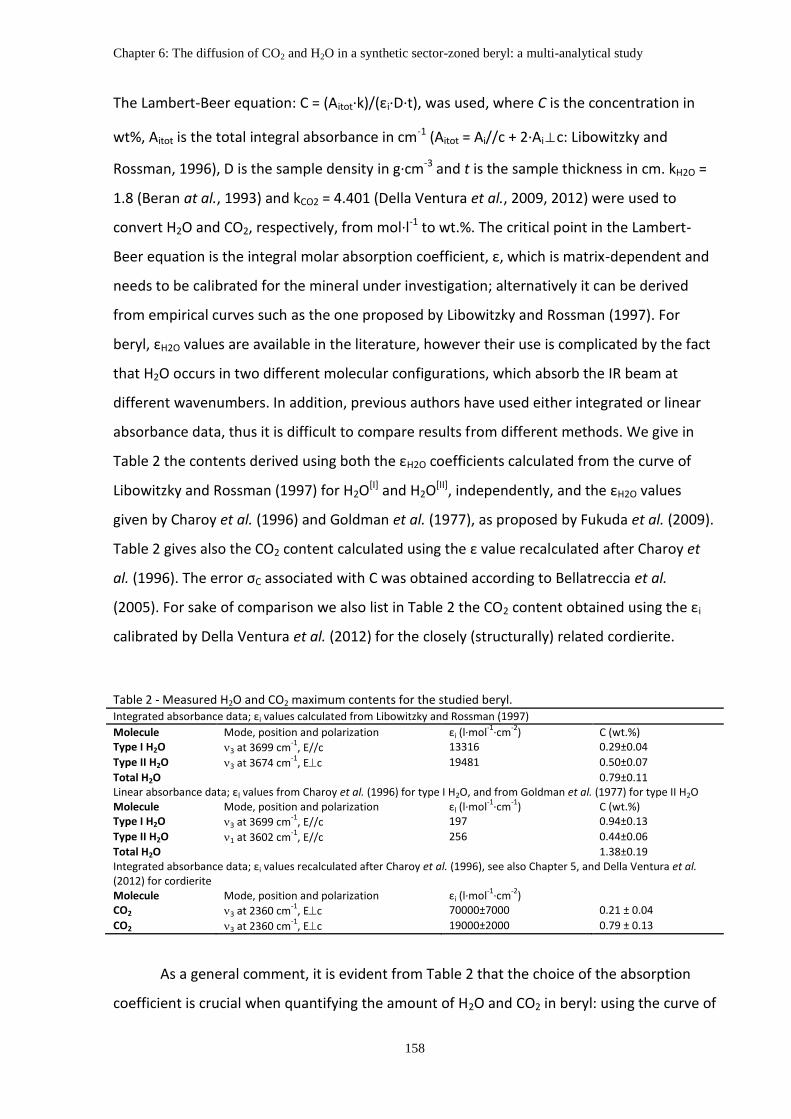
Chapter 6: The diffusion of CO2 and H2O in a synthetic sector-zoned beryl: a multi-analytical study
158
The Lambert-Beer equation: C = (Aitot∙k)/(εi·D·t), was used, where C is the concentration in
wt%, Aitot is the total integral absorbance in cm-1 (Aitot = Ai//c + 2·Ai⊥c: Libowitzky and
Rossman, 1996), D is the sample density in g·cm-3 and t is the sample thickness in cm. kH2O =
1.8 (Beran at al., 1993) and kCO2 = 4.401 (Della Ventura et al., 2009, 2012) were used to
convert H2O and CO2, respectively, from mol·l-1 to wt.%. The critical point in the Lambert-
Beer equation is the integral molar absorption coefficient, ε, which is matrix-dependent and
needs to be calibrated for the mineral under investigation; alternatively it can be derived
from empirical curves such as the one proposed by Libowitzky and Rossman (1997). For
beryl, εH2O values are available in the literature, however their use is complicated by the fact
that H2O occurs in two different molecular configurations, which absorb the IR beam at
different wavenumbers. In addition, previous authors have used either integrated or linear
absorbance data, thus it is difficult to compare results from different methods. We give in
Table 2 the contents derived using both the εH2O coefficients calculated from the curve of
Libowitzky and Rossman (1997) for H2O[I] and H2O[II], independently, and the εH2O values
given by Charoy et al. (1996) and Goldman et al. (1977), as proposed by Fukuda et al. (2009).
Table 2 gives also the CO2 content calculated using the ε value recalculated after Charoy et
al. (1996). The error σC associated with C was obtained according to Bellatreccia et al.
(2005). For sake of comparison we also list in Table 2 the CO2 content obtained using the εi
calibrated by Della Ventura et al. (2012) for the closely (structurally) related cordierite.
Table 2 - Measured H2O and CO2 maximum contents for the studied beryl. Integrated absorbance data; εi values calculated from Libowitzky and Rossman (1997)
Molecule Mode, position and polarization εi (l·mol-1
·cm-2
) C (wt.%) Type I H2O 3 at 3699 cm
-1, E//c 13316 0.29±0.04
Type II H2O 3 at 3674 cm-1
, Ec 19481 0.50±0.07
Total H2O 0.79±0.11 Linear absorbance data; εl values from Charoy et al. (1996) for type I H2O, and from Goldman et al. (1977) for type II H2O Molecule Mode, position and polarization εl (l·mol
-1·cm
-1) C (wt.%)
Type I H2O 3 at 3699 cm-1
, E//c 197 0.94±0.13
Type II H2O 1 at 3602 cm-1
, E//c 256 0.44±0.06
Total H2O 1.38±0.19 Integrated absorbance data; εi values recalculated after Charoy et al. (1996), see also Chapter 5, and Della Ventura et al. (2012) for cordierite Molecule Mode, position and polarization εi (l·mol
-1·cm
-2)
CO2 3 at 2360 cm-1
, Ec 70000±7000 0.21 ± 0.04
CO2 3 at 2360 cm-1
, Ec 19000±2000 0.79 ± 0.13
As a general comment, it is evident from Table 2 that the choice of the absorption
coefficient is crucial when quantifying the amount of H2O and CO2 in beryl: using the curve of
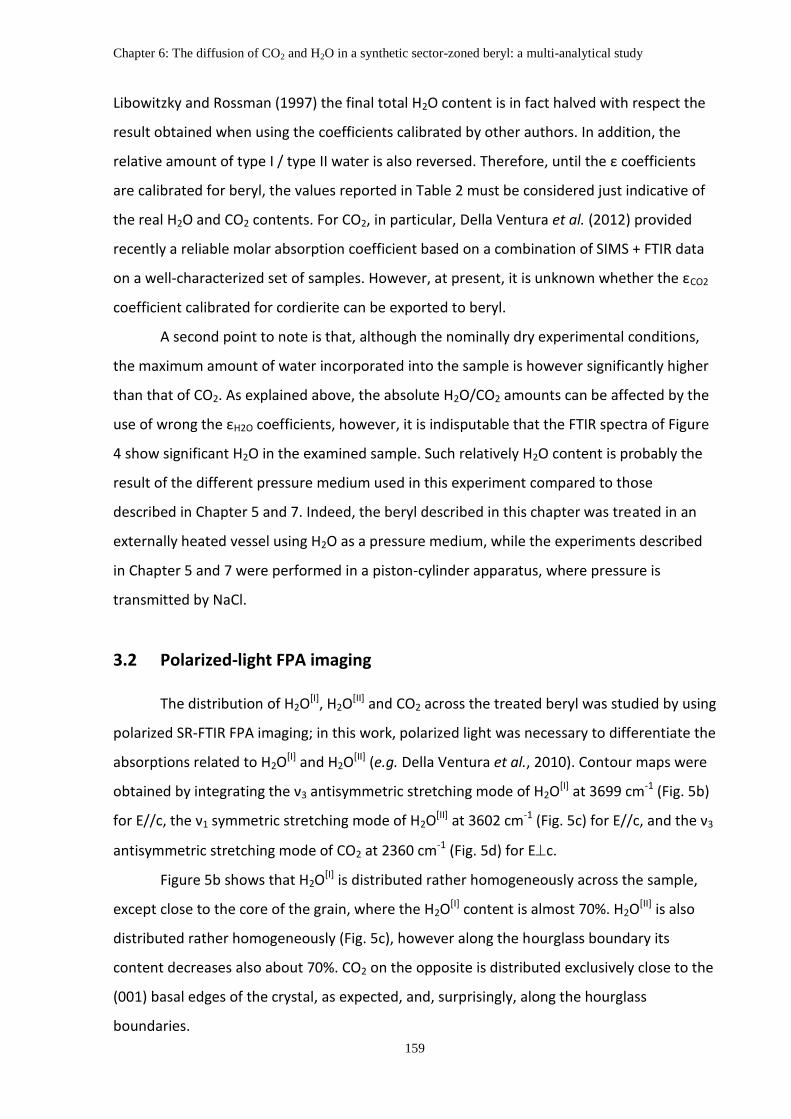
Chapter 6: The diffusion of CO2 and H2O in a synthetic sector-zoned beryl: a multi-analytical study
159
Libowitzky and Rossman (1997) the final total H2O content is in fact halved with respect the
result obtained when using the coefficients calibrated by other authors. In addition, the
relative amount of type I / type II water is also reversed. Therefore, until the ε coefficients
are calibrated for beryl, the values reported in Table 2 must be considered just indicative of
the real H2O and CO2 contents. For CO2, in particular, Della Ventura et al. (2012) provided
recently a reliable molar absorption coefficient based on a combination of SIMS + FTIR data
on a well-characterized set of samples. However, at present, it is unknown whether the εCO2
coefficient calibrated for cordierite can be exported to beryl.
A second point to note is that, although the nominally dry experimental conditions,
the maximum amount of water incorporated into the sample is however significantly higher
than that of CO2. As explained above, the absolute H2O/CO2 amounts can be affected by the
use of wrong the εH2O coefficients, however, it is indisputable that the FTIR spectra of Figure
4 show significant H2O in the examined sample. Such relatively H2O content is probably the
result of the different pressure medium used in this experiment compared to those
described in Chapter 5 and 7. Indeed, the beryl described in this chapter was treated in an
externally heated vessel using H2O as a pressure medium, while the experiments described
in Chapter 5 and 7 were performed in a piston-cylinder apparatus, where pressure is
transmitted by NaCl.
3.2 Polarized-light FPA imaging
The distribution of H2O[I], H2O[II] and CO2 across the treated beryl was studied by using
polarized SR-FTIR FPA imaging; in this work, polarized light was necessary to differentiate the
absorptions related to H2O[I] and H2O[II] (e.g. Della Ventura et al., 2010). Contour maps were
obtained by integrating the ν3 antisymmetric stretching mode of H2O[I] at 3699 cm-1 (Fig. 5b)
for E//c, the ν1 symmetric stretching mode of H2O[II] at 3602 cm-1 (Fig. 5c) for E//c, and the ν3
antisymmetric stretching mode of CO2 at 2360 cm-1 (Fig. 5d) for Ec.
Figure 5b shows that H2O[I] is distributed rather homogeneously across the sample,
except close to the core of the grain, where the H2O[I] content is almost 70%. H2O[II] is also
distributed rather homogeneously (Fig. 5c), however along the hourglass boundary its
content decreases also about 70%. CO2 on the opposite is distributed exclusively close to the
(001) basal edges of the crystal, as expected, and, surprisingly, along the hourglass
boundaries.
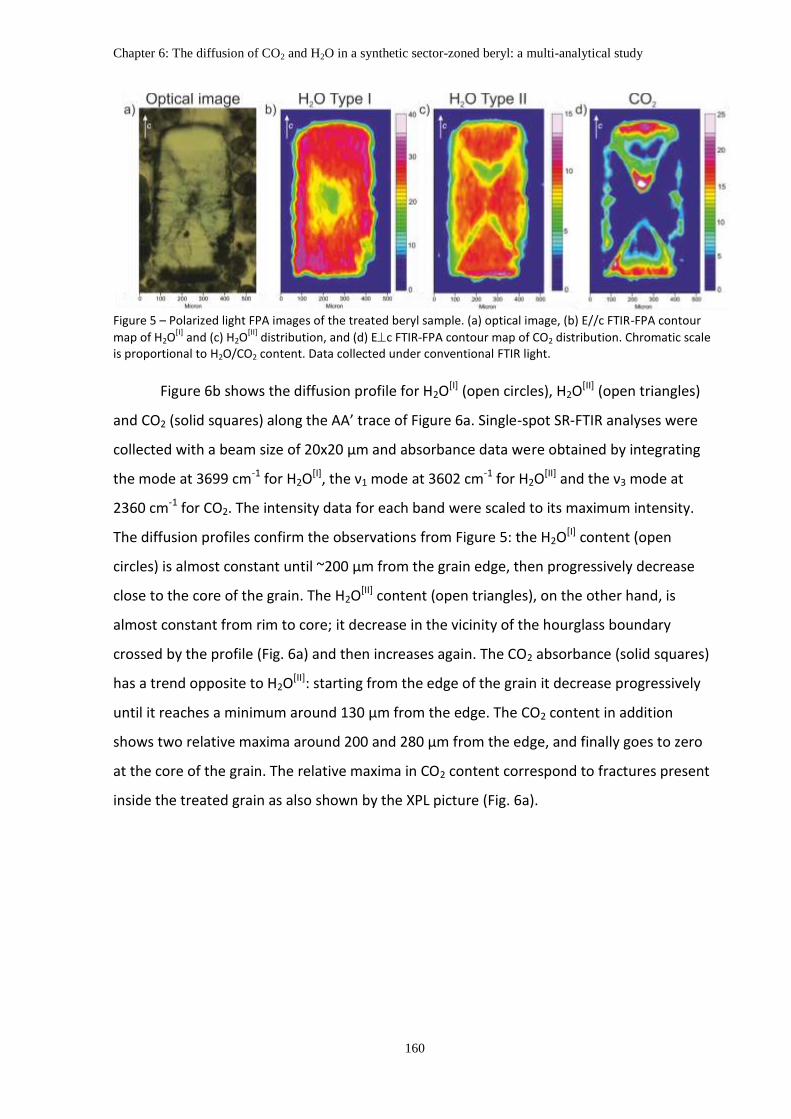
Chapter 6: The diffusion of CO2 and H2O in a synthetic sector-zoned beryl: a multi-analytical study
160
Figure 5 – Polarized light FPA images of the treated beryl sample. (a) optical image, (b) E//c FTIR-FPA contour
map of H2O[I]
and (c) H2O[II]
distribution, and (d) Ec FTIR-FPA contour map of CO2 distribution. Chromatic scale is proportional to H2O/CO2 content. Data collected under conventional FTIR light.
Figure 6b shows the diffusion profile for H2O[I] (open circles), H2O[II] (open triangles)
and CO2 (solid squares) along the AA’ trace of Figure 6a. Single-spot SR-FTIR analyses were
collected with a beam size of 20x20 µm and absorbance data were obtained by integrating
the mode at 3699 cm-1 for H2O[I], the ν1 mode at 3602 cm-1 for H2O[II] and the ν3 mode at
2360 cm-1 for CO2. The intensity data for each band were scaled to its maximum intensity.
The diffusion profiles confirm the observations from Figure 5: the H2O[I] content (open
circles) is almost constant until ~200 µm from the grain edge, then progressively decrease
close to the core of the grain. The H2O[II] content (open triangles), on the other hand, is
almost constant from rim to core; it decrease in the vicinity of the hourglass boundary
crossed by the profile (Fig. 6a) and then increases again. The CO2 absorbance (solid squares)
has a trend opposite to H2O[II]: starting from the edge of the grain it decrease progressively
until it reaches a minimum around 130 µm from the edge. The CO2 content in addition
shows two relative maxima around 200 and 280 µm from the edge, and finally goes to zero
at the core of the grain. The relative maxima in CO2 content correspond to fractures present
inside the treated grain as also shown by the XPL picture (Fig. 6a).
Chapter 6: The diffusion of CO2 and H2O in a synthetic sector-zoned beryl: a multi-analytical study
161
Figure 6 – (a) XPL image of the treated beryl. (b) Absorbance profiles along the AA’ trace in (a) for H2O[I]
(open circles), H2O
[II] (open triangles) and CO2 (solid squares); intensity data are expressed as % of the maximum
intensity for each target molecule. A fracture is present about 200 µm from the grain edge and a hole at about 280 µm. Spot size 15x15 µm, step 10 µm.
4. Discussion
4.1 Hourglass zoning and CO2 diffusion
During the experiments of CO2 diffusion in beryl and cordierite (this Thesis, chapter 5)
it was observed, in particular by high-resolution FPA imaging, that carbon dioxide diffusion in
beryl is faster along the structural channels parallel to [001], and eventually along fractures
presents in the grain. This behavior is in agreement with the diffusion mechanism of H2O in
beryl (Fukuda et al., 2009). The spectroscopic image given in Figure 5d clearly demonstrates
that the CO2 diffusion proceeds from the (001) surface into the grain along the [001]
direction. Single-spot, quantitative data collected on a traverse parallel to [001] (Figure 6b)
in addition show that the CO2 concentration profile follows the typical one dimensional
diffusion trend (see for example Fukuda et al., 2009, Zhang and Cherniak, 2010, and this
Thesis, chapter 5) up to about 130 µm from the crystal edge.
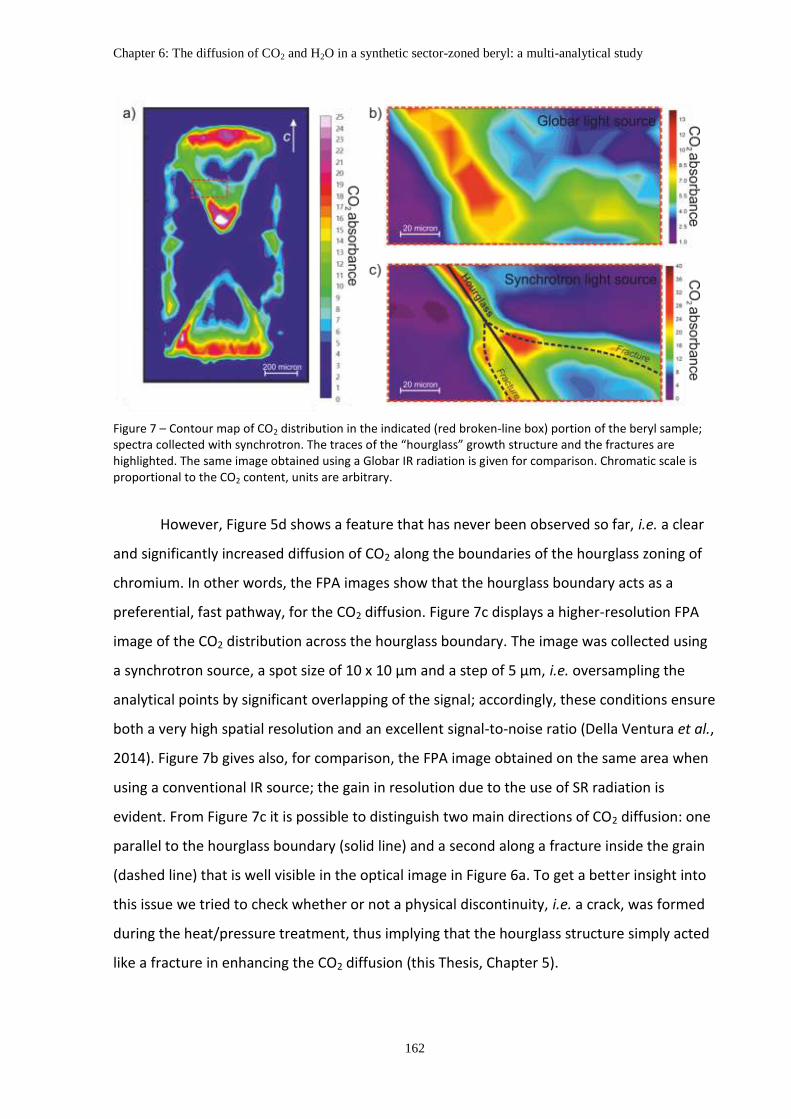
Chapter 6: The diffusion of CO2 and H2O in a synthetic sector-zoned beryl: a multi-analytical study
162
Figure 7 – Contour map of CO2 distribution in the indicated (red broken-line box) portion of the beryl sample; spectra collected with synchrotron. The traces of the “hourglass” growth structure and the fractures are highlighted. The same image obtained using a Globar IR radiation is given for comparison. Chromatic scale is proportional to the CO2 content, units are arbitrary.
However, Figure 5d shows a feature that has never been observed so far, i.e. a clear
and significantly increased diffusion of CO2 along the boundaries of the hourglass zoning of
chromium. In other words, the FPA images show that the hourglass boundary acts as a
preferential, fast pathway, for the CO2 diffusion. Figure 7c displays a higher-resolution FPA
image of the CO2 distribution across the hourglass boundary. The image was collected using
a synchrotron source, a spot size of 10 x 10 µm and a step of 5 µm, i.e. oversampling the
analytical points by significant overlapping of the signal; accordingly, these conditions ensure
both a very high spatial resolution and an excellent signal-to-noise ratio (Della Ventura et al.,
2014). Figure 7b gives also, for comparison, the FPA image obtained on the same area when
using a conventional IR source; the gain in resolution due to the use of SR radiation is
evident. From Figure 7c it is possible to distinguish two main directions of CO2 diffusion: one
parallel to the hourglass boundary (solid line) and a second along a fracture inside the grain
(dashed line) that is well visible in the optical image in Figure 6a. To get a better insight into
this issue we tried to check whether or not a physical discontinuity, i.e. a crack, was formed
during the heat/pressure treatment, thus implying that the hourglass structure simply acted
like a fracture in enhancing the CO2 diffusion (this Thesis, Chapter 5).

Chapter 6: The diffusion of CO2 and H2O in a synthetic sector-zoned beryl: a multi-analytical study
163
Figure 8 – FESEM pictures of the treated beryl sample in correspondence of the “hourglass” structure, in a fracture-free area (a and b) and in a fractured area (c, d, e and f). Note that in a, c and d the BSE compositional images of the investigated areas are given, while in b, e and f the morphological SE images are displayed. The red dashed line indicates the limit of the “hourglass” sector zoning and the yellow dashed line indicates a fracture in the grain.
Figure 8 shows high-resolution FESEM (Field-Emission SEM) images of selected areas
of the studied sample. The areas were chosen across the hourglass boundary, both in a point
optically clean and without fractures (Fig. 8a) and in a second point characterized the
presence of a fracture (Fig. 8c). The BSE (back-scattered electron) pictures displayed in
Figures 8a and 8b show how the higher magnification images given in Figures 8b, 8e and 8f
were indeed collected across the hourglass boundary, i.e. across the compositional
discontinuity due to the different Cr contents, and across a fracture (Fig. 8d) running semi-
parallel to this boundary. High-resolution SE (secondary electrons) morphological images
Chapter 6: The diffusion of CO2 and H2O in a synthetic sector-zoned beryl: a multi-analytical study
164
collected in the area displayed in Figure 8a show a perfectly flat surface suggesting that no
cracks are present along the hourglass boundary (Figure 8b, see red broken line), while in
correspondence of the fracture optically visible in Figure 8c (yellow dashed line) a defined
groove is clearly present (Figs. 8d to 8f). The FESEM images of Figure 8 thus allow the
conclusion that, at least at the scale of tenths of nm, the hourglass structure is exclusively
due to a compositional inhomogeneity, and that there is no physical discontinuity along the
compositional boundary. This being the case, the diffusion path observed along this
structure (Figs 5 and 6) cannot be explained on the basis of a fracture-enhanced diffusion
mechanism, therefore the process responsible for the enrichment of CO2 in specific
directions of the sample (i.e. along the hourglass boundaries) is probably similar to a defect-
enhanced mechanism.
Hollister (1970) showed that differences in growth rates of different crystal faces may
causes a mismatch in the periodical structure, and concluded that this mechanism may be
responsible for the formation of sector zoning in minerals. The mismatch is usually
characterized by chemical zoning, which is controlled by the presence of particular ions in
the supply material, by differences in local charge-balance and/or atomic geometrical
conditions (Hollister, 1970, Bahat, 1974); for instance this process has been shown to be
responsible for Pb zoning in synthetic cordierite (Wunder et al., 1991), Cr zoning in Be-
indialites (Mikhailov et al., 2007) and can explain the Cr zoning in the crystals studied here
(Fig. 5).
The images of Figure 7c suggest that the defects arising from the structural mismatch
likely speed up the diffusion of CO2, similarly to what observed along a fracture. Zhang et al.
(2006) studied the oxygen diffusion in titanite under different experimental conditions and
observed that planar defects may act as fast-path for diffusion inside the crystal lattice and
that diffusion along these directions may be even 4 - 5 orders of magnitude faster than the
lattice diffusion at the same PTt conditions. A similar mechanism could explain the
penetration of CO2 down to the core of the grain along the hourglass discontinuity. A
consequence of this discussion is that, in experimentally treated samples, several diffusion
mechanisms may locally act; for example, in the studied case, our spectroscopic data suggest
the possible combination of (a) a fast-path defects diffusion, (b) a fracture-induced diffusion
and (c) a structural-channel diffusion (this Thesis, Chapter 5). Therefore, in diffusion studies,
a careful characterization of the possible inhomogeneous distribution of the target molecule

Chapter 6: The diffusion of CO2 and H2O in a synthetic sector-zoned beryl: a multi-analytical study
165
inside the matrix is mandatory because measurement of diffusion coefficients could be
complicated by local effects.
4.2 The role alkali ions on the H2O diffusion
The images displayed in Figures 5c and 5d suggest that the role of the hourglass
zoning on the H2O diffusion is extremely different to that so far discussed for CO2. As a
matter of fact, the FTIR-FPA data show that while type I H2O diffusion is not affected by the
chemical zoning (Fig. 5b), H2O[II] incorporation/speciation is significantly decreased where
CO2 concentration is higher, and where Na has been locally replaced by K (compare Fig. 3c
with Fig. 5c).
In Figure 1b we showed that both H2O and CO2 share the same crystallographic
position (2a) in the channel, thus we would expect that areas with a higher concentration of
CO2 (like the hourglass traces) presented a lower global H2O content. However, the FPA
images show that only H2O[II] is depleted along the hourglass traces, while H2O[I] is
unaffected. In the introduction we mentioned that H2O[II] is strongly associated to the
monovalent cations inside the channels (Wood and Nassau, 1968; Goldmann et al., 1977),
and we also mentioned that in beryl K+ and other larger cations are located in the larger 2a
site (Hawthorne and Černý, 1977), where H2O[II] is also located; in Figure 3 we observe that
along the hourglass boundary there is an increase in K+ and a decrease of Na+. Considering
that H2O[II] may be associated preferentially, if not exclusively, to Na+, we conclude that the
H2O[II] depletion along the hourglass discontinuity may be the combined result of a paucity of
Na (which is preferentially bound to H2O) and an increase K+ content at the 2a site (Fig. 1). In
other words, the presence of K filling the 2a sites would prevent the occurrence of H2O at
the same site (compare Fig. 3c and 3d with Fig. 5c). Aines and Rossman (1984) in their high-T
study of water and CO2 in cordierite and beryl concluded that CO2 probably acts as a partial
plug for the diffusion of H2O along the cordierite channels. The same feature was also
observed by Johannes and Schreyer (1981) in their hydrothermal equilibration studies on
cordierite. Additionally CO2 may alter the local thermodynamic equilibrium of H2O, affecting
a particular speciation of water, similarly to the problem of diffusion and speciation of OH
and H2O in melt/glasses. Based on these considerations, we suggest that an additional
reason for the depletion of H2O[II] along the hourglass boundary could be simply connected
with the increased amount of CO2. As a final comment, Fukuda et al. (2008) observed in their

Chapter 6: The diffusion of CO2 and H2O in a synthetic sector-zoned beryl: a multi-analytical study
166
experiments that the dominant diffusive species along the beryl channels was type I H2O
relatively to type II H2O, however the FTIR-FPA images of Figure 5 show that this is not the
case in our samples, and clearly suggest that there is no major difference in the diffusivity of
the two water types, which seems to be controlled only by the alkali content. We have no
explanation at this moment for this discrepancy.

Chapter 7: Speciation and diffusion profiles of H2O in water-poor beryl: comparison with cordierite
167
CHAPTER 7
SPECIATION AND DIFFUSION PROFILES OF H2O IN WATER-POOR
BERYL:
COMPARISON WITH CORDIERITE
Abstract
This chapter reports the polarized FTIR study of two beryl samples treated in CO2-rich
atmosphere, at 700°C and 800°C, 700 MPa, respectively. The infrared spectra, as expected,
show the presence of CO2 but also of minor H2O due to moisture present in the starting
products used for the synthesis. FPA-FTIR images show that H2O diffuses into the beryl
matrix along the structural channels oriented parallel to [001]. Spectra collected along
profiles parallel to the c crystallographic axis show subtle changes as a function of the
distance from the crystal edge; these changes can be correlated to a progressive change in
the H2O coordination environment in the channel, as a response to the varying H2O/alkali
ratio. In particular, the data show that when 2·H2O > Na+ apfu, H2O can assume both type I
and type II orientation; in the latter case, each Na cation coordinates two H2O[II] molecules
(doubly coordinated H2O). If 2·H2O < Na+ apfu, then H2O[II] molecules are singly coordinated
to each Na cation. The same type of feature is observed and commented for the structurally
related cordierite.

Chapter 7: Speciation and diffusion profiles of H2O in water-poor beryl: comparison with cordierite
168
1. Introduction
Beryl, ideally Be3Al2Si6O18, is an accessory mineral typical of pegmatitic and granitic
rocks (e.g. Deer et al., 2006). In the beryl structure, SiO4 tetrahedra share common oxygens
to form six-membered hexagonal rings with [Si6O18]12- composition (Fig. 1a); the stacking of
these rings along the crystallographic c direction give rise to cages which are connected into
open channels parallel to [001] (Fig. 1b). The cages diameter is about 5.0 Å (Gibbs et al.,
1968), while the bottle necks of the channels have a diameter of 2.8 Å (Fukuda and Shinoda,
2011). For this reason beryl, as well as the isostructural cordierite, are of interest as a model
for microporous materials. It is known since the early work of Wood and Nassau (1967,
1968) that several atoms and molecular groups may be present in the structural voids of
beryl.
Figure 1 - Schematic representation of the crystal structures of beryl viewed down the crystallographic c axis (a)
and parallel to the (100) plane (b ). In blue the Si site, in orange the Al site and in gray the Be site. Mean
distances in the crystal cages are reported. The position on CO2 and H2O molecules are shown (modified after
Fukuda and Shinoda, 2011).
In particular, water and carbon dioxide (Wood and Nassau, 1968, Aines and Rossman,
1984) which are both located in the wider parts of the channels (2a position, Fig. 1b).
Possible OH groups (Wickersheim and Buchanan, 1959, Aurisicchio et al., 1994) and large
ions such as Cs and K are almost exclusively located at the 2a position (Hawthorne and
Černý, 1977) while smaller cations like Na+ (Wood and Nassau, 1968) always occupy the
Chapter 7: Speciation and diffusion profiles of H2O in water-poor beryl: comparison with cordierite
169
narrower 2b site (Fig. 1b). The linear CO2 molecules are oriented orthogonally to the c axis
(Wood and Nassau, 1968; Aines and Rossman, 1984). H2O groups occur in the structural
channels with the molecular plane parallel to (100) but with two different possible
orientations (Fig. 1b): type I H2O (hereafter H2O[I]) has with the H–H vector parallel to the c
axis, while type II H2O (H2O[II]) has the H–H vector perpendicular to the c axis (Wood and
Nassau, 1968). H2O molecules of the latter orientation are bonded locally to alkali cations at
the 2b site in a 2:1 ratio (Goldmann et al., 1977; Hawthorne and Černý, 1977), however,
Fukuda and Shinoda (2008, 2011) showed recently that in a low-H2O environment H2O[II] may
be bound to only one alkaline cation.
In the present PhD work, several volatile-free beryl single-crystals were treated in
CO2-rich environment at different PTt conditions, in order to study CO2 diffusion in the
structural channel (see Chapter 5). After the experimental runs, FTIR spectroscopy showed
systematically the presence of weak amounts of H2O in the samples. Due to the absence of
water as a pressure medium during the experiments (see below), the H2O trapped in the
beryl is inferred to originate from the moisture adsorbed by the used materials during the
tube preparation; because of this, diffused H2O contents are very low. For this reason, a
detailed polarized FTIR spectroscopic study was carried out to study the local environment
of such trace amounts of water into the beryl structure, such as to contribute to the
knowledge of the coordination environment and the physical state of H2O in beryl, after the
extensive studies of Kolesov (2008), Fukuda and Shinoda (2008, 2011) and Fukuda et al.
(2009).
2. Experimental methods and studied materials
Experiments were carried out using synthetic H2O and CO2-free beryls (Hautefeuille
and Perrey, 1888, 1890; Bellatreccia et al., 2008, this Thesis, cap. 5) as starting materials.
Single-crystals were packed into Pt tubes together with crushed Al2O3 powder as inert, and
silver carbonate as a CO2 source and treated at different PTt conditions. Two samples were
selected for the present study, treated at the same P = 700 MPa and T = 700 °C (Pa_340 r)
and 800 °C (Pa_340 o), respectively. Experiments were done using a non end-load piston-
cylinder apparatus QUICKpress™ at the HP-HT Laboratory of Experimental Volcanology and

Chapter 7: Speciation and diffusion profiles of H2O in water-poor beryl: comparison with cordierite
170
Geophysics of Instituto Nazionale di Geofisica e Vulcanologia (INGV, Rome, Italy). After the
run, the recovered crystals were oriented along (hk0) using the external morphology.
FTIR spectra were acquired using a Bruker™ Hyperion 3000 microscope equipped
with a conventional Globar IR source, a KBr broadband beamsplitter and a liquid nitrogen-
cooled MCT detector, at Laboratori Nazionali di Frascati, Istituto Nazionale di Fisica Nucleare
(LNF-INFN), in Frascati (Rome). The polarized spectra were collected using a gold-wire-grid
polarizer. The nominal resolution was 4 cm-1 and 128 scans were averaged for both
spectrum and background. FTIR images were collected with a 64 x 64 pixel focal-plane array
(FPA) of liquid nitrogen-cooled MCT detectors coupled with a 15x Schwarzschild objective.
The nominal resolution was set at 4 cm−1 and 64 scans were averaged for both spectrum and
background; each image covers an area of 170 µm x 170 µm with a spatial resolution close to
5 µm (Della Ventura et al., 2010, 2014). Polarized FTIR profiles were performed with a spot
size 25 X 80 µm, collecting the data at steps of 20 µm.
Selected polarized FTIR spectra, collected on the crystal edge (see below) are given in
Figure 2. The spectra show a sharp and very intense peak at 2360 cm-1 for Ec which is
assigned to the antisymmetric stretching mode of CO2, and a group of sharp peaks in the
H2O stretching region (3750-3500 cm-1).
Figure 2. Polarized FTIR spectra of sample Pa 340_o collected on the crystal edge (see text for explanation).

Chapter 7: Speciation and diffusion profiles of H2O in water-poor beryl: comparison with cordierite
171
Peak areas were determined using the routine built into the spectrometer software;
the spectra were decomposed using Origin 9™ by using a Lorentzian shapes for all
components except for the broad absorption at 3665 cm-1 which was modeled as a Gaussian
band (Kolesov, 2008). Peak positions and widths were constrained to be constant and the
background was modeled as linear; an example is given in Figure 3.
Figure 3 - Decomposed single-crystal polarized FTIR spectra of beryl Pa 340_r in H2O stretching region for (a)
Ec and (b) E // c, and in H2O bending region (c). Experimental spectrum = black line, fitted peaks = gray line,
calculated pattern = dashed black curve; peak position are reported.

Chapter 7: Speciation and diffusion profiles of H2O in water-poor beryl: comparison with cordierite
172
The maximum amount of water and CO2 incorporated into the sample were
quantified, via the Beer-Lambert relationship, see this Thesis, cap 6. Absorbance values (A)
were obtained from polarized data collected on the edge of the grain (see below); the used
mode, type of absorbance and molar absorption coefficients are summarized in Table 1.
Table 1 – Used mode, method, absorption coefficients and resulting H2O and CO2 contents (ppm) for the studied beryl samples. For explanation, see text.
Linear abosorbance data; εl values from Charoy et al. (1996) for type I H2O, and from Goldman et al. (1977) for type II H2O
Molecule Mode, position and polarization εl (l·mol-1
·cm-1
) Pa_340_r Pa_340_o
Type I H2O 3 at 3699 cm-1
, E//c 197 1215 ± 172 544 ± 77
Type II H2O 1 at 3602 cm-1
, E//c 256 725 ± 102 611 ± 86
Total H2O
Integrated absorbance data; εi values recalculated after Charoy et al. (1996), see also Chapter 5
Molecule Mode, position and polarization εi (l·mol-1
·cm-2
)
CO2 3 at 2360 cm-1
, Ec 70000±7000 1795 ± 276 1071 ± 159
3. FTIR-FPA imaging
Figure 4 – FTIR-FPA images of the H2O distribution for (a) sample Pa 340_r, (107 µm thick section) treated at
700 MPa, 700 °C for 24 hrs and (b) sample Pa 340_o (188 µm thick section) treated at 700 MPa, 800 °C for 10
hrs. Color scale is proportional to water concentration (integration range 3740-3565 cm-1
), units are cm-1
. The
white arrows indicate the direction FTIR profile in Figure 5.

Chapter 7: Speciation and diffusion profiles of H2O in water-poor beryl: comparison with cordierite
173
The FPA-FTIR maps of the H2O distribution within the studied samples (Fig. 4) shows
that the H2O content is maximum at both edges of the crystal or in fractures along the
sample (Fig. 4a, see also Chapter 5). Based on single-spot FTIR data Fukuda et al. (2009)
inferred that the H2O diffusion in beryl proceeds exclusively along the structural channels
parallel to the c crystallographic axis, implying that the H2O content must be maximum on
the edge of the grain, then progressively decrease toward the crystal; this is what we
actually observe using FPA imaging (Fig. 4), and, more generally, in all beryl and cordierite
samples studied during this Thesis (chapters 5 and 6). The white arrows in Figure 4 indicate
the profiles along which we collected FTIR single spot data used for the discussion presented
below. Based on the FPA images, we thus assume that proceeding from the edge of the grain
along the analytical profile, the H2O content progressively decreases, providing the
possibility to compare the FTIR patterns collected on points with different H2O contents, in
the same matrix. For each point, the H2O content was quantified using the polarized data, as
explained above.
4. Polarized FTIR measurements
Figures 3a and 3b show an enlargement of the fitted spectra of Figure 2 in the water
stretching 3800-3500 cm-1 region. For Ec (Fig. 3a) a very broad and convolute absorption is
observed, centered at 3665 cm-1; relatively sharp and intense peaks are resolved at 3725,
3643, 3602 and 3586 cm-1, and a minor peak is also visible at 3699 cm-1. The 3665 cm-1 band
is assigned to the ν3 mode H2O[II], while the 3602 cm-1 component is assigned to the ν1 mode
of type I H2O (see Fukuda and Shinoda, 2008). The sharp peaks at 3725 and 3586 cm-1 have
never been observed in the water region for beryl when Ec; based on the data for
cordierite, these bands can be related to the ν3 + ν1 and ν3 + 2ν2 combination modes of CO2,
respectively (Della Ventura et al., 2009, 2012). This assignment is confirmed by their
polarization behavior and by the excellent correlation between their intensity with that of
the ν3 mode of CO2 (see Chapter 5). Assignment of the sharp 3643 cm-1 peak will be
discussed in a later section. The E//c spectrum (Fig. 3b) shows a sharp and intense peak at
3699 cm-1 which is assigned to the ν3 mode H2O[I] (Wood and Nassau, 1967); this band occurs
also in the Ec spectrum with a very low intensity (Fig. 3a), possibly due to a slight

Chapter 7: Speciation and diffusion profiles of H2O in water-poor beryl: comparison with cordierite
174
misalignment of the section. In Figure 3b two relatively intense peaks are resolved at 3600
and 3589 cm-1, respectively. The former band is assigned to the ν1 mode of type I H2O. The
latter component can be assigned to the ν1 mode of a new water configuration in beryl, i.e.
to the "singly coordinated" type II water (Fukuda and Shinoda, 2008); this point will be
discussed in more details below. The E//c spectrum in the H2O bending region (Fig. 3c) shows
two components centered at 1633 and 1620 cm-1. Based on the work of Fukuda and Shinoda
(2008, 2011) these peaks can be correlated with the ν2 bending motion of H2O[II].
Figure 5 - Polarized IR spectra collected for sample Pa 340_r in the H2O stretching region with (a) Ec and (b) E//c, and in the H2O bending region (c) for E//c. The distance from the grain rim is indicated on the right. Upward and downward arrows indicate increase or decrease in the peak intensity.
The evolution of the polarized FTIR patterns of sample Pa 340_r, as a function of the
distance from the crystal rim, is given in Figure 5; it is evident that several variations occur in
the spectra, and, as explained above, these variations are connected with the progressive
decrease in the H2O content. In particular, the intense band at 3699 cm-1 rapidly decreases
while progressing within the crystal, and disappears at a distance > 120 m from the rim (see
spectra for E//c in Figure 5b). The broad band at 3665 cm-1 (for Ec, Fig. 5a) and the sharp
peak at 3600 cm-1 (for E//c, Fig. 5b) also decrease progressively in the same range. By

Chapter 7: Speciation and diffusion profiles of H2O in water-poor beryl: comparison with cordierite
175
contrast, the sharp peak at 3643 cm-1 (Ec, Fig. 5a) and the 3589 cm-1 component (E//c, Fig.
5b) initially grow in intensity and then eventually decrease, but persist up to 340 µm from
the rim. In the bending region (spectra collected for E//c, Fig. 5c), the 1620 cm-1 component
follows the same intensity variation of the 3665/3600 cm-1 pair, while the trend of the 1633
cm-1 component is similar to that of the 3589 cm-1 band. No absorptions related to the H2O[I]
bending mode (1626, 1600, 1544 cm-1 after Charoy et al., 1996) were present in the spectra,
probably because of the low H2O contents.
Figure 6 clearly shows that the measured absorbance of the 3600/1620 and
3589/1633 cm-1 pair of bands are strongly correlated, and this feature, coupled with the fact
that both sets of bands occur with E polarized in the same direction, allows their assignment
to two different water molecules, but oriented in a similar way.
Figure 6 – Absorbance relationship between for the 1620/3600 cm-1
and 1633/3589 cm-1
peaks, sample Pa 340_r.
As discussed by Fukuda and Shinoda (2008) considering that these water molecules
have different vibrational frequency, their coordination state in the structural channel must
also be different. The 3643 cm-1 component, observed above in Figures 3a and 5a for Ec is
also compatible with this scenario. From the recent work of Fukuda and Shinoda (2008,
2011) it is now clear that type II water occurs in the beryl channels with two bonding
environments, called "doubly-coordinated" type II water, and "singly-coordinated" type II
water in Fukuda and Shinoda (2008). The former molecule is characterized by a ν3 mode
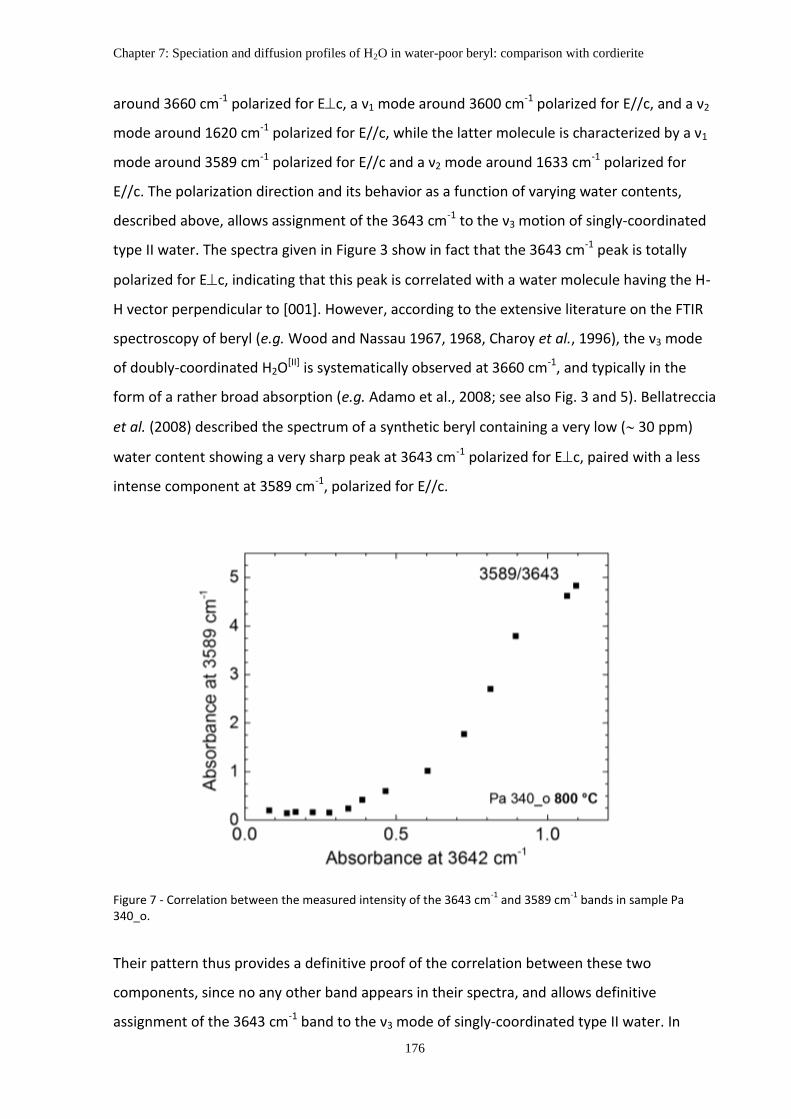
Chapter 7: Speciation and diffusion profiles of H2O in water-poor beryl: comparison with cordierite
176
around 3660 cm-1 polarized for Ec, a ν1 mode around 3600 cm-1 polarized for E//c, and a ν2
mode around 1620 cm-1 polarized for E//c, while the latter molecule is characterized by a ν1
mode around 3589 cm-1 polarized for E//c and a ν2 mode around 1633 cm-1 polarized for
E//c. The polarization direction and its behavior as a function of varying water contents,
described above, allows assignment of the 3643 cm-1 to the ν3 motion of singly-coordinated
type II water. The spectra given in Figure 3 show in fact that the 3643 cm-1 peak is totally
polarized for Ec, indicating that this peak is correlated with a water molecule having the H-
H vector perpendicular to [001]. However, according to the extensive literature on the FTIR
spectroscopy of beryl (e.g. Wood and Nassau 1967, 1968, Charoy et al., 1996), the ν3 mode
of doubly-coordinated H2O[II] is systematically observed at 3660 cm-1, and typically in the
form of a rather broad absorption (e.g. Adamo et al., 2008; see also Fig. 3 and 5). Bellatreccia
et al. (2008) described the spectrum of a synthetic beryl containing a very low ( 30 ppm)
water content showing a very sharp peak at 3643 cm-1 polarized for Ec, paired with a less
intense component at 3589 cm-1, polarized for E//c.
Figure 7 - Correlation between the measured intensity of the 3643 cm-1
and 3589 cm-1
bands in sample Pa 340_o.
Their pattern thus provides a definitive proof of the correlation between these two
components, since no any other band appears in their spectra, and allows definitive
assignment of the 3643 cm-1 band to the ν3 mode of singly-coordinated type II water. In
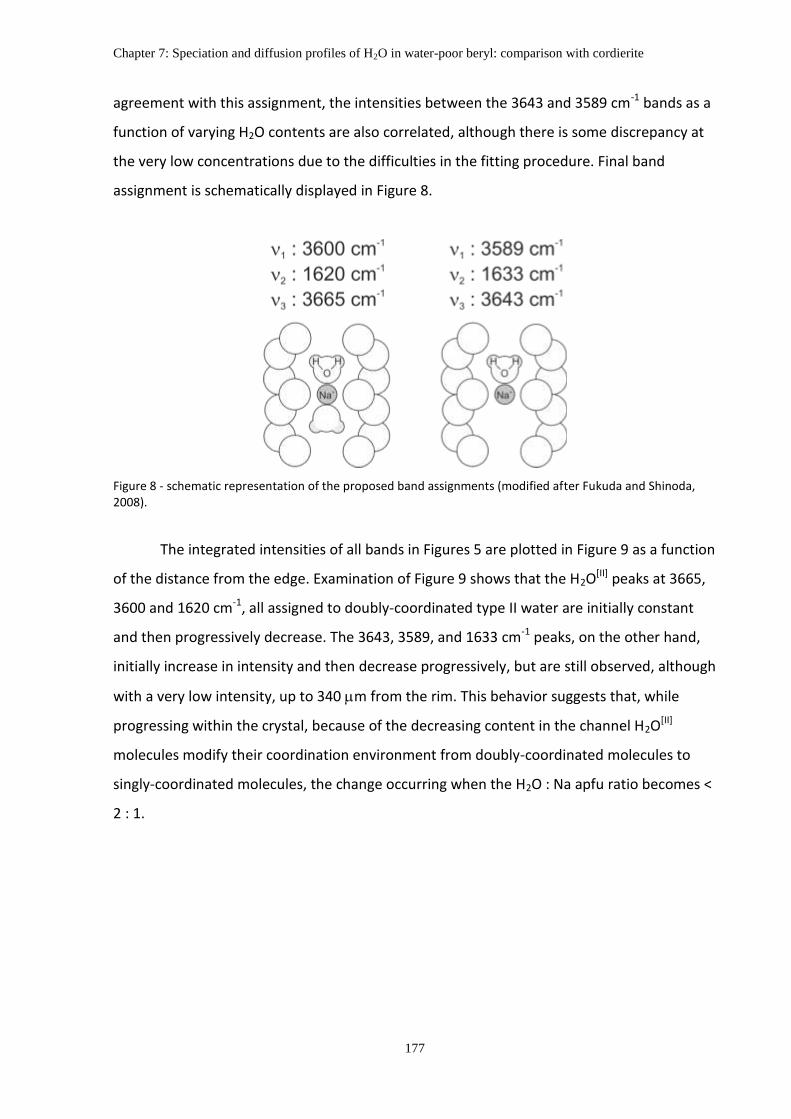
Chapter 7: Speciation and diffusion profiles of H2O in water-poor beryl: comparison with cordierite
177
agreement with this assignment, the intensities between the 3643 and 3589 cm-1 bands as a
function of varying H2O contents are also correlated, although there is some discrepancy at
the very low concentrations due to the difficulties in the fitting procedure. Final band
assignment is schematically displayed in Figure 8.
Figure 8 - schematic representation of the proposed band assignments (modified after Fukuda and Shinoda, 2008).
The integrated intensities of all bands in Figures 5 are plotted in Figure 9 as a function
of the distance from the edge. Examination of Figure 9 shows that the H2O[II] peaks at 3665,
3600 and 1620 cm-1, all assigned to doubly-coordinated type II water are initially constant
and then progressively decrease. The 3643, 3589, and 1633 cm-1 peaks, on the other hand,
initially increase in intensity and then decrease progressively, but are still observed, although
with a very low intensity, up to 340 m from the rim. This behavior suggests that, while
progressing within the crystal, because of the decreasing content in the channel H2O[II]
molecules modify their coordination environment from doubly-coordinated molecules to
singly-coordinated molecules, the change occurring when the H2O : Na apfu ratio becomes <
2 : 1.

Chapter 7: Speciation and diffusion profiles of H2O in water-poor beryl: comparison with cordierite
178
Figure 9 - Evolution of selected peak areas for sample Pa 340_o (a, c and e) and sample Pa 340_r (b, d and f).
5. The coordination of H2O in beryl and cordierite
According to several studies, type II H2O and alkali cations are typically in the ratio 2:1
in both beryl (e.g. Charoy et al., 1996; Kolesov, 2008) and cordierite (e.g. Della Ventura et al.,
2010), suggesting that in both minerals each alkali cation is normally associated with two
water molecules in the channel. However, both Fukuda and Shinoda (2008, 2011) and this
work, provides evidence that in H2O poor samples this relationship is no longer valid, and
each alkali cation may coordinate to a single H2O[II] molecule. The same point was also
addressed by Kolesov (2008) in his analysis of Raman spectra collected on H2O-poor beryl.
A theoretical approach to this feature has been provided by Bauschlicher et al. (1991)
and Lee et al. (2004), who simulated the energy of M(H2O)n+ clusters as a function of
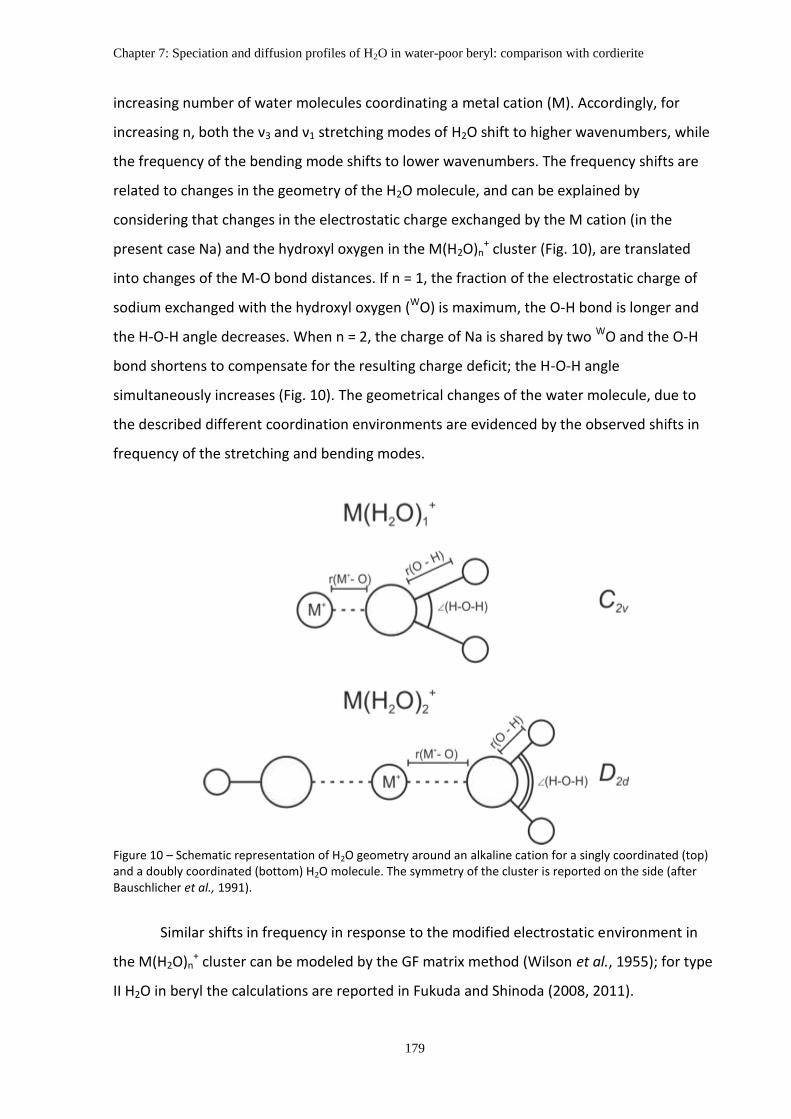
Chapter 7: Speciation and diffusion profiles of H2O in water-poor beryl: comparison with cordierite
179
increasing number of water molecules coordinating a metal cation (M). Accordingly, for
increasing n, both the ν3 and ν1 stretching modes of H2O shift to higher wavenumbers, while
the frequency of the bending mode shifts to lower wavenumbers. The frequency shifts are
related to changes in the geometry of the H2O molecule, and can be explained by
considering that changes in the electrostatic charge exchanged by the M cation (in the
present case Na) and the hydroxyl oxygen in the M(H2O)n+ cluster (Fig. 10), are translated
into changes of the M-O bond distances. If n = 1, the fraction of the electrostatic charge of
sodium exchanged with the hydroxyl oxygen (WO) is maximum, the O-H bond is longer and
the H-O-H angle decreases. When n = 2, the charge of Na is shared by two WO and the O-H
bond shortens to compensate for the resulting charge deficit; the H-O-H angle
simultaneously increases (Fig. 10). The geometrical changes of the water molecule, due to
the described different coordination environments are evidenced by the observed shifts in
frequency of the stretching and bending modes.
Figure 10 – Schematic representation of H2O geometry around an alkaline cation for a singly coordinated (top) and a doubly coordinated (bottom) H2O molecule. The symmetry of the cluster is reported on the side (after Bauschlicher et al., 1991).
Similar shifts in frequency in response to the modified electrostatic environment in
the M(H2O)n+ cluster can be modeled by the GF matrix method (Wilson et al., 1955); for type
II H2O in beryl the calculations are reported in Fukuda and Shinoda (2008, 2011).
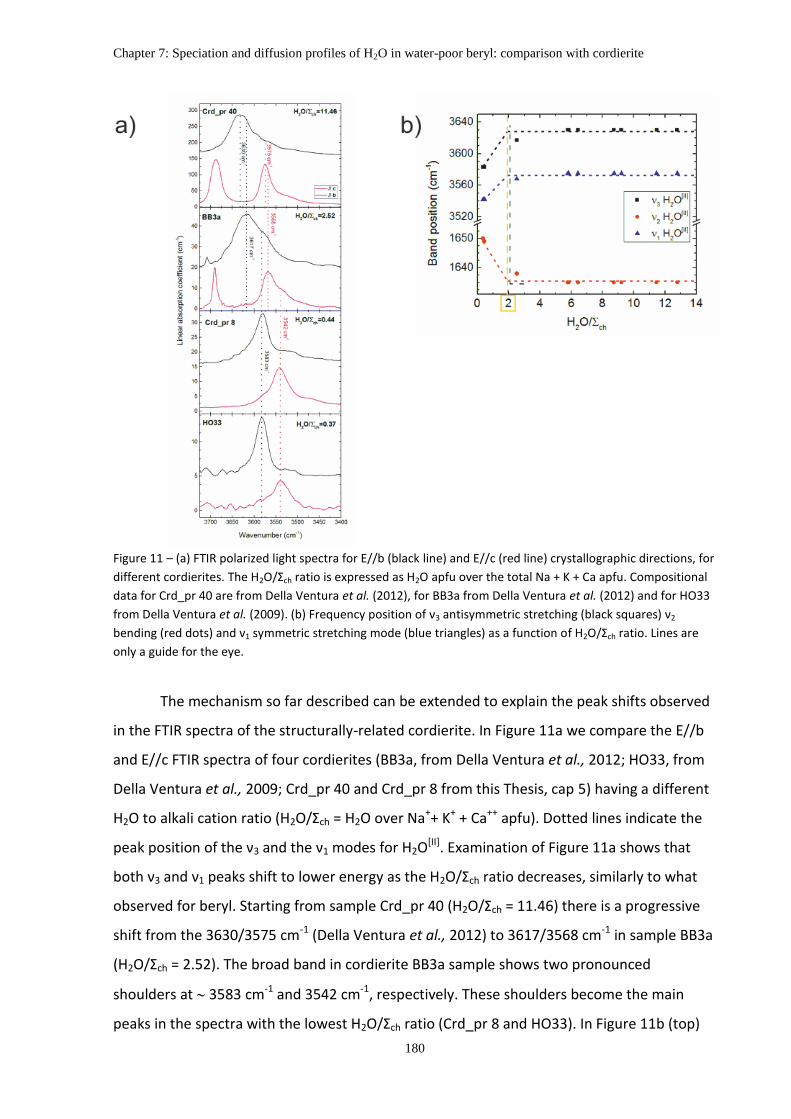
Chapter 7: Speciation and diffusion profiles of H2O in water-poor beryl: comparison with cordierite
180
Figure 11 – (a) FTIR polarized light spectra for E//b (black line) and E//c (red line) crystallographic directions, for
different cordierites. The H2O/Σch ratio is expressed as H2O apfu over the total Na + K + Ca apfu. Compositional
data for Crd_pr 40 are from Della Ventura et al. (2012), for BB3a from Della Ventura et al. (2012) and for HO33
from Della Ventura et al. (2009). (b) Frequency position of ν3 antisymmetric stretching (black squares) ν2
bending (red dots) and ν1 symmetric stretching mode (blue triangles) as a function of H2O/Σch ratio. Lines are
only a guide for the eye.
The mechanism so far described can be extended to explain the peak shifts observed
in the FTIR spectra of the structurally-related cordierite. In Figure 11a we compare the E//b
and E//c FTIR spectra of four cordierites (BB3a, from Della Ventura et al., 2012; HO33, from
Della Ventura et al., 2009; Crd_pr 40 and Crd_pr 8 from this Thesis, cap 5) having a different
H2O to alkali cation ratio (H2O/Σch = H2O over Na++ K+ + Ca++ apfu). Dotted lines indicate the
peak position of the ν3 and the ν1 modes for H2O[II]. Examination of Figure 11a shows that
both ν3 and ν1 peaks shift to lower energy as the H2O/Σch ratio decreases, similarly to what
observed for beryl. Starting from sample Crd_pr 40 (H2O/Σch = 11.46) there is a progressive
shift from the 3630/3575 cm-1 (Della Ventura et al., 2012) to 3617/3568 cm-1 in sample BB3a
(H2O/Σch = 2.52). The broad band in cordierite BB3a sample shows two pronounced
shoulders at 3583 cm-1 and 3542 cm-1, respectively. These shoulders become the main
peaks in the spectra with the lowest H2O/Σch ratio (Crd_pr 8 and HO33). In Figure 11b (top)

Chapter 7: Speciation and diffusion profiles of H2O in water-poor beryl: comparison with cordierite
181
we plot the ν3 (squares) and ν1 (triangles) peak positions against the H2O/Σch ratio (data from
Della Ventura et al., 2012). As expected from the above discussion, the ν2 bending mode
(Fig. 11b, circles), shows an opposite trend for increasing H2O/Σch ratio, from 1634 cm-1 to
1650 cm-1. Figure 11b emphasizes that there is a sudden shift in peak position for
compositions with H2O/Σch < 2. This threshold value corresponds to the ratio of 2 H2O[II] for
each alkali cation atom in the channel: when this ratio is below 2 the 3583 – 3542 – 1650 cm-
1 components prevail suggesting that H2O[II] is predominantly in a singly-coordinated state.
6. Conclusions
Figure 12 – Top: schematic representation of the configuration of water molecules inside the structural
channels of beryl, as the overall water content decreases. Bottom: concentration trends of selected peaks in
the FTIR spectra. Peak intensities are scaled to the maximum intensity value.

Chapter 7: Speciation and diffusion profiles of H2O in water-poor beryl: comparison with cordierite
182
Figure 12 displays schematically the summary of the discussion presented so far,
providing a sketch of the water molecules within the beryl channels as H2O concentration
progressively decreases, correlated with the plots relating the intensity variation of the
antisymmetric stretching modes for each H2O configuration. From the plot it is apparent that
for higher water contents on the crystal edge, H2O can assume both type I and type II
orientations (black squares and gray circles curves close to the edge in Fig. 12) and this
implies that 2·H2O > Na+ apfu. Proceeding within the channel, all H2O molecules tend to
assume the type II configuration (doubly H2O[II], gray circle curve) implying that the water
content approaches 2·H2O ≈ Na+ apfu. Proceeding further within the channel, the water
content reaches 2·H2O < Na+ apfu and singly coordinated H2O[II] predominates (singly H2O[II],
black triangles curve).
The above FTIR data thus allow to conclude that H2O diffuses across the structural
channels as an unbounded molecule, then it changes its local bonding configurations as a
function of the based on the Na/H2O ratio. The diffusion coefficients for H2O[I] and H2O[II]
(considering for simplicity the doubly and the singly coordinated H2O[II] as a single molecule)
were evaluated for both samples, using the monodimensional plane diffusion formalism
(Crank, 1975, Zhang and Cherniak, 2010) as discussed in chapter 5. Profile data were
obtained by integrating the H2O[I] ν3 anti-symmetric stretching mode at 3699 cm-1 polarized
for E//c and the sum of both H2O[II] ν1 symmetric stretching modes at 3600 and 3589 cm-1
also polarized for E//c. The results are reported in Table 2. The calculated mean activation
energy for H2O[I] (Ea) is 135 kJ/mol with a pre-exponential (-logD0) factor of 10-6.61 (m2/s) or
10-2.61 (cm2/s), for H2O[II] Ea = 90 kJ/mol and -logD0 = 10-8.43 (m2/s) or 10-4.43 (cm2/s). The
combined result for total H2O is Ea = 111±54 kJ/mol and -logD0 = 10-7.5 (m2/s) or 10-3.5
(cm2/s). It is to be noted that the results for H2O[I] are in good agreement with those
obtained by Fukuda et al. (2009), for the same molecular type.
Table 2 – Diffusion coefficients for H2O[I]
and H2O[II]
along the structural channels of beryl.
Sample Pressure (MPa)
Temperature (°C)
Time (h)
D (m2/sec)
1000/T (K)
Log D
Pa_340 r H2O[I] 700 700 24 1.8±0.1 E-14 1.03 -13.75±0.06
Pa_340 r H2O[II] 700 700 24 5.2±0.3 E-14 1.03 -13.28±0.05
Pa_340 o H2O[I] 700 800 10 8.3±0.6·E-14 0.93 -13.08±0.07
Pa_340 o H2O[II] 700 800 10 1.5±0.1·E-13 0.93 -12.83±0.07

Chapter 8: the permanent storage of CO2 in mesoporous minerals: experiments with beryl
183
PUBLISHED ON RENDICONTI ONLINE SOCIETÀ GEOLOGICA ITALIANA (2014)
DOI 10.1007/s00410-012-0779-8
CHAPTER 8
THE PERMANENT STORAGE OF CO2 IN MESOPOROUS MINERALS:
EXPERIMENTS WITH BERYL
Giancarlo Della Ventura1, Francesco Radica1, Fabio Bellatreccia1 and Lidia
Bellomo1
1Laboratorio di spettroscopia FTIR, Università di Roma Tre, Largo S. Leonardo Murialdo 1,
00146 ROMA
Abstract
In this short note we describe the recent experimental mineralogy work at University of
Roma Tre focused on the diffusion of carbon dioxide within the structural channels of
microporous silicates. The results obtained in the last few years for cordierite and beryl are
briefly reported, as well as the developments of novel spectroscopic methods to
characterize the volatile distribution across the studied materials.
KEY WORDS: CO2 diffusion, HT/HP experiments, cordierite, beryl, FTIR-FPA spectroscopy and
imaging, optical properties.

Chapter 8: the permanent storage of CO2 in mesoporous minerals: experiments with beryl
184
Carbon dioxide (CO2) generated by the combustion of fossil fuels is by far the most
abundant greenhouse gas; its reduction in the atmosphere is therefore a primary
environmental concern. Due to several reasons, it can be easily understood that fossil fuels
will continue to play a significant role in the world’s economy at least in the following
decades, thus emphasis must be placed on improving methods to decrease the amount of
CO2 dispersed in the environment. The reduction of CO2 from the atmosphere can be
achieved by efficiency improvements in power plants, use of alternative energy
technologies, sequestration of CO2, or some combination of these methods. Up to the
present, several techniques have been considered, and these include: 1) forestation, where
CO2 is removed from the atmosphere by biological activity; 2) aquifer storage, in which CO2
is injected into terrestrial aquifers where it is trapped hydro-dynamically; 3) deep sea
storage, where CO2 is injected into the ocean at approximately 3,000 meter depths, where it
is believed to remain stable; and 4) mineral carbonation, in which CO2 is reacted with
minerals to form solid carbonates. This final form of sequestration is the most permanent
method, because the carbonates are stable over geologic time periods (millions of years),
rather than the hundreds to thousands of years of stability expected for the first three forms
of sequestration. This process is however highly expensive and energy consuming, therefore
research in material science has focused in the last decade at developing technically feasible
processes for mineral sequestration of carbon dioxide alternative to carbonation.
Actually, many minerals contain carbon as a major to trace constituent, however the
carbon content analysed in naturally occurring silicates is traditionally assigned to CO32-
groups in the structure, whereas the possible presence of molecular CO2 in these phases is
almost completely ignored. Up to the present, the only accepted CO2-bearing minerals are
beryl (Wood and Nassau, 1967) and cordierite (Armbruster and Bloss, 1980, Della Ventura et
al., 2009, 2012) two (structurally) closely related silicates characterized by open channels
running along [001]; in these channels carbon dioxide is located together with H2O and extra
framework cations such as Na, Li or Cs. Recent research have shown that other silicate
materials are able to host molecular CO2 in their structural pores; these materials include
some clay-like minerals (Zhang et al., 2005), some particular type of hydrous silica (Kolesov
and Geiger, 2003) and several microporous, zeolite-type, feldspathoids (Bellatreccia, 2009,
2012, Bonaccorsi et al., 2007, Della Ventura et al., 2005, 2007, 2008).

Chapter 8: the permanent storage of CO2 in mesoporous minerals: experiments with beryl
185
Figure 1 - Photo of the studied synthetic emeralds
We devoted significant efforts in the last years to the problem of CO2 diffusion in
microporous minerals, and in particular in cordierite and beryl. Cordierite is an extremely
interesting material because it represents the only known case of a microporous structure
(pore size under 2 nm) stable under extreme geological conditions and able to trap
significant amounts of molecular H2O and CO2 (Armbruster and Bloss 1980). As a matter of
fact, its occurrence extends from the amphibolite facies to ultra-high temperature
metamorphism to crustal anatexis (Carrington and Harley, 1996; Harley et al., 2002).
Because of its thermal and mechanical properties cordierite is used in applications such as
high-tech ceramics or as a catalyst in petroleum industry. Beryl is a pegmatitic mineral and
has a lower thermal and baric stability; it is well known for providing some of the most
notable gemstones, such as the varieties emerald (green), aquamarine (light-blue), heliodor
(yellow) or bixbite (red). We used natural cordierite and synthetic emeralds (Fig. 1) as
starting materials for CO2 diffusion experiments under high P and T conditions; this research
has been developed in the frame of two Master Thesis and a PhD project in collaboration
with the INFN (Istituto Nazionale di Fisica Nucleare) and INGV (Istituto Nazionale di Geofisica
e Vulcanologia).
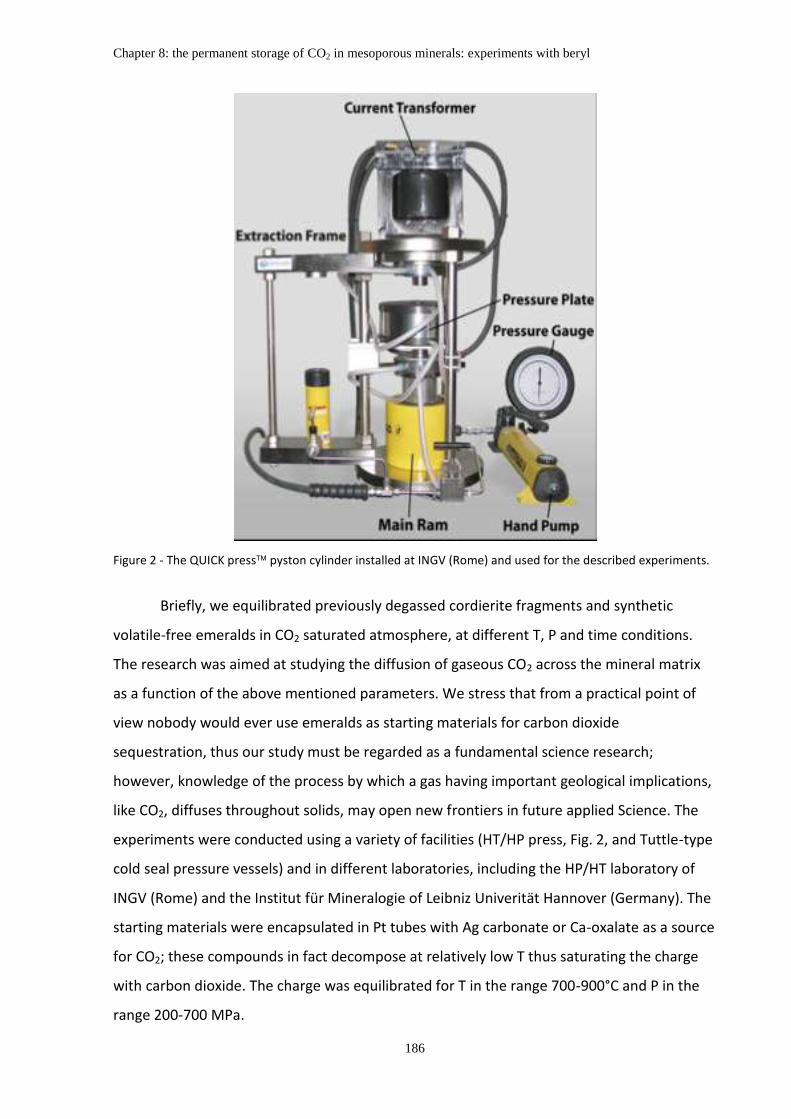
Chapter 8: the permanent storage of CO2 in mesoporous minerals: experiments with beryl
186
Figure 2 - The QUICK press pyston cylinder installed at INGV (Rome) and used for the described experiments.
Briefly, we equilibrated previously degassed cordierite fragments and synthetic
volatile-free emeralds in CO2 saturated atmosphere, at different T, P and time conditions.
The research was aimed at studying the diffusion of gaseous CO2 across the mineral matrix
as a function of the above mentioned parameters. We stress that from a practical point of
view nobody would ever use emeralds as starting materials for carbon dioxide
sequestration, thus our study must be regarded as a fundamental science research;
however, knowledge of the process by which a gas having important geological implications,
like CO2, diffuses throughout solids, may open new frontiers in future applied Science. The
experiments were conducted using a variety of facilities (HT/HP press, Fig. 2, and Tuttle-type
cold seal pressure vessels) and in different laboratories, including the HP/HT laboratory of
INGV (Rome) and the Institut für Mineralogie of Leibniz Univerität Hannover (Germany). The
starting materials were encapsulated in Pt tubes with Ag carbonate or Ca-oxalate as a source
for CO2; these compounds in fact decompose at relatively low T thus saturating the charge
with carbon dioxide. The charge was equilibrated for T in the range 700-900°C and P in the
range 200-700 MPa.

Chapter 8: the permanent storage of CO2 in mesoporous minerals: experiments with beryl
187
Figure 3 - Left: selected FTIR-FPA image of the CO2 distribution within the emerald samples equilibrated at 700°C, 500 MPa in carbon dioxide saturated atmosphere. The spectroscopic image is oriented over the crystal image. The color from red to blue is proportional to the amount of CO2. Right: schematic model for the CO2 diffusion within the structural channels.
This short note is not intended to describe all obtained results, however, from a
general point of view we observed that temperature has a very small effect on the CO2
solubility in the studied minerals, while pressure has a significant effect; the effect of time is
also negligible. To characterize the run products we used a novel technique in mineral
spectroscopy (Della Ventura et al., 2014), which takes advantage of the focal-plane-array of
detectors (FPA) to produce bi-dimensional images of the distribution of an absorber within a
matrix, a concept very similar to the CCD detectors typically used in X-ray based methods.
The extreme interest of these techniques in experimental studies is the possibility to probe
the distribution of the target molecule, a piece of information that is crucial in diffusion
studies where the homogeneity of the run product is rarely attained. Figure 3 shows a
selected FTIR-FPA image of a beryl slice after the experiment, where the color intensity, from
blue to red, is proportional to the CO2 amount within the sample; the FPA image has been
oriented onto the emerald crystal. The image clearly shows that the carbon dioxide diffused
only for a short distance from the basal (pinacoidal) faces of the emerald along the channels;
a schematic interpretation of the process is given on the right side of Figure 3.
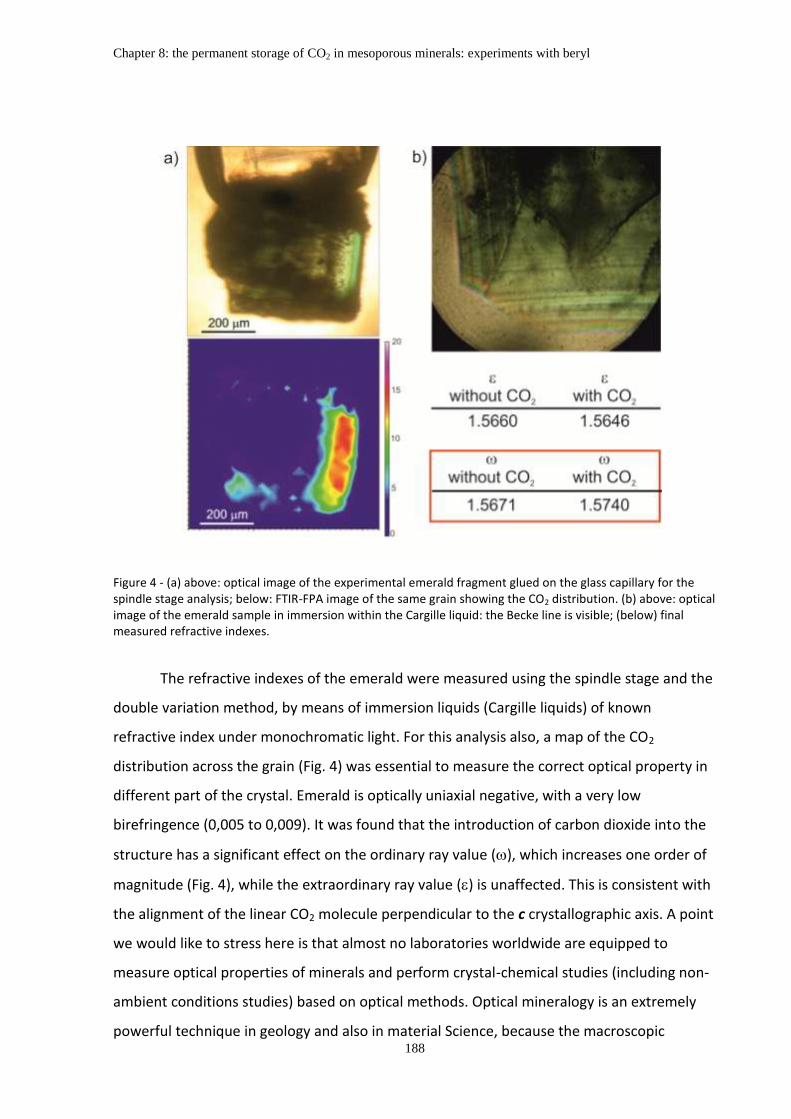
Chapter 8: the permanent storage of CO2 in mesoporous minerals: experiments with beryl
188
Figure 4 - (a) above: optical image of the experimental emerald fragment glued on the glass capillary for the spindle stage analysis; below: FTIR-FPA image of the same grain showing the CO2 distribution. (b) above: optical image of the emerald sample in immersion within the Cargille liquid: the Becke line is visible; (below) final measured refractive indexes.
The refractive indexes of the emerald were measured using the spindle stage and the
double variation method, by means of immersion liquids (Cargille liquids) of known
refractive index under monochromatic light. For this analysis also, a map of the CO2
distribution across the grain (Fig. 4) was essential to measure the correct optical property in
different part of the crystal. Emerald is optically uniaxial negative, with a very low
birefringence (0,005 to 0,009). It was found that the introduction of carbon dioxide into the
structure has a significant effect on the ordinary ray value (), which increases one order of
magnitude (Fig. 4), while the extraordinary ray value () is unaffected. This is consistent with
the alignment of the linear CO2 molecule perpendicular to the c crystallographic axis. A point
we would like to stress here is that almost no laboratories worldwide are equipped to
measure optical properties of minerals and perform crystal-chemical studies (including non-
ambient conditions studies) based on optical methods. Optical mineralogy is an extremely
powerful technique in geology and also in material Science, because the macroscopic
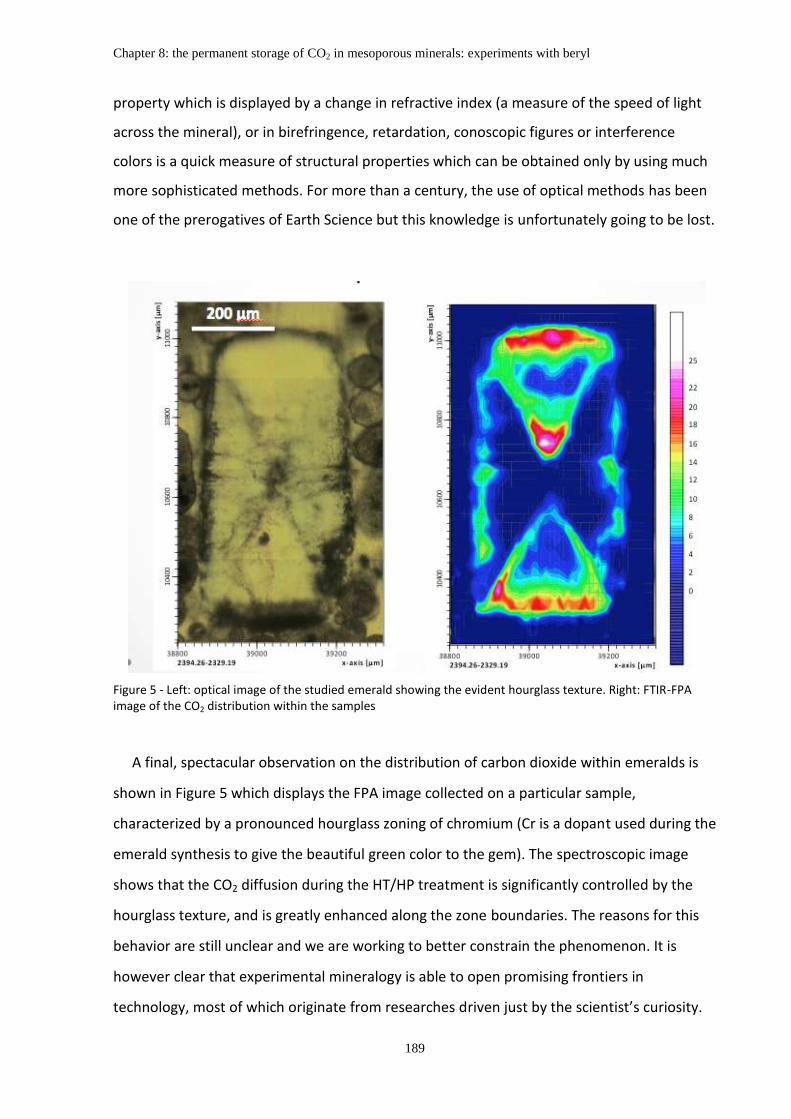
Chapter 8: the permanent storage of CO2 in mesoporous minerals: experiments with beryl
189
property which is displayed by a change in refractive index (a measure of the speed of light
across the mineral), or in birefringence, retardation, conoscopic figures or interference
colors is a quick measure of structural properties which can be obtained only by using much
more sophisticated methods. For more than a century, the use of optical methods has been
one of the prerogatives of Earth Science but this knowledge is unfortunately going to be lost.
Figure 5 - Left: optical image of the studied emerald showing the evident hourglass texture. Right: FTIR-FPA image of the CO2 distribution within the samples
A final, spectacular observation on the distribution of carbon dioxide within emeralds is
shown in Figure 5 which displays the FPA image collected on a particular sample,
characterized by a pronounced hourglass zoning of chromium (Cr is a dopant used during the
emerald synthesis to give the beautiful green color to the gem). The spectroscopic image
shows that the CO2 diffusion during the HT/HP treatment is significantly controlled by the
hourglass texture, and is greatly enhanced along the zone boundaries. The reasons for this
behavior are still unclear and we are working to better constrain the phenomenon. It is
however clear that experimental mineralogy is able to open promising frontiers in
technology, most of which originate from researches driven just by the scientist’s curiosity.
Chapter 8: the permanent storage of CO2 in mesoporous minerals: experiments with beryl
190
Acknowledgments
Thanks are due to S. Mollo, C. Freda and P. Scarlato (INGV, Rome) for providing both
facilities and their personal expertise to solve most of the technical aspects of this research.
The spectroscopic work has been done at Dane Laboratory of FTIR spectroscopy of INFN
(Frascati, Rome), thanks to the scientific collaboration of Mariangela Cestelli Guidi and
Augusto Marcelli.
Final Remarks
191
FINAL REMARKS
This PhD Thesis was aimed at investigating the ability of cordierite and beryl,
considered as a model for microporous materials, to diffuse and trap H2O and CO2 within
their structural channels.
The work focused in particular on the CO2 diffusion because of very few and
controversial results so far available in the literature. In addition, CO2 is considered one of
the major cause of long-term climate change, thus knowledge of the conditions under which
it diffuses into minerals may have interesting bearings for the design of new materials for
the permanent storage of this gas. The study was done by combining different analytical
techniques, however most data were based on micro-FTIR and FTIR-FPA imaging. Indeed,
during this work novel applications of the FPA imaging were developed and tested for the
first time in the study of Earth Science materials, in particular under polarized and
synchrotron radiation.
The volatile-free crystals were treated at different pressure and temperatures in a
CO2 rich atmosphere using a non end-load piston–cylinder press, especially designed for
short term experiments. The results showed that CO2 diffusion inside beryl and cordierite
proceeds exclusively along the structural channels running parallel to the c crystallographic
axis (Chapter 5); the same mechanism occurs also during CO2 expulsion from the matrix
(Chapter 3). Thus the CO2 loss from cordierite and beryl is strongly affected by both the
particle size and shape of the crystal, i.e. the length of the escape path. To examine
quantitatively this feature, in Chapter 3 we performed experiments with two different
crystallographic orientations: a first (001), 77 m thick slab, with a diffusion pathway of 34
µm to simulate the loss from small or tabular grains, and a second (010) slab to model the
case of large or prismatic grains (typical growth habit of cordierite, Deer et al., 2004). In this
case, in fact, the mean diffusion pathway was about 120 µm, corresponding to half the slab

Final Remarks
192
dimension along the c axis. In the (001) lamella or in thin and tabular cordierite grains both
CO2 and H2O desorption proceeds smoothly even when T increases with a very fast rate; on
the other side, for thicker or prismatic cordierite grains, as simulated by the (010) lamella,
both CO2 desorption and dehydration occur at higher temperatures, at least 50/100 °C
higher than in the former sample. In other words, the data suggest that the difference in
diffusion path length has a significant effect on the temperatures of CO2 and H2O desorption
and longer heating time are necessary to extract all volatile molecules from the core of the
grain (see also Chapter 4).
Fractures inside the grains also acted as additional pathways of inward and/or
outward CO2 diffusion, in accelerating the CO2 diffusion across the grain (Chapter 3 and 5);
this finding is in line with the general observation that grain-boundary diffusion and diffusion
along interfaces, like cracks, can be several order of magnitude faster than lattice diffusion
(Zhang and Cherniak, 2010). A third additional way of diffusion was observed in synthetic
beryls (Chapter 6). The planar defect generated by the structural mismatch in
correspondence of the hourglass zoning also acted as a fast-path for CO2 diffusion (Zhang et
al., 2006). A direct conclusion is that the simultaneous occurrence of different diffusion
mechanisms, i.e. (I) channel/lattice diffusion, (II) fracture induced diffusion and (III) fast path
diffusion, may complicate the evaluation of diffusion coefficients of a molecular species,
thus inspection of the distribution of a molecule inside the mineral via 2D imaging is
mandatory in experimental work.
Differently to CO2, which is always oriented normal to the c axis, H2O may be oriented
in different ways (Chapters 1, 2 and 7): relatively unbound H2O[I], doubly coordinated H2O[II]
and singly coordinated H2O[II]. It follows that H2O in different coordination environments
may have different diffusion mechanisms and consequently diffusion coefficients. Based on
the results discussed in Chapter 7, it is possible to infer that when the amount of H2O in the
channels is 2·H2O > Na apfu, than water may be present both as H2O[I] and doubly
coordinated H2O[II]; when 2·H2O < Na apfu, than water is present as doubly and/or singly
coordinated H2O[II]. Characterization of the coordination state of H2O in the structural
channels is thus important for a proper interpretation of diffusion data in experimental
studies.
A major result of the experiments described in chapter 5 is that pressure plays a
major role in controlling the amount of CO2 diffused in both cordierite and beryl, while

Final Remarks
193
temperature and time have a minor effect, in line with data from natural occurrences
(Thompson, et al., 2001; Harley et al., 2002). Surprisingly, however, the CO2 contents
introduced during the present study into cordierite were at least one order of magnitude
lower than expected (Johannes and Schreyer, 1981; Armbruster and Bloss, 1982). One of the
reasons for this discrepancy probably is related to the fact that the crystals used here as a
starting material had significant amounts of alkali cations (Chapter 1). Vry et al. (1990)
observed that in natural cordierite the total content of CO2 + alkali may induce a volatile
deficiency of both H2O + CO2 during equilibration with the surrounding fluid because of a
plug effect hindering diffusion of the relatively large CO2 molecule from the fluid into the
mineral. A second, additional source of discrepancy may be looked for in the sample
handling and preparation for the analyses; HT/HP treatment of the sample during the
experiments were found to induce development of a series of micro-fractures close to the
edges of the cordierite crystals. These micro-fractures may induce the formation of a CO2-
rich but fragile external layer which may be removed during sample slicing and polishing for
FTIR analyses, thus distorting the final data relative to analyses done on bulk samples.
Cracks and fractures, produced during the thermal treatment, were found to
enhance significantly the CO2 diffusion across with contents up to 4 times higher than at the
edge of the grain. This feature has a great relevance from a technological point of view,
because it demonstrates that to trap faster and larger CO2 amounts inside the material, the
use of highly fractured or clusters of micron-sized grains is preferred over larger grains
(Chapter 8).
Because of the well-developed hexagonal prismatic habitus, the beryl samples were
excellent candidates to evaluate the inward diffusivity of CO2 in microporous structures
(Chapter 5); diffusion coefficients for cordierite, on the opposite, could be evaluated only for
the outward diffusion (Chapter 3). Diffusion coefficients of volatile species in silicates are
expected to be related to the dimension of the diffusing species and the diffusing structure.
It is also widely accepted that for more compact silicate structures diffusing rates are smaller
and activation energies larger. As we may observe from Figure 1 the diffusing rates
calculated for CO2 (Chapter 5) and H2O (Fukuda et al., 2009) in beryl are very close, even
though CO2 molecule are larger than the H2O molecule. On the other hand, the inward CO2
diffusion coefficients for beryl (see Figure 1 and Chapter 5) are greater than the diffusion
coefficient calculated for the outward CO2 diffusion in cordierite (see Figure 1 and Chapter 3)

Final Remarks
194
even though the structures are very similar. Vry et al. (1990) observed that in cordierite
inward diffusion is quicker than outward diffusion. These authors stated that the difference
between inward and outward diffusion rates may be caused by alkali cations and CO2 itself,
that, acting as plugs in the channel, preferentially slows down outward volatile diffusions.
Figure 1 – Arrhenius diagram of various diffusion coefficients D for different silicates or silicate melts for H2O and CO2. D for beryl after diffusion profiles (Chapter 5), D for cordierite after isothermal heating experiments (Chapter 3).
Figure 1 give selected examples of diffusion rates for the most common hydrous
minerals. In Figure 18 we may observe that the diffusion coefficients measured for CO2 in
beryl are close to the OH- diffusion coefficients obtained in other ring silicates like
tourmaline (Desbois and Ingrin, 2007), layer silicates like muscovite (Graham, 1981),
amphiboles like kaersutite (Ingrin and Blanchard 2000), or in disilicates like epidote (Graham,
1981). However, it’s important to note that structural OH- probably diffuses inside these
structures in the form of H+ (Zhang et al., 2010) thus the diffusing species is much smaller
compared to molecular CO2 and H2O.
Our data suggest that the structural channels of cordierite and beryl act more likely
as fast paths for the mobility of large molecular groups compared to similar silicate
Final Remarks
195
structures, and for this reason the diffusing behavior is more similar (in terms of diffusion
coefficients, not in the mechanism) to the one typically observed for grain boundary
diffusion, such as, for example, H2O in quartzite (Farver and Yund, 1991) or to the behavior
of CO2 in non-crystalline materials, like silicate melts (Watson et al., 1982; Watson, 1991).

References
196
REFERENCES
Adamo I, Gatta GD, Rotiroti N,Diella V, Pavese A (2008) Gemmological investigation of a
synthetic blue beryl a multi-methodological study. Mineralogical Magazine, 72, 799-808.
Aines RD, Rossman GR (1984) The high temperature behaviour of water and carbon dioxide
in cordierite and beryl. American Mineralogist, 69, 319-327.
Anderson TF (1972) Self-diffusion of carbon and oxygen in dolomite. Journal of Geophysical
Research, 77, 857-861.
Armbruster T (1985) Ar, N2, and CO2 in the structural cavities of cordierite, an optical and X-
ray single-crystal study. Physics and Chemistry of Minerals, 12, 233-245.
Armbruster T, Bloss FD (1980) Channel CO2 in cordierites. Nature, 286, 140-141.
Armbruster T, Bloss FD (1982) Orientation and effects of cannel H2O and CO2 in cordierite.
American Mineralogist, 67, 284–291.
Armbruster, T (1986) Role of Na in the structure of low-cordierite: A single-crystal X-ray
study. American Mineralogist, 71, 746-757.
Armbruster, T, Irouschek, A (1983) Cordierites from the Lepontine Alps: Na + Be → Al
substitution, gas content, cell parameters and optics. Contribution to Mineralogy and
Petrolology, 82, 389-396.
Aurisicchio C, Grubessi O, Zecchini P (1994) Infrared spectroscopy and crystal chemistry of
the beryl group. Canadian Mineralogist, 32, 55–68.
Aurisicchio C., Fioravanti G, Grubessi O,Zanazzi PF (1988) Reappraisal of the crystal chemistry
of beryl. American Mineralogist, 73, 826-837.
Avrami M (1939) Kinetics of Phase Change. I. General Theory. Journal of Chemical Physics, 7,
1103-1112.

References
197
Avrami M (1940) Kinetics of Phase Change. II. Transformation-Time Relations for Random
Distribution of Nuclei. Journal of Chemical Physics, 8, 212-224.
Avrami M (1941) Kinetics of Phase Change. III. Granulation, Phase Change, and
Microstructure. Journal of Chemical Physics,9, 177-184.
Bahat D (1974) Phase transformation and development of hourglass pattern in synthetic
barium feldspar. American Mineralogist, 59, 139-142.
Baker DR (2004) Piston-cylinder calibration at 400 –500 MPa: a comparison of using water
solubility in albite melt and NaCl melting. American Mineralogist, 89, 1553 –1556.
Bauschlicher CW, Langhoff SR, Partridge H, Rice JE, Komornicki A (1991) A theoretical study
of Na(H2O)+n (n = 1–4). Journal of Chemistry and Physics, 95, 5142–5148.
Behrens H (2010) Ar, CO2 and H2O diffusion in silica glasses at 2 kbar pressure. Chemical
Geology. 272, 40-48.
Behrens H, Misiti V, Freda C, Vetere F, Botcharnikov R, Scarlato P (2009) Solubility of H2O and
CO2 in ultrapotassic melts at 1200 and 1250 °C and pressure from 50 to 500 MPa. American
Mineralogist, 94, 105-120
Bellatreccia F, Della Ventura G, Libowitzky E, Beran A (2005) The quantitative analysis of OH
in vesuvianite: a polarized FTIR and SIMS study. Physics and Chemistry of Minerals, 32, 65–
76.
Bellatreccia F, Della Ventura G, Piccinini M, Cavallo A, Brilli M (2009) H2O and CO2 in minerals
of the haüyne-sodalite group: an FTIR spectroscopy study. Mineralogical Magazine, 73, 399-
413.
Bellatreccia F, Della Ventura G, Piccinini M, Grubessi O (2008) Single-crystal polarized light IR
study of an historical synthetic water poor emerald. Neues Jahrbuch für Mineralogie
Abhandlungen, 185, 11-16.
Bellatreccia F, Della Ventura G, Gatta GD, Harley S (2012) Carbon dioxide in pollucite, a
feldspathoid with the ideal composition (Cs,Na)16Al16Si32O96 · nH2O. Mineralogical Magazine,
76, 903-911.

References
198
Bellatreccia F, Della Ventura G, Libowitzky E, Beran A (2005) The quantitative analysis of OH
in vesuvianite: a polarized FTIR and SIMS study. Physics and Chemistry of Minerals, 32, 65-76.
Beran A, Langer K, Andrut M (1993) Single crystal infrared spectrain the OH range
fundamentals of paragenetic garnet, omphacite and kyanite in an eclogitic mantle xenolith.
Mineralogy and Petrology, 48, 257–268.
Bertoldi C, Proyer A, Garbe-Schönberg D, Behrens H, Dachs E (2004) Comprehensive
chemical analyses of natural cordierites: implications for exchange mechanisms. Lithos
78:389-409
Bish DL, Carey JW (2001) Thermal behavior of natural zeolites in: Natural zeolites:
occurrence, properties, applications. Review in Mineralogy and Geochemistry, vol 45, The
Mineralogical Society of America, Washington.
Bloss FD (1981) The spindle stage: principles and practice. Cambridge University Press,
Cambridge.
Boberski C, Schreyer W (1990) Synthesis and water contents of Fe2+-bearing cordierites.
European Journal of Mineralogy, 2, 565-584
Bonaccorsi E, Della Ventura G, Bellatreccia F, Merlino S (2007) The thermal behaviour and
dehydration of pitiglianoite, a mineral of the cancrinite group. Microporous Mesoporous
Materials, 99, 225-235
Bruno G, Vogel S (2008) Calculation of the Average Coefficient of Thermal Expansion in
oriented Cordierite Polycrystals. Journal of American Ceramic Society, 91, 2646-2652.
Bulbak TA, Shvedenkova SV (2011) Solid solutions of (Mg, Fe2+)-cordierite: Synthesis, water
content, and magnetic properties. Geochemistry International, 49, 391-406.
Burla MC, Caliandro R, Camalli M, Carrozzini B, Cascarano GL, De Caro L, Giacovazzo C,
Polidori G, Siliqi D, Spagna R (2007) IL MILIONE: a suite of computer programs for crystal
structure solution of proteins. Journal of Applied Crystallography, 40, 609–613.
Burton WK, Cabrera N, Frank FC (1951) The Growth of Crystals and the Equilibrium Structure
of their Surfaces, Philosophical Transactions of the Royal Society, 243, 299-358.

References
199
Carbone M, Ballirano P, Caminiti R (2008) Kinetics of gypsum dehydration at reduced
pressure: an energy dispersive X-ray diffraction study. European Journal of Mineralogy, 20,
621-627.
Carey JW (1993) The Heat Capacity of Hydrous Cordierite Above 295 K. Physics and
Chemistry of Minerals, 19, 578-583.
Carey JW (1995) A thermodynamic formulation for hydrous cordierite. Contribution to
Mineralogy and Petrology, 119, 155–165.
Carrington DP, Harley SL (1995) Partial melting and phase relations in high-grade
metapelites: an experimental petrogenetic grid in the KFMASH system. Contrib Mineral
Petrol 120:270-291
Carrington DP, Harley SL (1996) Cordierite as a monitor of fluid and melt water contents in
the lower crust: an experimental calibration. Geology, 24, 647–650.
Carslaw HS, Jeager JC (1959) Conduction of heat in solids. Oxford Science Publications, 510
pp.
Černý P, Chapman R, Schreyer W, Ottolini L, Bottazzi P, McCammon CA (1997) Lithium in
sekaninaite from the type locality Dolni Bory, Czech Republic. The Canadian Mineralogist, 35,
167-173.
Cesare B, Maineri C, Baron Toaldo A, Pedron D, Acosta Vigil A (2007) Immiscibility between
carbonic fluids and granitic melts during crustal anatexis: a fluid and melt inclusion study in
the enclaves of the Neogene Volcanic Province of SE Spain. Chem Geol 237:433–449
Charoy B, de Donato P, Barres O, Pintho-Choelo C (1996) Channel occupancy in an alkali-
poor beryl from Serra Blanca (Goias, Brazil): spectroscopic characterization. American
Mineralogist, 81, 395–403.
Cohen, JP, Ross, FK, Gibbs GV (1977) An X-ray and neutron diffraction study of hydrous low
cordierite. American Mineralogist, 62, 67-78.
Coulomb CA (1776) Essai sur une application des regles des maximis et minimis a quelques
problems de statique relatifs a la architecture. Mémoires de l'Académie Royale pres Divers
Savants, 7, 343–387.

References
200
Crank J (1975) The Mathematics of Diffusion. Clarendon Press, Oxford. 414 pp.
Dachs E, Geiger CA (2008) Low-temperature heat capacity of synthetic Fe-and Mg-cordierite:
thermodynamic properties and phase relations in the system FeO-Al2O3-SiO2-(H2O).
European Journal of Mineralogy, 21, 971-983.
Daniels P (1992) Structural effects of the incorporation of large-radius alkalis in high
cordierite. American Mineralogist, 77, 407-411.
Deer WA, Howie RA, Wise WS, Zussman J (2004). Rock-forming minerals. Volume 1B.
Disilicates and ring silicates (2nd ed.). London, Geological Society of London. 982 pp.
Deer WA, Howie RA, Zussman J (1986) Rock-forming minerals 1B: disilicates and ring-
silicates, second edition. The Geological Society, Bath (UK).
Della Ventura G, Bellatreccia F, Bonaccorsi E (2006) CO2 in minerals of the cancrinite-sodalite
group: pitiglianoite. European Journal of Mineralogy, 17, 847-851.
Della Ventura G, Bellatreccia F, Cesare B, Harley S, Piccinini M (2009) FTIR microspectroscopy
and SIMS study of water-poor cordierite from El Hoyazo, Spain: application mineral and melt
devolatilization. Lithos, 113, 498–506.
Della Ventura G, Bellatreccia F, Marcelli A, Cestelli Guidi M, Piccinini M, Cavallo A, Piochi M
(2010) Application of micro-FTIR imaging in the Earth sciences. Analytical and Bioanalytical
Chemistry, 397, 2039-2049.
Della Ventura G, Bellatreccia F, Piccinini M (2008) Presence and zoning of hydrous
components in leucite from the Albani Hills volcano (Rome, Italy). American Mineralogist, 93,
1538-1544.
Della Ventura G, Bellatreccia F, Rossi P (2007) The single-crystal, polarized-light, FTIR
spectrum of stoppaniite, the Fe analogue of beryl. Physics and Chemistry of Mineral, 34, 727-
731.
Della Ventura G, Marcelli A, Bellatreccia F (2014) SR-FTIR Microscopy and FTIR Imaging in the
Earth Sciences. Reviews in Mineralogy and Geochemistry, 78, 447-479.

References
201
Della Ventura G, Radica F, Bellatreccia F, Cavallo A, Capitelli F, Harley (2012) Quantitative
analysis of H2O and CO2 in cordierite using polarized FTIR spectroscopy. Contributions to
Mineralogy and Petrology, 164, 881-894.
Della Ventura G, Bellatreccia F, Bonaccorsi E (2005) CO2 in minerals of the cancrinite-sodalite
group: pitiglianoite. European Journal of Mineralogy, 17, 843-851.
Della Ventura G, Bellatreccia F, Piccinini M (2008) Channel CO2 in feldspathoids: a review of
existing data and new perspectives. Rendiconti Accademia Lincei, 19, 141-159.
Della Ventura G, Bellatreccia F, Parodi GC, Cámara F, Piccinini M (2007) Single-crystal FTIR
and X-ray study of vishnevite, ideally [Na6(SO4)][Na2(H2O)2](Si6Al6O24). American
Mineralogist, 92, 713-721.
Della Ventura G, Rossi P, Parodi GC, Mottana A, Raudsepp M, Prencipe M (2000) Stoppaniite
(Fe,Al,Mg)4(Be6Si12O36)*(H2O)2(Na,), a new mineral of the beryl group from Latium (Italy).
European Journal of Mineralogy, 12, 121-127.
Desbois G, Ingrin J (2007) Anisotropy of hydrogen diffusion in tourmaline. Geochimica
Cosmochimica Acta, 71, 5233-5243.
Duisenberg AJM, Kroon-Batenburg LMJ, Schreurs AMM (2003) An intensity evaluation
method: EVAL-14. J. Appl. Crystall 36 :220-229
Erämetsä O, Nieminen K, Niinisto L (1973) Two transparent beryl varieties from the Kaatiala
pegmatite. Finland. Bulletin of the Geological Society of Finland, 45, 125 130.
Farrell EF, Newnham RE (1967) Electronic and vibrational absorption spectra in cordierite.
Am Min 52:380-388
Farver JR (2010) Oxygen and Hydrogen Diffusion In Minerals, in Diffusion in Minerals and
Melts. Reviews in Mineralogy and Geochemistry, 72, 2010.
Farver JR, Yund RA (1991) Measurement of oxygen grain boundary diffusion in natural, fine
grained, quartz aggregates. Geochimica Cosmochimica Acta, 55, 1597-1607.
Fediuk F (1971) Cordierite in the Moldanubian gneisses. Krystalinikum (Academia, Prague), 7,
183-204.

References
202
Ferraris G, Merlino S (2005) Micro- and Mesoporous Mineral Phases. Reviews in Mineralogy
and Geochemistry, vol. 57, The Mineralogical Society of America, Washington
Fitzsimons ICW (1996). Metapelitic migmatites from Brattstrand Bluffs, East Antarctica –
Metamorphism melting and exhumation of the mid crust. J Petrol 37:395-414
Freda C, Gaeta M, Misiti V, Mollo S, Dolfi D, Scarlato P (2008) Magma–carbonate interaction:
an experimental study on ultrapotassic rocks from Alban Hills (Central Italy) Lithos, 101, 397–
415.
Fukuda J, Shinoda K (2008) Coordination of water molecules with Na+ cations in a beryl
channel as determined by polarized IR spectroscopy. Physics and Chemistry of Minerals, 35,
347-357.
Fukuda J, Shinoda K (2011) Water molecules in beryl and cordierite: high-temperature
vibrational behavior, dehydration, and coordination to cations. Physics and Chemistry of
Minerals, 38, 469-481.
Fukuda J, Shinoda K, Nakashima S, Miyoshi N, Aikawa N (2009) Polarized infrared
spectroscopic study of diffusion of water molecules along structure channels in beryl.
American Mineralogist, 94, 981-985.
Gatta GD, Nestola F, Bromiley GD, Mattauch S (2006) The real topological configuration of
the extra-framework content in alkali-poor beryl: A multi-methodological study. American
Mineralogist, 91, 29-34.
Geiger CA, Armbruster T, Khomenko VM, Quartieri S (2000) Cordierite I: The coordination of
Fe2+. Am Min 85:1255-1264
Geiger CA, Kolesov BA (2002) Microscopic-macroscopic relationships in silicates: Examples
from IR and Raman spectroscopy and heat capacity measurements. In:Gramaccioli CM (ed)
Energy modelling in minerals. European Notes in Mineralogy 4, Eötrös University Press,
Budapest, Hungary, pp 347-387
Geiger CA, Rager H, Czank (2000) Cordierite III: the site occupation and concentration of
Fe2+. Contribution to Mineralogy and Petrology, 140, 344-352.

References
203
Giampaolo C, Putnis A (1989) The kinetics of dehydration and order-disorder of molecular
H2O in Mg-cordierite. European Journal of Mineralogy, 1, 193-202.
Gibbs GV (1966) The polymorphism of cordierite I: the crystal structure of low cordierite.
American Mineralogist, 51, 1068–1087.
Gibbs GV, Breck DW, Meagher EP (1968) Structural refinement of hydrous and anhydrous
synthetic beryl, Al2(Be3Si6)O18 and emerald, Al1.9Cr0.1(Be3 Si6)O18. Lithos, 1, 275–285.
Goldman DS, Rossman GR, Dollase WA (1977) The channel constituents in cordierite. Am
Min 62:1144-1157
Gottesmann, B. and Förster, H.J. (2004) Sekaninaite from the Satzung granite (Erzgebirge,
Germany): magmatic or xenolithic? European Journal of Mineralogy, 16, 483-491.
Graham CM (1981) Experimental hydrogen isotope studies III: Diffusion of hydrogen in
hydrous minerals, and stable isotope exchange in metamorphic rocks. Contribution to
Mineralogy and Petrology, 76, 216-228.
Grapes R, Korzhova S, Sokol E, Seryotkin Y (2010) Paragenesis of unusual fe-cordierite
(sekaninaite)-bearing paralava and clinker from the kuznetsk coal basin, Siberia, Russia.
Contributions to Mineralogy and Petrology, 162, 253-273.
Griffin LJ (1950) Observation of unimolecular growth steps on crystal surfaces. Philosophical
Magazine, 41, 196-199.
Guastoni A, Demartin F, Pezzotta F (2004) Sekaninaite delle pegmatiti granitiche di Feriolo e
Baveno (VB). Atti della Società Italiana di Scienze Naturali e Museo Civico di Storia Naturale
Milano, 145, 59-68.
Gunter ME, Bandli BR, Bloss FD, Evans SH, Su SC, Weaver R (2004) Results from a McCrone
Spindle Stage Short Course, a New Version of EXCALIBR, and How to Build a Spindle Stage.
Microscope 52:23-39
Gunter ME, Downs RT, Bartelmehs KL, Evans SH, Pommier CJS, Grow JS, Sanchez MS and
Bloss FD (2005) Optic properties of centimeter-sized crystals determined in air with the
spindle stage using EXCALIBRW. American Mineralogist, 90, 1648–1654.

References
204
Hancock JD, Sharp JH (1972) Method of Comparing Solid-State Kinetic Data and Its
Application to the Decomposition of Kaolinite, Brucite, and BaCO3. Journal of the American
Ceramic Society, 55, 74-77.
Hanson RC, Jones LH (1981) Infrared and Raman studies of pressure effects on the
vibrational modes of solid CO2. Journal of Chemical Physics, 75, 1102-1112.
Harley SL, Carrington DP (2001) The distribution of H2O between cordierite and granitic melt:
improved calibration of H2O incorporation in cordierite and its application to high-grade
metamorphism and crustal anatexis. Journal of Petrology, 42, 1595–1620.
Harley SL, Thompson P (2004) The influence of cordierite on melting and mineral-melt
equilibria in ultra-high-temperature metamorphism. Transactions of the Royal Society of
Edinburgh: Earth Sciences, 95, 87–98.
Harley SL, Thompson P, Hensen BJ, Buick IS (2002) Cordierite as a sensor of fluid conditions
in high-grade metamorphism and crustal anatexis. Journal of Metamorphic Geology, 20, 71-
86.
Hautefeuille P, Perrey A (1888) Sur la reproduction de la phenacite e de l’emeraude.
Comptes Rendus de l'Académie des Sciences, 106, 1800–1802.
Hautefeuille P, Perrey A (1890) Sur la combinaisons silicatèes de la glucine. Annales de
chimie et de physique, 6, 447-435.
Hawthorne FC, Oberti R, Della Ventura G, Mottana A (2007) Amphiboles: Crystal Chemistry,
Occurrence, and Health Issues. Reviews in Mineralogy and Geochemistry, vol. 67, The
Mineralogical Society of America, Washington.
Hawthorne, F.C. and Cěrný, P. (1977) The alkali-metal positions in Cs-Li beryl. The Canadian
Mineralogist, 15, 414-421.
Herzberg G (1956)Infrared and Raman Spectra of Polyatomic Molecules. D. Van Nostrand
Company, New York
Hochella MFjr, Brown GE jr (1986) Structural Mechanisms of Anomalous Thermal Expansion
of Cordierite-Beryl and Other Framework Silicates. Journal of the American Ceramic Society,
69, 13-18.
References
205
Hochella MFjr, Brown GE jr, Ross FK, Gibbs GV (1979) High-temperature crystal chemistry of
hydrous Mg- and Fe-Cordierite. American Mineralogist, 64, 337-351.
Hollister LS (1970) Origin, mechanism, and consequences of compositional sector zoning in
staurolite. American Mineralogist, 55, 742-766.
Holtz F, Becker A, Freise M, Johannes W (2001) The water-undersaturated and dry Qz-Ab-Or
system revisited. Experimental results at very low water activities and geological
implications. Contributions to Mineralogy and Petrology, 141, 347–357.
Iezzi G, Liu Z, Della Ventura G (2006) High pressure synchrotron infrared spectroscopy of
synthetic Na(NaMg)Mg5Si8O22(OH)2 up 30 GPa: a possible high-pressure new amphibole
polymorph. American Mineralogist, 91, 479-482
Iezzi G, Liu Z, Della Ventura G (2009) The role of B-site on the compressional behaviour of
synthetic P21/m amphiboles in the system ANaB(NaxLi1-xMg1) CMg5 Si8 O22 (OH)2 (with x=1,
0.6, 0.2 and 0): an high pressure synchrotron infrared study. Physics and Chemistry of
Minerals, 36, 343-354
Ingrin J, Blanchard M (2000) Hydrogen mobility in single crystal kaersutite. EMPG VIII,
Journal of Conference Abstracts, 5, 52.
Ingrin J, Blanchard M (2006) Diffusion of hydrogen in minerals. Reviews in Mineralogy and
Geochemistry, 62, 291-320.
Ingrin J, Hercule S, Charton T (1995) Diffusion of hydrogen in diopside: results of dehydration
experiments. Journal of Geophysical Research: Solid Earth, 100, 15489-15499.
Jakobsson S (2012) Oxygen fugacity control in piston-cylinder experiments. Contribution to
Mineralogy and Petrology, 3, 397-406.
Johannes W, Schreyer W (1981) Experimental introduction of CO2 and H2O into Mg-
cordierite. American Journal of Science, 281, 299-317.
Kalt A (2000) Cordierite channel volatiles as evidence for dehydration melting: an example
from high-temperature metapelites of the Bayerische Wald (Variscan belt, Germany).
European Journal of Mineralogy, 12, 987–998.

References
206
Keppler H, Bagdassarov NS (1993) High-temperature FTIR spectra of H2O in rhyolite melt to
1300 °C. American Mineralogist, 78, 1324-1327.
Keppler H, Smyth JR (2006) Water in Nominally Anhydrous Minerals. Reviews in Mineralogy
and Geochemistry, vol. 62, The Mineralogical Society of America, Washington
Khomenko VM, Langer K (1999) Aliphatic hydrocarbons in structural channels of cordierite: a
first evidence from polarized single-crystal IR-absorption spectroscopy. American
Mineralogist, 84, 1181–1185
Khomenko VM, Langer K (2005) Carbon oxides in cordierite channels: determination of CO2
isotopic species and CO by single crystal IR spectroscopy. American Mineralogist, 90, 1913–
1917.
Khosrovani N, Sleight AW (1999) Strong anisotropic thermal expansion in oxides. The
International Journal of Inorganic Materials, 1, 3-10.
Kitamura M, Hiroi Y (1982) Indialite from Unazuki schist, Japan, and its transition texture to
cordierite. Contributions to Mineralogy and Petrology, 80, 110-116.
Koch-Müller M, Dera P, Fei Y, Reno B, Sobolev N, Hauri E, Wysoczanski R (2003) OH– in
synthetic and natural coesite. American Mineralogist, 88, 1436-1445
Kolesov B (2008) Vibrational states of H2O in beryl: physical aspects. Physics and Chemistry
of Mineral, 34, 727-731.
Kolesov BA, Geiger CA (2003) Molecules in the SiO2-clathrate melanophlogite: a single-
crystal Raman study. American Mineralogist, 88, 1364-1368.
Kolesov BA, Geiger CA (2000) Cordierite II: the role of CO2 and H2O. American Mineralogist,
85, 1265–1274
Kolesov BA, Geiger CA (2000) The Orientation and Vibrational State of H2O in Synthetic
Alkali-Free Beryl. Physics and Chemistry of Mineral, 27, 557-564.
Kolesov N (2008) Vibrational states of H2O in beryl: physical aspects. Physics and Chemistry
of Minerals, 35, 271-278.

References
207
Kurepin VA (1985) H2O and CO2 contents of cordierite as an indicator of thermodynamical
conditions of formation. Geochemistry International, 22, 148–156.
Kurepin VA (2010) Cordierite as an indicator of thermodynamic conditions of petrogenesis.
Contribution to Mineralogy and Petrology, 160, 391–406.
Labotka TC, Cole DR, Riciputi LR (2000) Diffusion of C and O in calcite at 100 MPa. American
Mineralogist, 85, 488-494.
Lal RK, Akermand D, Raith M, Raase P, Seifert F (1984). Sapphirine-bearing assemblages from
Kiranur, Southern India. A study of chemographic relationships in the Na2O–FeO–MgO–
Al2O3–SiO2–H2O system. Neues Jb Miner Abh 150:121-152
Le Breton N (1989) Infrared investigation of CO2-bearing cordierites. Contribution to
Mineralogy and Petrology, 103, 387–396.
Le Breton N, Schreyer W (1993) Experimental CO2 incorporation into Mg-cordierite:
nonlinear behavior of the system. European Journal of Mineralogy, 5, 427-438.
Lee HM, Tarakeshwar P, Park J, Kolaski MR, Yoon YJ, Yi HB, Kim WY, Kim KS (2004) Insights
into the structures, energetics, and vibrations of monovalent cation-(water)1-6 clusters.
Journal of Physical Chemistry, A108, 2949–2958.
Lepezin GG, Melenevsky VN (1977) On the problem of water diffusion in the cordierites.
Lithos, 10, 49-57.
Libowitzky E, Rossman GR (1996) Principles of quantitative absorbance measurements in
anisotropic crystals. Physics and Chemistry of Minerals, 23, 319–327.
Libowitzky E, Rossman GR (1997) An IR absorption calibration for water in minerals.
American Mineralogist, 82, 1111–1115.
Liedl A, Polese C, Hampai D, Della Ventura G, Dabagov SB, Marcelli A, Bellatreccia F, Cavallo
A (2014) X-Ray μCT and μXRF Mapping of Synthetic Emerald by using a laboratory PolyCO-X-
ray Tube Layout (submitted).
Łodzioski M, Sitarz M, Stec K, Fojud Z, Jurga S (2005) ICP, IR, Raman, NMR investigations of
beryls from pegmatites of the Sudety Mts. Journal of Molecular Structure, 744, 1005-1015.

References
208
Malcherek T, Domeneghetti MC, Tazzoli V, Ottolini L, McCammon C, Carpenter MA (2001)
Structural properties of ferromagnesian cordierites. American Mineralogist, 86, 66–79.
Masotta M, Freda C, Gaeta M (2012) Origin of crystal-poor, differentiated magmas: insights
from thermal gradient experiments. Contributions to Mineralogy and Petrology, 163, 49-65.
Masotta M, Freda C, Paul TA, Moore G, Gaeta M, Scarlato P, Troll VR (2012) Low pressure
experiments in piston cylinder apparatus: calibration of newly designed 25 mm furnace
assemblies to P = 150 MPa. Chemical Geology, 312-313, 74-79.
McCusker LB (2005) IUPAC Nomenclature for Ordered Microporous and Mesoporous
Materials and its Application to Non-zeolite Microporous Mineral Phases. Reviews in
Mineralogy and Geochemistry, 57, 1-16
McCusker LB, Liebau F, Engelhardt G (2001) Nomenclature of structural and compositional
characteristics of ordered microporous and mesoporous materials with inorganic hosts -
(IUPAC recommendations 2001), Pure and Applied Chemistry, 73, 381-394.
Mikhailov MA, Demina TV, Belozerova OY (2007) Partitioning of species-forming and
impurity cations among growth pyramids of pinacoid and prism faces in crystals of beryl,
cordierite, and beryllian Indialite. Russian geology and geophysics, 48, 923-932.
Mirwald PW, Maresch WV, Schreyer W (1979) Der Wassergehalt von Mg-Cordierit zwischen
500° und 800 °C sowie 0.5 und 11 Kbar. Fortschritte der Mineralogie, 57, 101-110.
Mirwald PW, Schreyer W (1977) Die stabile und metastabile Ab-baureaktion von Mg-
Cordierit in Talk, Disthen und Quarz und ihre Abhiingigkeit vom Gleichgewichtswassergehalt
des Cordierits. Fortschritte der Mineralogie, 55, 95-97.
Moore G, Roggensack K, Klonowski S (2008) A low-pressure-high-temperature technique for
the piston-cylinder. American Mineralogist, 93, 48–52.
Morosin B (1972) Structure and thermal expansion of beryl. Acta Crystallographica, B28,
1899–1903.
Mottana A, Fusi A, Bianchi Potenza B, Crespi R, Liborio G (1983) Hydrocarbon-bearing
cordierite from the Dervio-Colico road tunnel (Como, Italy). Neues Jahrbuch für Mineralogie
Abhandlungen, 148, 181–199

References
209
Newton RC, Wood BJ (1979) Thermodinamics of water in cordierite and some petrological
consequances of cordierite as hydrous phase. Contributions to mineralogy and petrology, 68,
391-405.
Nonius (1998) COLLECT. Nonius BV, Delft, The Netherlands.
Olijnyk H, Däufer H, Jodl HJ, Hochheimer HD (1988) Effect of pressure and temperature on
the Raman spectra of solid CO2. Journal of Chemical Physics, 88, 4204-4212.
Orlandi P, Pezzotta F (1994) La sekaninaite dei filoni pegmatitici elbani. Atti della Società
Toscana di Scienze Naturali, Memorie, 100, 85-91.
Paterson M (1982) The determination of hydroxyl by infrared absorption in quartz, silicate
glasses and similar materials. Bulletin de Mineralogie, 105, 20-29
Paukov IE, Kovalevskaya YA, Rahmoun NS, Geiger CA (2007) Heat capacity of synthetic
hydrous Mg-cordierite at low temperatures: thermodynamic properties and the behavior of
the H2O molecules in selected hydrous micro and nanoporous silicates. American
Mineralogist, 92, 388–396.
Pistorius AMA, DeGrip WJ (2006) Deconvolution as a tool to remove fringes from an FT-IR
spectrum. Vibrational Spectroscopy, 36, 89-95.
Pouchou JL, Pichoir F (1985) A new model for quantitative X-ray microanalysis. Rech.
Aerosp., 3 13–38.
Prasad PSR, Shiva Prasad K, Ramana Murthy S (2005) Dehydration of natural stilbite: An in
situ FTIR study. American Mineralogist, 90, 1636-1640
Putnis A (1992) Introduction to mineral science. Cambridge University Press, 457 pp.
Putnis A, Winkler B, Fernandez-Diaz L (1990) In situ IR spectroscopic and thermogravimetric
study of the dehydration of gypsum. Mineralogical Magazine, 54, 123-128.
Radica F, Capitelli, F, Bellatreccia F, Della Ventura G, Cavallo A, Piccinini M, Hawthorne FC
(2013) Spectroscopy and X-ray structure refinement of sekaninaite from Dolní Bory (Czech
Republic). Mineralogical Magazine, 77, 485-498.
References
210
Rigby MJ, Droop GTR, Bromiley GD (2008) Variations in fluid activity across the Etive thermal
aureole, Scotland: evidence from cordierite volatile contents. J Metam Geol 26:331–346
Rossman GR (2006) Analytical methods for measuring water in nominally anhydrous
minerals. In:Keppler H, Smith JR (eds) Water in nominally anhydrous minerals. Reviews in
Mineralogy, Mineralogical Society of America 62, pp 1-28
Rouquerol J, Avnir D, Fairbridge CW, Everett DH, Haynes JM, Pernicone N, Ramsay JDF, Sing
KSW, Unger KK (1994) Recommendations for the characterization of porous solids (Technical
Report), Pure and Applied Chemistry, 66, 1739–1758.
Ryback G, Nawaz R, Farley E (1988) Seventh supplementary list of British Isles Minerals
(Irish). Mineralogical Magazine, 52, 267-274.
Sarkar S, Santosh M, Dasgupta S, Fukuoka M (2010) Very high density CO2 associated with
ultrahigh-temperature metamorphism in the Eastern Ghats granulite belt, India. Geology,
34, 51-54.
Schreyer W (1985) Experimental studies on cation substitutions and fluid incorporation in
cordierite. Bulletin of Mineralogy, 108, 273–291.
Schreyer W, Gordillo CE, Werding G (1979) A new sodian-beryllian cordierite from Sato,
Argentina, and the relationship between distortion index, Be content, and state of hydration.
Contrib Mineral Petrol 70:421-428
Schreyer W, Yoder HS (1964) The system Mg-cordierite—H2O and related rocks. Neues
Jahrbuch für Mineralogie Abhandlungen, 101, 271–342.
Sekanina J (1928) Minerals of Moravian pegamtites. Acta Musei Moraviae, Scientie
Naturales, 26, 113-224 (in Czech).
Selkregg KR, Bloss FD (1980) Cordierites: compositional controls of Δ, cell parameters, and
optical properties. American Mineralogist, 65, 522-533.
Sharygin VV, Sokol EV, Belakovskii DI (2009) Fayalite-sekaninaite paralava from the Ravat
coal fire (central Tajikistan). Russian Geology and Geophysics, 50, 703-721.

References
211
Sheldrick GM (1996) SADABS. Absorption correction program. University of Göttingen,
Germany.
Sheldrick GM (1997) SHELXL-97. Program for the Refinement of Crystal Structures. University
of Gottingen, Germany
Sheldrick, GM (2008) A short history of SHELX. Acta Crystallographica. A64, 112-122.
Sherriff BL, Grundy HD, Hartman JS, Hawthorne FC, Černý P (1991) The incorporation of
alkalis in beryl, a multinuclear MAS-NMR and crystal structure study. Canadian Mineralogist,
29, 271-285.
Smith CH (1996) H2O-CO2 contents of cordierite in migmatites of the Fosdick Mountains,
Marie Byrd Land. Terra Antartica 3:11-22
Sokol EV, Seryotkin YV, Bul’bak TA (2010) Na-Li-Be-rich cordierite from the Murzinka
pegmatite field, Middle Urals, Russia. Euro J Miner 22:565–575
Staněk, J, Miškovský j (1964) Iron-rich cordierite from the Dolní Bory pegmantite. Casopis pro
mineralogii a geologii, 9, 191-192 (in Czech).
Staněk J, Miškovský j (1975) Sekaninaite, a new mineral of the cordierite series, from Dolní
Bory, Czechoslovakia. Scripta Facultatis Scientiarum Naturalium Universitatis Purkynianae
Brunensis; Geologia 1, 5, 21-30.
Su SC, Bloss FD, Gunter ME (1978) Procedures and computer programs to refine the double
variation method. American Mineralogist, 72, 1011-1013.
Thompson P, Harley SL, Carrington DP (2001) The distribution of H2O-CO2 between cordierite
and granitic melt under fluid-saturated conditions at 5 kbar and 900 C. Contrib Mineral
Petrol 142:107-118
Tokiwai K, Nakashima S (2010) Dehydration kinetics of muscovite by in situ infrared
microspectroscopy. Physics and Chemistry of Minerals. 37, 91-101.
Tokiwai K, Nakashima S (2010) Integral molar absorptivities of OH in muscovite at 20 to 650
°C by in-situ high-temperature IR microspectroscopy. American Mineralogist, 95, 1052-1059.
References
212
Tuttle OF (1949) Two Pressure Vessels for Silicate-Water Studies. Geological Society of
American Bulletin 60, 1727-1729.
Visser D, Kloprogge JT, Maijer C (1994) An infrared spectroscopic (IR) and light element (Li,
Be, Na) study of cordierites from the Bamble Sector, South Norway. Lithos 32:95-107
Vry JK, Brown PE, Valley JV (1990) Cordierite volatile content and the role of CO2 in high-
grade metamorphism. American Mineralogist, 75, 71–88.
Watson EB (1991) Diffusion of dissolved CO2 and Cl in hydrous silicic to intermediate
magmas. Geochimica Cosmochimica Acta, 55, 1897-1902.
Watson EB, Baxter EF (2007). Frontiers: Diffusion in solid-Earth systems. Earth and Planetary
Science Letters, 253, 307-327.
Watson EB, Sneeringer MA, Ross A (1982) Diffusion of dissolved carbonate in magmas:
experimental results and applications. Earth Planet Science letters, 61, 346-358.
Welch MD, Cámara F, Della Ventura G, Iezzi G (2007) In situ non-ambient studies of
amphiboles. Reviews in Mineralogy, 67, 223-260
Wickersheim KA, Buchanan RA (1959) The Near Infrared Spectrum of Beryl. American
Mineralogist, 44, 440-445.
Wilson EB, Decius JC, Cross PC (1955) Molecular vibrations: the theory of infrared and
Raman vibrational spectra. McGraw-Hill, New York, pp 174–177.
Winkler B, Coddens G, Hennion B (1994) Movement of channel H2O in cordierite observed
with quasi-elastic neutron scattering. American Mineralogist, 79, 801-808.
Wood DL, Nassau K (1967) Infrared Spectra of Foreign Molecules in Beryl. The Journal of
Chemical Physics, 47, 2220-2228.
Wood DL, Nassau K (1968) The characterization of beryl and emerald by visible and infrared
absorption spectroscopy. American Mineralogist, 53, 777–780.
Wunder B, Sahl K, Schreyer W (1991) Abrupt high/low-transition in flux-grown Mg-cordierite
single crystals with hour-glass structure. European Journal of Mineralogy, 3, 809-817.
References
213
Yakubovich OV, Massa W, Pekov IV, Gavrilenko PG and Chukanov NV (2004) Crystal structure
of the Na-, Ca-, Be-cordierite and crystallochemical regularities in the cordierite-sekaninaite
series. Crystallography Reports, 49, 953-963.
Yamagishi H, Nakashima S, Ito Y (1997) High temperature infrared spectra of hydrous
microcrystalline quartz. Physics and Chemistry of Minerals, 24, 66-74.
Zhang M, Hui Q, Lou J, Redfern SAT, Salje EKH, Tarantino SC (2006) Dehydroxylation, proton
migration and structural changes in heated talc: An infrared spectroscopic study. American
Mineralogist, 91, 816-825.
Zhang M, Salje EKH, Carpenter MA, Wang JY, Groat LA, Lager GA, Wang L, Beran A, Bismayer
U (2007) Temperature dependence of IR absorption of hydrous/hydroxyl species in minerals
and synthetic materials. American Mineralogist, 92, 1502-1517.
Zhang M, Wang L, Hirai S, Redfern SAT, Salje EKD (2005) Dehydroxylation and CO2
incorporation in annealed mica (sericite): an infrared spectroscopic study. American
Mineralogist, 87, 90, 173-180.
Zhang XY, Cherniak DJ, Watson EB (2006) Oxygen diffusion in titanite: lattice diffusion and
fast-path diffusion in single crystals. Chemical Geology, 235, 105–123.
Zhang Y, Cherniak DJ (2010) Diffusion in Minerals and Melts. Reviews in Mineralogy and
Geochemistry, vol. 72, The Mineralogical Society of America, Washington.
Zimmermann JP (1981) La libération de l’eau, du gaz carbonique et des hydrocarbures des
cordiérites. Cinétigue des mécanismes. Determination des sites. Intéret pétrogénétique.
Bulletin de la Societe francaise de mineralogie et de cristallographie, 104, 325-338.