universidad del turabout.suagm.edu/.../tesis-2011-12/rodriguezi_2012_tesis_ut.pdf · program...
TRANSCRIPT
i
Universidad del Turabo
Inference of Habitat Connectivity via Habitat Use by Resident and Migratory
Birds between Secondary Dry Forest and Mangroves in Jobos Bay National
Estuarine Research Reserve
By
Ivelisse Rodríguez-Colón BS, Biology, University of Puerto Rico in Cayey
Thesis
Submitted to the School of Science and Technology in partial fulfillment of the requirements for
the degree of
Master of Environmental Science
Specialization in Environmental Management
Gurabo, Puerto Rico
May, 2012

ii
Universidad del Turabo
A thesis submitted in partial fulfillment of the requirements for the degree of Master of Environmental Science
22 May, 2012 date of defense
Inference of Habitat Connectivity via Habitat Use by Resident and Migratory
Birds between Secondary Dry Forest and Mangroves in Jobos Bay National
Estuarine Research Reserve
Ivelisse Rodríguez-Colón
Approved: ____________________________ Fred C Schaffner, PhD Research Advisor ____________________________ __________________________ María Fernanda Barberena-Arias, PhD Samuel Flores, PhD Member Member ____________________________ Joseph M Wunderle Jr, PhD Member ____________________________ __________________________ Fred C Schaffner, PhD Teresa Lipsett Ruiz, PhD Associate Dean, Graduate Studies Dean and Research
ii

iii
© Copyright 2012 Ivelisse Rodriguez-Colon. All Rights Reserved.
iii
iii
Dedications
First, I want to dedicate this research to God, for all the blessings that he gives
me every day. To my father Fernando Rodríguez-Taboada, for being an excellent
human being, for always listening to me and providing guidance.
In memory of my mother, Paula Colón-Cruz, because she taught me how to
overcome obstacles, how to be strong and keep struggling with a smile on my face.
To all those who, like my parents, fight against cancer and disease every day.
For my husband Javier Arbelo-Decós, for your love, for understanding me,
providing support in all these years and be my eternal field assistant, even when you
were tired.
To all my family members for their good wishes and cheers and for being my field
companions when I couldn’t find anyone else.
iv
iv
Acknowledgments
Completing this research would not have been possible without the help of many
people.
I wish to thank my thesis committee members: To my advisor Dr Fred Schaffner,
for all his advice, guidance and dedication. For sincerely teaching me all his knowledge
in ecology and ornithology, assisting me in mist netting field work and for his critical
review, comments and suggestions on this manuscript. For being more than an advisor
and guiding me as a father would do. To Dr Joseph Wunderle, for showing me how to
analyze point count and arthropod data and for providing a critical review and comments
on the manuscript. To Dr Maria Fernanda Barberena, for her assistance with statistical
analysis and arthropod identification. To Dr Samuel Flores and Dr Adaris Mas, for their
availability, guidance and comments of the manuscript.
To Jobos Bay Reserve personnel, especially the Director Carmen González for
her assistance, logistical support and for giving me the opportunity to work in Jobos
Educational Program, while I finished my research. To Mr Luis Encarnación, who initially
gave me the opportunity and access to the Jobos Bay Reserve and to all the Reserve
personnel that helped me in this process. To the Department of Natural Recourses
(DRNA) personnel, especially the Biologist Gilbert Bonilla, who taught me basic bird
identification in the field and to Hibrain Sued who initially gave me great
support and guidance.
I am very grateful for Dr Jaime Collazo, for his availability and suggestions in
different stages of this research. Also, Dr William Beltran, for his suggestions about
arthropod analysis and for his advice about bird diets. To Maritza Rodríguez, Viviana
González and Keishla M Rodríguez, for their great assistance and help in arthropod

v
v
sorting and identification. To Brenda Carolina Torres for her great contribution in
statistical analysis. To Ingrid Flores, Emilio Font, Waleska Vázquez and Giselle
Caraballo, for assisting me with mist netting in the field. For all my field assistants:
Yeimelys Figueroa, Cristina Acosta, José Huertas, Dioricella Márquez, Arelis Ocasio,
Ariam Delgado and my family members: Keishla M Rodríguez, Alexander Rodríguez,
and Orlando Rodríguez that helped me in arthropod sampling and identification, birds
censuses and mist netting as well.
To the National Oceanic and Atmospheric Administration (NOAA), for the
Graduate Fellowship (GRF) program (NA10NOS4200023), and mini grants of School of
Science and Technology at Universidad del Turabo. Last, but not less important, to Dr
James Quinn of McMaster University for the loan of a field vehicle.
To all the other people who contributed to the success of this research.

vi
vi
Vita
Ivelisse Rodriguez-Colón is a graduate student in the Environmental Sciences
program (Environmental Management specialty) at Universidad del Turabo, Gurabo,
Puerto Rico. She completed a Bachelor’s degree in Natural Science with a concentration
in Biology in May 2003, at the University of Puerto Rico in Cayey PR. She also
completed a Certification in Biotechnology at the Universidad de Puerto Rico, Cayey
Campus in 2007. She continues to broaden her knowledge and expertise, obtaining
professional certifications and attending workshops to enhance her technical knowledge
to support her career.
After completing her Bachelor’s degree, she had the opportunity to begin field
research, having one year of experience as an environmental consultant and five years
of experience in the Pharmaceutical Industry in quality control and chemical laboratories.
Moreover, she has experience in the agricultural industry. Her professional goal is to
develop a research career as an educator and university professor in the area of
Biodiversity, Natural Resource Conservation, and Environmental Management.

vii
vii
Table of Contents
page
List of Tables...................................................................................................................ix
List of Figures..................................................................................................................xi
List of Appendices..........................................................................................................xiv
Abstract...........................................................................................................................xv
Resumen in Spanish.....................................................................................................xvii
Chapter One. Introduction…………….............................................................................1
1.1. Background and Problem.............................................................................1
1.2. Study Species.……………………………………………………………………3
1.3. Study Site...................................................................................................10
1.4. Research Objectives and Hypotheses……………………………………….12
Chapter Two. Methodology…...………..........................................................................14
2.1. Fixed-radius Point Counts..........................................................................14
2.2. Bird Movement Between Habitats..............................................................15
2.2.1. Observations From Blinds.............................................................15
2.2.2. Mist Netting...................................................................................16
2.3. Arthropod Sampling………………………….…………………………………17
2.3.1. Sampling Canopy Arthropods by the
Branch Clipping Technique..........................................................17
2.3.2. Sampling Ground Arthropods by the
Quadrat Technique.......................................................................19
Chapter Three. Results…………………........................................................................21
3.1. Fixed-Radius Point Counts.........................................................................21
3.2. Bird Movement between Secondary Dry Forest
and Combined Mangrove Forest...............................................................31
3.2.1. Observations From a Blind............................................................31
viii
viii
3.2.2. Mist Netting...................................................................................35
3.3. Arthropod Sampling………………………….…………………………………43
3.3.1. Canopy Arthropods in Secondary Dry Forest and
Combined Mangrove Forest (Branch Clipping)............................43
3.3.2. Ground Arthropods in Secondary Dry Forest and
Combined Mangrove Forest (Quadrat Technique).......................50
Chapter Four. Discussion and Conclusions………………………..……………..............55
4.1. Habitat Use by Neotropical Migratory Birds................................................55
4.2. Habitat Quality and Optimal Foraging........................................................59
4.3. Habitat Preference, Social Dominance and Diurnal Migrations..................60
Literature Cited...............................................................................................................63
Appendices….................................................................................................................71
ix
ix
List of Tables
page
Table 1.01. Diet, provisioning preferences and behavior of some
of the resident commonest birds, present in Jobos Bay
National Estuarine Research Reserve (JBNERR) in PR………..7
Table 1.02. Diet, provisioning preferences and behavior of some
migratory birds of interest present in Jobos Bay
National Estuarine Research Reserve (JBNERR) in P.R…….....8
Table 3.01. Summary of presence (+) or absence (-) of species
in a given habitat type during 25-m, 6-min duration
fixed-radius point counts, Sept. 2010 to Sept. 2011
and mist netting during Feb. 2011 to the end of
Apr. 2011 in southern Puerto Rico……………………………….22
Table 3.02. Species richness and presence or absence of warblers
and vireos per habitat type and season, including:
(NM) non-migratory, (M1) wet migratory and
(M2) dry migratory seasons……………………………………….24
Table 3.03. Means SE’s of counts per point of the five most
common warblers and vireos in Jobos Bay per habitat
and season……………………………………………………...…26
Table 3.04. Major directionality of birds captured moving
between mangroves and dry forest, during mist
netting conducted Feb –Apr 2011………………………………34
Table 3.05. Mayor directionality of birds captured moving
between mangroves and dry forest, during mist
netting conducted Feb–Apr 2011 and Chi-Square results…….42

x
x
Table 3.06. Biomass and prey Items of arthropods collected via
branch clipping, by habitat type…………………………………..44
Table 3.07. Biomass and prey Items of arthropods collected via
clipping, by habitat type, excluding Odonata……………………45
Table 3.08. Branch clipping sampling of arthropods by sampling dates
in mangrove and secondary dry forest. Samples
were conducted March-May 2011………………………………..49
Table 3.09 Biomass and prey items of arthropods sampled
in quadrats, habitat type and a two-sample t-test with
log transformed data, excluding orders Diplopoda
and Milipeda………...………………………………………………52
Table 3.10. Arthropod sampling by quadrats technique by sampling
date in mangrove and secondary forest. Samples
were conducted March-May 2011………………………………..54

xi
xi
List of Figures
page
Figure 1.01. Adelaide’s Warbler (Setophaga adelaide)………………………..4
Figure 1.02. Northern Waterthrush (Parkesia noveboracensis)
captured by mist netting and banded……………………………...4
Figure 1.03. Yellow Warbler (Setophaga petechia) captured by mist
netting and banded………………………………………………….5
Figure 1.04. Prairie Warbler (Setophaga discolor) captured by mist
netting and banded…………………………………………………5
Figure 1.05. American Redstart (Setophaga ruticilla) captured by mist
netting and banded………………………………………………….6
Figure 1.06. Aerial View of Jobos Bay National Estuarine Research
Reserve, Salinas Puerto Rico and Reserve Boundary Map…10
Figure 2.01. Locations of 6-min, 25-m fixed-radius point count
sampling from Sep 2010 to Sep 2011 at Jobos Bay
Estuarine Research Reserve (JBNERR)………………………..15
Figure 2.02. Blinds for bird movement observation, established
in a gap between secondary dry forest and mangrove forest…17
Figure 2.03. Arthropod sampling by the branch clipping technique…………18
Figure 2.04. Sampling of ground arthropods by Quadrat Technique………..20
Figure 3.01. Mean number of Adelaide’s Warblers (ADWA) observed per
25-m-fixed radius, 6-min duration point counts…………………27
Figure 3.02. Mean number of Yellow Warblers (YEWA) observed per
25-m-radius, 6-min point counts………………………………….28
Figure 3.03. Mean number of Prairie Warblers (PRAW) observed per
25-m-radius, 6-minute duration point counts…………………...29

xii
xii
Figure 3.04. Mean number of Northern Waterthrushes (NOWA) observed
per 25-m-radius, 6-min duration point counts…………………...30
Figure 3.05. Mean number of Black-whiskered Vireos (BWVI) observed
per 25-m-radius, 6-minute point counts…………………………31
Figure 3.06. Directional observations from a blind between November
2010 to January 2011……………………………………………...32
Figure 3.07. Capture Rate per net hour. Complete Session.
February 18, 2011………………………………………………….36
Figure 3.08. Capture Rate per net hour, complete session. March 7, 2011.38
Figure 3.09. Capture Rate per net hour, complete composite day.
March 21, 2011 AM and March 20, 2011……………………….39
Figure 3.10. Capture Rate per net hour, complete composite day.
April 11 2011, AM and April 10 2011, PM………………………40
Figure 3.11. Capture Rate per net hour, complete composite day.
April 26 2011, AM and April 27 2011…………………………….41
Figure 3.12. Median of prey items per sampling date by branch
clipping technique, between secondary dry forest
and combine (red, black and white) mangrove forest,
between March 26 and April 11 on 2011………………………..46
Figure 3.13. Median arthropod biomass in (mg) per sampling dates
by branch clipping technique, between secondary dry forest
and combine (red, black and white) mangrove forest,
between March 26 and April 11 on 2011……………………….47
Figure 3.14. Median of biomass in mg/g of branch clipped per
sampling dates, by branch clipping technique,
between secondary forest and mangrove forest,
between March 26 and April 11 on 2011………………………..47
xiii
xiii
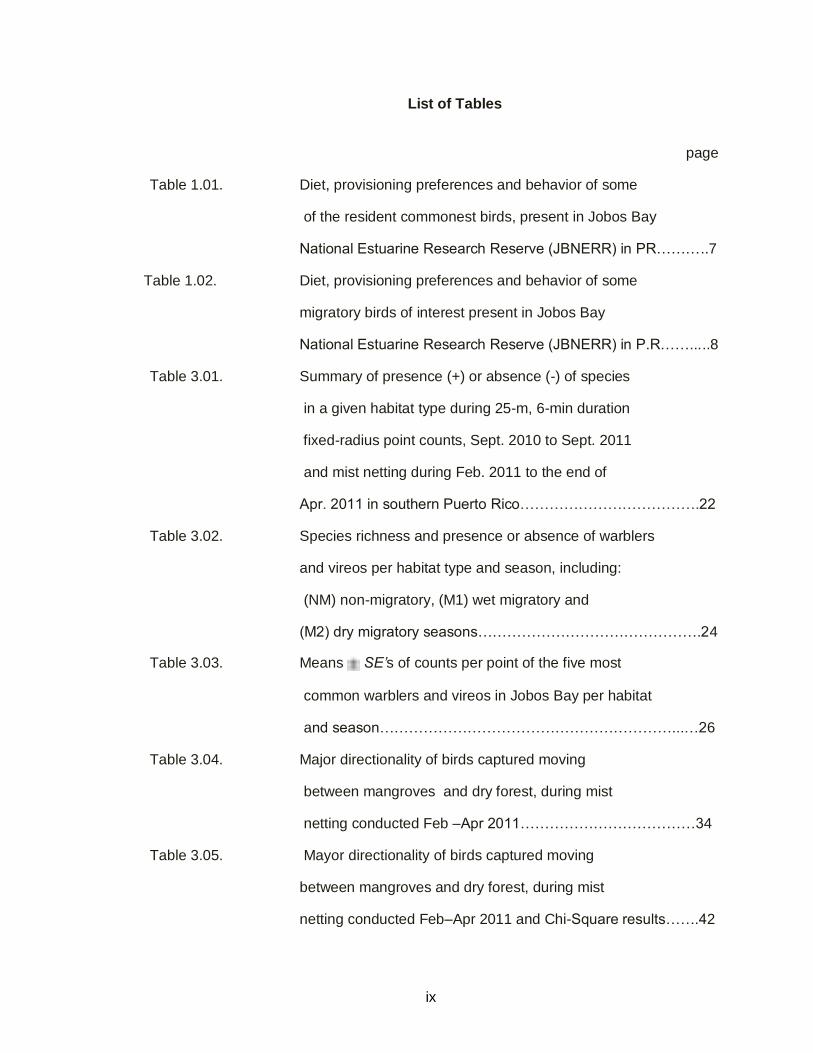
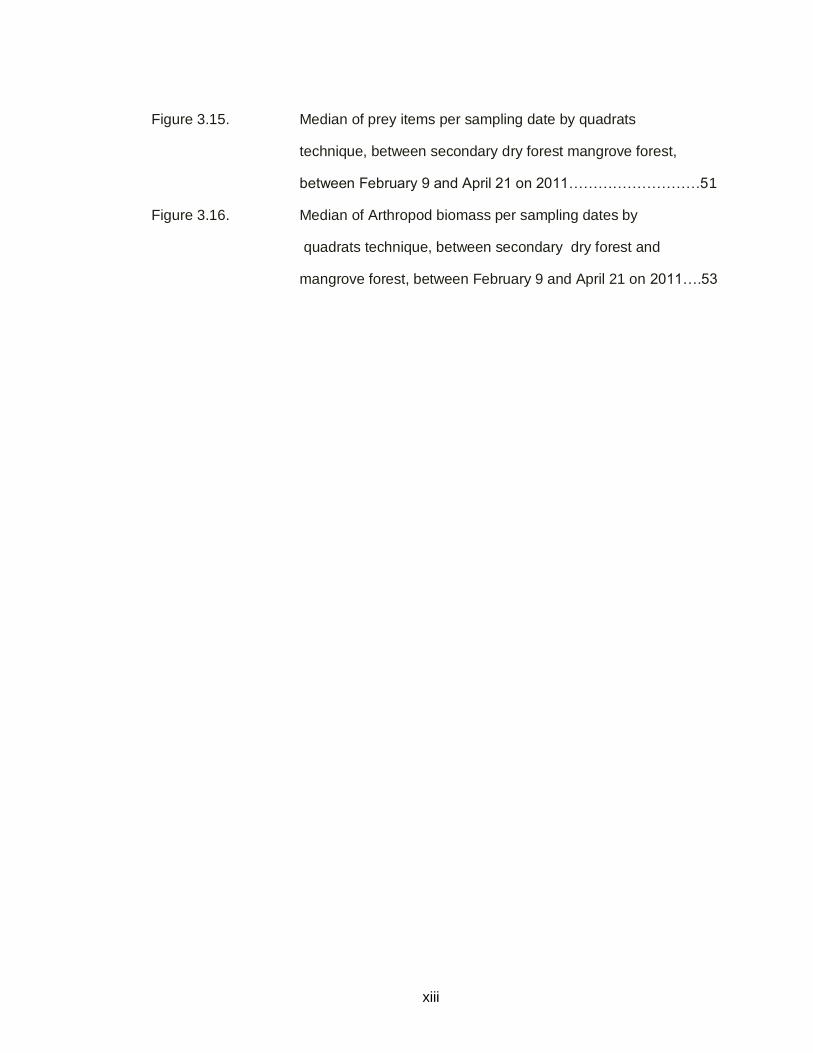
Figure 3.15. Median of prey items per sampling date by quadrats
technique, between secondary dry forest mangrove forest,
between February 9 and April 21 on 2011………………………51
Figure 3.16. Median of Arthropod biomass per sampling dates by
quadrats technique, between secondary dry forest and
mangrove forest, between February 9 and April 21 on 2011….53

xiv
xiv
List of Appendices
page
Appendix One Canopy Arthropod Sampling……………………………………...71
Appendix Two Ground Arthropod Sampling………………….…………………..85

xv
xv
Abstract
IVELISSE RODRÍGUEZ-COLÓN. (MS, Master of Environmental Science)
Inference of Habitat Connectivity Via Habitat Use By Resident and Migratory Birds
between Secondary Dry Forest and Mangroves in Jobos Bay National Estuarine
Research Reserve (May/2012)
Abstract of a master’s thesis at the Universidad del Turabo.
Thesis supervised by Dr Fred C Schaffner. No. of pages in text 99
This research addressed whether several species of migrant birds moved between
mangrove night-roosts and daytime foraging habitat in dry secondary forest. Early
morning fixed-radius point counts performed between (Sep 2010-August 2011), revealed
eleven (11) migratory and resident warbler species in black mangrove, red mangrove
and secondary dry forest. Observations from blinds established in gaps between
mangrove and dry forest within two hours of sunrise and sunset revealed nearly
unidirectional movement by several species tree-hopping through the corridor from
mangroves after sunrise and to mangroves before sunset. Mist netting during February –
April 2011 (a single line of 6, or 8, 12 m length, 30 or 38 mm mesh nets set to intercept
observed flight lines) during the first and last two hours of the day revealed diurnal
mostly unidirectional movements in Prairie Warblers (Setophaga discolor), Northern
Waterthrushes (Parkesia noveboracencis), Yellow Warblers (Setophaga petechia),
American Redstarts (Setophaga ruticilla), Northern Parulas (Parula americana) and
Western Palm Warblers (Setophaga palmarum). This movement was most intense
shortly before sunset. Migrants represented 62% of 312 captures during February-April,
2011 (the dry migratory season). Migrant Ovenbirds (Seiurus aurocapilla), Common
xvi
xvi
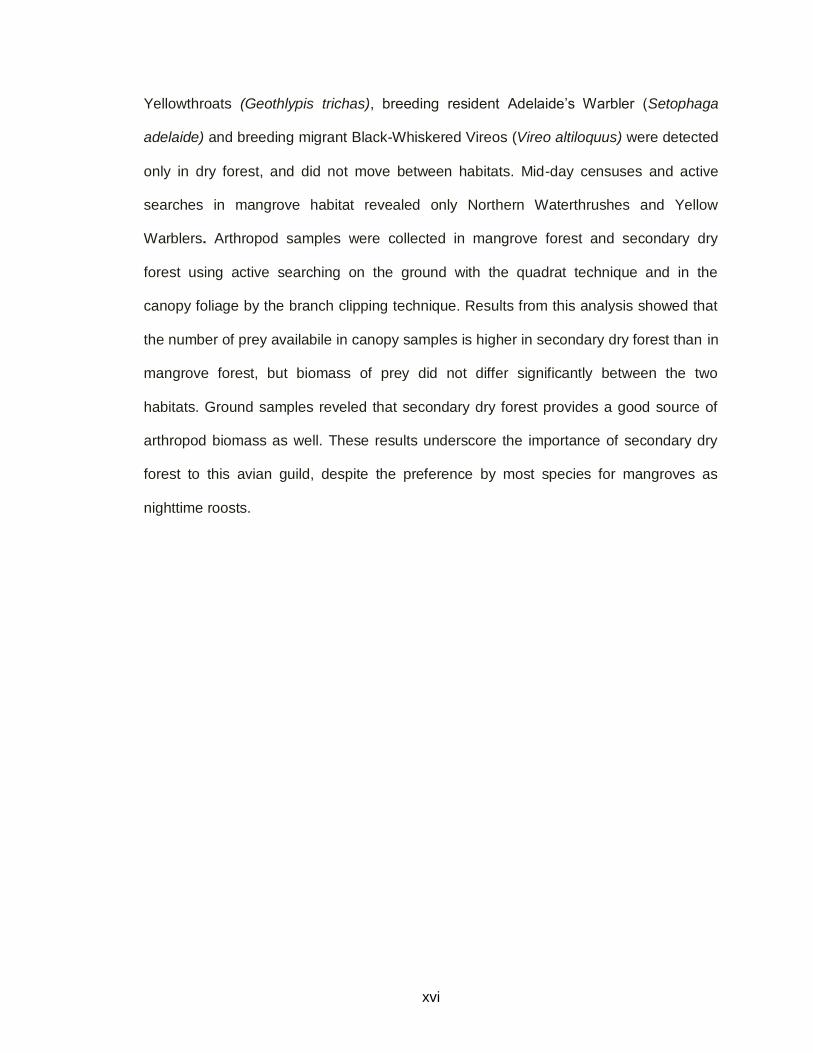
Yellowthroats (Geothlypis trichas), breeding resident Adelaide’s Warbler (Setophaga
adelaide) and breeding migrant Black-Whiskered Vireos (Vireo altiloquus) were detected
only in dry forest, and did not move between habitats. Mid-day censuses and active
searches in mangrove habitat revealed only Northern Waterthrushes and Yellow
Warblers. Arthropod samples were collected in mangrove forest and secondary dry
forest using active searching on the ground with the quadrat technique and in the
canopy foliage by the branch clipping technique. Results from this analysis showed that
the number of prey availabile in canopy samples is higher in secondary dry forest than in
mangrove forest, but biomass of prey did not differ significantly between the two
habitats. Ground samples reveled that secondary dry forest provides a good source of
arthropod biomass as well. These results underscore the importance of secondary dry
forest to this avian guild, despite the preference by most species for mangroves as
nighttime roosts.

xvii
xvii
Resumen
IVELISSE RODRIGUEZ-COLÓN. (MS, Maestría en Ciencias Ambientales)
Inferencia de Conectividad vía el uso de hábitat por aves migratorias y residentes entre
bosque seco secundario y manglares en la Reserva Nacional de Investigación Estuarina
de la Bahía de Jobos (mayo/2012)
Resumen de una tesis de maestría en la Universidad del Turabo.
Tesis Supervisada por el profesor Dr Fred C Schaffner. No. de páginas en el texto 99
Esta investigación evalúa cuando múltiples especies de aves migratorias se
mueven entre sus dormideros en el bosque de mangle y el hábitat de aprovisionamiento
diurno en el bosque seco secundario. Puntos de conteo de radio fijo llevados a cabo
temprano en la mañana entre (Septiembre 2010- Agosto 2011), revelaron once (11)
especies de reinitas residentes y migratorias en el mangle negro, mangle rojo y bosque
seco secundario. Observaciones llevadas acabo en puntos escondidos establecidos en
la interface entre el bosque de mangle y el bosque seco secundario, dos horas después
del amanecer y dos horas antes del atardecer durante (Febrero-Abril 2011), revelaron
un movimiento prácticamente unidireccional por varias especies de aves a través del
corredor, desde los mangles al amanecer y hacia los mangles en el atardecer. Las
redes de niebla fueron establecidas utilizando una línea sencilla de redes de 12 m de
largo y 38 mm, cuya función fue interceptar el movimiento de las aves entre ambos
hábitats, durante las primeras dos y últimas dos horas del día. Fueron detectadas varias
aves migratorias llevando acabo movimientos diarios a través de dicho corredor, entre
ellas: la Reinita Galana (Setophaga discolor), la Pizpita de Mangle (Parkesia
noveboracencis), el Canario de Mangle (Setophaga petechia), la Candelita (Setophaga

xviii
xviii
ruticilla), la Reinita Pechidorada (Parula americana) y la Reinita Palmera (Setophaga
palmarum). El movimiento de las aves fue mas intenso justo antes del anochecer. Las
aves migratorias representan el 62% de 312 capturas durante la temporada seca.
La Reinita Mariposera (Setophaga adelaide), la cual es un ave residente y
endémica, fue observada cerca en el bosque seco secundario, pero no en los
corredores. Las aves migratorias o no residentes: Pizpita Dorada (Seiurus aurocapilla),
Reinita Pica Tierra (Geothlypis trichas), y el Julian Chiví (Vireo altiloquus), fueron
detectados solo en el bosque seco secundario. Ninguna especie fue detectada solo en
los mangles. Muestras de artrópodos fueron colectadas tanto en el mangle como en el
bosque mediante la técnica de búsqueda activa, utilizando cuadrates en el suelo y
cortado de rama en el follaje. Las muestras colectadas, fueron luego cuantificadas para
determinar la biomasa promedio por muestra, en cada tipo de hábitat. Los resultados de
este análisis mostraron que la disponibilidad de alimento en las muestras del dosel es
mayor en el bosque seco secundario que en el bosque de mangle, pero su biomasa no
representa una diferencia significativa. Muestras de artrópodos tomadas en el sustrato
revelaron que el bosque seco secundario provee una excelente fuente de biomasa de
artrópodos, por lo que este representa una fuente esencial de alimento par las aves. Los
resultados de esta investigación realzan la importancia del bosque secundario para este
grupo de aves, independientemente la preferencia de la mayoría de las especies por los
mangles a la hora de descanso al anochecer.
1
1
Chapter One
Introduction
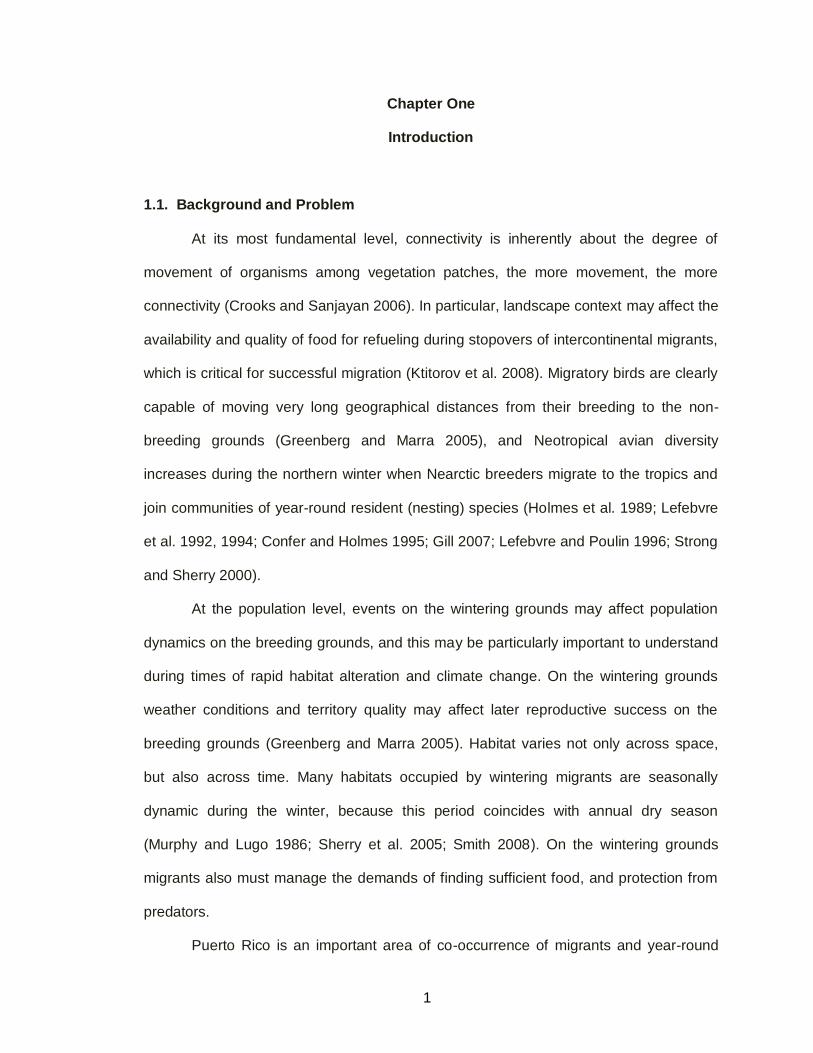
1.1. Background and Problem
At its most fundamental level, connectivity is inherently about the degree of
movement of organisms among vegetation patches, the more movement, the more
connectivity (Crooks and Sanjayan 2006). In particular, landscape context may affect the
availability and quality of food for refueling during stopovers of intercontinental migrants,
which is critical for successful migration (Ktitorov et al. 2008). Migratory birds are clearly
capable of moving very long geographical distances from their breeding to the non-
breeding grounds (Greenberg and Marra 2005), and Neotropical avian diversity
increases during the northern winter when Nearctic breeders migrate to the tropics and
join communities of year-round resident (nesting) species (Holmes et al. 1989; Lefebvre
et al. 1992, 1994; Confer and Holmes 1995; Gill 2007; Lefebvre and Poulin 1996; Strong
and Sherry 2000).
At the population level, events on the wintering grounds may affect population
dynamics on the breeding grounds, and this may be particularly important to understand
during times of rapid habitat alteration and climate change. On the wintering grounds
weather conditions and territory quality may affect later reproductive success on the
breeding grounds (Greenberg and Marra 2005). Habitat varies not only across space,
but also across time. Many habitats occupied by wintering migrants are seasonally
dynamic during the winter, because this period coincides with annual dry season
(Murphy and Lugo 1986; Sherry et al. 2005; Smith 2008). On the wintering grounds
migrants also must manage the demands of finding sufficient food, and protection from
predators.
Puerto Rico is an important area of co-occurrence of migrants and year-round
1

2
2
residents, including those that are known to occur in both secondary dry forest and
coastal mangroves, in southwestern and southeastern Puerto Rico (Staicer 1991, 1992;
Baltz 2000; Reitsma et al. 2002, 2004; Hunt et al. 2005; Smith 2008; Toms 2011). A
summary of reports across a broad geographic area within the non-breeding range,
reveals a common pattern of off-home range movements between diurnal home ranges
and nocturnal roost sites by a diversity of migrant and resident species (Post 1978,1982;
Holmes et al. 1989; Alsop III 1995; Reitsma et al. 2002; 2004; Burson III et al. 2005;
Hunt et al. 2005; Smith 2008; Smith et al. 2008), often moving through, and foraging in,
a variety of habitat types in a single day.
This connectivity concept is based fundamentally on the degree of movement of
organisms or processes (Crooks and Sanjayan 2006). For residents and migrants in
Puerto Rico, movement between distinct habitat types may be enhanced as birds seek
to achieve an optimal balance between the pressures of locating a safe (predator-free)
night roost and feeding. A diversity of both insects and flora makes an ideal habitat for
tropical birds, but when patch size is small, or when habitat is fragmented, connectivity,
including daily movements between habitats (ephemeral habitat occupancy) may
increase (see Stutchbury 1994; Strong and Sherry 2000). This is an especially important
conservation issue when species move naturally between protected and unprotected
habitats (Powell and Bjork 1995), including dry forest habitats that may be in a diversity
of stages of secondary succession.
Some specialized species can have stable populations in the tropics, but may be
vulnerable to climate and habitat changes, therefore making it important to understand
the relationships between movement, foraging behavior and successional stage is
crucial (Reitsma et al. 2002, 2004; Smith 2008; Smith et al. 2008). These authors
focused on the connectivity issues and found that daily movement by migrants between
distinct foraging habitat (scrub and dry forest) and night roosts (mangroves) was
3
3
common.
In Puerto Rico and the Virgin Islands, avian communities include some 350
species and consist of both residents and non-residents during some parts of the year
(Raffaele 1989; Oberle 2006). About a third of these species are accidental that have
occurred rarely, while about 120 species breed in Puerto Rico, including native species,
of which 17 are considered endemic (Oberle 2006, 2010).
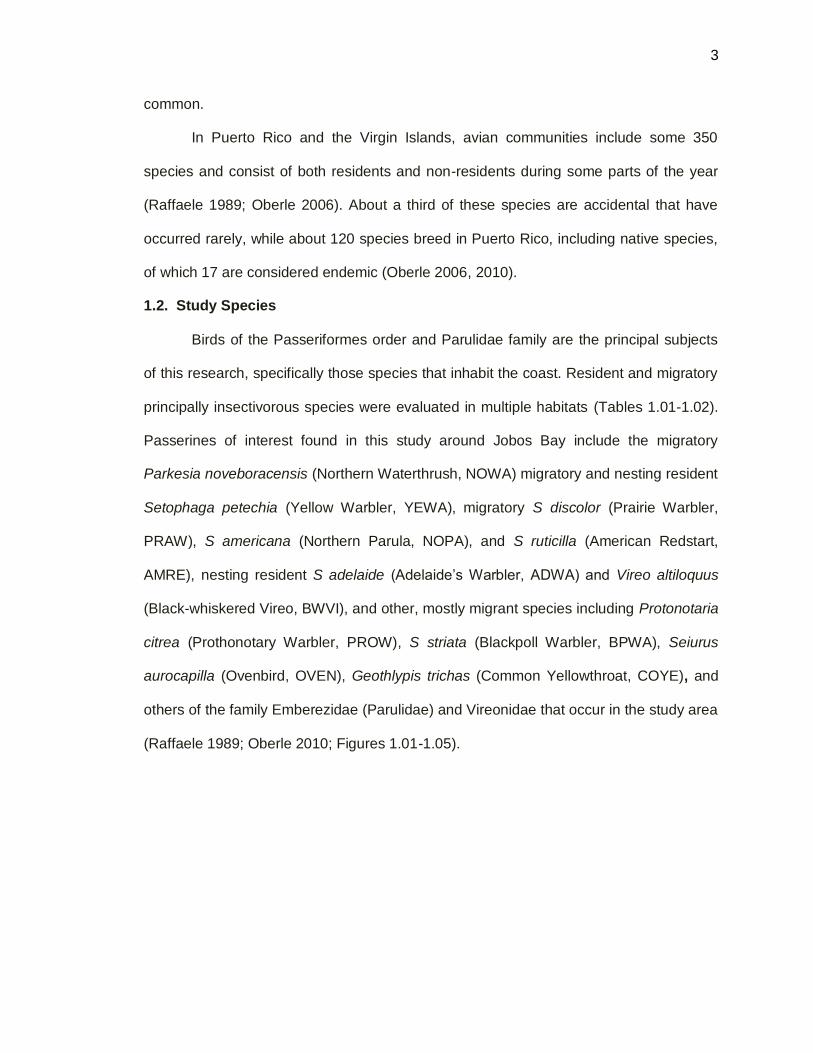
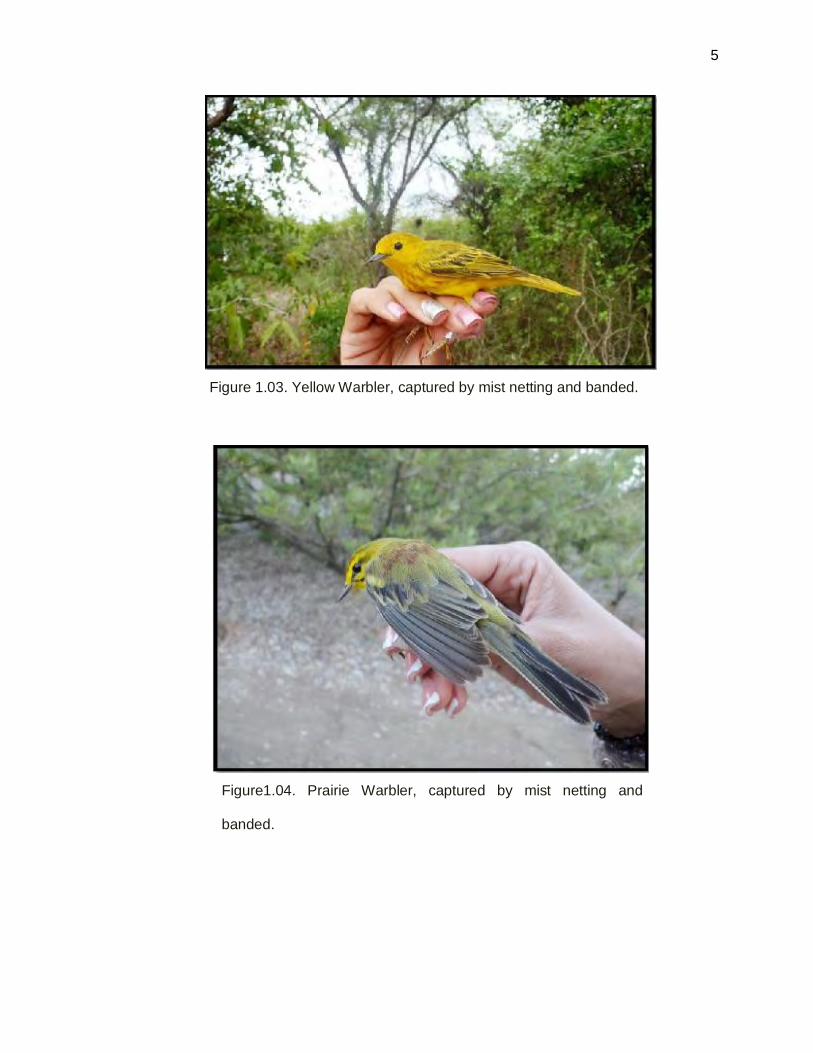
1.2. Study Species
Birds of the Passeriformes order and Parulidae family are the principal subjects
of this research, specifically those species that inhabit the coast. Resident and migratory
principally insectivorous species were evaluated in multiple habitats (Tables 1.01-1.02).
Passerines of interest found in this study around Jobos Bay include the migratory
Parkesia noveboracensis (Northern Waterthrush, NOWA) migratory and nesting resident
Setophaga petechia (Yellow Warbler, YEWA), migratory S discolor (Prairie Warbler,
PRAW), S americana (Northern Parula, NOPA), and S ruticilla (American Redstart,
AMRE), nesting resident S adelaide (Adelaide’s Warbler, ADWA) and Vireo altiloquus
(Black-whiskered Vireo, BWVI), and other, mostly migrant species including Protonotaria
citrea (Prothonotary Warbler, PROW), S striata (Blackpoll Warbler, BPWA), Seiurus
aurocapilla (Ovenbird, OVEN), Geothlypis trichas (Common Yellowthroat, COYE), and
others of the family Emberezidae (Parulidae) and Vireonidae that occur in the study area
(Raffaele 1989; Oberle 2010; Figures 1.01-1.05).

4
4
Figure 1.01. Adelaide’s Warbler. Photo by Mike Morel
Figure 1.02. Northern Waterthrush, captured by mist netting and
banded.
5
5
Figure 1.03. Yellow Warbler, captured by mist netting and banded.
Figure1.04. Prairie Warbler, captured by mist netting and
banded.

6
6
Figure 1.05. American Redstart, captured by mist netting and
banded.
7
7
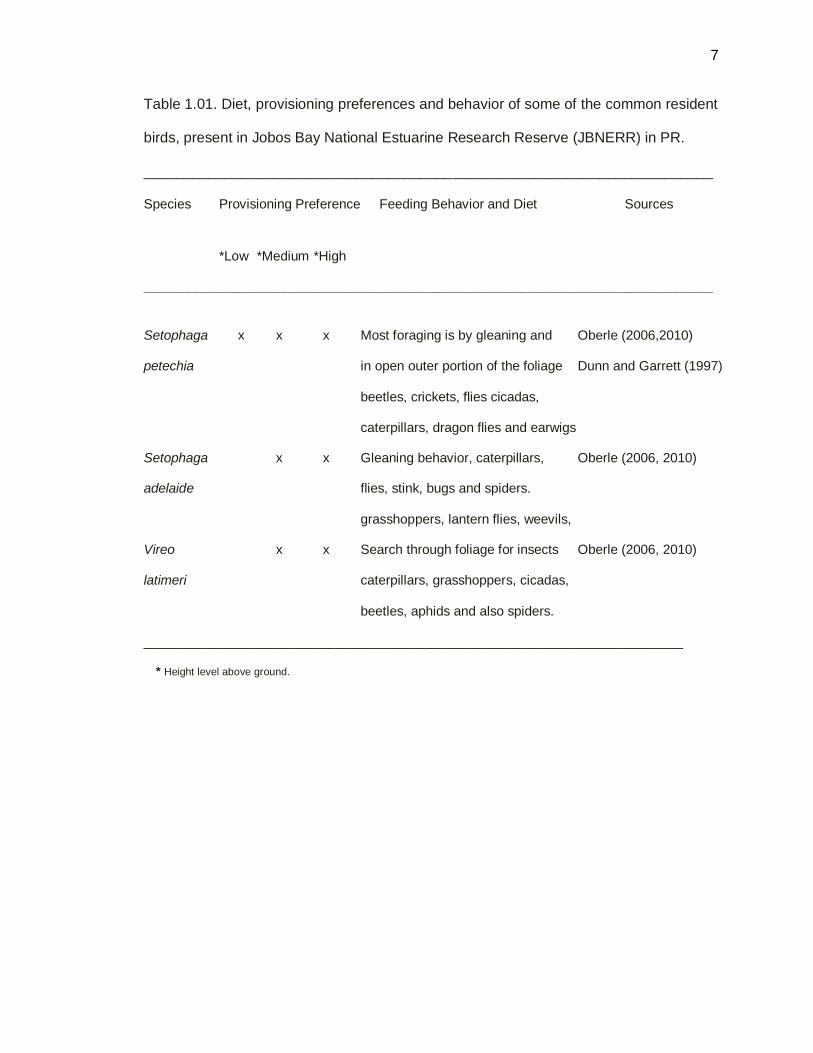
Table 1.01. Diet, provisioning preferences and behavior of some of the common resident
birds, present in Jobos Bay National Estuarine Research Reserve (JBNERR) in PR.
______________________________________________________________________
Species Provisioning Preference Feeding Behavior and Diet Sources
*Low *Medium *High
_____________________________________________________________________________
Setophaga x x x Most foraging is by gleaning and Oberle (2006,2010)
petechia in open outer portion of the foliage Dunn and Garrett (1997)
beetles, crickets, flies cicadas,
caterpillars, dragon flies and earwigs
Setophaga x x Gleaning behavior, caterpillars, Oberle (2006, 2010)
adelaide flies, stink, bugs and spiders.
grasshoppers, lantern flies, weevils,
Vireo x x Search through foliage for insects Oberle (2006, 2010)
latimeri caterpillars, grasshoppers, cicadas,
beetles, aphids and also spiders.
_________________________________________________________________________
* Height level above ground.
8
8
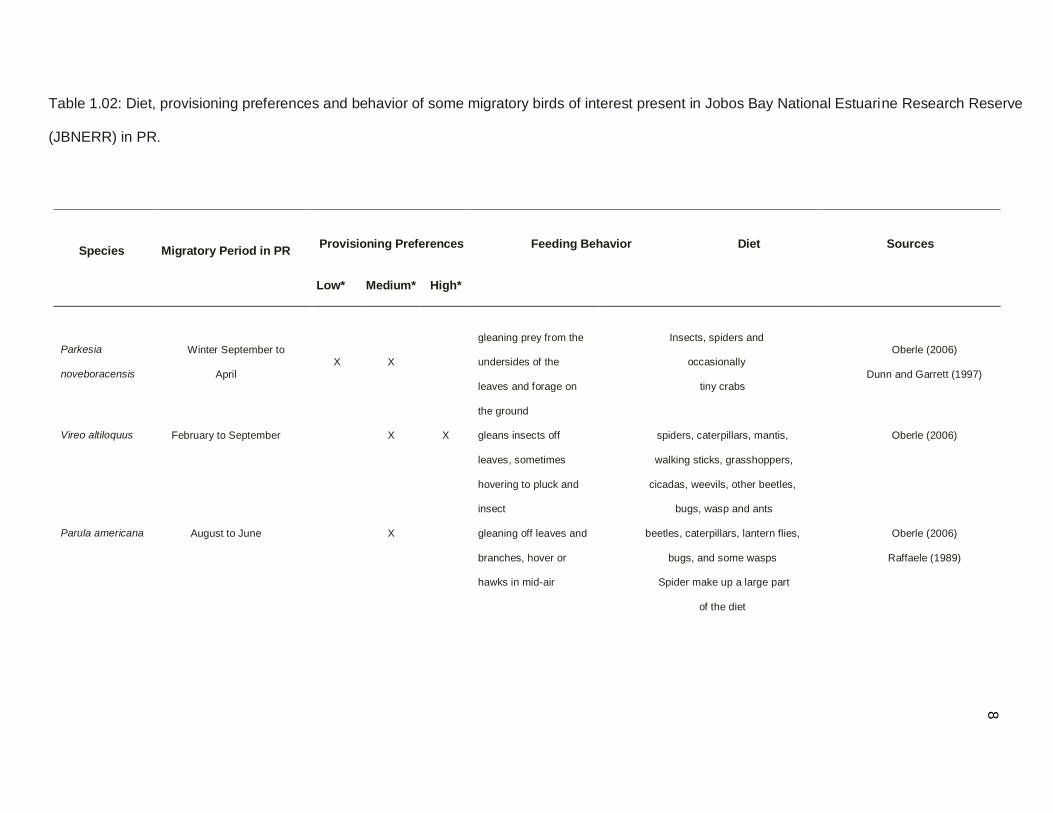
Table 1.02: Diet, provisioning preferences and behavior of some migratory birds of interest present in Jobos Bay National Estuarine Research Reserve
(JBNERR) in PR.
Species Migratory Period in PR
Provisioning Preferences
Feeding Behavior Diet
Sources
Low* Medium*
High*
Parkesia
noveboracensis
Winter September to
April
X X
gleaning prey from the
undersides of the
leaves and forage on
the ground
Insects, spiders and
occasionally
tiny crabs
Oberle (2006)
Dunn and Garrett (1997)
Vireo altiloquus February to September X X gleans insects off
leaves, sometimes
hovering to pluck and
insect
spiders, caterpillars, mantis,
walking sticks, grasshoppers,
cicadas, weevils, other beetles,
bugs, wasp and ants
Oberle (2006)
Parula americana August to June X gleaning off leaves and
branches, hover or
hawks in mid-air
beetles, caterpillars, lantern flies,
bugs, and some wasps
Spider make up a large part
of the diet
Oberle (2006)
Raffaele (1989)

9
9
* Altitude level above ground.
Setophaga tigrina November to March X X forage along edges off
moist forest, dry forest
and mangroves
insects and spiders
Oberle (2006)
Raffaele (1989)
Setophaga striata
Fall (October-November)
uncommon in September.
X haunts in low branches,
often by gleaning
- Oberle (2006)
Raffaele (1989)
Dunn and Garrett (1997)
Setophaga
discolor
August to April X gleans insects off
leaves
insects Oberle (2006)
Raffaele (1989)
Setophaga
ruticilla
September to April with
records in early May
X X X Snatches insects in mid
air or hover to pick
insects off leaves, also
creeps along trunks
Beetles, flies, lantern flies,
small wasp, and spiders
Oberle (2006)
Raffaele (1989)
Dunn and Garrett (1997)

10
10
1.3. Study Site
This research was conducted at the Jobos Bay National Estuarine Research
Reserve (JBNERR), located on the south-central coast of Puerto Rico near Ponce
17˚57’N and 66˚14’W, between the municipalities of Guayama and Salinas (Figure 1.06).
This reserve was designated as a reserve in 1981 via an agreement between the
Commonwealth of Puerto Rico Department of Natural and Environmental Resources
(DNER) and the National Oceanic and Atmospheric Administration (NOAA). The
Reserve comprises an area of 1120 ha, located at the west end of Jobos Bay, while the
Aguirre State Forest (total area 957 ha, or 2,393 acres) borders the north shore and the
east end of the Bay (Ewel and Whitmore 1973; González 2001) (Figure 1.06).
Figure 1.06. Aerial View of Jobos Bay National Estuarine Research Reserve,
Salinas Puerto Rico. Reserve boundary is shown in red. Source: National
Oceanic and Atmospheric Administration (NOAA).
11
11
The ecosystems within the Reserve include mangrove forests, lagoons, salt flats,
a dry forest and sea grass beds. Mangrove forests are one of the most severely
impacted habitats throughout the Caribbean and Central America, and many native,
endangered and threatened bird species share the mangrove forest as their main habitat
in JBNERR (Laboy et al. 2006; Laboy 2009). Recent studies show that the mangrove
forest in JBNERR has experienced massive mortality (Morris 2000) likely resulting from
land use changes and agricultural practices that impact the hydrological conditions
necessary to sustain mangrove and wetland ecosystems.
The Jobos Bay Reserve and its surroundings are a substantially fragmented area
(Figure 1.06). Fragmentation is a threat to biodiversity even in a relatively stable world.
Biological communities and ecological processes may change substantially as a result of
edge effects, and is a major cause for the decline of forest birds in heavily fragmented
landscapes (Noss et al. 2006 (Chapter 7) in Groom et al. 2006).
Much of the existing dry forest habitat in Jobos Bay includes successional habitat
arising from recently abandoned agricultural land that lies outside of the Reserve
(Gonzalez 2001; Laboy-Nieves 2009). Mangroves in the Reserve include Red Mangrove
(Rhizophora mangle), Black Mangrove (Avicennia germinans), White Mangrove
(Laguncularia racemosa), and Buttonwood (Conocarpus erectus), and extensive stands
of these mangroves have suffered heavy mortality during the previous 2 decades,
creating areas of low, early successional recovering mangroves close to the coast. All
dry forest in the area is secondary and includes a mix of native and exotic species
dominated in most areas by exotic mesquite (Prosopis juliflora), though the youngest (<
15 years) patches, especially those not previously used for livestock grazing, are
dominated by exotic Leucaena leucocephala, often in monocultural stands. Much of this
habitat is in public ownership for agricultural purposes, but little enjoys any legal
protection and is largely perceived by the general public and local government as
12
12
“trash”; thus, it is in even greater peril than mangrove habitat that has already suffered
significant destruction and alteration throughout the Caribbean. Wunderle et al. (2010)
underlined the importance of anthropogenically disturbed early-successional habitat to
migrants, heightening the urgency for better understanding and protecting these
ecosystems.
1.4. Research Objectives and Hypotheses
The principal objectives of this research are to (1) determine whether migratory
and resident species are using multiple habitats during the winter and through the year,
(2) determine whether individuals move routinely (daily) between and (3) determine
potential differences in food (invertebrates) abundance and quality in the canopy and
floor of the various habitats used by the birds. The Northern Waterthrush, Parkesia
noveboracensis is of special interest because it has already shown connectivity
movement between mangrove and dry secondary forest agroecosystems (Reitsma et al.
2002, 2004; Smith 2008; Smith et al. 2008; 2010) nearby at the former Roosevelt Roads
Navy Base on the east coast of Puerto Rico.
Specific hypotheses can be articulated according to each objective:
1. The first objective of this research is to determine bird occurrence by resident
and migratory birds year round in multiple habitats.
H0 - Each species of resident and migratory warbler or vireo occurs in a
single, specific habitat.
H1 -Each species of resident and migratory warbler or vireo occurs in multiple
habitats.
2. The second objective of this research is to determine if mangrove-roosting birds
move to secondary dry forest in search of food at dawn and return to the
mangrove forest at dusk, in order to infer connectivity during the dry migratory
season (February – April 2011).

13
13
H0- Mangrove-roosting migrants are sedentary in mangrove forest and do not
move between mangroves and other habitats.
H1- Mangrove-roosting migrants make daily movements from mangroves to
secondary forest at dawn, and return to the mangrove forest at dusk
(connectivity between habitats).
3. The third objective of this research is to determine arthropod biomass in
secondary dry forest and mangrove forest. Which habitat offers potentially
greater food abundance (or biomass) of arthropods, the canopy or the ground,
mangrove forest or secondary dry forest?
H0- Arthropod biomass will not change between secondary forest and
mangrove forest, in the canopy and on the ground.
H1- Arthropod biomass will be higher in mangrove forest than in secondary
forest, in the canopy and on the ground.
14
14
Chapter Two
Methodology
2.1. Fixed-radius Point Counts
In order to assess presence or absence, relative abundance and an index of
seasonal trends in occurrence of migrant and resident warblers and vireos, a series of 6-
minute, 25-meter fixed-radius point counts were used in plots of four habitat types: red
mangrove forest, black and white mangrove forest (= “black” mangrove), secondary dry
forest and cultivated areas (Wunderle 1994) (Figure 2.01). The point counts were
established randomly within each habitat type and located at least 100 m apart (a
stratified random design). The number of points placed in each habitat type varied due
to the site size and accessibility, and each point was no closer than 25 m from a habitat
edge. The radius of each point was fixed at 25 m and counting time was standardized at
6 min in each point during one year, from Sep 2010 through Sep 2011. Counts were
initiated at sunrise and terminated before 1100 AM.
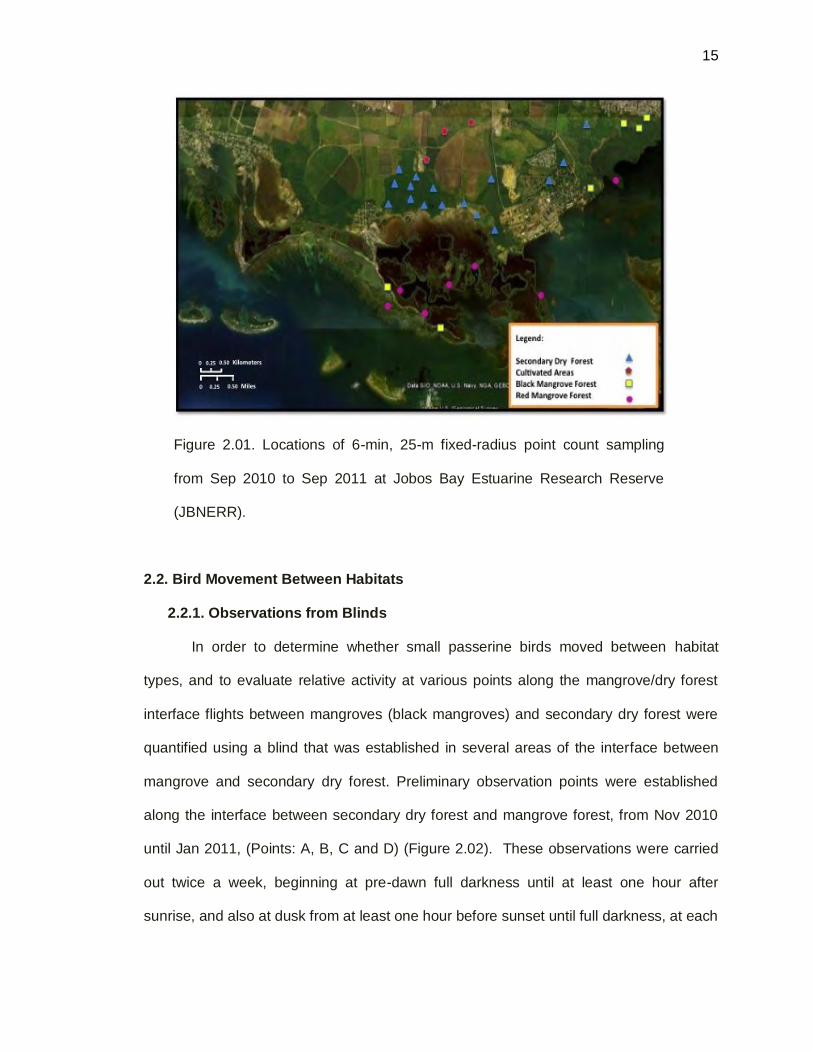
Thirty-two points were sampled: 16 in secondary dry forest, 6 in black and white
mangrove (“black”) forest, 7 in red mangrove forest and 3 in cultivated areas (Figure
2.01). All point counts were sampled during the entire year, except red mangroves,
which were sampled from Feb 2011 through Aug 2012 only, due to limited access (lack
of availability of boat transportation). A non-parametric Kruskal Wallis test was
performed to evaluate differences through the year and between habitats for bird
species detected in these counts.
14
15
15
Figure 2.01. Locations of 6-min, 25-m fixed-radius point count sampling
from Sep 2010 to Sep 2011 at Jobos Bay Estuarine Research Reserve
(JBNERR).
2.2. Bird Movement Between Habitats
2.2.1. Observations from Blinds
In order to determine whether small passerine birds moved between habitat
types, and to evaluate relative activity at various points along the mangrove/dry forest
interface flights between mangroves (black mangroves) and secondary dry forest were
quantified using a blind that was established in several areas of the interface between
mangrove and secondary dry forest. Preliminary observation points were established
along the interface between secondary dry forest and mangrove forest, from Nov 2010
until Jan 2011, (Points: A, B, C and D) (Figure 2.02). These observations were carried
out twice a week, beginning at pre-dawn full darkness until at least one hour after
sunrise, and also at dusk from at least one hour before sunset until full darkness, at each

16
16
point. Areas of documented between-habitat movement are henceforth referred to as
“corridors”. Additional visual observations were conducted to find the locations of day
roosts and night roosts.
2.2.2. Mist Netting
Mist netting was conducted at the most active corridor point (Point B) during dry
migratory (M2) period, from Feb 2011 to Apr 2011 (Figure 2.02). A series of 6 to 10
four-trammel 2.5 m tall mist nets of 30 mm or 38 mm mesh, and 12 m length, was used
to capture small warblers and other passerines. An initial mist-netting session was
conducted in secondary dry forest habitat on Feb 4 2011 for 5 hours, beginning at 8:00
AM and ending at 1:45 PM. Subsequently, mist nets were established in corridor point
“B” in a gap between mangrove and dry forest, the most active point of this corridor
based on blind observations. Netting was conducted from Feb 18 to April 27. Thereafter,
to detect bird movements between habitats (Smith 2008), mist netting was conducted
from full darkness before dawn until two hours after dawn, and from two hours before
dusk until full darkness after dusk. Multiple species were captured in order to quantify
directionality, intensity and time of movement. All birds captured were identified,
weighted, banded and released. A Chi-squared Test was performed to assess
differences among bird movements between secondary dry forest (SF) and mangrove
forest (M) at sunrise (“AM”) and at dusk (“PM”).

17
17
Figure 2.02. Blinds for bird movement observation, established at points A, B, C,
D and E, in a gap between secondary dry forest and mangrove forest. Mist nets
were established at the most active site point “B”.
2.3. Arthropod Sampling
2.3.1. Sampling Canopy Arthropods by the Branch Clipping Technique
Total abundance of arthropods in an environment does not necessarily
correspond to the amount of food available for foraging predators, due to the bird’s
selection of prey and foraging microhabitats (Hutto 1990; Johnson and Sherry 2001). For
that reason, the branch clipping technique was chosen. Many migrants and resident
warblers feed at mid to high heights above the ground. Examples include Yellow
18
18
Warblers, Adelaide’s Warblers, Prairie Warblers, American Redstarts and Northern
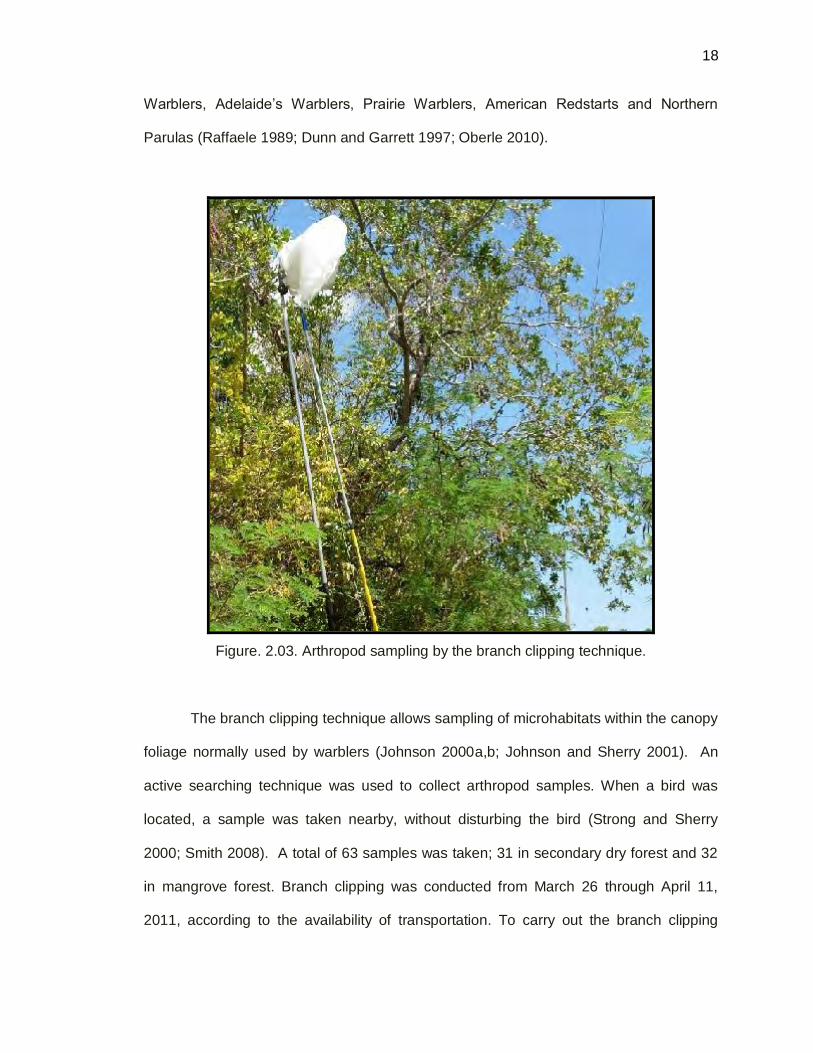
Parulas (Raffaele 1989; Dunn and Garrett 1997; Oberle 2010).
Figure. 2.03. Arthropod sampling by the branch clipping technique.
The branch clipping technique allows sampling of microhabitats within the canopy
foliage normally used by warblers (Johnson 2000a,b; Johnson and Sherry 2001). An
active searching technique was used to collect arthropod samples. When a bird was
located, a sample was taken nearby, without disturbing the bird (Strong and Sherry
2000; Smith 2008). A total of 63 samples was taken; 31 in secondary dry forest and 32
in mangrove forest. Branch clipping was conducted from March 26 through April 11,
2011, according to the availability of transportation. To carry out the branch clipping

19
19
technique a collapsible bag was positioned in the vegetation at height of 9-20 m, with the
aid of extension poles. The bag was placed quickly over the edge of the branch and the
mouth of the bag was closed tightly around the branch. The branch was clipped free with
the aid of a telescopic tree pruner, and then the bag and branch were lowered. Samples
were extracted and collected with the aid of a modified vacuum manufactured by Bioquip
Corporation for further quantification and biomass determination. Individuals per branch
clipped were counted and dried to constant mass to the nearest 0.1 mg. The mass of
each sample was expressed in mg of total biomass of arthropods per g of clipped
vegetation (wet mass) (Johnson 2000a,b; Johnson and Sherry 2001). To test the
prediction that arthropod biomass was higher in mangrove forest than in secondary dry
forest, during the dry migratory season, a 2 sample t-test was used.to compare means
between two groups.
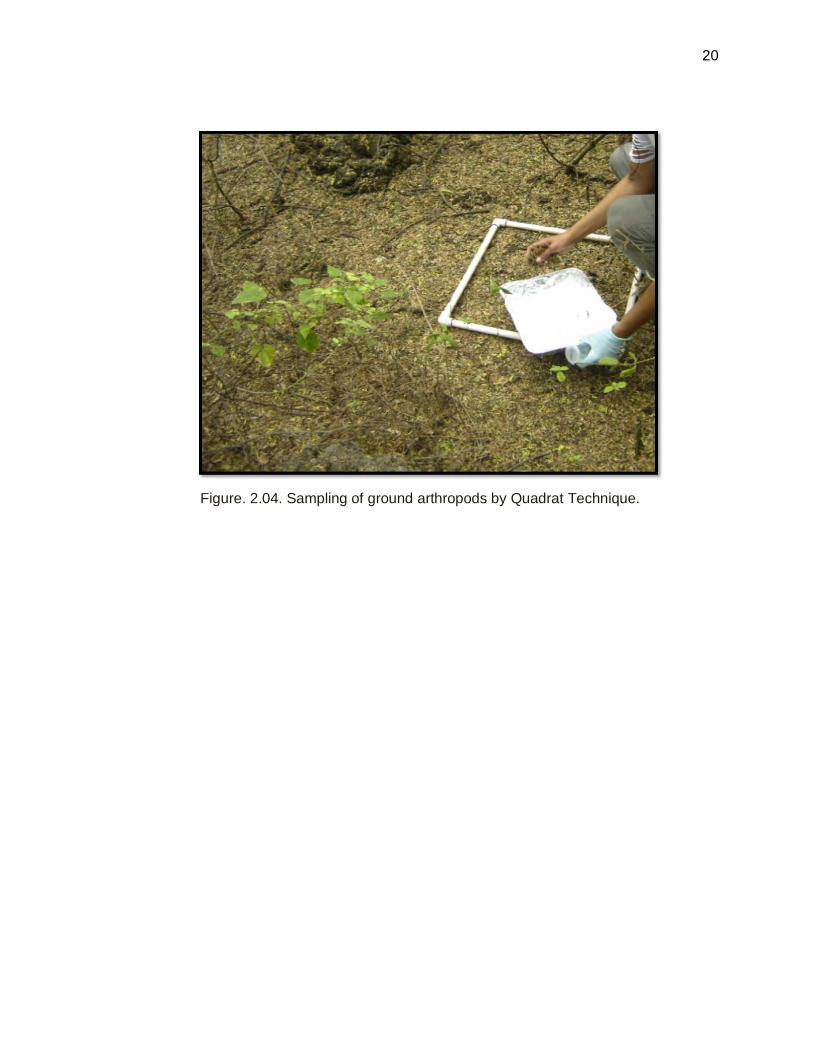
2.3.2. Sampling Ground Arthropods by the Quadrat Technique
The quadrat technique was used to sample arthropods on the surface of the leaf
litter (Figure 2.03). Active searching was used because the Northern Waterthrush is an
active leaf-tosser during foraging (Smith 2008), and Ovenbirds feed from the leaf litter
surface (Strong and Sherry 2000). A total of 60 samples were taken, 30 in secondary
dry forest and 30 in mangrove forest. Each time a bird was located, a direct search of
the ground substrate was carried out within a 0.25 m2 quadrat. Samples were taken as
close as possible to the exact location that the bird was observed, without disturbing the
bird (Strong and Sherry 2000; Smith 2008). All samples were collected for further
quantification and biomass determination. Arthropod samples were counted and then
dried to constant mass to the nearest 0.1 mg. To test the prediction that arthropod
biomass was higher in mangrove forest that in secondary dry forest, during the dry
migratory season, the 2 sample t-test was used to compare means between two groups.
20
20
Figure. 2.04. Sampling of ground arthropods by Quadrat Technique.

21
21
Chapter Three
Results
3.1. Fixed-radius Point Counts
Multiple point counts with a fixed radius of 25 m and 6 minute duration were
conducted in four habitats: secondary dry forest, black and white mangrove forest, red
mangrove forest and cultivated habitats. Censuses were conducted from September
2010 to August 2011. The data collected include presence or absence of each bird
species detected, as well as the number of each species observed per point.
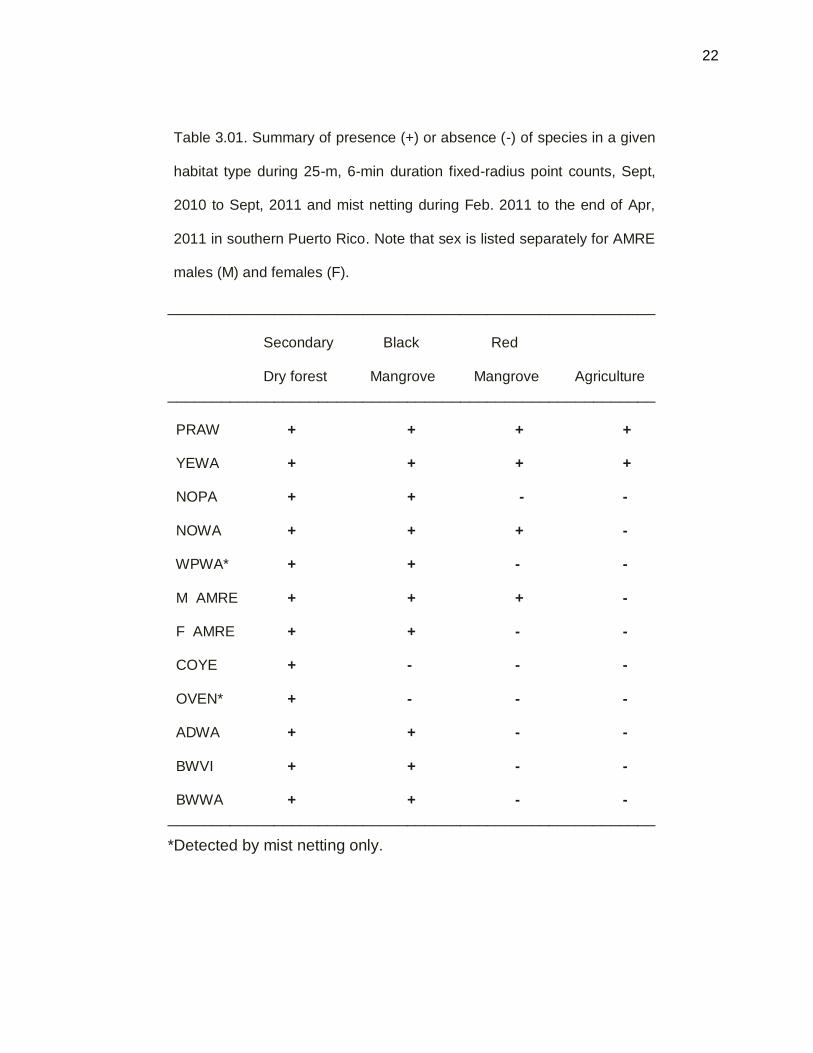
Prairie Warblers and Yellow Warblers were found in all habitat types (Table
3.01). Northern Waterthrushes and American Redstarts were found in secondary dry
forest, black mangrove forest and red mangrove forest, but not in agricultural areas.
Several migratory species were observed only in two habitat types, secondary dry forest
and black mangrove forest. Those species are: Northern Parulas, female American
Redstarts, Western Palm Warblers, and Black-and-white Warblers. In addition, the
Adelaide’s Warbler was only detected in two habitat types, secondary dry forest and
black mangrove forest (Table 3.01), and in the latter habitat nearly always in areas
adjacent to dry forest. The resident, Black-Whiskered Vireo and the three migrants,
Blackpoll Warbler, Common Yellowthroat and Ovenbird were detected only in secondary
dry forest. Blackpoll Warblers were detected only in the first migratory season (M1, Sep-
Dec), as this species commonly uses Puerto Rico as a stopover area (Baltz 2000). All
species were detected with fixed-radius point counts, except Western Palm Warbler and
Ovenbirds, which were detected only by mist netting during the dry migratory season
from February to April 2011.
21
22
22
Table 3.01. Summary of presence (+) or absence (-) of species in a given
habitat type during 25-m, 6-min duration fixed-radius point counts, Sept,
2010 to Sept, 2011 and mist netting during Feb. 2011 to the end of Apr,
2011 in southern Puerto Rico. Note that sex is listed separately for AMRE
males (M) and females (F).
_______________________________________________________
Secondary Black Red Dry forest Mangrove Mangrove Agriculture
_______________________________________________________
PRAW + + + + YEWA + + + + NOPA + + - - NOWA + + + - WPWA* + + - - M AMRE + + + - F AMRE + + - - COYE + - - - OVEN* + - - - ADWA + + - - BWVI + + - - BWWA + + - -
_______________________________________________________
*Detected by mist netting only.

23
23
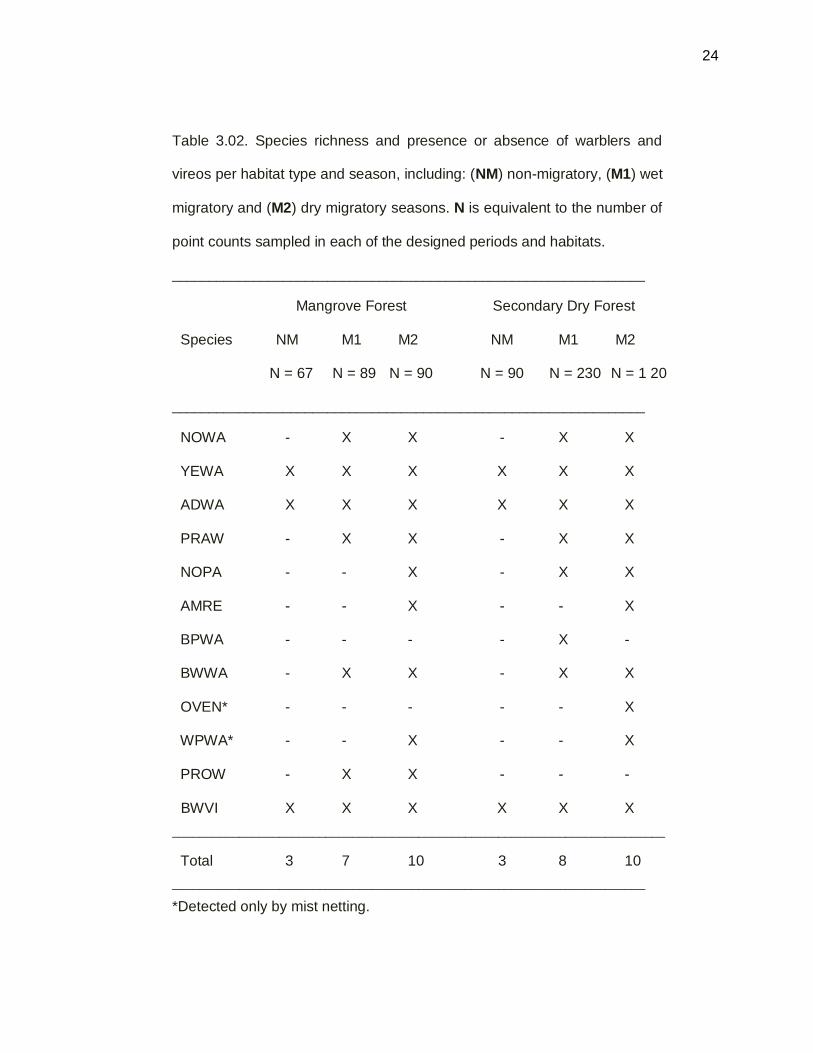
Species richness was evaluated in mangrove forest and secondary dry forest
during one entire year, Sep 2010 to Sep 2011. The year was divided into three seasons:
M1 = the migratory wet season that covers Sep-Dec 2010; M2 = the migratory dry
season, Jan-Apr, 2011; and NM = the non-migratory season, May-Aug 2011 (Table
3.02). Both secondary dry forest, and combined red and black mangrove habitats,
reached their highest species richness in the second (dryer, M2) migratory season. Ten
species were found in the M2 season in mangrove forest. All species were detected by
point counts, except two species that were detected only by mist netting – Ovenbird and
Western Palm Warbler. All species above were also detected in secondary dry forest in
the M2 season except the Prothonotary Warbler, which was observed accidentally. Only
three breeding species (Oberle 2010) were found during the non-migratory season (NM),
in both habitats including: Adelaide’s Warbler, Yellow Warbler and Black-Whiskered
Vireo. During the M1 season, seven species were found in combined mangrove habitat.
In addition, secondary forest richness during M1 included eight species (Table 3.02).
24
24
Table 3.02. Species richness and presence or absence of warblers and
vireos per habitat type and season, including: (NM) non-migratory, (M1) wet
migratory and (M2) dry migratory seasons. N is equivalent to the number of
point counts sampled in each of the designed periods and habitats.
________________________________________________________________
Mangrove Forest Secondary Dry Forest
Species NM M1 M2 NM M1 M2
N = 67 N = 89 N = 90 N = 90 N = 230 N = 1 20
________________________________________________________________
NOWA - X X - X X
YEWA X X X X X X
ADWA X X X X X X
PRAW - X X - X X
NOPA - - X - X X
AMRE - - X - - X
BPWA - - - - X -
BWWA - X X - X X
OVEN* - - - - - X
WPWA* - - X - - X
PROW - X X - - -
BWVI X X X X X X
__________________________________________________________________________
Total 3 7 10 3 8 10
_______________________________________________________________________
*Detected only by mist netting.

25
25
Fixed-radius point counts were conducted from Sep 2010 to Sep 2011 in multiple
habitats, including secondary dry forest, red mangrove and black mangrove forest and
cultivated areas (Agriculture). For the purpose of the following analyses, the two major
habitats are considered; (1) secondary dry forest and (2) combined (black and red)
mangrove forest. Although twelve species of warblers and vireos were observed in this
research, only data for the five most common species at Jobos Bay Reserve were
evaluated in detail (Table 3.03). A non-parametric Kruskal Wallis test was performed to
evaluate differences between habitat and season.
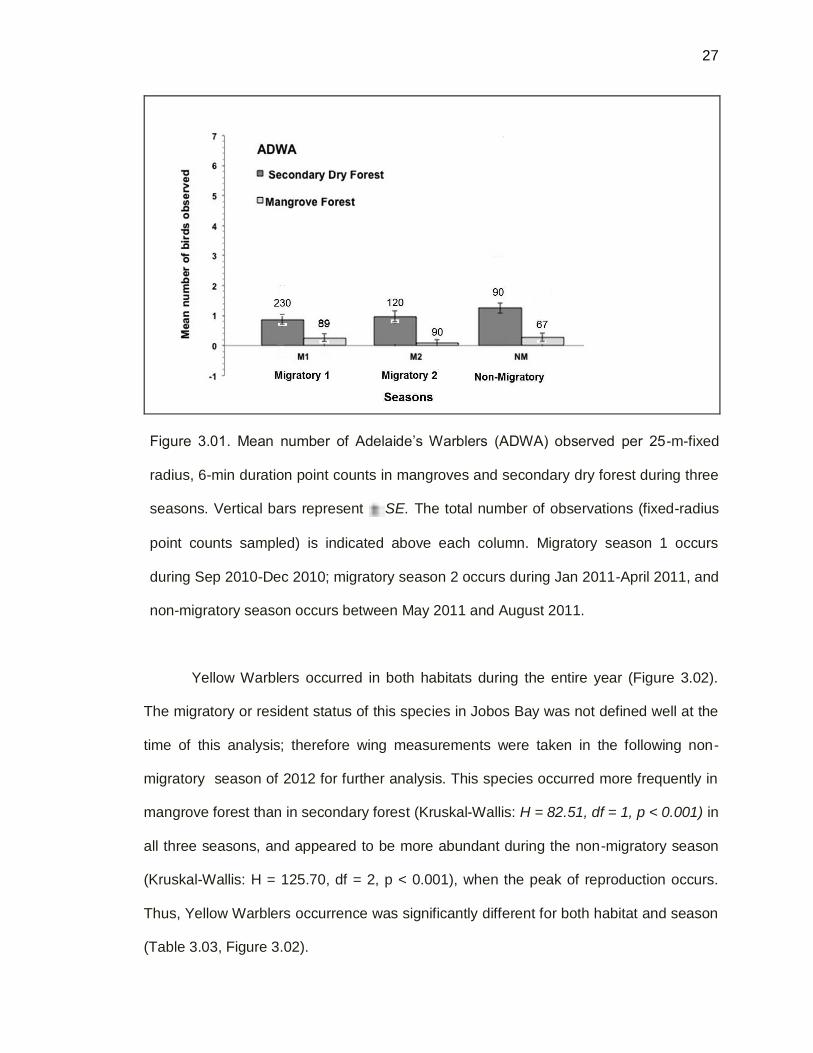
The resident Adelaide’s Wabler occurred in both major habitats during all
seasons over the entire year. Adelaide’s Warbler was less common in mangrove forest
than in secondary dry forest (Figure 3.01) and tended to occur in areas where the
canopy cover seemed greater (pers. Obs.). Adelaide’s Wabler occurrence differed
significantly between habitats (H = 99.43, df =1, p<0.001), probably because it was more
frequently detected in secondary dry forest than mangrove forest during the entire year.
Moreover, Adelaide’s Wabler was seen in all seasons as it is a resident species, but a
significant difference in abundance was obtained among seasons (H=6.82 df=2,
p<0.003). It also was more commonly detected in secondary dry forest in the non-
migratory season (May-Aug 2011), which also is its primary nesting season. The highest
mean for Adelaide’s Wabler was in secondary dry forest, during the non-migratory
season (Table 3.03, Figure 3.01).

26
26
Table 3.03. Means SE’s of counts per point of the five most common warblers
and vireos in Jobos Bay per habitat type (mangrove or secondary dry forest) and
season, including: (NM) non-migratory, (M1) wet migratory and (M2) dry migratory
seasons.
___________________________________________________________________________
Mangrove Forest Secondary Dry Forest
Species NM M1 M2 NM M1 M2
___________________________________________________________________________
ADWA 0.28 0.92, 0.25 0.61, 0.07 0.34, 1.27 1.13, 0.85 1.17, 0.95 1.35
YEWA 3.60 2.42, 0.94 1.41, 1.92 1.81, 1.92 2.18, 0.32 0.86, 0.91 1.47
PRAW 0.00 0.00, 0.10 0.37, 1.42 1.52, 0.00 0.00, 0.17 0.49, 0.10 0.30
NOWA 0.00 0.00, 1.80 2.53, 1.42 1.52, 0.00 0.00, 0.53 1.29, 0.57 1.23
BWVI 0.37 0.83, 0.02 0.21, 0.01 0.11, 0.38 0.65, 0.01 0.09, 0.06 0.24
____________________________________________________________________________
27
27
Figure 3.01. Mean number of Adelaide’s Warblers (ADWA) observed per 25-m-fixed
radius, 6-min duration point counts in mangroves and secondary dry forest during three
seasons. Vertical bars represent SE. The total number of observations (fixed-radius
point counts sampled) is indicated above each column. Migratory season 1 occurs
during Sep 2010-Dec 2010; migratory season 2 occurs during Jan 2011-April 2011, and
non-migratory season occurs between May 2011 and August 2011.
Yellow Warblers occurred in both habitats during the entire year (Figure 3.02).
The migratory or resident status of this species in Jobos Bay was not defined well at the
time of this analysis; therefore wing measurements were taken in the following non-
migratory season of 2012 for further analysis. This species occurred more frequently in
mangrove forest than in secondary forest (Kruskal-Wallis: H = 82.51, df = 1, p < 0.001) in
all three seasons, and appeared to be more abundant during the non-migratory season
(Kruskal-Wallis: H = 125.70, df = 2, p < 0.001), when the peak of reproduction occurs.
Thus, Yellow Warblers occurrence was significantly different for both habitat and season
(Table 3.03, Figure 3.02).

28
28
Figure 3.02. Mean number of Yellow Warblers (YEWA) observed per 25-m-radius, 6-min
point counts in mangroves and secondary dry forest during three seasons. Vertical bars
represent SE. The total number of observations (fixed-radius point counts sampled) is
indicated above each column. Migratory season 1 occurs during Sep 2010-Dec 2010;
migratory season 2 occurs during Jan 2011-April 2011, and non-migratory season
occurs between May 2011 and August 2011.
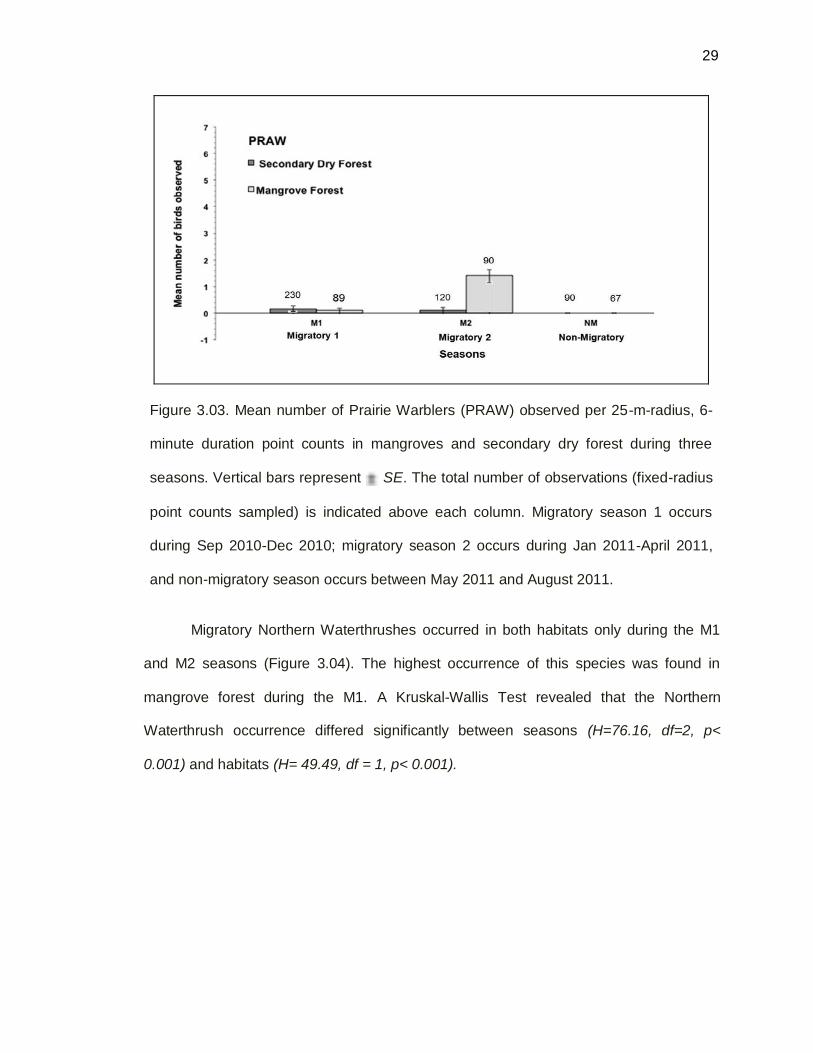
Migratory Prairie Warblers occurred in both habitats during the M1 and M2
seasons, but not in NM season (Table 3.03). The highest occurrence of this species was
found in mangrove habitat during the M2. The lowest occurrence was found during M1 in
mangrove forest and during M2 in secondary dry forest (Figure 3.03). However, a
Kruskal-Wallis test revealed that Prairie Warblers occurrence differed significantly
between seasons (H =18.31, df = 2, p < 0.001) and habitats (H = 5.98, df = 1, p < 0.001).
29
29
Figure 3.03. Mean number of Prairie Warblers (PRAW) observed per 25-m-radius, 6-
minute duration point counts in mangroves and secondary dry forest during three
seasons. Vertical bars represent SE. The total number of observations (fixed-radius
point counts sampled) is indicated above each column. Migratory season 1 occurs
during Sep 2010-Dec 2010; migratory season 2 occurs during Jan 2011-April 2011,
and non-migratory season occurs between May 2011 and August 2011.
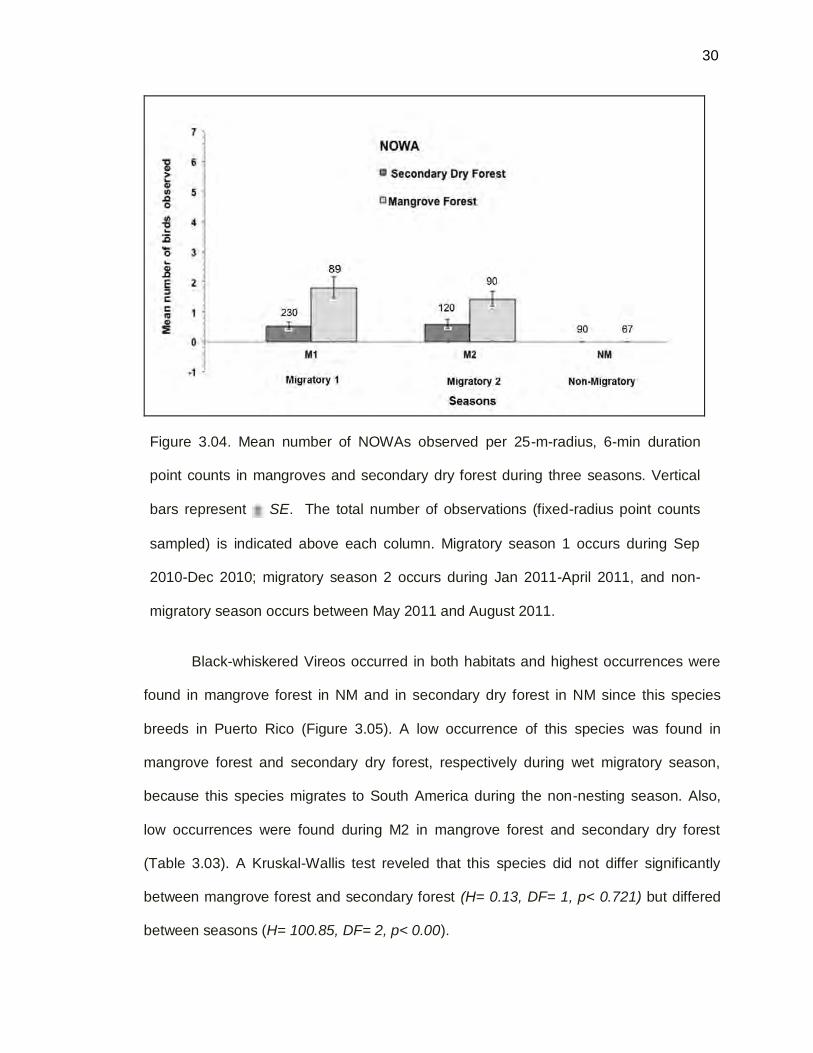
Migratory Northern Waterthrushes occurred in both habitats only during the M1
and M2 seasons (Figure 3.04). The highest occurrence of this species was found in
mangrove forest during the M1. A Kruskal-Wallis Test revealed that the Northern
Waterthrush occurrence differed significantly between seasons (H=76.16, df=2, p<
0.001) and habitats (H= 49.49, df = 1, p< 0.001).
30
30
Figure 3.04. Mean number of NOWAs observed per 25-m-radius, 6-min duration
point counts in mangroves and secondary dry forest during three seasons. Vertical
bars represent SE. The total number of observations (fixed-radius point counts
sampled) is indicated above each column. Migratory season 1 occurs during Sep
2010-Dec 2010; migratory season 2 occurs during Jan 2011-April 2011, and non-
migratory season occurs between May 2011 and August 2011.
Black-whiskered Vireos occurred in both habitats and highest occurrences were
found in mangrove forest in NM and in secondary dry forest in NM since this species
breeds in Puerto Rico (Figure 3.05). A low occurrence of this species was found in
mangrove forest and secondary dry forest, respectively during wet migratory season,
because this species migrates to South America during the non-nesting season. Also,
low occurrences were found during M2 in mangrove forest and secondary dry forest
(Table 3.03). A Kruskal-Wallis test reveled that this species did not differ significantly
between mangrove forest and secondary forest (H= 0.13, DF= 1, p< 0.721) but differed
between seasons (H= 100.85, DF= 2, p< 0.00).

31
31
Figure 3.05. Mean number of Black-whiskered Vireos (BWVI) observed per 25-m-
radius, 6-minute point counts in mangroves and secondary dry forest during three
seasons. Vertical bars represent SE. Number of observations (fixed-radius point
counts sampled) is indicated above each column. Migratory season 1 occurs during
Sep 2010-Dec 2010; migratory season 2 occurs during Jan 2011-April 2011, and
non-migratory season occurs between May 2011 and August 2011.
3.2. Bird Movement between Secondary Dry Forest and Combined (Red, Black
and White) Mangrove Forest.
3.2.1. Observations from a Blind
To assess the hypothesis that mangrove-roosting birds move to secondary dry
forest in search of food at dawn and return to the mangrove forest at dusk, preliminary
observations using a blind along the interface between secondary forest and mangrove
forest were conducted in 5 different observation points (Figure 2.02). Corridor “B” was
the most active site, thus mist netting was conducted in this corridor (Figure 3.06). A
32
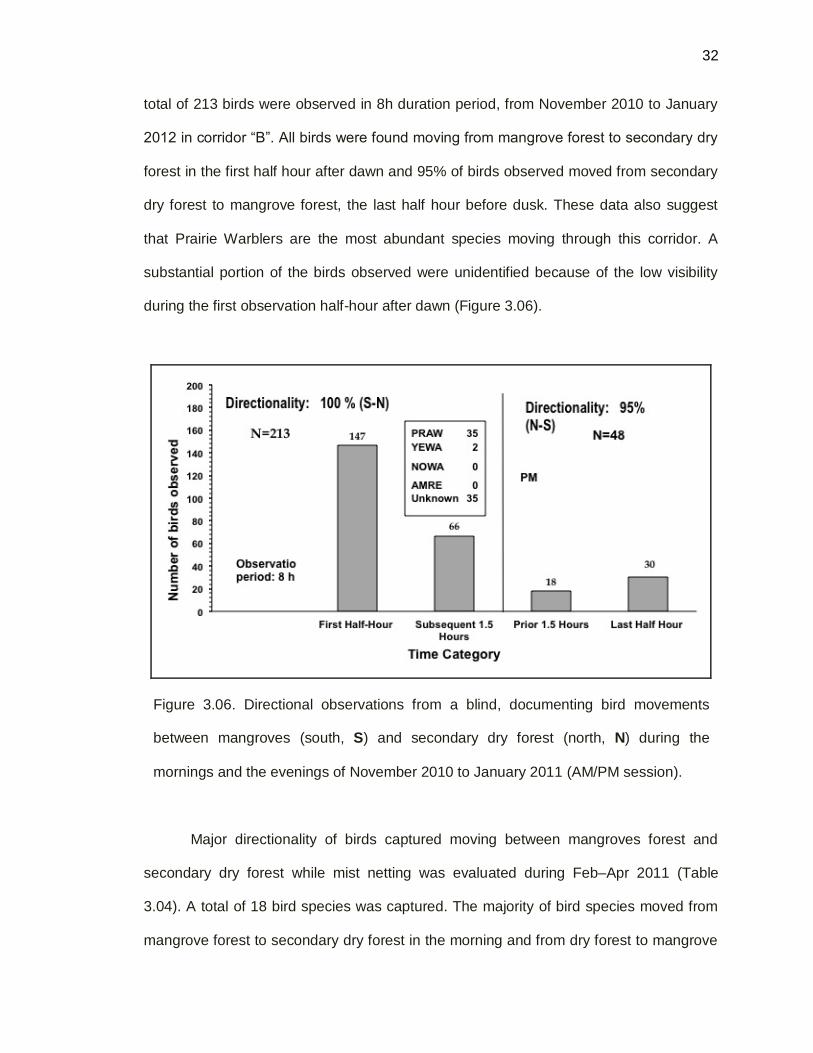
32
total of 213 birds were observed in 8h duration period, from November 2010 to January
2012 in corridor “B”. All birds were found moving from mangrove forest to secondary dry
forest in the first half hour after dawn and 95% of birds observed moved from secondary
dry forest to mangrove forest, the last half hour before dusk. These data also suggest
that Prairie Warblers are the most abundant species moving through this corridor. A
substantial portion of the birds observed were unidentified because of the low visibility
during the first observation half-hour after dawn (Figure 3.06).
Figure 3.06. Directional observations from a blind, documenting bird movements
between mangroves (south, S) and secondary dry forest (north, N) during the
mornings and the evenings of November 2010 to January 2011 (AM/PM session).
Major directionality of birds captured moving between mangroves forest and
secondary dry forest while mist netting was evaluated during Feb–Apr 2011 (Table
3.04). A total of 18 bird species was captured. The majority of bird species moved from
mangrove forest to secondary dry forest in the morning and from dry forest to mangrove

33
33
forest in the afternoon. Both, resident and migratory birds showed this pattern of
movement. Six species including Northern Parula, Western Palm Warbler, American
Redstart, Gray Kingbird, Yellow-faced Grassquit and Northern Mockingbird, moved in
this pattern, showing that 100% of birds captured in the morning moved to dry secondary
forest and to mangrove forest in the afternoon. Also, this same directionality pattern of
movement in the morning was observed Yellow Warbler, Northern Waterthrush and
Prairie Warbler, all of which showed a high incidence of directionality (92%, 92% and
91% for the three species respectively). All species in morning showed over 80%
directionality, from mangrove forest to secondary forest (Table 3.04). A total of six
migrant species showed a 100% of movement from mangrove to dry secondary forest
(Northern Waterthrush, Northern Parula, Western Palm Warbler and American Redstart)
and two resident species (Black-faced Grassquit, Gray Kingbird). Also Prairie Warbler
follow the same pattern with 96% of directionality (Table 3.04).

34
34
Table 3.04. Major directionality of birds captured moving between mangroves
(M) and dry forest (DF) during mist netting conducted Feb –Apr 2011. “Status”
includes resident nesting species (R) and Migratory (M) species.
________________________________________________________ Major Directionality
Morning Afternoon
Status M-DF DF-M % DF-M M-DF %
________________________________________________________
PRAW M 32 3 91 55 2 96
YEWA M/R1 2 1 92 12 3 80
NOPA M 3 0 100 4 0 100
NOWA M 11 1 92 16 0 100
WPWA M 4 0 100 1 0 100
AMRE M 3 0 100 4 0 100
COYE M 0 2 0 0 0 0
OVEN M 2 0 100 0 0 0
ADWA* R 0 0 0 0 0 0
BWVI* M 0 0 0 0 0 0
BWWA* M 0 0 0 0 0 0
NOMO R 2 0 100 3 1 75
BANA R 15 3 83 15 3 83
BFGR R 28 5 85 4 0 100
YFGR R 3 0 100 0 0 0
COGD R 20 1 95 3 3 50
PRFL R 3 0 100 0 0 0
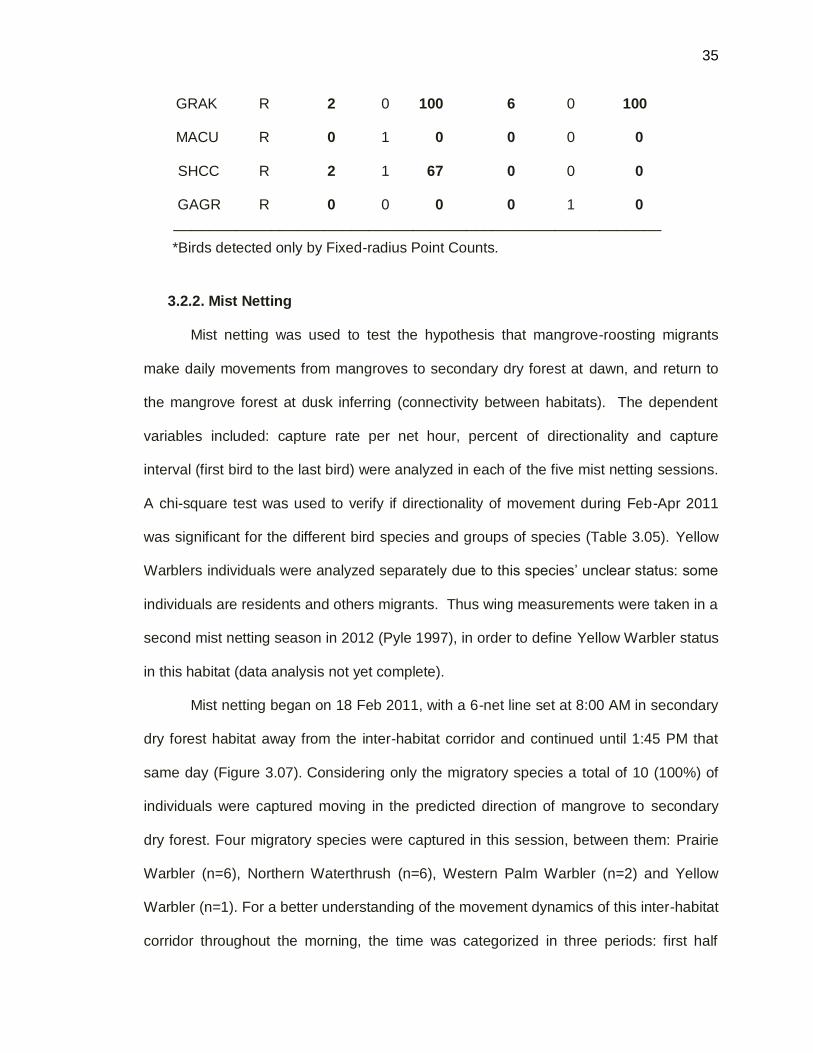
35
35
GRAK R 2 0 100 6 0 100
MACU R 0 1 0 0 0 0
SHCC R 2 1 67 0 0 0
GAGR R 0 0 0 0 1 0
_______________________________________________________
*Birds detected only by Fixed-radius Point Counts.
3.2.2. Mist Netting
Mist netting was used to test the hypothesis that mangrove-roosting migrants
make daily movements from mangroves to secondary dry forest at dawn, and return to
the mangrove forest at dusk inferring (connectivity between habitats). The dependent
variables included: capture rate per net hour, percent of directionality and capture
interval (first bird to the last bird) were analyzed in each of the five mist netting sessions.
A chi-square test was used to verify if directionality of movement during Feb-Apr 2011
was significant for the different bird species and groups of species (Table 3.05). Yellow
Warblers individuals were analyzed separately due to this species’ unclear status: some
individuals are residents and others migrants. Thus wing measurements were taken in a
second mist netting season in 2012 (Pyle 1997), in order to define Yellow Warbler status
in this habitat (data analysis not yet complete).
Mist netting began on 18 Feb 2011, with a 6-net line set at 8:00 AM in secondary
dry forest habitat away from the inter-habitat corridor and continued until 1:45 PM that
same day (Figure 3.07). Considering only the migratory species a total of 10 (100%) of
individuals were captured moving in the predicted direction of mangrove to secondary
dry forest. Four migratory species were captured in this session, between them: Prairie
Warbler (n=6), Northern Waterthrush (n=6), Western Palm Warbler (n=2) and Yellow
Warbler (n=1). For a better understanding of the movement dynamics of this inter-habitat
corridor throughout the morning, the time was categorized in three periods: first half

36
36
hour, subsequent 1.5 hours and complete AM session (4H), after the sunrise. The first
half hour had the highest capture rate (2 birds per net hour) and a capture interval (first
bird to the last bird) of one bird each 5 min. The capture rate obtained in the subsequent
1.5 h after the sunrise was 0.4 birds per net hour and a capture interval (first bird to the
last bird) of one bird each 85.7 minutes, which indicates that bird activity or movement in
this corridor was considerably lower than in the first half hour. The complete session
capture rate was 0.5 birds per net hour and a capture interval (first bird to the last bird) of
one bird each 24 min (Figure 3.07).
Figure 3.07. Capture Rate per net hour. Complete Session. February 18, 2011 (AM).
Mangroves are to the south (S) and secondary dry forest to the north (N).
A second complete day session of mist netting was conducted on 7 Mar 2011,
with 8-net line, starting at 6:30 AM and closing at 6:30 PM (Figure 3.08). The day was
divided in two periods (AM) and (PM). In the morning, 91% of all birds captured (N=20),
moved from secondary dry forest to mangrove forest. Capture rate per net hour and
37
37
capture interval (first to the last bird), were assessed in each time category. In the first
half hour after dawn, a capture rate of one bird per net hour was obtained with a capture
interval (first to the last bird) of one bird each five minutes, indicating high movement
activity in this corridor. Similarly, the subsequent 1.5 hours after sunrise, were extremely
active too with a capture rate of 1.3 birds per net hour and a capture interval (first to the
last bird) of one bird each 3.8 min. These two time periods after dawn illustrate the high
level of movement activity early in the morning, when the most abundant species were
Prairie Warbler (n=10) and Northern Waterthrush (n=5), but also individuals of Yellow
Warbler, Western Palm Warbler and American Redstart were captured and Northern
Parula was not detected. Moreover, it was the most active morning in all the dry seasons
assessed (Feb–Apr 2011).
The activity started to diminish the third and fourth hour after the sunrise and mid-
day hours capture rates were very low as expected. A low capture rate of 0.1 birds per
net hour and a capture interval (first to the last bird) of one bird each 6.1 min, were
obtained (Figure 3.08). Mist nets were closed between 2:00 PM to 4:00 PM, due to a low
level of activity (movement).
In the afternoon session after 4:00 PM, the prior 1.5 hours before dusk, were
assessed and a capture rate of 2 birds per net hour was obtained. Furthermore, a
capture interval (first to the last bird) of one bird each 2.7 min was founded. However, in
contrast to direction movement in the morning, 98% of all afternoon captures (N=41)
moved N-S from secondary dry forest to mangrove. In the last half hour before dusk, an
exceptional intensity of movement was observed with a capture rate of 3.5 birds per net
hour and a capture interval of one bird each 1.2 min. The most abundant species
detected in the afternoon were Prairie Warbler (n=22) and Northern Waterthrush (n=12)
with lower captures of Yellow Warbler, American Redstart, and Northern Parula, but no
Western Palm Warbler captures. This afternoon session was the most active session in

38
38
the entire assessment period (Figure 3.08).
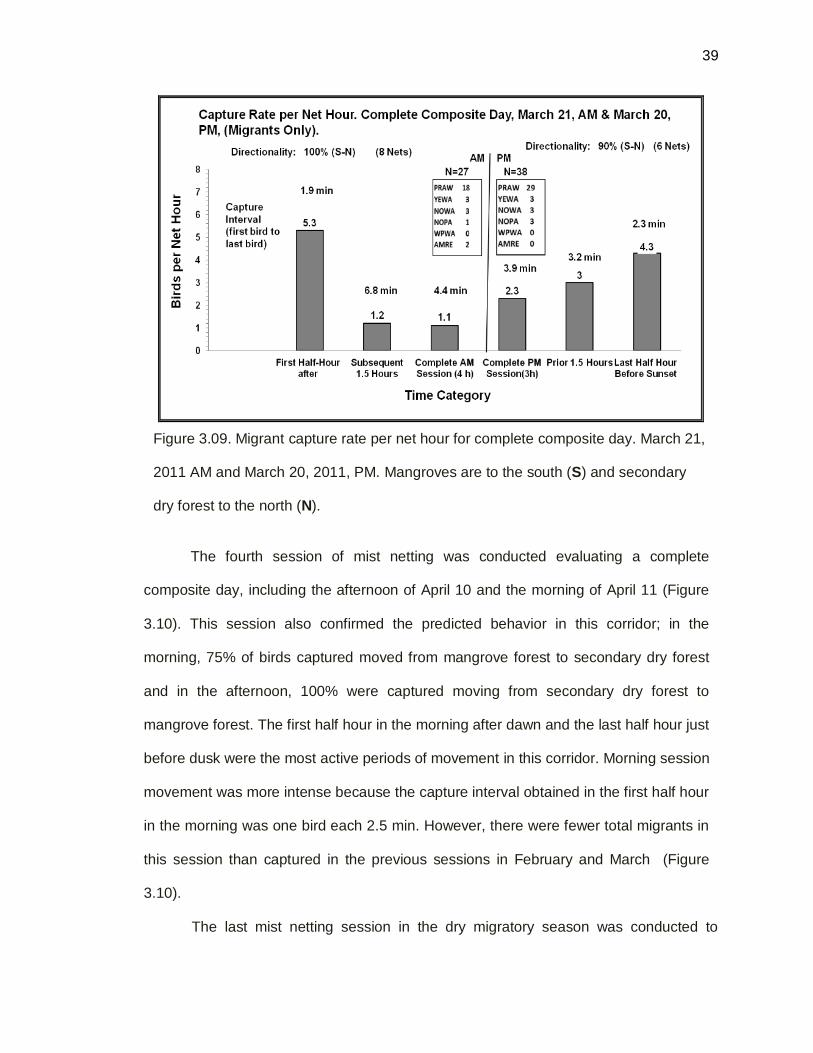
A third session of mist netting was conducted the afternoon of 20 Mar 2011 and
the following morning 21 Mar 2011. After a complete day of mist netting was assessed
on March 7 2011, a new strategy of composite days was conducted taking in
consideration the most active hours of the corridor. The morning of March 21, 100% of
migrant birds moved in the expected direction from mangrove forest to secondary dry
forest (N=27) and 90% (N=38) of birds moved in the opposite direction in the afternoon
of March 20 2011. Prairie Warblers were the most active birds in the corridor and
Western Palm Warblers were not detected. The most active movement period was the
first half hour after dawn with 5.3 birds/ net h and a capture interval of 1.9 min per bird
and also the last half hour before dusk with 4.3 birds/ net h and a capture interval of 2.3
min per bird (Figure 3.09).
Figure 3.08. Migrant capture rate per net hour, complete session during March 7,
2011. Mangroves are to the south (S) and secondary dry forest to the north (N).
39
39
Figure 3.09. Migrant capture rate per net hour for complete composite day. March 21,
2011 AM and March 20, 2011, PM. Mangroves are to the south (S) and secondary
dry forest to the north (N).
The fourth session of mist netting was conducted evaluating a complete
composite day, including the afternoon of April 10 and the morning of April 11 (Figure
3.10). This session also confirmed the predicted behavior in this corridor; in the
morning, 75% of birds captured moved from mangrove forest to secondary dry forest
and in the afternoon, 100% were captured moving from secondary dry forest to
mangrove forest. The first half hour in the morning after dawn and the last half hour just
before dusk were the most active periods of movement in this corridor. Morning session
movement was more intense because the capture interval obtained in the first half hour
in the morning was one bird each 2.5 min. However, there were fewer total migrants in
this session than captured in the previous sessions in February and March (Figure
3.10).
The last mist netting session in the dry migratory season was conducted to

40
40
evaluate a complete composite date, the afternoon of April 26 and the subsequent
morning on April 27 (Figure 3.11). Only five migrant individuals were captured, indicating
that the migratory season was ending. Only individuals of Yellow Warblers and Northern
Parulas were present, but the species previously most abundant in this corridor Prairie
warblers and Northern Waterthrushes were absent, as were American Redstart and
Western Pam Warblers. Despite fewer migrants, unidirectionality in the corridor was
100% in morning from mangrove secondary forest and in afternoon secondary forest to
mangrove forest. Similar to other dates, the highest intensity of bird movement occurred
in the first half hour after dawn and the last half hour before dusk (Figure 3.11).
Figure 3.10. Migrant capture rate per net hour for a complete composite day,
including April 11 2011, AM and April 10 2011, PM. Mangroves are to the south (S)
and secondary dry forest to the north (N).

41
41
Figure 3.11. Capture Rate per net hour for a complete composite day. April 26 2011,
AM and April 27, 2011, PM. Mangroves are to the south (S) and secondary dry forest
to the north (N).
Considering all 291 birds of 18 species whose directionality of movement was
known (i.e., direction they were moving when they entered the net), directionality was
dramatic and statistically significant, with 88.9% of birds captured in the morning moving
from mangroves to secondary dry forest, and 89.9% of birds captured in the afternoon
moving from secondary dry forest back to the mangroves or (X2= 180.13; df=1, p<0.001)
(Table 3.05). Overall, 150 of 291 birds (51.5%) were captured moving from secondary
forest to mangrove forest, while 48.5% were captured moving from mangrove forest to
secondary dry forest, but this is simply a reflection of the fact that slightly more birds
were captured during morning sessions (53.3%), than in the afternoon (47.4%) (Table
3.04).

42
42
Table 3.05. Major directionality of birds captured moving between mangroves (M) and
dry forest (DF) during mist netting conducted Feb–Apr 2011 and Chi-Square results.
Major directionality of birds was evaluated in 4 groups: migratory birds, resident birds,
YEWA and all birds that were captured.
_____________________________________________________________________________
Major Directionality
Morning Afternoon Overall
Specie M-DF DF-M Total, % DF-M M-DF Total, % DF-M, % M-DF, % N
_____________________________________________________________________________
Migratory 53 5 58; 91.4 80 2 82; 97.6 85; 97.6 55; 39.3 140*
Residents 71 11 82; 86.6 32 9 41; 78.0 43; 35.0 80; 65.0 123*
**YEWA 12 1 13; 92.3 12 3 15; 80.0 13; 46.4 15; 53.6 28*
All Species 136 17 153; 88.9 124 14 138; 89.9 141; 48.5 150; 51.5 291*
_____________________________________________________________________________
*A Chi-square, p< 0.001.
** A separated Chi-Square was done for Yellow Warblers individuals, because the population
may include both resident and migratory birds.
A second chi-square analysis was performed to determine if differences in the
movement and directionality of migratory individuals alone in the morning and at night
were statically significant. A total of seven migratory species were considered in this
analysis: Northern Waterthrush, Prairie Warbler, Northern Parula, Western Palm
Warbler, American Redstart, Common Yellowthroat, and Ovenbird (Table 3.04). Of 140
migrant individuals captured during all mist netting sessions, a significant number of
individuals (85 or 60.7%) moved from dry secondary forest to mangrove forest (X2=
112.66; df=1, p<0.001). A total of 53 of 58 migratory individuals (91.4%) were captured
moving in the morning from mangroves to secondary dry forest and 80 of 82 individuals
(97.6%), were captured in the afternoon, moving from secondary dry forest back to the

43
43
mangroves.
Directionality was also analyzed for resident birds in the corridor during all
sessions and 10 resident species were captured (Table 3.04). A total of 123 resident
individuals were captured, of which 35.0% of the individuals moved from secondary dry
forest to mangrove forest in the afternoon, while 65.0% were captured moving from
mangrove forest to secondary dry forest in the morning (X2= 50.22; df=1, p=0.00). A
significant percentage of resident birds (86.6%) moved from mangrove forest to
secondary dry forest in the morning and 78% moved from secondary dry forest to
mangrove forest in the afternoon (Table 3.05).
A separate directionality analysis was conducted for Yellow Warblers given the
potential for the population to contain both residents and migrants. Directionality was
dramatically intense in the morning where 92.3% of the individuals were captured
moving from mangrove to secondary dry forest in the morning and 80.0% of individuals
moved from secondary dry forest to mangrove forest in the afternoon (X2= 14.64; df=1,
p<0.001) (Table 3.05). Overall, 53.6% of individuals were captured moving from
mangrove forest to secondary dry forest and 86.7%, moved from secondary dry forest to
mangrove forest (Table 3.05).
3.3. Sampling of Arthropods in Secondary Dry Forest and Mangrove Forest
3.3.1. Canopy (Branch Clipping)
Biomass and prey item availability were quantified in the dry season using the
branch clipping technique to compare arthropod availability between habitats for birds
that feed at medium to high levels (Adelaide’s Warbler, Yellow Warbler, Prairie Warbler,
Northern Parula and American Redstart). Availability was determined for total individual
arthropods, total arthropod individuals per branch clip, and total arthropod biomass. Data
were transformed and a two sample t-test was used to evaluate the significance of

44
44
differences between arthropods biomass between secondary dry forest and combined
red and black mangrove forest.
The mean number of prey items was significantly higher (t= 2.63 p<0.01) in
mangrove forest than secondary dry forest (Table 3.06). Those high numbers in
mangrove forest were specifically found in samples that came from black mangrove.
Secondary dry forest exhibited fewer prey items per branch clip.
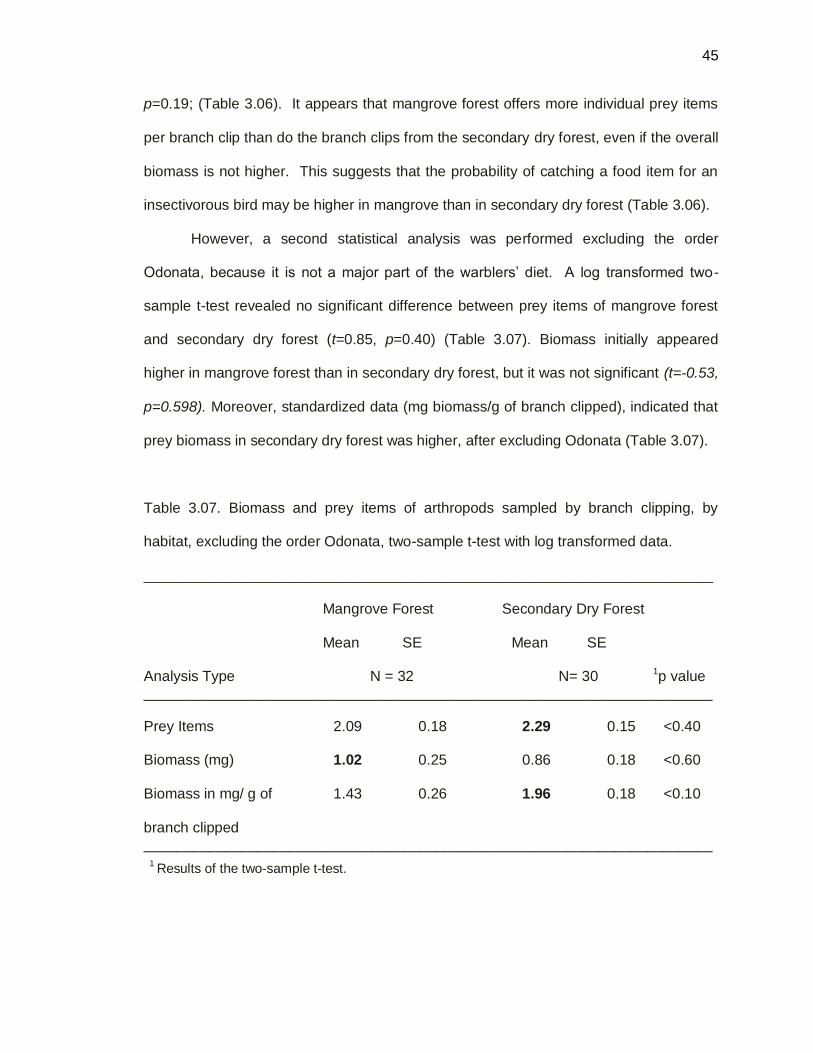
Table 3.06. Biomass and prey items of arthropods sampled by branch clipping, by
habitat type using a two-sample t-test with log-transformed data.
______________________________________________________________________
Mangrove Forest Secondary Dry Forest
Mean SE Mean SE
Analysis Type N = 32 N= 30 1p value
______________________________________________________________________
Prey Items 1.69 0.13 1.16 0.15 <0.01
Biomass (mg) 0.51 0.28 0.95 0.18 <0.01
Biomass in mg/g of 1.61 0.28 2.05 0.18 <0.19
branch clipped ______________________________________________________________________
1 Results of the log transformed two-sample t-test.
Unlike prey item results, prey biomass differences between both habitats were
significantly higher in secondary dry forest than in mangrove forest (t=4.40, p<0.01),
which suggests that canopy foliage in the mangrove forest has more prey items but
probably smaller in biomass than secondary forest (which has fewer prey items but with
a higher biomass). Moreover, standardized data (mg biomass/per g of branch clipped),
indicated no significant difference between mangrove and secondary dry forest (t=1.32,
45
45
p=0.19; (Table 3.06). It appears that mangrove forest offers more individual prey items
per branch clip than do the branch clips from the secondary dry forest, even if the overall
biomass is not higher. This suggests that the probability of catching a food item for an
insectivorous bird may be higher in mangrove than in secondary dry forest (Table 3.06).
However, a second statistical analysis was performed excluding the order
Odonata, because it is not a major part of the warblers’ diet. A log transformed two-
sample t-test revealed no significant difference between prey items of mangrove forest
and secondary dry forest (t=0.85, p=0.40) (Table 3.07). Biomass initially appeared
higher in mangrove forest than in secondary dry forest, but it was not significant (t=-0.53,
p=0.598). Moreover, standardized data (mg biomass/g of branch clipped), indicated that
prey biomass in secondary dry forest was higher, after excluding Odonata (Table 3.07).
Table 3.07. Biomass and prey items of arthropods sampled by branch clipping, by
habitat, excluding the order Odonata, two-sample t-test with log transformed data.
______________________________________________________________________
Mangrove Forest Secondary Dry Forest
Mean SE Mean SE
Analysis Type N = 32 N= 30 1p value ______________________________________________________________________
Prey Items 2.09 0.18 2.29 0.15 <0.40
Biomass (mg) 1.02 0.25 0.86 0.18 <0.60
Biomass in mg/ g of 1.43 0.26 1.96 0.18 <0.10
branch clipped ______________________________________________________________________
1 Results of the two-sample t-test.

46
46
A detail analysis was conducted considering the dates when arthropod samples
were taken. The highest median value of prey items per branch clipped was obtained on
March 30 (median=16, n=6) in mangrove forest, which suggests an outbreak of
arthropods. Median prey items in secondary dry forest samples remained relatively
constant in the same period (Figure 3.12). Moreover, a higher biomass of arthropods
was also obtained on March 30 in mangrove forest (median=13.05, n=6), but also a
notable median biomass (mg) of arthropods was obtained in April 8 (median=6.85,
n=12). Medians of arthropod biomass in secondary forest remained constant between
sampling dates (Figure 3.13).
Figure 3.12. Median prey items collected by branch clipping per sampling date,
compared between secondary dry forest and combined (red, black and white)
mangrove forest, between March 26 and April 11, 2011.
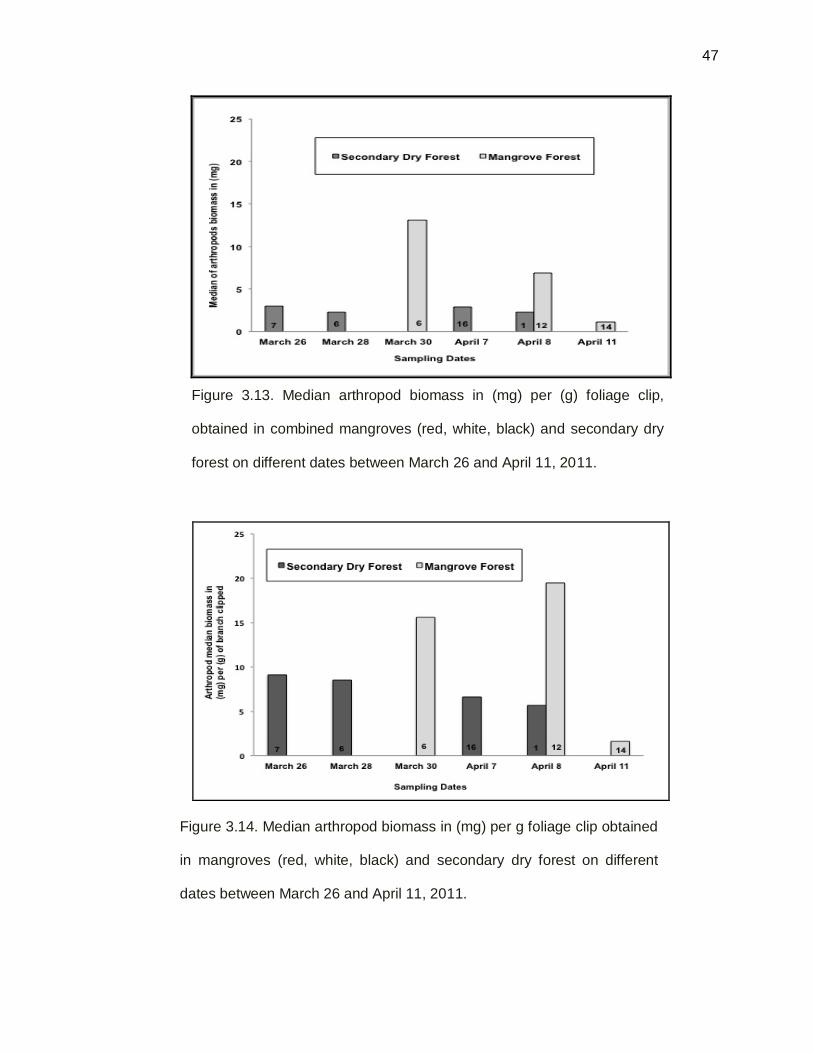
47
47
Figure 3.13. Median arthropod biomass in (mg) per (g) foliage clip,
obtained in combined mangroves (red, white, black) and secondary dry
forest on different dates between March 26 and April 11, 2011.
Figure 3.14. Median arthropod biomass in (mg) per g foliage clip obtained
in mangroves (red, white, black) and secondary dry forest on different
dates between March 26 and April 11, 2011.
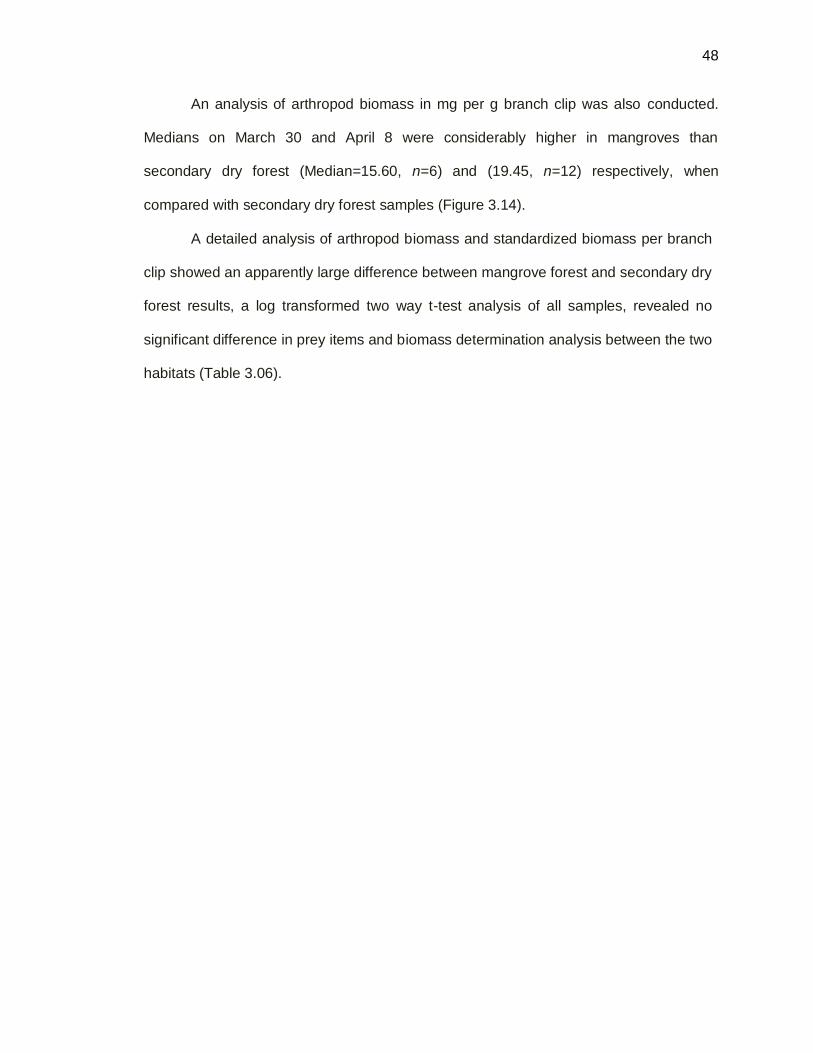
48
48
An analysis of arthropod biomass in mg per g branch clip was also conducted.
Medians on March 30 and April 8 were considerably higher in mangroves than
secondary dry forest (Median=15.60, n=6) and (19.45, n=12) respectively, when
compared with secondary dry forest samples (Figure 3.14).
A detailed analysis of arthropod biomass and standardized biomass per branch
clip showed an apparently large difference between mangrove forest and secondary dry
forest results, a log transformed two way t-test analysis of all samples, revealed no
significant difference in prey items and biomass determination analysis between the two
habitats (Table 3.06).

49
49
Table 3.08. Branch clip (BC) samples of foliage arthropods per sampling date in secondary dry forest and mangrove forest for
samples collected March-April 2011.
_________________________________________________________________________________________________
Secondary Dry Forest Mangrove Forest
Branch Mass Prey Items/
Spl Mass Mass/ Mass/BC Branch Mass Prey items/ Spl Mass Mass/ Mass/BC
(g) 0.25 (m2) quadrat (mg) Prey Items (mg) (mg)/(g) (g) 0.25 (m
2) quadrat (mg) Prey Items (mg) (mg)/(g)
N 30 30 30 30 30 32 32 32 32 32
Mean 31.79 5.03 3.87 1.09 13.04 75.43 7.53 6.27 0.97 12.24
Median 29.15 3.00 2.95 0.95 7.00 75.60 5.00 3.25 0.72 5.65
SD 9.50 8.44 4.48 0.86 21.69 33.49 6.09 7.24 1.35 14.76
SE 1.73 1.54 0.82 0.16 3.96 5.92 1.08 1.28 0.24 2.61
Range 35.78 47.00 25.00 3.49 122.50 27.20 21.00 27.20 6.80 65.40
(19.4-55.21) (1-48) (0.1-25.1) (0.1-3.59) (0.5-123) (0.2-27.4) (2-23) (0.2-27.4) (0.1-6.9) (0.2-65.6)
_________________________________________________________________________________________________________
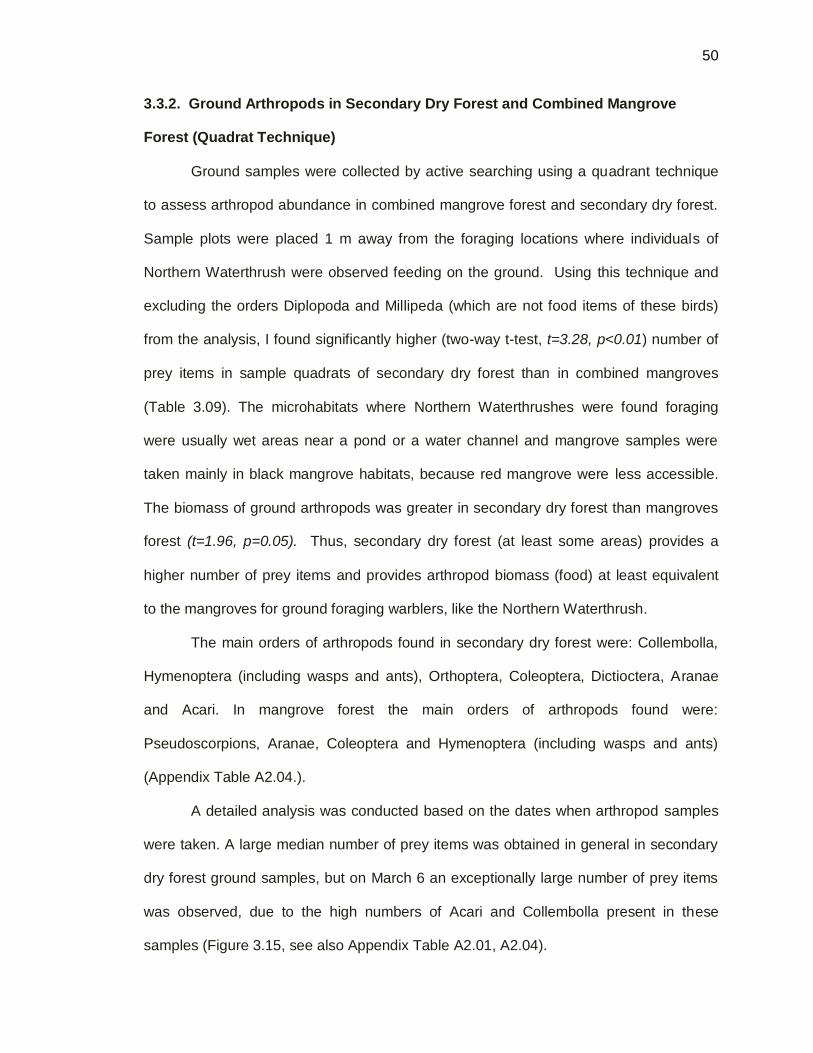
50
50
3.3.2. Ground Arthropods in Secondary Dry Forest and Combined Mangrove
Forest (Quadrat Technique)
Ground samples were collected by active searching using a quadrant technique
to assess arthropod abundance in combined mangrove forest and secondary dry forest.
Sample plots were placed 1 m away from the foraging locations where individuals of
Northern Waterthrush were observed feeding on the ground. Using this technique and
excluding the orders Diplopoda and Millipeda (which are not food items of these birds)
from the analysis, I found significantly higher (two-way t-test, t=3.28, p<0.01) number of
prey items in sample quadrats of secondary dry forest than in combined mangroves
(Table 3.09). The microhabitats where Northern Waterthrushes were found foraging
were usually wet areas near a pond or a water channel and mangrove samples were
taken mainly in black mangrove habitats, because red mangrove were less accessible.
The biomass of ground arthropods was greater in secondary dry forest than mangroves
forest (t=1.96, p=0.05). Thus, secondary dry forest (at least some areas) provides a
higher number of prey items and provides arthropod biomass (food) at least equivalent
to the mangroves for ground foraging warblers, like the Northern Waterthrush.
The main orders of arthropods found in secondary dry forest were: Collembolla,
Hymenoptera (including wasps and ants), Orthoptera, Coleoptera, Dictioctera, Aranae
and Acari. In mangrove forest the main orders of arthropods found were:
Pseudoscorpions, Aranae, Coleoptera and Hymenoptera (including wasps and ants)
(Appendix Table A2.04.).
A detailed analysis was conducted based on the dates when arthropod samples
were taken. A large median number of prey items was obtained in general in secondary
dry forest ground samples, but on March 6 an exceptionally large number of prey items
was observed, due to the high numbers of Acari and Collembolla present in these
samples (Figure 3.15, see also Appendix Table A2.01, A2.04).
51
51
Figure 3.15. Median ground arthropod prey per 5 min scan of 0.25 m2
quadrats in secondary forest and combined mangrove forest (red, black
and white) gathered on separate dates between February 9 and April 21,
2011.
In addition, a detailed analysis of biomass of ground arthropods per quadrat
was conducted to compare secondary dry forest and mangrove forest and indicated
that mangrove forest had a large median biomass value on February 26, due to an
abundance of Diplopoda and Acari (Figure 3.16). Arthropods from the order Millipeda,
Acari, Collembolla, Isopoda and Aranae contributed to this exceptionally large
biomass sample. On April 21, the main orders that contributed to this high biomass
were: Diplopoda, Aranae and Acari. Mangrove Forest ground sample medians were
practically constant between dates and lower than the secondary dry forest medians.
The main orders found in mangrove forest samples in general were: Hymenoptera,

52
52
Aranae and Coleoptera which were found in low numbers (Figure 3.16 and Appendix
Table A2.03), but which may provide adequate food for birds that feed on the ground
(i.e., Northern Waterthrushes and Ovenbirds).
Table 3.09. Biomass and prey items of arthropods collected in 0.25 m quadrats, by
habitat type, a two-sample t-test with log transformed data, excluding Diplopoda and
Millipeda orders.
______________________________________________________________________
Mangrove Forest Secondary Dry Forest
Mean SE Mean SE
Analysis Type N = 30 N= 30 1p value ______________________________________________________________________
Prey Items 0.88 0.08 1.26 0.09 <0.01
Biomass (mg) 0.01 0.10 0.28 0.09 =0.05
______________________________________________________________________ 1 Results of the two-sample t-test.

53
53
Figure 3.16. Median ground arthropod biomass per 5 min scan of 0.25 m2
quadrats in secondary forest and combined mangrove forest (red, black
and white) gathered on separate dates between February 9 and April 21,
2011.

54
54
Table 3.10. Ground arthropod abundance obtained by scanning a 0.25 m2 ground quadrats for 5 min in mangrove forest and
secondary dry forest for various dates from March 26 to April 7, 2011. Abundance was tallied for number of individuals per quadrat
and biomass per quadrat.
____________________________________________________________________________________________________________________
Secondary Dry Forest Mangrove Forest
Individuals/ Sample Mass (mg) Mass (mg) /Individual Individuals/ Sample .Mass (mg) Mass (mg) /Individual
(0.25 m2) quadrat (0.25 m
2) quadrat
N 30 30 30 30 30 30
Mean 24.03 13.15 0.71 8.23 3.88 0.47
Median 13.50 8.90 0.46 7.50 3.70 0.44
SD 20.97 12.24 0.80 4.23 2.38 0.18
SE 3.83 2.23 0.15 0.77 0.43 0.03
Range 88 47.50 4.02 17.00 11.29 0.86
(6-94) (2.10-49.60) (0.12-4.13) (2-19) (0.11-11.40) (0.02-0.88)
____________________________________________________________________________________________________________________

55
55
Chapter Four
Discussion and Conclusions
4.1. Habitat Use by Neotropical Migratory Birds
This study discovered that (1) six species of migratory warblers occurred in
multiple habitats in the coastal area around Jobos Bay, and that (2) these species were
not sedentary within each habitat, i.e., that some or all of the individuals of these
populations had a night-roosting habitat (mangroves) that was distinct and
geographically separated from their foraging habitat. These findings are significant in
terms of (1) accurately interpreting the results of census data, (2) understanding the
fundamental evolutionary and behavioral ecology (life history characteristics) of these
species, and (3) habitat conservation for these species in the coastal zone. Census data
in this study, as with most studies, were collected mostly in the morning concurrent with
the inter-habitat movements of the birds. This means that mid-day populations in the
destination habitats are probably greater than those revealed by morning censuses and
that mid-day populations in the night-roost (originating) habitats are less than those
revealed by morning censuses.
To refine the results of morning census results future studies should consider
including mid-day census surveys, mid-day or all-day mist netting within core areas of
each habitat type, and mapping daytime foraging territories or home ranges of color-
marked or radio-telemetered individuals. Over-wintering life history characteristic may
differ dramatically between species as well. In some species, like Northern Parulas and
Prairie Warblers, the entire population may be making daily movements (diurnal
migrations) between habitats (see Latta and Faaborg 2001 and below) in which others,
like the Northern Waterthrush, dominance hierarchies may be formed (possibly based on
data of arrival, body size, or latitude of origin), wherein dominant, or “despotic” high-
55
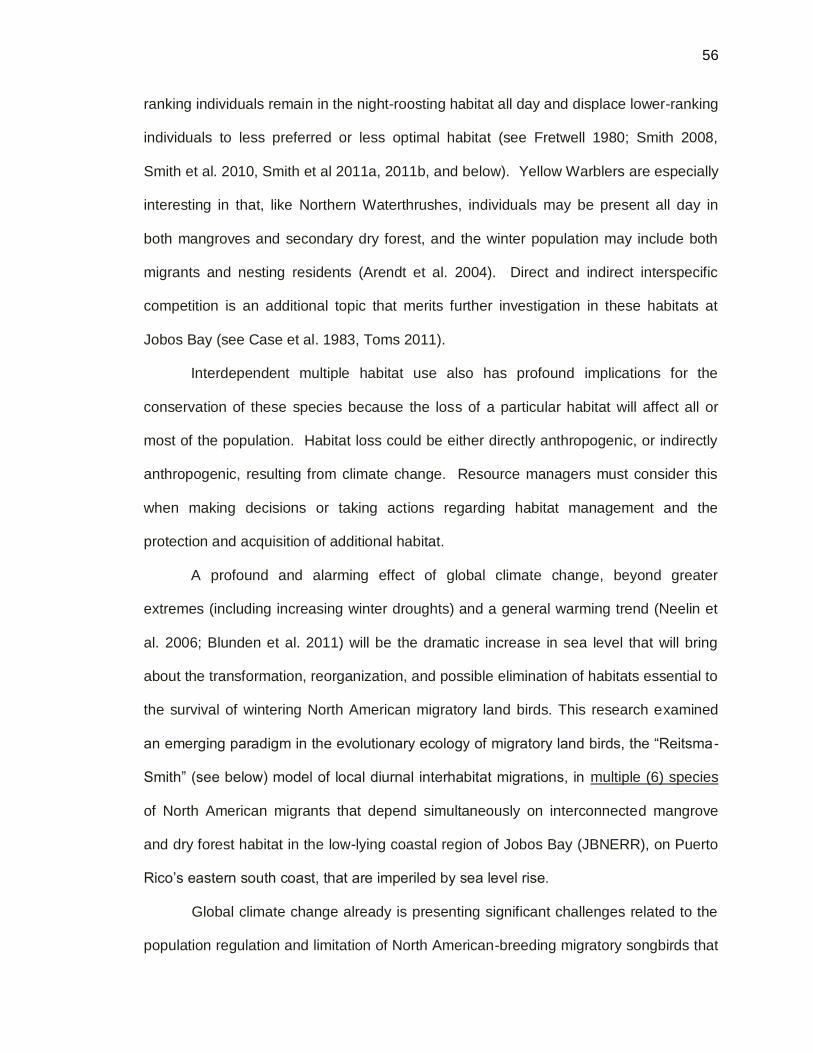
56
56
ranking individuals remain in the night-roosting habitat all day and displace lower-ranking
individuals to less preferred or less optimal habitat (see Fretwell 1980; Smith 2008,
Smith et al. 2010, Smith et al 2011a, 2011b, and below). Yellow Warblers are especially
interesting in that, like Northern Waterthrushes, individuals may be present all day in
both mangroves and secondary dry forest, and the winter population may include both
migrants and nesting residents (Arendt et al. 2004). Direct and indirect interspecific
competition is an additional topic that merits further investigation in these habitats at
Jobos Bay (see Case et al. 1983, Toms 2011).
Interdependent multiple habitat use also has profound implications for the
conservation of these species because the loss of a particular habitat will affect all or
most of the population. Habitat loss could be either directly anthropogenic, or indirectly
anthropogenic, resulting from climate change. Resource managers must consider this
when making decisions or taking actions regarding habitat management and the
protection and acquisition of additional habitat.
A profound and alarming effect of global climate change, beyond greater
extremes (including increasing winter droughts) and a general warming trend (Neelin et
al. 2006; Blunden et al. 2011) will be the dramatic increase in sea level that will bring
about the transformation, reorganization, and possible elimination of habitats essential to
the survival of wintering North American migratory land birds. This research examined
an emerging paradigm in the evolutionary ecology of migratory land birds, the “Reitsma-
Smith” (see below) model of local diurnal interhabitat migrations, in multiple (6) species
of North American migrants that depend simultaneously on interconnected mangrove
and dry forest habitat in the low-lying coastal region of Jobos Bay (JBNERR), on Puerto
Rico’s eastern south coast, that are imperiled by sea level rise.
Global climate change already is presenting significant challenges related to the
population regulation and limitation of North American-breeding migratory songbirds that

57
57
winter in the Caribbean (Studds and Marra 2007; Faaborg et al. 2010a,b; Smith et al.
2010). Sea level rise will dramatically transform coastal morphology, bringing marine and
estuarine habitats such as mangroves inland, and shrinking or forcing further inland (if
space is available) existing coastal dry forest habitat (IPCC 2002; Kerr 2009; Blunden et
al. 2011). This transformation is particularly alarming for the low-lying coastal and
estuarine areas in and around the JBNERR on Puerto Rico’s eastern south coast.
Space and habitat use strategies are means of maximizing survival probability of
migratory populations in winter (Sherry and Holmes 1995,1996). Migratory bird
populations can be limited in size by factors such as reproductive success and parental
survival rates during the breeding season, and by individual survival during the
nonbreeding season (see also Marra et al. 1993), as well as during the long distance
migration between these two sites (see Paxton et al. 2007, 2008; Faaborg et al.
2010a,b).
Marra and co-workers (Marra et al. 1993, 1998; Marra 2000; Marra and Holmes
2001; Reudinck et al. 2009), presented a model of sexual habitat segregation in the
American Redstarts based on the behavioral dominance of older males. Though not
addressed directly in these studies, there is an inherent presumption that birds night-
roosted in their foraging habitat, especially in some core area of a foraging territory, as in
the case of solitary roosting Ovenvirds (Brown and Sherry 2008). This model of
defended foraging territories and the documentation or presumption of night roosting
within these territories has become a powerful paradigm influencing the understanding of
wintering ecology and has enjoyed significant corroboration. Latta and Faaborg (2001)
found that Prairie Warblers in the Dominican Republic were territorial foragers, with few
floaters, in both high altitude pine forest and lowland scrub and desert, but they believed
that only the lowland birds night-roosted off of their foraging territories, in mangroves.
Latta and Faaborg (2002) also studied territorial Cape May Warblers (Setophaga tigrina)

58
58
in the Dominican Republic and linked both population responses and the individual
condition of nonbreeding birds to prevailing ecological conditions across divergent
habitats, but did not directly address night roosts. Townsend et al. (2010) found in
Bicknell’s Thrushes (Catharus bicknelli) that exclusive territoriality was the predominant
winter social system, that most birds night roosted on their foraging territories, and there
were few non-territorial floaters. Thus, this paradigm suggests that where foraging is
mostly territorial, most birds night-roost on their territories in their foraging habitat.
In a series of studies of Northern Waterthrushes begun in southwestern Puerto
Rico by Reitsma et al. (2002) and continued in greater detail at the former Roosevelt
Roads Naval Station in eastern Puerto Rico, Reitsma and coworkers (Reitsma et al.
2004; Burson et al. 2005; Hunt et al. 2005; Smith 2008; Smith et al. 2008, 2010, 2011,
(the “Reitsma-Smith” model)), found that 87% of birds during three January-April (dry
season) field seasons made diurnal migrations between disjunct red mangrove night-
roosts and daytime foraging sites in black and white mangroves, and especially
secondary dry forest and scrub up to 2 km distant. Red mangrove was the optimal and
preferred foraging habitat and high ranking territorial or “despotic” individuals (mostly
males, Fretwell 1980) forced lower ranking individuals to other habitats for foraging,
including both floaters and territorial (core area) foragers that may change locations as
the dry season (February-March) progressed. However, each habitat type was required
for the maintenance and success of the wintering population. Night-roosting occurred
mostly in red mangrove, individually, in loose groups of 3-5, or individually within the
core areas of despots.
Latta and Faaborg (2001) believed lowland-foraging, mangrove-roosting Prairie
Warblers night-roosted communally. Staicer (1992) found off-foraging-site communal
roosting in Northern Parulas) and Cape May Warblers and in non-territorial Prairie
Warblers that foraged in overgrown pastures in southwestern Puerto Rico (Staicer 1992;

59
59
Baltz 2000, Toms 2011). Advantages of off-site and communal roosting may include
predator avoidance and information exchange (Townsend et al. 2009; Smith et al. 2008).
Recently Jirinec et al. (2011) documented diurnal migrations by Black-throated Blue
Warblers (Setophaga caerulescens) moving between shade coffee foraging sites and
night-roost sites in adjacent forest patches, demonstrating how landscape composition
may affect the delivery of an ecosystem service (insect control). Thus, the findings of
Reitsma and Smith, of diurnal interhabitat migrations is likely to become another
important and influential paradigm guiding the understanding of processes of population
regulation in wintering migrant songbirds.
4.2. Habitat Quality and Optimal Foraging
Previous results by Smith (2008) and Smith et al. (2008, 2010, 2011) showed a
gradient from red mangrove to black mangrove to secondary dry forest in in terms of
both habitat preference by Northern Waterthrush and foraging habitat quality, and that
these gradients also were consistent with moisture gradients across the three habitat
types. In this study, logistics limited access to red mangrove and required that red
mangrove and black mangrove be combined to a single “mangrove” category that was
predominantly black mangrove. Despite this truncation of extremes, branch clipping
results of this study suggest the mangrove canopy may provide slightly larger individual
prey items (0.83 g) than secondary dry forest canopy (0.79 g) and thus, an optimal
foraging model Smith (2008) and Smith et al. (2008, 2010, 2011a, 2011b) suggesting
that the mangrove canopy would be preferable foraging habitat for larger-bodied
warblers like the Northern Waterthrush, but less preferable to smaller species like Prairie
Warblers and Northern Parulas which may have difficulty handling larger prey items.
This is consistent with the previous findings of Smith (2008) and Smith et al. (2008,
2010) for Northern Waterthrush, as well as the observations of Latta and Faaborg (2001)
who found that Prairie Warblers established foraging territories in coastal secondary dry
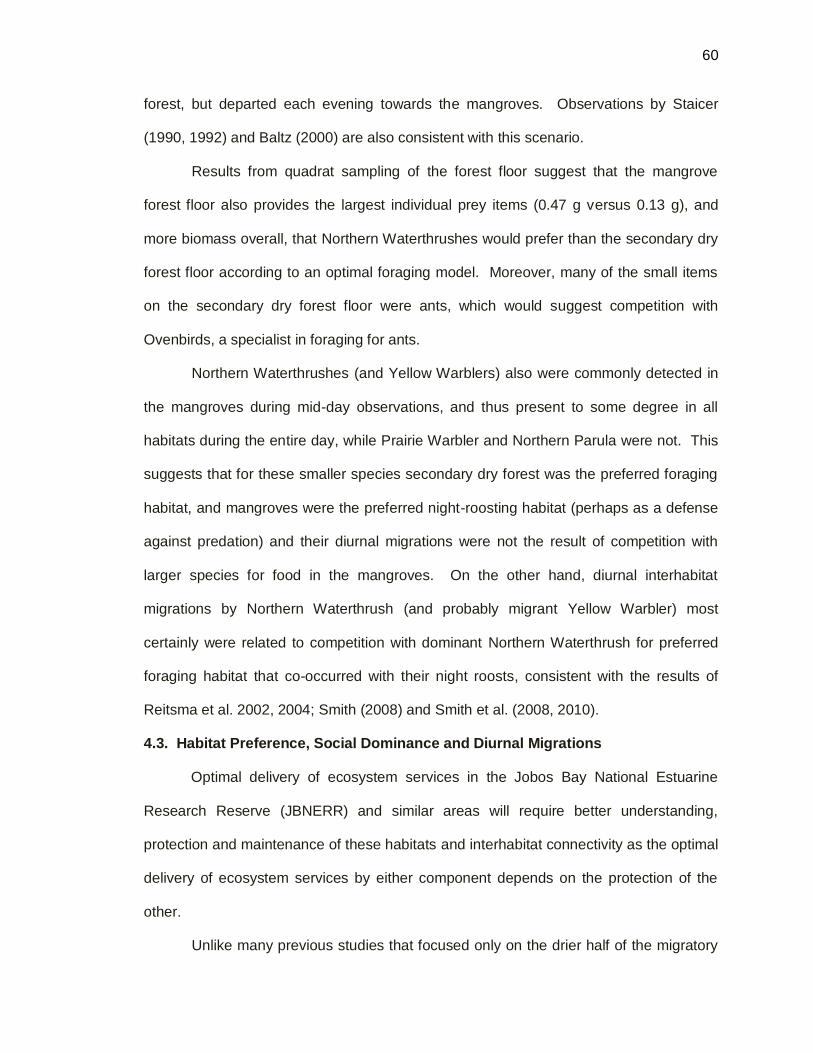
60
60
forest, but departed each evening towards the mangroves. Observations by Staicer
(1990, 1992) and Baltz (2000) are also consistent with this scenario.
Results from quadrat sampling of the forest floor suggest that the mangrove
forest floor also provides the largest individual prey items (0.47 g versus 0.13 g), and
more biomass overall, that Northern Waterthrushes would prefer than the secondary dry
forest floor according to an optimal foraging model. Moreover, many of the small items
on the secondary dry forest floor were ants, which would suggest competition with
Ovenbirds, a specialist in foraging for ants.
Northern Waterthrushes (and Yellow Warblers) also were commonly detected in
the mangroves during mid-day observations, and thus present to some degree in all
habitats during the entire day, while Prairie Warbler and Northern Parula were not. This
suggests that for these smaller species secondary dry forest was the preferred foraging
habitat, and mangroves were the preferred night-roosting habitat (perhaps as a defense
against predation) and their diurnal migrations were not the result of competition with
larger species for food in the mangroves. On the other hand, diurnal interhabitat
migrations by Northern Waterthrush (and probably migrant Yellow Warbler) most
certainly were related to competition with dominant Northern Waterthrush for preferred
foraging habitat that co-occurred with their night roosts, consistent with the results of
Reitsma et al. 2002, 2004; Smith (2008) and Smith et al. (2008, 2010).
4.3. Habitat Preference, Social Dominance and Diurnal Migrations
Optimal delivery of ecosystem services in the Jobos Bay National Estuarine
Research Reserve (JBNERR) and similar areas will require better understanding,
protection and maintenance of these habitats and interhabitat connectivity as the optimal
delivery of ecosystem services by either component depends on the protection of the
other.
Unlike many previous studies that focused only on the drier half of the migratory
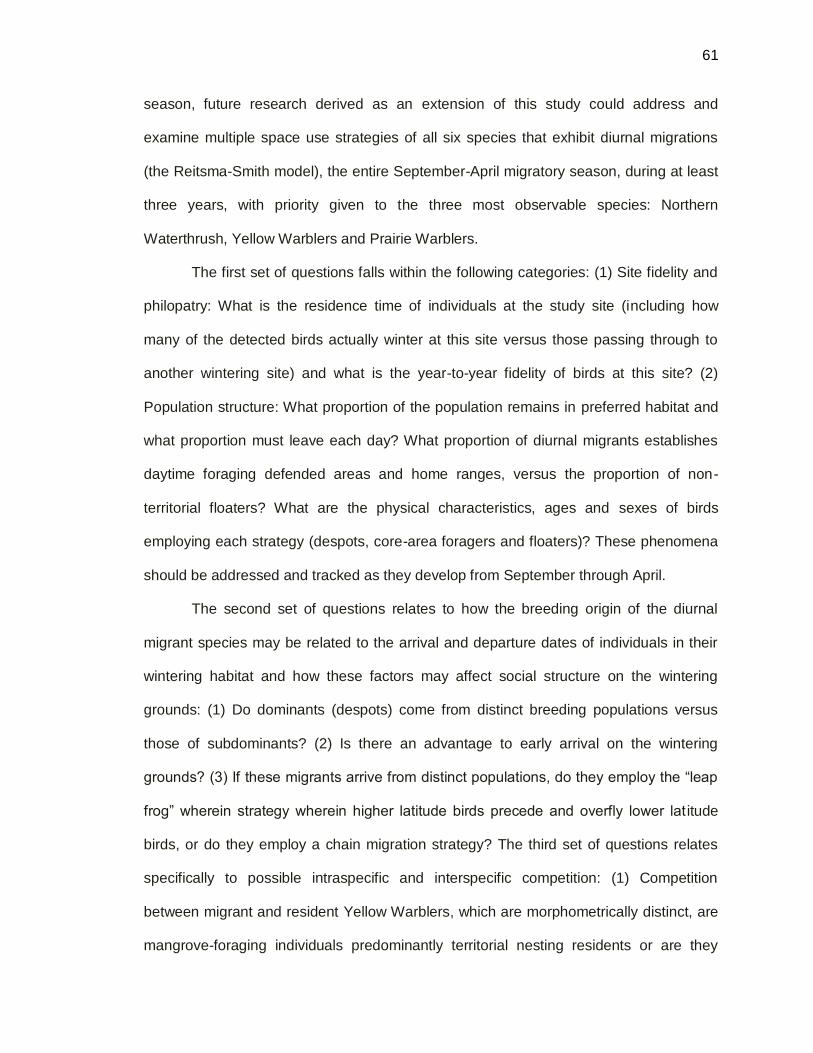
61
61
season, future research derived as an extension of this study could address and
examine multiple space use strategies of all six species that exhibit diurnal migrations
(the Reitsma-Smith model), the entire September-April migratory season, during at least
three years, with priority given to the three most observable species: Northern
Waterthrush, Yellow Warblers and Prairie Warblers.
The first set of questions falls within the following categories: (1) Site fidelity and
philopatry: What is the residence time of individuals at the study site (including how
many of the detected birds actually winter at this site versus those passing through to
another wintering site) and what is the year-to-year fidelity of birds at this site? (2)
Population structure: What proportion of the population remains in preferred habitat and
what proportion must leave each day? What proportion of diurnal migrants establishes
daytime foraging defended areas and home ranges, versus the proportion of non-
territorial floaters? What are the physical characteristics, ages and sexes of birds
employing each strategy (despots, core-area foragers and floaters)? These phenomena
should be addressed and tracked as they develop from September through April.
The second set of questions relates to how the breeding origin of the diurnal
migrant species may be related to the arrival and departure dates of individuals in their
wintering habitat and how these factors may affect social structure on the wintering
grounds: (1) Do dominants (despots) come from distinct breeding populations versus
those of subdominants? (2) Is there an advantage to early arrival on the wintering
grounds? (3) If these migrants arrive from distinct populations, do they employ the “leap
frog” wherein strategy wherein higher latitude birds precede and overfly lower lat itude
birds, or do they employ a chain migration strategy? The third set of questions relates
specifically to possible intraspecific and interspecific competition: (1) Competition
between migrant and resident Yellow Warblers, which are morphometrically distinct, are
mangrove-foraging individuals predominantly territorial nesting residents or are they

62
62
predominantly migrants? Are Prairie Warblers communal night-roosters and are they
pushed out of the mangroves each morning by larger, more aggressive species (e.g.,
Northern Waterthrushes and Yellow Warblers)? Future studies should be conducted at
JBNEER and elsewhere to address these questions.
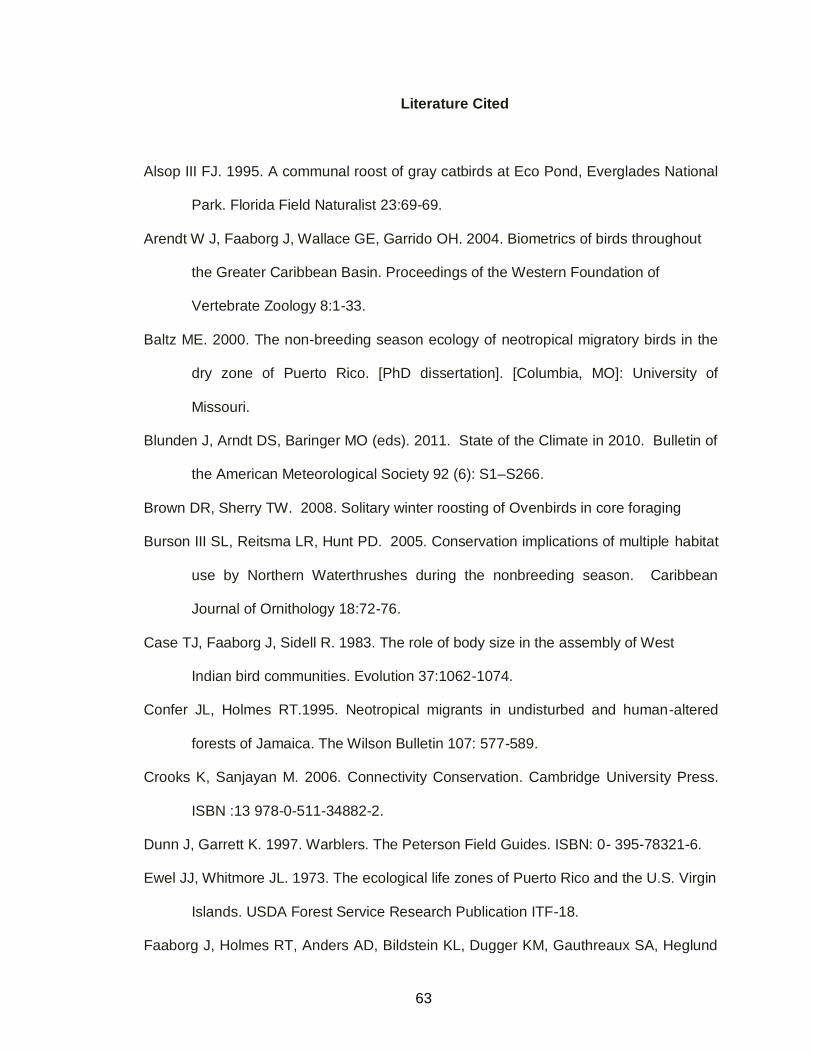
63
63
Literature Cited
Alsop III FJ. 1995. A communal roost of gray catbirds at Eco Pond, Everglades National
Park. Florida Field Naturalist 23:69-69.
Arendt W J, Faaborg J, Wallace GE, Garrido OH. 2004. Biometrics of birds throughout
the Greater Caribbean Basin. Proceedings of the Western Foundation of
Vertebrate Zoology 8:1-33.
Baltz ME. 2000. The non-breeding season ecology of neotropical migratory birds in the
dry zone of Puerto Rico. [PhD dissertation]. [Columbia, MO]: University of
Missouri.
Blunden J, Arndt DS, Baringer MO (eds). 2011. State of the Climate in 2010. Bulletin of
the American Meteorological Society 92 (6): S1–S266.
Brown DR, Sherry TW. 2008. Solitary winter roosting of Ovenbirds in core foraging
Burson III SL, Reitsma LR, Hunt PD. 2005. Conservation implications of multiple habitat
use by Northern Waterthrushes during the nonbreeding season. Caribbean
Journal of Ornithology 18:72-76.
Case TJ, Faaborg J, Sidell R. 1983. The role of body size in the assembly of West
Indian bird communities. Evolution 37:1062-1074.
Confer JL, Holmes RT.1995. Neotropical migrants in undisturbed and human-altered
forests of Jamaica. The Wilson Bulletin 107: 577-589.
Crooks K, Sanjayan M. 2006. Connectivity Conservation. Cambridge University Press.
ISBN :13 978-0-511-34882-2.
Dunn J, Garrett K. 1997. Warblers. The Peterson Field Guides. ISBN: 0- 395-78321-6.
Ewel JJ, Whitmore JL. 1973. The ecological life zones of Puerto Rico and the U.S. Virgin
Islands. USDA Forest Service Research Publication ITF-18.
Faaborg J, Holmes RT, Anders AD, Bildstein KL, Dugger KM, Gauthreaux SA, Heglund
63

64
64
P, Hobson K a, Jahn AE, Johnson DH, et al. 2010. Conserving migratory land
birds in the new world: do we know enough? Ecological applications: a
publication of the Ecological Society of America 20:398-418.
Faaborg J, Holmes RT, Anders AD, Bildstein KL, Dugger KM, Gauthreaux SA, Heglund
P, Hobson KA, Jahn AE, Johnson DH, Latta SC, Levey DJ, Marra MP, Merkord
CL, Nol E, Rothstien SI, Sherry TW, Sillett TS, Thompson II FR, Nils W. 2010a.
Recent advances in understanding migration systems in New World land birds.
Ecological Monographs: 80(1):3-48.
Fretwell S. 1980. Evolution of migration in relation to factors regulating bird numbers. In:
Keast, A. and Morton, E S (eds). Migratory birds in the neotropics: ecology,
behavior, and conservation. Smithsonian Institution Press, Washington D.C., pp.
517-527.
Gill FB. 2007. Ornithology. 3rd ed. W. H, Freeman and Company. New York, NY.
González CM. 2001. Management Plan for the Jobos Bay National Estuarine Research
Reserve. Guayama/Salinas, Puerto Rico.
Greenberg R, Marra PP. 2005. Birds of two worlds. Smithsonian Institution. ISBN: 0-
8018-8107-2.
Holmes RT, Sherry TW, Reitsma L. 1989. Population structure, territoriality and
overwinter survival of two migrant warbler species in Jamaica. Condor 91: 545-
561.
Hunt PD, Reitsma L, Burson III SL. 2005. Spatial and Temporal Distribution of Northern
Waterthrushes among Nonbreeding Habitats in Southwestern Puerto Rico.
Biotropica 37(4): 697–701.
[IPCC] Intergovernmental Panel on Climate Change. 2002. Climate Change and
Biodiversity. IPCC Technical Report V. Intergovernmental Panel on Climate
Change, OMM/WMO/PNUE/UNEP.

65
65
Jirinec V, Campos BR, Johnson, MD. 2011. Roosting behaviour of a migratory songbird
on Jamaican coffee farms: landscape composition may affect delivery of an
ecosystem service. Bird Conservation International 21(3):353-361.
Johnson MD, Sherry TW. 2001. Effects of food availability on the distribution of
migratory warblers among habitats in Jamaica. Journal of Animal Ecology
70:546–560.
Johnson MD. 2000a. Evaluation of an arthropod sampling technique for measuring food
availability for forest insectivorous birds. Journal of Field Ornithology 71:88–109.
Johnson MD. 2000b. Effects of shade tree species and crop structure on the arthropod
and bird communities in a Jamaican coffee plantation. Biotropica 32:133–145.
Kerr RA. 2009. What Happened to Global Warming? Scientists Say Just Wait a Bit.
Science 326:28-29.
Ktitorov P, Bairlein F, Dubinin M. 2008. The importance of landscape context for
songbirds on migration: body mass gain is related to habitat cover. Landscape
Ecology 23:169–179.
Laboy EN, Capella J, Robles PO, González CM. 2006. Jobos Bay Estuarine Profile, A
national estuarine research reserve.
Laboy EN. 2009. Environmental Management issues in an estuarine ecosystem: A case
study from Jobos Bay, Puerto Rico. In: Laboy-Nieves EN, Schaffner FC,
Abdelhadi A, Goosen MFA, editors. 2009. Environmental Management,
Sustainable Development and Human Health. AK Leiden, NL: CRC
Press/Balkema. p 361-398.
Latta SC, Faaborg J. 2001. Winter site fidelity of Prairie Warblers in the Dominican
Republic. Condor 103:455-468.
Latta SC, Faaborg J. 2002. Demographic and population responses of Cape May
Warblers wintering in multiple habitats. Ecology 83:2502-2515.
66
66
Lefebvre G, Poulin B, McNeil R. 1992. Abundance, feeding-behavior, and body condition
of Nearctic warblers wintering in Venezuelan mangroves. Wilson Bulletin
104:400-412.
Lefebvre G, Poulin B, McNeil R. 1994. Temporal dynamics of mangrove bird
communities in Venezuela with special reference to migrant warblers. Auk
111:405-415.
Lefebvre G, Poulin B. 1996. Seasonal abundance of migrant birds and food resources in
Panamanian mangrove forests. Wilson Bulletin 108:748-759.
Marra PP, Hobson KA, Holmes RT 1998. Linking winter and summer events in a
migratory bird by using stable carbon isotopes. Science 282:1884-1886.
Marra PP, Holmes RT 2001. Consequences of dominance-mediated habitat segregation
in American Redstarts during the nonbreeding season. Auk 118:92-104.
Marra PP, Sherry TW, Holms RT. 1993. Territorial exclusion by a long-distance migrant
warbler in Jamaica: a removal experiment with American Redstarts (Setophaga
ruticilla). Auk 110:565-572.
Marra PP. 2000. The role of behavioral dominance in structuring patterns of habitat in
structuring patterns of habitat occupancy in a migrant bird during the
nonbreeding season. Behavioral Ecology 11:299-308.
Morris GL. 2000. Hydrologic Hydraulic and Biological Analysis of Jobos Estuarine
Mangrove Mortality Jobos, Puerto Rico: Puerto Rico Land Authority.
Murphy PG, AE Lugo.1986. Ecology of tropical dry forest. Annual Review of Ecology and
Systematics 17:67-88.
Neelin JD, Münnich M, Su H, Meyerson JE, Holloway CE. 2006. Tropical drying trends
in global warming models and observations. Proceedings of the National
Academy of Sciences. 103(16):6110-6115.
Noss R, Csuti B, Groom MJ. 2006. Habitat fragmentation. Pp 212-251 (Ch 7), in
67
67
Groom MJ, Meffe GK, Carroll CR eds., Principles of Conservation Biology, 3rd ed.
Sinauer Associates, Inc.. Publishers. Sunderland MA.
Norris DR, Marra PP, Bowen GJ, Ratcliff LM, Royle JA, Kyser TK. 2006. Migratory
Connectivity of a widely distributed songbird, the American Redstart (Setophaaga
ruticilla). Ornithological Monographs 61:14-28.
Oberle MW. 2010. Puerto Rico’s Birds in photographs. A complete guide and CD-ROM
including the Virgen Islands. 3rd ed. Editorial Humanitas, Seattle, Washington.
ISBN-13: 978-0965010450.
Paxton KL, Ripper III CV, O’Brien C. 2008. Movement patterns and stopover ecology of
Wilson’s Warblers during spring migration on the lower Colorado River in
southwestern Arizona. The Condor 110(4):672–681.
Paxton KL, Ripper III CV, Theimer TC, Paxton EH. 2007. Spatial and temporal migration
patterns of Wilsons Warbler (Wilsonia pusilla) in the Southwest as revealed by
stable isotopes. The Auk 124(1):162-175.
Post W. 1978. Social and foraging behavior of warblers wintering in Puerto Rican coastal
scrub. Wilson Bulletin 90:197-214.
Post W. 1982. Why do Grey Kingbirds roost communally? Bird Behav 4: 46-49.
Powell GVN, Bjork R. 1995. Implications of intratropical migration on reserve design: A
case study using Pharomachrus mocinno. Conserv Biol 9: 354-362.
Pyle P. 1997. Identification Guide to North American Birds, Part 1: Columbidae to
Ploceidae. Slate Creek Press, Bolinas, California.
Raffaele HA. 1989. A guide to the birds of Puerto Rico and the Virgin Island. Princeton
University Press. ISBN: 0-691-02424-3.
Reitsma LR, Hunt PD, Burson III SL, Steele BB. 2002. Site fidelity and ephemeral
habitat occupancy: Northern Waterthrush use of Puerto Rican Black Mangroves
during the nonbreeding season. Wilson Bulletin 114: 99-105.

68
68
Reitsma LR, Marra P, Smith J. 2004. Fourth and Final Year Report (2004): The
Importance of Mangroves to Neotropical Migratory Birds at Naval Station
Roosevelt Roads, Puerto Rico. Cooperative Agreement # DACA87-00-H-0007
with the Army Corps of Engineers.
Sherry TW, Holmes RT 1996. Winter habitat quality, population limitation, and
conservation of neotropical nearctic migrant birds. Ecology 77:36-48.
Sherry TW, Holmes RT. 1995. Summer versus winter limitation of populations: What are
the issues and what is the evidence? Pages 85–120 in T. E. Martin and D. M.
Finch, editors. Ecology and management of Neotropical migratory.
Sherry TW, Johnson MD, and Strong AM. 2005. Does winter food limit populations of migratory
birds? Pages 414-425. in . Birds of two worlds (R. Greenberg, and Peter P Marra, Eds.).
John Hopkins University Press, Baltimore, Maryland.
Smith JAM. 2008. The Non-Breeding Ecology of a Neotropical Migratory Songbird: The
influence of Habitat Quality on Spatial and Social Behavior and Consequences
for Individual Performance. [PhD dissertation]. [Fairfax, VA]: George Mason
University.
Smith, JAM, Reitsma LR, Rockwood LL, Marra PP. 2008. Roosting behavior of a
Neotropical migrant songbird, the Northern Waterthrush Seiurus noveboracensis,
during the nonbreeding season. Journal of Avian Biology 39:460–465.
Smith JAM, Reitsma LR, Marra PP. 2010. Moisture as a determinant of habitat quality
for a nonbreeding Neotropical migratory songbird. Ecology 91(10): 2874–2882.
Smith JAM, Reitsma LR, Marra PP. 2011a. Influence of Moisture and Food Supply on
the Movement Dynamics of a Nonbreeding Migratory Bird (Parkesia
noveboracensis) in a Seasonal Landscape. The Auk 128:43-52.
Smith JAM, Reitsma LR, Marra PP. 2011b. Multiple space-use strategies and their
divergent consequences in a nonbreeding migratory bird (Parkesia

69
69
noveboracensis). The Auk 128:53-60.
Staicer CA. 1991. The Role of Male Song in the Socioecology of the Tropical Resident
Adelaide's Warbler (Dendroica adelaidae). PhD Dissertation, University of
Massachusetts.
Stacier CA. 1992. Social behavior of the Northern Parula, Cape May Warbler, and
Prairie Warbler wintering in second-growth forest in southwestern Puerto Rico.
In: Hagan JM. and Johnston DW (eds). Ecology and conservation of neotropical
migrant landbirds. Smithsonian Institution Press, Washington DC, pp. 309-320.
Strong AM, Sherry TW. 2000. Habitat-specific effects of food abundant on the condition
of Ovenbirds wintering in Jamaica. Journal of Animal Ecology 69: 883-895.
Studds C, Marra PP. 2007. Linking fluctuations in rainfall to nonbreeding season
performance in a long-distance migratory bird, Setophaga ruticilla. Climate
Research 35:115-122.
Stutchbury BJ. 1994. Competition for winter territories in a neotropical migrant-the role of
age, sex and color. Auk 111: 63-69.
Toms JD. 2011. Non-breeding competition between migrant American Redstarts
(Setophaga ruticilla) and resident Adelaide’s Warblers (Dendroica adelidae) in
the Guanica Biosphere Reserve, southwest Puerto Rico [PhD dissertation].
[Columbia, MO]: University of Missouri.
Townsend JM, Rimmer CC, Brocca J, McFarland KP, Townsend AK. 2009. Predation
of a wintering migratory songbird by introduced rats: can nocturnal roosting
behavior serve as predator avoidance? Condor 111(3):565-569.
Townsend JM, Rimmer CC, McFarland KP. 2010. Winter territoriality and special
behavior of Bicknell’s Thrush (Catharus bicknelli) at two ecologically distinct sites
in the Dominican Republic. Auk 127(3):514-522.
Wunderle JM Jr. 1994. Census Methods for Caribbean Land Birds. United States
70
70
Department of Agriculture. Forest Service, Southern Forest. Experiment Station
New Orleans, Louisiana. General Technical Report SO-98.
Wunderle Jr JM, Curie D, Helmer E, Ewert DN, White JD, Ruzycki TS, Parresol B, Kwit
C. 2010. Kirtland’s Warblers in anthropogenically disturbed early-successional
habitats on Eleuthera, The Bahamas. Condor 112(1):123-137.

71
71
Appendices
Appendix One
Canopy Arthropod Sampling
Table A1.01. Median arthropod prey items collected via branch clipping in
mangrove forest and secondary dry forest between March 26 and April
11, 2011.
___________________________________________________________
Mangrove Forest Secondary Dry Forest
Dates Median Range N Median Range N
___________________________________________________________
March 26 3.00 9.00 7 - - -
March 28 3.50 7.00 6 - - -
March 30 - - - 16.00 21.00 6
April 7 3.00 47.00 16 - - -
April 8 5.00 0 1 4.50 17.00 12
April 11 - - - 4.50 11.00 14
___________________________________________________________
71
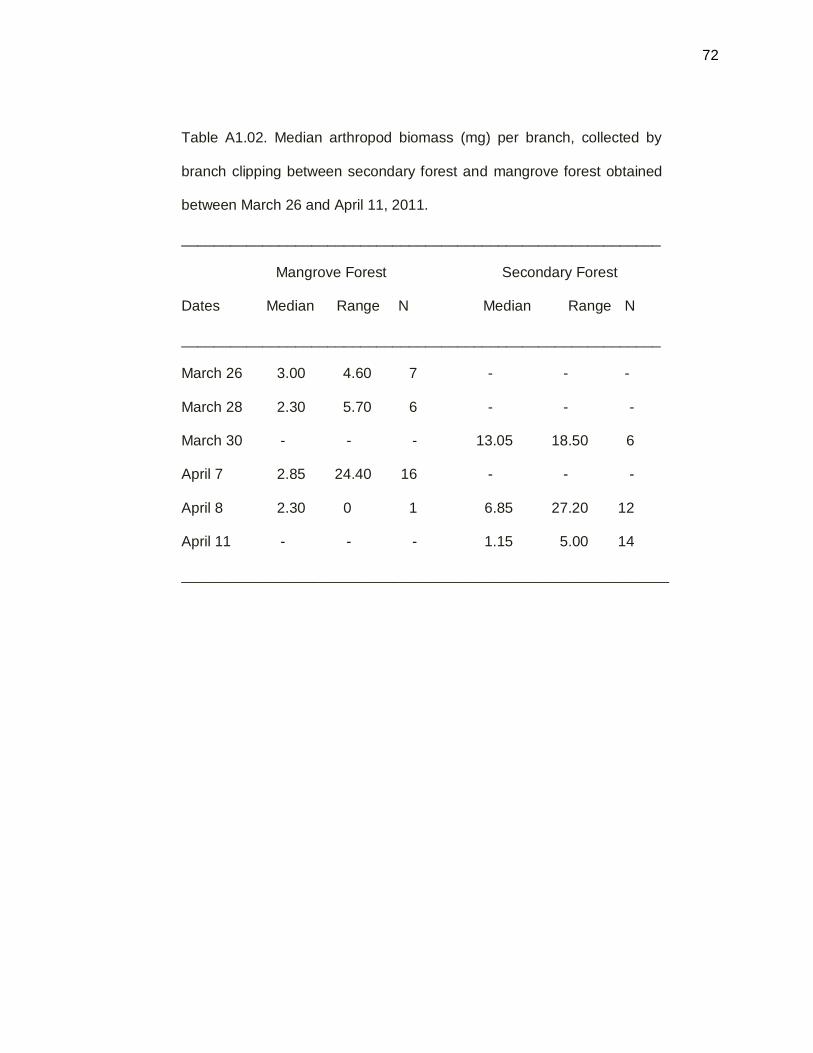
72
72
Table A1.02. Median arthropod biomass (mg) per branch, collected by
branch clipping between secondary forest and mangrove forest obtained
between March 26 and April 11, 2011.
___________________________________________________________
Mangrove Forest Secondary Forest
Dates Median Range N Median Range N
___________________________________________________________
March 26 3.00 4.60 7 - - -
March 28 2.30 5.70 6 - - -
March 30 - - - 13.05 18.50 6
April 7 2.85 24.40 16 - - -
April 8 2.30 0 1 6.85 27.20 12
April 11 - - - 1.15 5.00 14
____________________________________________________________

73
73
Table A1.03. Median arthropod biomass in mg / g of branch clipped by
branch clipping technique between secondary forest and mangrove forest,
between March 26 and April 11, 2011.
___________________________________________________________
Mangrove Forest Secondary Forest
Dates Median Range N Median Range N
___________________________________________________________
March 26 9.10 13.50 7 - - -
March 28 8.50 17.10 6 - - -
March 30 - - - 15.60 37.60 6
April 7 6.65 121.00 16 - - -
April 8 5.70 0 1 19.45 65.20 12
April 11 - - - 1.60 4.80 14
___________________________________________________________

74
74
Table. A1.04. Branch clipping arthropod samples taken in secondary dry forest, in the dry season, between March 26, 2011
and April 11, 2011. Arthropods samples were quantified and classified to order and also biomass (mg) was determined.
______________________________________________________________________________________________________________
Sample Tree* Date Order Number of Total number of Biomass in Total mass mg of arthropods
Number Prey Items Prey Items (mg) (mg) per g of foliage
______________________________________________________________________________________________________________
1 L.leucocephala March 26 Orthoptera 1 1.1
Collembolla 1 2 1.9 3.0 10.4
2 L.leucocephala Homoptera 8 0.3
Blattaria 1 0.7
Orthoptera 2 11 0.6 1.6 4.2
3 L.leucocephala Odonata 2 3.4
Diptera 1 3 0.7 4.1 17.0
4 P. dulce Homoptera 1 2.2
Diptera 1 1.6
Thysanoptera 1 3 1.7 5.5 17.1
5 P. dulce Aranae 3 1.5
Homoptera 1 4 1.1 2.6 6.3

75
75
6 L.leucocephala Hymenoptera 2 2 0.9 0.9 3.6
7 L.leucocephala Aranae 3 3 3.1 3.1 9.1
8 P. dulce March 28 Aranae 1 1.2
Isoptera 5 2.2
Orthoptera 1 2.9
Odonata 1 8 0.6 6.9 22
9 L.leucocephala Coleoptera 1 0.7
Hymenoptera 1 2 0.5 1.2 4.9
10 L.leucocephala Hemiptera 1 1.1
Odonata 1 0.2
Homoptera 2 0.3
Larvae 1 5 0.4 2 7
11 G. herbaceum Hymenoptera 1 1 2.3 2.3 10
12 G. herbaceum Homoptera 2 1.1
Diptera 1 3 0.6 1.7 7
13 L.leucocephala Odonata 1 2.1
Coleoptera 2 1.7

76
76
Aranae 1 4 0.5 4.3 14.8
14 P. dulce April, 7 Hemiptera 6 23.9
Aranae 1 7 1.2 25.1 123.1
15 L.leucocephala Aranae 2 2 2.9 2.9 9.9
16 L.leucocephala Aranae 1 0.8
Isoptera 2 2.3
Coleoptera 1 4 1.1 4.2 14.9
17 L.leucocephala Homoptera 1 2.3
Coleoptera 1 0.9
Larvae 2 2.1
Acari 1 5 0.7 6 22.4
18 L. leucocephala Coleoptera 1 1 0.1 0.1 0.5
19 L. leucocephala Coleoptero 1 0.1
Hymenoptera 1 2 0.4 0.5 2.6
20 P. dulce Coleoptera 5 2.2
Aranae 1 1.3
Collembolla 1 7 0.1 3.6 6.7

77
77
21 L. leucocephala Mantodea 1 2.1
Aranae 2 1.7
Homoptera 1 4 0.8 4.6 14.3
22 G. herbaceum Isoptera 1 1.7
Homoptera 45 4
Aranae 2 48 2.2 7.9 23.1
23 L.leucocephala Hymenoptera 1 1 1.2 1.2 2.9
24 L leucocephala Homoptera 1 1 0.7 0.7 2.1
25 L leucocephala Mantodea 1 5.6
Aranae 1 2 1.5 7.1 28.9
26 L.leucocephala Aranae 1 1 1.8 1.8 6.6
27 L leucocephala Hymenopera 1 0.6
Aranae 2 3 1.9 2.5 8.2
28 L.leucocephala Coleoptera 1 0.9
Aranae 1 1.3
Homoptera 1 3 1.1 3.3 6.3
29 L. leucocephala Thysanoptera 1 0.4

78
78
Hymenoptera 1 0.5
Aranae 2 4 2.3 3.2 5.8
30 L. leucocephala Aranae 3 2.2
Coleoptera 2 5 0.1 2.3 5.7
___________________________________________________________________________________________________
* Trees - complete scientific names: Leucaena leucocephala, Pithcellobium dulce, Gossypium herbaceum.
Table A1.05. Branch clipping arthropod samples taken in mangrove forest, in the dry season, between March 4, 2011 and
April 11, 2011. Arthropods samples were quantified and classified to order and also biomass (mg) was determined.
______________________________________________________________________________________________________________
Sample Tree* Date Order Number of Total number of Biomass in Total mass mg of arthropods
Number Prey Items Prey Items (mg) (mg) per g of foliage
______________________________________________________________________________________________________________
1 A. germinans March 4 Homoptera 16 12.5
Aranae 1 4.5
Orthoptera 3 20 1.1 18.1 22.70
2 A. germinans Homoptera 17 20.4
Hymenoptera 6 23 0.2 20.6 43.49

79
79
3 A. germinans Aranae 1 1.9
Diptera 1 2 1.9 3.8 6.79
4 A. germinans Homoptera 11 11 2.1 2.1 5.90
5 A. germinans Homoptera 18 14.5
Aranae 2 20 1.2 15.7 13.29
6 A. germinans Homoptera 11 10.2
Hymenoptera 1 12 0.2 10.4 17.89
7 A. germinans April 8 Homoptera 5 5 19.8 19.8 33.32
8 L racemosa Diptera 1 7.7
Aranae 1 2 1.1 8.8 13.75
9 A. germinans Aranae 2 2 1.1 1.1 2.71
10 R. mangle Hymenoptera 1 1.9
Coleoptera 2 2
Neuroptera 1 4 0.6 4.5 9.37
11 A. germinans Aranae 1 1.3
Homoptera 7 8.4
Odonata 1 9 5.7 15.4 24.70

80
80
12 A. germinans Coleoptera 1 3.1
Hymenoptera 2 3 0.1 3.2 21.15
13 A. germinans Homoptera 7 6.2
Odonata 1 8 3.1 9.3 14.51
14 A. germinans Homoptera 14 4.9
Larvae 1 0.7
Aranae 2 0.4
Coleoptera 1 1.7
Hymenoptera 1 19 0.4 8.1 17.69
15 A. germinans Hymenoptera 1 12.9
Aranae 1 1.7
Orthoptera 2 4 12.8 27.4 26.32
16 A. germinans Hemiptera 1 1.7
Coleoptera 1 0.1
Aranae 3 5 0.2 2 2.19
17 A. germinans Homoptera 4 3.1
Aranae 3 2.5
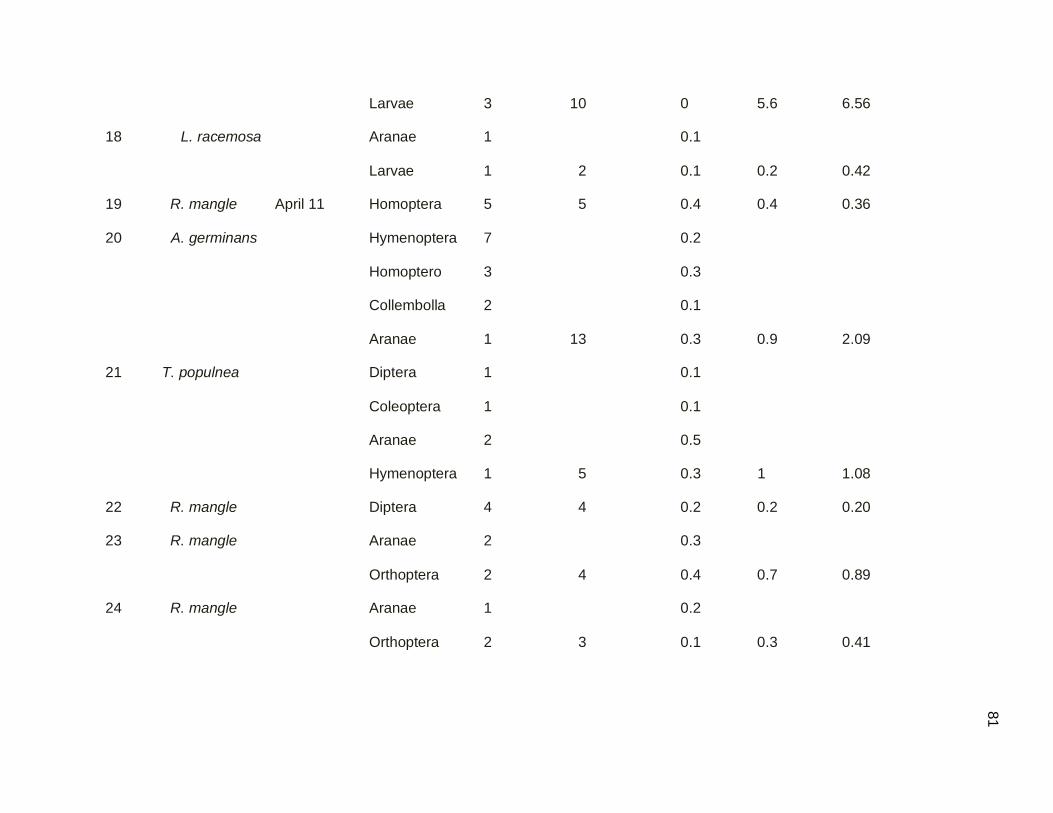
81
81
Larvae 3 10 0 5.6 6.56
18 L. racemosa Aranae 1 0.1
Larvae 1 2 0.1 0.2 0.42
19 R. mangle April 11 Homoptera 5 5 0.4 0.4 0.36
20 A. germinans Hymenoptera 7 0.2
Homoptero 3 0.3
Collembolla 2 0.1
Aranae 1 13 0.3 0.9 2.09
21 T. populnea Diptera 1 0.1
Coleoptera 1 0.1
Aranae 2 0.5
Hymenoptera 1 5 0.3 1 1.08
22 R. mangle Diptera 4 4 0.2 0.2 0.20
23 R. mangle Aranae 2 0.3
Orthoptera 2 4 0.4 0.7 0.89
24 R. mangle Aranae 1 0.2
Orthoptera 2 3 0.1 0.3 0.41
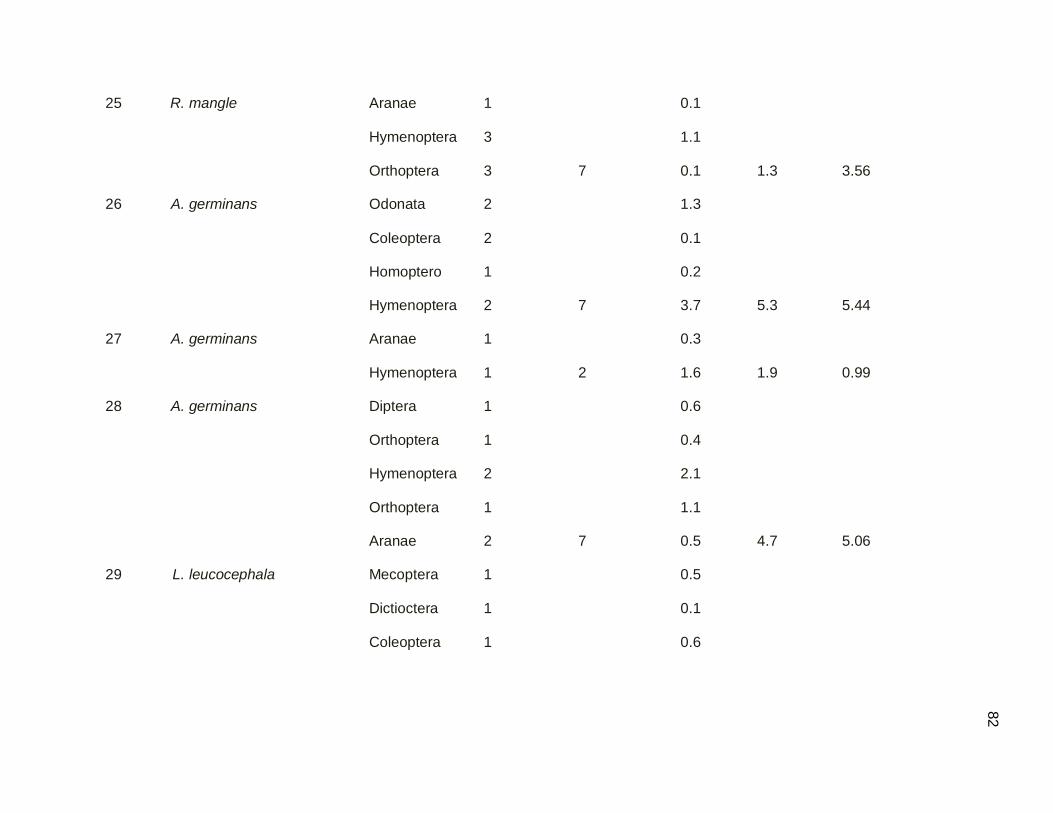
82
82
25 R. mangle Aranae 1 0.1
Hymenoptera 3 1.1
Orthoptera 3 7 0.1 1.3 3.56
26 A. germinans Odonata 2 1.3
Coleoptera 2 0.1
Homoptero 1 0.2
Hymenoptera 2 7 3.7 5.3 5.44
27 A. germinans Aranae 1 0.3
Hymenoptera 1 2 1.6 1.9 0.99
28 A. germinans Diptera 1 0.6
Orthoptera 1 0.4
Hymenoptera 2 2.1
Orthoptera 1 1.1
Aranae 2 7 0.5 4.7 5.06
29 L. leucocephala Mecoptera 1 0.5
Dictioctera 1 0.1
Coleoptera 1 0.6

83
83
Orthoptera 1 0
Larvae 1 5 1.3 2.5 2.56
30 R. mangle Aranae 1 0.1
Orthoptera 1 2 1.6 1.7 2.09
31 R. mangle Plecoptera 1 2.9
Orthoptera 1 0.1
Homoptero 1 3 0.3 3.3 4.89
32 T populnea Orthoptera 1 0.1
Homoptero 1 0.1
Hemiptera 1 3 0.1 0.3 0.57
________________________________________________________________________________________________________
* Trees complete scientific names: Avicennia germinans, Laguncularia racemosa, Rhizophora mangle, Thespesia populnea,
Leucaena leucocephala.

84
84

85
85
Appendix Two
Ground Arthropods Sampling
Table A2.01. Median arthropod prey items per 5 min scan of 0.25 m2
quadrat, obtained in mangrove forest and secondary dry forest, between
March 26 and April 11, 2011.
___________________________________________________________
Mangrove Forest Secondary Dry Forest
Dates Median Range N Median Range N
___________________________________________________________
February 9 15 11 9 - - -
February16 - - - 11 4 2
February 20 - - - 25 0 1
February 26 - - - 16.5 9 2
March 6 8.5 7 2 72.5 65 4
March 13 - - - 20 36 7
March 14 3 10 5 - - -
March 16 5 5 4 - - -
April 14 8 8 9 - - -
April 16 11 12 7 - - -
April 20 - - - 14.5 10 8
April 21 - - - 15 16 8
____________________________________________________________
88
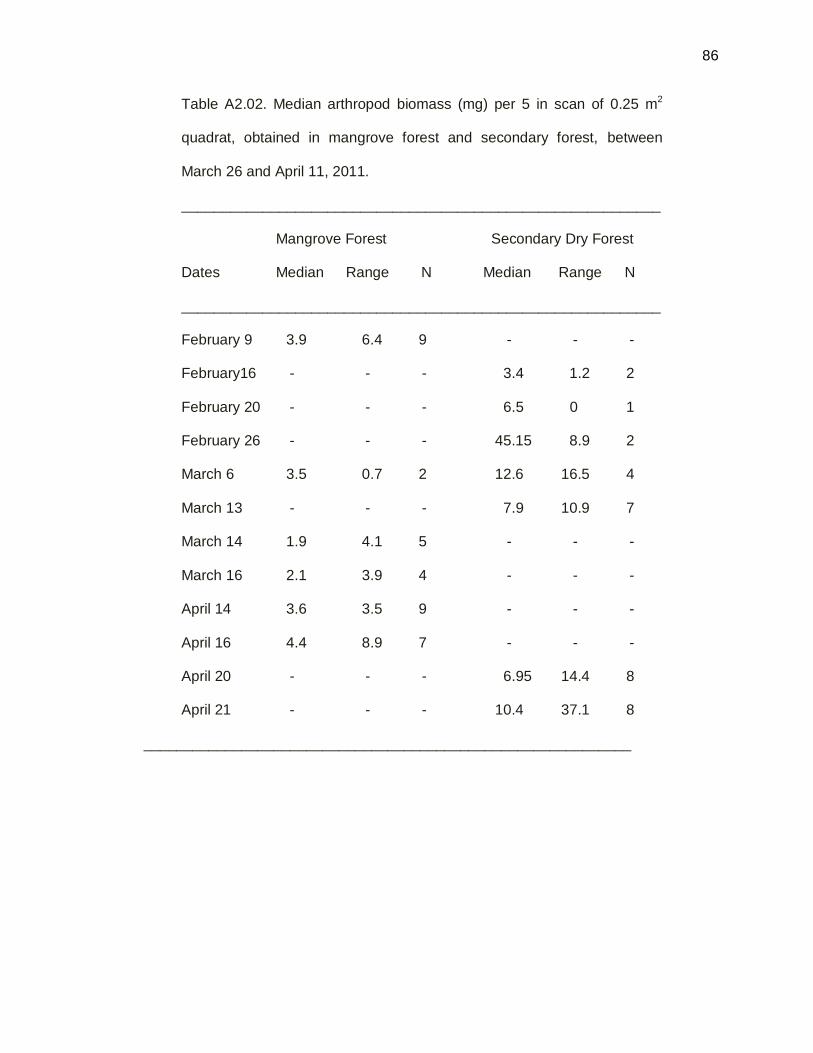
86
86
Table A2.02. Median arthropod biomass (mg) per 5 in scan of 0.25 m2
quadrat, obtained in mangrove forest and secondary forest, between
March 26 and April 11, 2011.
___________________________________________________________
Mangrove Forest Secondary Dry Forest
Dates Median Range N Median Range N
___________________________________________________________
February 9 3.9 6.4 9 - - -
February16 - - - 3.4 1.2 2
February 20 - - - 6.5 0 1
February 26 - - - 45.15 8.9 2
March 6 3.5 0.7 2 12.6 16.5 4
March 13 - - - 7.9 10.9 7
March 14 1.9 4.1 5 - - -
March 16 2.1 3.9 4 - - -
April 14 3.6 3.5 9 - - -
April 16 4.4 8.9 7 - - -
April 20 - - - 6.95 14.4 8
April 21 - - - 10.4 37.1 8
____________________________________________________________

87
87
Table A2.03. Ground arthropod samples taken in mangrove forest, in the dry season, between February 9, 2011
and April 16, 2011, using a 5 min scan of each 0.25 m2 quadrat. Arthropods samples were quantified and classified
to order and also biomass (mg) was determined. Samples were taken from (BM) black and (RM) red mangrove.
____________________________________________________________________________________________
Sample Habitat Date Order Number of Total number of Biomass in (mg) Total mass (mg)
Number Prey Items Prey Items
______________________________________________________________________________________________________
1 BM Feb 9, 2011 Aranae 2 1.8
Collembolla 1 0.2
Hymenoptera 7 10 1.9 3.9
2 BM Aranae 4 1.5
Isopoda 1 5 0.2 1.7
3 BM Isopoda 1 0.2
Coleoptera 2 0.9
Orthoptera 2 2.3
Aranae 9 15 4.7 8.1
4 RM March 6, 2011 Aranae 5 5 3.1 3.1
5 BM Aranae 4 1.3
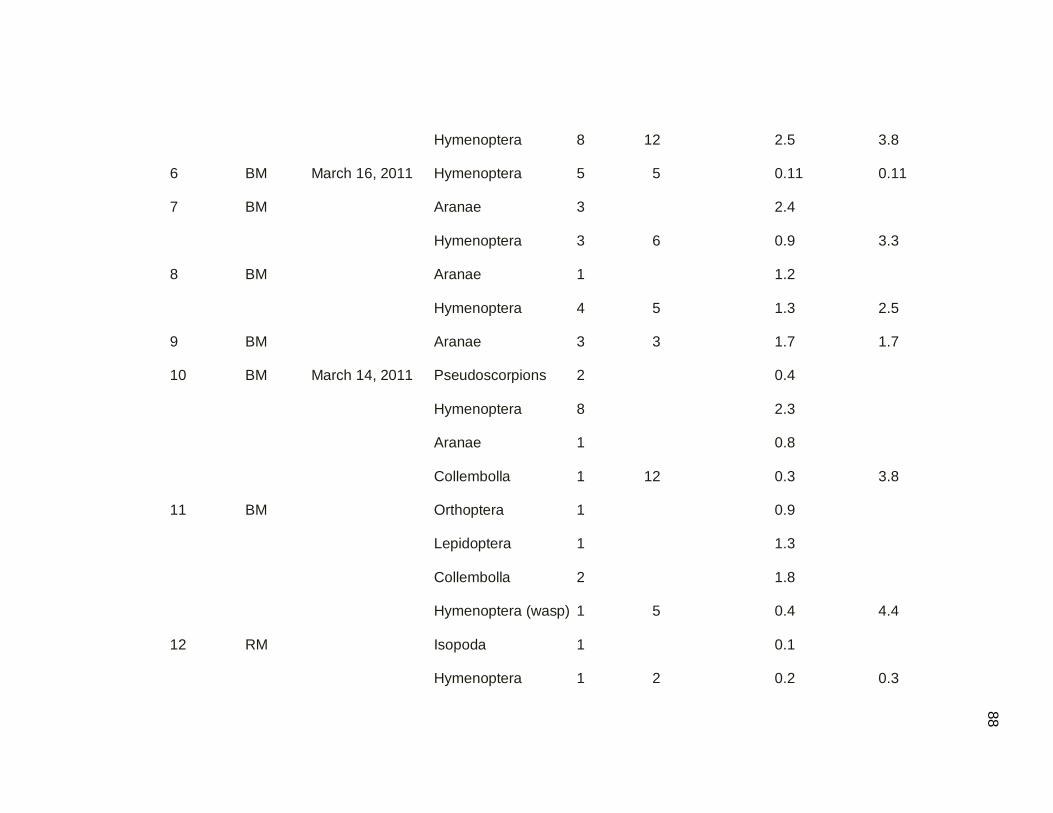
88
88
Hymenoptera 8 12 2.5 3.8
6 BM March 16, 2011 Hymenoptera 5 5 0.11 0.11
7 BM Aranae 3 2.4
Hymenoptera 3 6 0.9 3.3
8 BM Aranae 1 1.2
Hymenoptera 4 5 1.3 2.5
9 BM Aranae 3 3 1.7 1.7
10 BM March 14, 2011 Pseudoscorpions 2 0.4
Hymenoptera 8 2.3
Aranae 1 0.8
Collembolla 1 12 0.3 3.8
11 BM Orthoptera 1 0.9
Lepidoptera 1 1.3
Collembolla 2 1.8
Hymenoptera (wasp) 1 5 0.4 4.4
12 RM Isopoda 1 0.1
Hymenoptera 1 2 0.2 0.3

89
89
13 RM Aranae 1 0.5
Hymenoptera 1 2 0.3 0.8
14 RM Aranae 2 1.6
Isopoda 1 3 0.3 1.9
15 RM Pseudoscorpions 1 1 0.5 0.5
16 RM April 14, 2011 Aranae 2 0.8
Hymenoptera 2 0.7
Psocoptera 3 0.4
Collembolla 3 1.2
Coleoptera 3 13 2.7 5.8
17 RM Pseudoscorpions 3 0.7
Hymenoptera 6 1.7
Aranae 1 0.7
Collembolla 2 12 0.5 3.6
18 RM Orthoptera 2 1.8
Lepidoptera 1 1.2
Collembolla 2 1.5

90
90
Hymenoptera 1 6 0.4 4.9
19 RM Isopoda 1 0.2
Aranae 3 1.7
Hymenoptera 2 6 0.5 2.4
20 BM Hymenoptera 5 1.3
Aranae 4 9 2.5 3.8
21 RM Aranae 3 1.7
Hymenoptera 2 5 0.6 2.3
22 BM Aranae 5 4.1
Hymenoptera 4 9 1.4 5.5
23 RM Hymenoptera 4 1.3
Aranae 2 1.6
Isopoda 2 8 0.6 3.5
24 BM April 16,2011 Aranae 12 6.3
Hymenoptera 9 21 3.2 9.5
25 BM Aranae 3 2.6
Collembolla 1 0.3
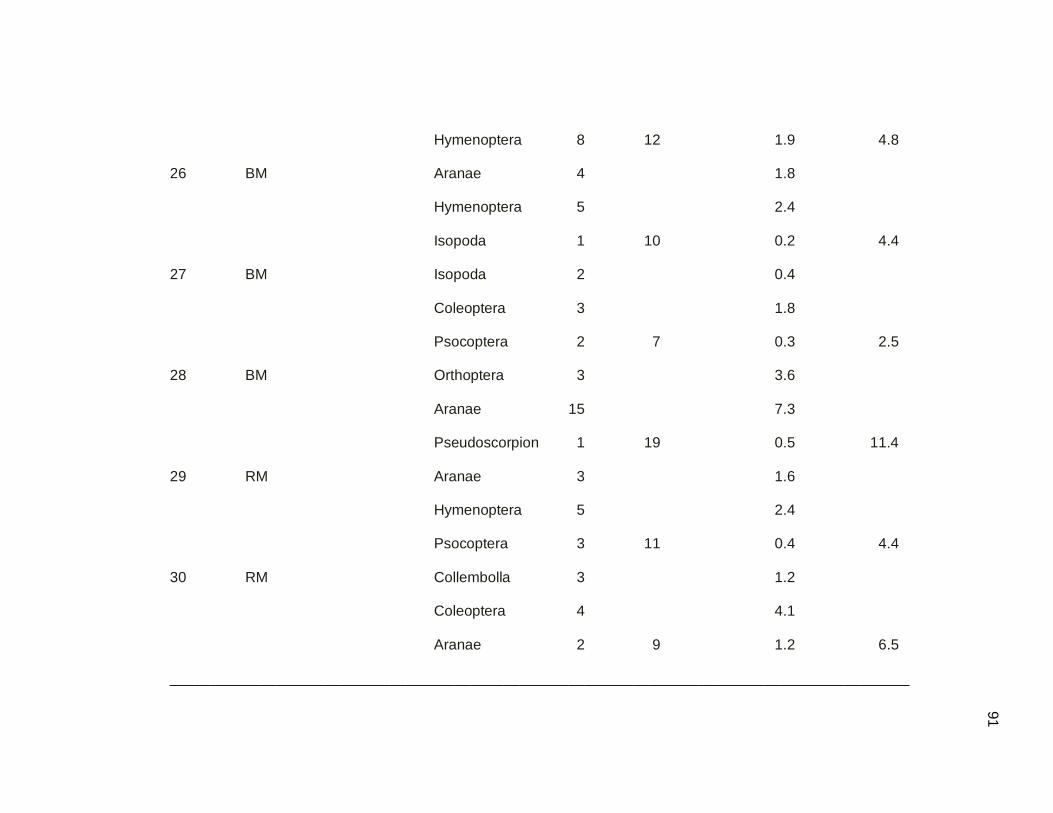
91
91
Hymenoptera 8 12 1.9 4.8
26 BM Aranae 4 1.8
Hymenoptera 5 2.4
Isopoda 1 10 0.2 4.4
27 BM Isopoda 2 0.4
Coleoptera 3 1.8
Psocoptera 2 7 0.3 2.5
28 BM Orthoptera 3 3.6
Aranae 15 7.3
Pseudoscorpion 1 19 0.5 11.4
29 RM Aranae 3 1.6
Hymenoptera 5 2.4
Psocoptera 3 11 0.4 4.4
30 RM Collembolla 3 1.2
Coleoptera 4 4.1
Aranae 2 9 1.2 6.5
___________________________________________________________________________________________

92
92
Table A2.04. Ground arthropod samples obtained in secondary dry forest, in the dry season, between February 9,
2011 to April 16, 2011 using 5 min scans of 0.25 m2 quadrats. Arthropods samples were quantified and classified at
order level and also biomass (mg) was determined.
Sample Number Date Order Number Total Prey Items Biomass in (mg) Total mass (mg)
Prey Items
______________________________________________________________________________________________________
1 Feb 16, 2011 Collembolla 1 0.4
Hymenoptera 6 1
Aranae 1 0.5
Diptera 1 9 0.9 2.8
2 Feb 20, 2011 Collembolla 3 2.6
Hymenoptera 1 0.2
Acari 20 2.2
Diptera 1 25 1.5 6.5
3 Feb 26, 2011 Hymenoptera 7 1.5
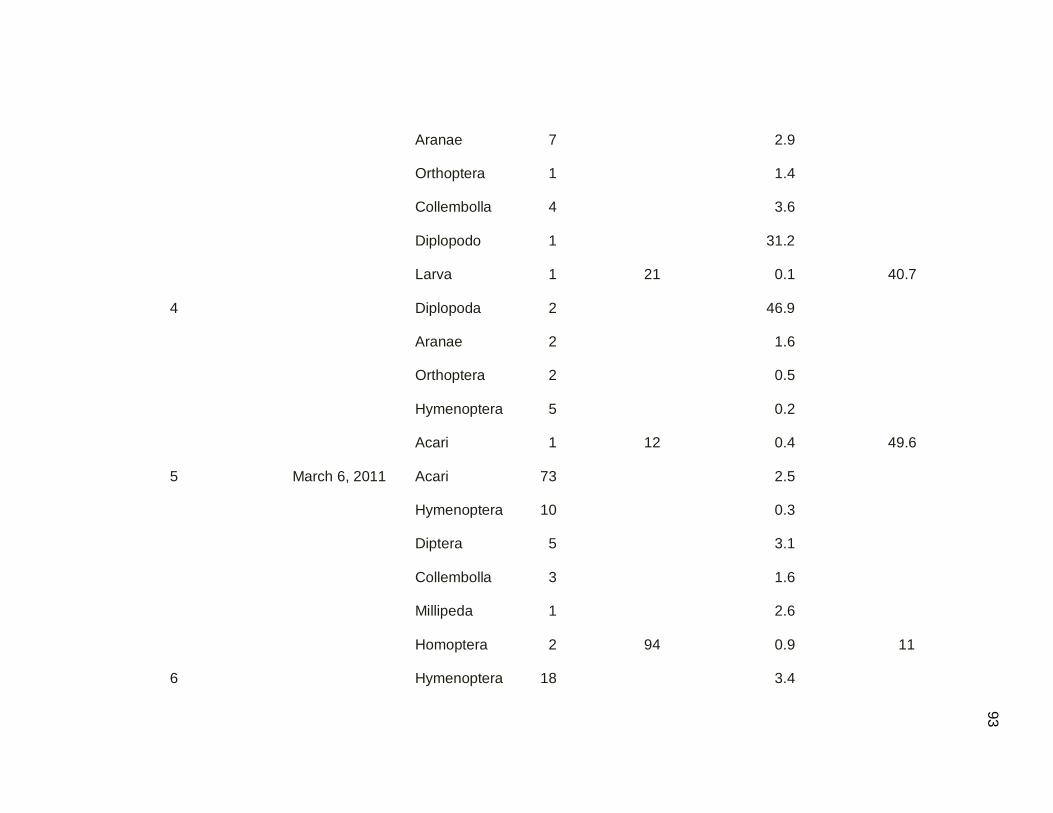
93
93
Aranae 7 2.9
Orthoptera 1 1.4
Collembolla 4 3.6
Diplopodo 1 31.2
Larva 1 21 0.1 40.7
4 Diplopoda 2 46.9
Aranae 2 1.6
Orthoptera 2 0.5
Hymenoptera 5 0.2
Acari 1 12 0.4 49.6
5 March 6, 2011 Acari 73 2.5
Hymenoptera 10 0.3
Diptera 5 3.1
Collembolla 3 1.6
Millipeda 1 2.6
Homoptera 2 94 0.9 11
6 Hymenoptera 18 3.4
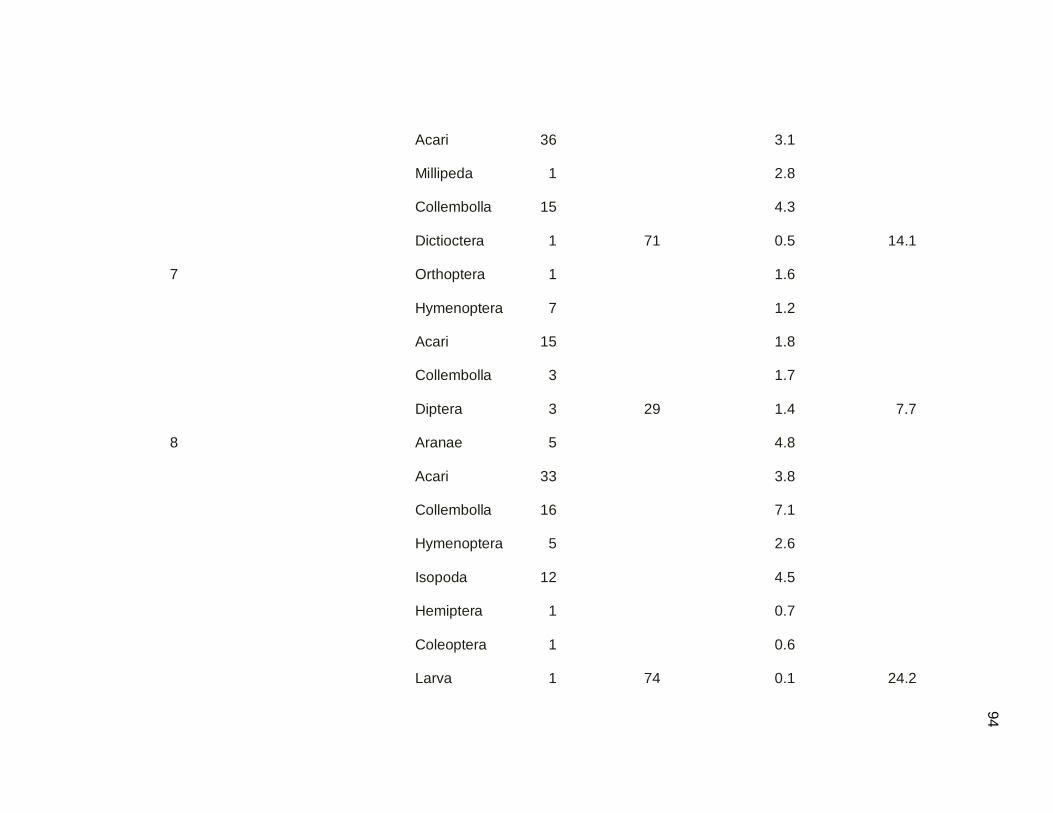
94
94
Acari 36 3.1
Millipeda 1 2.8
Collembolla 15 4.3
Dictioctera 1 71 0.5 14.1
7 Orthoptera 1 1.6
Hymenoptera 7 1.2
Acari 15 1.8
Collembolla 3 1.7
Diptera 3 29 1.4 7.7
8 Aranae 5 4.8
Acari 33 3.8
Collembolla 16 7.1
Hymenoptera 5 2.6
Isopoda 12 4.5
Hemiptera 1 0.7
Coleoptera 1 0.6
Larva 1 74 0.1 24.2
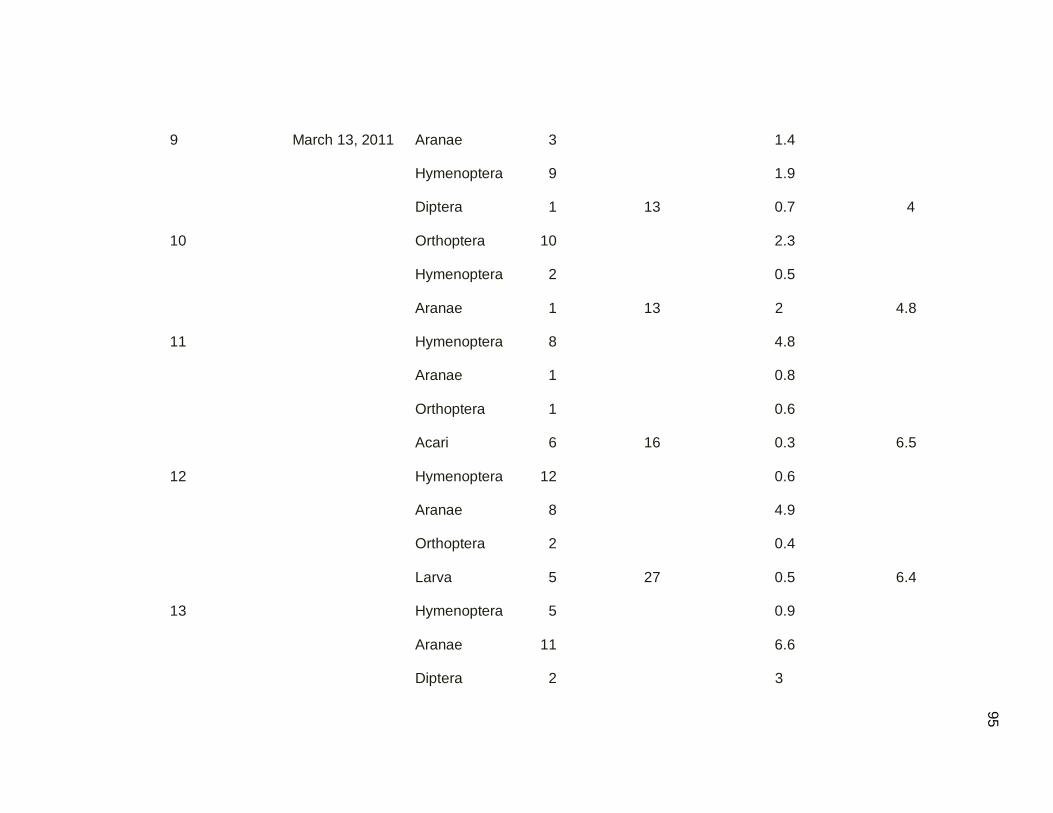
95
95
9 March 13, 2011 Aranae 3 1.4
Hymenoptera 9 1.9
Diptera 1 13 0.7 4
10 Orthoptera 10 2.3
Hymenoptera 2 0.5
Aranae 1 13 2 4.8
11 Hymenoptera 8 4.8
Aranae 1 0.8
Orthoptera 1 0.6
Acari 6 16 0.3 6.5
12 Hymenoptera 12 0.6
Aranae 8 4.9
Orthoptera 2 0.4
Larva 5 27 0.5 6.4
13 Hymenoptera 5 0.9
Aranae 11 6.6
Diptera 2 3
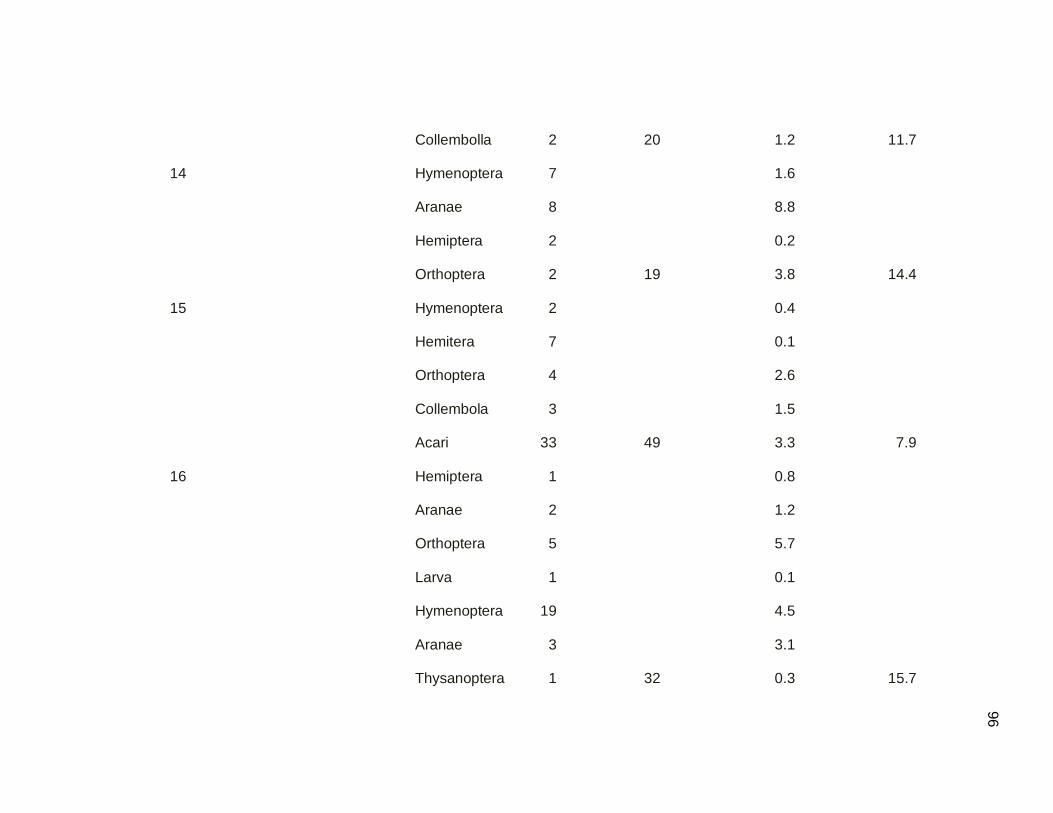
96
96
Collembolla 2 20 1.2 11.7
14 Hymenoptera 7 1.6
Aranae 8 8.8
Hemiptera 2 0.2
Orthoptera 2 19 3.8 14.4
15 Hymenoptera 2 0.4
Hemitera 7 0.1
Orthoptera 4 2.6
Collembola 3 1.5
Acari 33 49 3.3 7.9
16 Hemiptera 1 0.8
Aranae 2 1.2
Orthoptera 5 5.7
Larva 1 0.1
Hymenoptera 19 4.5
Aranae 3 3.1
Thysanoptera 1 32 0.3 15.7
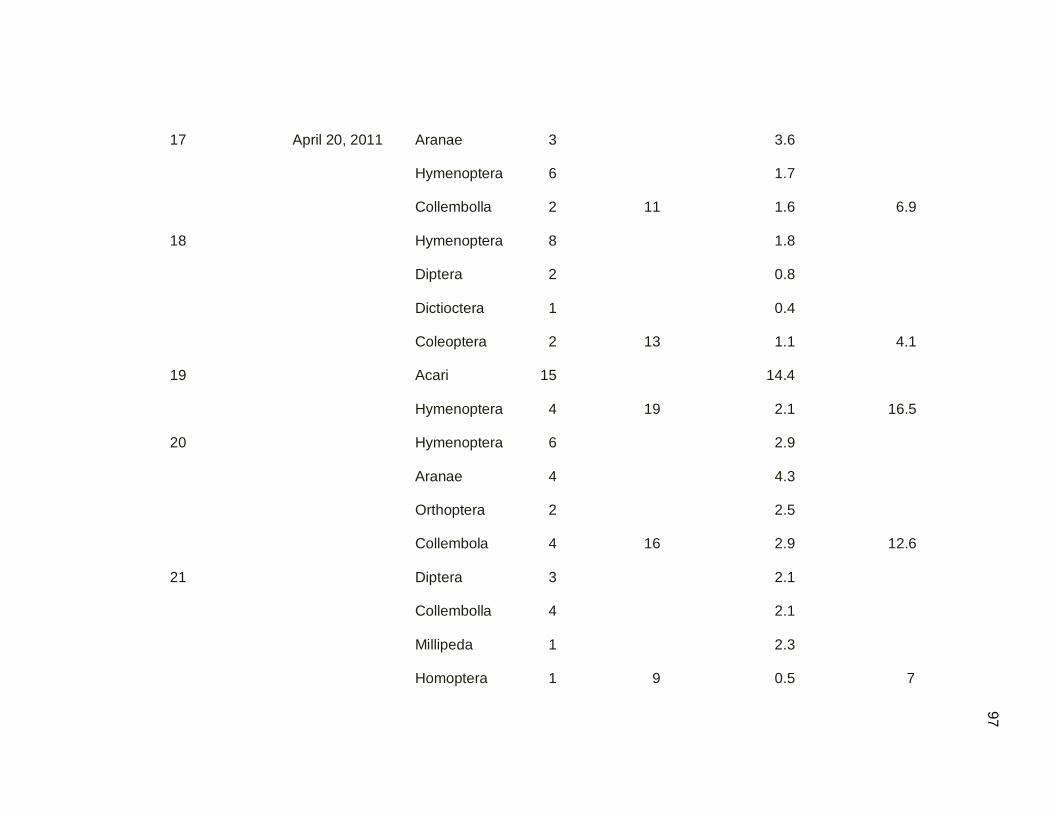
97
97
17 April 20, 2011 Aranae 3 3.6
Hymenoptera 6 1.7
Collembolla 2 11 1.6 6.9
18 Hymenoptera 8 1.8
Diptera 2 0.8
Dictioctera 1 0.4
Coleoptera 2 13 1.1 4.1
19 Acari 15 14.4
Hymenoptera 4 19 2.1 16.5
20 Hymenoptera 6 2.9
Aranae 4 4.3
Orthoptera 2 2.5
Collembola 4 16 2.9 12.6
21 Diptera 3 2.1
Collembolla 4 2.1
Millipeda 1 2.3
Homoptera 1 9 0.5 7

98
98
22 Hymenoptera 5 2.8
Collembolla 2 0.7
Acari 9 2.1
Orthoptera 2 1.5
Hemiptera 1 19 0.3 7.4
23 Aranae 7 3.0
Diplopoda 1 26.1
Diptera 1 9 0.8 29.9
24 April 21, 2011 Collembolla 10 4.3
Diptera 2 22 0.3 4.6
25 Hymenoptera 9 10
Diplopoda 1 31.2
Collembolla 4 3.6
Aranae 7 21 2.9 47.7
26 Hymenoptera 7 1.5
Orthoptera 2 0.6
Diptera 3 2.3
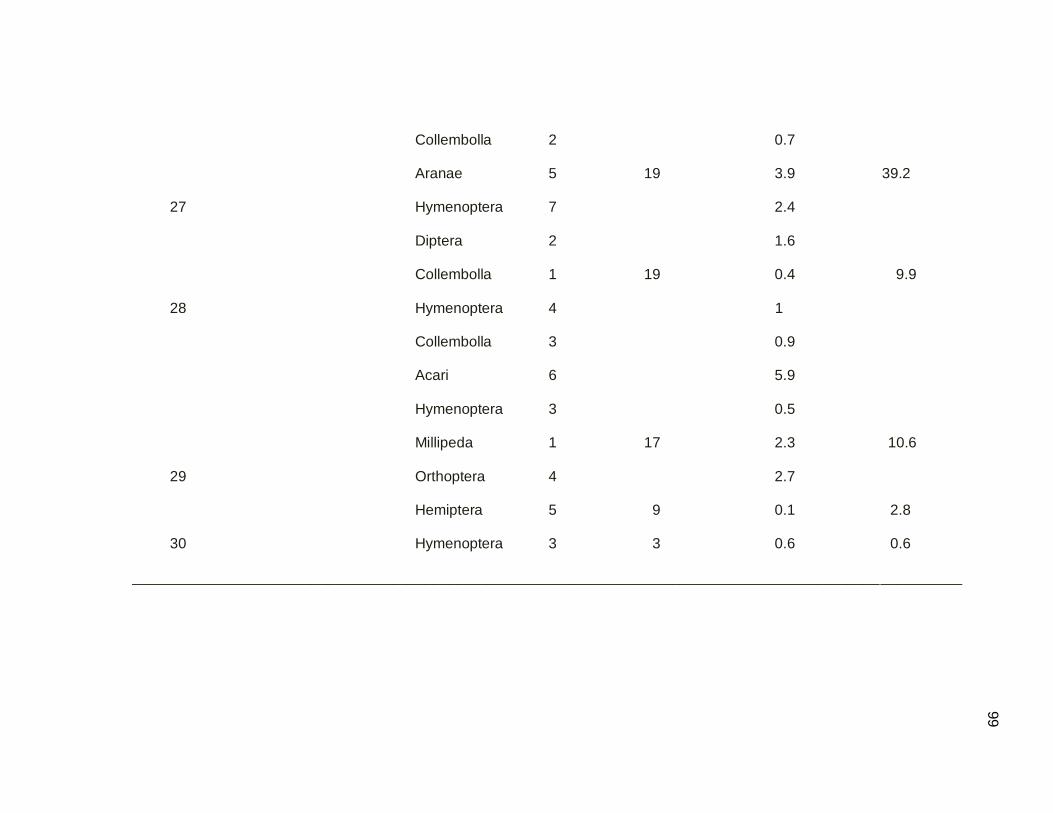
99
99
Collembolla 2 0.7
Aranae 5 19 3.9 39.2
27 Hymenoptera 7 2.4
Diptera 2 1.6
Collembolla 1 19 0.4 9.9
28 Hymenoptera 4 1
Collembolla 3 0.9
Acari 6 5.9
Hymenoptera 3 0.5
Millipeda 1 17 2.3 10.6
29 Orthoptera 4 2.7
Hemiptera 5 9 0.1 2.8
30 Hymenoptera 3 3 0.6 0.6
______________________________________________________________________________________________________

100
10
0