univariate analysis hermine maes tc19 march 2006
Post on 21-Dec-2015
220 views
TRANSCRIPT
Univariate Analysis
Hermine MaesTC19March 2006
Files to Copy to your Computer
Faculty/Maes/tc19/maes/univariateozbmi.recozbmi.datozbmiyface(s)(2).mxUnivariate.ppt
Univariate Genetic Analysis
Saturated ModelsFree variances, covariancesFree means
Univariate ModelsVariances partitioned in a, c/d and eFree means (or not)

ACE Model
T 2
AEA C
a ac e
T 1
1 111
E
e
1
C
c
1
1 or .5
1
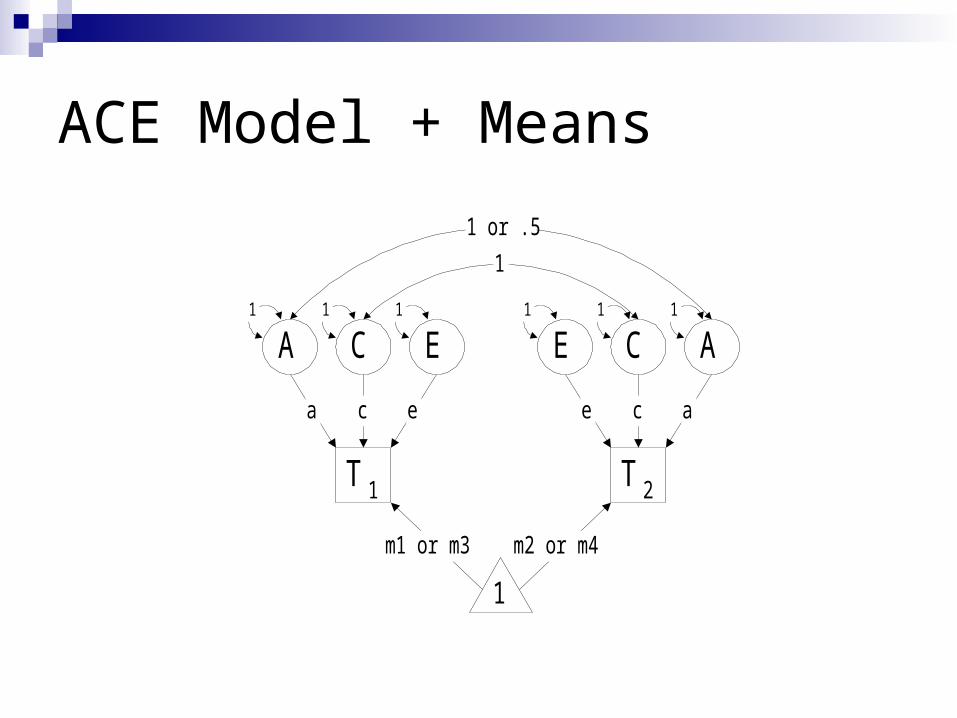
ACE Model + Means
T 2
AEA C
a ac e
T 1
1 111
E
e
1
C
c
1
1 or .5
1
1
m1 or m3 m2 or m4
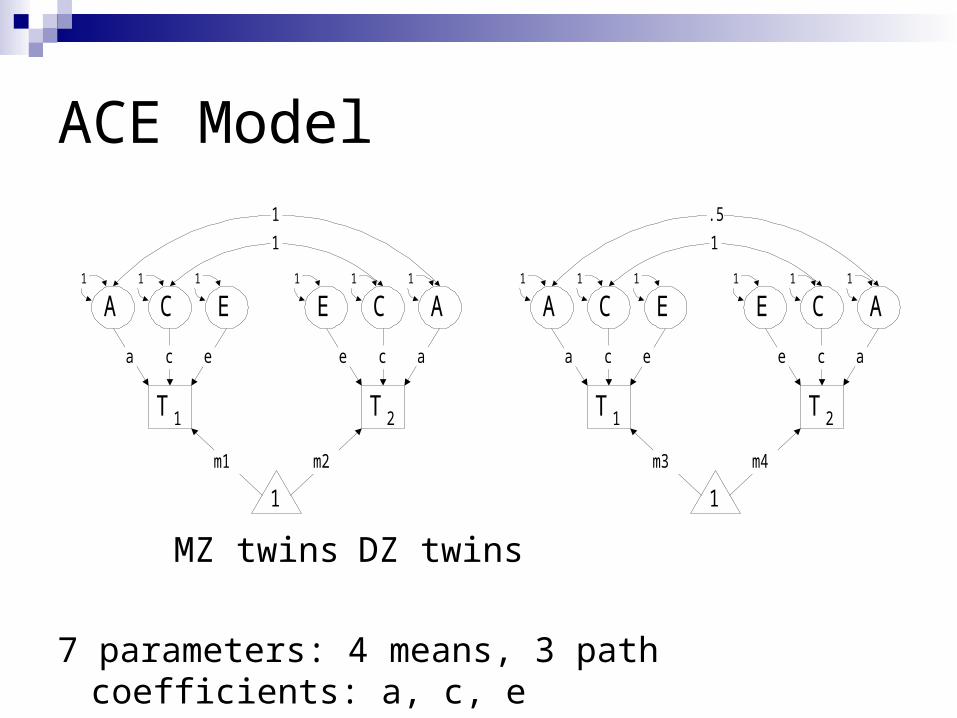
ACE Model
T 2
AEA C
a ac e
T 1
1 111
E
e
1
C
c
1
1
1
1
m1 m2
T 2
AEA C
a ac e
T 1
1 111
E
e
1
C
c
1
.5
1
1
m3 m4
MZ twins DZ twins
7 parameters: 4 means, 3 path coefficients: a, c, e
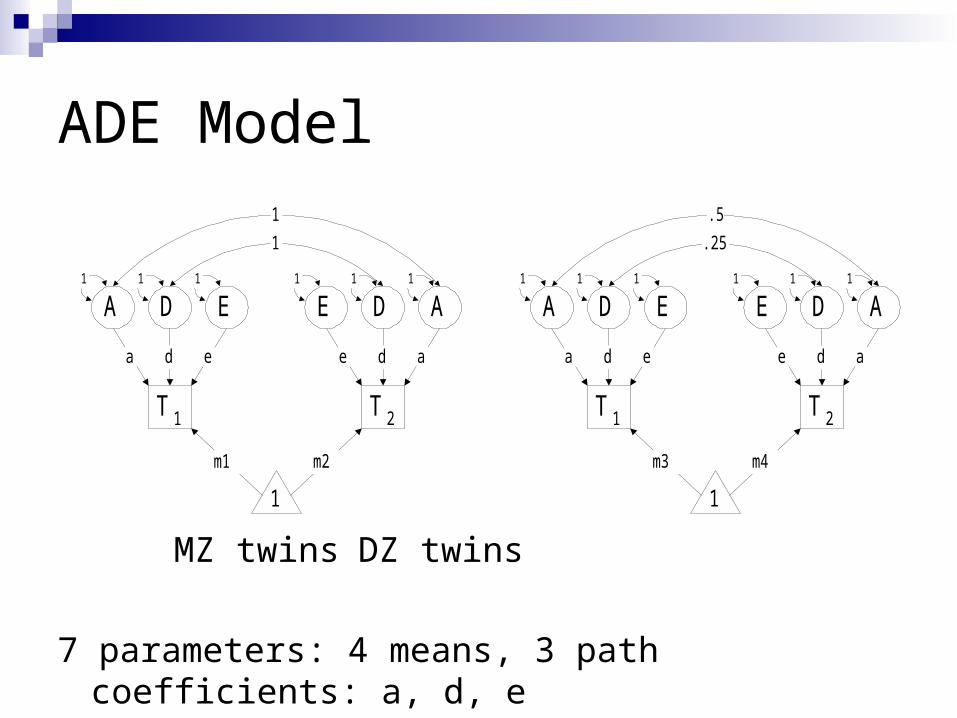
ADE Model
T 2
AEA D
a ad e
T 1
1 111
E
e
1
D
d
1
1
1
1
m1 m2
T 2
AEA D
a ad e
T 1
1 111
E
e
1
D
d
1
.5
.25
1
m3 m4
MZ twins DZ twins
7 parameters: 4 means, 3 path coefficients: a, d, e
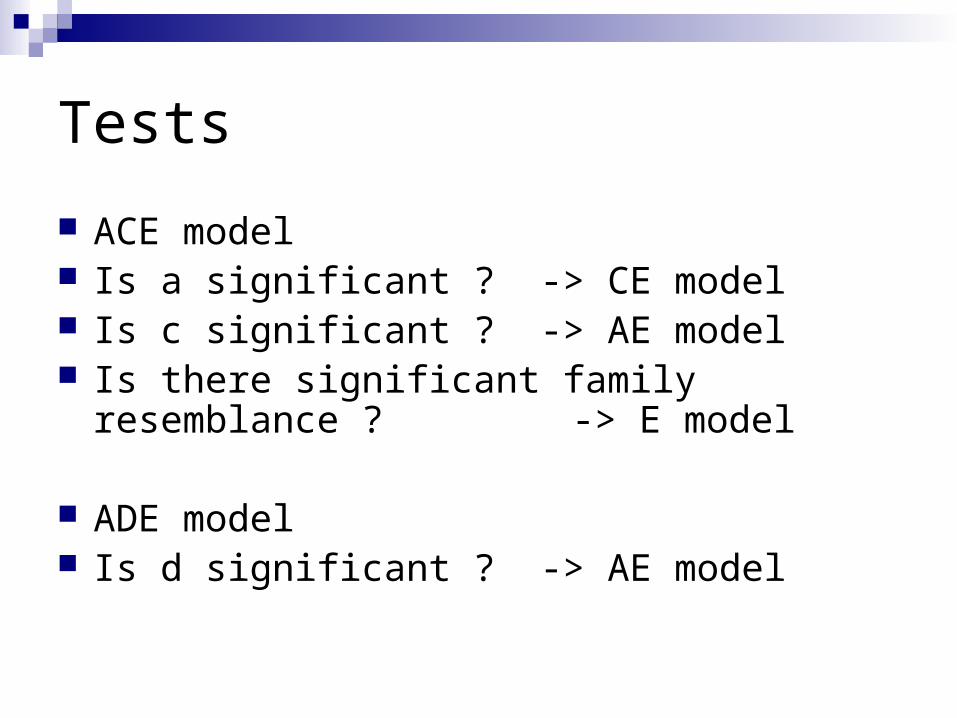
Tests
ACE model Is a significant ? -> CE model Is c significant ? -> AE model Is there significant family resemblance ? ->
E model
ADE model Is d significant ? -> AE model
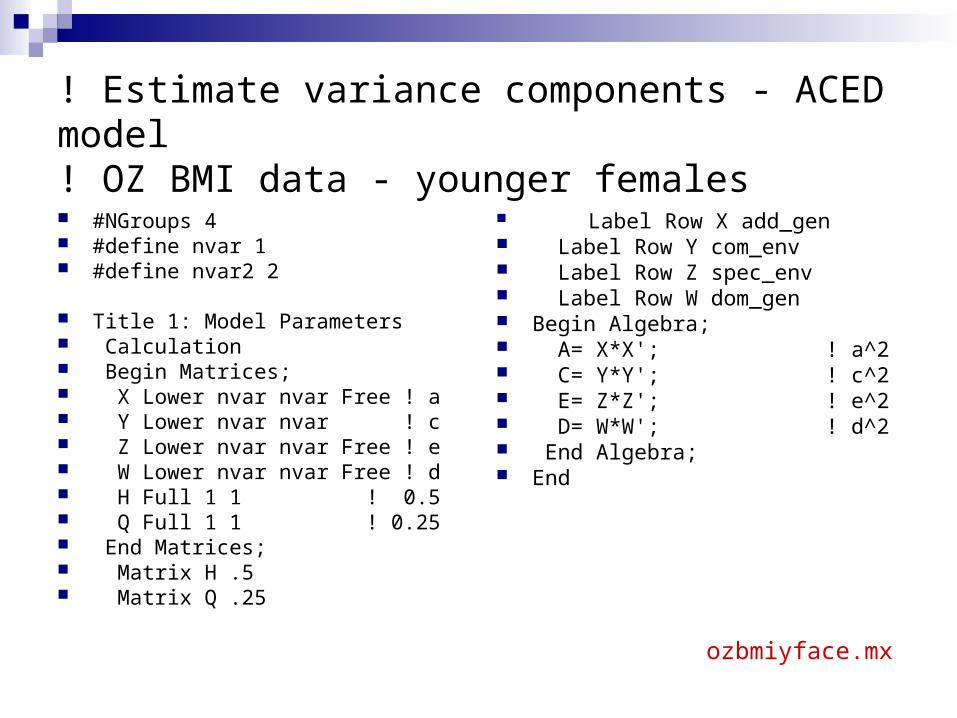
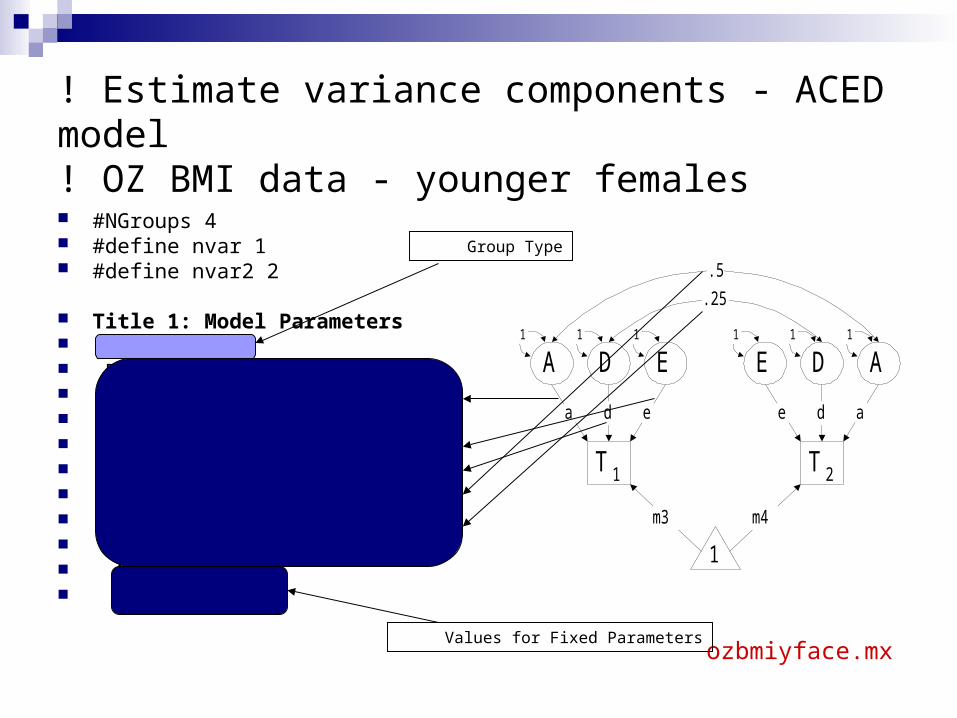
! Estimate variance components - ACED model! OZ BMI data - younger females
#NGroups 4 #define nvar 1 #define nvar2 2
Title 1: Model Parameters Calculation Begin Matrices; X Lower nvar nvar Free ! a Y Lower nvar nvar ! c Z Lower nvar nvar Free ! e W Lower nvar nvar Free ! d H Full 1 1 ! 0.5 Q Full 1 1 ! 0.25 End Matrices; Matrix H .5 Matrix Q .25
Label Row X add_gen Label Row Y com_env Label Row Z spec_env Label Row W dom_gen Begin Algebra; A= X*X'; ! a^2 C= Y*Y'; ! c^2 E= Z*Z'; ! e^2 D= W*W'; ! d^2 End Algebra; End
ozbmiyface.mx
! Estimate variance components - ACED model! OZ BMI data - younger females
#NGroups 4 #define nvar 1 #define nvar2 2
Title 1: Model Parameters Calculation Begin Matrices; X Lower nvar nvar Free ! a Y Lower nvar nvar ! c Z Lower nvar nvar Free ! e W Lower nvar nvar Free ! d H Full 1 1 ! 0.5 Q Full 1 1 ! 0.25 End Matrices; Matrix H .5 Matrix Q .25
ozbmiyface.mx
Group Type
T 2
AEA D
a ad e
T 1
1 111
E
e
1
D
d
1
.5
.25
1
m3 m4
Values for Fixed Parameters
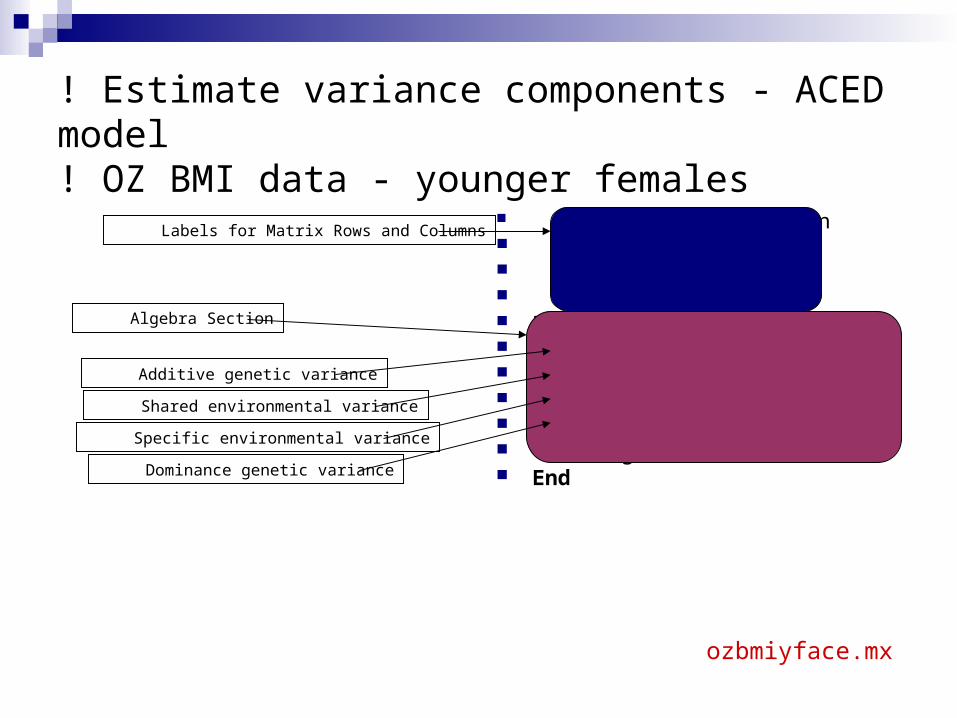
! Estimate variance components - ACED model! OZ BMI data - younger females
Label Row X add_gen Label Row Y com_env Label Row Z spec_env Label Row W dom_gen Begin Algebra; A= X*X'; ! a^2 C= Y*Y'; ! c^2 E= Z*Z'; ! e^2 D= W*W'; ! d^2 End Algebra; End
ozbmiyface.mx
Labels for Matrix Rows and Columns
Algebra Section
Additive genetic variance
Shared environmental variance
Specific environmental variance
Dominance genetic variance
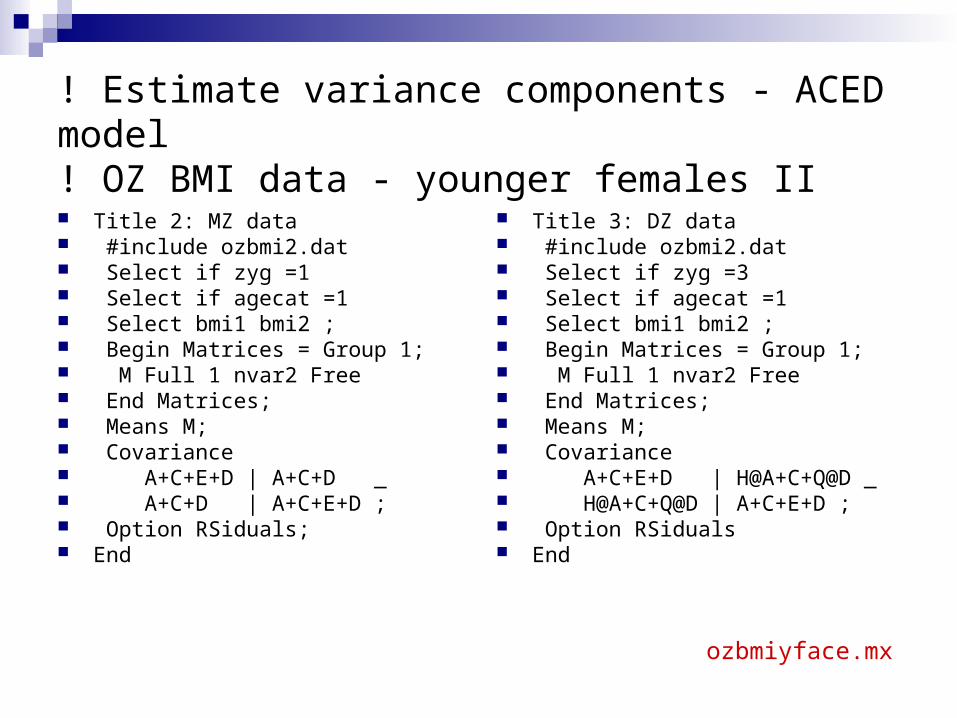
! Estimate variance components - ACED model! OZ BMI data - younger females II
Title 2: MZ data #include ozbmi2.dat Select if zyg =1 Select if agecat =1 Select bmi1 bmi2 ; Begin Matrices = Group 1; M Full 1 nvar2 Free End Matrices; Means M; Covariance A+C+E+D | A+C+D _ A+C+D | A+C+E+D ; Option RSiduals; End
Title 3: DZ data #include ozbmi2.dat Select if zyg =3 Select if agecat =1 Select bmi1 bmi2 ; Begin Matrices = Group 1; M Full 1 nvar2 Free End Matrices; Means M; Covariance A+C+E+D | H@A+C+Q@D _ H@A+C+Q@D | A+C+E+D ; Option RSiduals End
ozbmiyface.mx
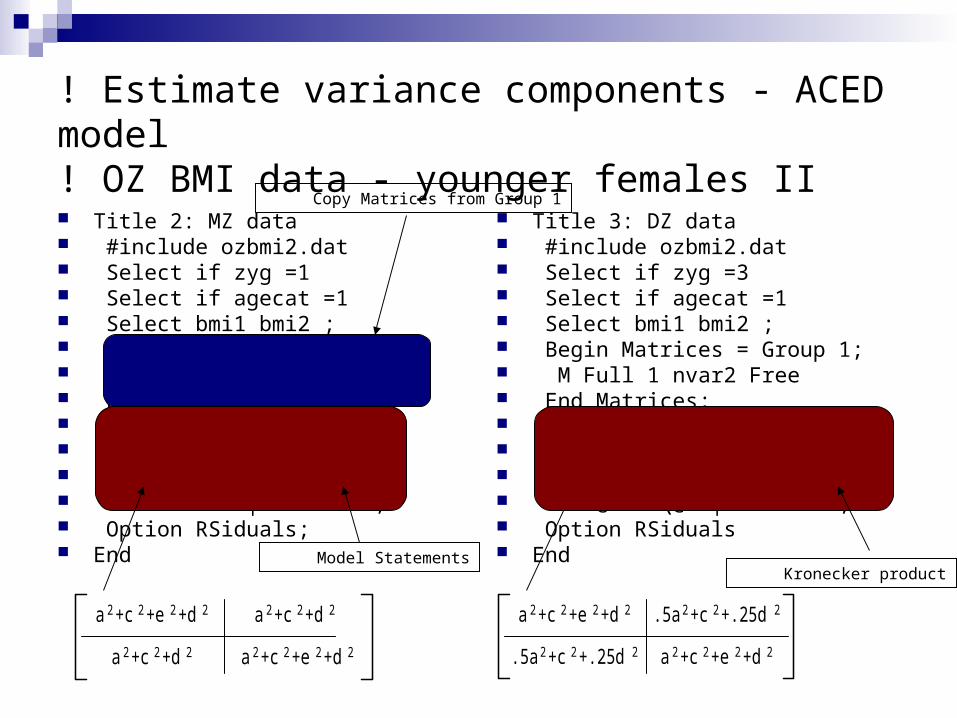
! Estimate variance components - ACED model! OZ BMI data - younger females II
Title 2: MZ data #include ozbmi2.dat Select if zyg =1 Select if agecat =1 Select bmi1 bmi2 ; Begin Matrices = Group 1; M Full 1 nvar2 Free End Matrices; Means M; Covariance A+C+E+D | A+C+D _ A+C+D | A+C+E+D ; Option RSiduals; End
Title 3: DZ data #include ozbmi2.dat Select if zyg =3 Select if agecat =1 Select bmi1 bmi2 ; Begin Matrices = Group 1; M Full 1 nvar2 Free End Matrices; Means M; Covariance A+C+E+D | H@A+C+Q@D _ H@A+C+Q@D | A+C+E+D ; Option RSiduals End
a2+c 2+e 2+d 2
a2+c 2+e 2+d 2a2+c 2+d 2
a2+c 2+d 2 a2+c 2+e 2+d 2
a2+c 2+e 2+d 2.5a 2+c 2+.25d 2
.5a 2+c 2+.25d 2
Model StatementsKronecker product
Copy Matrices from Group 1
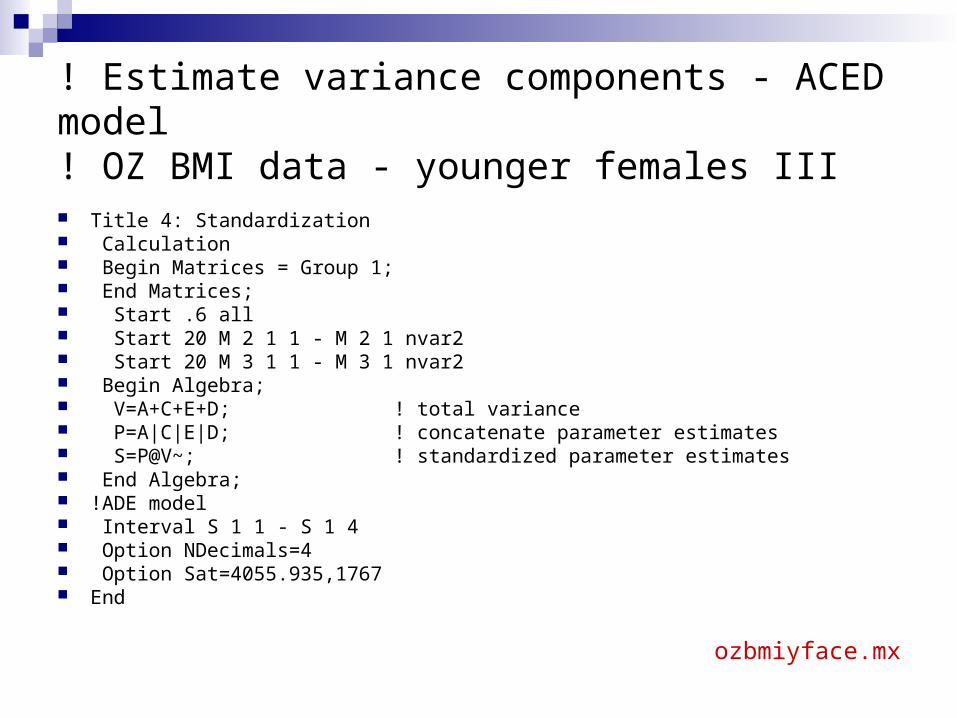
! Estimate variance components - ACED model! OZ BMI data - younger females III
Title 4: Standardization Calculation Begin Matrices = Group 1; End Matrices; Start .6 all Start 20 M 2 1 1 - M 2 1 nvar2 Start 20 M 3 1 1 - M 3 1 nvar2 Begin Algebra; V=A+C+E+D; ! total variance P=A|C|E|D; ! concatenate parameter estimates S=P@V~; ! standardized parameter estimates End Algebra; !ADE model Interval S 1 1 - S 1 4 Option NDecimals=4 Option Sat=4055.935,1767 End
ozbmiyface.mx
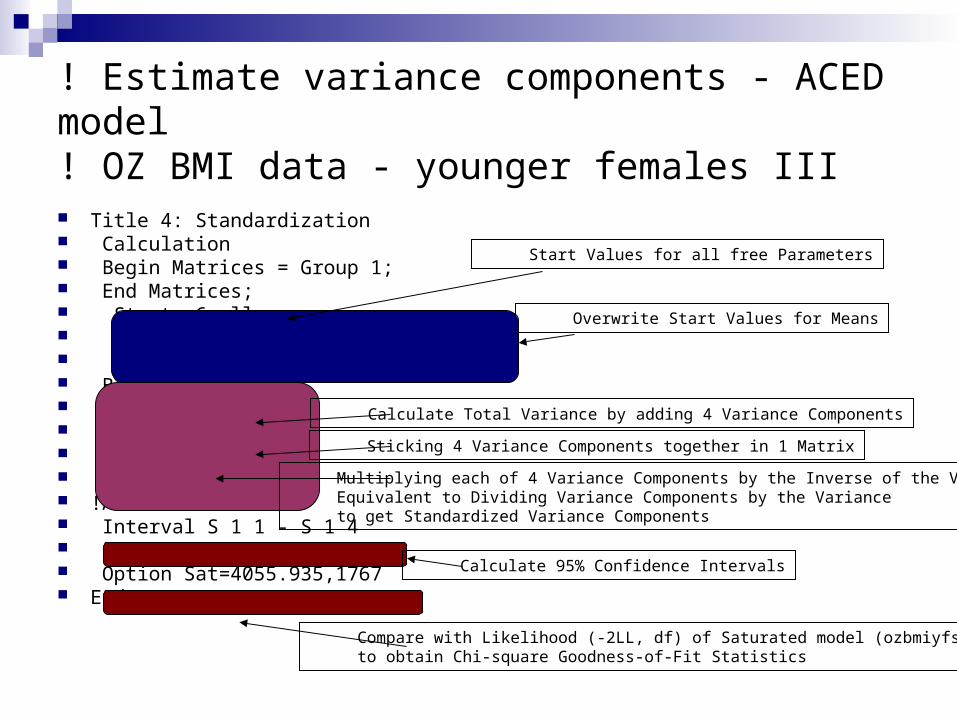
! Estimate variance components - ACED model! OZ BMI data - younger females III
Title 4: Standardization Calculation Begin Matrices = Group 1; End Matrices; Start .6 all Start 20 M 2 1 1 - M 2 1 nvar2 Start 20 M 3 1 1 - M 3 1 nvar2 Begin Algebra; V=A+C+E+D; P=A|C|E|D; S=P@V~; End Algebra; !ADE model Interval S 1 1 - S 1 4 Option NDecimals=4 Option Sat=4055.935,1767 End
Start Values for all free Parameters
Overwrite Start Values for Means
Calculate Total Variance by adding 4 Variance Components
Sticking 4 Variance Components together in 1 Matrix
Multiplying each of 4 Variance Components by the Inverse of the Variance, Equivalent to Dividing Variance Components by the Variance to get Standardized Variance Components
Calculate 95% Confidence Intervals
Compare with Likelihood (-2LL, df) of Saturated model (ozbmiyfsat.mxo),to obtain Chi-square Goodness-of-Fit Statistics
! Estimate variance components - ACED model! OZ BMI data - younger females IV
Title 4: Standardization Calculation Begin Matrices = Group 1; End Matrices; Start .6 all Start 20 M 2 1 1 - M 2 1 2 Start 20 M 3 1 1 - M 3 1 2 Begin Algebra; V=A+C+E+D; P=A|C|E|D; S=P@V~; End Algebra; !ADE model Interval S 1 1 - S 1 4 Option NDecimals=4 Option Sat=4055.935,1767 Option Multiple End
!AE model Drop W 1 1 1 End
!ACE model Free Y 1 1 1 End
!CE model Drop X 1 1 1 End
!E model Drop Y 1 1 1 End
ozbmifyaces.mx
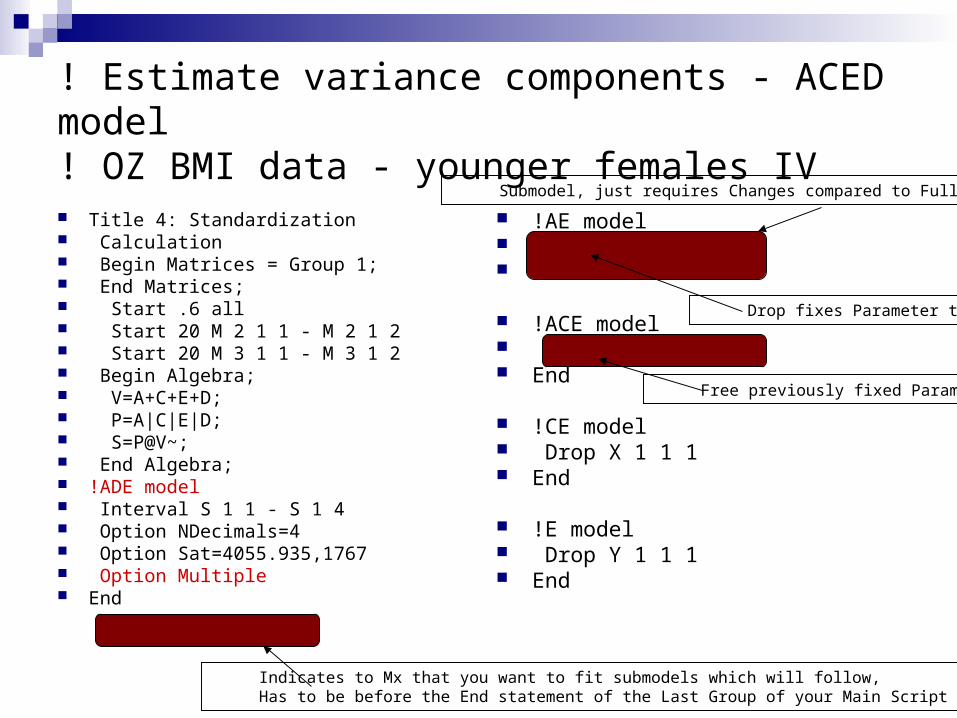
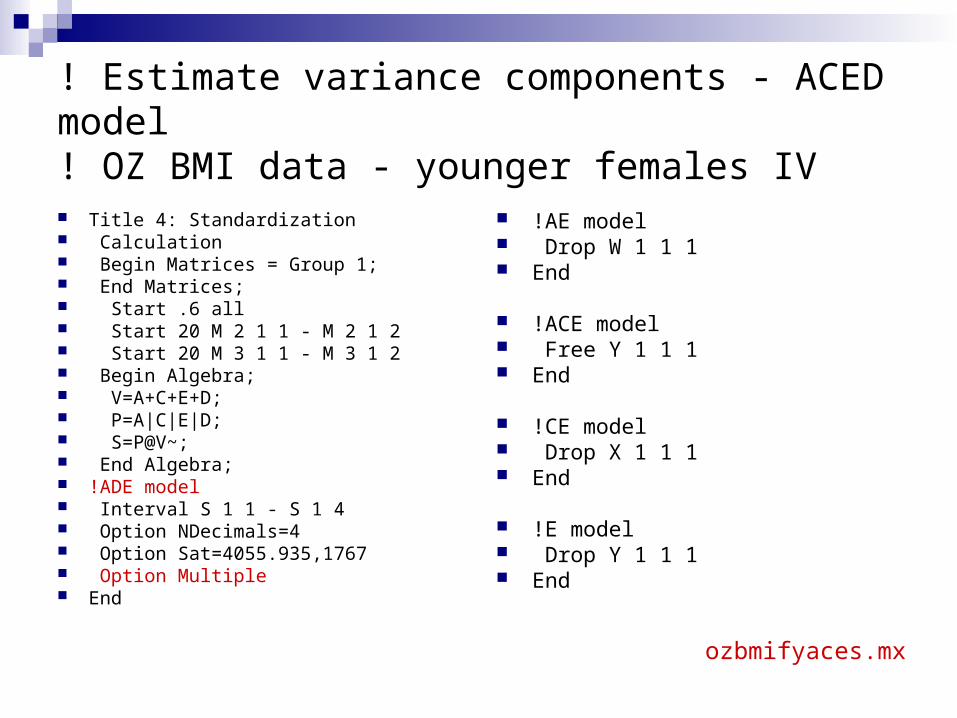
! Estimate variance components - ACED model! OZ BMI data - younger females IV
Title 4: Standardization Calculation Begin Matrices = Group 1; End Matrices; Start .6 all Start 20 M 2 1 1 - M 2 1 2 Start 20 M 3 1 1 - M 3 1 2 Begin Algebra; V=A+C+E+D; P=A|C|E|D; S=P@V~; End Algebra; !ADE model Interval S 1 1 - S 1 4 Option NDecimals=4 Option Sat=4055.935,1767 Option Multiple End
!AE model Drop W 1 1 1 End
!ACE model Free Y 1 1 1 End
!CE model Drop X 1 1 1 End
!E model Drop Y 1 1 1 End
Indicates to Mx that you want to fit submodels which will follow,Has to be before the End statement of the Last Group of your Main Script
Submodel, just requires Changes compared to Full Script
Free previously fixed Parameter
Drop fixes Parameter to 0
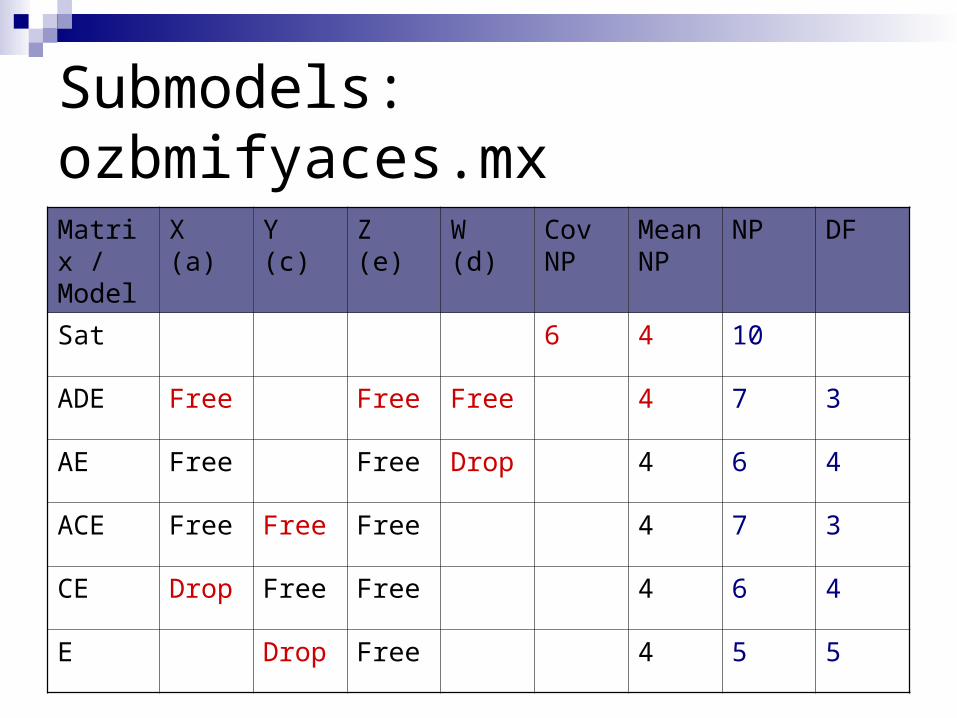
Submodels: ozbmifyaces.mx
Matrix / Model
X (a) Y (c) Z (e) W (d) Cov NP
Mean NP
NP DF
Sat 6 4 10
ADE Free Free Free 4 7 3
AE Free Free Drop 4 6 4
ACE Free Free Free 4 7 3
CE Drop Free Free 4 6 4
E Drop Free 4 5 5
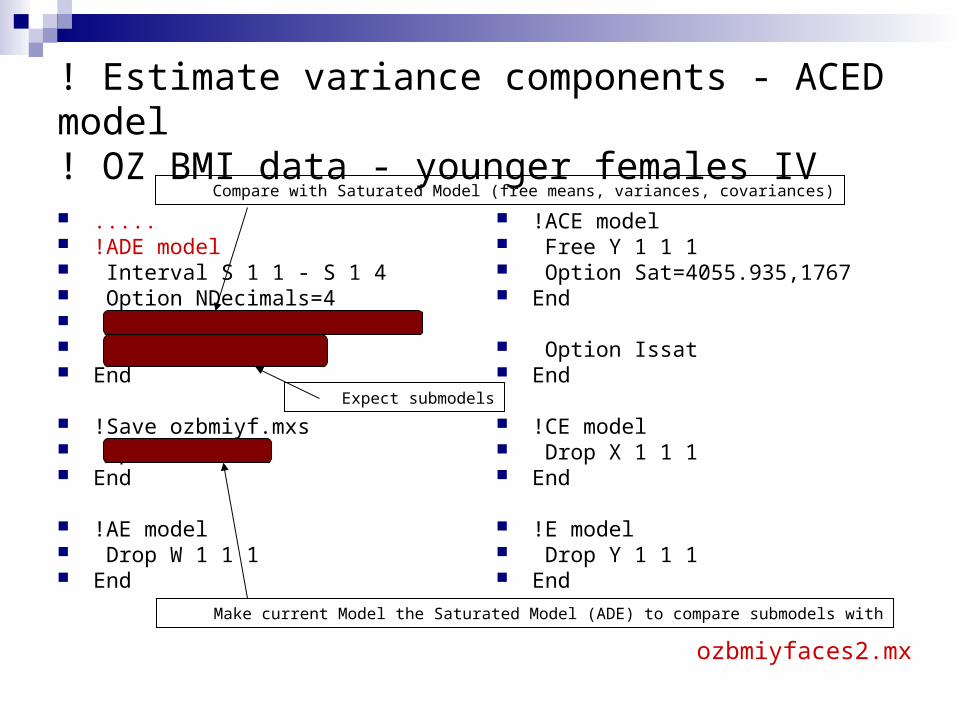
! Estimate variance components - ACED model! OZ BMI data - younger females IV
..... !ADE model Interval S 1 1 - S 1 4 Option NDecimals=4 Option Sat=4055.935,1767 Option Multiple End
!Save ozbmiyf.mxs Option Issat End
!AE model Drop W 1 1 1 End
!ACE model Free Y 1 1 1 Option Sat=4055.935,1767 End
Option Issat End
!CE model Drop X 1 1 1 End
!E model Drop Y 1 1 1 End
ozbmiyfaces2.mx
Compare with Saturated Model (free means, variances, covariances)
Make current Model the Saturated Model (ADE) to compare submodels with
Expect submodels
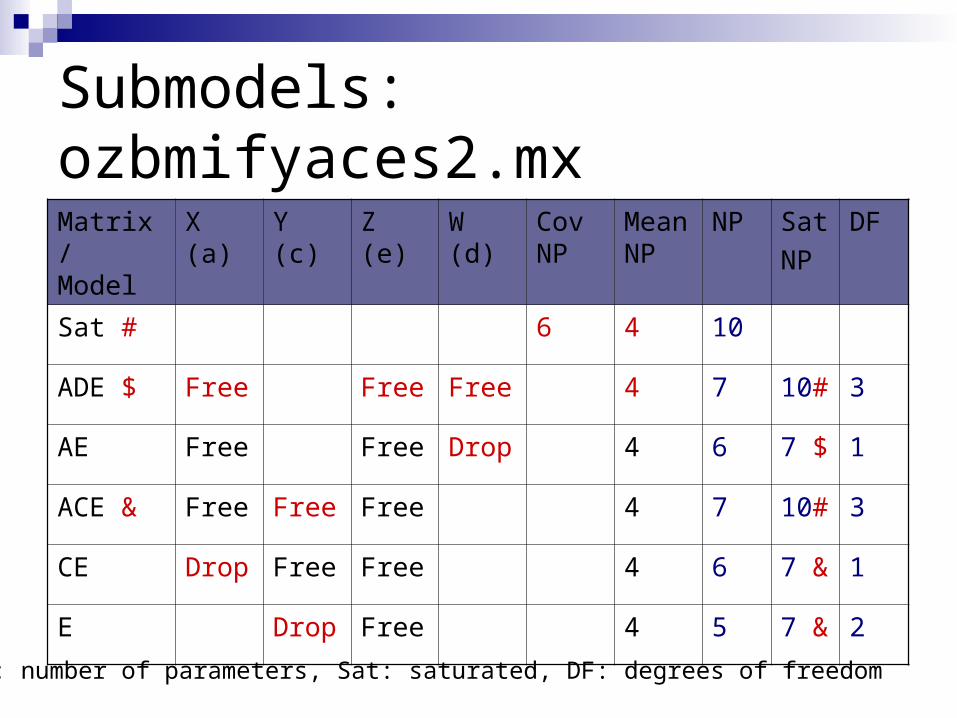
Submodels: ozbmifyaces2.mx
Matrix / Model
X (a) Y (c) Z (e) W (d) Cov NP
Mean NP
NP Sat
NP
DF
Sat # 6 4 10
ADE $ Free Free Free 4 7 10# 3
AE Free Free Drop 4 6 7 $ 1
ACE & Free Free Free 4 7 10# 3
CE Drop Free Free 4 6 7 & 1
E Drop Free 4 5 7 & 2
NP: number of parameters, Sat: saturated, DF: degrees of freedom
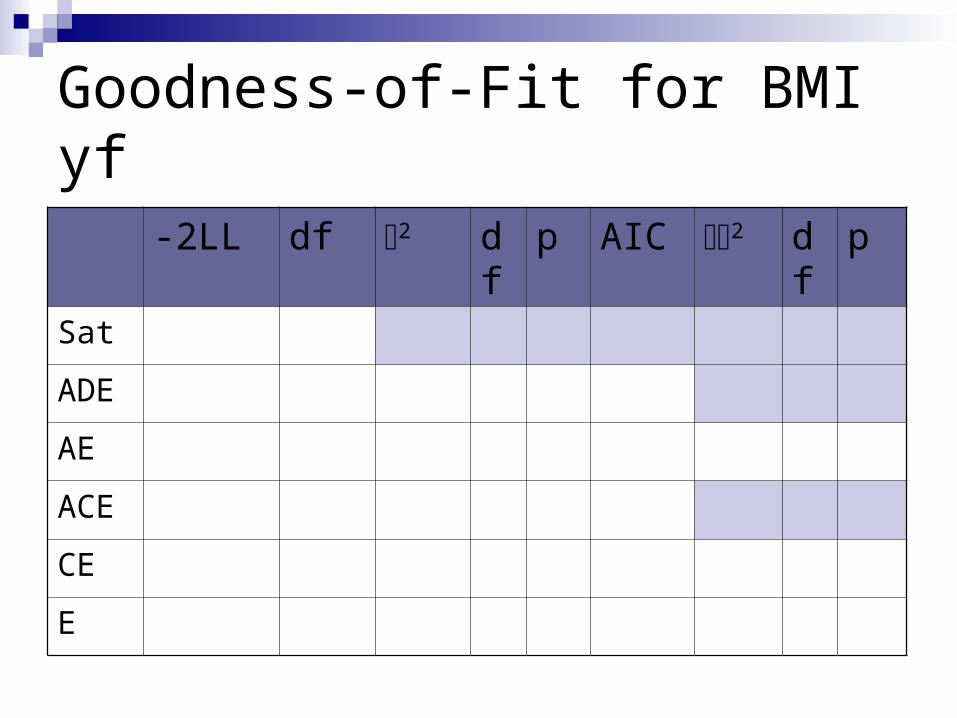
Goodness-of-Fit for BMI yf
-2LL df 2 df p AIC 2 df p
Sat
ADE
AE
ACE
CE
E
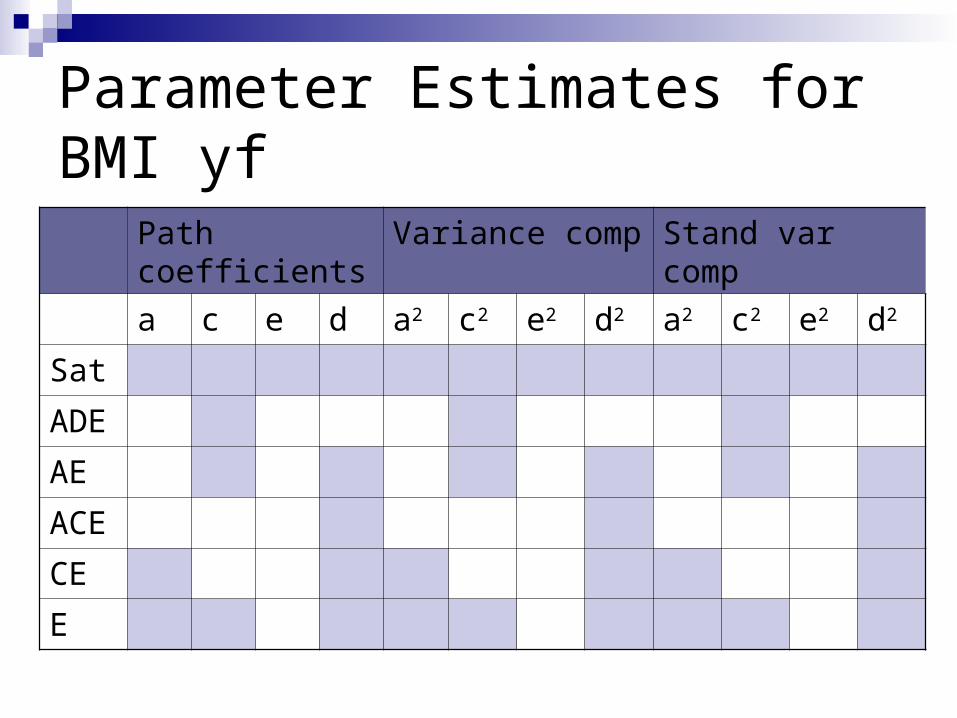
Parameter Estimates for BMI yf
Path coefficients Variance comp Stand var comp
a c e d a2 c2 e2 d2 a2 c2 e2 d2
Sat
ADE
AE
ACE
CE
E
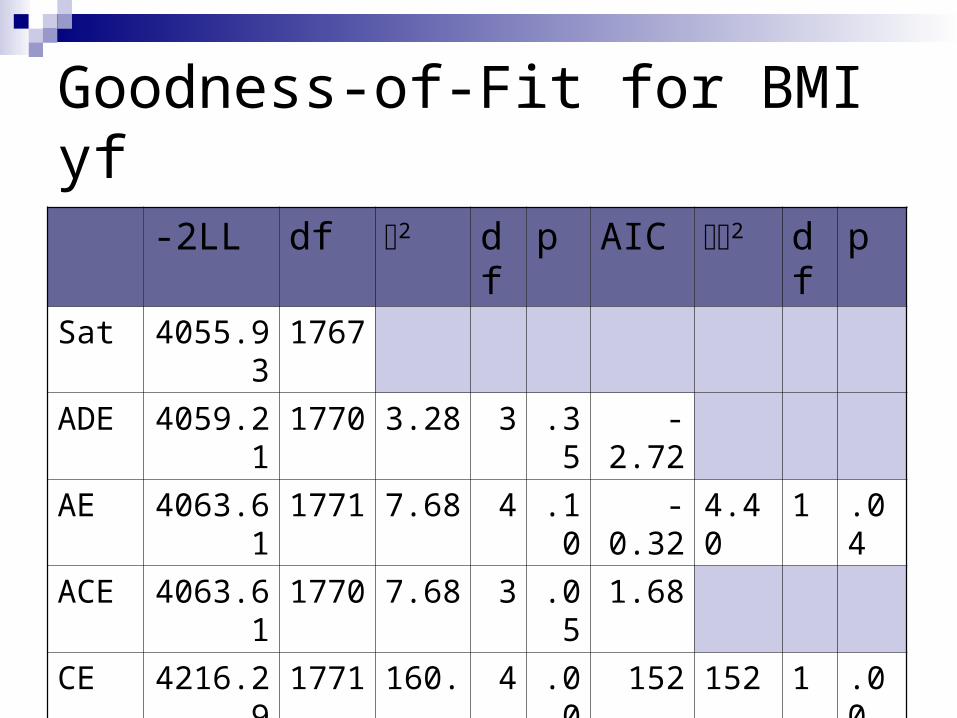
Goodness-of-Fit for BMI yf
-2LL df 2 df p AIC 2 df p
Sat 4055.93 1767
ADE 4059.21 1770 3.28 3 .35 -2.72
AE 4063.61 1771 7.68 4 .10 -0.32 4.40 1 .04
ACE 4063.61 1770 7.68 3 .05 1.68
CE 4216.29 1771 160. 4 .00 152 152 1 .00
E 4585.59 1772 529. 5 .00 519 521 2 .00
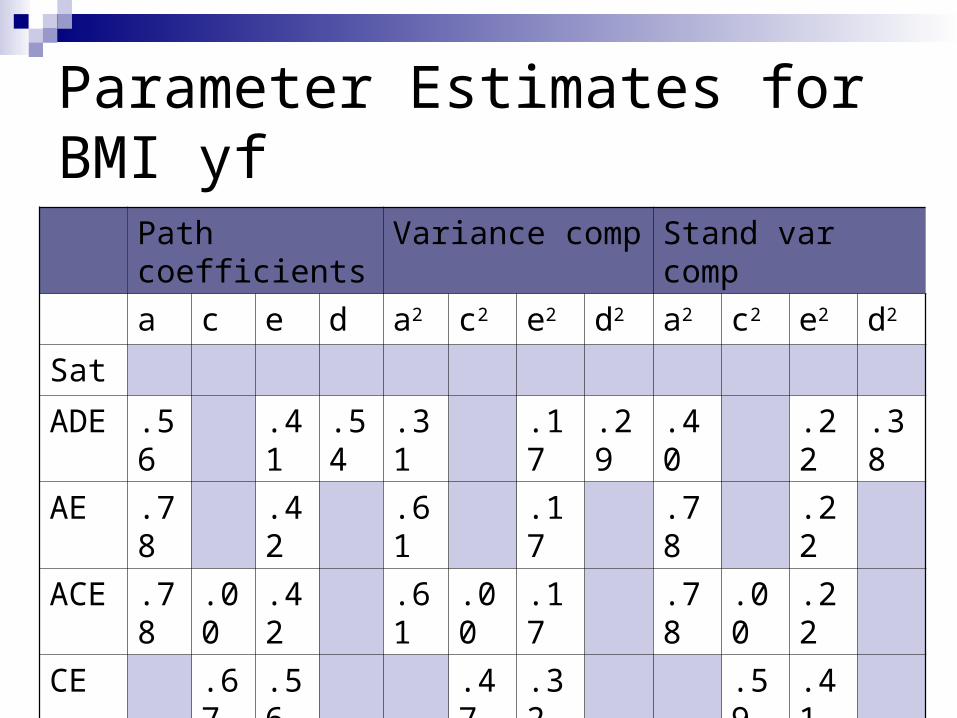
Parameter Estimates for BMI yf
Path coefficients Variance comp Stand var comp
a c e d a2 c2 e2 d2 a2 c2 e2 d2
Sat
ADE .56 .41 .54 .31 .17 .29 .40 .22 .38
AE .78 .42 .61 .17 .78 .22
ACE .78 .00 .42 .61 .00 .17 .78 .00 .22
CE .67 .56 .47 .32 .59 .41
E .88 .77 1.0