united states department of agriculture feed mill … mill operations of agricultural cooperatives...
TRANSCRIPT

RBS ResearchReport 207
Feed Mill Operations of AgriculturalCooperatives
United StatesDepartment ofAgriculture

Abstract This report analyzes the feed mill operations of over 200 farm supply and marketingcooperatives. They were surveyed about their 2004 feed mill ownership, production,type of feed produced, method of sales, and feed form. The cooperatives were alsoasked what animal types they produced feed for and how the feed was sold.Questions asked were similar to ones used in 1984, 1975, 1969, and 1959 surveys.The data was also sorted into 10 standard U.S. farm production regions and 7 feed millsizes.
Key words: Cooperatives, feed mills, feed production, feed type, and feed sales.
Feed Mill Operations of Agricultural Cooperatives
E. Eldon Eversull
Research Report 207
September 2005

Preface This report studied 2004 cooperative feed mill production and compared and contrast-ed this production with production reported in prior studies conducted in 1984, 1975,1969, and 1959. Cooperatives included in the study were chosen because they hadfeed sales of over $500,000. Surveys were sent to 646 cooperatives, with over 200usable surveys returned. Estimates for non-respondents were made based on priorresponses and published information. The study also focused on regional and feed millsize differences.
While this study is not a comprehensive census of all cooperative feed manufacturers,the information presented is comparable to the prior studies and can be used by coop-erative managers and boards of directors as a basis for comparing trends in feed salesin their region and by size of feed mill. The author thanks the cooperatives that partici-pated in this study.
i

Contents Highlights . . . . . . . . . . . . . . . . . . . . . . . . . . . . . . . . . . . . . . . . . . . . . . . . . . . . . . . . . . .iii
Survey . . . . . . . . . . . . . . . . . . . . . . . . . . . . . . . . . . . . . . . . . . . . . . . . . . . . . . . . . . . . . .1
Feed Operations . . . . . . . . . . . . . . . . . . . . . . . . . . . . . . . . . . . . . . . . . . . . . . . . . . . . . .1
All Respondents . . . . . . . . . . . . . . . . . . . . . . . . . . . . . . . . . . . . . . . . . . . . . . . . . . . . . . .3
Summary . . . . . . . . . . . . . . . . . . . . . . . . . . . . . . . . . . . . . . . . . . . . . . . . . . . . . . . . . . .10
Bibliography . . . . . . . . . . . . . . . . . . . . . . . . . . . . . . . . . . . . . . . . . . . . . . . . . . . . . . . . .12
ii

Highlights Feed operations of 220 agricultural cooperatives were analyzed in this report. Thecooperatives provided information about their sales, feed mill ownership, production,type of feed produced, method of sales, and feed form. They also provided informationon what animal types the feed was produced for and how the feed was sold.Information collected was expanded for non-respondents and compared to prior sur-veys conducted in 1984, 1975, 1969, and 1959.
Respondent cooperatives comprised about a third of all cooperatives that have over$500,000 in feed sales. The survey found:
l The Corn Belt and Lake States have a combined 80 percent of respondentcooperative feed production.
l Complete feed is produced 83 percent of the time; supplement, 12 percent;and premix, 5 percent.
l Feed was sold in bulk for 90 percent of feed sales and in bags for 10 percent.
l Meal was the most common feed type (72 percent), with pellets second at 14percent, followed by coarse-textured (11 percent), liquid (2 percent), and cubesand blocks (1 and 0.4 percent, respectively).
l Hog feed, at 53 percent, was most often produced, while dairy feed comprised17 percent of production and beef comprised 14 percent.
l Over half of the feed produced was sold at retail; 17 percent, wholesale; 15percent, custom grind and mix; 9 percent custom fed to others’ animals; and 6percent fed to animals owned by the respondent cooperative.
There have been a number of changes in feed mill operations as six major regionalcooperatives have ceased operations and one has converted to an investor-ownedfirm. There have been regional shifts in livestock production and farmer-owned ethanolplants have made distiller’s grains widely available for livestock feed.
iii

Feed Mill Operations of AgriculturalCooperatives
E. Eldon EversullRural Development
Agricultural cooperatives sold about $7 billion infeed in 2004, more than double the sales reported inthe 1984 feed study. This report is the fifth in a series ofstudies of cooperative feed mills; the prior studieswere conducted in 1984, 1975, 1969, and 1959. Theprior studies were a census of all U.S. feed manufac-turers and were conducted in a partnership withanother USDA agency, the Economic Research Service.
Many changes have occurred in the past 20 yearsfor cooperative feed manufacturers. Six of the majorcooperative feed manufacturers no longer exist. Theirmanufacturing facilities have not been lost though.Prior to these cooperatives ceasing operations,alliances were developed with other cooperatives toincorporate most of the feed mills into existing cooper-atives. This trend continued until one cooperativebecame the leading cooperative feed manufacturer.This same cooperative purchased a major investor-owned feed manufacturer and has become the largestU.S. feed manufacturer. Also, one large cooperativefeed manufacturer converted to an investor-ownedfirm.
So, the more than doubling in the dollar amountof feed sales for cooperatives over the last 20 years is acombination of business expansion, purchase of aninvestor-owned feed manufacturing firm, andincreased ingredient costs, minus the loss of the coop-erative that converted to an investor-owned firm andother such changes. In the prior studies, cooperativeshad a market share of 20 to 22 percent of feed pro-duced. However, with the dramatic growth in sales,cooperative market share for feed has probably alsogrown.
Survey
The 2004 survey was designed to be comparablewith the prior studies. The survey was much simplerthan prior surveys, with the survey instrument consist-ing of seven questions on one page. The surveyfocused on: ownership type (cooperative, LLC, jointventure, or other); type of feed sold (complete, supple-ment, and premix); how feed was sold (bag or bulk);the feed form (meal, coarse-textured, pellets, cubes,blocks, or liquid); and animal types (hog, beef, dairy,sheep/goat, broiler, starter-grower/layer-breeder,turkey, horse, aquaculture, pet, and other). The finalquestion asked whether feed sales were wholesale,retail, fed to own animals, custom-fed to others’ ani-mals, or custom grind and mix for others.
The survey was sent to 646 cooperatives that hadat least $500,000 in feed sales in any of the prior 5years. There are many more cooperatives with feedsales, but it was expected that few with sales less than$500,000 had either feed mills or the resources avail-able to respond to the survey. Almost 300 surveys werereturned, although about 70 were returned incompleteor blank and not used in this study. Of the 70, 15 con-firmed that they did not have a feed mill. So, with 220usable surveys or about 33 percent of those sent, datawas analyzed based on those returned while data fromnon-respondents is based on their prior responses toour surveys and other information gathered over thelast 20 years.
1

Feed Operations
Since the last study there have been numerouschanges in the feed industry. Hog production contin-ues toward concentration in larger growers and verti-cal integration among feed production, hog produc-tion, and meat packers. Hog production has also seenmovement from traditional production areas of theCorn Belt, Lake States, and Northern Plains to theAppalachian, Southeast, and Mountain states due topollution and odor issues. Global markets haveopened the U.S. borders to meats produced overseas.Bovine spongiform encephalopathy (BSE), or mad cowdisease, has closed the U.S. borders several times toimportation of live animals and has impacted exportmarkets. Avian flu has had large impacts on foreignproduction and could become a domestic concern.And, the large increase in ethanol production hasmade the byproduct, distiller’s grain, a competitivealternative to traditional feed production.
Feed Mill ProductionEstimated and actual cooperative feed mill pro-
duction for 2004 and prior studies is presented in table
1. Feed production is up about 16 percent from 1984 to2004. Feed production is up especially in the Corn Belt,Pacific, and Lake States. The Corn Belt, with 36 percentof cooperative production, and Lake States, with 28percent, remain the top production regions. Much ofthis increase in production is due to the acquisition ofan investor-owned feed manufacturer by a coopera-tive.
Information in this section includes estimates ofnonrespondent feed production. This information isbased on previous USDA surveys and from other pub-lished information—often from press releases andother sources within the cooperatives themselveswhen new acquisitions or combinations have beenmade.
The survey did not ask for feed sales by State orregion. Instead, feed sales by State from RBS’s annualsurvey of cooperatives, feed sales from prior surveys,and knowledge of cooperative feed mill locations wereused to allocate feed production to States. Allocationof feed production by this method may mean over- orunder-estimates, but the scope of the study was nar-rowed so that respondents were not unduly burdenedwith a complicated survey instrument. Most coopera-tives produce and sell feed in one State, so allocation
2
Table 1—Cooperative feed mill production, 2004, 1984, 1975, and 1969
2004 1984 1975 1969
Feed Percent Feed Percent Feed Percent Feed PercentRegion 1 produced 2 of total produced of total produced of total produced of total
1,000 tons Percent 1,000 tons Percent 1,000 tons Percent 1,000 tons Percent
Northeast 676.6 2.47 2,846.5 11.93 2,871.5 14.02 3,231.6 15.57Lake States 7,584.4 27.64 4,868.0 20.41 4,660.9 22.75 3,776.4 18.19Corn Belt 9,996.5 36.44 5,184.9 21.73 4,750.4 23.19 6,146.1 29.60Northern Plains 2,180.6 7.95 1,973.3 8.27 2,203.8 10.76 2,060.5 9.92Appalachian 1,491.7 5.44 2,025.3 8.49 1,034.0 5.05 1,080.5 5.20
Southeast 666.9 2.43 3,642.5 15.27 1,454.4 7.10 1,205.5 5.81Delta 91.9 0.33 570.2 2.39 1,005.7 4.91 705.3 3.40Southern Plains 93.7 0.34 1,365.0 5.72 513.6 2.51 657.8 3.17Mountain 847.2 3.09 929.0 3.89 541.6 2.64 462.1 2.23Pacific 3,805.4 13.87 452.1 1.90 1,450.2 7.08 1,435.3 6.91
———— ———— ———— ———— ———— ———— ———— ————U.S. 27,435.0 100.00 23,856.8 100.00 20,486.1 100.00 20,761.1 100.00
1 Standard farm production regions used, Northeast: ME, NH, VT, NY, MA, RI, CT, PA, NJ, DE, MD, and DC. Lake States: MI, WI, and MN.Corn Belt: OH, IN, IL, IA, and MO. Northern Plains: ND, SD, NE, and KS. Appalachian: VA, WV, KY, TN, and NC. Southeast: SC, GA, AL,and FL. Delta States: MS, LA, and AR. Southern Plains: OK and TX. Mountain: MT, ID, WY, CO, UT, NV, AZ, and NM. Pacific: WA, OR, CA,HI, and AK.
2 Feed produced was expanded to include both survey respondents and nonrespondents. Respondents comprised 7,532 thousand tons outof the total of 27,435 thousand tons.

of feed production is generally simple except for thehandful of cooperative feed manufacturers that havemulti-state operations.
All Respondents
All further analysis in this study will mainly dis-cuss respondents to the 2004 and 1984 feed mill sur-veys. Table 2 shows feed production by region andfeed mill size. As in 1984, the Corn Belt had the highestconcentration of cooperative feed mills and feed pro-duction. Over half of all feed production occurred inthe Corn Belt and over one-third of the feed mills werelocated in this region. The Lake States again had thesecond highest production and number of feed mills.Significant changes occurred in the Northeast, where acooperative ceased operations and in the Southeast,where a cooperative converted to an investor-ownedfirm.
By feed mill size, most respondents in 2004 and1984 had feed mills that produced from 1,000 to 9,999tons per year. Only 56 feed mills had production ofover 100,000 tons per year, yet they produced 53 per-cent of the total.
Average ProductionAverage feed mill production in 2004 was almost
double the production of 1984 (table 3). Part of theincrease in production was probably due to the factthat the survey was sent to cooperatives whose feedsales were at least $500,000. Average feed mill produc-tion was about double in the Lake States, Corn Belt,Northern Plains, and Appalachian regions. The otherregions had smaller average feed mill production than1984, and in the case of the Pacific region, considerablysmaller. Questions about capacity utilization were notasked in the current survey, but 16 respondents pro-vided this information and overall capacity utilizationwas 56 percent. Capacity utilization was 70 percent in1984. Feed mill production peaked with an average of216,042 tons per year for the largest feed mills.
For products other than feed, there have beensome ownership changes in the cooperative communi-ty where some cooperatives have joined together toown facilities through joint ventures or limited liabilitycompanies (LLCs). This survey found that less than 1percent of the respondents had some alternative formof feed mill ownership. The Lake States, Corn Belt, andNorthern Plains all had one respondent that owned afeed mill with another cooperative(s) through an LLC.
3
Table 2—Respondent feed production by region and by feed mill size, 2004 and 1984
2004 1984 2004 1984
Feed Feed Feed Feed Feed Feed Feed Feedproduction mills production mills production mills production mills
Percent Number Percent Number Percent Number Percent Number
Region Feed Mill Tons/Year Northeast 0.59 4 11.93 212 <999 0.06 9 0.10 77Lake States 25.31 84 20.41 411 1,000 to 9,999 4.79 99 10.96 737Corn Belt 54.59 135 21.73 585 10,000 to 24,999 7.69 54 17.32 547Northern Plains 9.20 64 8.27 344 25,000 to 49,999 18.87 67 17.11 247Appalachian 5.94 11 8.49 113 50,000 to 74,999 10.58 33 16.71 129
Southeast 1.33 3 15.27 77 75,000 to 99,999 5.35 11 6.93 54Delta 1.01 10 2.39 28 100,000+ 52.65 56 30.87 122Southern Plains 1.20 6 5.72 60Mountain 0.76 10 3.89 51Pacific 0.05 2 1.90 32
All 100.00 329 100.00 1,913 All 100.00 329 100.00 1,913
1,000 tons 1,000 tons
Total sales 7,796.1 23,856.8

Complete, Supplement, or PremixFormula feed is produced according to exacting
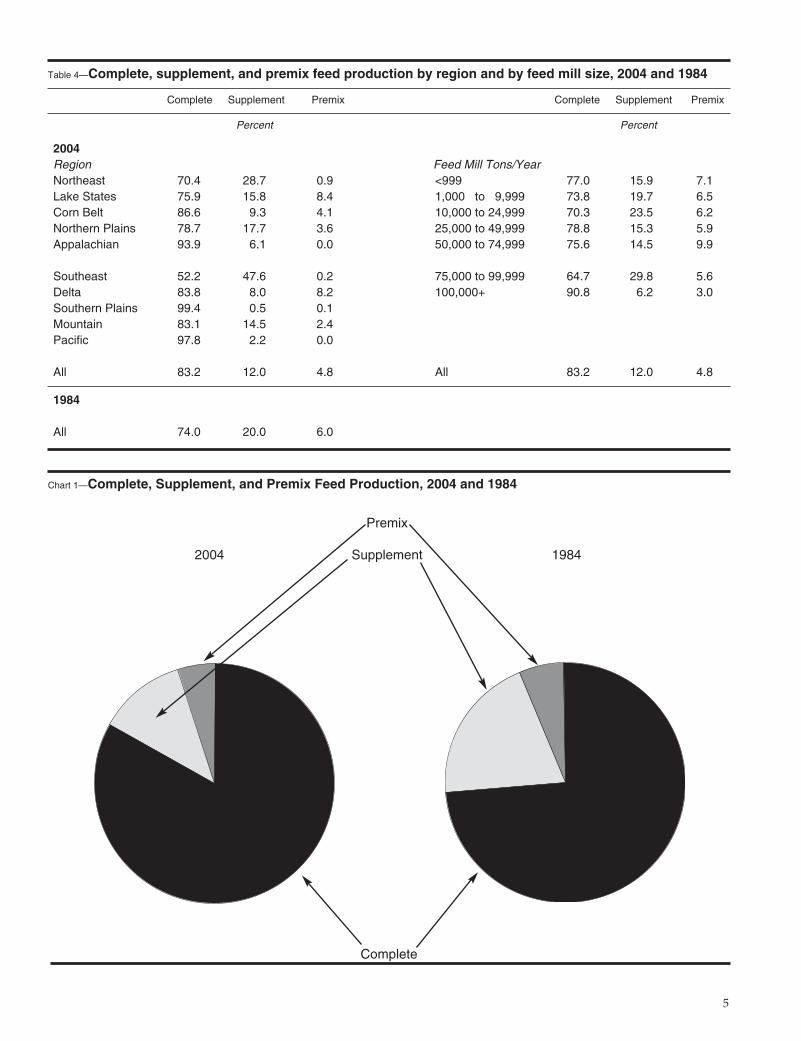
specifications to satisfy different animal groups’ physi-ological and environmental needs. Feed production isusually classified further into specific feed types. Thetypes used in this report are complete, supplement,and premix. 1 In table 4, feed production is presentedby type of feed, region, and size of feed mill.
Comparing 2004 to 1984, by region, completefeed production rose about the same amount as sup-plement feed fell. Complete feed production increasedgreatly over the 1984 average in all but the Northeast,Lake States and Southeast. From 1984 to 2004, com-plete feed production increased while supplementdecreased (chart 1).
By feed mill size, mills producing from less than999 tons to 74,999 tons annually had fairly similar pro-duction ratios from 1984 to 2004, with complete feedabout 70 to 79 percent of production. Feed mills pro-ducing from 75,000 to 99,999 tons produced more sup-plement feed (30 percent) and less complete feed (65percent). Production at feed mills with a volume ofover 100,000 tons also differed from the average—theyproduced over 90 percent complete feed and only 6percent supplement.
Bag or BulkFeed production is sold by the bag or in bulk. Bag
sales are usually to smaller accounts, either deliveredor picked up by the customer. Bulk sales are usuallydelivered to the customer and unloaded into their stor-age bins. By region, 11 percent of feed production wassold in bags, with the remainder, 89 percent, sold inbulk (table 5). Especially noticeable were deviationsfrom the average bag sales occurring in Northeast,Appalachian, Southern Plains, and Pacific regions. In1969, bag feed sales were more popular, comprising 26percent of total cooperative sales (chart 2).
Bag sales were used over half the time for feedmills with less than 999 tons of production. Bulk salesgenerally increased as feed mill size increased, peakingat 93 percent of sales for feed mills with over 100,000-ton production.
Feed TypeIn 1984, the use of pellet feed had increased
greatly from prior studies to just about half of feedproduction. Pellet feed included crumbles in 1984,while the 2004 survey asked for pellet feed alone andthe category “coarse-textured” was added.Respondents in 2004 had dropped pellet feed to 14percent of total production while meal was 72 percentand coarse-textured 11 percent (table 6). This comparesto 49 percent meal in 1984 and 47 percent pellets (chart3). Much of this drop in pellet feed is probably due toseveral of the larger cooperative feed manufacturers
4
Table 3—Average feed mill production by region and by feed mill size, 2004 and 1984
2004 1984 2004
Average feed Average feed Average feedmill production mill production mill production
Tons/year Tons/year
Region Feed Mill Tons/Year Northeast 11,506 13,427 <999 517Lake States 23,493 11,844 1,000 to 9,999 4,557Corn Belt 31,526 8,863 10,000 to 24,999 15,376Northern Plains 11,208 5,736 25,000 to 49,999 34,221Appalachian 42,095 17,923 50,000 to 74,999 58,934
Southeast 34,671 47,305 75,000 to 99,999 83,355Delta 7,895 20,364 100,000+ 216,042Southern Plains 15,594 22,750Mountain 5,959 18,216Pacific 2,123 14,128
All 23,696 12,471 All 23,696
1 There are both primary and secondary feed manufacturing.Primary feed manufacturing is further classified into complete,supplement, super concentrate, and premix. For definitions ofthese terms, please see [Brainich and Eversull].
5
Table 4—Complete, supplement, and premix feed production by region and by feed mill size, 2004 and 1984
Complete Supplement Premix Complete Supplement Premix
Percent Percent
2004Region Feed Mill Tons/YearNortheast 70.4 28.7 0.9 <999 77.0 15.9 7.1Lake States 75.9 15.8 8.4 1,000 to 9,999 73.8 19.7 6.5Corn Belt 86.6 9.3 4.1 10,000 to 24,999 70.3 23.5 6.2Northern Plains 78.7 17.7 3.6 25,000 to 49,999 78.8 15.3 5.9Appalachian 93.9 6.1 0.0 50,000 to 74,999 75.6 14.5 9.9
Southeast 52.2 47.6 0.2 75,000 to 99,999 64.7 29.8 5.6Delta 83.8 8.0 8.2 100,000+ 90.8 6.2 3.0Southern Plains 99.4 0.5 0.1Mountain 83.1 14.5 2.4Pacific 97.8 2.2 0.0
All 83.2 12.0 4.8 All 83.2 12.0 4.8
1984
All 74.0 20.0 6.0
Chart 1—Complete, Supplement, and Premix Feed Production, 2004 and 1984
Premix
2004 Supplement 1984
Complete

6
Table 5—Bag and bulk feed production by region and by feed mill size, 2004
Bag Bulk Bag Bulk
--------------Percent-------------- --------------Percent--------------
Region Feed Mill Tons/YearNortheast 21.6 78.4 <999 51.3 48.7Lake States 9.5 90.5 1,000 to 9,999 29.2 70.8Corn Belt 6.8 93.2 10,000 to 24,999 14.9 85.1Northern Plains 10.1 89.9 25,000 to 49,999 9.0 91.0Appalachian 33.1 66.9 50,000 to 74,999 18.2 81.8
Southeast 4.1 95.9 75,000 to 99,999 7.9 92.1Delta 31.5 68.5 100,000+ 7.3 92.7Southern Plains 63.6 36.4Mountain 19.3 80.7Pacific 56.9 43.1
All 10.5 89.5 All 10.5 89.5
Chart 2—Bag and Bulk Feed Production, 2004 and 1969
Bag
2004 1969
Bulk

7
Table 6—Feed production by region and by feed mill size, 2004 and 1984
Coarse-Item Meal textured Pellets1 Cubes Blocks Liquid
Percent
Region, 2004
Northeast 51.2 33.6 14.0 0.0 0.6 0.6
Lake States 74.5 10.6 12.6 0.2 0.3 1.8
Corn Belt 81.5 6.8 9.9 0.4 0.3 1.2
Northern Plains 63.7 16.1 13.9 4.0 1.0 1.3
Appalachian 31.6 24.3 41.6 1.4 1.0 0.0
Southeast 1.1 6.7 91.9 0.2 0.1 0.0
Delta 23.0 25.9 46.1 5.1 0.0 0.0
Southern Plains 9.3 49.8 9.6 26.9 0.9 3.5
Mountain 11.8 37.4 3.3 2.3 2.3 42.9
Pacific 4.3 70.1 25.6 0.0 0.0 0.0
All 71.9 10.8 14.3 1.1 0.4 1.6
Region, 1984Northeast 46.6 n.a. 53.1 0.0 0.0 0.2
Lake States 73.2 n.a. 25.8 0.4 0.1 0.4
Corn Belt 53.4 n.a. 42.7 2.5 1.1 0.3
Northern Plains 57.3 n.a. 32.3 7.5 2.1 0.8
Appalachian 19.8 n.a. 76.3 0.8 2.8 0.3
Southeast 46.1 n.a. 53.7 0.1 0.0 0.2
Delta 23.4 n.a. 70.6 6.0 0.0 0.0
Southern Plains 34.4 n.a. 50.2 13.5 1.7 0.3
Mountain 68.7 n.a. 18.1 7.7 2.9 2.6
Pacific 43.2 n.a. 56.5 0.3 0.0 0.0
All 49.4 n.a. 47.1 2.2 0.9 0.4
Feed Mill Tons/Year, 2004<999 46.4 43.4 5.0 0.0 0.3 5.0
1,000 to 9,999 44.7 31.9 14.1 3.9 2.6 2.9
10,000 to 24,999 71.1 19.6 6.3 1.3 0.3 1.4
25,000 to 49,999 69.4 14.2 10.9 1.4 0.7 3.4
50,000 to 74,999 71.1 18.9 5.4 2.5 0.3 1.8
75,000 to 99,999 42.8 22.0 31.9 0.0 0.4 2.9
100,000+ 78.4 3.6 16.6 0.5 0.2 0.7
All 71.9 10.8 14.3 1.1 0.4 1.6
1 Pellets included pellets and crumbles in 1984.n.a. = Category not asked in 1984.

not responding to the survey. Meal productionincreased in the Corn Belt, while pellets increased inthe Southeast.
Feed mills with less than 999 tons of productionmade about equal amounts of meal and coarse-tex-tured feed. They also made the most liquid feed. Feedmills with 10,000 tons to 74,999 tons of productionmade about the average amount of meal feed, 70 per-cent. Feed mills with 75,000 to 99,999 tons of produc-tion made the most pellet feed (32 percent).
Animal TypeHog feed was most often (53 percent) produced
by the respondents, while dairy feed was the most-produced feed in the 1984 survey (table 7). Hog feedwas the highest-produced feed in the Lake States, CornBelt, Northern Plains, and Mountain regions whilebeef feed was the most-produced feed in the SouthernPlains and Pacific regions. Dairy feed was the most-often-produced feed in the Northeast, Appalachian,Southeast, and Delta regions. Added to the 2004 sur-vey were three new animal types—sheep/goat, aqua-culture, and pets. In total, the three new animal typesaccounted for about 1.5 percent of cooperative feedproduction.
Hog feed was the most-often-produced feed in2004, while dairy was in 1984 (chart 4). Dairy feed
moved to second place in 2004, and beef remainedthird. Broiler feed fell from 5th most-produced in 1984to 6th in 2004.
Hog feed was the most-often-produced feed forthose feed mills with annual production from 25,000tons per year to over 100,000 tons. Feed mills produc-ing between less than 999 tons per year and 9,999 tonsfocused on beef feed. Feed mills producing between10,000 tons per year and 24,999 were about evenly splitbetween hog and dairy feeds.
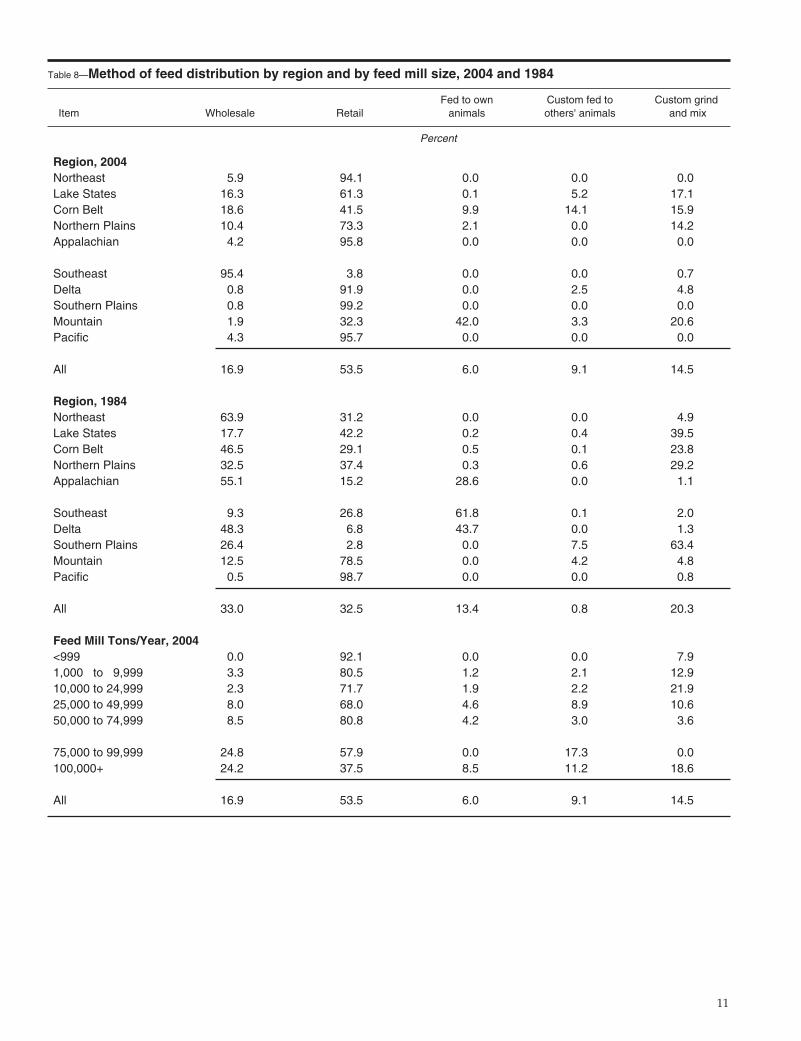
Feed DistributionBy a large margin, respondent cooperatives dis-
tributed the feed they produced through retail sales(table 8). This is very different from the distributionpattern found in 1984, in which wholesale sales andretail sales were about equally used. Again, severallarge cooperatives that did not respond to this surveyhave feed sales that are known to be heavily weightedtoward wholesale sales and thus may have skewedsurvey results.
Retail sales increased by about 20 percentagepoints over 1984, while wholesale sales dropped aboutthe same amount. At 17 percent, wholesale sales werestill much smaller than those in 1984 (chart 5). Customgrind and mix dropped 6 percentage points as didfeeding to own animals; while feeding to others’ ani-
8
Chart 3— Feed Production, 2004 and 1984
Percent
80
60
40
20
0meal coarse pellets cubes blocks liquid
textured
2004
1984

9
Tab
le 7
—C
oo
per
ativ
e fe
ed p
rod
uct
ion
by
anim
al t
ype,
reg
ion
, an
d f
eed
mill
siz
e, 2
004
and
198
4
She
ep/
Sta
rter
-gro
wer
/Ite
mH
ogB
eef1
Dai
rygo
at1
Bro
iler
laye
r-br
eede
rT
urke
yH
orse
Aqu
acul
ture
Pet
Oth
er
Per
cent
Reg
ion
, 200
4N
orth
east
2.3
6.0
80.3
2.8
0.0
1.2
0.0
3.1
0.0
1.7
2.6
Lake
Sta
tes
49.9
6.0
30.9
0.5
0.5
2.1
7.3
2.0
0.0
0.7
0.2
Cor
n B
elt
67.5
10.9
6.0
0.8
2.0
10.4
0.7
0.9
0.0
0.3
0.5
Nor
ther
n P
lain
s39
.432
.410
.61.
83.
06.
12.
12.
10.
01.
21.
4A
ppal
achi
an2.
230
.741
.91.
70.
43.
20.
013
.10.
00.
66.
1
Sou
thea
st0.
141
.457
.20.
00.
00.
00.
01.
00.
00.
00.
2D
elta
3.2
36.4
49.5
0.1
0.2
1.9
0.0
7.0
0.0
1.5
0.2
Sou
ther
n P
lain
s4.
066
.811
.00.
42.
90.
50.
010
.40.
10.
33.
7M
ount
ain
18.4
15.3
13.8
1.6
0.8
0.4
0.3
6.2
0.1
0.7
42.4
Pac
ific
17.8
23.8
0.0
34.9
0.0
4.3
0.0
15.0
0.0
4.3
0.0
All
53.4
14.2
16.5
0.9
1.6
7.0
2.4
2.3
0.0
0.5
1.2
Reg
ion
, 198
4N
orth
east
3.2
3.2
61.7
n.a.
0.9
20.3
2.4
5.6
n.a.
n.a.
2.7
Lake
Sta
tes
21.6
4.7
61.0
n.a.
0.2
7.8
2.0
0.8
n.a.
n.a.
2.0
Cor
n B
elt
47.6
12.1
22.1
n.a.
0.4
3.8
2.4
1.1
n.a.
n.a.
10.4
Nor
ther
n P
lain
s31
.450
.711
.3n.
a.0.
83.
90.
30.
9n.
a.n.
a.0.
8A
ppal
achi
an9.
85.
139
.4n.
a.7.
010
.320
.33.
6n.
a.n.
a.4.
5
Sou
thea
st3.
51.
131
.6n.
a.38
.222
.21.
80.
4n.
a.n.
a.1.
3D
elta
2.5
21.1
25.2
n.a.
30.6
8.6
0.0
3.6
n.a.
n.a.
8.4
Sou
ther
n P
lain
s7.
356
.225
.3n.
a.0.
04.
40.
03.
1n.
a.n.
a.3.
6M
ount
ain
8.7
33.4
32.7
n.a.
0.9
1.1
18.1
1.5
n.a.
n.a.
3.6
Pac
ific
0.9
17.3
74.5
n.a.
0.1
3.8
0.0
0.1
n.a.
n.a.
3.4
All
18.0
12.4
38.2
n.a.
9.6
11.1
4.6
1.9
n.a.
n.a.
4.2
Fee
d M
ill T
on
s/Y
ear,
200
4<
999
7.0
61.1
15.4
1.5
0.2
2.2
0.0
9.6
0.2
1.9
0.7
1,00
0 t
o 9
,999
22.1
38.0
23.1
2.2
0.8
1.7
0.8
8.2
0.1
2.3
0.6
10,0
00 to
24,
999
31.1
21.4
36.9
2.1
0.7
2.7
0.3
3.5
0.0
0.8
0.6
25,0
00 to
49,
999
54.4
12.7
21.6
1.1
1.0
3.1
1.0
2.1
0.0
0.8
2.4
50,0
00 to
74,
999
45.7
14.3
25.4
0.7
1.0
8.7
1.2
2.3
0.0
0.2
0.4
75,0
00 to
99,
999
42.0
18.1
36.7
0.4
0.2
0.4
0.2
1.5
0.0
0.6
0.0
100,
000+
61.7
11.1
7.5
0.6
2.3
9.8
3.9
1.7
0.0
0.3
1.2
All
53.4
14.2
16.5
0.9
1.6
7.0
2.4
2.3
0.0
0.5
1.2
1B
eef a
nd s
heep
wer
e co
mbi
ned
in 1
984,
n.a
. = n
ot a
vaila
ble.

mals grew by almost 9 percentage points. Retail saleswere used at least 90 percent of the time in theNortheast, Appalachian, Delta, Southern Plains, andPacific regions.
Feed mills with production of less than 999 tonsper year almost exclusively used retail sales. Feedmills producing from 75,000 to over 100,000 tons peryear used wholesale sales about 24 percent of the time.These same feed mills also custom-fed their feed toothers’ animals for over 10 percent of their feed sales.
Summary
There have been a number of changes since thelast cooperative feed survey. Six major regional coop-eratives have ceased operations. However, most oftheir feed facilities have been consolidated into thecooperative system, and feed production continues.One cooperative has become both the largest coopera-tive feed manufacturer and largest U.S. feed manufac-turer. With large numbers of joint ventures or LLCsoccurring in the cooperative system, it was thoughtthat, because feed mills are expensive to build and
operate, there might be a number of feed operationsowned as LLCs or joint ventures. The survey foundonly three cooperative feed facilities owned as LLCs.
Most feed is still sold as complete and in bulkform. Feed sales were heavily weighted towards mealsales and more than half of the feed sold was hog feed.
In the last study 20 years ago, more feed wasbeing fed to livestock owned by the cooperative feedmill. This time, respondent cooperatives were not thelarger cooperatives that are more likely to own live-stock. The rate of feeding to own livestock fell from 13percent to 6 percent overall while the largest feed millsfed about 9 percent of their feed to their own animalsand 11 percent was custom-fed to others’ animals.
Because the survey was not sent to cooperativeswith less than $500,000 in sales, many small feed millswere probably not documented. Although capacitywas not covered by the survey, there appeared to bemore than sufficient feed mill capacity, with excesscapacity more than likely. Some animal production hasmoved out of regions with surplus corn and soybeanproduction to areas where animal production odor andpollution were not large concerns. Ethanol plants werealso changing feed production, with their byproductsreadily available as a feed source in a number ofregions.
10
Chart 3— Feed Production by Animal Types, 2004 and 1984
Percent
60
40
20
0hog dairy beef layer horse
2004
1984
11
Table 8—Method of feed distribution by region and by feed mill size, 2004 and 1984
Fed to own Custom fed to Custom grindItem Wholesale Retail animals others' animals and mix
Percent
Region, 2004Northeast 5.9 94.1 0.0 0.0 0.0Lake States 16.3 61.3 0.1 5.2 17.1Corn Belt 18.6 41.5 9.9 14.1 15.9Northern Plains 10.4 73.3 2.1 0.0 14.2Appalachian 4.2 95.8 0.0 0.0 0.0
Southeast 95.4 3.8 0.0 0.0 0.7Delta 0.8 91.9 0.0 2.5 4.8Southern Plains 0.8 99.2 0.0 0.0 0.0Mountain 1.9 32.3 42.0 3.3 20.6Pacific 4.3 95.7 0.0 0.0 0.0
All 16.9 53.5 6.0 9.1 14.5
Region, 1984Northeast 63.9 31.2 0.0 0.0 4.9Lake States 17.7 42.2 0.2 0.4 39.5Corn Belt 46.5 29.1 0.5 0.1 23.8Northern Plains 32.5 37.4 0.3 0.6 29.2Appalachian 55.1 15.2 28.6 0.0 1.1
Southeast 9.3 26.8 61.8 0.1 2.0Delta 48.3 6.8 43.7 0.0 1.3Southern Plains 26.4 2.8 0.0 7.5 63.4Mountain 12.5 78.5 0.0 4.2 4.8Pacific 0.5 98.7 0.0 0.0 0.8
All 33.0 32.5 13.4 0.8 20.3
Feed Mill Tons/Year, 2004<999 0.0 92.1 0.0 0.0 7.91,000 to 9,999 3.3 80.5 1.2 2.1 12.910,000 to 24,999 2.3 71.7 1.9 2.2 21.925,000 to 49,999 8.0 68.0 4.6 8.9 10.650,000 to 74,999 8.5 80.8 4.2 3.0 3.6
75,000 to 99,999 24.8 57.9 0.0 17.3 0.0100,000+ 24.2 37.5 8.5 11.2 18.6
All 16.9 53.5 6.0 9.1 14.5

BibliographyBrainich, Eric, and E. Eldon Eversull, Feed
Manufacturing by Cooperatives, U.S. Department ofAgriculture, Rural Business-Cooperative Service,RR 89, April 1990.
Gessner, Anne L., Integrated Feed Operations ThroughFarmer Cooperatives, U.S. Department of Agriculture,Farmer Cooperative Service, GR 100, April 1962.
Mather, J. Warren and John M. Bailey, CooperativesPosition in Feed Manufacturing, U.S. Department ofAgriculture, Farmer Cooperative Service, RR 25,November 1973.
Vosloh, Carl J. Jr., Structure of the Feed ManufacturingIndustry, 1975, U.S. Department of Agriculture,Economics, Statistics, and Cooperative Service, SB596, 1978.
12
Chart 5— Feed Distribution, 2004 and 1984
Percent
60
40
20
0
wholesale retail fed to own custom fed custom grindanimals to others’ and mix
animals
2004
1984

U.S. Department of AgricultureRural Business–Cooperative Service
Stop 3250
Washington, D.C. 20250-3250
Rural Business–Cooperative Service (RBS) provides research,
management, and educational assistance to cooperatives to
strengthen the economic position of farmers and other rural
residents. It works directly with cooperative leaders and
Federal and State agencies to improve organization,
leadership, and operation of cooperatives and to give guidance
to further development.
The cooperative segment of RBS (1) helps farmers and other
rural residents develop cooperatives to obtain supplies and
services at lower cost and to get better prices for products they
sell; (2) advises rural residents on developing existing
resources through cooperative action to enhance rural living;
(3) helps cooperatives improve services and operating
efficiency; (4) informs members, directors, employees, and the
public on how cooperatives work and benefit their members
and their communities; and (5) encourages international
cooperative programs. RBS also publishes research and
educational materials and issues Rural Cooperatives magazine.
The U.S. Department of Agriculture (USDA) prohibits discrimi-
nation in all its programs and activities on the basis of race,
color, national origin, age, disability, and where applicable, sex,
marital status, familial status, parental status, religion, sexual
orientation, genetic information, political beliefs, reprisal, or
because all or a part of an individual's income is derived from
any public assistance program. (Not all prohibited bases apply
to all programs.) Persons with disabilities who require alterna-
tive means for communication of program information (Braille,
large print, audiotape, etc.) should contact USDA's TARGET
Center at (202) 720-2600 (voice and TDD).
To file a complaint of discrimination write to USDA, Director,
Office of Civil Rights, 1400 Independence Avenue, S.W.,
Washington, D.C. 20250-9410 or call (800) 795-3272 (voice) or
(202) 720-6382 (TDD). USDA is an equal opportunity provider
and employer.