objectives of mergers among agricultural cooperatives, to
TRANSCRIPT
AN ABSTRACT OF THE THESIS OF
GAIL LATIMER CRAMER for the Ph. D.(Name) (Degree)
in Agricultural Economics presented on October 31, 1967(Major) (Date)
Title: AN ECONOMIC ANALYSIS OF THE MERGER COMPONENT
IN THE GROWTH OF AGRICULTURAL COOPERATIVES
Abstract approved:(Signature)
Leon Garoian
The purpose of this study was to determine the ex ante
objectives of mergers among agricultural cooperatives, to deter-
mine the extent to which these objectives were achieved via merger,
and to identify factors that were instrumental in the success or lack
of success in equatingex ante objectives and ex post merger results.
Also, the impact of mergers on past and future growth of agricul-
tural cooperatives was examined. In order to accomplish these
purposes, it was necessary to sample and interview cooperatives
that had used external growth in past years.
To analyze the objectives and operating results of specific
cooperative mergers, a 10 percent sample was taken of all
cooperatives in the United States that acquired another cooperative
between 1956 and 1960. Cost studies from internal records of the
firms provided the necessary data to analyze actual merger
Redacted for Privacy

accomplishments. Deviations between pre-merger objectives and
post-merger operating results were studied from intensive case
interviews and multiple regression analysis.
Empirical results indicated that all absorbing cooperatives
were motivated to grow by merger to attain economies of size;
however, only 50 percent of the acquiring cooperatives achieved
this objective two years subsequent to merger and only 40 percent
of the sampled cooperatives achieved this objective by their latest
fiscal year (5 to 1Z years after merger). In addition, most acquiring
cooperatives did not increase their rate of return on investment
after merger. However, almost all of the smaller acquired coopera-
tives achieved substantial economies of size and increased their rate
of return to their members considerably after merger.
Acquiring cooperatives that merged to improve member
patron services, to increase barriers to entry, to obtain additional
facilities, or to diversify their operations, generally achieved their
objectives. Acquiring cooperatives that attempted to gain market
or bargaining power failed to attain their objective because of changes
in technology, supply response of producers, and the structure of
the market.
The Farmer Cooperative Service, U. S. D. A., provided
growth data on 434 local and regional cooperatives that used external
growth and on 791 local and regional associations that used strictly

internal growth. A comparison of the average growth rates of
external growth and internal growth locals showed no statistically
significant difference. Conve r s ely, internal growth regionals
grew at a faster average rate than external growth regional coopera-
tives. This was true regardless of whether the comparison was
made between federated, centralized, or mixed type of regional
organization.
External growth accounted for an average of approximately
one-third of the growth of local cooperatives using merger between
1940-1960. However, external growth accounted for only one-eighth
of the growth of regional associations using merger over the same
time period.
Multiple regression analysis suggests that cooperative mer-
gers occur during periods when stock prices (expectations) are high
and during periods when farm income is favorable rather thrn during
depressed periods of economic activity in agriculture as previously
hypothesized. Cooperative merger activity is not closely associated
with the business cycle, nor do cooperative mergers occur when
other business firms are failing.
Markov chains were used to examine the future impact of

merger on the growth of agricultural cooperatives. The Markov
chain analysis showed that agricultural cooperatives have a high
propensity to grow whether they grow internally or externally.
Two policy implications are derived from the study. The
first relates to the need for improved merger planning. The second
relates to antitrust policy. Since most acquired and acquiring
cooperatives are small by any measure of firm size and most
cooperative mergers are occurring on I?competitive fringes" of
oligopolistic markets, there appears to be little need for applying
antimerger legislation to maintain "competitive" markets.

AN ECONOMIC ANALYSIS OF THE MERGERCOMPONENT IN THE GROWTH OF
AGRICULTURAL COOPERATIVES
by
GAIL LATIMER CRAMER
A THESIS
submitted to
OREGON STATE UNIVERSITY
in partial fulfillment ofthe requirements for the
degree of
DOCTOR OF PHILOSOPHY
June 1968
APPROVED:
Profe s sor of Agricultural Economicsin Charge of Major
Head of Agicultural Economics
]ean of Graduate School
Date thesis is presented
Typed by Velda D. Mullins for Gail Latimer Cramer
Redacted for Privacy
Redacted for Privacy
Redacted for Privacy
ACKNOWLEDGMENTS
The author is indebted to many persons who gave unselfishly
of their time in the preparation of this dissertation. In particular,
debts of gratitude are due to:
Dr. Leon Garoian for his role as major professor, con-
structive critic and personal advisor,
Dr. James G. Youde, Clinton B. Reeder, Richard S.
Johnston, and Dr. John A. Edwards for valuable
suggestions and advice in the preparation of the dis-
s ertation,
Mr. David Volkin and Mr. Bruce Swanson of the Farmer
Cooperative Service, U. S. Department of Agricul-
ture, for their assistance in securing important secon-
dary data from their files,
the Department of Agricultural Economics and the Farmer
Cooperative Service, U. S. Department of Agriculture,
for financial assistance in carrying out the research,
my wife, Marilyn Cramer, for constant encouragement,
thoughtfulness, and the sacrifice of her own profession
throughout four years of graduate study.

TABLE OF CONTENTS
I INTRODUCTION 1
The Problem 4The Objectives 8
Definitions 9
II REVIEW OF MERGER LITERATURE 11
Merger Movements in the United States 11Causes of Industrial Mergers 14Success of Mergers 20Review of Cooperative Merger Literature 24
Motivations of Cooperative Mergers 26Cooperative Merger Activity 27
Trend in Cooperative Mergers 28Noncooperatives Acquired by Cooperatives 34
III THEORETICAL FRAMEWORK AND METHODOLOGY 37
Theoretical Framework 37Methodology 45
Sampling Procedure 46Selection of the Time Period 48Data Collection 49Approach to Cost Measurement 50Adjustments in Accounting Data 52
Allocation of Joint Costs 53Depreciation Rates 55Deflation of Costs 55
IV EMPIRICAL RESULTS: FIRM ANALYSIS 58
Survey Results of Ex Ante Growth and MergerObjectives 58
Economies of Size 59Cost Studies 60
Casesl-X 62
V EMPIRICAL RESULTS: AGGREGATE ANALYSIS 102
Economies of Size 102Profitability of Cooperative Mergers 110Service to Member Patrons 115Barriers to Entry 118

TABLE OF CONTENTS (Continued)
Market and Bargaining Power 120Miscellaneous Objectives 127Other Factors Influencing Merger 129
Amount of External Growth Achieved 133Effect of Maintaining Facilities 136Changes in Membership 138Timing of Cooperative Mergers 141
VI IMPACT OF MERGER ON THE GROWTH OF AGRI-CULTURAL COOPERATIVES 154
Data Collection 154External Growth of Agricultural Cooperatives 156Effect of Merger on the Growth Bate 164Future Size Distribution of Cooperatives 172
Markov Chain Process 174Emperical Results 178
Transition Probabilities of LocalCooperatives 180Estimated Number of Local, Cooperatives 184Growth of Regional Cooperatives 186
VII SUMMARY AND CONCLUSIONS 190Cooperative Merger Activity 190Objectives and Operating Results ofCooperative Mergers 193Timing of Cooperative Mergers 199Growth Analysis 200Policy Implications 202Future Research on Mergers 204
BIBLIOGRAPHY 207
APPENDIX A 214.
APPENDIX B 235

LIST OF TABLES
Proportion of total value of various farm products andsupplies handled by agricultural cooperatives, UnitedStates, 1964 3
2 Number of agricultural cooperatives and cooperativememberships, United States, 1960 5
3 Average number of mergers per year among agri-cultural marketing and purchasing cooperatives com-pared to mergers of noncooperatives with agricul-tural cooperatives in the United States by five yearperiods, 1905-1964 29
4 Mergers among agricultural marketing and pur-.chasing cooperatives by commodity types, UnitedStates, 1909-1964 30
5 Mergers by agricultural marketing and purchasingcooperatives by numbers and percent of totalpopulation by type of commodity handled, UnitedStates, 1935-1944, 1945-1954, and 1955-1964 32
6 Mergers of noncooperatives with agricultural mar-keting and purchasing cooperatives by commoditytypes, United States, 1940-1964 35
7 Growth and merger motives of 10 sample acquiringcooperatives, United States, 1956-1960 59
8 Cooperative I. Costs as percent of net sales priorand subsequent to merger, 1954, 1957, and 1965 63
9 Cooperative II. Average packing costs prior andsubsequent to merger, 1955, 1958, and 1965 68
10 Cooperative III. Average packing costs prior andsubsequent to merger, 1958, 1961, and 1963 72
11 Cooperative IV. Average costs of processing milkprior and subsequent to merger, 1956, 1958, and1965 76

LIST OF TABLES (Continued)
12 Cooperative V. Costs as percent of net sales priorand subsequent to merger, 1956, 1958, and 1965 81
13 Cooperative VI. Average costs of processing milkprior and subsequent to merger, 1958, 1961, and1965 86
14 Cooperative VII. Average costs prior and subse-quent to merger, 1956, 1959, and 1965 88
15 Cooperative VIII. Costs as percent of net salesprior and subsequent to merger, 1956, 1959, and1965 92
16 Cooperative IX. Average costs prior and subse-quent to merger, 1957, 1960, and 1966 96
17 Cooperative X. Average costs prior and subse-quent to merger, 1954, 1956, and 1966 97
18 Summary of average variable costs and totalvariable costs as percent of sales of the samplecooperatives prior and subsequent to merger 103
19 Summary of average fixed costs and total fixedcosts as percent of sales of the sample coopera-tives prior and subsequent to merger 104
20 Summary of average total costs and total costsas percent of sales of the sample cooperativesprior and subsequent to merger 105
21 Average and weighted average total costs andtotal costs as percent of sales of the acquired,acquiring, and combined cooperatives prior andsubsequent to merger 109
22 Savings as percent of sales for sample coopera-tives prior and subsequent to merger 112
23 Savings as percent of memberst equity forsample cooperatives prior and subsequent to merger 114

LIST OF TABLES (Continued)
24 Savings as percent of total assets. for samplecooperatives prior and subsequent to merger 116
25 Volume and price of all producers class onemilk received by a bargaining association ascompared to volume and price of class one milkclassified under federal marketing order, priorand subsequent to merger 123
26 Origin and length of merger negotiations 131
27 Number of mergers attempted, consummated,and the impact of merger on the ize and growthof sample cooperatives 134
28, Facilities purchased and sold as a result ofmerger 137
29 Number of members and nonmembers of theacquired and acquiring cooperatives one yearbefore merger and the latest fiscal year forthe combined association 140
30 Relative importance of cooperative acquisitionsin the growth of cooperatives, United States,1940- 1964 159
31 Relative importance of acquisitions in the expan-sion of local agricultural cooperatives by type ofcommodity, United States, 1940-1964 161
32 Relative importance of acquisition in the expan-sion of regional agricultural cooperatives bytype of commodity, United States, 1940-1964 163
33 Comparison of average growth rate, measuredin sales and total assets, of merging and non-merging local cooperatives, United States, 1941-1964 165

LIST OF TABLES (Continued)
34 Comparison of average growth rate, measured insales, of merging and nonmerging regionalcooperatives, United States, 1941-1964 1 69
35 Comparison of average growth rate, measured insales,of merging and nonmerging regional coopera-tives by type of organization, United States, 1941-1964 170
36 Class intervals employed in the analysis of growthpatterns of merging and nonmerging local coopera-tives 179
37 Transition probability matrix of local cooperativesby annual sales volume, United States, 1956-1964 181
38 Estimated number of local cooperatives per sizeclass, United States, 1972-1980 185
39 Class intervals employed in the analysis of thegrowth patterns of regional cooperatives 187
40 Transition probability matrix of regionalcooperatives by annual sales volume, UnitedStates, 1956-1964 187
41 Estimated number of regional cooperatives persize class, United States, 1972 and 1980 188

LIST OF APPENDIX TABLES
1 Cooperative I. Total costs prior and subsequentto merger, 1954, 1957, and 1965 215
2 Cooperative II. Total packing costs prior andsubsequent to merger, 1955, 1958, and 1965 216
3 Cooperative III. Total packing costs prior andsubsequent to merger, 1958, 1961, and 1963 218
4 Cooperative IV. Total cost of manufacturingmilk prior and subsequent to merger, 1956,1958, and 1965 219
5 Cooperative V. Total costs prior and subse-quent to merger, 1956, 1958, and 1965 221
6 Cooperative VI. Total costs of manufacturingmilk prior and subsequent to merger, 1958,1961, and 1965 223
7 Cooperative VII. Total costs prior and subse-quent to merger, 1956, 1959, and 1965 2i25
Cooperative VIII. Total costs as a percent ofsales prior and subsequent to merger, 1956,1959, and 1965 227
9 Cooperative IX. Total costs prior and subse-quent to merger, 1957, 1960, and 1966 229
10 Cooperative X. Total costs prior and subsequentto merger, 1954, 1956, and 1966 231
11 Number of mergers among cooperatives, non-cooperatives with cooperatives, cooperatives withnonooperatives, and industrial mergers, UnitedStates, 1940-1964 233
12. Mergers among cooperatives classified accordingto the commodity of acquiring cooperatives,United States, 1956-1964 234

LIST OF FIGURES
1 The relationship between the short run and long runaverage cost curve 40
2 Number of mergers among agricultural cooperativesby size classes, Unites States, 1956-1960 47
3 Number of cooperative mergers and manufacturingand mining mergers, United States, 1909-1964 142

AN ECONOMIC ANALYSIS OF THE MERGERCOMPONENT IN THE GROWTH OF
AGRICULTURAL COOPERATIVES
I. INTRODUCTION
Agricultural cooperatives have become a significant force
in agriculture in the United States because of their rapid expansion
since World War I. This rapid growth rate is exhibited in the in-
crease in the number of cooperatives, in their memberships, and
in their annual volume of business.
By 1920, there were 7, 400 farmer cooperatives with abusi-
ness volume of one and a quarter billion dollars (38). These co-
operatives had memberships totaling 1, 675, 000 (38). In 1964,
there were 8, 647 agricultural cooperatives with an estimated
business volume of 14 billion dollars (64). By the same year,
the number of memberships had increased to 7, 037, 735; however,
one farmer may have membership in more than one cooperative
(64). Consequently, over the 44 years considered, the number of
cooperatives increased 16. 85 percent, memberships increased
320. 2 percent, and business volume increased 846. 1 percent. 1
1Business volumes of farmer cooperatives were deflated by theWholesale Price Index for all commodities.

2
In 1964, Heckman (30) estimated that cooperative business
volume represented approximately 30 percent of the total value of
United States agricultural production. Heckman's estimate is a
slight increase over Knapp's (38) estimate of 26. 9 percent in 1958
and 2. 5 percent in 1950. Both Heckman's and Knapp's figures
include the business volume of bargaining cooperatives as well as
cooperatives that perform a processing or brokerage function.
Although cooperatives handle a substantial amount of agricultural
output, there is a wide range in the proportion of specific com-
modities handled (Table 1). Agricultural cooperatives handled as
much as 90 percent of the lemon crop and 85 percent of the cran-
berry crop in 1964. On the other hand, they handled only 15 per-
cent of all vegetables.
Also, according. to Heckman (30), farmers obtained about
15 percent of their production supplies and equipment through
purchasing cooperatives in 1964. Again, this volume of supplies
handled by supply cooperatives represents a small percentage in-
crease over Knapp's (38) estimate of 14. 5 percent in 1958 and 11.9
percent In 1950. The proportions of specific inputs sold by pur-
chasing cooperatives in 1964 are also shown in Table 1. Farmers
purchase 23 percent of their fertilizer and petroleum, 19 percent
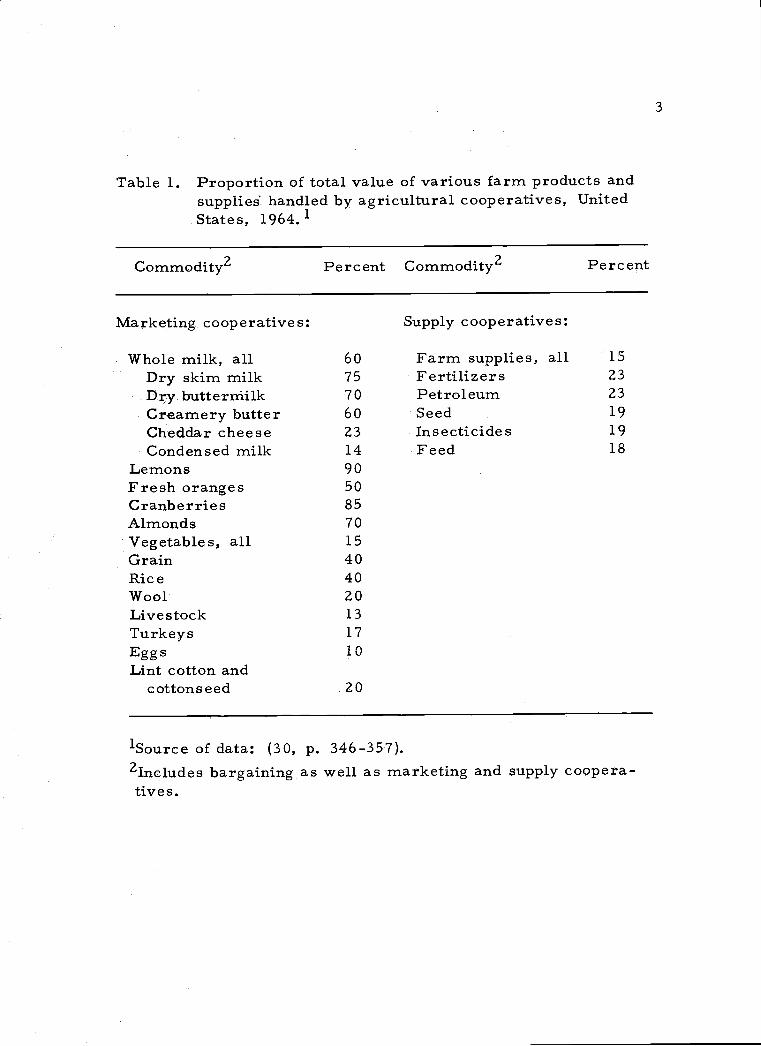
Table 1. Proportion of total value of various farm products andsuppliesT handled by agricultural cooperatives, UnitedStates, 1964.1
1Source of data: (30, p. 346-357).2lncludes bargaining as well as marketing and supply coopera-tiv e S.
3
Commodity2 Percent Commodity2 Percent
Marketing cooperatives: Supply cooperatives:
Whole milk, allDry skim milk
6075
Farm supplies,Fertilizers
all 1523
Dy. bUttermilk 70 Petroleum 23creamery butter 60 Seed 19Cheddar cheese 23 Insecticides 19Condensed milk 14 Feed 18
Lemons 90Fresh oranges 50Cranberries 85Almonds 70Vegetables, all 15Grain 40Rjce 40Wool 20Livestock 13Turkeys 17Eggs 10Lint cotton and
cottonseed 20

4
of their seed and insecticides, and 18 percent of their feed through
farmer owned and controlled associations.
Agricultural supply, marketing, and bargaining associations
represent only 36. 7 percent of the agricultural cooperatives (Table 2).
Agricultural service associations such as artificial breeding associa-
tions, dairy herd improvement associations, and grazing and irriga-
tion associations comprise almost half of the total number of agri-
cultural cooperatives. Other important agricultural cooperatives
are agricultural credit and fire insurance companies.
Furthermore, cooperatives are not limited strictly to the
agricultural sector in the United States. Of the 78, 000 cooperatives
in the United States, consumer associations account for 38, 000.
This group of cooperatives includes credit associations, mutual tele-
phone and insurance associations, mutual savings and loan associa-
tions, housing associations, consumer stores and rural electrification
cooperatives (57, p. 119-122). In addition, there are 6,579 business-
industrial associations and some 8, 000 quasi-cooperatives that oper-
ate according to basic cooperative principles (57, p. 123).
The Problem
Despite the aggregate growth of cooperatives, '1cooperative
leaders now are focusing their attention on a slowing down of the rate
of growth of cooperative-type businesses and the economic difficulties

Table . Number of agricultural cooperatives and cooperativemembership, United States, i96oL
1 Source of data: (57, p. 112).2Source of data: (64, p. 16 and 23)3These.2, 500 cooperatives serve 3,673,583 farmers.4Data not availableSMexnberships cannot be added because of duplications.
5
Type of cooperative Number ofCooperatives
Cooperativememberships
Agricultural bargaining 325 390, 000
Agricultural credit 2, 090 I' 136, 280Banks for Coopera-.tives 13 2,500
Credit corporations 21Federal Land BankAssociation 779 379,940
Production CreditAssociation 487 518,840
Rural credit unions 790 235, 000
Agricultural marketing2 5, 421 3,612,535
Agricultural services 11,462 1, 159, 579Artificial breeding 47 675, 000Dairy Herd ImprovementAssociation 1,436
Grazing 1,436Irrigation 7, 729Miscellaneous 814
42,03431,071
161, 679249, 795
Farmers' fire mutual 1, 600 3, 000, 000
Farm supply coopera-tive S2
Fishery marketing
3, 226
87
3, 425, 200
10,673
Indian enterprises 219 12,5205
Total 24, 430
6
of many $maller cooperatives" (5, p. 489)
The number of marketing cooperatives declined 21. 7 percent be-
tween 1949-1950 and 1963-1964. Membership in these associations
decreased 11. 3 percent over the same period. However, except for
the years 1949-1950 and 1953-1954, and 1955-1956, the deflated busi-
ness volume of marketing cooperatives has risen each year from
1949-1950 through 1963-1964.
The number of supply cooperatives increased by 113 or 3. 6
percent from 1949-1950 to 1963-1964. Over this period, business
volume rose 130. 9 percent while memberships increased 7 percent.
Even though purchasing cooperatives' total memberships increased
14.7 percent between 1949-1950 to 1963-1964, memberships have
fallen 21 percent between 1955-1956 and 1963-1964.
According to the Farmer Cooperative Service (64) the decreases
in memberships of purchasing and marketing cooperatives and in the
number of marketing associations reflects the reorganizations of co-
operatives by merger, acquisitions, and consolidations and declining
farm numbers. Since a farmer may be a member of more than one
cooperative, an area consolidation or merger may reduce the com-
bined memberships of the new organization considerably. Another
less sigr.ificant factor reducing memberships is the possibility that
conglomerate or vertical mergers, acquisitions, or consolidations

7
may lessen the need of producers to belong to more than one coopera-
tive to purchase inputs and market his products.
DeLoach believes that "even though aggregate statistics Of
growth are not now a basis for concern, it is increasingly apparent
that many small cooperative businesses, like many small farms and
profit-type firms in almost all kinds of processing and distributionare
in trouble. Likewise, some medium size and large cooperatives are
under competitive pressure, not because they are cooperatives, but
because competition with profit-type firms is increasingly severe'1
(15, p. 490).
To meet this competition, Mueller (49, p. 6) has suggested that
growth among cooperatives, like other corporations, can be achieved
readily via merger. The need for growth is a recognition of the need
to achieve economies of scale in plant processing, distribution, and
management and to enhance bargaining power, to improve cooperative
effectiveness in the marketplace, and to provide a stronger financial
base (8, p. 1).
Mueller (49, p. Z) indicates that many cooperative managers and
members think there is something unnatural or uncooperative in grow-
ing by merger. Cooperatives in an area are often unaware of succes-
ses and failures others have experienced. Therefore, it is the pur-
pose of this research to analyze factors important in cooperative
growth, to determine the profitability of cooperative mergers, the

8
extent of merger, the amount cooperatives have grown by external
growth, and the extent to which farmer cooperatives have achieved
their merger objectives.
The Objectives
The specific objectives of this study are:
To determine the ex ante objectives of mergers involving
farmer cooperatives;
To determine the extent to which their objectives were
achieved through merger;
To identify factors, operative in both successful and unsuc-
cessful mergers, that were instrumental in the success orlack of success in equating ex ante objectives and ex post
merger results;
To determine the amount of cooperative growth attributable
to external growth; and
To examine the future role of merger on the growth of agri-
cultural cooperatives.
To outline the dissertation, Chapter II contains a review of
literature relating to the extent of causes and success of mergers.
Chapter III presents the methodology of subsequent chapters. This
section describes the population, the frame, and the sampling
method. Chapter IV and Chapter V contain empirical results
of a sample surveyed to determine the objectives of merger, an
indication of merger accomplishments and an analysis of the
differences between objectives and actual operating results.
The external growth of cooperatives is the subject of Chapter
VI. The growth rate of cooperatives using external growth is
compared to those using strictly internal growth. Markov chains
are employed to estimate the future size distribution of coopera-
tives.
The summary and conclusions are presented in Chapter VII to
reiterate the major empirical results with recommendations for
public policy and future research needs.
Definitions
9
This section is included because many have not reviewed the
merger literature. The following definitions are not the author's,
but are scattered throughout the volumes written on corporate
merger.
Any firm may grow by one of two methods. One method is
internal growth; the second method is external growth. A coopera-
tive expands internally by constructing its own facilities, by in-
creasing membership or volume of business, or by developing its
own markets. External growth occurs with expansion by merger,
acquisition, or consolidation. So, external growth is synonomouS
with the growth by unification of a given business with all or part

10
of other businesses. Internal and external growth are not synon-
omous with internal and external financing. Our definitions are
not concerned with the origin of the funds to finance growth.
In economic literature, merger, acquisition, and consolidation
are used interchangeably since they have the same possible impact
on market structure and cost structure of the firms. However,
merger, acquisition, and consolidation have specific legal defini-
ti on s.
A statutory merger is the joining of two or more firms by
another with only the acquiring firm maintaining its identity. An
acquisition refers to the purchase of all or only part of the assets
of one business by another. The term consolidation normally
refers to the combination of two or more firms into a new organi-
zation. AU three ways of growing externally must be carried out
according to state laws.
In this study, the term merger will be used as a general term
to include all external growth whether it was accomplished through
merger, acquisition, or consolidation, unless it is otherwise
specified to convey a technical definition. Also, the largest
cooperative in a consolidation will be considered the acquiring
cooperative. All other smaller cooperatives engaged in the con-
solidation will be called acquired cooperatives.
II. Review of Merger Literature
A large volume of material has been written on the various
aspects of merger. Therefore, it is convenient to group these
studies into the following four categories:
Qeneral descriptive studies of the magnitude of merger
activity in the United States (11, 16, 32, 59, 65, 67, 69,
7Z, 74);
Studies that attempt to isolate the merger component and
its impact on industrial concentration (37, 49, 51, 75);
Studies that have analyzed the characteristics of mergers
and the theoretical causes and effects of such unifica-
tions (5, 26, 34, 43, 50, 53, 63); and
Studies that have attempted to determine the successful-
ness or unsuccessfulness of mergers (17, 41, 45, 52, 56).
The above classification is useful as an aid in reviewing the litera-
ture, but these studies as categorizedare not meant to be mutually
exclusive.
1 1.
Merger Movements in the United States
Three major merger periods have been identified by previous
students of industrial organization as 1598-1903, 1926-1929, and

12
1940-1947. The first merger period has received particular
attention because the consequence of this cycle was that "it gave
to America its characteristic twentieth century concentration of
control" (31, p. 114).
The large horizontal combinations of the early merger move-
ment did not result in many complete monopolies, but it is evident
that they did increase concentration in their respective markets.
The mean share of the total domestic market controlled by 22
combinations studied by the Industrial Commission was 71 percent
(70). Of the 92 large mergers studied by Moody, 26 firms con-
trolled 80 percent or more of the output of their industry; 57 con-
trolled 60 percent or more; and 78 controlled 50 percent or
more (48).
The second merger wave (1926 to 1929) was larger in absolute
size than lhe earlier merger movement. However, the second
movement did not have the same impact on industrial concentra-
tion because many of the mergers were in less concentrated in-
dustries. Stigler (63) in fact, has characterized this merger
period as one of transforming near monopolies to oligopbiies.
This transformation of industrial structure was influenced by
mergers among smaller firms and antitrust dissolutions.

13
Most of the merger activity of the 192 Os took place in the food
industry, public utilities, banks, and chemicals instead of in the
heavy industries involved in the first movement. The near
monopolies in the manufacture of metals, petroleum, and tobacco,
to name only a few, did not embark on a new merger program to
regain their monopolistic positions. The firms in these industries
did, however, maintain an oligopolistic market position.
The third merger period, 1940-1947, was similar to the
second merger movement in its impact on industrial concentra-
tion.. Among the 1, 000 largest manufacturing firms, the lower
500 firms grew relatively more through merger than the upper
500 firms (5, p. 278). In addition, most of the firms acquired were
small firms. The conclusion generally reached is that the third
merger movement had less impact on industrial concentration
than did the first two. Linter, Butters, and Gary (5, p. 278)
indicate that the Gini coefficient, a measure of concentration,
increased from .809 to .816 through merger of mining and manu-
facturing firms or . 007 in the eight years, 1940-1947, which
they considered an insignificant amount.
To summarize the effects of merger on industrial concentra-
tion, Weston (75, p. 102), in a 1953 study, concludes that "no
growth in the relative size of large firms was achieved through

14
internal expansion. Existing levels of industrial concentration are
due almost entirely to external growth. On the other hand, exter-
nal growth subsequent to the early merger period (1898-1903)
exerted only negligible effects on concentration. H
Causes of Industrial Mergers
The third category of merger literature consists of the causes
of merger. This literature includes the economic theory of merger
and the major institutional factors operative in each specific
merger cycle.
Markham (43, p. 167) posits four possible institutional
factors that contributed to the rise and fall of the merger cycle
at the turn of the century. These institutional factors are (a) the
Sherman Act of 1890 which ended the trust device by making
collusion illegal. Therefore, market control could be achieved
only through merging the separate constituents; (b) incorporation
laws were relaxed so that a unanimous vote by stockholders was
unnecessary, restrictions on capitalization and area of business
operations. were relaxed, and limitations on mergers were re-
moved; (c) a modern capital market was developed in the 1880s;
and (d) the Northern Securities decision in 1904 abruptly ended
mergers for market control.

ZThe 1940-1947 so-called merger movement appears to be merelya forerunner of the current merger movement (1949-1961).
15
The dominant factor influencing merger in the twenties was the
tgreat bull market in security prices." Weston (75, p. 83)
suggests that combinations took place to create new securities.
By doing so, merger made large gains to stockholders and in-
vestment bankers. Since the discounted expected earnings were
greater than the prevailing book value of assets, the formation
of mergers allowed these corporations to float new securities.
The promotion of new security issues in an active market and
the large commission paid investment bankers to locate firms
for merger made the promotion of merger a lucrative business.
Two other factors stimulating merger during the twenties were
technical gains from integration and more effective use of adver-
tising, to increase sales and to attain economies of large scale
(75, p. 83).
Strategic factors important in the smaller merger movement
of the forties are normally associated with World War II. Moti-
vating forces to merger were the high rate of taxation, low price-
earnings ratios, and postwar shortages that could be fulfilled more
rapidly by external than internal expansion. Kaplan (34, p. 95)
suggests that the motivations for the current merger movement
are those associated with firm growth and management2.
16
Factors encouraging merger, according to Kaplan are (a) scarcity
of superior management, (b) tougher competition, (c) the need to
increase scale of operations, (d) the need to keep abreast of
technological progress, and (e) the need to adjust operations to
market demand.
Weston (75), Nelson (53), and George (26), have attempted
to explain the periodicity of mergers on a theoretical basis. All
three arrive at similar conclusions, so only Weston's study is
summarized. After considering the institutional factors, Weston
finds three significant variables that should explain the merger
cycles. These variables are the general level of business
activity, lhe Dow-Jones industrial stock averages, and the
wholesale price index. Weston reasons that if economies of
scale are a dominant force to merger, then cost reduction pres-
sure should be greatest in periods of business contraction. Thus,
one would expect an inverse relationship to exist between business
activity and merger activity. If gains to merger promoters were
greatest during periods of high stock prices, one would hypothe-
size a high positive relationship between the timing of merger
activity and the level of stock prices. The wholesale price index
was used to consider the extent to which measures of growth
through consolidation might be overstated.

Weston1s multiple regression equation is as follows for the
interwar years:
Y = -446. 15 -440. 39X1 +3. 74X2'' +8. 45X3*
(461. 6O) (.98) (2. 87)
R2 = . 82
Where: Y = number of industrial mergers per year in
the United States
X1 = index of industrial production
X2 = Dow-Jones industrial stock prices
X3 = wholesale price index
This equation shows that 82 percent of the variation in the number
of industrial mergers per year is explained by the variation in the
three independent variables. Wholesale prices and industrial
production were significant at the 5 percent level of significance,
while stock prices were significant at the 1 percent significance
level, using a two-tailed ut_testtl with 13 degrees of freedom.
A comparison of the "beta coefficients showed that stock
prices exerted one and one-half times the influence on merger
activity of commodity prices and four times the influence of
the level of industrial production.
3 Values in parentheses are standard errors of the regressioncoefficients.
17

18
Markham(43, p. 153) points out that I!like most simple ex-
planationsof complex phenomena, however, this one (stock prices)
also leaves a great deal unexplained. For example, stock prices
registered one of the most rapid gains in history between the
fourth quarter of 1932 and the fourth quarter of 1933; over this
period, however, the quarterly volume of mergers decreased. H
Mueller (50, p. 12) postulates that the high correlation be-
tween merger activity and stock prices is the fact that stock
prices may represent a proxy variable of business expectations
and not promoter's evaluation of their personal gains. Thus, when
business expectations are favorable, firms have an incentive to
expand. This hypothesis appears reasonable in recent years
because stock prices and merger activity have not always been
positively correlated.
Although the paths of economic theory and merger literature
have rarely crossed (43, p. 143), an economic theory of merger
was developed by Stigler (63) to explain the first two merger
movements. Stigler uses price theory to examine the objectives
of merger for monopoly at the turn of the century and merger for
oligopoly in the late l9ZOs.

19
Stigler is interested in the conditions under which it is profit-
able for competing firms to merge for monopoly. He starts with
four rigid assumptions which he later relaxes or defends. These
assumptions are (a) long run average cost and marginal cost of
production are equal for firms of all relevant sizes, (b) entry of
new firms is easy, although not necessarily inexpensive, (c) the
demand for the output of the industry is stable, and (d) the speci-
alized resources in the industry are indestructible.
The first two conditions assure that monopoly gains will not
accrue to the firm in long run competitive equilibrium. However,
even though monopoly gains cannot continue to exist in the long run,
merger for monopoly may nevertheless occur. The essence of
his argument is that if firms in pure competition merge to form a
monopoly, monopoly gains are possible until they disappear due
to entry. As the number of rivals increases, the long run equilib-
rium established is one of permanent loss because of assumption
(d). It is possible, however, for the discounted value of early
gains to exceed the discounted value of later losses. Further, the
longer the adjustment period, the larger could be the monopoly
gains.
Stigler relaxes assumptions (b), (c), and (d) since they are
unrealistic, and as a result the expected benefits of merger
20
increase. If industry demand is growing over time as it is in
most industries, the amount of resources needed to be withdrawn
is reduced. In fact, if demand is growing rapidly enough, no
resources may need to be withdrawn. Also, if resources are not
indestructible, the investment can be withdrawn from this industry
before the subsequent period of 1oss If entry of firms is hindered
by excessive capital requirements or existence of economies of
scale, monopoly profits will exist over a longer period and again
increase the net benefit to merger.
Success of Mergers
Five major studies have been made to determine the success-
fulness of combinations. Four studies were concerned with firms
merging during the early merger period and one with firms that
merged during the current merger movement. The first of the
four merger studies by Dewing (17) proposes three measures of
merger success. These criteria for success are (a) that a com-
bination should yield a larger net profit than the sum of the net
profits ofthe constituents entering the union, (b) a combination
should yield a net profit at least equal to what investment bankers
estimated the union would yield, and (c) the average net earnings
over a period of time should show a "conspicuous increase" over

21
the net earnings prior to consolidation and during the combined
firm's first year of operation.
Studying 35 consolidations, Dewing found that (a) earnings
of the separate entities before consolidation were nearly a fifth
(18 percent) greater than the earnings after the first year of com-
bined operations and between a fifth and a sixth greater than the
average for the 10 years following consolidation, (b) investment
bankers' estimates of probable earnings were half again as large
as the actual earnings of the first year's operations and nearly
twice as large as the average earnings of the 10 years following
consolidation, and (c) after 10 years elapsed, to allow ample time
to take advantage of any anticipated economies of large scale
production, earnings fell slightly less than a tenth from the first
year of operation after the union. The inference drawn from
Dewing's research is that consolidations between 1893 and 1902
were not successful with respect to expected and actual earnings,
but this study has been criticized by Mead (45) because the firms
in Dewing's sample consolidated just before the 1903-1904 busi-
ness recession and Dewing's sample was weighted toward industries
in which the long run influence had not been favorable.
The second study, by Edward Mead (45), was a continuation

22
of the Dewing study. Mead did not define success, but he did con-
clude that consolidations did achieve 'conspicuous success" which
reflected advantages of large scale. Weston (75, p. 69) believes
that Mead's analysis does not permit this conclusion, especially
since only 14 out of 33 firms studied achieved financial success
without reorganization.
While Dewing's and Mead's analyses were weak, the success
of mergers was open to question because their conclusions were
based on a relatively small sample and because of external in-
fluences that did not remain constant during the period under
study. A more comprehensive study was done by Shaw Livermore
(41) in which he studied 328 firms that included all firms merging
between 1890 and 1904 for which adequate data could be obtained.
Also, Livermore's study included firms in the entire continuum
of market structures rather than confining his enumeration to the
near monopolies studied by Dewing and Mead.
To study the profitability of merger, Livermore divided
firms that merged into two groups. One group contained those
firms that attained a high degree of horizontal market control
through merger and the other group contained those that did not.
Of the 159 companies that achieved market control through merger,
Livermore estimated 40. 4 percent failures, 10. 9 percent

23
marginal, and 48. 7 percent successes. The other 178 firms that
did not attain a high degree of market control through merger
comprised45. 3 percent failures, 6. 4 percent marginal and 48. 3
percent successes. Also, merger success did not depend on firm
size. Of the 146 mergers that were unquestionably successful,
the majority of these firms owed their profitability to rapid tech-
nological and managerial improvement, product development,
product differentiation, and to the formation and development of
a research division. Very few of the successful mergers owed
their success to monopoly control or "unfair and vexatious prac-
tices. " It is evident that Livermore's study is more optimistic
of merger success than the Dewing study, but Livermore's study
proves that mergers during the first merger movement were not
always entirely profitable to stockholders. A similar conclusion
was reached by the National Industrial Conference Board (52) by
surveying the rates of return and stock prices of firms that con-
solidated during the same period studied by Livermore.
A recent study of merger and stock market performances was
made encompassing 478 of the largest manufacturing and mining
corporations in the United States from 1951 to 1961 (56). This
study showed that common stock prices of internal growth
companies advanced 680 percent, while active acquirers, with

24
11 or more acquisitions, rose only 307 percent. Earnings per
share followed a similar pattern.
Reasons given for the poor performance of active acquirers
are (a) rapid expansion is not subjected to repeated examinations
of costs and benefits, (b) some cases involve a substantial premium,
over market value, paid for the acquired assets, and (c) the costs
of integrating a new firm into the organization are high. It is
obvious that this study is also consistent with the previous con-
clusions reached by Dewing, Mead, Livermore, and the National
Industrial Conference Board.
A Review of Cooperative Merger Literature
While the discussion of corporate merger literature may seem
an unnecessary detour in this study, it should be noted that coopera-
tives are just a special form of corporation and the factors influ-
encing corporate mergers might also influence cooperative mergers.
Most studies on cooperative mergers are descriptive in nature and
are directed toward the dairy industry. These studies provide
some of the historical statistical data on cooperative mergers.
Mueller (49, p 61-63) found that between 1945 and 1955
nearly one-half of 102 large dairy cooperatives studied grew, in
25
part, through the acquisition of cooperatives and noncooperatives.
Cooperatives that used merger between 1946-1955 grew more
rapidly than those that grew entirely internally. His statistical
comparison of merging and nonmerging cooperatives showed that
mergers explained most of the differences in the average growth
rates of merging and nonmerging cooperatives. Mueller summar-
izes his study, by suggesting that if growth is a measure of suc-
cess, his findings support the hypothesis that merging dairy
cooperatives are much more successful than those that have not
used external growth.
Another study on dairy firms by Hammond and Cook (28, p. 4)
shows a similar conclusion to Mueller's, that merging firms showed
a higher growth rate than nonmerging firms.
Hammond and Cook also find no significant correlation be-
tween dairy mergers, business activity, or stock prices. They
hypothesize that a possible cause of this situation is that local
regulations and technological innovations influence merger acti-
vity among small cooperative and noncooperative businesses
rather than business cycles or aggregate variables for the national
economy.

Motivations of Cooperative Mergers
Cooperatives merge for a variety of reasons. Therefore, it
is necessary to separate these reasons into classes; namely, mo-
tives for growth and motives for growth by merger.
The dominant motive for cooperative and noncooperative
growth is the desire to achieve economies of large scale. Advan-
tages of large scale usually relate to production and distribution
economies of scale. Other motives for growth are decreasing
procurement and field service costs, vertical integration, diver-
sification of product lines and achievement of market power (49,
p. 24-25).
Motives for growth through merger are those factors that make
merger the most effective method of growth. Such factors are
competitive considerations that avoid disturbing market pricing
policy, it is cheaper to buy than to build, it is an effective means
of obtaining technical and management personnel and broadening
the financial base, and facilitates the adjustments to wartime
pressures. Financing a firm with a business history is normally
easier than financing strictly internal expansion. Projections of
future earnings, sales, etc. , are more readily available from
existing firms, but are difficult to project when internal growth
is used. Cooperatives, like noncooperatives, have an incentive
26

27
to integrate vertically to assure a source of supply and to capture
monopsony profits as a result of government rationing (61).
Cooperative Merger Activity
Data on agricultural cooperative mergers which occurred
before 1940 are very incomplete. The number of mergers and
consolidations for the period 1905-1939 were obtained by
Mueller (49) from a study by Cochrane and Elsworth (9) who
analyzed the records of 14, 655 discontinuing cooperatives.
Mueller (49, p. 9) points out that Cochrane and Elsworth had
information on the way in which only 10, 877 of these discontinued
cooperatives ceased operation; and if mergers represented the
same percentage of the other 3, 778 cooperatives not analyzed,
then another 162 cooperative mergers occurred during this period.
Merger data for the years 1940-1955 were collected by
Mueller from the Farmer Cooperative Servic&s file of discontinuing
cooperatives and from mergers reported in News for Farmer Co-
operatives, Cooperative Digest and other miscellaneous sources.
Mueller suggests that the data are sufficient to demonstrate the
trend of cooperative merger activity, if not its actual magnitude.
Updating Mueller's series of mergers among cooperatives
from 1956 to 1964, was done by the Farmer Cooperative Service

from its file of discontinuing cooperatives. Data on mergers of
noncooperatives with cooperatives are less complete than on
mergers of cooperatives with other cooperatives. The statistics
on noncooperatives acquired by cooperatives were collected from
trade publications cited in Mueller's study.
Trend in Cooperative Mergers: There has been an increasing
trend in the number of mergers among cooperatives per year, but
a decreasing number of noncooperatives acquired by cooperatives
(Table 3). Before World War I, mergers among cooperatives were
virtually unknown. Between 1910-1914, the average number of
mergers was only 1. 6 per year. This number increased steadily
to 27. 4 per year during the "Great Depression. " The average
number of mergers consummated fell to 16. 2 per year after the
depression and increased during the 1940s to 41. 2 per year.
During the l9SOs, the average number of mergers fell again and
then reached a record number of 55. 2 mergers per year in the
1960-1964 period.
Noncooperatives acquired by cooperatives averaged 32. 2 per
year during the Second World War. These mergers increased to
an average of 38. 0 mergers per year between 1945 and 1949 and
plummeted to an average of 11.8 per year between 1960 and 1964.
28

Time period
1905-19091910-19141915-19191920-19241925-19291930-19341935-19391940-19441945 -19491950-19541955-19591960-1964
Average number of mergersper year
Noncooperatives Cooperativeswith coopera- with toopera-
tives tives
29
Table 3. Average number of mergers per year among agriculturalmarketing and purchasing cooperatives compared tomergers of noncooperatives with agricultural coopera-tives in the United States, by five-year periods, 1905-
1 9641
'Source of Data: 1905-1955 (49, p. 8-10); 1956-1964 (64, personalcorrespondence).
ZTwenty-four noncooperatives which merged with cooperativesduring the period 1940-1955 were unknown as to the date of theconsummation.
3Original data collected from Mueller's sources. (see 49, p.8-10).
Dairy and purchasing cooperatives have accounted for the
majority of the merger activity among cooperatives (Table 4).
Since 1909, dairy cooperatives made 32. 2 percent of all coopera-
tive mergers, while supply cooperatives made 21. 9 percent, and
.21.65. 4
219. 227. 4
0
32. 30. 638. o2 41. 231. o2 20. 218. 43 28. 011. 8 55. 2

Table 4. Mergers among agricultural marketing and purchasing cooperatives by commodity types,United States, 1909 _19641
1Source of data: 1909-1955 (49, p. 8-10); 1956-1964 (64, personal correspondence).2Mergers among agricultural cooperatives classified according to type of commodity of acquiredcooperatives. Most of these mergers are believed to be horizontal mergers.
3Mergers among agricultural cooperatives classified according to type of commodity of acquiringcooperatives.
4lncludes some rice and dry bean associations.5lncludes 18 cotton, 15 egg and poultry, 10 wool, 3nut, 2 tobacco, and 31 unclassified marketingassociations.
6lncluded were: 10 poultry, 7 cotton, and 11 unclassified associations.7lncluded were: 5 cotton, 5 nut, 5 poultry, I rice, 1 wool, and 3 unclassified cooperatives.
0
Type1909_19392 1940-1955 1956..1964 1909-1964
Number Percent Number Percent Number Percent Number Percent
Dairy 74 15.6 190 39.2 170 43.5 434 32.2Elevator and grain 64 13. 5 61 12.5 45 11.5 170 12. 6Fruitandvegetable 120 25.4 60 12.4 31 7.9 211 15.7Livestock 67 14.2 18 3. 7 26 6. 7 111 8. 2Miscellaneous
marketing 795 16.7 286 58 ZO 5.1 127 9.4Supply 69 14,6 128 26.4 99 25.3 296 21.9
Total 473 100.0 485 100.. 0 391 100. 0 1,349 100. 0

31
grain, fruit and vegetable, livestock, and miscellaneous marketing
cooperatives made 12. 6, 15. 7, 8. 2, and 9.4 percent, respeotively.
During the period from 1939 to 1964, the percent of mergers
attributed to dairy cooperatives increased from 15. 6 percent to
43. 5 percent; supply cooperatives increased from 14. 6 percent
to 25.3 percent, wh1e the fruit and vegetable,, livestock, and
miscellaneous marketing decreased from 25. 4 to 7. 9, 14. 2 to
6. 7, and 16. 1 to 5. 1 percent, respectively.
The relative importance of cooperative mergers is indicated
by relating the number of mergers over 10-year periods to the
total number of operating cooperatives at the beginning of the
period. Table 5 shows that 416 mergers were consummated
during the period 1955-1964, which accounted for 4 3 percent of
the , 54 cooperatves in existence in 19. In the 10-year period,
1945-1954, mergers accounted for 3 percent of all cooperatives,
while in the period from 1935 to 1944, mergers represented only
2. 2 percent of all cooperatives.
The frequency of all cooperative mergers, except miscel-
laneous marketing cooperatives, has increased between 1935 and
1944, and 1955 and 1964. Dairy mergers between 1935-1944 were
2. 1 percent of all dairy cooperatives in 1935. In the 10-year
period 1956 to 1964, the frequency of dairy mergers increased

Table 5. Mergers by agricultural marketing and purchasing cooperatives bynumbers and percentof total population by type of commodity handled, United States, 1935-1944, 1945-1954,
and 1955_19641
No. ofassns.
Type 19352
Dairy 2,300Elevator andgrain4 3,125
Fruit andvegetable 1,082
Livestock 1,197Misc. mar-
Percent ofcooperativesusing mergeras a methodof discontinuingbusiness
'Source of data: 1935-1955 (49, p. 8-10); 1956-1964 (64, personal correspondence).2Mergers among agricultural cooperatives classified according to type of commodity of acquired
continued
No. ofmergers1935_442
Percent No. ofof assns.
1935 1945
No. ofmergersl945-54
Percent No. ofof assns.
1945 1955
No. ofmergersl955-64
Percentof1955
49 2.1 2,214 142 6.4 1,824 180 9.9
42 1.3 2,285 30 1.3 2, 125 47 2.2
33 3. 1 916 42 4.6 734 33 4. 5
19 1.6 661 11 1.7 439 26 5.9
21 2. 0 1,324 15 1. 1 1, 140 23 2. 069 3.6 2, 750 67 2.4 3, 322 107 3.2
233 2. 2 10, 150 307 3. 0 9, 584 416 4. 3
44. 7 52.4 56.4
keting4 1, 061Supply 1, 906
Total 10, 671

Table 5. Mergers by agricultural marketing and purchasing cooperatives by numbers and percentof total population by type of commodity handled, United States, 1935-1944, 1945-1954,
and 1955_19641 -- continued
cooperatives from 1936 to 1939.3Mergers among agricultural cooperatives classified according to type of commodity of theacquiring cooperative.
4See footnotes on Table 4.
34
to 9. 9 percent of the dairy associations that existed in 1955.
Even though cooperative mergers appear on the surface to be
rather insignificant, mergers seem to be of paramount importance
as a method of discontinuing operations. Almost 45 percent of the
net decrease in the number of cooperatives between 1935 and 1945
occurred through merger, while 56 percent of the net decrease in
the number of cooperatives between 1955 and 1964 is accounted for
by merger. This measure, however, is not an entirely accurate
measure of merger discontinuances because it does not take into
account the number of cooperatives starting business between
1933-1945 and 1955-1964.
Noncoóperatives Acquired by Cooperatives: Between 1940
and 1955, cooperatives acquired more noncooperatives than coopera-
tives, as shown by Table 6. During this period, cooperatives ac-
quired 553 noncooperatives and only 485 cooperatives. Fifty-eight
of the noncooperatives consummated represented dairy cooperatives,
while grai.n, fruit and vegetable, livestock, miscellaneous market-
ing, and supply accounted for 11.0, 3. 1, 1.5, 4.5, and 21.9 per-
cent, respectively. Feed and seed cooperatives are credited for
the majority of acquired purchasing associations.
During the 1956 to 1964 period, merger activity with non-
cooperatives decreased sharply. Whereas, in the 1940 to 1955

Table 6. Mergers of noncooperatives with agricultural marketingand purchasing cooperatives by commodity types, UnitedStates, 1940-1964," 2, 3
35
47, 54).2Mergers classified according to type of commodity handled byacquired cooperative.
3Data for 1956-1964 were collected from News for Farmer Coopera-tives, the Cooperative Digest and many other miscellaneous dairyjournals. Most of the nondairy mergers listed are found in theCooperative Digest.
period the number of mergers between noncooperatives and
cooperatives accounted for 53. 3 percent of all cooperative mergers,
in the period from 1956 to 1964, they represented only 27.7 per-
cent of all cooperative mergers.
Dairy firms totaled 73. 4 percent of the noncooperatives
acquired by cooperatives between 1956 and 1964. Elevator and
grain, fruit and vegetable, miscellaneous marketing, and supply
firms accounted for 13. 3, 3. 9, 4. 7, and 4. 7 percent, respectively.
1940-1955 1956-1964Type Number Percent Number Percent
Dairy 321 58.. 0 94 73. 4Elevator and grain 61 11.0 17 13.3Fruit and vegetable 17 3.1 5 3.9Livestock 8 1.5 0Miscellaneous marketing 25 4. 5 6 4. 7Supply 121 21.9 6 4. 7
Total 553 100. 0 128 100. 0
iSource of data: 1940-1955 (49, p 18-19); 1956-1964 (2, 12, 14,

36
The major change between the periods 1940 to 1955 and
1956 to 1964 was the increase in the percentage of dairy firms
acquired by dairy cooperatives and the decrease in the percentage
of supply firms acquired by supply cooperatives. Verification of
this basic trend was obtained by checking these data with regional
cooperatives which participated in merger negotiations. Farm-
land Industries noted that many cooperatives have added departments
by purchasing small businesses that would not be reported in trade
publications. Thus, these statistics on noncooperatives acquired
by cooperatives, as with statistics on mergers among cooperatives
only, is limited in that many smaller mergers are not reported
and therefore, to that extent, the magnitude of cooperative mergers
is understated.

III. THEORETICAL FRAMEWORK AND METHODOLOGY
The literature review of the previous chapter revealed that the
subject of merger and economic theory have rarely crossed paths.
Also, little analytical research has been done to ascertain the post-
merger costs and benefits of merger. Therefore, this chapter pre-
sents the theoretical framework and methodology employed in de-
termining the ex ante merger objectives and in determinining the
e post merger operating results.
Theoretical Framework
37
Many agricultural marketing and purchasing cooperatives
operate in oligolpolistic environments. As a result, many "under-
sized" cooperatives can remain in these industries without being
forced out of business by the underlying forces affecting demand
and supply in the long run. Reasons for these phenomena are
legal and economic.
The legal factors involved are associated with the Capper-
Volstead Act. The act permits the federated-type and centralized
type of farmer organization that provides local associations and
farmer members, respectively, with goods and services at cost
to provide "tie-in sales" with major farm organizations. The
economic factors are those that are a result of the market structure

38
conditions. They are (a) private corporations' use of "umbrella
pricing policies" that allow "undersized" firms to remain in the
industry and (b) "undersized" firms' acceptance of a lower rate of
return that allows them to remain in the industry. Because of the
nature of the cooperative enterprise, emphasizing operation on a
cost basis rather than emphasizing return on investment, it is
likely to operate so long as costs do not rise so high that the
cooperative can no longer make a net savings to member patrons
over time. Only when net savings fall to zero will the cooperative
be forced to liquidate or merge with another organization.
Even though the acquired cooperative may be "undersized,"
one would expect, a priori, that the acquiring cooperative would be a
larger association, but even these larger acquiring associations
may not be operating at optimum scale. This is especially true,
if the major objective for merger is economies of size as docu-
mented above. If in fact, there are sizable economies of size
and the larger associations are taking over the relatively smaller
associations for this purpose, the following theoretical outcome
should exist.
The following six assumptions are made which will be relaxed
or subsequently substantiated: (a) sizeable economies of scale
exist, (b) entry is relatively easy, (c) specialized resources are

indestructible (d) demand for the output of the firm is relatively
stable, (e) integration and growth costs by merger are negligible,
and (1) cooperatives operate at cost.
Now assume (SAGA), (SACB), and (SACAB) are the short run
average cost curves before and after merger of the acquired,
acquiring, and combined purchasing association, respectively.5
The long run average cost (LRAC) curve is a traditional envelope
curve of the short run average cost curves specified above. Also
A B ABassume (D ), (D ), and (D ) to be the corresponding demand
curves. In this particular case, the demand curves are the hori-
zontal summations of the member and nonmember Patron! s derived
demand for productive services.
Figure 1 shows that if our six assumptions are realistic,
horizontal merger is profitable for cooperative member patrons
of both firms.
The acquired cooperative before merger is operating at
output QA where is equal to SAGA because of assumptionf)
4For a discussion of the theory of cooperatives see reference (44).5This same analysis could be made regarding a marketingcooperative, but to avoid being redundant this analysis isnot presented.
39

Quantity of output per unit of time (firms)
Figure 1. The relationship between the short run andlong run average cost curve
The price paid for this homogeneous output per unit is The
acquiring cooperative prior to merger is handling output Q' at a
member price per unit of A comparison of the two coopera-
tives shows that the larger acquiring association provides a larger
output for members, the difference between (QB QA) at lower
40

price, the difference between (pB pA) per unit. After the two
cooperatives combine, member patrons obtain additional benefits.
The combined enterprise will operate at output QAB at a price per
unit of AB Thus, members of the acquiring and acquired cooper-
atives are able to obtain additional quantities of inputs at a lower
price than either cooperative could provide before the union. There-
fore, under the assumptions specified, member patrons and society
gain from real economies of size.
U the assumption of economies of size is relaxed for the ac-
quiring cooperative (that is, the acquiring cooperative is operating
at the low point on its LRAC curve and the acquired cooperative is
uundersizedlt) and a more realistic assumption is made such that
all economies of size are attained at a small volume of output and
thereafter the LRAC curve is flat, the merger is still profitable
from the acquired cooperativets, and possibly the acquiring
cooperative's, point of view. 6 Merger is especially appealing
41
6 Most eniperical evidence on the properties of long run average costcarves, suggests that the cost curves fall rapidly to low levels ofoutput, then remain fairly constant with no evidence that disecono-rnies are encountered in firms in actual operation. For a discus-sion, see references (3) and (6Z). However, Erlewine and Walsh(19) found that average unit costs of delivery in purchasing coopera-tives declined for refined fuel, feed, and fertilizer as volume in-creased.

42
to the acquired cooperative if it is operating on the falling portion
of the LRAC curve, since substantial economies of size can be
gained. On the other hand, merger could also be appealing to
the acquiring cooperative if other market structure variables could
be influenced such as increased pecuniary economies through in-
creased bargaining power with wholesalers which might not be con-
sidered in their planning curve. But this example is unlikely in
actual practice, especially if the acquired cooperative is an "under-
sized1t firm. However, this could be accomplished if additional
"undersized1 firms could be acquired. Seasonal or annual fluctua-
tions in the derived demand curve may have detrimental or bene-
ficial effects on the combined cooperative's operations. If the
demand curve does not intersect the relevant short run average
cost curve at its minimum point, member patrons are forced to
pay a higher price per unit of output for resources. However, in
the usual case, demand is generally growing with the economy. If
plant capacity continues to grow in direct relation to demand,
producer members are able to obtain a larger output at the same
price per unit or a larger output at a lower price per unit if econo-
mies of scale are encountered.
Where entry is easy, the undersized" cooperative is forced
to liquidate or merge in the long run. Entry of new firms into the

43
market will cause the cooperative's demand curve to shift to the
left. If resources in the market are indestructible, excess capacity
will increase for all firms in the market and all firms in the market
will be making permanent losses, until the growth in demand is
adequate to raise the price per unit above average variable costs
in the short run. However, if these cooperatives merge with a
cooperative of optimal scale, the member patrons could be made bet-
ter off if the discounted net revenues are greater than the discounted
subsidies caused by entry and indestructible resources in the long
run. If resources are destructible, however, the merger is more
lucrative since the cooperative can liquidate its operations before
the period of permanent loss is incurred.
If barriers to entry are high, the cooperative may be as in-
efficient as management desires without competition from possible
entrants forcing the cooperative to operate at optimum scale. The
only restraint on management of the cooperative is that the average
cost curves do not shift up to the point where the opportunity cost
of entry for another firm is greater than in its present endeavor.
However, the member producers may not be able to purchase inputs
cheaper with large barriers to entry if the cooperative operates at
cost.

44
If integration and growth costs of the cooperative are not neg-
ligible, it is possible for any economies of size to be offset by
these costs. This could make the merger unprofitable for the
acquiring cooperative, but still beneficial to the "undersized" ac-
quired cooperative. The outcome will depend on the effect these
costs have on the cost curves.
The acquiring cooperative will operate both firms after merger
only if the cost per unit of output in the acquired firm is lower than
the per unit cost would be to process or handle the entire acquired
firm's output in the acquiring firm's plant. Thus, acquiring coop-
eratives with excess economic capacity that could reduce their aver-
age costs would dispose of the acquired plant. On the other hand, if
the acquiring cooperative was operating at the minimum cost rate of
output, and substantial diseconomies of scale exist if the plant was
used beyond capacity, then one would expect the use of both facili-
tie s.
Theoretically then, it is apparent that mergers may or may
not be profitable depending on the internal and external environment
of each constituent entity. Thus, each merger should be studied to
determine the possible savings to producers of the acquired as well
as the acquiring cooperative if economies of size are a major
objective.

Methodology
To analyze the objectives and results of specific mergers
among agricultural cooperatives, a sample of agricultural market
ing, bargaining, and purchasing cooperative mergers that occurred
between 1956 and 1960 was taken. The Farmer Cooperative Service,
U. S. D. A., provided a frame that was derived from their file on
discontinued cooperatives. This file of discontinued cooperatives
is based on an annual survey of approximately 94 percent of all
agricultural cooperatives in the United States. Since all coopera-
tives do not return their questionnaires, the Farmer Cooperative
Service's frame was checked for accuracy against the agricultural
cooperative mergers reported by the 13 Banks for Cooperatives.
This comparison revealed that the Farmer Cooperative Service
records were more complete than the Banks for Cooperatives for
the time period under consideration. However, it is recognized
that some of the smaller cooperatives may not report acquisitions
to the Farmer Cooperative Service or obtain financing from the
Banks for Cooperatives. To the extent that these small cooperatives
do not report, the target population is misrepresented. It should
be mentioned, however, that this misrepresentation is negligible
45

46
and should not grossly affect the empirical results since systematic
sampling was used to cover the entire frame.
The population contained 99 agricultural cooperatives that
were involved in one or more mergers and that remained in opera-
tion in 1963. Seven associations that merged between 1956 and 1960
liquidated before 196Z, and were excluded from the population.
These exclusions were made because it was necessary to have in-
ternal records and personnel available for this study. Of the 99
cooperatives, 46 were dairy cooperatives, 34 were purchasing
cooperatives, 10 were grain cooperatives, 5 were fruit and vege-
table cooperatives, 3 were miscellaneous marketing cooperatives,
and 1 was a livestock cooperative.
Sampling Procedure
All cooperatives in the population were ranked in ascending
order, according to the combined organizations annual business vol-
ume as reported to the Farmer Cooperative Service for their latest
fial year, usually 1965. The data available to select the sample re-
present only the aggregate annual business volume of the corthined as-
sociations so the sample could not reflect the size distribution of ac-
quired cooWratives. A priori, however, one would suspect the size

of the acquisition varies directly with the size of the acquiring
cooperative.
Figure 2 is a histogram of the population which shows the
frequency of mergers among cooperatives of various sizes be-
tween 1956 and 1960.
Numberof
mergers
50
40
30
20
10
05 10 15 20 50* )50*
Business volume of combined associationsin millions of dollars, 1965
*Unequal size classes.
Figure 2. Number of mergers among agricul-tural cooperatives by size class,
United States, 1956-1960
Figure 2 indicates that almost 70 percent of the cooperatives
that grew externally during the period 1956 to 1960 were small
cooperatives with a combined annual sales volume in 1965 of less
th3n 10 million dollars. Only 11. 1 percent of the cooperatives in
the population had annual sales volumes of over 50 million dollars.
47

Because cf limited research resources and a wide geograph-
ical dispersion of the cooperatives in the population, a sample of
cooperatives was drawn. A 10, 1 percent sample was selected
using systematic sampling.
The 10 cooperatives selected in the sample had annual sales
volumes ranging from 590, 000, to 2Z8, 000. 000 dollars and con-
sisted of six marketing cooperatives and four purchasing coopera-
tives. Six of the 10 cooperatives in the sample were local coopera-
tives, whereas three were federated regional associations and one
was a centralized regional bargaining association.
Selection of the Time Period
The merger period 1956-196 0 was chosen for three reasons.
First, the number of mergers per year was relatively stable
during this period. This stability was desirable to eliminate
48
7An approximation of the appropriate sample size was made fromCochran?s formula (8, p. 96) for stratified random samp-ling. The following formula was used for a fixed population varianceassuming an index of variation in unit average costs:
(EWhSh) EWhShn=
Where:V+ !WhS
N
n = total sample size for precision (V).Wh = stratum weight.s = variance in each stratum.V = specified varianceN = total elements in all strata.

49
cyclical periods of mergers, which could possibly be initiated by
specific institutional factors. Secondly, studying each cooperative
over 5 to 12 years, depending on the end of its fiscal year, would
allow management ample time to implement its merger proposals
and to achieve its desired objectives. Thirdly, the time period had
to be short enough to obtain historical accounting data and short
enough to maintain the cooperative management that was involved
in merger negotiations.
Data Collection
Since the primary objective of the research is to determine
the objectives and results of mergers, and possible differences
between objectives and results, it was decided to use case study
analysis rather than a mail questionnaire because the information
needed for the analysis was too involved and merger definitions
too uncommon to make comparisons between different cooperatives.
Data on ex ante objectives and ex post operating results were
obtained by depth interviews with officers of the cooperatives or
boards of directors who were involved in the merger negotiations.
Usually, the data were obtained from interviews with the general
managers. Other necessary information came from financial and
other internal records. To make the interviews consistent, the

interviews were conducted with the aid of a questionnaire, which
appears in Appendix B.
Approach to Cost Measurement
As previously noted in the review of literature, most cooper-
atives merge to achieve economies of size via merger. To test
this hypothesis, some method of determining economies of size
had to be selected. Basically, there are three methods for deter-
mining economies of scale. These are (a) studies using accounting
cost and output data and employing least squares to estimate cost
relationships, (b) studies employing an economic-engineering
approach to synthesize input-output data to which costs can be
applied, and (c) Farrellts approach to measuring productive effi-
ciency. The most efficient method depends on the specific objec-
tives of the study and available resources for pursuing the re-
search. Because of the geographical dispersion of the sample
cooperatives and the expense involved in detailed time and motion
studies or estimation of productive functions, the accounting data
method was chosen, since "accounting records may give a rough,
but useful, approximation to economies of scale or variations in
relative efficiency among plants" (25, p. 579).
50

51
The arguments favoring the use of the accounting data
approach include (a) data are generally readily available, (b)
results are acquired at a low research cost, and (c) this approach
reflects real operating results rather than estimations or some
'ttheoretic ally optimal hypothetical operation.
However, the estimation of economies of size from accounting
data is not problem free. It is important in the estimation of short
run cost curves that (a) a physically homogeneous product be pro-
duced throughout the period, (b) no technical change should have
shifted the production function during the period, (c) the rate of
output varied over a wide range, and (d) costs and output were
recorded for the time period to which they apply. (10, p. 8089).
Traditional classical theory postulates cost curves that
apply to a situation under equilibrium, and therefore, the concept
is strictly timeless. Therefore, in the choice of a time period, one
must select one long enough to permit some variation in output,
yet short enough to assure a stable production function.
Accounting data also poses another problem because it is
for discrete periods. The accounting data has been generated
with considerable variation in the rate of output and time of opera-
tion within the period. Of course, such variation in the rate of
output cannot be separately considered. However, variations in

52
the seasonal, or in fact, daily, rate of output affect average annual
cost estimates. Thus, by using annual data, the researcher is
averaging various rates of output so that two firms with the same
output may not have the same average cost because of within-period
variation in plant utilization.
Even though accounting data does have these limitations, it
should give a fairly reliable approximation of any sizable variation
in the in-plant utilization over time. It seems also impossible to
make economic-engineering studies before and after mergers,
unless the profession accumulates data in a form that can be used
in subsequent studies (24).
Adjustments in Accounting Data
The basic accounting data used were from annual audit re-
ports from certified public accountants to the board of directors
of each association. These audit reports were collected for the
following years: one year prior to merger, approximately two
years after merger, and for their latest fiscal year. Additional
audit reports, if available, were collected for all acquired
cooperatives one year prior to merger. These audit reports were
checked with other time series information on the other years to
assure that the years chosen were not abnormal operating years.
53
After a preliminary examination of the audit reports of the
individual associations before and after merger, it was evident
that the following adjustments were necessary to make comparisons
of cost data over time. These are: (a) allocation of costs in mul-
tiple product operations, (b) changes in rates of depreciation, and
(c) deflation of input costs to make them comparable over time.
These adjustments are discussed consecutively below.
Allocation of Joint Costs: Two major decisions were made
concerning joint costs. The first decision involved the allocation
of fixed costs, or overhead costs, in multiple product cooperatives.
These joint costs were allocated by the manager or the accountant
only after careful and detailed analysis of the various factors that
affect each cost classification. Although these allocations are
somewhat arbitrary in the accounting data, or the engineering
approach, the services of a specialist were obtained if the manager
or accountant could not substantiate the cost allocations.
The second decision involved the allocation of costs between
primary commodities produced and by-products sales. This
problem was especially relevant to citrus associations that pack
fresh fruit and pool fruit with that of other locals for processing.
The direct costs were allocated by the-jr accountant, but all indirect

54
costs were allocated by the procedure developed by Tinley and Parks
(66, p. 39). They used the total number of packed boxes of fruit
packed.in determining direct unit costs of packing, and a calculated
packed box equivalent of all fruit handled to determine the indirect
unit costs. Tinley and Parks believe that this procedure may
underestimate actual unit costs, since packed fruit should bear a
more than proportionate share of overhead costs.
In two dairy processing cooperatives, small amounts of
dried buttermilk were included with the butter manufacturing
operation. It was impossible to separate the direct or indirect
cost of this process. This procedure should not affect the results
since the quantity of dried buttermilk produced was proportionate
to the pounds of butter manufactured.
Purchasing cooperatives posed a special problem in that
they handle a number of products. Hence, some small changes in
the product mix have taken place in the time period under study.
However, from accounting records it was not possible to construct
an index of output to make the comparisons over time more con-
sistent by weighting the products handled by some index of direct
labor or factor prices. While noting this limitation, it should be
qualified to the extent that changes in product mix have not fluctu-
ated enough to disregard costs as a percent of sales as an

approximation of economies of size.
Depreciation Rates: Additional adjustments were made for
changes in rates of depreciation on fixed assets. In order to com-
pare unit costs before and after merger, the rates of depreciation
should remain consistent over time. This is especially true if
changes in the rates of depreciation do not represent the actual
corsumption of the asset, but rather a policy variable depending
on changes in the tax structure. This depreciation adjustment was
considerable for some cooperatives and unimportant for others.
Since audit reports inventory fixed assets, the depreciation rates
were adjusted to those used before the merger was consummated.
Deflation of Costs: Another adjustment in the cost data for
marketing cooperatives was the correction for the general rise in
the prices of inputs. All cost data were therefore deflated to the
price level existing one year before merger to make the cost data
comparable over the period considered in the study.
It was deemed unnecessary to deflate the input prices of
purchasing cooperatives since the increase in the prices of the
input mix probably increased as much as the product mix, with
labor services an exception. Because of this inherent problem,
55

56
the results of the cost studies will be interpreted in light of this
limitation.
Although price indices are not available on specific cost
classifications for marketing cooperatives, the general trend
in the price level was adequately represented by the following
method. All labor costs were deflated by the average hourly
earnings of nondurable manufacturing workers. All manufacturing
supplies were deflated by the pulp, paper, and allied products
category of the wholesale price index. Utilities that normally
include items such as electricity, water, and gas were deflated
by the fuels and related products and power category of the whole-
sale price index. Interest paid on borrowed funds was deflated by
the average rate of interest on short term bank loans to business
in selected cities. This interest rate is more representative than
the interest rate charged by Banks for Cooperatives, since most of
the cooperatives in the sample borrowed funds from commercial
banks. Because typical indices are not sufficient to deflate all
other miscellaneous costs, these costs were deflated by the
wholesale price index for all commodities other than farm products
and food. Again, these indices cannot be precise, but they do
account for the general upward trend in major cost categories.

In light of the economic theory and methodology presented,
Chapter IV presents the operating results of an intensive case
study of a sample of 10 cooperatives that merged between 1956
and 1960. The names of the cooperatives are not mentioned
because the managements requested that they remain anonymous.
However, 2 of the cooperatives are located in the Pacific North-
west, 2 in California, 2 in Iowa, 1 in Michigan, 1 in Illinois, 1 in
Nebraska, and 1 in Kansas. The analysis, therefore, will be
presented by the size of the cooperative only.
57

IV, EMrIRICAL RESULTS: FIRM ANALYSIS
Expansion by merger may take place in a variety of direc-
tions. It may be planned to achieve a variety of objectives, and it
may fail for a variety of reasons. The purpose of this chapter is
to analyze the sample cooperativest costs of operation before and
after merger in light of ex ante growth and merger objectives.
Survey Results of Ex Ante Growth and Merger Objectives
Most cooperatives in the survey had more than one objective
for growing and more specifically, growing by merger. The cooper-
atives in the sample had an average of 2. 1 objectives. One of the
objectives was common to all sampled cooperatives, while others
depended on the cooperatives specific economic environment.
Even though cooperatives may have similar objectives for growth,
each objective may differ in its degree of importance to each firm.
In the sample cooperatives interviewed, the following objec-
tives were noted: (a) achieving economies of size, (b) providing
improved services to member patrons, (c) erecting barriers to
entry, (d) gaining market and bargaining powers (e) achieving
product diversification, (f) assuring a source of supply, and (g)
obtaining facilities, Table 7 summarizes the responses of
58
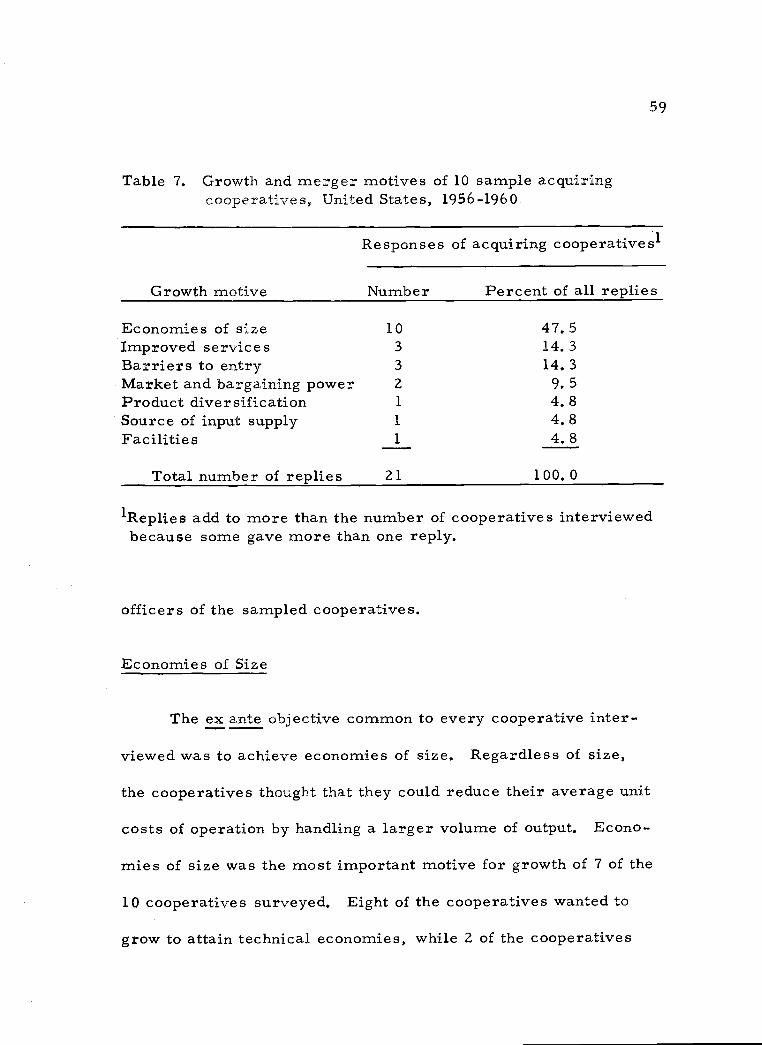
Table 7. Growth and merger motives of 10 sample acquiringcooperatives, United States, 1956 -1960..
59
1Replies add to more than the number of cooperatives interviewedbecause some gave more than one reply.
officers of the sampled cooperatives.
Economies of Size
The ex ante objective common to every cooperative inter-
viewed was to achieve economies of size. Regardless of size,
the cooperatives thought that they could reduce their average unit
costs of operation by handling a larger volume of output. Econo-
mies of size was the most important motive for growth of 7 of the
10 cooperatives surveyed. Eight of the cooperatives wanted to
grow to attain technical economies, while Z of the cooperatives
Growth motive
Responses of acquiring cooperatives1
Number Percent of all replies
Economies of size 10 47.5Improved services 3 14. 3Barriers to entry 3 14. 3Market and bargaining power 9. 5Product diversification 1 4. 8Source of input supply 1 4. 8Facilities 1 4. 8
Total number of replies ZI 100. 0

sought distribution as well as technical economies of size.
This objective does not seem unreasonable, as economic
theory suggests, since most agricultural cooperatives are small
firms regardless of the size measurement used. In addition,
other merger feasibility studies and studies of agricultural
processing industries show substantial cost savings to be gained
from large scale operations. 8
Some of the advantages of larger size were implied by the
following explanations: (a) "more efficient operation from a larger
busine ss, (b) '1a larger volume lowers operating costs, (c)
"desired a common merchandising benefit," and (d) "wanted
greater distribution efficiency.
Cost Studies
60
Average costs in this study are separated for explanatory
purposes into two cost classifications. They are (a) fixed costs
and (b) variable costs. Whether or not a cost was classified as a
fixed or variable expense depended solely on whether or not the
cost varied directly with the rate of output ofthe cooperative.
few selected references are listed, but this list is far frombeing exhaustive. See references (49, 50, 51).

Because of the interi.ndustry nature of the cooperatives in
the sample, one cost classification may be a variable cost for
one type of cooperative, but may well be a fixed cost for another
type of cooperative. However, in any aggregate cost classifica-
tion system, some of the fixed cost may include some portion of
variable costs and vice versa; but so long as the classifications
are made consistently, they are useful for the purpose at hand.
As previously mentioned, cost data were not available for
all of the acquired cooperatives prior to merger. However, all
cost data on the acquiring cooperative were collected for the
periods one year prior to merger, approximately two years after
merger, and for their most recent fiscal year ending in 1965 or
1966.
Since the attainments of these cooperatives can only be
measured in terms of their objectives, if economies of size are
accomplished, the average total costs of the acquiring cooperative
should decrease after merger as volume increases. Each of the
cost studies of the 10 cooperatives interviewed in the sample will
be numbered 1 through 10 to maintain the anonymity desired by
the cooperatives. The cost studies follow consecutively by the
size of the cooperative as measured by annual dollar sales volume
with the smallest cooperative first.
61

62
Case 1:
Cooperative I, a small purchasing cooperative in the Midwest,
acquired, in 1955, another small purchasing association in a
neighboring county located 39 miles from its office. The acquired
cooperative had annual sales of approximately $150, 000 and the
acquiring cooperative $205, 000 at the time of consummation. The
acquired and acquiring cooperatives had assets of $20, 000 and
$83, 000, respectively, at the time of merger.
As shown in Table 8, variable costs as a percent of net
sales for the acquiring cooperative increased from 2. 75 percent
in 1954, one year before merger, to 6. 99 percent in 1956 and
remained at 6. 99 percent in 1965. The increase in variable cost
was due to hiring four salesmen in an attempt to increase sales.
However, because of the competition from other cooperatives in
the area, salesmen's salaries and commissions increased five-
fold, while net sales increased only 16. 4 percent.
Fixed costs as a percent of sales increased from 9. 16 per-
cent prior to merger to 11. 91 percent two years after merger to
12.51 percent in 1965. The increase in fixed costs is accounted
for by insurance, advertising, repairs, travel, depreciation, and
miscellaneous costs that are associated with an expansion of the
sales staff and the introduction of liquid fertilizers and applicators.

Table 8. Cooperative I. Costs as percent of net sales prior and subsequent to merger, 1954, 1957,and 19651
Net sales
2 3Cooperative A Cooperative AB Cooperative AB
l954 1957 1965
$204,875 $424,618 $534,483
Percent Percent Percent
Variable costs -Truck expenseSalesmen's salaries
Total variable costs
Fixed costs -Manager's salaryOffice salaries
2. 75. 40
6. 59. 82
6. 172. 75 6 ,99 6. 99
2.632.87
1.312.77
1.481.75
Depreciation . 61 2. 35 3. 34Fertilizer expense . 03 . 05General taxes . 32 . 55 . 66
Insurance . 12 .28 .47Repairs and maintenance . 05 82 1. 06Office supplies .71 . 33 .28Advertising and promotion . 27 . 66 . 54Telephone . 22 . 28 . 39Payroll taxes . 15 . 37 . 30Travel expense .38 . 66 .31
Continued

Table 8. Cooperative I. Costs as percent of net sales1prior and subsequent to merger, 1954, 1957,and 1965 -- continued
1All input costs are deflated to the 1954 price level.2Acquiring cooperative costs one year before merger.3Combined costs of the cooperatives two years subsequent to merger.4Accounting data for 1954 were not available for the acquired cooperative.
Cooperative A2 Cooperative AB3 Cooperative AB
l954 1957 1965
Professional fees . 31 . 27 . 29
Utilities . 26 . 06 . 24Rent 29 .34Small tool expense . 06
Miscellaneous . 23 . 86 1. 00Total fixed costs 9. 16 11.91 12. 51
Total operating costs 11.91 18.90 19.50

65
It is significant to note, however, that managerial salaries, office
salaries, and office supplies expenses decreased as a percent of
sales subsequent to merger.
However, because of expansion costs, total costs as a percent
of sales increased from 11. 91 percent before merger to 18. 9 per-
cent in 1957 to 19. 5 percent in 1965.
Another measure of efficiency is to compare the amount of
input required to produce a given amount of output. This measure
is the ratio of expenses to gross operating income (42). A smaller
ratio indicates higher efficiency. Before merger, Cooperative I
spent 75 cents to obtain one dollar of gross operating income. Two
years after merger, expenses to gross operating income increased
to $1. 09, and in 1965 to $1. 31. This ratio substantiates the cost
study showing higher costs per unit of revenue.
Although expenses are increasing over time, the rate of
return on investment may be increasing. Three measures of the
rate of return are meaningful (18, p. 358). These are (a) net
savings as a percent of sales, (b) ratio of net savings to memberst
equity, and (c) ratio of net savings to total assets.
Because of increased competition by the entry of another
cooperative in the area and the increased costs of meeting that
competition in liquid fertilizer, savings as a percent of sales fell

from 8. 58 percent one year prior to merger to . 05 percent two
years after merger to (. 86)percent in 1965. 9 A similar trend was
found in the other measures of the rate of return on investment.
During the 10 years following the merger, Cooperative I
has had the services of five managers. Some of these managers
have resigned while others have been relieved from their duties
for dubious practices. Because of these practices, the percent
of member patron business fell from 80 percent before merger
to 20 percent in 1965.
This cooperative was profitable before the merger. The
acquiring cooperative had expanded its sales, savings and patron-
age dividends each year since its organization in 1948. But, be-
cause of the entry of a new cooperative and poor management
practices, the cooperative was unable to achieve its ex ante
objectives of increased efficiency and expansion into the fertilizer
industry. The cooperative has not been able to pay a patronage
refund in the last 10 years of operation and has operated at a
savings in only 5 of the last 10 years since merger.
9The parentheses indicate a negative rate of return.
66

67
Case 2:
The second cooperative in the sample was a citrus packing
house in Southern California. Again, the acquiring cooperative
was larger than the acquired citrus association. The acquiring
and acquired cooperatives handled 377, 356 and 263, 986 thirty-
nine and one-half pound carton equivalents, respectively.
The average variable cost of packing oranges before merger
for the acquired cooperative was 55. 8 cents per carton, while for
the same year the acquiring cooperative packed oranges for 44. 5
cents per carton (Table 9). Two years after the operations were
combined, the united organization packed fruit at a variable cost
of 40. 6 cents per carton. Again, by 1965, average variable costs
decreased to 40. 0 cents per carton. Variable costs per packed
carton were reduced with the increased quantity handled after
merger.
The acquired cooperative had average fixed costs per carton
of 11. 9 cents, compared to the acquiring cooperative's cost of 9. 7
cents per carton one year prior to unification. After the union,
average fixed costs increased to 11.8 cents and to 11. 7 cents in
1965. Administrative salaries increased proportionately more
than output to increase the average fixed costs from 2. 9 cents per
carton in 1955 to 4. 0 cents per carton in 1958 after consolidation.

Table 9. Cooperative II. Average packing costs prior and subsequent to merger, 1955, 1958, and19651
continued
Variable costs -
Unit costs Unit costs Unit costs Unit costsTOollars Dollars Dollars Dollars
Packing materials and supplies 304 265 351 248Packing house labor 212 158 134 128Utilities * 010 009 010 016Machinery expense 014Contract packing fee 015Administrative fee 003 013 011 008
Average variable costs 558 445 406 400
Fixed costs -Repairs 003 002. 005Office expense 003 002 001 002Rent 006 001Administrative salaries 041 02.9 040 047Taxes 016 017 019 015Telephone 001 003 003 003
Packed cartons 165, 151 246, 562 2.17,646 2.42, 503All fruit handled - carton equivalent 263, 986 377, 356 380, 732 454, 708
Cooperative2 Cooperative3 Cooperative4 CooperativeA B AB AB
1955 1955 1958 1965

Table 9. Cooperative II. Average packing costs prior and subsequent to merger, 1955, 1958, and19651 - -continued
2 .3Cooperative Cooperative
1 All input costs are delfated to the 1955 price level.2Acquired cooperative's costs one year before merger.3Acquiring cooperative's costs one year before merger.4Combined costs of the cooperatives two years subsequent to merger.
Cooperative4 CooperativeA
1955B
1955AB
1958AB
1965
Automobile expense . 007 . 004 005 001General expense . 012 . 006 009 005Insurance .017 .013 .010 019Interest . 002 . 002 001Depreciation .014 .017 027 014Pre.-cooler . 001 006
Average fixed costs . 119 . 097 .118 117
Average total costs .677 .542 524 .517

70
Administration salaries, insurance, taxes, and repairs accounted
for additional increases in average fixed costs in the post merger
period.
Average total annual costs were 67. 7 cents and 54. 2 cents
per carton before merger for the acquired and acquiring coopera-
tives, respectively. Two years after merger, the deflated total
average costs decreased to 52. 4 cents, and to 51. 7 cents per
carton by 1965.
One year before merger, the ratio of expenses to gross
operating income was . 93 for the acquired cooperative and . 78
for the acquiring cooperative. Two years after merger, the ratio
fell to . 71 and increased to . 83 in 1965. This efficiency ratio
substantiates the cost studies. The increase in 1965 was due to
increases in labor costs for the installation of new equipment.
Savings as a percent of sales, a measure of the rate of return
on investment, was 8. 71 percent and 16. 11 percent before merger
for theacquired and acquiring cooperatives, respectively. Two years
after the merger, the rate of return increased to 17.63 percent,
which is consistent with a priori theoretical results of merger. How-.
ever, by 1965 the rate of return fell to 7. 37 percent. The ratios of
earnings to total assets and earnings to member's equity show

the same results.
An adjustment in labor costs in 1965 was made because of
the installation of a pallet lift conveyor system that was not a
variable cost to the packing of fruit.
Case 3:
Another citrus packing house was selected in the sample.
This cooperative was located in Orange County, California, and
was a member of Sunkist Growers, Inc. Before merger, Coopera-
tive III packed the equivalent of 959, 484 cartons of oranges. The
acquired cooperative packed approximately 232, 848 cartons one
year prior to merger. Two years after merger, the combined
association's volume dropped 294, 668 carton equivalents and fell
another 190, 400 carton equivalents from 1961 to 1963. Because
of urban and industrial expansion in Orange County, bearing
Valencia acreage decreased from 63, 799 acres in 1949 to 22, 186
in 1964. Also Valencia production has fallen from 17. 0 million
field boxes (89 pounds) to 4.8 million field boxes or 71.8
percent (6).
One year before merger, the acquiring cooperative's average
variable cost per packed carton was 43. 1 cents (Table 10). Two
years after merger, average variable costs increased . 8 cents
per carton and increased another 2. 1 cents per carton by 1963 as
71

Table 10. Cooperative III. Average packing costs prior and subsequent to merger, 1958, 1961, and19631
Cooperative 2 Cooperative CooperativeA4 AB AB
1958 1961 1963
continued
Variable costs -
Unitcosts
Unitcosts
Unitcosts
(dollars) (dollars) (dollars)
Packing materials . 240 . 233 . 220Fruit treating . 022 . 022 . 023Packing house labor . 164 . 177 . 208Committee assessments . 005 . 007 . 009
Average variable costs . 431 . 439 . 460
Fixed costs -Salaries . 013 .016 . 020Maintenance and repairs . 003 . 002 . 001Utilities . 003 . 004 . 005Insurance (property) . 003 . 003 . 003Other insurance . 006 . 007 . 011
Packed cartons 511,387 442,188 315,449All fruit handled - cartonequivalent 959,484 897,664 707,264

1 All input costs are deflated to the 1958 price level.2 Acquiring cooperative's costs one year before merger.3 Combined costs of the cooperatives two years subsequent to merger.4 Accounting data for 1958 were not available for the acquired cooperative.
Table 10. Cooperative III. Average packing costs prior and subsequent to merger,19631 -- continued
1958, 1961 and
Cooperative 2A
1958
Cooperative 3 CooperativeAB AB1961 1963
Payroll taxes . 008 .010 012General taxes . 004 . 005 005Office supplies . 003 . 003 003Administrative expense . 002 . 001 001Telephone .001 .001 001Miscellaneous . 004 . 006 004Interest . 001Depreciation . 007 . 009 003
Average fixed costs . 057 . 068 069
Average total costs . 488 . 507 . 529

74
the volume of output fell. Higher direct packing house labor
costs explain the major increase in average variable costs.
Average fixed costs increased from 5. 7 cents in 1958 to 6. 8
cents in 1961 to 6. 9 cents per carton in 1963. The largest increase
in fixed costs was for fixed labor services.
Since the average variable and fixed costs increased per
carton, average total costs also increased. Average total costs
increased from 48. 8 cents per carton in 1958 to 50. 7 cents in 1961
to 52. 9 cents in 1963, when the member growers decided to liqui-
date the cooperative because of high costs and the change in com-
parative advantage for land in Orange County. The ratio of ex-
penses of the cooperative to the total value of the members' orange
crop increased from . 15 before merger to . 20 in 1961 to . 21 in
1963.
Because this cooperative's records are maintained on a cost
basis, a rate of return cannot be calculated. The ratio of total
returns to growers to total assets has fallen from 1. 69 before
merger to 1. 07 after merger.
This cooperative was unable to achieve economies of size
because of a change in comparative advantage, but it is evident
that the cooperative probably minimized the costs of packing the
fruit through merger, since their costs probably would have been

higher for a reduced volume from its own members caused by
the urban and industrial expansion.
Case 4:
The fourth cooperative interviewed was a dairy manufacturing
association in central Michigan. This cooperative, with the aid
of its regional association, acquired a very small dairy manu-
facturing plant 39 miles southwest of its manufacturing plant. The
acquiring and acquired cooperatives before merger in 1956 manu-
factured 2. 7 million and 213, 000 pounds of butter, respectively.
The average total direct manufacturing costs of the acquired
cooperative was 9. 1 cents per pound compared to 3. 0 cents per
pound for the acquiring cooperative before merger (Table 11).
Two years after consolidation, the direct manufacturing costs
increased slightly to 3. 2 cents per pound and remained at that
level in 1965. However, in 1960, the acquiring association sold
the acquired cooperative because of a shortage of manufactured
milk. As a consequence of changes in the comparative advantage
of milk production in the area, the cooperative relied on surplus
milk from the Muskegon milkshed. Surplus milk used increased
from 2.2 million pounds in 1957 to 18. 1 million pounds in 1964.
In 1966, because of a consolidation of the federal milk marketing
75

Table 11. Cooperative IV. Average costs of processing milk prior and subsequent to merger, 1956,1958, and 19651
Pounds of butter manu-factured 213, 030Pounds of powder manu-factured
(Dollars)
Variable costs -Factory labor 048 016 017 018 .017 014Materials and supplies 025 .010 008 008 008 .010Utilities 013 002 002 020 003 014Miscellaneous manufacturing
expensePayroll taxes 002 001 .001 .001 .001 .001Freight expense 002 020 004Marketing fees 003 001 .004 .004 .003 .004
Average variable costs 091 030 .032 .071 .032 .047
Fixed costs -AdvertisingMaintenance and repairs . 002 003 .002 .003 .001 .002Depreciation 010 .002 .004 .004 .004 .006
continued
Cooperative Cooperative Cooperative - CooperativeA B AB AB1956 1956 1958 1965Butter Butter Butter Powder Butter Powder
2, 726, 968 2, 688, 956 2, 485, 423
1,392,987 2,450,570(Dollars) (Dollars) (Dollars) (Dollars) (Dollars)

Table Ii. Cooperative IV. Average costs of processing milk prior and subsequent to merger, 19561958, and 19651 -- continued
.2Cooperative Cooperative3 Cooperative4
'All input costs are deflated to the 1956 price level.2Acquired cooperative's costs one year before merger.3Acquiring cooperative's costs one year before merger.4Combined costs of the cooperatives two years subsequent to merger.
CooperativeA
1956Butter
B1956
Butter
AB1958
Butter Powder
AB1965
Butter Powder
General taxes 001 001 001Salaries 006 006 002 005 .002 .002Office supplies 001 001 001
TelephoneProfessional fees 001 001Interest 003 002 002Miscellaneous 002 .001 .001 .001 .001Property taxes 004 001 .001 .001 .001 .001LicensesInsurance .003 .001 .001 001 .001 .001Storage 001
Average fixed costs .030 .018 .014 017 .011 .015
Average total costs .121 .048 .046 088 .043 .062

78
orders in Muskegon and southern Michigan, surplus milk was con-
sumed in the Detroit metropolitan area. This factor forced the
cooperative to liquidate because tie cooperative could not effi-
ciently process the small amount of its members' milk at pre-
vailing market prices.
Average fixed costs per pound of butter was 3. 0 before
merger for the small acquired cooperative. The acquiring asso-
ciation's average fixed costs were 1. 8 cents per pound before
merger. However, they decreased from 1.4 cents to 1. 1 cents per
pound from 1958 to 1965 (Table 11).
Even though the average variable costs of butter increased
per pound as the volume of butter manufactured decreased,
average fixed costs fell as the result of spreading their fixed
costs over their powder operation which they started in 1957.
Therefore, while the average total cost prior to merger with the
acquired cooperative was 12. 1 cents per pound, the acquiring
cooperative manufactured butter for 4. 8 cents per pound in 1958
and 4. 3 cents per pound in 1965.
Savings as a percent of sales were (2. 07) for the acquiring
cooperative before merger compared to 1. 03 for the acquiring
cooperative in the same time period. Subsequent to the entry
into the powder operation in 1957, the rate of return fell to . 52

79
percent in 1958 and to (.30) percent in 1965 because of the nigh
costs of producing powder and butter. Therefore, tne percent of
expenses to sales increased from . 9 percent one year before merger
to 13.9 percent two years after merger to 11.3 percent in 1965.
While some economies of size were achieved through merger
from tiAe use of surplus milk, the change in the comparative advan-
tage of milk producers forced the sale of the acquired plant only
four years after it was acquired.
Case 5:
The fifth cooperative in the sample was a purchasing and grain
cooperative in Kansas. This cooperative acquired a small pur-
chasing cooperative having financial difficulties, located about 40
miles from its central office. The acquired cooperative had net
sales of $74, 627 in 1956 compared to the acquiring cooperative's
sales of $1.3 million for the same year's operation.
Total variable costs as a percent of sales were 19. 56 per-
cent for the acquired cooperative one year before merger and 6. 79
percent for the acquiring cooperative. Two years after consolida-
tion, variable costs as a percent of sales decreased for the
acquired business to 12. 40 percent because of decreases in the
variable costs, but primarily labor, as a percent of sales. During
the same year, however, variable costs as a percent of net sales
80
for the acquiring cooperative increased to 9. 87 percent as sales fell
about $65, 000. By 1965, however, the acquired cooperativets sales
dropped $18, 740 and variable costs as a percent of sales increased
to 19. 64 percent, which is higher than the variable costs of the
association before merger. On the other hand, in 1965, the ac-
quiring cooperative's variable costs as a percent of sales decreased
to 8. 75 percent. (Table 12).
Total fixed costs as a percent of sales of the acquired cooper-
ative dropped from 7. 22 percent prior to merger to 2. 28 percent
two years subsequent to merger. The reduction in fixed and var-
iable costs was the result of better utilization of inputs at this
branch office through the expansion of facilities to handle grain.
However, fixed costs increased in 1965 to 12. 07 percent of sales
The increase in fixed costs is attributed to the building of a new
plant, necessitated because the acquired pl ant was destroyed by a
fire in 1959.
Total costs as a percent of sales for the acquired cooperative
decreased from 26. 78 percent before merger to 14. 68 percent in
1958, two years after merger. However, the acquiring coopera-
tive's total costs as a percent of sales increased from 11.49 per-
cent to 17. 50 percent as volume fell 4. 8 percent. Major increases
in cost for the acquiring cooperative were for additional elevators.

Table 12. Cooperative V. Costs as percent of net sales prior and subsequent to merger, 1956, 1958and 19651
Net sales
.2 .3 .4 .5Cooperative Cooperative Cooperative Cooperative Cooperative CooperativeA B A AB A AB
1956 1956 1958 1958 1965 1965(Dollars) (Dollars) (Dollars) (Dollars) (Dollars) (Dollars
74,627 1,346,169 87,637 1,280,841 68,897 2,655,985
Percent ofsales
Percent ofsales
Percent of Percent ofsales sales
Percent ofsales
Percent ofsales
Variable costs -Truck expense 1.23 1.44 1. 18Salaries 15. 37 5. 94 9. 77 8.50 15.88 7. 36Utilities 1.02 .31 .36 .51 .62 51Plant supplies . 99 . 25 .48 . 52 1. 00 29Repairs . 95 . 29 . 35 . 34 . 96 59
Average variablecosts 19.56 6.79 12.40 9.87 19.64 8. 75
Fixed costs -Rent - - - . 24 24 . 44 . 06Office supplies .50 .14 .07 .25 .47 .23Telephone .41 . 09 .32 . 17 .20 . 11General taxes .99 . 78 .53 .90 1. 72 1.24Licenses . 02 . 05 . 15 . 13 . 14
continued

Table 12. Cooperative V. Costs as percent of net sales prior and subsequent to merger, 1956, 1958and 19651 -- continued
Cooperative Cooperative3 Cooperative4 Cooperatives Cooperative CooperativeA B C AB A AB
1A11 input costs are deflated to the 1956 price level.2Acquired cooperative's costs one year before merger.3Acquiring cooperative's costs one year before merger.4Acquired cooperative's costs two years after merger.5Combined costs of the cooperatives two years subsequent to merger.
1956 1956 1958 1958 1965 1965
Insurance .60 .64 .15 .76 81 49Interest . 08 . 07 1..00 1. 80 1. 58Auditing . 40 . 04 - - - 04 03
Legal expense . 12 01
Travel . 18 . 12 25 13
Advertising . 82 . 52 .09 .87 .70 .52Depreciation 1. 78 1. 75 .88 2.81 5.29 2.86Miscellaneous 1.32 .25 .09 .21 .63 ,,32
Average fixedcosts 7. 22 4. 70 2.28 7.63 12. 07 7. 71
Average totalcosts 26.78 11.49 14.68 17.50 31.70 16.46

83
Because of additional storage capacity, income increased at a
faster rate than costs, therefore, the rate of return increased after
merger. Savings as a percent of sales increased from 12. 38 percent
one year before merger to 21. 70 two years after merger. Savings
as a percent of sales decreased to 8. 21 percent by 1965 because
of a change in C. C. C. storage income. In fact, one year before
merger, the acquiring cooperative spent 49 cents to obtain one
dollar of gross operating income. Two years after merger, it
took 45 cents and in 1965 approximately 75 cents to obtain one
dollar of gross operating income because of the change in C. C. C.
storage programs.
Case 6:
Cooperative VI was another dairy manufacturing plant in
the Midwest. The acquiring cooperative at the time of merger was
producing 5. 4 million pounds of butter and 9. 4 million pounds of
powder, -while the small acquired cooperative produced only
780, 000 pounds of butter in the same year. The plants were.
located only 16 miles apart.
Before merger, the acquired cooperative's average variable
cost per pound of butter was 6, 2 cents per pound, compared to the
acquiring cooperative's 2, 0 cents per pound to manufacture butter

84
and 2. 2 cents per pound to manufacture powder. Subsequent to
amalgamation, direct manufacturing costs increased to 2 .1 cents
per pound for butter, but decreased slightly from 2. 2 to 2 .1 cents
per pound in manufacturing powdered milk. In 1965, the direct
costs of manufacturing butter dropped to 1. 9 cents per pound,
while the manufacturing costs of powder decreased to 2. 0 cents
per pound with the increased output of butter and powder.
Average fixed costs of the acquiring cooperative, on the
other hand, increased from . 5 cents per pound in 1958 to . 9 cents
per pound in 1961 and remained at . 9 cents in 1965 for the manu-
facturing of butter. The average fixed costs of manufacturing
powder in the acquiring association rose steadily from . 8 cents
per pound before merger to .1. 1 cents in 1961 and to 1. 3 cents per
pound in 1965. The rising per unit fixed costs have been caused
by increased depreciation charges on equipment and buildings
acquired in four other mergers since 1961. Had the other mergers
not been made, this cooperative's average costs of production
would have probably increased anyway, since it acquired approxi-
mately 20 percent of its milk supply.
The average total costs of manufacturing butter in the ac-
quired association's plant was 9. 0 cents per pound. Because of
economies of scale in the manufacture of butter, the acquiring

association manufactured butter for 2. 5 cents per pound before
merger and for 3. 0 cents per pound in 1961 (Table 13). During
this same period, the average total costs of manufacturing powder
increased from 3. 0 cents to 3. 2 cents per pound.
Savings as a percent of net sales decreased from 6. 15 per-
cent one year before merger to 3. 00 percent two years after mer-
ger because the price of milk increased from $3. 06 to $3. 46 per
hundredweight and total costs increased 7 cents per pound. The
rate of return decreased to . 35 percent because of increased costs
of producing powder and falling butter prices.
Case 7:
Theonly vertical acquisition in the sample was made by
Cooperative VII. This purchasing:cooperative in the Pacific North-
west acquired an apple brokerage cooperative in the same city.
Individual accounting records were kept on each cooperative
separately so that the brokerage operation can be analyzed in the
pre-merger and post-merger periods.
Before merger, the brokerage cooperative handled 1. mu-
lion boxes of apples (Table 14). In the post merger period, this
cooperative sold 1. 6 million boxes of apples in 1959 and about 1. 8
million boxes in 1965,
85

Table 13. Cooperative VI. Average costs of processing milk prior and subsequent to merger, 1958,1961, and 19651
Cooperative2 cooperative3 Cooperative4 CooperativeA B AB AB
195'8 1958 1961 1965Butter Butter Powder.: Butter Powder Butter Powder
continued
Pounds of butter manufac-tured
Pounds of powder manufac -tured
780, 366 5, 379, 262
9, 399,
6, 686,
950
968 8, 254, 075
11, 367, 750 13, 131, 504(Dollars) (Dollars) (DdLlars) (Dollars )(Dollars )(Dollars)(Dollar s)
Variable costs -Brokerage -Miscellaneous manufacturing . 002 . 001 . 002Factory labor . 024 . 009 . 006 . 009 - 006 . 008 . 006Utilities .011 .004 .007 .004 .007 .004 .006Packages .011 .004 .003 .005 .002 .004 .001Creamery supplies . 012 . 002 . 002 . 002 . 003 . 001 . 003Salt , 001Repairs . 003 . 001 . 002 . 001 . 002 . 002 . 002
Average variable costs . 062 . 020 . 022 . 021 . 021 . 019 . 020
Fixed costs -Salaries . 005 . 001 . 001 . 001 . 001 - 001 . 001Office supplies . 001 . 001Telephone

Table 13. Cooperative VI. Average costs of processin milk prior and subsequent to merger, 1958,1961, and 1965' - - continued
'All input costs are deflated to the 1958 price level.ZAcquired cooperative one year before merger.3Acquiring cooperative one year before merger.4Combined costs of the cooperatives two years subsequent to merger.
Cooperative2A
1956Butter
Cooperative3B
1958Butter Powder
Cooperative4 CooperativeAB AB1961 1965
Butter Powder Butter Powder
Insurance 002 001 .001 .001 .002 .001Adve rti sing 001Professional fees 001General taxes 004 001 001 .002 .001 .002 .001Miscellaneous 001 001 .001 .001 .002 .002Depreciation 01.2 001 004 .003 .005 .002 .007Interest vol 001 002 001
Average fix&d costs 028 .005 .008 .009 .011 .009 .013
Average total costs .090 .025 .030 .030 .032 .028 .033

Table 14. Cooperative VII. Average costs prior and subsequent to merger, 1956, 1959, and 19651
Variable costs -Telephone 012 .013 015Brokerage paid 033 001Salaries 031 044 035 2. 56 2. 73 3. 66
Average variablecosts 076 .058 .050 2. 56 2.73 3.66
Fixed costs -Advertising 001 .003 .002 17 .20 .14Depreciation .001 .001 38 .40 .38Directorst Fees 001 04 04Utilities 06 05
Insurance 002 .002 .003 21 .23 .29Interest .10 .18 .09Professional fees 08 .09 .14Office supplies 005 .005 .005 .10 .13 .19
continued
Cooperative2 Cooperative3 Cooperative Cooperative4 Cooperative5 CooperativeA A A B B B
1956 1959 1963 1956 1959 1965Fruit Fruit Fruit Supplies Supplies Supplies
Number of boxeshandled 1,212, 029 1,617,397 1,751,403
Net sales 2, 939, 946 4, 049, 164 5,507, 236Unit cost Unit cost Unit cost Percent Perc ent Percent(Dollars) (Dollars) (Dollars) of sales of sales of sales

Table 14. Cooperative VII. Average costs prior and subsequent to merger, 1956, 1959, and 19651Continued
Cooperative2 Cooperative3 Cooperative Cooperative4 Cooperative5 Cooperative
1 All input costs are deflated to the 1956 price level.2 Acquired cooperative's costs one year before merger.3Acquired cooperative's costs two years after merger.4Acquiring cooperative's costs one year before merger.5Acquiring cooperative's costs two years after merger.
A1956Fruit
A1959Fruit
A1965Fruit
B1956Supplies
B1959
Supplies
B1965
Supplies
General taxes . 001 . 001 . 003 . 70 .65 . 76Travel expenses . 005 . 004 .008 . 26 .30 .41Telephone . 10 . 11 . 16
Miscellaneous costs .003 . 001 . 007 .55 . 19 . 15
Rent . 001Average fixed costs . 019 . 017 . 029 2. 76 2. 57 2. 71
Average total costs . 095 . 75 079 5.32 5.30 6.37

90
Average variable costs decreased from 7. 6 cents per box
prior to merger to 5, 8 cents two years after merger to 5. 0 cents
per box in 1965. Average variable costs per box were reduced
because of changes in distribution outlets. In the period before
merger, the association was merchandising apples in the major
auctions in the Midwest and on the eastern seaboard. However,
two years after merger due to the growth of chain stores in the Far
West which provided direct selling outlets, the association was
able to save approximately 3. 3 cents per box in commission fees.
This savings is attributed to the merger because it is associated
with the acquiring cooperativs management as any integration
would be.
Average fixed costs per box decreased from 1. 9 cents
prior to merger to 1. 7 cents two years after merger. In l965
average fixed costs increased to Z. 9 cents per box because of
additional travel and miscellaneous expenses that are associated
with the change in distribution outlets.
Average total costs were reduced as a direct result of
merger since average variable costs were decreasing more
rapidly than average fixed costs were increasing. Before merger,
average total costs amounted to 9. 5 cents per box. After merger,
average total costs fell to 7. 5 cents per Wox and then increased

slightly to 7. 9 cents per box in 1965.
The acquiring purchasing association reduced its total
costs as a percent of sales from 5. 32 percent before merger to
5. 30 percent in 1959, By 1965, total costs as a percent of sales
increased to 6. 37 percent. Despite the rising costs of operation,
savings as a percent of sales increased from 2. 89 before merger
to 3. 49 two years after merger to 5. 61 percent in 1965.
Case 8:
A regional wholesale purchasing association in the Pacific
Northwest with net sales of $7. 4 million acquired another medium
size wholesale purchasing cooperative with sales of $1. 3 million
in 1956. The acquired regional association was located in an
adjacent state. Cooperative VIII and its acquired component were
members of the same national farm organization.
Before the acquisition, the acquired cooperative's variable
costs -were 1. 97 percent of net sales compared to 1. 49 percent for the
acquiring association. After consolidation, variable costs increased
to 2 percent of sales in 1959-1960 and to 3. 35 percent in 1965-1966
(Table 15). Increased labor costs associated with increased serv-
ices represent most of the increase in costs.
Fixed costs as a percent of sales increased for the
acquiring cooperative from 1. 75 percent before merger to 1. 82
91

Table 15. Cooperative VIII. Costs as percent of net sales prior and subsequent to merger, 1956,1959, and 19651
'.0
Net sales 1,320, 146 7,377, 963 10, 463, 123 12, 570, 225
Variable costs -Truck expenseSalaries
Percentof sales
. 121. 85
Percentof sales
.011, 48
Percentof sales
. 061.94
Percentof sales
083.27
Total variable costs 1.97 1.49 2. 00 3. 35
Fixed costs -Advertising .31 . 06 . 08 . 15
Utilities .07 . 04 . 05 . 11
Rent .25 .08 .01Insurance . 06 , 07 09 . 11
General taxes .23 .34 35 .60Depreciation .11 .21 .17 .27Directors .10 08 . 07 . 19
Travel .62 .14 .10 .37Telephone . 20 . 07 . 23 . 14
Office expense .08 .09 . 10 .58Freight . 05Miscellaneous .33 .23 .14 .51
Continued
Cooperative2 Cooperative3 Cooperative4 CooperativeA B AB AB1956 1956 1959 1965

Table 15. Cooperative VIII. Costs as percent of net sales prior and subsequent to merger, 1956,1959, and 19651 --continued
1 All input costs have been deflated to the 1956 price level.2Acquired cooperative!s costs one year before merger.3Acquiring cooperativet s costs one year before merger.4Combined cost of the cooperatives two years subsequent to merger.5Transport operation is a separate operation. This operation is handled separately to make costs
comparable for the acquired and acquiring associations.
Cooperative2 Cooperative3A B
1956 1956
Cooperative4AB1959
CooperativeAB
1966
Repairs and maintenance .03 .03 .03Professional fees .04 .10 17
Interest '39 27
Total fixed costs 2.48 1.75 1.82 3.48
Total operating costs 4.45 3,24 3. 82 6. 83
Transport operation5 3.41 2, 71 2. 57
Total costs 4.45 6. 65 6. 53 9.40

94
perceritii1959-l96O to 6.83 percent in 1965-1966.
Because of increased labor costs, total costs as a percent of
sales,. excluding the transport division, increased for theacquiring
cooperative from 3. 24 percent prior to merger to 3. 82 percent
two years subsequent to merger to 6. 83 percent in 1965-1966.
However, because of the increase in the number of local coopera-
tives serviced by the transport division, total costs as a percent of
sales decreased from 6. 65 percent before merger to 6. 53 percent
in 1959-1960.
The rate of return--savings as a percent of net sale s--
decreased slightly from 2. 78 percent before merger to 2. 44 percent
two years. after merger. Even though costs increased rapidly in
1965, savings as a percent of sales increased to 3. 31 percent.
Case 9:
The ninth cooperative in the sample was a milk bargaining
association in the Midwest that handled 3.1 million hundredweight
of rnlllç for its members in 1957. With the acquisition of another
bargainIng association in the state, the acquiring association in-
creased its share of the milk supply in the area from 40 to 60
percenj.
Although accounting data were not available for the acquired

95
cooperative, the acquiring association's average variable costs
were 4. 3 cents per hundredweight before merger, 5. 6 cents per
hundredweight two years after merger and 4 cents per hundred-
weightin 1966. Most of the increase in variable costs was because
of permit fees for testing milk which increased their average vari-
able costs from three tenths of a cent per hundredweight before
merger to 1.4 cents per hundredweight in 1960 (Table 16). Later,
this institutional fee was transferred to processors. Therefore,
excluding the permit fee from cost calculations, average variable
costs remained fairly constant before and after merger.
Average fixed costs per hundredweight decreased from
5. 1 cents per hundredweight in 1957 to 4. 6 cents per hundredweight
after merger. Most of the decrease in average fixed costs was in
reduced interest payments.
If the costs are adjusted for permit fees, average total
cost decreased from 9. 1 cents per hundredweight before merger
to 8. 8 cents per hundredweight in 1960 to 8. 6 cents per hundred-
weight in 1966.
Savings as a percent of sales increased from . 10 percent
before merger to . 39 percent two years after merger to 1. 11
percent in 1966.

Table 16. Cooperative IX. Average costs priorand subsequent to merger, 1957 , 1960, and 19661
Cooperative2 Cooperative CooperativeA AB AB
1957k 1960 1966
Plant expenses .002 .001Administrative salaries .014 .016 .017Testers salaries .014 .011 .007Fieldmen salaries .007 .010 .009Tester expenses .001 --- .002Fieldmen expenses .004 .003 .004Permit fees .003 .014
Average variable costs .043 .056 .040
Fixed costs -Directors expense .002 .002 .003Utilities .001 .001 .001Insurance .001 .002Office supplies .006 .006 .004Telephone .001 .003 .003
continued
Hundredweight of milk handled 3,111,271 3,561,156 4,953,956
Unit cost Unit cost Unit cost(Dollars) (Dollars) (Dollars)
Variable costs -

Table 16. Cooperative LX. Average costs prior and subsequent to merger, 1957, il960, and 19661
Continued
1 All input costs were deflated to the 1957 price level.2Acquiring cooperative's costs one year before merger.3Combined costs of the cooperatives two years subsequent to merger.4Accounting data for 1957 were not available for the acquired cooperative.
Cooperative 2 Cooperative 3A AB
1957 1960
CooperativeAB
1966
Rent .001 002 .001.General taxes . 002 . 003 . 004Professional fees . 002 . 002 . 002Educational . 002 . 004 . 004Organization . 001 . 001
Advertising . 001 . 001Interest .028 .006 .010Depreciation . 002 . 00'? . 005Miscellaneous . 003 . 004 . 004Travel . 002 . 002RepairsTransport maintenance . 001 . 001
Average fixed costs . 051 . 046 . 046
Average total costs . 094 . 102 . 086

98
Case 10:
The final cooperative interviewed was a regional grain coopera-
tive that operated as a sales association for local grain associations.
This association consolidated with another regional grain associa-
tion with storage facilities. Therefore, it was necessary to com-
bine the two association& accounting records to make cost compari-
sons before and after merger, assuming the proportion of cash
grain sales to grain handled through their elevator facilities re-
mained fairly constant. This ratio remained fairly constant for
comparisons between 1954 and 1956, but in 1966 much more grain
was hand1ed through elevator facilities because of an additional
merger so the average cost per bushel of grain handled and sold
will be overestimated in comparison to the 1954 and 1956 estimates.
The combined average variable costs were 1. 1 cents per bushel
(Table 17). After merger, average variable costs increased
slightly to 1. 3 cents per bushel and plummeted to . 6 cents per
bushel in 1966 as output increased about 198 percent because of
additional volume associated with the second acquisition in 1963.
Labor services accounted for the major increase in average vari-
able costs as the volume fell 2.. 9 million bushels or 5. 8 percent.
Average fixed costs remained constant at 1. 1 cents per bushel in
1954, 1956, and 1966.

Bushels handled and sold
Cooperative2A
1954
16, 424, 882
Cooperative 3B
1954
33, 933, 851 47, 429, 342
Cooperativ4AB
1956
CooperativeAB1966
140, 449, 188
continued
Unit cost(Dollars)
Unit cost(Dollars)
Unit cost(Dollars)
Unit cost(Dollars)
Variable costs -Salaries 021 005 011 005Telephone 001 002 001 001Marketing expense 001 001 001
Average variable costs 023 008
Combined average variable costs .011 013 006
Fixed costs -Professional fees 001Office expense 001 001 001TravelInsurance 002 001 001
General taxes 003 001 001
Utilities and rent 002 001 005
Interest 005 003 002Depreciation 007 003 001
Table 17. Cooperative X. Average costs prior and subsequent to merger, 1954, 1956, and 1966.1

1A11 input costs are deflated to the 1954 price level.2Acquired cooperative's costs one year before merger.3Acquiring cooperative's costs one year before merger.4Combined costs of the cooperatives two years subsequent to merger.
Table 17. Cooperative X. Average costs prior and subsequent to merger, 1954, 1956, and 19661
Cooperative2A
1954
Cooperative Cooperative4 CooperatieB KB AB1954 1956 1966
Miscellaneous 001 001 . 001Advertising - - -Miscellaneous elevator expense - - - - - - - -Maintenance and repairs 001 - - - - - - - - -
Average fixed costs . 023 . 003
Combined average fixed costs .011 011 011
Average total costs . 046 . 011
Combined average total costs . 022 024 . 017

101
Because of the decline in volume after merger, average total
costs increased from 2,2 cents per bushel before merger to 2.4
cents per bushel two years after merger. In 1965, total average
cost fell to 1. 7 cents per bushel.
The rate of return varies with the method used. Savings as
a percent of sales decreased from . 97 before merger to . 23 in
1956 to . 13 in 1966. Also, earnings on assets decreased from
7.75 percent before merger to 2.02 percent in 1957, but increased
to Z. 07 percent in 1966. The primary reason for the decrease in
earnings after merger was that the ratio of storage income to
total income decreased from 44. 7 percent to 16 percent two years
after merger.
It is evident from these individual firm studies that per unit
costs are influenced by a multitude of factors. Both internal and
external factors tended to increase per unit costs after merger.
The external factors were (a) increased competition from other
cooperatives through advertising and membership raids, (b)
changes in comparative advantage in single commodity cooperatives,
( ) acquiring assets in the merger that have no resale value in
order to obtain additional supply of input, and (d) institutional
factors. The internal factors that increased costs were (a) inade-
quate management and (b) increasing services that shifted the
cost curves upwards.
102
Those cooperatives that were able to reduce their costs over
time were ones that (a) integrated the two organizations under one
general manager, (b) differentiated their product, (c) obtained
and maintained the volume of output acquired, and (d) made addi-
tional mergers. An aggregate analysis of additional factors in-
fluencing operating results of the sample cooperatives is made in
Chapter V.

V. EMPIRICAL RESULTS: AGGREGATE ANALYSIS
The individual cost studies indicate some of the deviations
between pre-merger objectives and post-merger operating results.
However, other factors may influence merger that are not associ-
ated entirely with the acquired organization. This chapter will
summarize the merger accomplishments and attempt to examine
other variables influencing cooperative mergers.
Economies of Size
103
Managers of all 10 cooperatives in the sample had an objective
of achieving economies of size. To analyze the merger accomplih-
ments, Tables 18, 19, and ZO have been prepared to summarize
the individual cost studies examined in Chapter IV.
Table 18 shows that the average variable costs, or costs as
a percent of sales, two years after unified operations, decreased
for the acquiring associations in 2 of the 10 mergers, remained
relatively constant in 6 cases, and increased rapidly in 2 cases.
By the cooperatives latest fiscal year, 5 to 12 years after merger,
4 acquiring cooperatives reduced their unit variable costs, 5 coop-
eratives' variable costs increased, and 1 cooperative's costs re-
mained constant at the level it was prior to merger. Even though

Table 18. Summary of average variable costs and total variable costs as percent of sales of thesample cooperatives prior and subsequent to merger
Two years Latest fiscalOne year prior to merger after merger yearAcquired Acquiring Combined Combined
cooperative cooperative cooperatives cooperatives
Cooperative
iThese cooperatives are purchasing cooperatives, all others are marketing cooperatives.2Costs for the acquired cooperative only.3lncludes cooperatives that made additional acquisitions between two years after the merger andtheir latest fiscal year.
4Combined cost of the acquired and acquiring cooperative since one cooperative provided a sellingfunction and the other cooperative provided a selling and storage function.
I' (%) 2. 75 6. 99 6. 99II ($) 558 445 406 400
III ,431 * 439 460IV ($) 091 030 032 032v2' (%:) 19. 56 12.40 19. 64
VI ($) 062 020 021 0l92 ($) 076 058 050
VIlil (%) 1. 97 1.49 2. 00 3. 35IX ($) 040 042 040x ($) oii 013 oo6

Table 19. Summary of average fixed costs and total fixed costs as percent of sales of the samplecooperative prior and subsequent to merger
Cooperative
Two years Latest fiscalOne year prior to merger fter merger YearAcquired Acquiring Combined Combined
cooperative cooperative cooperatives cooperatives
'These cooperatives are purchasing cooperatives, all others are marketing cooperatives.2Costs for the acquired cooperative only.3lncludes cooperatives that made additional acquisitions between two years after the mergerunder study and their most recent year.
4Combined unit costs of the acquired and acquiring cooperative.
Ii (%) 9.16 11.91 12.51II ($) .119 .097 .118 .117
UI ($) .057 .068 .069IV ($) .030 .018 .014 .011
V2,1 (%) 7. 22 2. 28 12. 07
VI ($) 028 . 005 . 009 . 009Vu2 ($) .019 .017 .029
VIIIl (%) 2. 48 1. 75 1. 82 3. 48Ix ($) 051 . 046 . 046
x ($) .011

Table 20. Summary of average total costs and total costs as a percent of sales of the samplecooperatives prior and subsequent to merger
Two years Latest fiscalOne year prior to merger after merger year
'These cooperatives are purchasing cooperatives, all others are marketing cooperatives.2Because of different services provided by the acquired and acquiring cooperatives they are listed
separately.3lncludes cooperatives that made additional acquisitions between two years after the merger understudy and their most recent fiscal year.
4Combined average total costs for the acquired and acquiring cooperative.
Acquiredcooperative
Acquiringcooperative
Combinedcooperatives
Combinedcooperatives
Cooperative
Ii (%) 11.91 18.90 19.50II ($) .677 .542 .524 .517
III ($) .488 .507 .529IV ($) . 121 .048 .046 . 043y2 1 26.78 14.68 31. 70
1L49 17.50 16.46VI ($) . 090 . 025 . 030 . 028
1 . 095 . 075 . 0795.32 5.30 6.37
vui2' (%) 4. 45 3. 24 3. 82 6. 836.65 6.53 9.40
IX ($) . 091 . 088 . 086X ($) - . 022 . 024 . 017
107
few of the acquiring cooperatives were able to reduce their per unit
variabl,e costs after merger, Table 18 indicates that the acquired
cooperatives were able to reduce their average variable costs
significantly after merger. Five of the six acquired cooperatives
for which audit reports were available, were able to reduce vari-
able costs by a substantial amount. The other acquired coopera
tive's unit variable costs remained constant after merger. These
emperical results are consistent with economic theory, where
1tundersized't cooperatives are merging with larger associations
that are operating at optimal size or at least at that level of out-
put where the long run function is relatively flat, but may still
have some downward slope.
Although the trend in unit variable costs is shown above, unit
variable costs between two years after merger and the combined
cooperative's latest fiscal year were reduced for five acquiring
cooperatives. In three of these cooperatives, additional acqui-
sitions had taken place.
Average fixed costs or fixed costs as a percent of sales for
acquiring cooperatives two years after merger decreased in five
associations, increased in four cases, and remained stable in one
case (Table 19), Only two cooperatives reduced their unit fixed
costs by 1965 below the level existing prior to merger. Unit
fixed costs increased in seven cooperatives and remained constant

108
in one association duiing the period from one year before merger
and their latest fiscal year. However, between two years after
merger and 1965, only, three cooperatives' unit fixed costs in-
creased, two decreased, and five remained fairly constant. Thus,
the sample cooperatives show that spreading overhead through
merger is not too likely to occur for the combined cooperative.
On the other hand, the ftundersizedu acquired cooperatives
were able to reduce their overhead in all six cooperatives for
which accounting data were available. This result can be ex-
pected as the rate of output is increased because of the location
of the acquired cooperatives on the long run average cost curve.
Although few associations individually reduced their van-
able or fixed costs after merger, average total costs for the
acquiring cooperatives were reduced in 50 percent of the associL
ations two years after merger (Table ZO). Per unit total costs
increased significantly in Cooperatives I and V, but remained
fairly constant in Cooperatives III, VI, and X. Therefore, in
two years, 50 percent of the acquiring cooperatives achieved one
of their merger objectives. By 1965-1966, unit total costs of
acquiring cooperatives decreased in only 40 percent of the cooper-
atives. However, much of the increased costs of operation were
caused by a change in member services which will be explained

109
later in this chapter. From the evidence presented in Table ZO,
it is evident that large economies of size are not evident in ac-
quiring cooperatives regardless of the size of the cooperative.
Large economies of size do exist for the Itundersizedtt acquired
cooperatives as economic theory suggests. Large economies of
size were achieved by all acquired cooperatives for which data were
available.
In summary, the cost studies indicate that farmer patrons
of acquired cooperatives benefit substantially by merger, but the
benefits to one-half of the acquiring cooperative's members are
questionable on the basis of economies of size alQne.
If the unit total costs of the acquired and acquiring coopera-
tives are weighted by their sales or volume of output, depending
on whether they are a supply or marketing association, the anal-
ysis shows that two-thirds of the acquiring cooperatives achieved
some economies of size after merger (Table 21). Data show the
acquiring firms have reduced costs more than they could have
had they operated as separate entities, assuming that the cost
structure would have remained unchanged had the cooperative not
merged.
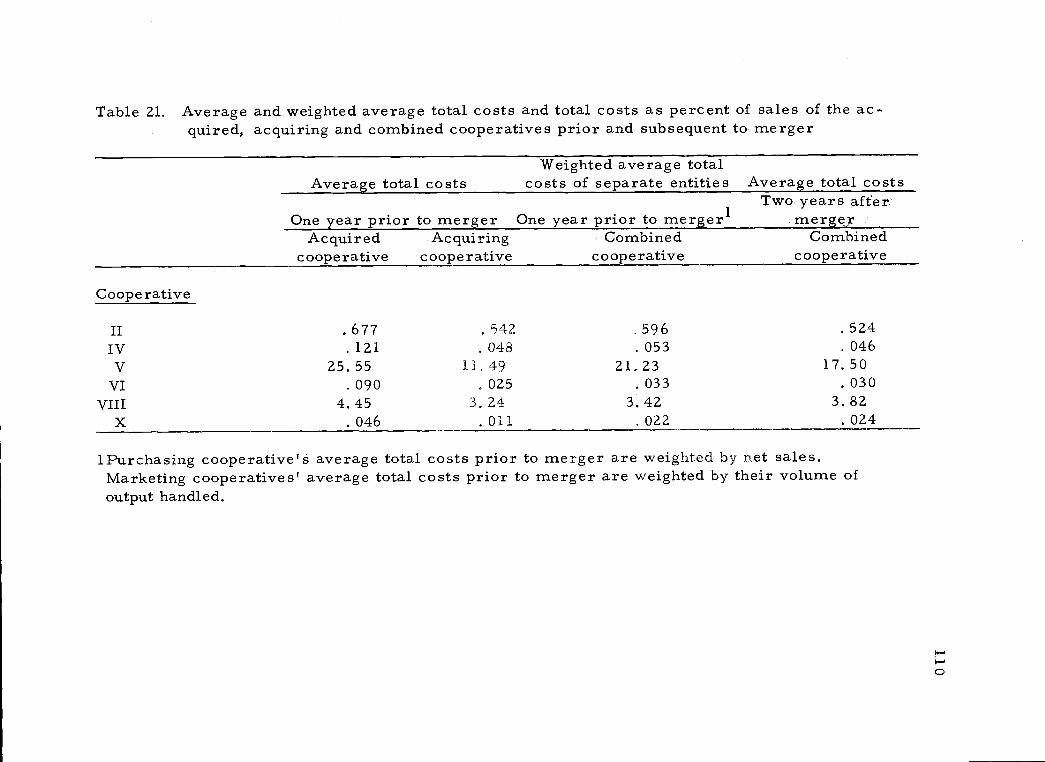
Table 21. Average and weighted average total costs and total costs as percent of sales of the ac-quired, acquiring and combined cooperatives prior and subsequent to merger
Cooperative
Weighted average totalAverage total costs costs of separate entities
One year prior to merger One year prior to merger'Acquired Acquiring Combined
cooperative cooperative cooperative
Average total costsTwo years after:
mergerCombined
cooperative
IPurchasing cooperativets average total costs prior to merger are weighted by net sales,Marketing cooperatives' average total costs prior to merger are weighted by their volume ofoutput handled.
II 677 542 .596 524IV 121 * 048 053 046V 25. 55 11,49 21.23 17,50
VI 090 025 033 030VIII 4,45 3. 24 3.42 3. 82
x 046 Oil 022 024

Profitability of Cooperative Mergers
Other things being equal, economic theory posits that mergers
should reduce unit costs and increase the combined profits of the
participants in the merger. To test this hypothesis, three indica-
tions of profitability or rates of return are used. These three in-
dications are (a) ratio of savings to net sales, (b) ratio of savings
to members' equities, and (c) ratio of savings to earning assets.
Although these ratios are useful, pricing policies among
cooperatives may change over time. For instance, a cooperative
may attempt to operate on a wide margin and return possible large
patronage dividends at the end of the year or attempt to operate
on a small margin and return a smaller patronage dividend. In
the latter case, the members benefit through lower prices rather
than in higher dividend payments. A related problem involves con
sidering savings a profit since theoretically the cooperative is
assumedto operate at cost. Therefore savings may be considered
a safety margin,surplus, or even errors in cost calculations
rather than "profits. l Nonetheless, one can argue that the
accounting ratios are an indication of performance because a
cooperative, like any other corporation, must make a net surplus
if in the long run it is to survive and grow.
ill

112
Table 22 summarizes the ratio of savings to net sales for the
10 cooperatives in the sample. As shown by this table only 4 of the
10 acquiring cooperatives increased their rates of return two years
after merger. These cooperatives were Cooperatives II, V, VII, and
IX. Cooperatives II, VII and IX also achieved economies of size over
the same period. Cooperative IV achieved economies of size, but
did not increase its rate of return after merger, and Cooperative V
increased its rate of return, but did not achieve economies of size.
By 1965-1966, only three cooperatives (VII, VIII, IX) in-
creased their rate of return above the level it was before merger.
Cooperatives VII and VIII had not achieved economies of size by
1965-1966. Thus, there appears to be no consistent relationship be-
tween economies of size and the rate of return after merger.
Table 22 also suggests that although the acquiring associations
generally did not increase their profitability over the time period
considered, 7 of the 8 acquired cooperatives did. These coopera-
tives attained large increases in rates of return. In fact 5 of the
acquire4 cooperatives were operating at a loss one year before
merger.
In summary, the percent of savings to net sales supports
the cost studies and attests to the increased competitive pres-
sure cooperatives are facing. Sixty percent of the acquiring

Table 22. Savings as percent of sales for sample cooperatives prior and subsequent to merger1
Cooperative
One year prior tomerger
Two years aftermerger
Latest fiscalyear
Combinedcooperatives
lCooperative III was excluded from this analysis because accounting records were kept on a costbasis.
ZReported by the past manager of this association.3Figures in parentheses are net losses for the fiscal year under consideration.4These cooperatives made additional acquisitions between two years after merger and their latestfiscal year.
5flata available were not comparable with that of the acquiring cooperatives.
I (%) (loss)2 8.58 05 (.86)ii (%) 8.71 16.11 17. 63 7.37IV (%) (2. 07) 1. 03 52 (3)3V (%)
(447)3 12.38 21. 70 5. 21
VI (%) (1.80) 6.15 3. 00 354
VII (%) (6. 03) 2. 89 3. 49 5. 61
VIII (%) .56 2.78 2. 44 3,31Ix (o,7) .90 .10 39 1.
x (%) .97 23 l3
Acquired Acquiring Combinedcooperative cooperative cooperatives

114
cooperatives achieved no increase in their rates of return two years
after merger and 70 percent of the cooperatives achieved no in-
crease by 1965-1966. This data supports the tenet that cooperative
mergers made during the period 1956-1960 have not generally in-
creased the profitability of the acquiring cooperative, although
6. of the 7 acquired cooperatives increased their member?s returns
via merger. Had the surviving cooperatives not merged, their
rate of return may have fallen anyway. This is especially relevant
to Cooperative I with management problems, Cooperative III with
its rising costs caused by a change in comparative advantage,
Coopezative IV which relied on surplus milk, Cooperatives V and
X with the change in the Commodity Credit Corporation storage
policies on grain, and Cooperative VI because it could not obtain
enough grade B milk to keep its cost low enough to operate at pre-
vailing prices of dairy products. Even though most cooperatives did
not increase their rate of return, the point to be made is that gen-
erally merger did not make the acquiring cooperatives more
.profitable after merger than they were before merger.
If profitability is calculated as the percent of savings to
member's equity, Table 23 shows that 5 of the 9 acquiring coopera-
tives increased their rate of return on investment two years after
merger. On the other hand, only three surviving cooperatives

Table 23. Savings as percent of members' equity for sample cooperatives prior and subsequent tomerger1
Cooperative
One year prior tomerger
Acquired Acquiringcooperative cooperative
Two years aftermerger
Combinedcooperatives
Latest fiscalyear
Combinedcooperatives
1Cooperative III was excluded from this analysis because accounting records were kept on a costbasis
2Reported by the past manager of this association.3Figures in parentheses are net losses for the fiscal year under consideration.4These cooperatives made additional acquisitions between two years after merger and their latestfiscal year.
I (%) (loss)2 31. 21 21 (4. l7)II (%) 24. 08 18. 34 21. 07 13. 06IV (%) (36.8l) 9.72 5. 20 (3. 55)3
V (%) (15. 5l) 22.32 25. 40 8. 21VI (%) {l0.33) 38.49 16.84 1. 81
VII (%) (20.35) 9.17 16. 51 26. 57VIII (%) 15.43 10.00 12.36 12.44
Ix (%) 35.46 3.34 5. 55 8.35x (%) 46.94 19.34 8. 39 8. 67

Indications of improved services to members are (a) in-
creases in inventories (b) increases in number of services, and (c)
increases in the quality of existing services. Theoretically, addi-
tional services should increase the average cost of operation,
ceteris paribus, but these services may generate more than
proportional increases in sales and hence greater earnings.
Improved services to members was an objective of three
1.1 6
increased their rate of return by 1965-1966.
Only 6 of 9 acquired cooperatives increased their rate of
return on memberrs equity two years after merger, but all of the
acquired cooperatives owned less than 50 percent of their assets
so any savings would show a large rate of return on member's
equity.
An additional comparison of savings to earning assets sub-
stantiates the conclusion drawn from savings as a. percent of net
sales (Table 24). That is, the acquiring cooperatives generally
did not increase their profitability through merger, but the savings
to acquired members have been immense. This conclusion is
consistent with economic theory and the cost studies presented
in: Chapter IV.
Services to Member Patrons

Table 24. Savings as percent of total assets for sam?le cooperatives prior and subsequent tomerger
1 Cooperative III was excluded from this analysis because accounting records were kept on a costba si S.
2Reported by the past manager of this association.3Figures in parentheses are negative rates of return for the fiscal year under consideration.4mese cooperatives made additional acquisitions between two years after merger and theirlatest fiscal year.
5Data were not comparable with that of the acquiring association.
Acquired Acquiringcooperative cooperative
Combinedcooperatives
Combinedcooperatives
Cooperative
I (%) (loss)2 21. 13 .12 (1. 35)3
II (%) 6. 67 6.80 8.49 7. 12IV (%) (10. 29) 6.11 2.57 (1. 84)V (%) (11. 04) 20. 91 17.74 5. 70
VI (%) (5. 20) 28. 63 11.03 1.. 454
VII (%) (18. 8) 7.50 9. 91 10. 31VIII (%) 5.91 9.99 10. 43 10. 14
Ixx
(%)(%)
1.495
335.56
2.612. 02
3. 672. 07
One year prior to Two years after Latest fiscalmerger merger year

118
purchasing cooperatives. In Z of the 3 cooperatives, operations had
expanded into the operating area of the acquired cooperative. Be-.
sides being able to service members more adequately through
closer acilities, both cooperatives added credit facilities to
finance production expenses of members as well as nonmembers.
The increase in the value of inventories was five percent after
merger in Cooperative V and 54 percent after merger in Coopera-
tive VIII.
Cooperative VII integrated vertically into the marketing of
members commodities in addition to supplying them with productive
services. Other services added as a result of the merger included
hiring additional field representatives to counsel growers, and a
market news publication to inform members of market devekp-
ments.
None of the cooperatives which improved services achieved
economies of size by 1965-1966. However, all three cooperatives
increased their earnings on member!s equities after merger. In
addition, these cooperatives have been able to maintain their
memberships prior to merger even though farm numbers have been
declining. Thus, these data are consistent with theoretical expecta-
tions and suggest that these cooperatives did achieve the objectives
of improving member services.

Barriers to Entry
Barriers to entry refer to the advantage which established
firms possess over a potential competitor who may wish to enter.
Entry then is a significant factor in the structure of the market be-
cause it establishes the ability of firms to secure abnormalH
prices, without inducing potential entrants. Bain (3) suggests
three types of barriers. These are (a) product differentiation, (b)
superiority in production efficiency, and (c) size of firm to industry
output. We interpret the latter to include absolute cost advantages.
Merger was used to restrain entry in three cases. In all
three cases, however, the acquired cooperative had initiated
merger negotiations with the acquiring cooperative. In one case,
a local dairy cooperative acquired another to assure that some
national firm with superior financial resources and management
would not buy the association and compete for their producers'
milk or in their distribution area.
In another case, a regional association having financial
difficulties initiated merger negotiations with another regional with
the same national farm organization affiliation. After three months
of negotiations, merger talks were terminated; but a month later
when the association opened negotiations with a regional
119

120
association of another farm organization, the marriage between
the brother associations was completed within a month.
Two of the three cooperatives achieved economies of size
two years after merger, and 1 of the 3 associations achieved some
economies of size by 1965-1966, after additional acquisitions.
However, only 1 of the 3 cooperatives increased its earnings as
a result of merger.
Local cooperatives are usually limited in their method and
type of growth by the interests of those that originated the cooperative.
Most local cooperatives in adjacent areas compete with each other
for members, but many of the managers interviewed would not
expand facilities by internal growth to another vicinity to compete
with other local cooperatives directly since they are already serv-
iced by a cooperative. This observation is also valid in the case
of regional cooperatives because regional cooperatives are con-
.stantly competing with each other for the business of local coopera-
tives, but do not expand internally into another regionalts marketS
It is difficult for regional cooperatives to enter a marketing or
procurement area serviced by other regionals, normally, because
of various types of product and service differentiation, such as
an affiliation with farm organizations, and brand names; this
factor alone limits the scale to which a regional cooperative

121
could enter the market.
All three cooperatives that merged to restrict entry have
achieved this objective, since other regional associations have not
entered their market areas; but the threat of potential entrants can
improve market performance. Any time the discounted marginal
returns in the new market exceed the discounted opportunity cost
of entry, economic theory suggests that entry should occur.
Market arid Bargaining Power
The two largest cooperatives in the sample merged to achieve
market and bargaining power. Bargaining power is the ability to
negotiate with influence to bring about a desired change (39, p. 4).
Bargaining associations are cooperatives organized to increase
farmerst incomes from farming by negotiating with processors
over raw product price and other contract terms which influence
income. They gain recognition as bargaining agents in proportion
to the volume of relevant market supply over which they have con-
trol.
Market power, on the other hand, is a broader concept than
bargaining power. While bargaining power is normally measured
by supply control, market power is measured by strategic market
structure variables such as supply control, barriers to entry,

122
product differentiation, and the degree of buyer and seller con-
C entration.
George Ladd (39, p. 14) distinguishes two types of bargaining
power. Type I bargaining power stems from advantages that can
be offered to another party for accepting your terms. Type II bar-
gaining power is the ability to make the other party worse off by
not accepting your offer.
Many agricultural marketing and purchasing cooperatives
exert Type I bargaining power, but few control enough of the vol-
urne of a commodity in their relevant markets to exert Type II
bargaining power. "Opponent pain" bargaining power is limited
to agricultural cooperatives usually handling specialized commodi-
ties in relatively small geographic areas. Cooperatives have had
problems regulating the volume of output because of their voluntary
membership policies, supply response of producers when prices
increase, and a relatively high cross elasticity among many agri-.
cultural commodities. These economic conditions tend to support
the belief that agricultural bargaining power as well as market
power will remain fairly weak in total, except in those cases where
group action has been taken as in federal legislation to control
some of the market structure variables.

]i2 3
The milk bargaining association in the sample attempted to
gain bargaining power through merger, since processors in the
area were able to weaken the bargaining position of the two bar-
gaining cooperatives hecause they were competing in the same mar-
ket area.
An indication of the bargaining strength of a dairy bar-
gaining cooperative is its ability to negotiate price differentials
above the minimum federal order price. However, this is only
one measure, since it is impossible to make a complete study of
factors influencing the demand and supply of milk in the market
area.
One year before merger, the cooperative handled 96. 7
percent of the milk marketed under the federal order and obtained
a nine cent price differential for class one milk (Table 25)
Approximately two years after merger, this cooperative handled
all of the milk marketed under the federal order and was able to
obtain a 14 cents per hundredweight price differential for class one
milk. In recent years however, because of the supply response of
producers and increased competition from producers in the
northern Iowa-southwestern Minnesota area, caused by bulk tank
transportation, the price differentials above the minimum federal
order fell gradually to five cents per hundredweight in 1966.

Table 25. Volume and price of all producers' class one milk received by a bargaining associationas compared to volume and price of class one milk classified under federal marketing
order, prior and subsequent to merger
Averageminimum
federalorder
priceCwt.
Averagepricediffer-entialCwt.
Volume ofmilk handl-ed by asso-
ciati on
Volume ofmilk handl-ed undermarketing
order
iSource of data (71, p. 13).2Before merger.3After merger.4About 19 percent processed in association plant.5Part of the producers' milk marketed under the Denver federal marketing order.
Order milkhandledPerc ent
19572 4. 84 4. 75 +. 09 311, 127, 114 321, 610, 151 96. 7
l96O 4.95 4.81 +. 14 356, 115, 571 319, 010, 363 100. o5l966 5.34 5.29 +.05 612,39O,79O 5439Z8,8I,6 95. 0
Averagenegotied
Year price 1
Cwt.

1z5
Even though the bargaining cooperative handled 95 percent
of the milk marketed under their federal order, the potential
entry of milk from other areas because of low cost transportation,
has limited their bargaining strength. In addition, they have
attempted to divert milk in other order areas and process dairy
products for members, but this attempt has not increased their
bargaining strength in their bilateral oligopoly position. There
appears, however, to be beneficial effects from the bargaining
association's point of view such as more price stability in the
market and their lobbying activities to exert political influence: to
change the institutional relationships in the market.
The evidence presented does not enable a conclusive anal-
ysis of the effect of merger on the objective of achieving bargain-
ing power. The data suggest that after merger monopsony power
was established, but without strict supply controls and changes
in technology, the bargaining power of the association is not as
strong as it was in the period just after merger.
One large grain cooperative interviewed desired market
power through merger. As previously mentioned, one of the
participants in the merger operated as a grain storage and sales
organization and the other association as a sales association only.
Before merger, the acquiring cooperative sold 33 million bushels

126
compared to 9 million bushels handled and sold by the acquired
cooperative. Since an additional grain merchandiser was acquired
in 1963, the volume of grain handled and sold was 153 million
bushels in 1966.
Although price data on lot grain sales were not collected to
identify possible increases over prevailing market prices, it is
well documented that the grain market probably comes as close
to the economists' concept of a "perfect't market as any agricul-
tural market (13, 20, 27). Fletcher (22, p. 22) found that the four
largest grain marketing corporations in the North Central region
in 1960 accounted for 21. 6 percent of total volume, and the eight
largest for 33. 9 percent of the volume, out of a total of 301 mer-
chandising and processing firms. This cooperative competes with
14 other large grain sellers, including four commission firms
and 10 terminal merchandisers. In addition, there are 185 small
grain merchandisers, in the North Central region (22, p. 21).
Barriers to entry are negligible and low rates of return on the
necessary large investment offer little incentive to enter a de-
clining industry pervaded with excess storage capacity.
The cooperative receives no price premiums for its grain
sales, which are generally made in the national and international
markets. Also, product differentiation is impossible since it

(13, p. 5).
127
sells uniform grades and standards.
In 1953, the Commodity Credit Corporation, the price sup-
porting agency of the Federal Government, was directed by
Congress to use commercial storage facilities wherever possible.
This was done to provide incentive for commercial merchandisers
to expand commercial facilities by increasing the rate paid for
storage. Dahi found that C. C. C. approved storage in the North
Central region more than tripled from 1953 to 1962 (13, p. 4).
He also points out that between 1949 and 1962, farm storage was
expanded as a result of providing low interest rate loans.
During the l950s, the government rapidly accumulated
surplus grain stocks through the use of nonrecourse loans to
support prices. This program was expensive; so in 1963, the
government shifted to farm income support programs. The
program was implemented by direct payment through certificates
for domestic and foreign use. Acreage diversion programs were
initiated and exports were increased which reduced the level of
goveriment-owned grain stock. Carryover stocks fell from a
record level of 1. 4 billion bushels of wheat and 85 million bushels
of feed grains in 1961 to 400 million bushels of wheat and 25
million tons of feed grains in the 1966-1967 marketing year

128
Because of this change in government programs, excess
storage capacity exists in the Midwest. The cooperative in the
sample, which acquired grain storage facilities in 1955, took
advantage of increased storage payments under the incentive
programs. These increased earnings, however, were dissipated
by building more storage facilities. Consequently, savings as a
percert of sales have fallen throughout the time periods under
consideration as shown previously by Table ZZ.
In concluding, it seems that this association did not achieve
market power because of the nature of the market structure and
it was unable to capitalize on the government storage facilitiesin-
centives because of the change in government policy to reduce
C. C. C. stocks, causing excess storage capacity and a low rate
of return to storage facilities.
Miscellaneous Objectives
Three other merger objectives of the acquiring cooperatives
were product diversification, source of raw material, and facili-
ties.
As discussed above, the grain merchandiser did obtain
storage facilities and in addition built three new elevators with
storage capacity for 746,, 000 bushels of grain. Two of these were

129
built in 1957 and one in 1961. Also, they leased additional storage
capacity and cooperatively operated one elevator with another
regional association. Via merger, this association accomplished
the objective of attaining additional storage facilities, although
such investment was of questionable profitability.
Cooperative VI acquired five processing cooperatives and
one private processing firm to assure itself of adequate supplies
of milk in an area where volume had been decreasing. The cooper-
ative achieved this objective as the cooperative handled 101, 965, 121
pounds of members' whole milk before merger, 126, 753, 215 pounds
of members' milk two years after merger, and 162, 800, 602 pounds
in 1965. The increase in pounds of member milk between 1958
and 1965 was 59. 66 percent.
Cooperative Vii's objective of product diversification was
an attempt to broaden the base of operations to lessen income
variations. The percent of savings to members' equity increased
from 9. 17 percent before merger to 16. 51 percent after merger to
26. 57 percent in 1965. Savings as a percent of sales were 2. 89
percent before merger, 3. 49 percent two years after merger, and
5. 61 percent in 1965. Most of the variation in rates of return is
due to the purchasing department and not to the newly acquired
marketing department.

10The number of responses given exceeds the number of cooper-atives in the sample because more than one reason was givenfor exiting from business by merger.
130
These data suggest that the cooperatives have accomplished
these three secondary merger objectives.
Other Factors Influencing Merger
Merger motivations of the acquired cooperatives may be as
important as the motivations of acquiring associations, since
marriage performed in merger requires the consent of both
partners. The reasons acquired cooperatives exited by merger
are varied. Seven of the acquired cooperatives merged with
larger associations because of financial problems or the need for
additional financial strength to compete effectively in their indus-
try. Also, 70 percent of the acquired cooperatives merged to
obtain economies of size. Other motivations to exit by merger
were to attain bargaining power and management services of
the surviving association. 10
Although 50 percent of the acquiring cooperatives achieved
economies of size after merger, most of the acquired cooperatives
gained substantially in cost reductions and increased earnings.
Therefore, the relationship between the two associations before

131
consummation may be important. The benefits of merger to the
acquired cooperative is noted in 9 of the 10 mergers studied.
Merger negotiations originated with the acquired cooperative
(Table 26). The one acquisition initiated by the acquiring coopera-
tive was the bargaining association that attempted to control the
supply of milk in its market area. Thus, it is possible that
the acquiring cooperatives did not plan their mergers to attain
their growth objectives, but only accepted mergers presented to
them. Evidence from the interviews shows that only one of the
10 cooperatives engaged in a merger economic feasibility study
prior to extended negotiations. None of these cooperatives re-
quested merger studies from state universities or the Farmer
Cooperative Service. However, some planning did occur with
the managers and the boards of directors with the aid of parent
associations. All cooperatives used legal and accounting services
provided by the parent association or hired these services locally
to handle the necessary legal papers and to determine the book
value of assets.
Regional and parent associations were directly involved in
merger negotiations in 70 percent of the cooperatives. Normally,
the acquired cooperative used the parent association as an agent
in starting merger negotiations. It is impossible, however, for

Table 26. Origin and length of merger negotiations
Coo e rative
Length ofmerger nego-
Origin of mer:er negotiations tiations(Months)
132
Acquired cooperative and regional 5
Acquired cooperative and regional 6
Acquired cooperative and regional 3
Acquired cooperative and regional 6
Acquired cooperative and regional 6
Acquired cooperative 5
Acquired cooperative 12
Acquired cooperative and parentassociation 18
Acquiring cooperative 6
X Acquired cooperative and parentassociation 24
Average
II
III
IV
V
VI
VII
VIII
Ix

133
regional and parent associations to be impartial judges in negotia-
tions because their objectives may differ widely from the objec-
tives of the regional or local association as the case may be.
This conflict of interest could be s-ignificant, but is not analyzed
in this study.
In addition to few actual merger studies being done, the
merger negotiation period is relatively short in duration (Table 26).
The average time between the initial contact and complete consum-
mation of the acquired firms was 9. 1 months compared to indus-
trial mergers which take one to two years (73, p. 167). Larger
acquisitions generally had longer negotiation periods. Subsequent
mergers by the same cooperative took less time. For example,
Cooperative IX completed its first acquisition in six months, but
the next four acquisitions averaged only 48 days.
Nine of the acquired cooperatives accepted certificates of
equity in the new associations equal to the net book value of their
assets in the old association. Only one cooperative was appraised
to determine its current marketable value because the association
was a brokerage cooperative and owned few tangible assets. Thus,
none of the acquired cooperatives forfeited any of their equity via
merger.

134
Available evidence suggests that generally the acquired
cooperatives which had higher operating costs, initiated merger
negotiations. These negotiations are relatively short in duration
and the acquired cooperatives did not lose any equity in the merger.
Amount of External Growth Achieved
Three cooperatives in the sample made additional acquisi-
tions besides the one studied in this research. The average number
of acquisitions attempted was 3. 1 per association, but the average
number completed was 2. 4 per firm. The 29 percent of the nego-
tiations that were terminated was attributed to personality con-
flicts among managers, national farm organizations that discour-
aged merger because of the possibility of losing some of their
membership, and local pride in the cooperative, especially in
rural communities.
The relative size of the acquisitions made by the sample
cooperatives ranged from 3. 1 percent to 65. 3 percent of the sur-
viving cooperatives assets. The size of the acquired cooperative
is not directly correlated to the size of the acquiring cooperative
(Table 27). It should be mentioned that some of the larger ac-
quiring cooperatives made larger absolute acquisitions, but the
larger the base, the smaller the percentage effect of any change in.

Table 27. Number of mergers attempted, consummated, and the impact of merger on the sizeand growth of sample cooperatives
continued
CooperativeNumber of mer- Number of
gers attempted mergers completedRelative size ofthe acquisition'
Amount of growth due tomerger between consumma-tion and 1965_19662
Percent Percent
I 2 1 24.0 7.8
II 5 2 43.8 -93.7
I" 4 z
IV 1 1 34.6 65.5
V 3 2 5.5 1.5
VI 5 5 18.9 70.1
VII 1 1 3.i
VIII 2 2 6.1 6.1
Ix 6 6 3.8 31.0
x 2 2 65.3 59.1
Total 31 24Average 3. 1 2. 4

Table 27. Number of mergers attempted, consummated, and the impact of merger on the sizeand growth of sample cooperatives--continued
'The relative size of the acquisition is measured as the percent the acquired cooperative's assetsare of the acquiring cooperative's assets at the time of merger.
2External growth is measured between the time of merger and the cooperative's latest fiscal year.Only the direct effect of merger is measured as the assets acquired as a percent of total growthof the acquiring cooperative over the time period considered.
3The surviving cooperative did not acquire any physical assets. In this special case, the coopera-tive acquired the growers only. This cooperative liquidated its assets in 1963.
4This is a vertical merger and assets are a poor measure of the size or growth of the survivingcooperative.

Cooperatives II and IV did not acquire any assets in their
acquisitions. Associations I, V, VI, VIII, and X did not sell any
of the acquired assets (Table 28). Of those cooperatives that kept
their assets, Cooperatives I, V, VI, VIII, and X did not achieve
137
relative size. Also, the relative size of the acquisition is not
correlated with the achievement of economies of size or increased
earnings.
The amount of growth attributed to acquisitions by the
sample cooperatives is also shown in Table 27. The growth in
assets by acquisition between time of merger and their latest fiscal
year ranged from -93. 7 percent to 70. 1 percent. The amount of
external growth again did not depend on the absolute size of the
acquiring cooperatives before merger. A comparison of the amount
of external growth and economies of size shows that Cooperatives
IV, VI, IX, and X grew more than 30 percent externally and all
of these cooperatives achieved some economies of size by 1965-
1966. However, Cooperative II grew negatively in assets by 93. 7
percent and still was able to reduce its per unit costs of operation.
The Effect of Maintaining Facilities on Post-Merger OperatingRe suits
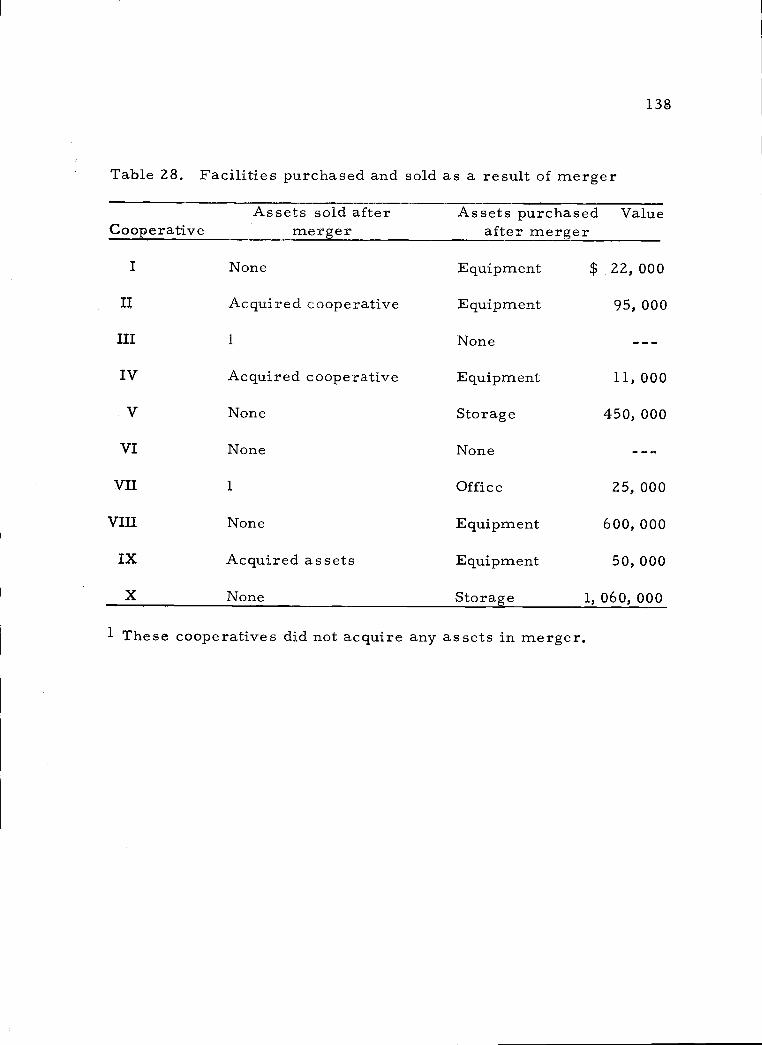
138
1 These cooperatives did not acquire any assets in merger.
Table 28. Facilities purchased and sold as a result of merger
Assets sold afterCooperative merger
Assets purchased Valueafter merger
I None Equipment $ 22, 000
II Acquired cooperative Equipment 95, 000
III 1 None
IV Acquired cooperative Equipment 11, 000
V None Storage 450, 000
VI None None
VII 1 Office 25, 000
VIII None Equipment 600, 000
IX Acquired assets Equipment 50, 000
X None Storage 1, 060, 000

139
economies of size in the acquiring cooperative two years after merger
and only Cooperative V increased its profitability by internal expan-
sion after merger.
Also, Cooperatives II, IV, and IX, which sold the assets of
the acquired cooperative, achieved economies of size two years
after merger and achieved additional economies through their
latest fiscal year.
Those Cooperatives V, VII, and X that made large amounts
of additional investment caused their costs of operation to increase
during that period. However, the investment by Cooperatives V
and VIII increased their earnings. Earnings in Cooperative X did
not increase because of changes in government storage policies.
Thus, those cooperatives that retained memberships but disposed
of facilities were more likely to attain economies via merger. This
result is consistent with a priori expectations. Those cooperatives
that can reduce their average cost below the level it would be if both
plants were operated; are induced to dispose of the acquired facilities.
Changes in Memberships as a Result of Merger
Large variations in membership may seemingly indicate inade-
quate management, changes in comparative advantage, or decreasing
farm numbers that may directly effect the successfulness of 'mergers.

140
Few members leave a cooperative because of a merger
(Table 9). It is evident, however, that competitors do react
to mergers. Because of merger negotiations, Cooperatives II, III,
V, and VIII noted that competitors made membership raids especi-.
ally on the acquired cooperative. Local cooperatives are vulnerable
during the negotiation period because of management conflicts and
the local pride and interest involved. Therefore, it is important to
the continuity of operations that members understand the reasons
for the merger and the benefits or costs to be expected.
Other competitive methods used by competitors are short run
in nature such as increased services to producers, increased prices
offered producers, and price wars. Most of these tactics are not
continued once the new association is firmly established. The most
drastic action to a merger occurred to Cooperative VII. The chain
stores boycotted the cooperative for approximately two years,
but once the chain stores realized they were not forming a bargain-
ing association to control the supply of the commodity, the "chains"
were ready to continue their normal business relationships. Thus,
merger does not cause an upheaval in the status quo. Also,
Hammond and Cook (28, p. 29) found that acquisition may not
affect the stability of the market as much as eliminating competi-
tors through aggressive, but risky competitive effort.
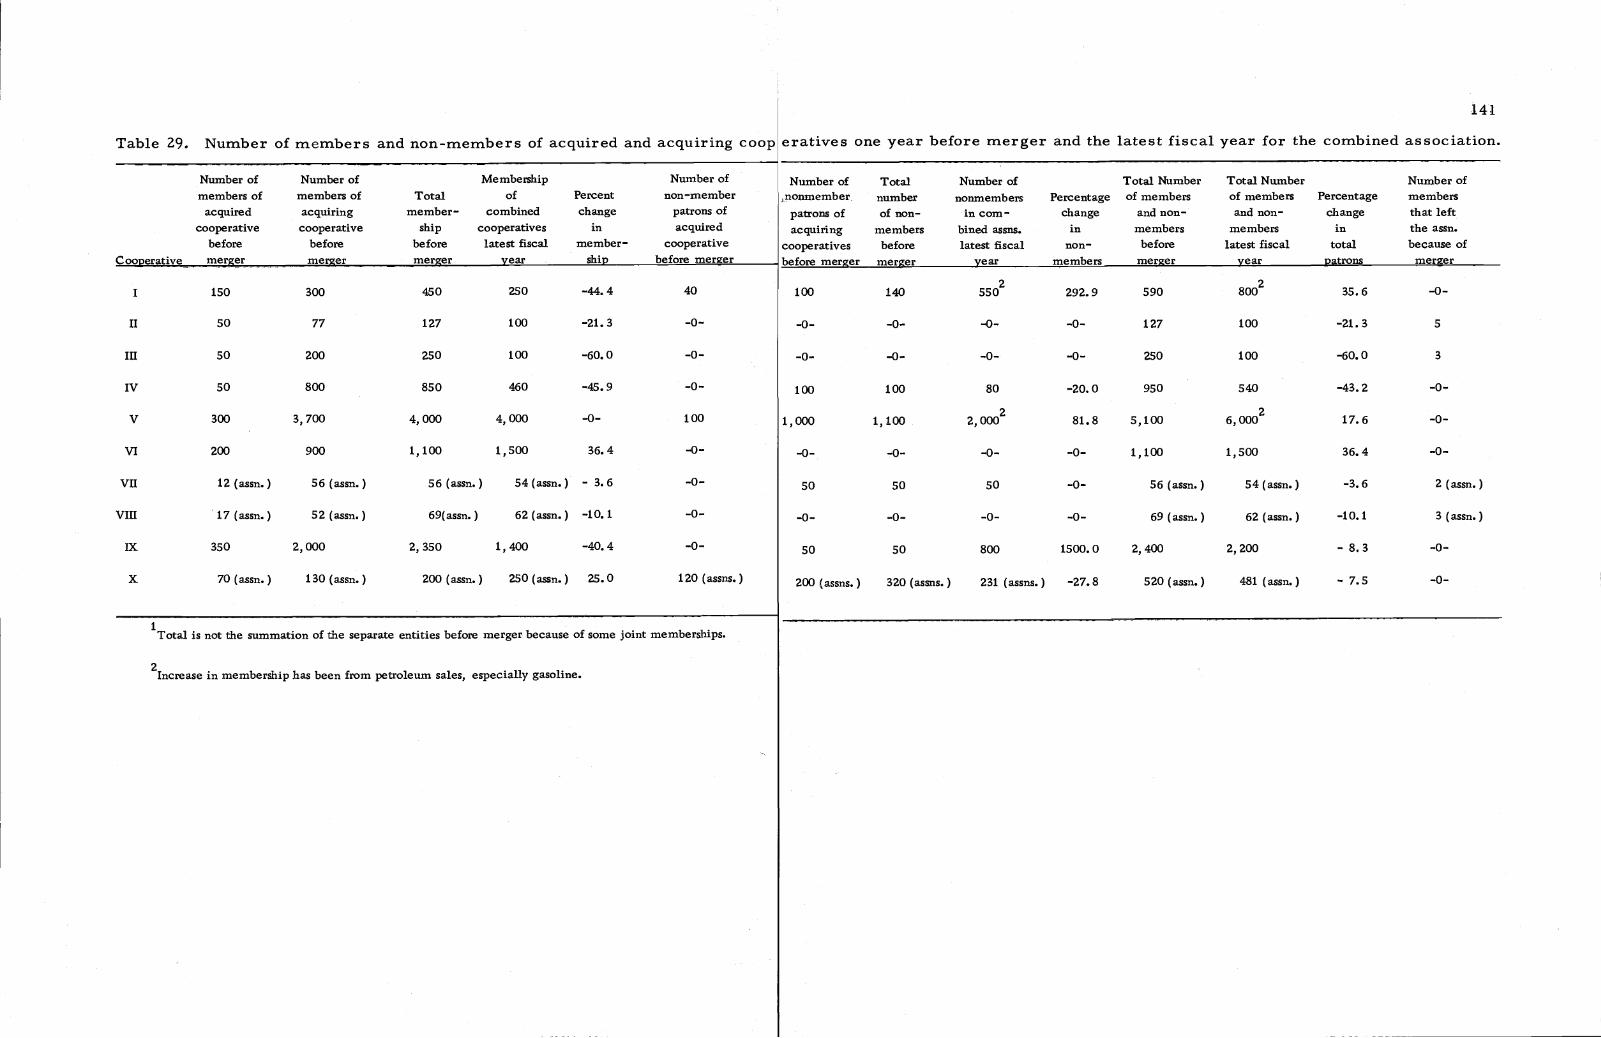
Table 29. Number of members and non-members of acquired and acquiring coop
250 -44.4 40
eratives one year before merger and the latest fiscal year for the combined association.
2 35.6
141
I 150 300 450 100 140 550 292. 9 590 800
II 50 77 127 100 -21. 3 -0- -0- -0- -0- -0- 127 100 -21. 3 S
III 50 200 250 100 -60.0 -0- -0- -0- -0- -0- 250 100 -60.0 3
Iv 50 800 850 460 -45.9 -0- 100 100 80 -20.0 950 540 -43.2 -0-
V 300 3,700 4,000 4,000 -0- 100 1, 000 1,100 2, 0002 81.8 5,100 6, 0002 17.6 -0-
VI 200 900 1,100 1,500 36.4 -0- -0- -0- -0- -0- 1,100 1,500 36.4 -0-
VII 12 (assn.) 56 (assn.) 56 (assn.) 54 (assn.) - 3.6 -0- 50 50 50 -0- 56(assn.) 54 (assn.) -3. 6 2 (assu.)
VIII 17 (assn.) 52 (assn.) 69(assn.) 62 (assn.) -10. 1 -0- -0- -0-. -0- -0- 69 (assn.) 62 (assn.) -10.1 3 (assn.)
350 2,000 2,350 1,400 -40.4 -0-- 50 50 800 1500.0 2,400 2, 200 - 8. 3 -0-
x 70 (assn.) 130 (assn.) 200 (assu.) 250 (assn.) 25.0 120 (assns.) 200 (assns.) 320 (assns.) 231 (assns.) -27.8 520 (assn.) 481 (assn.) - 7.5 -0-
Number of Number of Membership Number of Number of Total Number of Total Number Total Number Number ofmembers of members of Total of Percent non-member nonmember. number nonmembers Percentage of members of members Percentage membersacquired acquiring member- combined change patrons of patrons of of non- in com- change and non- and non- change that left
cooperative cooperative ship cooperatives in acquired acquiring members bined assns. in members members in the assn.before before before latest fiscal member- cooperative cooperatives before latest fiscal non- before latest fiscal total because of
C oqperative meger meiger merger year ship before merger before merger merger year members merger year patrons merger
1Total is not the summation of the separate entities before merger because of some joint memberships.
2lncrease in membership has been from petroleum sales, especially gasoline.
14z
Cooperative memberships in both marketing and supply cooper-
atives have declined in recent years because of merger and declining
farmnumbers. Therefore, we could expect some decline in the
memberships of the sample cooperatives. However, in Cooperatives
I, I, III, IV, and IX, memberships fell between Zi and 60 percent
from the time of merger through their latest fiscal year. Coopera-
tive I lost membership because of competitive efforts of another
cooperative and because of poor management. Cooperatives II, III,
IV which are citrus and dairy manufacturing cooperatives declined
in membership because of a change in comparative advantage for
land. But, Cooperatives I and IX have been able to offset some of
the declining membership with increases in nonmember patronage.
Cooperative IV relied on outside sources of inputs to operate its
plant at capacity. Those cooperatives that lost membership which
affected their volume of output after merger, especially Cooperatives
Ill and X, were unable to achieve economies of size. Those coopera-
tives that were able to increase output and maintain their member-
ship did achieve some economies of size.
The Timing of Cooperative Mergers
TIe cylical nature of mergers has interested economists
since the turn of the century. Figure 3 shows the periodicity of

Number
of
Coopera -ti.ve
Mergers
120-
110
log-
90-
80-
70 -
60-
50-
40_
30_
20-
10 -
0
I'
Industrial
ooperative
I - I
1900 1910 1920 1930 1940 1950 1960 1970Year
'zoo
1100
1000 Number
800 Indus-trial
700
600
500
400
300
200
100
0
Mergers
Figure 3. Number of cooperative mergers andmanufacturing and mining mergers, United States,1909 -1964
900 of

144
nergers among cooperatives a.s compared with all industrial mergers.
Students of merger cycles have distinguished four periods of high
merger activity. Three of these cycles are shown in Figure 3.
They are the merger movements of the latei9ZOs and the late
1940s, and the current merger movement. The most important
merger movement called the early merger movement (1894-1896)
is not shown in Figure 3.
Mergers among cooperatives have shown a similar cyclical
pattern to all industrial mergers, increasing in the late 192 Os and
early 1930s, increasing in the late 1940s, and again in recent years
to an apex in 1961, one year before the change in the federal tax
structure of cooperatives and one year after the Maryland and
Virgthia Milk Producers' Antitrust Case. 11 The simple correla-
tion coefficient between cooperative mergers and all industrial
11 Many cooperative leaders have misinterpreted the Maryland andVirginia Milk Producers antitrust case. The discussion in thiscase does not state that cooperatives cannot form a monopoly byacquiring cooperatives. It is apparently legal for a cooperativeto form a monopoly, but illegal for the cooperative to use coerciveand anticompetitive practices. Many cooperative leaders thinkthatthcan be challenged for acquiring noncooperatives, but thisis true only if they violate one of the other antitrust laws. The in-terpretation of these cases probably explains the increase in thenumber of mergers among cooperatives and the decline in thenumber of noncooperatives acquired by cooperatives.

145
mergers is . 542 indicating that possibly those factors influencing
all industrial mergers (most of which have occurred in the food
industry in recent years) may also influence cooperative mergers.
As previously indicated in the review of literature, Weston
(75, p. 80) identified three aggregate economic variables, on
strictly logical grounds, that tend to occur simultaneously with
merger. These variables are industrial production, stock prices,
and the wholesale price index. All variables are significant at the
five percent significance level, but stock prices, the most signifi-
cant variable, have not always exhibited influence in the same
direction at all times.
Weston (75, p. 79) believed that the dominant reason of merger
was economies of large scale production. The emphasis on cost
reduction, however, should be during periods of cyclical contrac-
tions. From this tenet, one would expect an inverse relationship
between mergers and general business activity. Similar logic should
apply to cooperatives. Therefore, one would expect an inverse rela-
tionship between cooperative mergers and the level of general busi-
ness activity.
Because of the widely held opinion that investment bankers
promote merger for their own benefit during periods of rising stock
prices, one would expect a positive relationship between stock prices

146
and mergers. If stock prices, as Mueller (50) suggests, are a
proxy variable for business expectations, one would expect a direct
correlation between cooperative expectations and cooperathre mergers.
Alvin Hansen (29, p. 209) stresses the fact that John M. Keynes and
Alfred Marshall stressed the role of confidence, which economists
underestimate, and that bankers and businessmen have been right
in emphasizing upon its effect on the marginal efficiency of capital.
While merger is not investment from society's viewpoint, but a mere
change in ownership, it is an alternative to investment and the same
rate of return calculations must be made.
A priori, farm income should influence cooperative mergers.
During periods of low farm income, one would expect cooperative
growth to improve the position of the rural population. The impetus
to the rapid expansion of agricultural cooperatives during the 1920s
was to improve the economic well-being of their members. There-
fore, one would hypothesize an inverse relationship between cooper-
ative merger and farm income.
As noted previously, the majority of the acquired cooperatives
apparently merged for financial strength. To approximate factors
influencing local business conditions, the business failure rate was
used as a proxy variable. One would suspect a direct relationship
between the business failure rate and cooperative mergers.

14.18
R = . 80A 1.5 15
(2) Y2 = 122. 15 -. 133X1 +2. 075X2 +8. 957X3
S 17.28
R = . 66
+. 523X4
(. 110)16 (2. 244) (2. 101) (.474)
-2. l84X5
(-1, 131)
147
The fifth variable expected to explain variation in cooperative
mergers is farm output. Farm output should vary inversely with
the number of annual cooperative mergers, because as farm output
falls, merger could be used to increase plant utilization.
The relationship between cooperative merger activity and the
five independent variables cited above was analyzed using regres-
sion analysis for the 1920 to 1964 and 1947 to 1964 periods.
The multiple regression equations for the post World War II
period are:
12 13(1) Y1 = 137, 53 +. 194X1 +2, 388X2 +10. 291X3 +1. 685X
(.196)16(3.149) (2. 941) (1.861)
-3. 166X4
(-2. 095)

13(3) Y3 = 429. 74 -1. 275X1 +17. 012X2 +3, 086X4
224)16 (4 105) (.955)
S =95.85y. x
R = . 95A
Where Y1 Number of agricultural cooperative mergers with
other cooperatives per year
= Number of agricultural cooperative mergers with
other cooperatives and noncooperatives per year
Y3 = Number of industrial mergers per year
17 = Nondurable industrial production index (1957-
1959 = 100)
X217= Standard and Poor's Industrials (425 stocks;
1941-1943=10.)
= Farmincome from farm sources in billions of
dollars
X4 = Business failure rate per 10, 000 firia.
= Total farm output of crops and livestock and
products (l957l959 = 100).
Significant at the 1 percent level using a 2-tailed t-test.13Significant at the 2 percent level using a 2-tailed t-test.i4Significant at the 5 percent level using a 2-tailed t-test.15Sgnificant at the 10 percent level using a 2-tailed t-test.16Values in parentheses are t.-values.17me trendj.s removed from these variables.
148

149
Because the interest in presenting the regression equations
is in determining the possible influence of aggregate economic
factors, the equations are presented even though some of the
variables are not significant and the amount of variation explained
by the independent variables is small in some cases. These re-
suits however, could be expected using the number of mergers
that are of all types and sizes.
Multiple regression equation (1) shows that 64 percent of the
variation in the number of mergers among cooperatives is explained
by the variation in the five independent variables. Stock prices,
farm income, and farm output are significant variables at the
1, 2, and 10 percent sgn1flcance levels, respedtive].y. The signs on
the regression coefficients are consistent on logical grounds except
for industrial production and farm income, although industrial
production is an insignificant variable so little reliability can be
attachedto the sign of the regression coefficient. Ceteris paribus,
as farm income increases by one billion dollars, 10 additional
cooperative mergers occur.
In equation (2), the same five exogenous variables explain 43
percent of the variation in the number of noncooperatives and
cooperatives acquired by cooperatives. The signs are conststent
with the tentative hypotheses, but the sign on farm income is

150
positive rather than negative. Farm income and stock prices are
again the only significant variables, but only at the 10 percent sig-
nificance level.
Industrial mergers are highly correlated with stock prices as
shown by equation (3). Industrial production, stock prices, and
the buiness failure rate explain 90 percent of the variation in the
number of all industrial mergers. The signs on the variables are
consistent, but the only significant variable in the equation is stock
prices which is significant at the one percent significance level.
In the post war period, the regression equations indicate that
mergers do not occur generally during difficult times in agriculture
to obtain cost reductions, but occur during periods when business
expectation appears good and farm income is high. However, it is
observed from the equations that stock prices and farmincome do
not explain the majority of the variations in the number of coopera-
tive mergers. Other factors may be important that are not associ-
ated with the variables included in the regression equations. Other
possible variables may be of local significance only. Stock prices
alone, however, explain 82 percent of the variation in industrial
mergers.
If a longer period of time is considered, the results of the
regression equations are similar to those for the post war period.
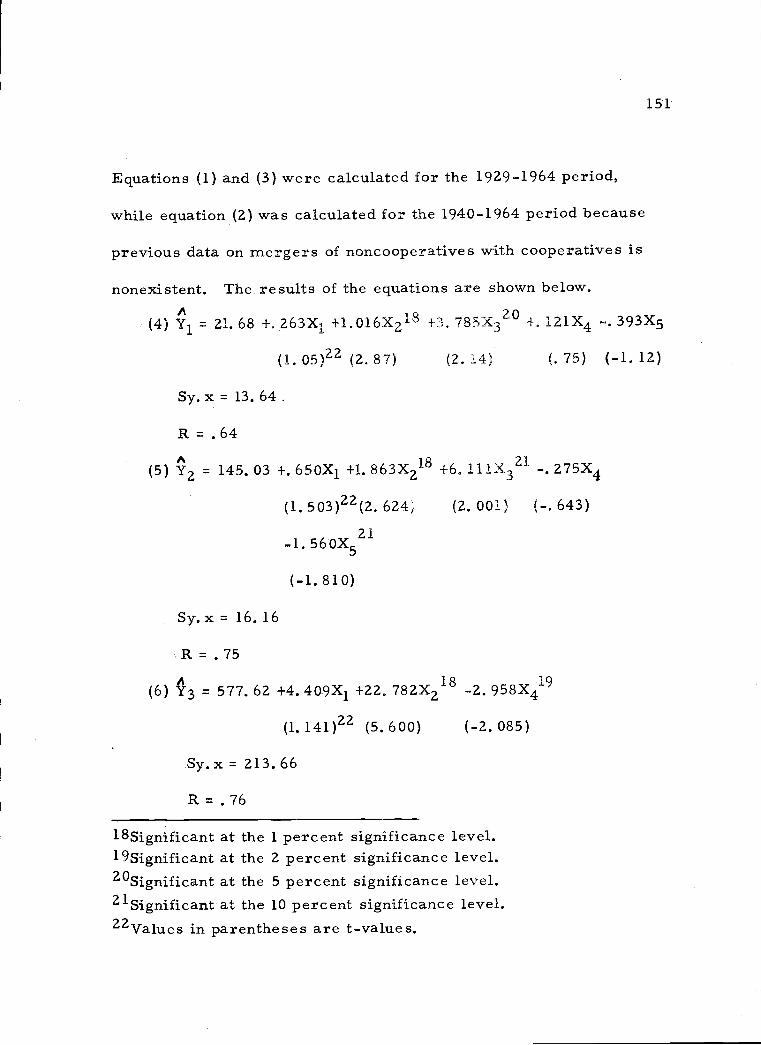
Equations (1) and (3) were calculated for the 1929-1964 period,
while equation (2) was calculated for the 1940-1964 period because
previous data on mergers of noncooperative s with cooperatives is
(1. 503)22(2. 624; (2. 001) (-. 643)
-1. 560X521
(-1. 810)
Sy.x 16.16
R = . 75
Y3 = 577. 62 +4. 409X1 +22. 782X218 -2. 958X419
(1.141)22 (5.600)
Sy.x 213.66
R = . 76
(-2. 085)
l8Significant at the 1 percent significance level.19Significant at the 2 percent significance level.20Significant at the 5 percent significance level.21Signifi.cant at the 10 percent significance level.22Values in parentheses are t-values.
151
nonexistent. The results of the equations are shown below.
(4) = 21. 68 +. 263X1 +l.016X218 +3. 785X° 4. 121X4 -. 393X5
(1. 05)22 (2. 87) (2. 14) (. 75) (-1. 12)
Sy. x 13. 64.
R = . 64
(5) 'z = 145.03 +. 650X1 +1. 863X218 ±6. 111X321 -. 275X4
152
Farinincome and stock prices are significant variables in ex-
plaining part of the variation in the number of mergers among coop-
eratives and the number of mergers of noncooperatives and coopera-
tives with cooperatives as shown by equations (1) and (2) for the per-
iods 1929-1964 and 1940-1964, respectively. Both of these variables
were significant in the post war period. In equation (2) farm output
is significant, but only at the 10 percent significance level.
Equation (6) shows that during the 1929-1964 period both stock
prices and the business failure rate were significant variables in ex-
plaining variation in all industrial mergers. The negative sign on
the business failure rate regression coefficient suggests that most
mergers occur during prosperous periods and not when other busi-
nesses are forced to exit.
Industrial production is not significant in any of the six regres-
sion equations, indicating that our hypothesis that economies of
scale should be evident during periods of contracting business acti-
vity must be rejected. This statistical evidence and the cost studies
question the hypothesis that most mergers are made to achieve
economies in size.
In addition, cooperative mergers are not highly correlated with
the business failure rate. However, over the time periods con-
sidered in this study, the sign of the coefficient is generally positive

153
indicating that cooperative mergers generally increase with the
business failure rate. However, this variable is insignificant in
all four cooperative merger equations.
Cooperative mergers appear to occur during periods when
expectations (stock prices) and farm income are high. This con-
clusion is contrary to Mueller's findings that "other things re-
maining unchanged, cooperative mergers are most likely to occur
during periods of very low levels of economic activity. In times
of severe economic depression, merger into stronger associations
may be the only alternative to complete failure" (49, p. lZ).
Farm output is negatively correlated with cooperative mergers,
but is significant only in equations (1) and (5). As farm output
decreases, one would expect the number of mergers to increase.
However, the cost studies and the regression equations question
the existence of significant economies of size via merger.
Aggregate economic variables and aggregate farm variables
explain some of the variation in the number of cooperative mergers,
but it is possible for local conditions to have effects that are not
correlated with aggregate variables.

Data on the growth of agricultural marketing and purchasing
associations were made available from the History and Statistics
Z3Branch of the Farmer Cooperative Service.
Todetermine the growth rate, some measure of cooperative
size was necessary. Total assets and annual sales are the widely
used measures of growth, but the measure should depend on the
The author appreciates the assistance of Mr. Bruce L. Swanson,Chief, History and Statistics Branch, F. C. S., U. S.D. A., forsupervising the collection of this data.
154
VI. IMPACT OF MERGER ON THE GROWTH OF AGRICULTURALCOOPERATIVES
The absolute numbers of mergers among cooperatives give
an indication of the extent of merger activity. But the full impact
of mergers on cooperative growth can only be analyzed by examining
the relative amount that cooperatives have grown externally. Even
though the measures of the relative impact of mergers on the growth
of cooperatives are not very precise, they are useful to provide a
general indication. Therefore, this chapter will examine the
amount cooperatives have grown externally, the rate of growth of
these cooperatives, and the effect external growth may have on the
future growth of agricultural cooperatives.
Data Collection

155
the objectives of the study.Z4 Annual sales volume is probably the
most accurate measure of cooperative growth because relative
sales measure the cooperative's influence in the market. Sales,
however, fail to take into account the amount of vertical integration
in an industry. Since local cooperatives have grown primarily
horizontally, this qualification should not affect the results.
A growth trend in sales is distorted by the secular trend in
product prices. If sales are to represent growth in real terms,
they must be correct for changes in the price level. The appropriate
wholesale price index was used to deflate industry sales.
The cooperative's control of the means of production and its
productive capacity is best measured by total assets. Total assets
reflect the accumulation of real property, inventories, cash and
current receivables. Major disadvantages of this measure of firm
growth are sudden variations between one year and another caused
by inventory pricing methods and re..valuation of fixed assets. It
is unlikely that much variation exists in small businesses. The
most serious qualification upon the use of total assets to measure
firm growth over time is that no series is available to deflate total
assets of business firms. Since the growth rate of cooperatives
24 For an excellent discussion of the measurs of firm growth see(75, p. 122-125) and (58).

156
will be studied using both measures of growth between 1940 and 1964,
during a period of secularly rising prices, total assets will exagger-
ate the degree of htreallt growth.
Schroeder: (58, p. 25-26) believes that even.though no sensible
method. of deflating fixed assets has been found, the growth pattern.
would not be greatly altered since only additions to assets would be
corrected for price level changes and.these normally are only a
small portion of total assets.
External Growth of Agricultural Cooperatives
A complete enumeration was taken of all cooperatives that
merged between 1940 and 1964 and that were recorded by the Farmer
Cooperative Service. This enumeration included. 434 local associa-
tions and 139 regional associations which are only about one-half of
the number of mergers recorded by Mueller (49) and the Farmer
Cooperative Service between 1940 and.l964.25 To the extent that
25 A local association is a cooperative that provides service in alocal area or community which may include a county or severalcounties. Individual farmers are members of local cooperatives.These local associations are usually federated with regionalassociations, but a few are not affiliated with other cooperatives.A regional cooperative is a cooperative that serves a districtcomprised of a number of counties or may include a number ofstate. The following types of associations are classified asregionals:
(a) All federated cooperatives - These are cooperative

157
data on 50 percent of the known cooperative acquisitions are not
available, the measurement of the proportion of growth since 1940
attributed to acquisitions is obviously understated. The method used
to isolate the merger component of growth tends to minimize the
organizations whose membership is composed of two or morelocal associations. Individual farmers are not members offederated associations directly, but are members of localcooperatives that comprise the federation. Regional federa-tions may be members of other federated associations.
Centralized associations - These are associations whichserve more than 8 to 10 counties. A regional centralizedassociation is structured as a local association in that indivi-dual farmers are direct members. Thus, no local associationexists.
Mixed cooperatives - These are cooperatives with largeannual business volumes that are neither strictly federated norstrictly centralized associations, but are comprised of bothlocal associations and individual farmer members.
Other associations - These are associations with smallbusiness volumes which market farm products or sell produc-tion supplies to local associations and individual producers ordo business in more than one state.
Bargaining associations - These associations derive allor a major portion of their business volume from negotiatingwith distributors, processors, and other buyers over price,quantities, grades, terms of sale, and other factors involvedin selling members' farm products.
For a discussion of these definitions, see (64, p. 68).

158
effects of the lack of data on all corporations. It has been mini-
mized by taking the average size of all acquisitions as a percent of
the average gowth of all cooperatives between 1940 and 1964.
This procedure measures only the direct effects of merger and
consequently does not take into account the acquired cooperativ&s
impact on future growth. Table 30 shows the extent to which the
overall growth of agricultural associations was due to external
expansion
The direct effect of cooperative mergers with cooperatives
between 1940 and 1964 was to increase the size of all cooperatives
6 ,9 percent. Cooperative mergers also accounted for 8 ..6 per-
cent. of the growth of marketing associations, but only 1.5 percent
of the supply cooperatives. Mueller (49, p. 31) estimated that
between 1940 and 1955, mergers among cooperatives accounted
for 4.1 percent of all cooperative growth, 3..6 percent of mar-
keting cooperativest growth, and 5.9 percent of supply coopera-
tives' growth. Thus, external growth through the acquisition of
other cooperatives has become a more important component of
cooperative growth in recent years.
The number of noncooperatives acquired by cooperatives
has fallen sharply since 1955. Mueller (49, p .31) estimated that
noncooperative mergers between 1940 and 1955 contributed 6.6
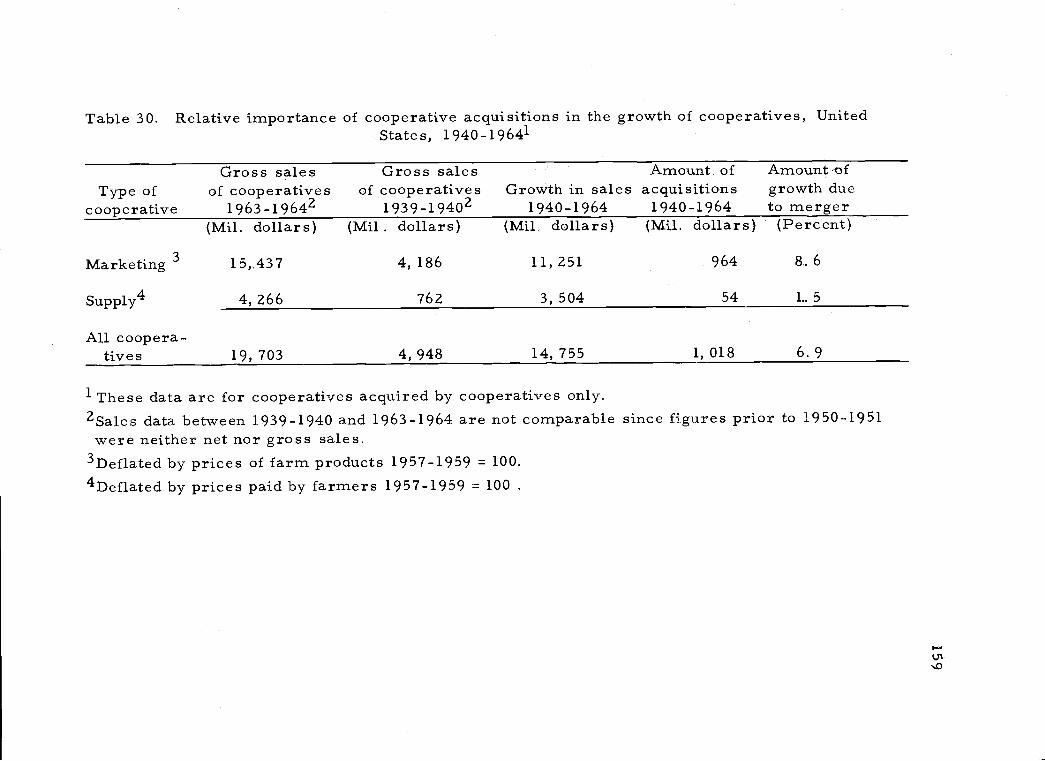
Table 30. Relative importance of cooperative acquisitions in the growth of cooperatives, UnitedStates, 1940_19641
1 These data are for cooperatives acquired by cooperatives only.2Sales data between 1939-1940 and 1963-1964 are not comparablewere neither net nor gross sales.
3Deflated by prices of farm products 1957-1959 = 100.4Deflated by prices paid by farmers 1957-1959 100
since figures prior to 1950-1951
Type ofcooperative
Gross salesof cooperatives
1963_19642
Gross salesof cooperatives
1939 _19402
Amount ofGrowth in sales acquisitions
1940 -1964 1940-1964
Amount ofgrowth dueto merger
3Marketing
Supply4
All coopera-tives
(Mu. dollars)
15,437
4, 266
(Mu. dollars)
4, 186
762
(Mu, dollars)
11,251
3, 504
(MU. dollars)
964
54
(Percent)
8.,6
L.5
19, 703 4, 948 14, 755 1,018 6. 9
Z6Muellerts estimate is probably an overestimate of cooperativegrowth from the acquisitions of noncooperative s for use betweenl96-l964 because of the declining numbers of noncooperativeacquisitions that have been consummated and the rapid growth ofcooperatives between 1955 and 1964.
160
percent of the total cooperative growth, while marketing cooperatives
accounted for 4. 1 percent, and supply cooperatives 15. 2 percent.
Since the data on noncooperative mergers in recent years is non-
existent, Mueller's past data provides a rough estimate, but it is
still useful.
Therefore, if merger among cooperatives between 1940 and 1964
accounts for 6. 9 percent and Mueller's estimate of noncooperative
growth has remained relatively constant at 6. 6 percent, external
growth would have contributed 13. 5 percent of cooperative sales. 26
If Mueller's estimate is fairly reliable for the 1940-1964 period,
internal growth still accounts for 86. 5 percent of cooperative growth.
Thus, it was evident that cooperatives have relied heavily on internal
rather than external growth.
Of the local cooperatives that did grow externally, the proportion
of external growth to total growth was 31. 71 percent measured in
terms of deflated sales and 61.13 percent in assets (Table 31).
For those agricultural industries where a number of observa-
tions are available, external growth as measured by sales repre-
sented 12 percent of the growth of cotton cooperatives, 18 percent of

Table 31. Relative importance of acquisitions in the expansion oflocal agricultural cooperatives by type of commodity,United States, 1940_19641
161
1These data do not include service cooperatives. Also, these dataare for mergers among cooperatives only.
2Sales figures are deflated by the wholesale price index for eachcommodity class (73).
3A negative growth rate as measured by total assets implies thatthe average growth rate of cooperatives in these commodity groupsbetween 1940-1964 has been declining even though they have ad-quired additional assets.4.Miscellaneous marketing includes flax, flowers, fur, bay, seed,and tung oil associations.
Commodity
Numberof
Cooperatives
Total growth dueto acquisitionsas measured by
sales2
Totar growth dueto acquisitionsas measured by
assetsPercent Percent
Cotton 6 12. 16 99. 97Dairy 83 18. 27 _434. 55Fruit 31 67. 29 772. 09Vegetable 7 26. 89 45. 24Grain 139 9.48 14. 83Live stock 11 71.61 -520. 21Wool and mohair 5 -6. 13 -953. 53Miscellaneous
marketing4 I . 12 10Farm supply 146 24. 32 34. 66
Total, all localassociations 31.71 61.13

162
d3iry, 67 percent of fruit, 27 percent of vegetable, 72 percent of
livestock, and 24 percent of the growth in farm supply associations.
Total assets as a measure of growth is less reliable than sales
because most cooperatives maintain their outlets and memberships
after merger, and sell the assets of the acquired cooperatives. This
is not universal, however, especially in farm purchasing coopera-
tives which usually operate the acquired cooperative.
Table 31 shows that local cotton cooperatives that have merged
have grown 100 percent through acquisition of assets; dairy coopera-
tives, -435 percent; fruit, 772 percent, vegetable, 45 percent; grain,
15 percent; livestock, -520 percent; and farm supply, 35 percent.
External growth is important to the local acquiring cooperatives.
These acquired almost one-third of their sales volume and two-
thirds of their assets through mergers between 1940 and 1964.
Acquiring regional associations, on the other hand, have ac-
quired only one-eighth of their sales volume and about one-eighth
of their assets through mergers between 1940 and 1964 (Table 32.)
Regional fruit and vegetable cooperatives acquired 25 percent
of their sales by external growth. Regional dairy cooperatives'
external growth amounted to 15 percent, while farm supply regionals
acquired 7 percent of their sales. External growth of regionals be
tween 1940 and 1964 did not vary as much as for local associations.
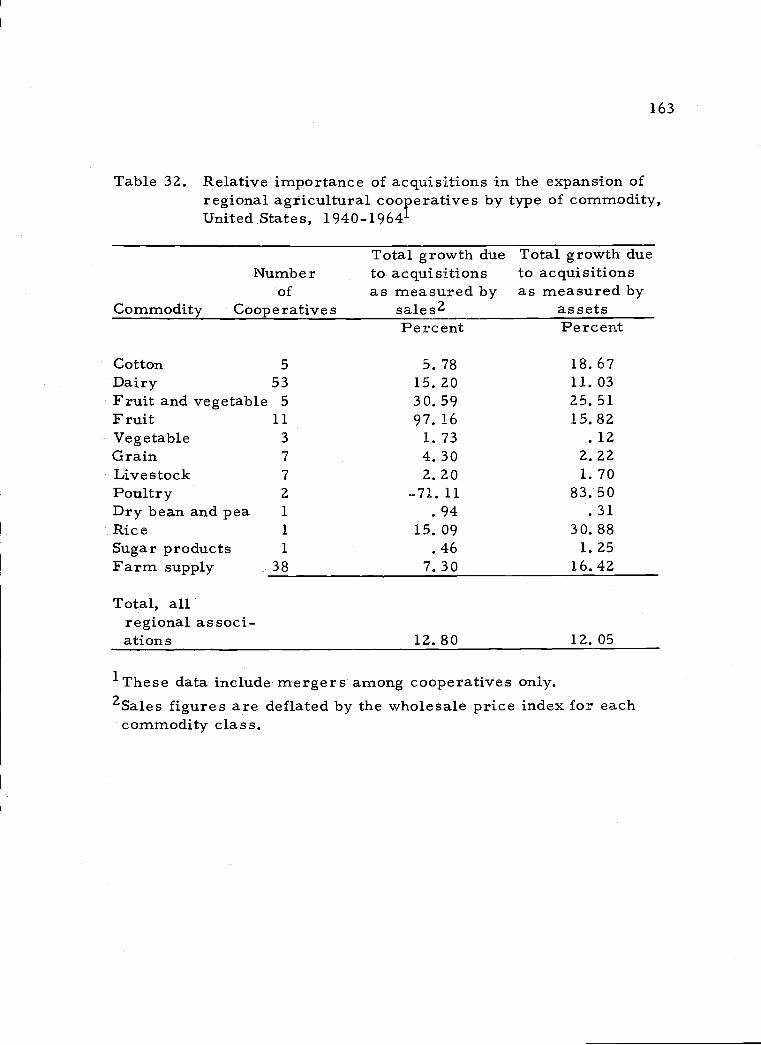
Total growth due Total growth dueNumber to acquisitions to acquisitions
of as measured by as measured byCommodity Cooperatives sales2 as sets
Percent Percent
Cotton 5 5. 78 18. 67Dairy 53 15.20 11.03Fruit and vegetable 5 30. 59 25. 51Fruit 11 97.16 15.82Vegetable 3 1. 73 . 12Grain 7 4.30 2.22Livestock 7 2. 20 1. 70Poultry 2 ..7l.11 83.50
1These data include mergers among cooperatives only.2Sales figures are deflated by the wholesale price index for eachcommodity class.
163
Table 32. Relative importance of acquisitions in the expansion ofregional agricultural cooperatives by type of commodity,UnitedStates, 1940-1964'
Dry bean and pea 1 .94 .31Rice 1 15.09 30.88Sugar products 1 . 46 1. 25Farm supply 38 7.30 16.42
Total, allregional associ-ations 12.80 12. 05
164
This is probably caused by the fact that regional associations acquire
distribution outlets and processing facilities and are not merging to
increase membership volume as many local associations do that are
not operating at capacity.
Regional.dairy cooperatives that made acquisitions acquired 11
percent of their assets while farm supply cooperatives acquired 16
percent of their assets by merger in the period from 1940-1964.
The Effect of Merger on the GrowthRate of Agricultural Cooperatives
Comparisons were made of the average growth rates of the 434
local associations with a 10 percent sample of all local cooperatives
that grew internally according to the Farmer Cooperative Service. 27
These comparisons show that those cooperatives that engagedin ex-
ternal growth, grew at an average rate of 5. 64 percent per year
between 1940 and 1964 compared to the internal local associations
growth rate of 3. 58 percent per year as measured in sales (Table 33).
27A 10 percent systematic sample of all local and regional associa-tions that grew internally was made by the Farmer CooperativeService from its annual survey of farmer cooperatives. Thissample ináluded '732 local associations and 59 regional associa-tion s.
Because some cooperatives did not report their total assets andbusiness volume each year between 1940 and 1964, the data wasaveraged for all cooperatives that reported in a given year.

Table 33. Comparison of average growth rate measured in salesand total assets, of merging and nonmerging local co-
operatives, United States, 1941-1964
Growth rate of merging Growth rate of nonmergingcooperatives local cooperatives
165
Year Sales Tta1 assets Sales Total assetsPercent Percent Percent Percent
1941 3.325 28.756 2.748 21.3781942 9.751 5.446 7.995 L.5121943 11.855 11.168 6.207 12.4971944 20.484 40.866 5.910 6.2791945 5.846 -10. 234 1.609 33. 1891946 - .905 28.201 5.283 41.1561947 3.104 18,735 1,237 13.7991948 4.624 16.885 .639 9.2931949 5.541 - 4.602 6.197 .6101950 -8. 359 7. 842 -6. 887 3. 0111951 -1.637 5.958 3.113 12.8101952 6.797 12.127 1.864 11.8431953 3.828 1. 779 4.624 5. 1981954 -.127 9.271 - .578 3.3121955 9.858 11,349 4.572 2.2981956 9.821 7.212 2.309 4.6821957 4. 742 6. 863 5. 005 8. 3221958 7.331 10.649 5.594 7.6671959 8.766 15.785 6.334 14.5111960 7.337 2.957 4.460 4.6631961 3.545 7.038 5.132 6.2831962 7. 125 6. 208 . 022 8. 0891963 4.968 - 4.109 7.837 5.7121964 7.619 2.414 4.647 20.319
Average growthrate 1941-1964 5.635 9.940 3.57.8 8. 986
Standarddeviation 5.44 3.24

166
If total assets is used as a measure of growth, merging cooperatives
grew at an average growth rate of 9. 94 percent per year compared to
the internal growth cooperatives that grew at an average rate of 8. 97
percent per year. Thus, those cooperatives that have merged have
a higher growth rate than those that did not. Also, because sales
and profits of business firms are highly correlated (46, p. 130), one
would not expect the net savings of those cooperatives that are ex-
panding sales to be more profitable unless diseconomies of growth
are encountered.
Both merging and nonmerging local cooperatives experienced
considerable growth during World War II. The growth rate tended
to fall during the early 1950s, but the growth rate in sales has re-
mained relatively constant in recent years (Table 33).
It is possible to test the hypothesis that on the average, merging
cooperatives do not grow faster in sales volume than nonmerging
cooperatives by applying the t-test for paired observations (40,
p. 108). A one-tailed test is necessary since merger usually in-
creases the rate of cooperative growth. At the five percent sig-
nificance level, the critical region is t>l. 714. The computed
t-value is Z. 302 which is in the critical region so the conclusion is
that the hypothesis is rejected. It is possible then to accept the
alternative hypothesis that merging cooperatives grow faster than
nonmerging cooperatives, only because the null hypothesis was re-
jected.
Applying the same test to the growth in total assets between 1941
and 1964 of merging and nonmerging local cooperatives, the t-value
is only . 878 so the nullhypothesisrnustbe accepted that there is no
significant difference in the rates of growth of assets of merging and
nonmerging cooperatives. Again it should be emphasized that the
sales data is more complete than the total asset data. Also, as
previously mentioned many assets of the acquired cooperative are
disposed of subsequent to merger.
Since mergers occurred over the time period of analysis, some
internal growth is included between 1940 and the time of merger.
By eliminating the internal growth of those cooperatives that used
external growth, the average rate of growth after merger dropped
to 5. 0 percent per year between 1940 and 1964. This result infers
that those cooperatives that do merge are growing, at a faster rate
28The t-value is calculated as follows:
t 2. 05775 0 = 2. 302 with 23 degrees of freedom
89405
167

1.68.
internally before merger than after merger. Furthermore, the
hypothesis is not rejected at the five percent significance level that
the average rate of growth in sales of merging cooperatives is no
greater than for nonmerging cooperatives.
Regional cooperatives that made acquisitions grew in sales at
an average rate of 4. 65 percent per year as compared to regionals
that grew entirely internally at an average rate of 6. 57 percent per
year (Table 34). If the internal growth is eliminated from the
growth of external growth cooperatives, the regional merging
cooperatives grew in sales at an average rate of 4. 29 percent per
year. Thus, regional associations that grew internally grew at a
faster rate on the average than those associations that grew exter-
nally. In addition, the rate of growth of external growth regional
cooperatives was greater before merger than after merger. This
was also true for the local cooperatives using external growth.
However, this comparison can be misleading for regional coopera-
tives because they can grow externally through centralization or
federation with other cooperatives or members through contractual
arrangements. This growth, which is technically external growth,
is not taken into account in the analysis of cooperative growth. It
is possible for the so-called internal growth cooperatives, in fact,
to have grown more externally than the merging associations.

Table 34. Comparison of average growth rate measured in salesof merging and nonmerging regional cooperatives,
United States, 1941-1964
-
169
Growth rate of Growth rate ofmerging cooperatives nonmerging cooperatives
Year sales sales
1941194219431944
Percent
12.480- 3.78019, 94720.074
Percent
-33.65284.92319, 96535.945
1945 3. 601 - 7.5211946 - 7. 202 - 1. 0071947 - 3.353 -44. 3361948 - 1.239 54. 3691949 7. 227 17. 5071950 - 3.304 -19. 8861951 - 5. 538 14. 3991952 9.633 - 6.6791953 9.991 -10. 3061954 2, 803 4. 0891955 1.870 1.8161956 1.972 - 7.6801957 3.985 7.8921958 3.157 14.4401959 9. 091 6. 4441960 2.827 4.1211961 7.385 1.0831962 2.346 7.9511963 8.313 - 2.2151964 9. 287 16, 059
Average growthrate (1941-1964) 4.649 6.572
Standard deviation 7.11 26.18

170
A comparison of the average annual growth rates of regionals
by type of organization between 1940 and 1964 shows that federated
associations have grown more rapidly than centralized associations
and centralized associations have grown faster than mixed associa-
tions (Table 35). Table 35 shows that the nonmerging regional
cooperatives, regardless of the type of organization, grew more
rapidly than merging associations.
Table 35. Comparison of average growth rate, measures in sales ofmerging and nonmerging regional cooperatives bytype of organization, United States, 1941-1964
Average rate Average rateType of of growth of of growth oforgani- No. of coop- merging No. of coop- nonmergingzation eratives cooperatives eratives cooperatives
Percent Percent
Central-I z ed 65 4.89 44 5.90
Federa-ted 39 6.49 9 8.41
Mixed 35 4.51 6 6.631
'Mixed cooperative growth from 1951 to 1964.
Even though the rate of growth of internal growth regionals
has been larger than their merging counterparts, the variability
of the internal growth cooperatives is over three times the varia-
tion in the rate of growth of merging regional associations (Table 34).
The variation in the growth rates ampng local cooperatives was the
171
opposite of regional associations. The standard deviation in the
external growth rate of locals between 1941 and 1964 was 5. 44
percent compared to the 3. 24 percent among internal growth
cooperatives.
In conclusion, merging local associations have grown somewhat
more rapidly than nonmerging local cooperatives, but the difference
inthe rate of growth is not significant at the 5 percent significance
level. The situation is the reverse for regional cooperatives. The
internal growth regional associations have grown faster than the
external growth regionals, but internal growth regionals in fact
could have grown externally through contractual arrangements of
federations or centralization. Also, all cooperatives that used
external growth were growing faster before merger than they did
after merger which may infer that there could possibly be dis-
economies of growth by merger. A possibility is the diversion of
management from plant operations to the difficult task of taking
over the operations of another organization and integrating it into
the regular operations of the cooperative.

Future Size Distribution of Local and Regional Cooperatives
Markov chains have been used to "characterize how economic
processes and institutions have changed through time as well as
what paths they are likely to take in future time periodsu (33, 1).
Markov chains are a useful tool to determine past and potential
size distribution of agricultural marketing and purchasing coopera-
tives in the United States. The purpose of this section of the thesis
is to project the future growth of cooperatives to determine their
vitality in American agriculture.
In specifying this probability model, one must assume that
cooperatives can be grouped according to some criterion of size
into a number of states or classes. In addition, the movement of
cooperatives through these classes or states can be regarded as a
stochastic process. The probabilities of transition must be con-
stant in time and the probability of moving from one state to
another is solely a function of the two states involved. Thus,
the transition of a cooperative through a given number of states
during some given period of time depends upon the cooperative's
size at the beginning of the period and the number of states or
steps involved. The movement through these steps is independent
of the previous or historical growth of the cooperative. In this
1 7a

simplified model, absolute size is the determinant of growth.
Obviously this restrictive assumption means that technology,
economies of scale, financial policy variables, and profits are
correlated with cooperative size.
Another simplifying assumption is that the interaction of all
the economic variables is summarized in the transition probabil-
ities and does not change during the evolutionary process. This
limiting assumption can lead to correct conclusions if the time
period covered includes at least one complete business cycle (1).
Farris and Padberg (Zl) suggest that the transition probabil-
ities vary among and within markets, but periods of stability are
likely. Nonetheless, changes in the probabilities may occur
because of external influences such as government policy and
technological changes. These factors may not affect the different
size categories equally. Farris and Padberg conclude that it is
necessary to consider whether past relationships in the time
period selected will prevail during the length of the projections.
173

Markov Chain Process
Markov chains are a stochastic process. A stochastic process
is "a sequence of experiments where the outcome of each particular
experiment depends on some chance element" (36, p. 160). A
finite number of experiments and a finite number of possibilities
for each experiment must be assumed. If all the outcomes of the
experiments that precede a given experiment were known, then both
the possibilities for this experiment and the probability that any
particular possibility will occur is known.
Coin tossing, unlike the Markov process, is an independent
process. For example, in repeated throws of an ordinary coin,
there are two possible outcomes on any particular experiment and
the probabilities for each outcome is one-half regardless of any
other outcomes. The probability of any given experiment does not
29Kemeny (35, p. 148) defines a Markov chain as follows: A finitestochastic process with outcome function f0, f1, . . . , f is aMarkov chain process if the starting state, given by fo is fixedand
(1) Pr [f=t(
(1n1 =S) (f2 =r) A .,(f1=a)J =
Pr LfntI
1n-i SJ
(Z)Pr [f=t en-i = Pr Lfmt 1 m-i =SJ For all m 1, nZ
and any possible sequence of outcomes a,. .., a, t.
174

175
depend upon the outcomes of previous experiments. In the Markov
process, the outcome of each preceding experiment is not indepen-
dent and influences the outcome of the next experiment.
In order to illustrate the operation of a Markov process, a
sequence of experiments is assumed with the following properties.
The outcome of each experiment is one of a finite number of possible
outcomes S1, S2, . The probability of the outcome S on any
given experiment depends upon the outcome of the immediately
preceding experiment. There are given numbers which represent
the probability of outcome S on any given experiment, given that
outcome S occurred on the preceding experiment. The outcomes
S1, S2, S3, ... S are called "states, " and the numbers are
called transition probabilities. If it is assumed that the process
begins in some particular state, then there is enough information
to calculate probabilities of statements for the over-all sequence
of experiments.
A generalized Markov chain model can be specified as follows:

1.76
The column vector S1 with states, S1, S2, . . S specifies
the magnitude of the experiment in its initial state. The row
vector Si with states S1, S2, . . .,
S specifies the outcome of the
experiment in the following time period.
The transition probability matrix (P1fs) designates the probabil-
ity of an element in a given state to remain in the same state during
the following period or move to another state. For example, S1 of
column vector' S has P11 probability of remaining in state S,
pobabi1ity of moving to state S etc., in the S vector that repre-
sents the subsequent period. Consequently the P1 l and. 0
1=1
for each row in the transition probability matrix, signifying that any
element in a given state invector S will either remain in that stat
or move to another state in vector. Sj.
Since the transition probabilities matrix is established from the
movements of elements from column vector S to row vector Sj

177
then the transition probabi1ities matrix (D) can beased to project
the outcomes of future experiments. However, this simplified
model is similar to a trend projection using regression analysis
in that one must assume that the influences in the base period will
continue to have the same influence in the future. Markov chains
are more restrictive than regression analysis because it is im-
possible to even calculate standard errors of the estimate or con-
fidence intervals for estimates within the range of the data.
To use Markov chains to project the outcomes of future
experiments, the initial state vector Si multiplied by the (D) matrix
equals the Sj for the first experiment or time period. For the projec-
tion of future experiments, Sk ... S is accomplished by successive
multiplication of the (D) matrix times the vector outcome of the
preceding experiment.
The states of the S vector in this study designate size cate-
gories of marketing and purchasing cooperatives. The number and
size of the cooperatives appearing in each state were those existing
in 1956. The movement of cooperatives was traced over the nine-
year base period to obtain the S row vector. The (D) matrix values
were determined by observing the movement in size of a particular
cooperative between the extreme points of the base period years.

178
One modification of the Markov process is necessary so as to make
the model as realistic as possible. That modification is to allow
for entry into and departures from the industry. To accommodate
this change, one row and one column were added to the (D) matrix.
The Sn state of the S. vector represents potential entrants of new
cooperatives and the S state of the S. vector represents the exit
of cooperatives. The probability of entry or exit for each state
is calculated as described above for all other states. 30
Empirical Results
The Markov process was used to observe the future growh
pattern of local marketing and supply cooperatives that grew ex-
ternally as opposed to those which grew entirely by internal means.
The annual sales volume of cooperatives represents the firm size
(Table 36). In any one year, it is possible for a cooperative to
be in any one of the 10 specified size classes. The class limits are
arbitrarily chosen to observe the growth pattern of the firms. More
defined categories could be specified if data were available on
30 For computation, an IBM 1620 program for Markov ChainProcesses developed by J M Stafford and IN . R. Reilly, bothformerly of the Purdue Agricultural Economics Department, wasmodified to run on the CDC 3300 computer.

Table 36. Class intervals employed in the analysis of growthpatterns of merging and nonmerging local cooperatives
Size class
1.79
Class limits1Merging cooperativesand all local coopera- Nonmerging
tives cooperativesMillion dollars Million dollars
1Annual sales for each cooperative were deflated by the appro-priate wholesale price index, 1957-1959 = 100.
Si C2O_ .79 -O- .39
.8 - 1.59 .4- .79S3 1.6 - 239 .8--l.19
2.4 - 3. 19 1.2 -1.59
S5 3. 2 - 3. 99 1.6 - 1.99
S6 4. 0 - 4. 79 2. 0 - 2. 39
S7 4. 8 - 5. 59 2.4 - 2. 79
5. 6 - 6. 39 2.8---. 3.19
S9 '6. 4 '3. 2
S10 0 0

180
economies of sca.le, the extent of the market, or other factors in-
fluenci.ng the sizes of cooperatives.
Before the Markov Chain Process is applicable to cooperative
growth, the assumption that a cooperative's size in time (t+l) is
dependent solely on time (t) must be tested statistically. Statis-
tically, the assumption of independence is tested by the use of a
Chi-square test (72). In all cases, the computed Chi-square values
exceeded the theoretical tabular values at the . 01 significance level,
so the hypothesis of independence was rejected.31 The rejection of
this hypothesis increases the validity of the assumption that a
cooperative's size in a given period depends on its size in preceding
periods.
Transition Probabilities of Local Cooperatives: The transition
probabilities computed from observed year -to -year movements
among size classes by sales volume is shown in Table 37. These
transition probability matrices show the growth pattern of coopera-
tives. The probability coefficients of the matrices are the
31The CM-square value for merging local cooperatives was 709. 18;nonmerging local cooperatives, 1, 018. 48; all local cooperatives,1, 166. 12; and all regional cooperatives, 162. 92. The theoreticalChi-square value with 8l degrees of freedom is 112. 329 at the . 01significance level. Since the computed Chi-square value exceededthe theoretical value, the hypothesis of independence was rejectedin all cases.
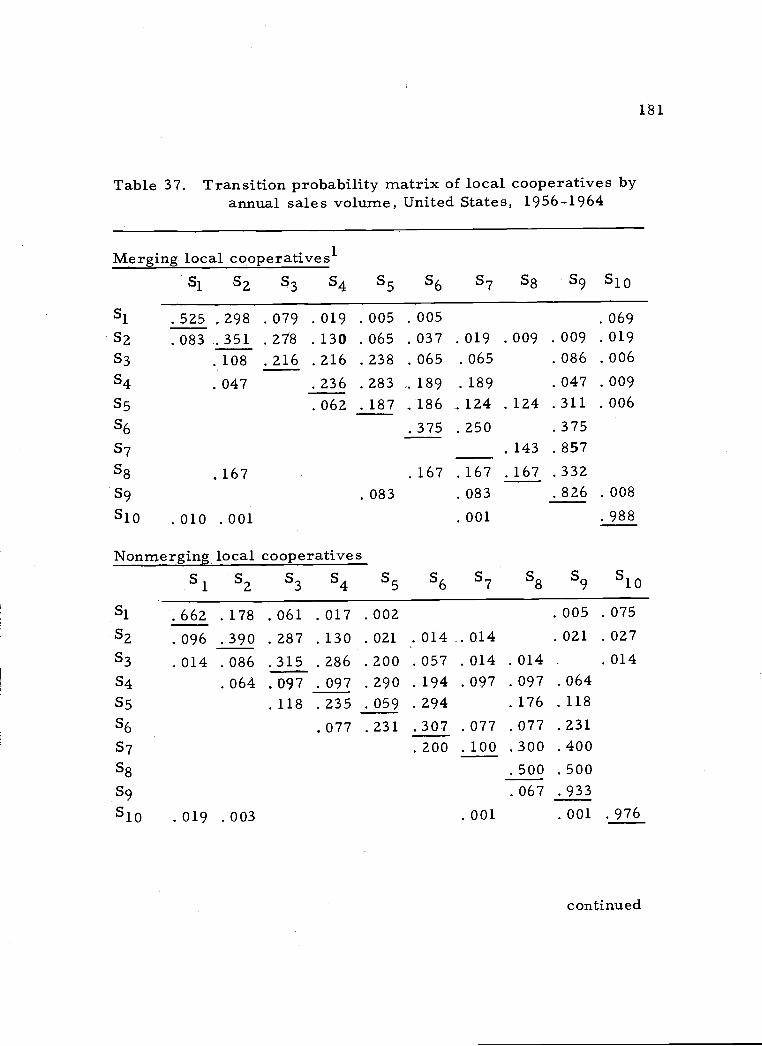
Table 37. Transition probability matrix of local cooperatives byannual sales volume, United States, 1956-1964
Merging local cooperatives'
l s2 S3 S4 S5 S6 S7 S8 59 S10
S1. 525 . 298 . 079 . 019 . 005 . 005 . 069083 .351 . 278 . 130 . 065 . 037 . 019 . 009 . 009 . 019
53 . 108 .216 .216 .238 . 065 . 065 .086 . 006S4 . 047 .236 .283 189 . 189 . 047 . 009S5 .062 .187 .. 186 .124 .124 .311 .006S6 .375 .250 .375S7 .143 .857S8 .167 .167 .167 .167 .332S9 . 083 . 083 . 826 . 008S10 .010 .001 .001 .988
Nonmerging local cooperativesi
2S3 S4 S5
6s7 S8 S9 S10
S1 .662 .178 .061 .017 .002 .005 .075S2 .096 .390 .287 .130 .021 .014 .014 .021 .027S3 .014 .086 .315 .286 . 200 . 057 . 014 .014 . 014S4 .064 .097 . 097 .290 . 194 . 097 . 097 . 064
.118 .235 .059 .294 .176 .118S6 .077 .231 .307 .077 .077 .23157 .200 .100 .300 .400S8 .500 .500S9 .067 .933S10 .019 .003 .001 .001 .976
continued
181

All local cooperatives2
182
Table 37. Transition probability matrix of local cooperatives byannual sales volume, United States, 1956-1964--
continued
S1 S2 S3 S4 S5 S 6 7 8 9 l0
Si 722 . 168 . 013 . 004 . 005 . 003 . 085S2 .087 .456 .317 .083 .024 .003 .002 .001 .001 .026S3 .202 .377 .162 .138 .035 .035 .032 .011 .008S4 .007 .139 .385 .252 .098 .028 .077 .014S5 022 . 282 . 065 . 261 . 022 . 326 . 022S6 .145 .479 .174 .014 .188S7 1. 000
200 . 200 . 400. 200S9 023 233 . 023 . 698 . 023S10 . 224 . 001 . 001 . 001 . 773
1Based upon the 10 percent sample of nonmerging cooperatives and10 percent of the merging cooperatives. The transition probabil-ities for merging and nonmerging cooperatives cannot be summedby size categories in order to derive the transition probabilitiesfor all local cooperatives because they are based on differentnumbers of cooperatives and different size categories.
2The number of aggregate cooperative discontinuance s was esti-mated by the Farmer Cooperative Service, U. S. D. A. To dividethe aggregate data by size class, the assumption was made thatall nonmerging cooperatives exit from business in the sameproportion as merging cooperatives.
3Cooperative acquisitions are included in size category Sio (exitor no production).

183
probabilities of a movement of cooperatives from the size classes
indicated in the left column to each of the size classes in the top
row of Table 37. For example, the probability of a merging local
cooperative in size class S1 in 1956 to remain in that size class in
1964 is . 525. The probability of a cooperative moving to size
class S2 is . 298 and the probability of moving to size class S6 is
005.
The magnitude of the entries in the cells along the diagonal
of the matrices indicates that between 1956 and 1964, there was
a strong tendency for merging and nonrnerging local cooperatives
to move to a larger size classification. This tendency is readily
visible as the rnajoiity of the entries fall to the right side of the
principal diagonal. Although the vitality of both merging and non-
merging local cooperatives is partially caused by the somewhat
arbitrary class intervals, it is possible that some other method
of defining these class intervals would have given the system more
stability.
From the transition matrices, the probability of a cooperative
increasing in size can be compared with the probability of a
cooperative decreasing in size. The aggregate probability that a
cooperative will increase in size in each size category is calculated
by summing all of the elements horizontally to the right of the

184
principal diagonal, except Si which represents exits. Conversely,
the sum of the elements to the left of the principal diagonal and S10
represents decreases. For example, observe class S6, for all
local cooperatives. The probability of an increase in size is
.376, (. 174 + . 014 + . 188), compared to a decrease of . 145.
The merging and nonmerging matrices show generally that
merging cooperatives with annual sales greater than 4 million
dollars and nonnierging cooperatives with annual sales greater
than 1. 2 million dollars have a remote chance of discontinuing
operations. Usually, the larger the size of merging and nonmerging
cooperatives the higher is the probability of increasing in size.
Also, as expected, the smaller cooperatives are the cooperatives
that are likely to exit and enter.
Estimated Number of Local Cooperatives: The estimate of the
number of cooperatives in each size category in 1972 and 1980 is
to be interpreted as a general forecast noted from the stochastic
movement of cooperatives between size categories. The Markov
process indicates that there is a slight trend of fewer local
cooperatives, but the trend is decreasing at a decreasing rate
(Table 38). It is estimated that the number of local cooperatives
will decrease from 7,418 in 1964 to 7, 238 in 1980, or only 2.4

Size category
.185
Table 38. Estimated number of local cooperatives per size class,United States, 1972 and 1980
1Actual number of cooperatives calculated from a 10 percent sampleof merging and nonmerging local cooperatives.
percent. In the size class of less than .8 million dollars of
annual sales (S1) the number of local cooperatives will decrease
30. 9 percent between. 1964 and 1980 compared to size class S9
(greater than. 6. 4 million dollars of annual sales) which will in-
crease 350 percent over the same time period.
Thus, the analysis shows that the total number of local coopera-
tives will decrease in number with merger accounting for about
approximately 50 percent of the cooperatives exiting in the smallest
size category. Both internal and external growth cooperatives have
the inherent growth tendencies that will increase the number of
cooperatives in all of the larger size classes.
YearS S- S
,'S S
-'SL.
I-'S S0 S9 Total
19561 5,921 1,136 371 143 46 69 16 5 43 7,750
19641 4,596 1,589. 597 244 169 80 46 5 92 7,418
1972 3,752 1,626 821 343 267 127 98 39 220 7,290
1980 3, 178 1,548 922 422 355 205 147 47 414 7, 238

186
Growth of Regional Cooperatives: The growth pattern of regional
cooperatives was also analyzed by observing the movements of
these cooperatives between specified class categories between
1956 and 1964. Size classes were defined to reflect the observed
sizes of the regional cooperatives in terms of annual sales (I'abIe 39).
Size category S10 (no sales) provides for potential entry of
new regional cooperatives as well as exits due to merger or other
reasons.
The movement of regional cooperatives from one category to
another is shown in Table 40. This transition probability matrix
shows, as did the matrix for the local cooperatives, the growth
potential of regional cooperatives. Generally, the larger regionals
have a greater probability of growing than do the smaller regionals.
The likelihood of entry is very small, but the probability of a
regional cooperative merging or leaving business for other reasons
is 35 percent in the size class of less than $10 million annual sales
volume.
The predicted number of regional cooperatives in 1972 and 1980
is shown in Table 41. The projected total number of regional
cooperatives shows a decrease of 280 cooperatives between 1964
and 1980 or 42.4 percent. The number of cooperatives with
annual sales less than 20 million dollars will decrease from 508

Table 39. Class intervals employed in the analysis of the growthpatterns of regional cooperatives
1Annual sales are deflated for each cooperative by the appropriatewholesale price index (1957-1959 = 100).
Table 40. Transition probability matrix of regional cooperativesby annual sales volume, United States, 1956-1964
SI
l .569S2 .04953
54
S5
S7
S9
lO .004
Million dollars
Si c.0 - 9.99S2 10.0- 19.99S3 20. 0 - 29. 99S4 30. 0 - 39. 99S5 40. 0 - 49. 99S6 50. 0 - 59. 99S7 60. 0 - 69. 99S8 70. 0 - 79. 9959 >80. 00S10 0
187
S3 S5 S6 S7 S8 S9 S10
.064 .016 .001 .350.216 .186 .225 .118 .108 /ozo 078
.029 .314 .143 .314 .029 .057 .114.157 .579 .053 . 053 . 105 .053200 200 . ZOO . 200 . 200
.333 .6671.000
____ .750 .2501. 000
996
Size class Class limits'

Table 41. Estimated number of regional cooperatives per sizeclass, United States, 1972and 1980
'Actual number of cooperatives calculated from a 10 percentsample of merging and nonmerging regional cooperatives.
firms in 1964 to 168 cooperatives in 1980. The number of regional
cooperatives between 20 and 80 million dollars of annual sales will
remain fairly constant, but there will be a 252 percent increase in
the number of cooperatives with sales greater than 80 million
dollars annually.
These Markov chains show that the vitality of all cooperatives
in the United States is great. There will be fewer cooperatives,
but they will be larger, with the smaller cooperatives being forced
to merge or liquidate their operations. The evidence from this
analysis suggests that regional cooperatives can grow as effectively
and rapidly through internal expansion as they can through merger,
188
Year
Size category
S1 S2 S3 S5 S5 S6 S7 S8 S9 Total
19561 691 102 35 19 5 3 2 4 13 874
1964k 441 67 45 39 13 25 3 2 25 660
1972 237 42 42 44 10 34 7 2 53 417
1980 143 25 34 41 7 33 7 2 88 380

189
acquisition, or consolidation. On the other hand, local cooperatives
that have used external growth have grown more rapidly than those
using internal growth, but the difference in their average growth
rates is minor.
VII. SUMMARY AND CONCLUSIONS
This research has been conducted on the premise that there is a
need to determine the economic impact of mergers on the growth
of agricultural cooperatives. Mergers, acquisitions, and consoli-
dations have not been a panacea to those using this method of growth
in past years and many cooperatives considering merger are often
unaware of the factors conducive to success or failure of this
alternative method of growth.
Cooperative Merger Act1ity
Three periods of heightened cooperative merger activity have
occurred. These are (a) the 1930s, (b) the mid-1940s, and (c)
early 1960s. The largest merger cycle among cooperatives is
taking place at the present time with an average of 55. 2 mergers
per year between 1960 and 1964. The number of noncooperative s
absorbed by cooperatives is decreasing. It is possible that these
acquisitions are relatively small and are therefore unreported in
trade journals. In anycase, noncooperatives acquired by
cooperatives have decreased from an average of 38 mergers per
year between 1940 and 1944 to 11.8 mergers per year over the
1960 to 1964 period. Between 1909 and 1939, many cooperative
190

191
mergers occurred among fruit and vegetable cooperatives. Since
that time, most of the merger activity has been concentrated among
dairy and purchasing cooperatives. Furthermore, the majority of
the noncooperatives acquired by cooperatives has also occurred in
the dairy industry.
Even though mergers among cooperatives are increasing, mer-
gers between 1955 and 1964 accounted for only 4. 3 percent of all co-
operatives operating in 1955. Cooperative merger activity did, how-
ever, represent 6. 4 percent of the net decrease in the total number
of cooperatives between 1955 and 1964. According to Farmer Cooper-
ative Service records, merger activity accounted for only 21. 2 per-
cent of all cooperative discontinuances between 1957 and 1964. If
cooperatives merging with noncooperatives are taken into account,
26. 8 percent of all discontinued cooperatives used external growth as
a method of discontinuing their business identity betweei 1957 and
1964.
Local cooperatives that have been acquired between 1956 and
1964 have been small. Approximately 85 percent of these coopera-
tives had an annual sales volume of less than . 8 million dollars.
Only . 06 percent had an annual sales volume greater than 4 million
dollars. The size of acquiring local cooperatives is also small.
The Markov chain analysis shows that in 1964, after mergers had
been consummated, 55 percent of these external growth local

192
cooperatives had annual sales of less than 1. 6 million dollars.
These data also show that only 7. 5 percent of the acquiring locals
had annual sales greater than 6. 4million dollars.
Also, 92. 4 percent of the regional cooperatives that were
absorbed had annual sales of less than 10 million dollars between
1956 and 1964. Only . 05 percent of the acquired regional coopera-
tives had annual sales greater than 70 million dollars over the
same time period. The size distribution of acquiring regional
cooperatives in 1964,, after merger, were somewhat more evenly
distributed in sales than local cooperatives. About 52 percent of
the acquiring regionals had annual sales less than 10 million
dollars. However, 19. 2 percent of these regionals had annual sales
greater than 80 million dollars. Thus, most of the acquired and
acquiring cooperatives are small and most of the cooperative merger
activity is occurring in industries, particularly dairy and purchasing
as sociations, where significant oligopoli stic elements exist. This
oligopolistic market structure has been caused primarily by other
types of business organizations.

Objectives and Operating Results ofCooperative Mergers
Economic theory suggests that merger is one method of in-
creasing the size of the firm. Therefore, one would expect average
costs per unit of output to fall or remain relatively constant as out-
put increases if diseconomies of scale are not encountered. Also,
one would expect the profitability of the combined operations to be
larger than the sum of the profits or savings of each association
before merger.
A 10 percent sample of all those cooperatives merging between
1956 and 1960 showed the major motivations of merger and growth
to be (a) economies of size, (b) improved services to member
patrons, (c) barriers to entry, (d) increased market and bargaining
power, (e) product diversification, (f) a source of supply, and (g)
acquired facilities.
Empirical results show that actual operating results deviated
considerably from some of the pre-merger objectives. Cost data
taken from accounting records showed that average variable costs
decreased in 20 percent of the acquiring associations two years
after merger and only 40 percent of the merging associations
achieved any reduction in average variable costs by 1965-1966,
193

194
normally 5 to 12 years subsequent to the combination. Although the
acquiring associations did not generally reduce their per unit
variable costs after merger, 5 of the 6 acquired associations
gained extensively from the lower costs of operation from the
larger acquiring associations.
Some savings are possible from spreading general overhead
over a larger volume of output for some cost categories, but
these reductions are generally offset by rising costs in other fixed
cost categories. Forty percent of the acquiring cooperatives re-
duced their fixed costs two years after merger, and only 30 percent
by their latest fiscal year. Conversely, all acquired cooperatives
were able to reduce their average fixed costs subsequent to merger.
Total average costs were reduced in 50 percent of the acquiring
cooperatives two years subsequent to merger and in only 40 percent
by l965-l966. Consequently, the data generally support the con-
clusion that these sample absorbing cooperatives did not achieve
significant economies of size through merger. Nevertheless, the
smaller acquired associations gained aubstantial economies in
size in all cases. This tenet is consistent with Stiglerts hypothesis
that the long run average cost curve of a firm is relatively flat
after a rather small volume of output is reached.
195
Reasons for the failure of cooperatives to achieve economies
of size ae external as well as internal to the firm. External
factors are (a) changes in comparative advantage, (b) aggressive
competition from other associations, (c) inefficient branch opera-
tions maintained after merger, and (d) institutional factors.
Changes in comparative advantage for farm land forced many
merging association's output to fall subsequent to merger. Since
many local associations are organized on a commodity basis,
little flexibility exists in changing enterprises. When local member-
ships decrease, associations are confronted with obtaining, addi-
tional volume outside their membership, with merging, or with
liquidation.
The second reason acquiring cooperatives failed to achieve
economies of size is the increased competition from other coopera-
tives. Mergers tend to disrupt normal business relationships.
Competitors attempt to raid the acquired cooperative's disgruntled
membership, cut product prices or increase the prices paid to
farmers, and increase advertising in the short run.
Many facilities acquired in a merger have little productive
value to the operations of the surviving cooperative. Thus,
liquidating this real property at a loss or depreciating the equipment
and buildings over their useful life increases the costs of operation.

196
Some cooperatives acquired small associations to increase plant
capacity without considering the costs involved in acquiring
additional volume.
Also, some as sociations, especially purchasing cooperatives,
continued to operate small inefficient acquired branch offices.
It could possibl be more efficient to service members in outlying
areas from a central plant. This phenomenon could be associated
with the fact that some managers are paid on their yearly volume
of business and they are not interested in losing members to
neighboring associations because of locational advantages.
Institutional factors also increased the costs of operation which
may not be associated with the merger. These are additional taxes
and various assessments from marketing orders and regional
market and supply or other parent associations. For example,
the bargaining association in the sample paid permit fees of 1.4
cents per hundredweight of milk. Later, these fees were trans-
ferred to processors rather than paid by handlers.
Internal factors increasing costs subsequent to merger are
(a) inadequate management, (b) adjusting labor services to the
needs of the combined organization, and (c) improved services to
farmer members. Smaller associations have problems in securing
capable management. The smallest cooperative in the sample used

197
the services of five managers between 1956 and 1965. Management
problems disrupted the operation of this association which resulted
in the loss of the majority of their membership. Inadequate man-
agement is complementary to the problem of integrating the two
merging partners into a unified organization. If the acquired
management remains with the reorganized association, the usual
case is that the associations are operated as separate entities. Too
often, the integration process is delayed and as a result labor costs
increase.
Increased member services may be a legitimate reason for
increasing the cost structure if it also increases the profitability
of the association either directly through increased savings or
indirectly through better membership relations. Increasing the
product line in an inefficient size association is usually of negligible
value to members of the acquiring association.
Those surviving cooperatives that were generally successful
in achieving economies of size can be characterized as follows:
( ) maintained the acquired association's sales or volume of output
after merger, (b) sold the acquired cooperative's plant and real
estate or did not acquire these items, (c) made additional mergers,
(d) had capable management, (e) had differentiated products or
extremely good rapport with members, and (f) integrated the two

198
associations completely under the larger association's manage-
ment.
Cooperatives that merged to increase market or bargaining
power did not achieve their objectives because of technological
changes in the industries and the structure of the market.
Although the ex ante_objectives of economies of size and market
and bargaining power were not achieved, other objectives such as
barriers to entry, product diversification, increased member
services, a source of supply, and facilities were generally
achieved. It is possible that the achievement of these other ob
jectives offset any possible gains from increased economiqs of
size.
Because of the external and internal factors affecting costs
and external influences suchas government programs' influence
on storage incomes in grain cooperatives, the ratio of savings to
net sales (a measure of the rate of return) fell after merger.
Forty percent of the acquiring cooperatives increased their
rate of return two years after unification, but only 30 percent
increased their rate of return by their latest fiscal year. On
the other hand, 7 of the S acquired cooperatives increased their
rate of return via merger. Wallace (73, p. 165) also has found

199
that the expectations of increased profitability of acquiring firms
has not been fulfilled. He concludes that either operating revenues
have not increased sufficiently relative to operating costs or
operating costs have not decreased sufficiently relative to operating
revenues.
Timing of Cooperative Mergers
Because of the large gains attributed to acquired rather than
the acquiring cooperatives via merger, it is possible that the
timing of mergers could be associated with acquired cooperatives
rather than any possible benefits accruing to the acquiring coopera-
tive. However, it is realized that marriages are usually performed
with the consent of both partners.
The primary motivations for merger of acquired cooperatives
were (a) to achieve economies of size, and (b) to overcome finan-
cial problems. As preiously noted, these motivations were ful-
filled. In fact, in 9 out of the 10 mergers studied, the acquired
cooperative instigated merger negotiations. To test this hypothesis,
regression analysis was used. The number of cooperative mergers
was regressedagainst stock prices (a measure of business expecta-
tions), the business failure rate (a measure of local business
conditions), farm income, farm output, and industrial production

200
between. 1929 and 1964 and 1947 and 1964. The only significant
variables in the equations in both time periods were stock prices
and farm.income. The results of this analysis indicate that
cooperative mergers are not correlated with the business failure
rate. Cooperative mergers, however, do appear to occur when
business expectations are excellent and when farm income is high,
despite the conclusions of Mueller (49) who thought that cooperative
mergers occurred during depressed periods in agriculture.
Growth Analysis
Mergers have increased the rate of growth of local cooperatives,
but not to the extent proposed by past observations. A comparison
of the average rate of growth of those local associations that grew
externally as opposed to those that grew strictly internally, between
1940 and 1964 showed that external growth cooperatives grew in sales
at an. average rate of 5. 6 percent per year compared with 3. 6 per-
cent for those cooperatives growing internally. Regional coopera-
tives using merger grew an average rate of 4. 6 percent per year
compared to 6. 6 percent for nonmerging regionals. Nonmerging
regional associations grew at a faster rate regardless of whether
they were of the centralized, federated, or mixed type of organiza-
tion. It is possible for internal regionals to actually use external

2oi
growth, however, through contractual arrangements that were not
considered in this study.
In addition, the analysis showed that between 1940 and 1964
federated regionals grew at a faster rate than centralized or mixed
regional organizations.
Between 1940 and 1964, mergers among all cooperatives
accounted for 8. 6 percent of the growth in sales of marketing
cooperatives and 1. 5 percent of the growth of purchasing coopera-
tives.
Of those local associations growing externally between 1940 and
1960, the direct effects of merger show that 32 percent of the
growth has been external if measured in sales and 61 percent if
measured in assets. External growth accounted for a considerable
amoimt of growth among fruit, livestock, vegetable, purchasing, and
dairy cooperatives.
Regional cooperatives that grew by merger grew an average of
12. 8 percent externally between 1940 and 1964 as measured by
sales, and 12. 0 percent as measured in assets. External growth
accounted for a significant amount of growth among fruit and
vegetable and dairy regional cooperatives. Sales data are more
complete than asset data so it can be generally concluded that
cooperatives, even though they have used merger to grow, have

202
used internal growth more extensively.
Markov chains showed that merging as well as nonmerging
cooperatives have a high propensity to grow. It was estimated
that local cooperatives will decrease slightly in numbers from
7, 418 in 1964 to 7, 238 in 1980, or 2. 4 percent. The general
tendency will be for a decrease in the number of smaller coopera-
tives, but a 350 percent increase inthe number of local coopera-
tives with annual sales of over 6. 4 million dollars by 1980.
Regional cooperatives also have a high propensity to grow.
It is estimated that the number of regional associations will
decrease from 660 in 1964 to 380 in 1980. Again, there will be
a large decrease in the number of regional cooperatives with
annlial sales of less than 20 million dollars and a substantial
increase in the number of larger associations. The general con-
clusion is that the vitality of cooperatives is substantial and if
they continue to grow as projected, they should expand their
influence in American agriculture.
Policy Implications
Two policy implications result from this research. The first
involves merger planning and the second involves national policy.
Merger benefits are not generated automatically from the

203
combination of two firms. Planning and evaluation are necessary
to achieve merger objectives. Wallace (73, p. 166-178) states
that merger principles differ little from good management prin-
ciples. His three basic principles are (a) development of specific,
realizable operating objectives before the acquisition is consum-
mated, (b) development of a positive program for achieving
operating benefits through controls and integrating common func-
tions, and (c) provision of necessary leadership, creation of
atmosphere for change, and the readiness to give an acquisition
the time it needs.
Generally, cooperatives do not plan their mergers. Only the
largest cooperative in the sample made an economic study of the
benefits and costs of acquisition. Another indication of the lack
of planning is that the merger negotiation period lasted an average
of 9. 1 months compared to industrial mergers which take one to
two years. An improvement in the evaluation of specific mergers
could possibly either increase the benefit from mergers or increase
the liquidation rate of smaller cooperatives having financial diffi-
culties. In either case, agricultural producers will benefit
substantially.
Because both the acquired and acquiring cooperatives are
generally small by any measure of firm size and most cooperative

204
mergers are occurring in industries that are oligopolistic in nature,
there appears to be little need for antitrust legislation against the
majority of merging cooperatives in order to assure competitive
markets. It is possible that isolated cooperative mergers may
form monopolies in the relevant market. Some specialized agri-
cultural commodities are already highly concentrated (78, p. 98)
and prices of widely grown commodities in an area could never be
increased above the cost of transporting the commodity into the
market from other producing areas. If voluntary membership
policies are required, the supply response of growers and the
high cross elasticities among agricultural commodities will tend
to neutralize any local monopoly power. In fact, by encouraging
cooperative mergers that result in increased efficiency, coopera-
tives may provide a potential source of countervailing power in
the highly concentra.ted agricultural supply industry and possibly
increase competition in some oligopoli stic product markets.
Future Research on Mer:ers
Since external growth is only an alternative to internal growth,
it seems that future research should concentrate on the integration
of merger theory and the theory of the growth of the firm.
Penrose (55, p. 154) finds that the rudimentary biological

205
theories of firm growth such as Marshall' s "life cycle theory, "
Aichain's "viability analysis," and Boulding's "homeostasis
theory" break down when applied to merger. Marshall's life cycle
theory makes no provision for abrupt discontinuities and changed
identity in individual, development; while the ecological analogies
do not explain the sudden and unpredictable changes in the nature
of individual organisms and the consequent changes in their rela-
tion to their entire environment.
The limit to the size of firm in Penrose's "continuous growth
theory" is not diseconomies of scale as posited by traditional
neoclassical theory for there always exists economies of growth
and economies of size. Thus, Penrose contends the limiting
factor to the rate of growth of the firm is the limited capacity
of management. Hpwever, when merger is considered an alter-
native to internal growth additional restraints must be reached
because most merging firms do not grow at unlimited rates.
But even when merger is considered, managerial talents of
absorbers are burdened with planning, integration and coordination
problems. Also, at a given time only a certain number of suitable
firms are available for acquisition. Marris (44, p. 124) suggests
that the administrative restraint on the growth rate explains why
external growth is so attractive. Perhaps this hypothesis could be

206
tested as well as the determinants of the optimal rate of growth
using Baumolts approach (4) of studying the discounted costs and
net returns of growth of merging and nonmerging firms over time.
An indication of possible administrative restraints to growth
by merger is that all cooperatives, whether they were locals or
regional associations, were growing more rapidly internally
before merger than they did through external and internal growth
subsequent to merger.

BIBLIOGRAPHY
Adelman, I. G. A stochastic analysis of the size distributionof firms. Journal of the American Statistical Association53:894. 1958.
American Milk Review. New York, Urner-Barry, Monthly.Vol. 18, no. 1 - Vol. 26, no. 12. January 1956 -December 1964.
Bain, Joe S. Economies of scale, concentration, and thecondition of entry. American Economic Review 46:15-39.1954.
Baumol, William. The theory of expansion of the firm. TheAmerican Economic Review 52:1078-1087. 1962.
Butters, Keith 3., John Lintner and WilliamL. Cary.Effects of taxation on corporate mergers. Cambridge,Riverside, 1951. 356 p.
California Crop and Livestock Reporting Service. Californiafruit and nut acreage, bearing and non-bearing acreage,principal crops by counties. Sacramento, 1949-1964.(In cooperation with the U. S. Dept. of Agriculture, Statis-tical Reporting Service).
Campbell, John D. Cost of ginning cotton by cooperative atsingle-gin and two-gin plants, California and Texas, 1962.Washington, D. C., 1964. 31 p. (U. S. Dept. of Agri-culture. Farmer Cooperative Service. Marketing Re-search Report no. 640).
Cochrane, William G. Sampling techniques. Zd ed. New York,Wiley, 1965. 330 p.
Cochrane, W. W. and R. H. Elsworth. Farmer's Coopera-tive discontinuances 1875-1939. Washington, D. C., 1943.38 p. ( U. S. Dept. of Agriculture. Farm Credit Admin-istration. Miscellaneous Report no. 65).
Committee on Price Determination for the Conference onPrice Research. Cost behavior and price policy. NewYork, National Bureau of Economic Research, 1943.356 p.
207

Conant, Luther, Jr. Industrial consolidations in the UnitedStates. American Statistical Association, Publications7:207-226. 1901.
Cooperative Digest. Ithaca, Roy H. Park, Monthly. Vol. 16,no. 7 - Vol. 25, no. 6. January 1956-December 1964.
F3.. Dahl, Reynold P. Grain markets, marketing, and farmpolicy. Paper presented at the Conference on Implicationsof Changes on Farm Management and Marketing Research,sponsored by the Iowa State University Center for Agricul-tural and Economic Development and the Farm Foundation,April 24, 25, and 26, 1967.
Dairy Record. St. Paul, Dairy Record, Weekly. Vol. 56,no. 32 - Vol. 65, no. 30. January 1956 December 1964.
DeLoach, D. B. Growth of farmer cooperatives: Obstaclesand opportunities. Journal of Farm Economics 46:489.1962.
Dewing, A. S. The financial policy of corporations. Vol. 11.4th ed. New York, Ronald, 1941. 1550 p.
Dewing, A. S. A statistical test of the success of consolida-tions. Quarterly Journal of Economics 36:86-101. 1921.
Easton, E. E. and Byron L. Newton. Accounting and theanalysis of financial data. New York, McGraw-Hill,1958. 449 p.
Erlewine, Keith R. and Richard G. Walsh. Changes inmarket structure and costs of farm supply retailing.Lincoln, 1962. 35 p. (Nebraska. Agricultural EconomicsReport no. 28).
Farris, Paul L. The grain procurement industry. Marketstructure of the agricultural industries. Ames, IowaState University, 1966. 250 p.
Farris, Paul L. and Daniel I, Padberg, Measures of marketstructure change on the Florida fresh citrus packing indus-try. Agricultural Economics Research, 1964, p. 96.
208

Fletcher, L D. Market organization of grain industries inthe North Central Region. Columbia, l967 21 p(Missouri. Agricultural Experiment Station. ResearchBulletin 847)
Frederick, Justus George. Modern industrial consolidation.New York. Frank-Maurice, 1926. 397 p.
French, B. C. The food marketing commission and market-ing efficiency. Journal of Farm Economics 49:433. 1967.
French, B. C. , L. L. Sammet and R, G. Bressler. Econo-mic efficiency in plant operations with special referenceto the marketing of California pears. Hilgardia 24:579.1956.
George, M. V. The causes of dairy mergers and their im-pact on the structure of the dairy industry. Ph. D. thesis.Madison, University of Wisconsin, 1961. 190 numb.leaves. (microfilm)
Gray, Roger N. Futures trading seminar: Fundamentalprice behavior characteristics in commodity futures.Madison, Mimir, 1966. 258 p.
Hammond, Jerome W. and Hugh L. Cook. Wisconsin dairyfirm mergers: Extent, causes and results. Madison, 1964.48 p. (Wisconsin. Agricultural Experiment Station.Research Bulletin 249)
Hansen, Alvin H. A guide to Keynes. New York, McGraw-Hill, 1953, 237 p.
Heckman, John H. Cooperatives in world trade. U. S.Dept. of Agriculture, Yearbook, 1964. p. 346-357.
Homan, Paul T. Trusts: Early development. Encylopediaof the Social Sciences 15:114. 1935.
Jones, Eliot. The trust problem in the United States. NewYork, Macmillan, 1923. 598 p.
209

Judge, G. G. and E. R. Swanson. Markov chains: Basicconcepts and suggested uses in agricultural economics.Urbana, 1961. 17 p. (Illinois. Agricultural ExperimentStation. Research Report AERR no. 49)
Kaplan, A. D. H. The current merger movement analyzed.Harvard Business Review 33:91. 1955.
Kemeny, 3. G. etal. Finite mathematical structures.Englewood Cliffs, N. J. , Prentice-Hall, 1959. 487 p.
Kemeny, J. G. , et al. Finite mathematics with businessapplications. g1ewood Cliffs, N. J., Prentice-Hall,1962. 482 p.
Kemp, Bernard A. The merger component in the growth ofa firm. Ph. D. thesis. Nashville, Vanderbilt University,1957. 249 numb, leaves. (microfilm).
Knapp, Joseph G. The scope of farmer cooperatives:Present and future. Journal of Farm Economics 46:477.1962.
Ladd, George W. Agricultural bargaining power. Ames,Iowa State University, 1964. 163 p.
Li, Jerome C. R. Statistical inference I Ann ArborsEdwards, 1964. /658 p.
Livermore, Shaw. The success of industrial mergers.Quarterly Journal of Economics 10:68 -96. 1935.
Manuel, MiltonL. andRichard L. Epard. An economicanalysis and recommendations for improving the manage-ment of Kansas grain cooperatives. Manhattan, 1967. 29 p.(Kansas. Agricultural Experiment Station. Bulletin 497)
Markham, Jesse W. Survey of the evidence and findings onmergers. In: Business concentration and price policy.Princeton, Princeton University, 1955. p. 14-182.(National Bureau of Economic Research. Special Confer-ence Series 5)
210

211.
Marris, Robin. The economic theory of managerial capi-talism. New York, The Free Press of Glencoe, 1964. 346p.
Mead, Edward S. Corporation finance. New York, D.Appleton, 1930. 480 p.
Meyer, JohnR. and Edwin Kuh. The investment decision.Cambridge, Harvard University, 1959. 2.84 p.
The Milk Dealer. Milwaukee, Olsen, Monthly. Vol. 45,no. 4 - Vol. 54, no. 3. January 1956 - December 1964.
Moody, John. The truth about the trusts. New York, Moody,1904', 487 p.
Mueller, Willard F. The role of mergers in the growth ofagricultural cooperatives. Berkeley, 1961. 66 p.(California. Agricultural Experiment Station. Bulletin777)
Mueller, Willard F. he scope of the current mergermovementi In: Economic Concentration Hearings beforethe Subcommittee on Antitrust an& Monopoly of the Com-mittee on the Judiciary, United States Senate 89th Congress,1st session, on S. Res., 40, Mar 16-Apr 21, 1965. Part 2.1965. p. 501-537.
Mueller, Willard F. and Leon Garoian. Changes in the marketstructure of grocery retailing. Madison, University ofWisconsin, 1961. 215 p.
National Industrial Conference Board. Mergers in industry.New York, 1929. 205 p.
Nelson, Ralph L. Merger movement in American industry1895 - 1965. New York, 1959. 177 p. (National Bureauof Economic Research. General Series no. 66)
News For Farmer Cooperatives. Washington, D. C., U. S.Farmer Cooperative Service, Monthly. Vol. 22, no. 10 -Vol. 30, no. 12, January 1956 - December 1964.

Penrose, Edith T. The theory of the growth of the firm.New York, Wiley, 1959. 272 p.
Reid., Samuel R. etal. Growing from within may pay offfaster. Business Week, Sept. 17, 1966, p. 44-46.
Roy, E. P. Cooperatives: Today and tomorrow. Danville,Illinois, Interstate, 1964. 590 p.
Schoeder, Gertrude G. The growth of major steel companies,1900-1950. Baltimore, Johns Hopkin University, 1952.224 p. (Studies in Historical and Political Science, ser. 70,no. 2)
59, Seager, H. R. and C. A. Gulick, Jr. Trust and corpora-tion problems. New York, Harper, 1929. 719 p.
Snedecor, George W. Statistical methods applied to experi-ments in. agriculture and biology. 5th ed. Ames, IowaState University, 1937. 534 p.
Stigler, George J. The division of labor is limited by theextent of the market. Journal of Political Economy59:183-193. 1951.
Stigler, George J. The economies of scale. Journal of Lawand Economics 1:54-71. 1958.
Stigler, George 3. Monopoly and oligopoly by merger.American Economic Review 40 (2):23-34. 1950.
Swanson, Bruce L. Statistics of farmer cooperatives,1963-1964. Washington, D. C., 1966. 24p. (U. S.Dept. of Agriculture. Farmer Cooperative Service.General Report 134)
Thorp, Willard L. The persistence of the merger movement.American Economic Review 21 (sup. 1): 77-89. 1931.
Tinley, 3. M. and G. W. Parks. Consolidation of citruspacking houses in the Ontario-Cucamonga area. Berkeley,1963. 112 p. (California. Agricultural ExperimentStation. Mimeographed Report no. 154)
21.2

213
Toulmin, H. A., Jr. Millions in mergers. New York, B. C.Forbes, 1929, 323 p.
U. S. Federal Trade Commission. The merger movement.Washington, D. C., 1948. 134 p.
U. S. Federal Trade Commission. Report on corporateácquisitions and mergers. Washington, IJ. C., 1955.210 p.
U. S. Industrial Commission. Control of product. In:Industrial Commission reports. Vol. 13. Washington,D.. C., 1901. p. xvii-.xviii.. (57th Congress, 1stsession, House document 182)
U. S. Statistical Reporting Service. Fluid Milk and CreamReport. Washington, D. C., Monthly. 1957, 1960, and1966, 17 p.
Von Halle, Ernest. Trusts or industrial combinations in theUnited States. New York, Macmillan, 1900. 350 p.
Wallace, Forest D. Some principles of acquisition. tn:The corporate merger, ed. by William W. Alberts andJoel E. Segall. Chicago, University of Chicago, 1966.287 p.
Watkins, Myron W. Industrial combinations and publicpolicy. Cambridge, Riverside, 1927. 331 p.
Weston, Fred J. The role of merger in the growth of largefirms, Berkeley, University of California, 1953. 159 p.
Wholesale Prices and Price Indexes. U. S. Bureau of LaborStatistics. Annually 1940-64. Washington, D. C.
Wisconsin. Governor's Dairy Committee. Improving theefficiency of dairy cooperatives in Wisconsin. Part II.Madison, University of Wisconsin, 1960. 46 p.
Youde, James G. Cooperative enterprise in alternativemarket structures. Ph. D. Thesis. Madison, Universityof Wisconsin, 1966. 277 p.

APPENDICES

214
APPENDIX A
This appendix contains the unadjusted total costs of opera-
tion of the 10 sample cooperatives one year prior to merger,
two years subsequent to merger and for their latest fiscal
year.as well as other statistical data used in this study.

Cooperative Cooperative CooperativeA1 AB2 AB9543 1957 1965
(dollars) (dollars) (dollars)
Variable costs -
'Acquiring cooperative's total costs one year before merger.ZCombined total costs of the cooperatives two years subsequent to
merger.3Accounting data for 1954 were not available for the acuired coop-
erative.
21.5
Appendix Table 1. Cooperative 1. Total costs prior and subse-quent to merger, 1954, 1957, and 1965
Fixed costs -
Truck expense 4 1, 692 4, 388Salesmen's salaries 5, 635 27, 995 32, 960
Total variable costs 5, 639 29, 687 37, 348
Manager's salary 5,384 5,583 7,890Office salaries 5,876 11,756 9,338Depreciation 1,249 9,964 17,825Fertilizer expense 66 222General taxes 651 2, 330 3, 539Insurance 246 1,208 2,527Repairs and maintenance 108 3,462 5, 669Office supplies 1,441 1, 391 1,470Advertising and promotion 554 2, 80 2, 868Telephone 452 1, 204 2, 098Payroll taxes 317 1,565 1, 622Travel expense 770 2,791 1,665Professional fees 637 1, 152 1,536Utilities 537 275 1,277Rent. 1,228 1,817Small tool expense 346Miscellaneous 467 3, 645 5, 365
Total fixed costs 18, 755 50, 596 66, 852
Total operating costs 24,394 80,283 104,200

Appendix Table 2.
Variable costs -
Cooperative IL. Totalpacking costs prior and subsequent to merger , 1955,1958, and 1965
Cooperative1A
1955(dollars)
Cooperative2B
1955(dollars)
Cooperative3AB
l9 58(dollars)
CooperativeAB1965
(dollars)
Packing materials and suppliesPacking house laborUtilities
50, 29035,0111,602
65, 27339, 0562,286
59, 23333, 389
2, 327
65, 79561, 1384, 084
Machinery expense 2, 246Contract packing fee 2, 398Administrative fee 574 3, 166 2, 672 2, 282
Total variable costs 92, 121 109, 781 97, 621 133, 299
Fixed costs -Repairs 1,078 757 9, 788Office expense 840 941 536 1,257Rent 1,482 225Administrative salaries 10, 870 11,017 16, 440 23, 753Taxes 4, 202 6, 563 7, 627 7, 545Telephone 361 1, 192 1, 150 1,726Auto expense 1, 912 1,606 2, 155 360General expense 3, 087 2, 276 3, 637 2, 672Insurance 4,517 4, 791 4, 179 9, 401
continued

Appendix Table 2. Cooperative IL. TotaLpacking costs prior and subsequent to merger, 1955,1958, and 1965--continued
Cooperative1 Cooperative2 Cooperative3 CooperativeA B AB AB
1-Acquired cooperative's total costs one year before merger.2Acqui.ring cooperative's total costs one year before merger.3Combined total costs of the cooperative two years subsequent to merger.
1955 1955 1958 1965(dollars) (dollars) (dollars) (dollars)
Interest 632 75.0 507
Depreciation 3,612 6,315 11, 154 7, 266
e-coo1er --- 30 --- 2,976Totalfixedcosts 31,515 36,559 48,367 66,744
Total operating costs 123, 636 146, 340 145, 988 200, 043

CooperativeAl
CooperativeAB2
CooperativeAB
'Acquiring cooperative's total costs one year before merger.2Combined total costs of the cooperatives two years subsequent to
merger.3Accounting data for 1958 were not available for the acquired
cooperative.
1958 1961 1963
Variable costs -Packing materialsFruit treatingPacking house laborCommittee assessments
(dollars)
122,733ll,25l83, 8672, 557
(dollars)
101,6449,92B
8, 5002, 949
(dollars)
68,7877,453
76, 3562, 935
Total variable costs 220,408 201,081 155,531
Fixed costs -Salaries 12,785 15,877 15,956Maintenance and repairs 2,557 1,436 817Utilities 3,068 4,116 3,326Insurance (property) 3, 068 2, 482 2, 225Other insurance 6, 137 6,579 7, 699Payroll taxes 7, 159 8,938 8,683General taxes 3,580 4,543 3,851Office supplies 2,557 2,695 2, 156Admi.ni strative expense 2, 046 1,063 956Telephone 1, 023 1,, 001 916Miscellaneous 4, 091 5, 150 2, 79BInter e st - - 895Depreciation 7,j59 8,030 1,877
Total fixed costs 55, 230 64, 805 51, 298
Total operatin costs 275, 638 263., 886 206, 829
218
Appendix Table 3. Cooperative III. Total packing costs priorand subsequent to merger, 1958, 1961, and
1963

Appendix Table 4. Cooperative IV. Total cost of manufacturing milk prior and subsequent tomerger, 1956, 1958, and 1965
Cooperative1A
1956
Cooperative2B1956
CooperativeAB
1958
CooperativeAB1965
continued
Butter Butter Butter Powder Butter Powder
Variable costs -
(dollars) (dollars) (dollars) (dollars) (dollars) (dollars)
Factory labor 10, 101 42, 826 49, 598 26, 707 56, 930 46, 580Materials and supplies 4, 997 27, 224 22,414 11,546 20, 641 25, 217Utilities 2, 753 6, 790 5,019 28,440 6,104 34, 589Miscellaneous mfg. expense 98Payroll taxes 326 1, 953 2,210 1,139 3, 692 3, 020Freight expense 380 1, 183 369 28,424 69 11,267Marketing fees 64 1,544 11,203 5,771 8, 228 10, 057
Total variable costs 19, 298 81, 520 90,813 102,027 95, 664 130, 730
Fixed costs -Advertising 587 569 246Maintenance and repairs 320 9, 345 4, 920 4, 541 3, 042 4, 563Depreciation 2, 007 4, 330 9, 994 5, 148 9, 556 14, 335General taxes 105 2, 861 1,536 792 935 312Salaries 1, 158 16, 267 7, 188 7, 188 6, 363 6, 363Office supplies 151 1, 51 1 829 829 223 223Telephone 88 627 567 567 496 496Professional fees 295 1, 366 363 363 318 318
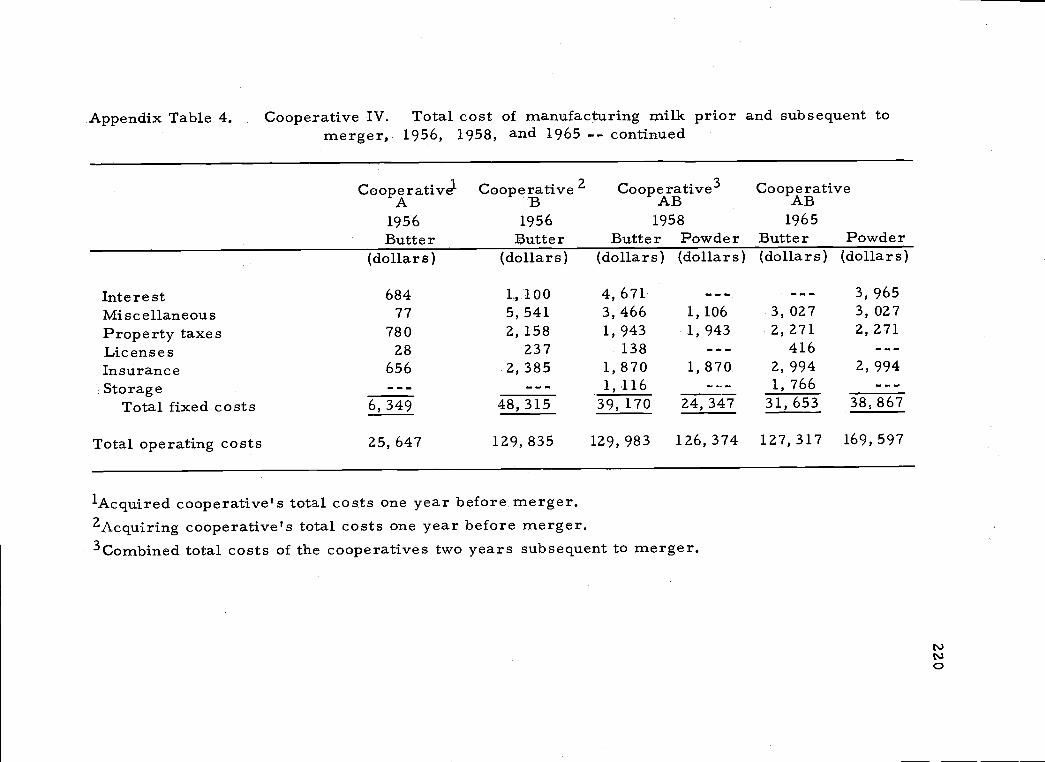
1Acquired cooperative's total costs one year before merger.2Acquiring cooperative's total costs one year before merger.3Combined total costs of the cooperatives two years subsequent to merger.
Cooperative'A
1956Butter
Cooperative 2
1956Butter
Cooperative3AB
1958Butter Powder
CooperativeAB
1965Butter Powder
(dollars) (dollars) (dollars) (dollars) (dollars) (dollars)
Interest 684 1., 100 4, 671 3, 965Miscellaneous 77 5, 541 3,466 1,106 3,027 3,027Property taxes 780 2, 158 1,943 1,943 2,271 2,271Licenses 28 237 138 416Insurance 656 2, 385 1,870 1,870 2,994 2,994Storage 1,116 1,766
Total fixed costs 6, 349 48, 315 39, 170 24, 347 31, 653 38, 867
Total operating costs 25, 647 129, 835 129,983 126,374 127,317 169,597
Appendix Table 4. Cooperative IV. Total cost of manufacturing milk prior and subsequent tomerger, 1956, 1958, and 1965 -- continued

Appendix Table E . Cooperative V. Total costs prior and subsequent to merger, 1956, 1958,and 1965
Cooperative Cooperative Cooperative Cooperative Cooperative CooperativeA'
1956B21956
A31958
AB41958
A1965
AB1965
Variable costs -Truck expense
(dollars)
918
(dollars (dollars)
1,254
(dollars) (dollars)
814
(dollars)
Salaries 11,471 79, 984 8, 567 108, 834 1 0, 943 195, 578Utilities 761 4, 180 316 6, 496 425 13, 461Plant supplies 741 3, 380 421 6, 662 689 7,712Repairs 706 3, 940 306 4, 402 663 15, 692
Total variable costs 14, 597 91, 484 10, 864 126, 394 13, 534 232, 443
Fiked costs -Rent 3, 271 3, 057 300 1, 800Office supplies 371 1, 889 62 3, 245 327 6, 242Telephone 304 1, 153 281 2,215 137 2, 999General taxes 738 10, 501 464 11,483 1, 186 32, 837Licenses 17 686 129 1, 702 3, 745Insurance 445 8,615 132 9, 780 555 12, 909Interest 63 988 12, 772 1,243 41, 992Auditing 300 477 555 838Legal expense 92 180 69Travel 131 1, 598 3, 148 3, 381Advertising 613 7, 008 83 11,096 485 13,684
continued
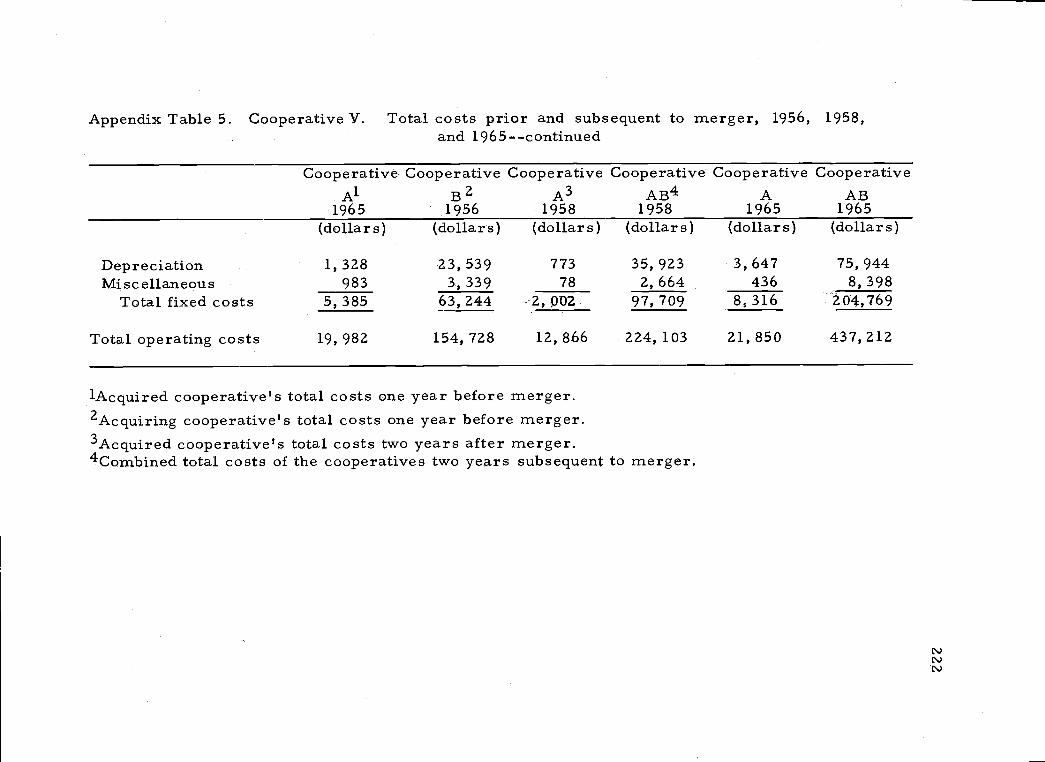
Appendix Table 5. Cooperative V. Total costs prior and subsequent to merger, 1956, 1958,and 1965--continued
lAcquired cooperative's total costs one year before merger.2Acquiring cooperative's total costs one year before merger.3Acquired cooperative's total costs two years after merger.4Combined total costs of the cooperatives two years subsequent to merger.
1965 1956 1958 1958 1965 1965(dollars) (dollars) (dollars) (dollars) (dollars) (dollars)
Depreciation 1,328 23, 539 773 35, 923 3,647 75,944Miscellaneous 983 3, 339 78 2, 664 436 8, 398
Total fixed costs 5, 385 63,244 97,709 8,316 Z04,769
Total operating costs 19, 982 154, 728 12, 866 224, 103 21,850 437,212
Cooperative Cooperative Cooperative Cooperative Cooperative CooperativeB2 A3 AB4 A AB

Appendix Table &. Cooperative VI. Total costs of manufacturing milk prior and subsequent tomerger, 1958, 1961, and 1965
Cooperative1 CooperativeA AB
.3Cooperative2B
CooperativeAB
continued
1958 19651958Butter Powder Butter PowderButter Butter Powder
1961
Variable costs.-BrokerageMiscellaneous manu-
(dollars) (dollars) (dollars) (dollars) (dollars) (dollars)(dollars)
1, 897
facturin,g 11,526 182 12, 607 875 27,548Factory labor 18, 934 46, 712 58, 820 64, 434 80, 259 82, 587 105, 463Utilities 8, 359 22, 872 67, 940 26, 026 76, 483 29, 212 82, 059Packages 8, 880 21, 338 25, 649 31, 065 25, 327 33, 143 13, 109Creamery supplies 9, 569 7, 527 21, 460 13, 479 30, 107 12, 525 34, 403Salt 331 2, 015 2, 630 2, 959Repairs 2, 595 5, 783 17, 199 10, 523 23, 542 14,892 28,908
Total variable costs 48, 668 106; 247 204, 491 148, 334 248, 325 176,193 291,490
Fixed costs-Salaries 3,600 7,459 10,400 6,063 10,289 8,562 14,529Office supplies 419 815 815 1,492 1,498 1,227 1,227Telephone 175 294 294 520 716 678 658Insurance 1, 173 2,401 2, 401 10, 026 1.2,. 177 14, 021 14, 151Advertising 799 362 834 1,912 1,149 3,944 3,829Professional fees 727 1,138 1,138 2,388 4,885 1,804 3,500

Appendix Table 6. Cooperative VI. Total costs of manufacturing milk prior and subsequent tomerger, 1958, 1961, and 1965--continued
i-Acquired cooperative one year before merger2Acquiring cooperative one year before merger.3Combined total costs of the cooperatives two years subsequent to merger.
Butter Butter Powder Butter Powder Butter Powder(dollars) (dollars) (dollars) (dollars) (dollars) (dollars) (dollars)
General taxes 2, 962 7,448 7,629 12,427 13,088 16,093 17,137Miscellaneous 700 3,383 10,422 7,133 12,602 12,095 25,405Depreciation 9, 786 6,942 39,153 15,449 57,474 17,149 90,704Interest 1, 131 4,12.5 --- .l6,,992 --- 12,567
Total fixed costs 21,, 1.92 30,242 77,211 57,410 130,870 75,573 183,707
Total operating costs 70, 140 136,489 281,702 205,744 379,195 251,766 475,197
Cooperative1 Cooperative 2 Cooperative CooperativeA B AB AB
1958 1958 1961 1965

Appendix Table 7. Cooperative VII. Total costs prior and subsequent to merger, 1956, 1959and 1965
Cooperative1 Cooperative3 Cooperative Cooperative Cooperativ CooperativeA A A B B B
1956 1959 1965 1956 1959 1965(dollars) (dollars) (dollars) (dollars) (dollars) (dollars)
Fixed costs -
continued
Advertising 1,637 5,303 4,269 5,059 7,933 7,541Depreciation 485 1,524 1,729 11,061 16,327 20,879Directors' fees 1, 009 --- 1, 160 1, 685Utilities 1, 794 2, 073Insurance 1,865 3,739 6,237 6,301 9,325 16,056Interest --- --- --- 2,859 7, 134 4,819Professional fees 282 299 2, 423 3, 831 7, 825Office supplies 5, 660 7,497 9, 584 2,882 5, 305 10, 567General taxes 1, 123 2,308 4,619 20, 471 26, 277 41, 661Travel expenses 5,472 7, 161 15, 038 7, 791 12, 007 22, 353Telephone --- --- --- 3, 041 4, 513 8, 963Miscellaneous costs 4, 112 1,347 12, 659 16, 199 7, 780 8, 388
Variable costs -Telephone 14,466 22,139 27,545 --Brokerage paid 39, 597 1, 616Salaries 37, 672 79, 784 81, 789 75, 327 110, 553 201, 531Total variable costs 91, 735 103, 539 109, 334 75, 327 110, 553 201, 531

Appendix Table 7. Cooperative VII. Total costs priorand subsequent to merger, 1956, 1959and 1965 --continued
Cooperative1 Cooperative3 Cooperative Cooperativ Cooperative4 CooperativeA A A B B
'Acquired cooperative's total costs one year before merger.2Acquiring cooperative's total costs one year before merger.3Acquired cooperative's total costs two years after merger4Acquiring cooperative's total costs two years after merger.
1956 1959 1965 1956 1959 1965(dollars) (dollars) (dollars) (dollars) (dollars) (dollars)
Rent 1,320
Total fixedcosts 22, 965 29, 178 54, 135 81, 041 104, 190 149, 052
Total operating costs 114, 700 132, 717 163, 469 156, 368 214, 743 350, 583

Appendix Table8 Cooperative VIII. Total costs as a percent of sales prior and subsequentto merger, 1956, 1959, and 1965
continued
1956 1956 1959 1965
Variable costs -
(dollars) (dollars) (dollars) (dollars)
Truck expense 1, 561 718 6, 037 9,039Salaries 24, 497 109, 427 203, 307 411,407
Total variable costs 26, 061 110, 145 209,344 420,446
Fixed costs -Advertising 4, 036 4, 195 8, 588 19, 355Utilities 892. 2,941 4,821 13,551Rent 3, 300 - - - 8, 000 894Insurance 844 4,870 9,442 13,451General taxes 2,995 25,405 36,898 75,612Depreciation 1, 502 15,738 17,847 33,657Directors 1, 333 6, 180 6, 983 24, 321Travel 8, 144 10,118 10,437 46,997Telephone 2, 677 4,897 23,819 17,719Office expense 1, 065 6,719 10,974 73,347Freight 610Miscellaneous 4,410 16,973 14,926 63,818Repairs and maintenance 452 2, 131 2,701
Cooperative' Cooperative2 Cooperative3 CooperativeA B AB AB

Appendix Table 8. Cooperative VIII. Total costs as a percent of sales prior and subsequent tomerger, 1956, 1959, and 1965--continued
l Acquired cooperative's total costs one year before merger.2 Acquiring cooperative's total costs one year before merger.3 Combined total cost of the cooperative's two years subsequent to merger.
Transport operation is a separate operation. This operation is handled separately to make costscomparable for the acquired and acquiring associations.
Cooperative'A
1956
Cooperative 2
B1956
CooperativeAB
1959
CooperativeAB1965
Professional feesInterest
Total fixed costs
Total operating costs
Transport operation4
Total costs
(dollars)
479
(dollars)
28, 508
(dollars)
10, 91424, 323
1,
(dollars)
20, 82734, 074
32, 739 128, 675 190, 673 437, 623
58, 800 238, 820 400, 017 858, 069
251, 824 283, 745 314, 162
58, 800 490, 644 683, 762 172, 231

Appendix Table 9. Cooperative IX. Total costs prior and subsequent to merger, 1957, 1960, and1966
Cooperative A1l957
Cooperative AB2 Cooperative AB1960 1966
Variable costs -(dollars) (dollars) (dollars)
Plant expenses 5, 953 5, 283Administrative salaries 42, 982 62, 592 113, 533Testers salaries 44, 060 42, 905 45, 164Fieldmen salaries 22, 439 38, 009 61, 466Tester expenses 1,417 1, 737 8, 513Fieldmen expenses 13, 621 12, 054 18, 422Permit fees 10, 290 50, 366
Total variable costs 134, 809 213, 616 252, 381
Fixed costs -Directorst expense 7, 226 7, 915 14, 887Utilities 1, 752 4, 157 5, 937Insurance 1,679 5,115 11,358Office supplies 18,120 21,085 22,811Telephone 2,954 9,409 14,267Rent 2, 100 7,459 5, 570General taxes 7, 062 10, 590 18, 595Professionalfees 4,960 6,921 11,847Educational 4,997 13,913 19,640Organization 1, 184 2, 880 5, 067Advertising 2, 377 1, 892 1, 382Interest 86,151 26,487 62,613
continued

Appendix Table 9. Cooperative IX. Total costs prior and subsequent to merger, 1957, 1960, and1966 --continued
Acquiring cooperative's total costs one year before merger.2 Combined total costs of the cooperative's two years subsequent to merger.3 Accounting data for 1957 were not available for the acquired cooperative.
1957 1960 L966(dollars) (dollars) (dollars)
Depreciation 7, 067 24, 763 25, 713MiscellaneousTravelRepairsTransport maintenance
Total fixed costs
9, 869 14,8,1,
3,
764523435368
19,10,
3,
184280
424157, 498 170, 676 252, 575
Total operating costs 292, 307 384, 292 504, 956
Cooperative A1 Cooperative AB2 Cooperative AB

Cooperative' 2Cooperative .3Cooperative Cooperative
continued
A1954
B1954
AB AB1956 1966
Variable costs -
(dollars) (dollars) (dollars) (dollars)
Salaries 333, 360 179, 958 552, 630 1, 131, 549Telephone 19, 722 59, 013 73, 335 119, 794Marketing expenses 17, 711 35, 077 53, 651 43, 204
Total varjable costs 370, 793 274, 048
Combined total variable costs 644, 841 679,616 1,294,547
Fixed costs -Professional fees 7,681 6,589 21,857 30,813Office expense 14, 627 17,643 30,319 68,965Travel 7, 477 13,461 17,840 25,935Insurance 34, 267 2, 294 35, 020 77 096General taxes 47, 210 6,455 56,197 153,192Utilities and rent 27, 186 12,516 49,632 786,313Interest 84, 465 13, 178 140, 057 451, 089Depreciation 113, 990 1, 065 129, 096 219, 828Miscellaneous 25, 759 11,518 31,335 171,298Advertising 4,880 6,320 2,346Miscellaneous elevator expense 1,302
Cooperative X . Total costs prior and subsequent to merger, 1954, 1956,and 1966
Appendix Table 10.

Appendix Table l0. Cooperative X., Total costs prior and subsequent to merger, 1954, 1956,
1 Acquired cooperative's total costs one year before merger.Z Acquiring cooperatjves total costs one year before merger.
Combined costs of the cooperatives' two years subsequent to merger.
and 1966 --continued
Cooperative1A
1954
CooperativeB1954
CooperativeAB1956
CooperativeAB
1966(dollars) (dollars) (dollars) (dollars)
Maintenance and repairs 11,097 ZZ, 100 49, 517Total fixed costs 373, 759 90, 901
Combined total fixed costs 464, 660 539, 773 Z, 036, 392
Total operating costs 744, 55Z 364, 949
Combined total operating costs 1,109,501 l,Z19,389 3, 330, 939

1lncludes mining and manufacturing mergers only.
233
Appendix Table 11. Number of mergers among cooperatives,noncooperatives with cooperatives, cooper-ative s with none oop e rative s, and industrial
mergers, UnitedStates, 1940-1964
Year
Mergersamong
coopera-tives
Noncooperative mergerswith cooper-
atives
Cooperativemergers
with non Industrialcooperatives mergers1
1940 21 12 31 1401941 22 15 25 1111942 35 31 22 1181943 36 56 36 2131944 39 47 32 3241945 47 53 35 3331946 46 32 40 4191947 49 4O 31 4041948 42 42 20 2231949 22 23 32 1261950 28 15 16 2191951 25 23 7 351952 15 45 6 2881953 17 33 12 2951954 16 39 7 3871955 25 23 7 6831956 19 16 19 6731957 41 18 16 5851958 25 12 14 5891959 30 23 13 8351960 28 9 11 8441961 93 13 9 9541962 63 10 10 8531963 42 13 4 8611964 50 14 9 854
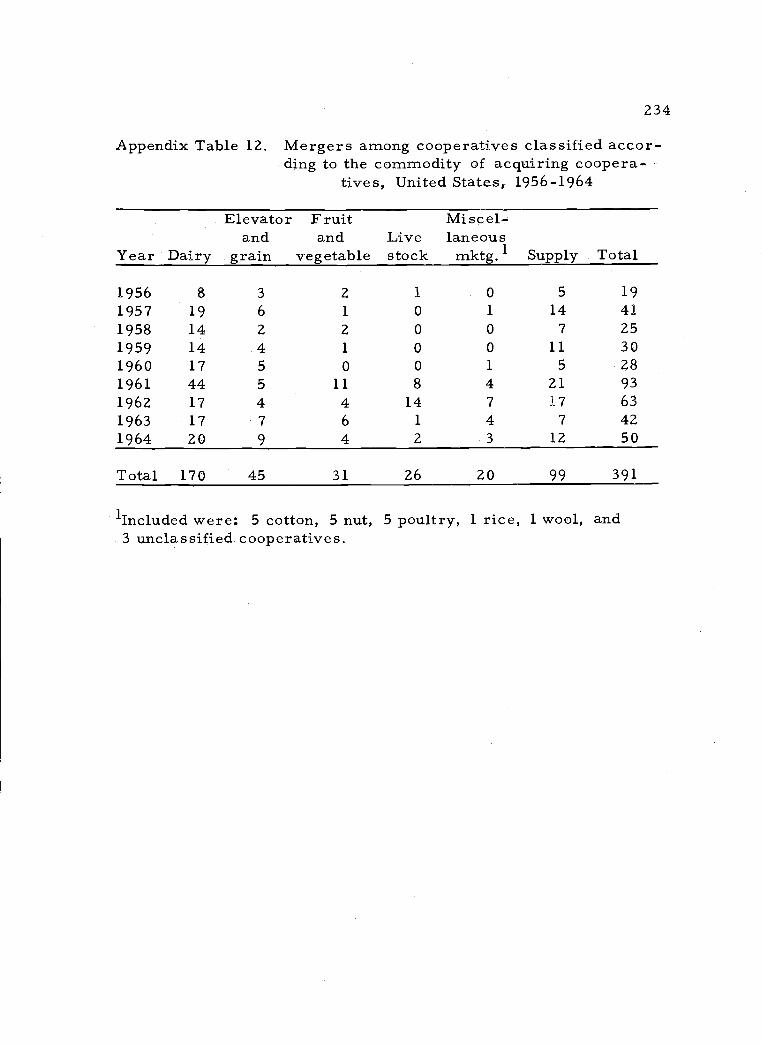
'Included were: 5 cotton, 5 nut, 5 poultry, 1 rice, 1 wool, and3 unclassified cooperatives.
234
Appendix Table 12. Mergers among cooperatives classified accor-ding to the commodity of acquiring coopera-
tives, United States 1956-1964
Year Dairy
Elevatorand
grain
Fruitand
vegetableLivestock
MisceL-laneousmktg. Supply Total
1956 8 3 2 1 0 5 191957 19 6 1 0 1 14 41
1958 14 2 2 0 0 7 251959 14 4 1 0 0 11 301960 17 5 0 0 1 5 281961 44 5 11 8 4 21 931962 17 4 4 14 7 17 63
1963 17 7 6 1 4 7 421964 20 9 4 2 3 12 50
Total 170 45 31 26 20 99 391
APPENDIX B
This appendix contains a copy of the questionnaire used in
personal interviews with the managers of the same cooperatives.
Z35

OREGON STATE UNIVERSITY Corvallis, Oregon 97330Department of Agricultural Economics
CONFIDENTIAL
I. General merger information:
Merger Acquisition Consolidation (CHECK
Firm: Person completingquestionnaire:
Position: Date:
Local Centralized Federated ONE)
No. of locals before merger No. of locals at present
1. How many mergers, acquisitions, and; consolidation possibi-
bilities have been attempted by your cooperative?
How many of these have been completed?
Z36
For each merger completed, please give the following in-
formation:
Annual dollar sales Cooperativevolume at the time or Type of
Merger No. Date of merger noncooperative merger
2. What were the reasons or motives for growth by merger?(Please list in order of importance - check with the boardof directors' minutes)
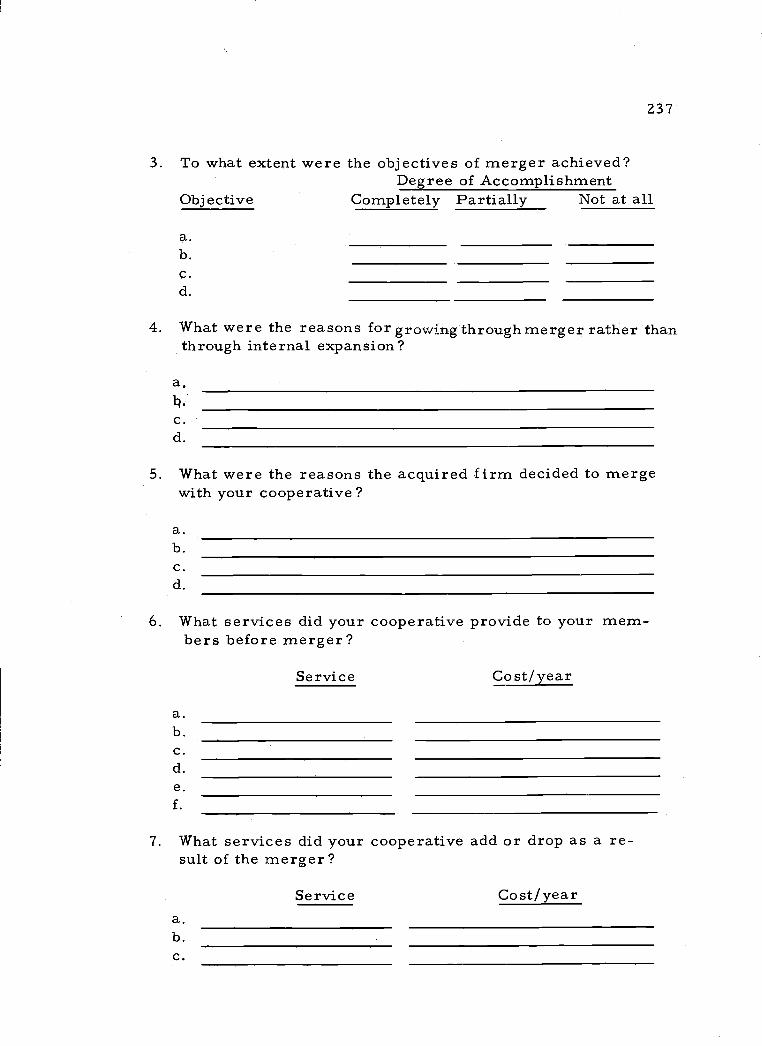
3. To what extent were the objectives of merger achieved?Degree of Accomplishment
Objective Completely Partially Not at all
C.
d.
4. What were the reasons for growing through merger rather thanthrough internal expansion?
a,
C.
d.
5. What were the reasons the acquired firm decided to mergewith your cooperative?
C.
d.
6. What services did your cooperative provide to your mem-bers before merger?
Service Cost/year
C.
7. What services did your cooperative add or drop as a re-suit of the merger?
Service Cost/year
237
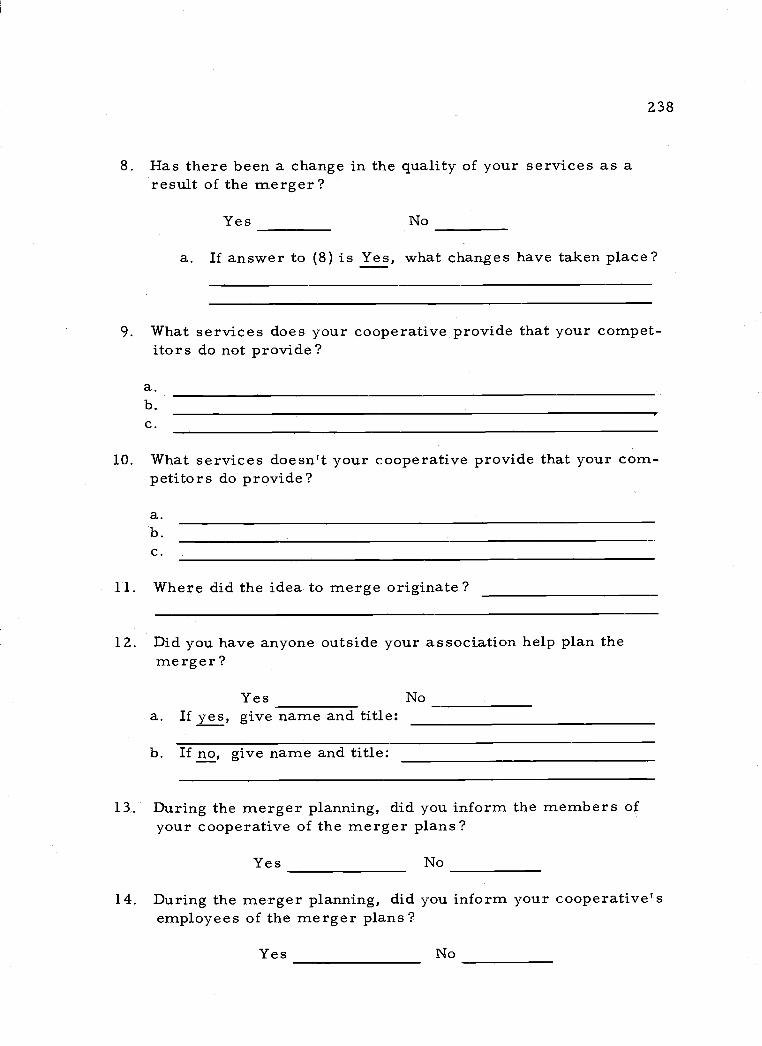
8. Has there been a change in the quality of your services as aresult of the merger?
Yes No
a. If answer to (8) is Yes, what changes have taken place?
9. What services does your cooperative provide that your compet-.itors do not provide?
10. What services doesn't your cooperative provide that your com-petitors do provide?
Ii. Where did the idea to merge originate?
12. Did you have anyone outside your association help plan themerger?
Yes Noa. If yes, give name and title:
b. If no, give name and title:
13,. During the merger planning, did you inform the members ofyour cooperative of the merger plans?
Yes No
14. During the merger planning, did you inform your cooperative'semployees of the merger plans?
Yes
238

15. How many members did your cooperative have at the time ofmerger?
Number at present?Number of the acquired firm at the time of merger?
16. Does your cooperative accept nonmember patronage?Yes No
Number of nonrnember patrons in your cooperative at thetime of merger?Number at present?Number of the acquired firm at the time of merger?
18. Did your cooperative or the acquired firm lose any of yourmembership accounts as a result of the merger?
Yes Noa. If yes, how many and why?
22. Is your processing plant or retail outlet more modern now asa result of the merger? Yes No
Was your procurement and distribution equipment technicallymodern at the time of merger? Yes No
Is your procurement and distribution equipment more modernas a result of the merger? Yes No
239
17. What was the percent of your total annual sales volume handledby your cooperative members?Before merger At present
19. What was the membership fee of your cooperative at the time ofmerger?
Of the acquired firm at the time of merger?At the present time?
20. How much permanent capital must be invested by each memberin your cooperative at the time of the merger?a.. At the present timeb. Of the acquired firm at the time of the merger?
21. Was your processing plant or retail outlet technically modernat the time of the merger? Yes No

25. Has your cooperative sold any of the acquired firm's or yourown assets as a result of the merger? Yes No
If Yes, what was sold?
If No, are all of your facilities used?
26. Has your cooperative purchased any new assets as a result ofthe merger? Yes Noa. If Yes, what assets did you purchase?
27. Since your merger, briefly describe what other changes haveresulted from this merger that could not have been obtained byeither firm if the merger had not taken place?
Changes in operating costs?
Changes in procuring products from farmers or suppliers?(i. e. , use of contracts, etc. )
Changes in packaging? (i. e., containers, etc.
Changes in distribution outlets? (i. e. , number and size
Changes in employee specialization? (i. e., fieldmen)
Changes in research? (i. e., setting up your own researchstaff or providing research funds to research organizations)
Changes in accounting practices? (i. e. , use of central-ized bookkeeping system for all firms and/or EDP, etc.
Changes in pricing practices?
Changes in size of sale per customer?
240

II. Market structure:
28. What were the main products sold by your cooperative be-fore and after the merger? Of the acquired firm beforemerger? (Please indicate the percent of total sales ac-counted for by the various products as well as the actualdollar volume):
Your cooperative Acquired firmBefore merger After merger Before merger
29. Consider your main product:a. What is the geographical area in which your coopera-
tive sells this product? (local, regional, national)Before mergerAt presentAcquired firm before merger
b. How many other sellers did your cooperative competewith in selling its major product in your marketingarea?
Before mergerAt present
241
c. How many of your competitors are other cooperatives?
d. What percent of your market area sales were made byyour cooperative?
Before mergerAt present
Product %Actualro1ume Product %
Actua1volume Product %
Actualvolume
a.b.c.d.e.f.g.

242
30. Which of the following best describes the conditions a new firmentering your industry faces?
Relatively easy for new firms to enter.Entry by new firms is difficult, but possible.Entry of new firms is, for all practical purposes,impossible.
31. If answer to (29) is (b) or (c), whichol the following conditionsmake entry difficult?
High capital requirements.Patents, processes, or other advantages held byexisting, firms.Established, firms have important brand namessupported through advertising.
A large firm is needed to have a low-cost operation.Other.
32. Which of the following best describes the pricing policy fol-lowed by your cooperative?
Cooperative follows the price set by another firm.Cooperative sets its price and then others follow it.
Cooperative sells at the going market price.There is interaction between prices of various firmsin the industry, with no one price being established.Other:
33. What action did your competitors take when they heard of yourmerger?
a.. Cut product prices.Increased prourement prices offered to farmers.Increased services offered to farmers or distribu-tors.No change.Other:
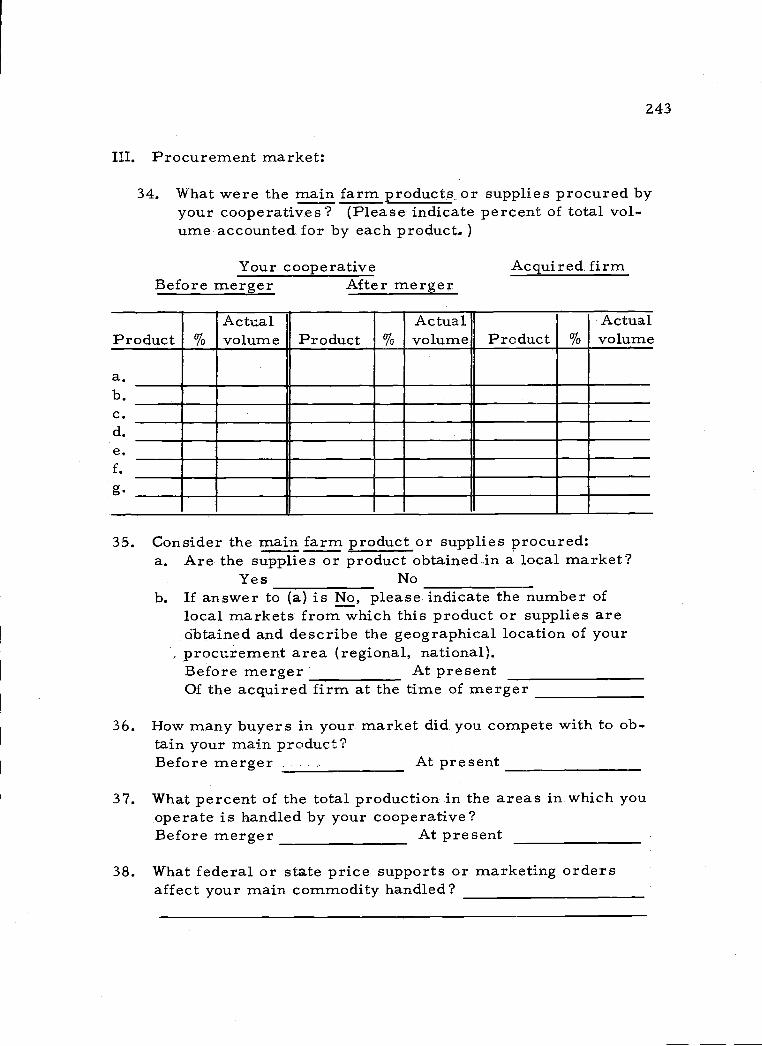
III. Procurement market:
34. What were the main farm productsor supplies procured byyour cooperatives? (Please indicate percent of total vol-ume accounted for by each product.)
Your cooperative Acquired firmBefore merger After merger
35. Consider the main farmproduct or supplies procured:Are the supplies or product obtained in a local market?
Yes NoIf answer to (a) is No, please indicate the number oflocal markets from which this product or supplies areobtained and describe the geographical location of yourprocurement area (regional, national).Before merger At presentOf the acquired firm at the time of merger
36. How many buyers in your market did you compete with to ob-tain your main product?Before merger . At present
37. What percent of the total production in the areas in which youoperate is handled by your cooperative?Before merger At present
38. What federal or state price supports or marketing ordersaffect your main commodity handled?
243
Product %Actualvolume Product, %
Actualvolume Product %
Actualvolume
a.b.C.d.e.f.g.
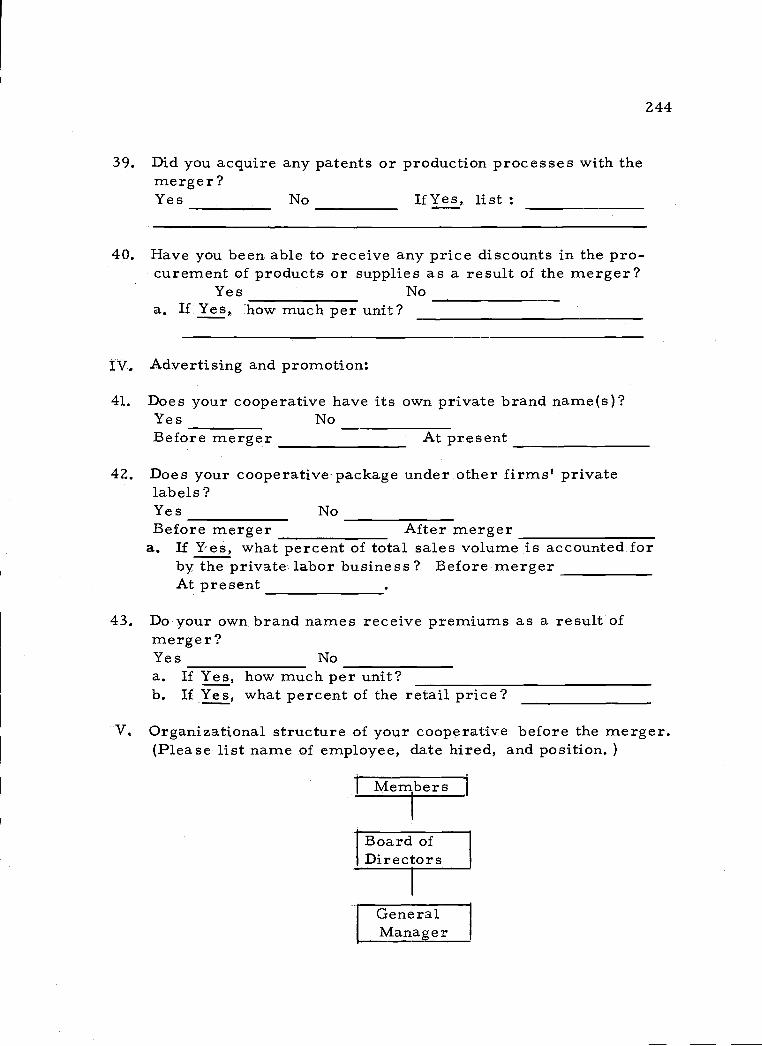
39. Did you acquire any patents or production processes with themerger?Yes No IfYes, list
40. Have you been able to receive any price discounts in the pro-curement of products or supplies as a result of the merger?
Yes Noa. If Yes Ihow much per unit?
IV. Advertising and promotion:
41. Does your cooperative have its own private brand name(s)?Yes NoBefore merger At present
Does your cooperative package under other firms' privatelabels?Yes NoBefore merger After merger
a. If Yes, what percent of total sales volume is accountedforby the private labor business? Before mergerAt present
Do your own brand names receive premiums as a result ofmerger?Yes No
If Yes, how much per unit?If Yes, what percent of the retail price?
V. Organizational structure of your cooperative before the merger.(Please list name of employee, date hired, and position.
Members 1
Board ofDirectors
GeneralMana. er
244

Board ofDirectors
GeneralManager
Organizational structure of your cooperative at the present time.
Board ofDirectors
Gene rälManager
Members
VI. Financial position:What were the bases of exchange or issuance of newequities between your association and the acquired firm?
How did your cooperative finance the exchange or issuanceof new equities?
Was the valuation of the acquired firm an adequate repre-sentation of the firm's earning potential?
Yes NoWhy?
245
Organizational structure of the acquired firm before the merger.
Members

47. What was the cost of integrating the two firms?
Changes in personnelCentralized bookkeeping and financesLegal, accounting, and other servicesUnnecessary- facilitiesNew plant and equipment needed
1.
1.
Cost
246

48. Financial position of your cooperative:
Advertising Long-term Patronage Current Total Curr. Total Members' $ Sales NetYear expense debt refunds as sets assets liab. liab. equity volume saving
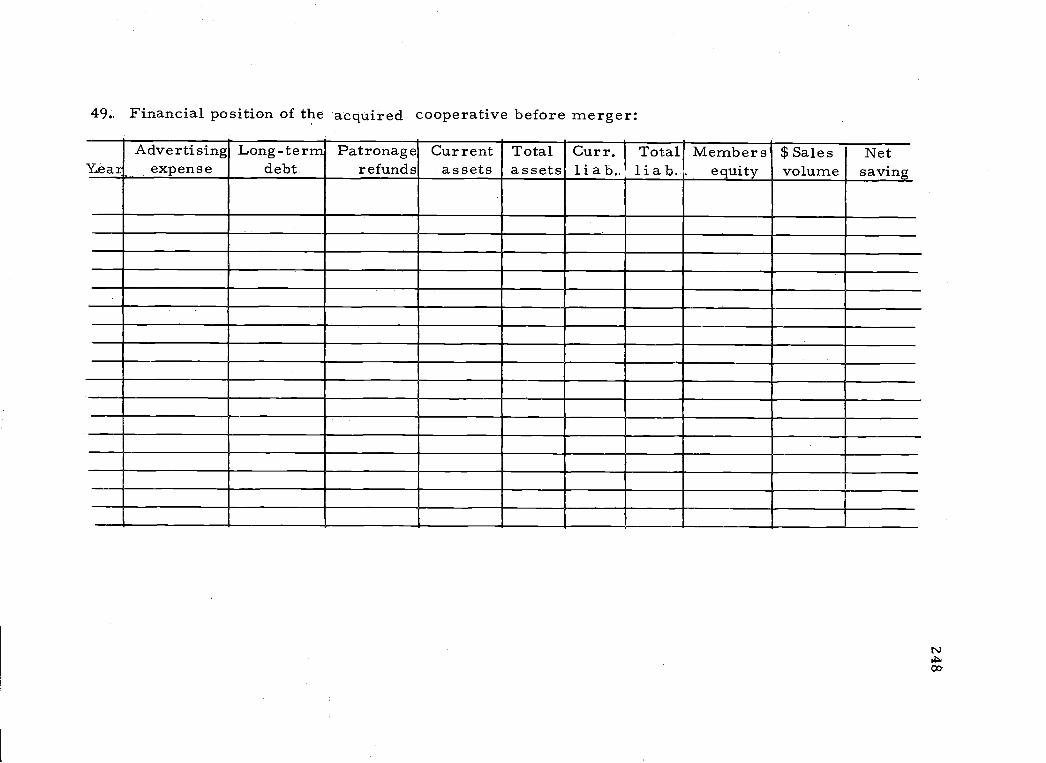
49., Financial position of the acquired cooperative before merger:
Yea:Advertising
expenseLong-term
debtPatronage
refundsCurrent
assetsTotalassets
Curr.liab..
Totalliab..
Membersequity
$ Salesvolume
Netsaving
Z49
Please enclose a copy of your merger proposal, and by-laws.
Please enclose a profit and loss statement and balance sheetand an audit report, if available, of both firms at the time ofmerger, two years after merger, and for last year's opera-tion.