united states court of appeals fifth circuit
TRANSCRIPT

JUDICIAL WORKLOAD STATISTICS
UNITED STATES COURT OF APPEALS
FIFTH CIRCUIT
CLERK'S ANNUAL REPORT
JULY 2020 - JUNE 2021

ii
PREFACE
This report provides information on the judicial business of the United States
Court of Appeals for the Fifth Circuit for the period of July 1, 2020, through June 30,
2021.
Our statistics refer to both "appeals" and "cases." The term "appeals" refers to
all filings reported to the Administrative Office. This includes additional appeals, cross
appeals, consolidated appeals, successive habeas corpus, paid and in forma pauperis
mandamus applications, and petitions for review. The term "cases" refers to actual
workload credit. An example would be a main appeal with a cross appeal. We count
this as two "appeals," but only one "case" because the court works on the main and the
cross appeal together. Statistics counting "cases" provide a more accurate and realistic
picture of the actual workload of our judges.
A summary of the report appears at page vi.
LYLE W. CAYCE
CLERK

i
INDEX
Index of Tables ................................................................................................................ iii
Index of Enclosures ........................................................................................................... v
SUMMARY OF ANNUAL REPORT ............................................................................... vi
A. NEW FILINGS ........................................................................................................ 1
1. New Appeals Filed ................................................................................................ 1
2. Source of New Appeals by Type ........................................................................... 1
3. New Appeals ......................................................................................................... 3
B. CLOSED APPEALS ................................................................................................ 6
1. Yearly Comparison ............................................................................................... 6
2. Method of Disposition ........................................................................................... 6
C. UNDISPOSED OF (PENDING) APPEALS/CASES .............................................. 8
1. Cases Under Submission ...................................................................................... 8
2. Unassigned Carry-Over ........................................................................................ 9
D. SUMMARY OF APPEALS COMMENCED, TERMINATED AND PENDING .. 11
E. OPINIONS ............................................................................................................. 11
1. Number of Opinions, Published and Unpublished ............................................ 11
2. Types of Opinions ............................................................................................... 12
3. Types of Opinions by Calendar .......................................................................... 13
(b) Oral Argument Calendar .............................................................................. 14
(c) Conference Calendar ...................................................................................... 15
4. Published and Unpublished Opinions ............................................................... 15
(a) Number and Percentage - 2021 ..................................................................... 15
(b) Percentage Comparison (Published) - 2016 - 2021 ....................................... 15
(c) Length of Published Opinions ....................................................................... 16
5. Reversal Rate ...................................................................................................... 17
F. WORKLOAD PER ACTIVE JUDGE .................................................................... 18
1. Opinion Output - Per Active Judge .................................................................... 18
2. Opinion Output - Overall - 2016 - 2021 ............................................................. 18
3. Overall Workload ................................................................................................ 20
G. SCREENING CLASSIFICATIONS ...................................................................... 21

ii
1. Cases Screened by Judges .................................................................................. 21
(a) Screening Classifications by Case Type ....................................................... 23
H. EN BANC PETITIONS AND REHEARINGS ..................................................... 25
I. PETITIONS FOR CERTIORARI ........................................................................... 25
J. ADMINISTRATIVE-INTERIM MOTIONS .......................................................... 27

iii
Index of Tables
Table 1 - New Appeals Filed............................................................................................. 1
Table 2 - New Appeals by Case Type ............................................................................... 2
Table 3 - 2021 New Appeals by Case Type ...................................................................... 3
Table 4 - New Appeals by Source ..................................................................................... 4
Table 5 - New Appeals Trends ......................................................................................... 5
Table 6a - 2020 New Appeals ........................................................................................... 5
Table 6b - 2021 New Appeals ........................................................................................... 5
Table 7a - 2020 New Appeals ........................................................................................... 6
Table 7b - 2021 New Appeals .......................................................................................... 6
Table 8 - Appeals and Cases Closed ................................................................................. 6
Table 9 - Method of Disposition ....................................................................................... 7
Table 10 - Method of Disposition by Graph ..................................................................... 7
Table 11 - Pending Appeals/Cases ................................................................................... 8
Table 12 - Cases Under Submission ................................................................................ 8
Table 13 - Unassigned Carry-Over .................................................................................. 9
Table 14 - Unassigned Carry-Over by Category............................................................ 10
Table 15 - Summary of Appeals Commenced, Terminated and Pending ..................... 11
Table 16 - Number of Opinions, Published and Unpublished ...................................... 11
Table 17 - Number of Opinions, Published and Unpublished by Graph ...................... 12
Table 18 - Types of Opinions .......................................................................................... 12
Table 19 - Types of Opinions by Graph .......................................................................... 13
Table 20 - Summary Calendar Opinions ....................................................................... 14
Table 21 - Oral Argument Opinions ............................................................................... 14
Table 22 - Opinion Number and Percentage 2021 ........................................................ 15
Table 23 - Published Opinion Percentage ...................................................................... 15
Table 24 - Published Opinion Percentage Comparison by Graph ................................ 16
Table 25 - Length of Published Opinions by Graph ...................................................... 16
Table 26 - Reversal Rate................................................................................................. 17
Table 27 - Reversal Rate by Percentage by Graph ........................................................ 18
Table 28 - Opinion Output.............................................................................................. 19
Table 29 - Opinion Output - Active & Non-Active Judges ............................................ 19
Table 30 - Overall Workload .......................................................................................... 20
Table 31 - Overall Workload by Graph .......................................................................... 21

iv
Table 32 - Screening Classifications .............................................................................. 22
Table 33 - Screening Classifications by Graph .............................................................. 23
Table 34 - Summary Calendar Percentage by Case Type ............................................. 23
Table 35 - Petitions for Certiorari .................................................................................. 26
Table 36 - Petitions for Certiorari by Graph ................................................................. 26

v
Index of Enclosures
Table of New Appeals Docketed...................................................................Enclosure A
Workload per Active Judge.......................................................................... Enclosure B
Summary of Screening Classification by Case Type...................................Enclosure C
Petitions for Rehearing En Banc and En Banc Grants...............................Enclosure D
Petitions for Certiorari Filed, Acted on, and Pending................................ Enclosure E
Monthly Report of Administrative-Motions Submitted to Judges.............Enclosure F

vi
SUMMARY OF ANNUAL REPORT
2016 2017 2018 2019 2020 2021
New Appeals 8675 7390 7347 7164 6593 6351
Terminations 7747 8214 7387 7377 6499 6513
By Judges 5007 5335 4692 4635 4192 4045
By Clerk 1827 1858 1857 1867 1480 1725
By Consolidation 913 1021 838 875 827 743
Pending Appeals 5713 4888 4848 4633 4723 4563
Total Cases Screened for Decision
as to Oral Argument 2981 2887 2729 2721 2582 2321
Cases Sent to:
Summary Calendar 1536 1655 1594 1221 1254 1174
Conference Calendar 647 421 360 606 505 365
Oral Argument Calendar 798 811 775 893 823 782
Summary Calendar Rate 65.8% 67.1% 67.3% 57.8% 60.4% 60.0%
Conference & Summary Calendar
Rate 73.2% 72.0% 71.6% 67.2% 68.1% 66.3%
Cases Ready for Argument 9 148 158 153 146 67
Cases Pending Under Submission 158 133 199 187 226 214
90-day Cases 55 47 59 70 105 107
Total Opinions 3136 2995 2836 2870 2808 2554
Published Opinions 422 457 372 473 487 489
Unpublished Opinions 2714 2538 2464 2397 2321 2065
Opinions per Active Judge 163 157 139 130 130 114
Publication Rate 13.5% 15.3% 13.1% 16.5% 17.3% 19.1%
Page Length of Published Opinions 14.3 12.6 14.0 13.5 13.4 13.5
Participations per Active Judge in
Opinions 489 471 417 390 405 342
En Banc Cases 6 2 8 6 8 10
Motions per Active Judge 1232 1435 1204 1035 961 808

1
A. NEW FILINGS
1. New Appeals Filed
The chart below shows the “new appeals” filing trends in comparison to the
national average filing trends. We experienced a 242 appeal decrease (3.7%), from 6593
to 6351 appeals. Criminal appeals increased by 34 (1.7%) and BIA appeals increased
by 196 (31.3%). Prisoner appeals decreased by 53 (3.3%). Successive Habeas petitions
decreased by 254 (44.3%). Civil Rights appeals decreased by 150 (24.7%).
Table 1 - New Appeals Filed
2. Source of New Appeals by Type
The source of appeals by type is found in the following tables. The first shows
the six year trend and the second displays 2021 data. (See also column (d) of the
monthly cumulative report of new appeals by type at Enclosure A, page 28).
50084336
4102 3982 4087 3816
8675
7390 73477164
6593 6351
0
1000
2000
3000
4000
5000
6000
7000
8000
9000
10000
2016 2017 2018 2019 2020 2021
National Average Fifth Circuit

2
Table 2 - New Appeals by Case Type
TYPE YEAR Change from
Prior Year
2016 2017 2018 2019 2020 2021 No. %
Criminal 3004 2310 2158 2197 1953 1987 +34 +1.7
Prisoner Appeals 2011 2074 2136 1971 1606 1553 -53 -3.3
Successive Habeas Corpus 1304 728 497 503 574 320 -254 -44.3
IFP Mandamus 145 171 147 138 121 131 +10 +8.3
Federal Question 506 431 728 604 386 342 -44 -11.4
Diversity 379 439 371 345 383 349 -34 -8.9
U.S. Civil 80 125 98 119 87 101 +14 +16.1
Tax 9 7 8 13 6 10 +4 +66.7
Tax Court 9 16 15 16 15 10 -5 -33.3
Civil Rights 538 533 587 610 619 469 -150 -24.7
Bankruptcy 58 63 86 74 76 86 +10 +13.2
Social Security 23 18 7 16 21 32 +11 +52.4
BIA 330 350 393 442 626 822 +196 +31.3
Mandamus 33 38 27 29 30 28 -2 -6.7
Agency 124 46 44 47 38 54 +16 +42.1
Miscellaneous 122 41 45 40 52 57 +5 +9.6
8675 7390 7347 7164 6593 6351 -242 -3.7

3
Table 3 - 2021 New Appeals by Case Type
Our biggest increase in filings was in Criminal and BIA appeals. Prisoner,
Successive Habeas petitions and Civil Rights appeals dropped significantly.
3. New Appeals
Eastern Texas is the oly one of the nine districts that showed an increase in
appeals filed. Southern Texas decreased the most. Other appeals (Agency,
Bankruptcy, U.S. Tax Court, BIA, and Mandamus) increased by 215 cases.
Criminal 31.3%
Prisoner Appeals 24.5%
Successive Habeas Corpus 5.0%
IFP Mandamus 2.1%
Federal Question 5.4%
Diversity 5.5%
Mandamus 0.4%
Civil Rights 7.4%
Bankruptcy 1.4%
U.S. Civil 1.6%
Other 0.8%
Agency 0.8%
BIA 12.9%
Miscellaneous 0.9%

4
Table 4 - New Appeals by Source
2016 2017 2018 2019 2020 2021
Change from
Prior Year
Louisiana Eastern 623 575 807 537 408 385 -23
Louisiana Middle 173 148 164 153 195 145 -50
Louisiana Western 663 356 360 402 401 301 -100
Subtotal 1459 1079 1331 1092 1004 831 -173
Mississippi Northern 155 132 136 129 123 119 -4
Mississippi Southern 351 355 314 328 279 258 -21
Subtotal 506 487 450 457 402 377 -25
Texas Northern 1757 1634 1659 1654 1416 1311 -105
Texas Southern 2197 1797 1653 1532 1293 1166 -127
Texas Eastern 623 600 534 605 509 526 +17
Texas Western 1579 1280 1155 1216 1184 1140 -44
Subtotal 6156 5311 5001 5007 4402 4143 -259
Agency 124 46 44 47 38 54 +16
Bankruptcy 58 63 86 74 76 86 +10
U.S. Tax Court 9 16 15 16 15 10 -5
BIA 330 350 393 442 626 822 +196
Mandamus 33 38 27 29 30 28 -2
Subtotal 554 513 565 608 785 1000 +215
Total 8675 7390 7347 7164 6593 6351 -242

5
The graph below shows the six year trend of the appeals by state.
Table 5 - New Appeals Trends
A comparison of the percentage of appeals by states for 2020 and 2021 is shown
on the following charts:
Table 6a - 2020 New Appeals Table 6b - 2021 New Appeals
831
1004
1092
1331
1079
1459
377
402
457
450
487
506
4143
4402
5007
5001
5311
6156
1000
785
608
565
513
554
0 1000 2000 3000 4000 5000 6000 7000
2021
2020
2019
2018
2017
2016
Other
Texas
Mississppi
Louisiana
TX = 4402 LA = 1004
Other = 785 MS = 402
TX 66.8%
MS 6.1%
Other 11.9%
LA 15.2%
TX = 4143 LA = 831
Other = 1000 MS = 377
TX 65.2%
MS 6.0%
Other 15.7%
LA 13.1%

6
A comparison of the percentage of other appeals by source for 2020 and 2021 is shown
on the following charts:
Table 7a - 2020 New Appeals Table 7b - 2021 New Appeals
B. CLOSED APPEALS
1. Yearly Comparison
The court disposed of 14 more appeals this year, an increase of 0.2%.
Table 8 - Appeals and Cases Closed
2016 2017 2018 2019 2020 2021
Change from
Prior Year
All Appeals 7747 8214 7387 7377 6499 6513 +14 +0.2%
Cases 6834 7193 6549 6502 5672 5770 +98 +1.7%
2. Method of Disposition
Overall, the court disposed of 98 more cases than last year. There were 260
fewer opinions, and other judicial dispositions increased by 106. Clerk dispositions
increased by 245.
Agency 4.8%
Bankruptcy 9.7%
US Tax Court 1.9%
BIA 79.8%
Mandamus 3.8%
Agency = 38 Bankruptcy = 76
US Tax Court = 15 BIA = 626
Mandamus = 30
Agency = 54 Bankruptcy = 86
US Tax Court = 10 BIA = 822
Mandamus = 28
BIA 82.2%
Mandamus 2.8% Agency 5.4%
Bankruptcy 8.6%
US Tax Court 1.0%

7
Table 9 - Method of Disposition
2016 2017 2018 2019 2020 2021
Change from
Prior Year
By Opinion* 3110 2967 2820 2840 2781 2521 -260
Other Judicial
Dispositions
1897 2368 1872 1795 1411 1517 +106
Total Judicial
Dispositions
5007 5335 4692 4635 4192 4045 -147
By Clerk 1827 1858 1857 1867 1480 1725 +245
Closed Cases 6834 7193 6549 6502 5672 5770 +98
*Does not include 33 opinions that were non-dispositive, such as limited remands.
Table 10 - Method of Disposition by Graph
5770
5672
6502
6549
7193
6834
4045
4192
4635
4692
5335
5007
2521
2781
2840
2820
2967
3110
1517
1411
1795
1872
2368
1897
1725
1480
1867
1857
1858
1827
0 2000 4000 6000 8000
2021
2020
2019
2018
2017
2016
By Clerk
Other Judicial Dispositions
By Opinion
Total Judicial Dispositions
Closed Cases

8
C. UNDISPOSED OF (PENDING) APPEALS/CASES
The court disposed of 6513 appeals compared to 6351 filed. There are 4563
appeals pending compared to 4723 last year. There are 3977 cases pending this year
compared with 4071 last year.
Table 11 - Pending Appeals/Cases
2016 2017 2018 2019 2020 2021
Change from
Prior Year
All Appeals Pending 5713 4888 4848 4633 4723 4563 -3.4%
Cases 4907 4227 4111 3862 4071 3977 -2.3%
The 3977 pending cases are characterized as either Cases Under Submission or
Unassigned Carry-Over:
1. Cases Under Submission
Excluding 22 cases consolidated for argument and decision, and 23 held in
abeyance, the court has fewer cases argued and awaiting decision this year.
Table 12 - Cases Under Submission
2016 2017 2018 2019 2020 2021
Active Judges 136 105 137 167 200 186
Senior Judges 21 22 62 18 26 23
Visiting Judges 1 0 0 2 0 5
Total 158 127 199 187 226 214

9
2. Unassigned Carry-Over
All cases briefed but not yet argued or decided and all unbriefed cases are
reported as “Unassigned Carry-Over” (see Table 14 for details). Unassigned cases
decreased, 103 fewer than last year. This leaves 3736 cases that are the immediate
future workload of the court. The following chart gives the six-year trend for
unassigned carry-over:
Table 13 - Unassigned Carry-Over
Year
Unassigned
Cases
New
Appeals
% Unassigned Cases
to New Appeals
2016 4739 8675 54.6
2017 4092 7390 55.4
2018 3901 7347 53.1
2019 3658 7164 51.1
2020 3839 6593 58.2
2021 3736 6351 58.8
The 3736 unassigned cases fall into the following categories.

10
Table 14 - Unassigned Carry-Over by Category
Category 2020 2021
(a) Already Briefed
Calendared for Oral Argument 72 142
Briefed but Held in Abeyance 58 70
Awaiting Assignment to Oral Argument Calendar 146 67
Awaiting Assignment to Screening Panel 2 2
Being Screened 807 960
Assignment to Panel for Jurisdictional Review 21 10
Subtotal 1106 1251
(b) Unbriefed Cases
Pre-Briefing 1245 1069
Records Due 177 102
Being Briefed 1175 1187
Stayed/Held in Abeyance 51 57
Awaiting DC Action* 85 70
Subtotal 2733 2485
Total 3839 3736 *Our court is unable to proceed because of matters pending in the district court.

11
D. SUMMARY OF APPEALS COMMENCED, TERMINATED AND PENDING
Table 15 - Summary of Appeals Commenced, Terminated and Pending
E. OPINIONS
1. Number of Opinions, Published and Unpublished
The total number of opinions decreased by 254. Total opinions, including the
numbers published and unpublished for the last six years are:
Table 16 - Number of Opinions, Published and Unpublished
Year Total Opinions Published Unpublished
2016 3136 422 2714
2017 2995 457 2538
2018 2836 372 2464
2019 2870 473 2397
2020 2808 487 2321
2021 2554 489 2065
8675
7390 7347 7164 65936351
7747 82147387 7377
64996513
57134888 4848 4633 4723 4563
0
1000
2000
3000
4000
5000
6000
7000
8000
9000
10000
2016 2017 2018 2019 2020 2021
Commenced Terminated Pending

12
Table 17 - Number of Opinions, Published and Unpublished by Graph
2. Types of Opinions
Signed opinions increased by 0.6% this year and per curiam opinions decreased
by 11.9%.
Table 18 - Types of Opinions
Year Signed Per Curiam Rule 47.6 Total
2016 15.2% 84.6% 0.2% 100.0%
2017 15.0% 84.7% 0.3% 100.0%
2018 13.2% 86.7% 0.1% 100.0%
2019 16.3% 83.0% 0.7% 100.0%
2020 17.0% 82.2% 0.8% 100.0%
2021 18.8% 80.9% 0.3% 100.0%
3136 29952836 2870 2808
2554
27142538 2464 2397 2321
2065
422 457372
473 487 489
0
500
1000
1500
2000
2500
3000
3500
2016 2017 2018 2019 2020 2021
Total Opinions Unpublished Published

13
Table 19 - Types of Opinions by Graph
3. Types of Opinions by Calendar
The types of opinions on the summary, oral argument and conference calendars
are as follows:
(a) Summary Calendar
The number of summary calendar decisions decreased by 99 from 1274
to 1175. The percentage of signed opinions on the summary calendar
decreased by 0.8% and per curiam opinions increased by 1.7%.
84.6 84.7 86.783 82.2 80.9
15.2 15 13.2 16.3 17 18.8
0.2 0.3 0.1 0.7 0.8 0.3
0
10
20
30
40
50
60
70
80
90
100
2016 2017 2018 2019 2020 2021
P
E
R
C
E
N
T
A
G
E
Per Curiam Signed R.47.6
14
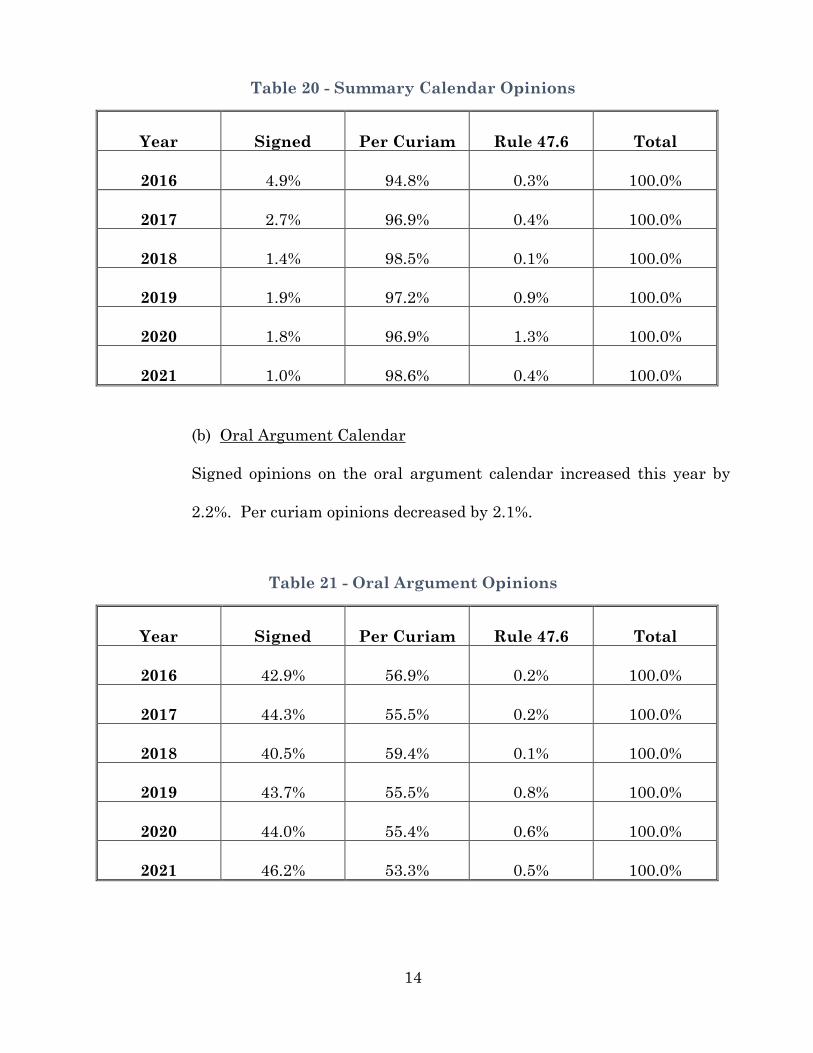
Table 20 - Summary Calendar Opinions
Year Signed Per Curiam Rule 47.6 Total
2016 4.9% 94.8% 0.3% 100.0%
2017 2.7% 96.9% 0.4% 100.0%
2018 1.4% 98.5% 0.1% 100.0%
2019 1.9% 97.2% 0.9% 100.0%
2020 1.8% 96.9% 1.3% 100.0%
2021 1.0% 98.6% 0.4% 100.0%
(b) Oral Argument Calendar
Signed opinions on the oral argument calendar increased this year by
2.2%. Per curiam opinions decreased by 2.1%.
Table 21 - Oral Argument Opinions
Year Signed Per Curiam Rule 47.6 Total
2016 42.9% 56.9% 0.2% 100.0%
2017 44.3% 55.5% 0.2% 100.0%
2018 40.5% 59.4% 0.1% 100.0%
2019 43.7% 55.5% 0.8% 100.0%
2020 44.0% 55.4% 0.6% 100.0%
2021 46.2% 53.3% 0.5% 100.0%
15
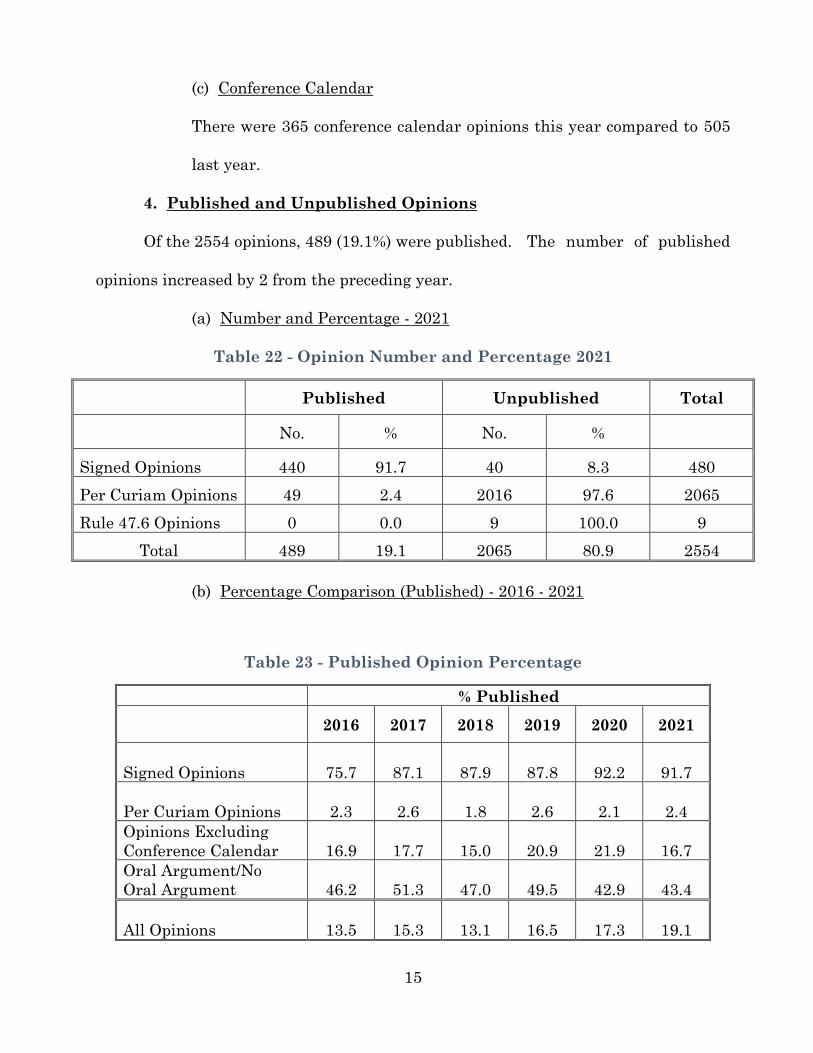
(c) Conference Calendar
There were 365 conference calendar opinions this year compared to 505
last year.
4. Published and Unpublished Opinions
Of the 2554 opinions, 489 (19.1%) were published. The number of published
opinions increased by 2 from the preceding year.
(a) Number and Percentage - 2021
Table 22 - Opinion Number and Percentage 2021
Published Unpublished Total
No. % No. %
Signed Opinions 440 91.7 40 8.3 480
Per Curiam Opinions 49 2.4 2016 97.6 2065
Rule 47.6 Opinions 0 0.0 9 100.0 9
Total 489 19.1 2065 80.9 2554
(b) Percentage Comparison (Published) - 2016 - 2021
Table 23 - Published Opinion Percentage
% Published
2016 2017 2018 2019 2020 2021
Signed Opinions 75.7 87.1 87.9 87.8 92.2 91.7
Per Curiam Opinions 2.3 2.6 1.8 2.6 2.1 2.4
Opinions Excluding
Conference Calendar 16.9 17.7 15.0 20.9 21.9 16.7
Oral Argument/No
Oral Argument 46.2 51.3 47.0 49.5 42.9 43.4
All Opinions 13.5 15.3 13.1 16.5 17.3 19.1

16
Table 24 - Published Opinion Percentage Comparison by Graph
(c) Length of Published Opinions
The average page length of opinions is up 0.7% from 2020.
Table 25 - Length of Published Opinions by Graph
75.7
87.187.9
87.8
92.291.7
2.3 2.6 1.8 2.6 2.1 2.4
13.5 15.3 13.116.5 17.3 19.1
16.917.7
1520… 21.9 16.7
46.251.3
47 49.542.9
43.4
0
10
20
30
40
50
60
70
80
90
100
2016 2017 2018 2019 2020 2021
P
E
R
C
E
N
T
A
G
E
Signed Per Curiam Opinions Excluding Conference OA/NOA All Opinions
14.3
12.6
1413.5
13.413.5
10
15
2016 2017 2018 2019 2020 2021
Average Page Length

17
5. Reversal Rate
The 2021 reversed/vacated rate of 7.6% is higher than the 2020 reversed/vacated
rate of 6.8%.
Table 26 - Reversal Rate
2021 2020
Summary Hearing
Conference
Calendar Overall Overall
No. % No. % No. % No. % %
Affirmed 935 79.5 589 58.1 0 -0.1 1524 59.7 59.5
Affd. In Part 96 8.2 112 11.0 0 0.0 208 8.1 6.5
Dismissed 110 9.4 109 10.7 363 99.5 582 22.8 25.7
Remanded 8 0.7 18 1.8 1 0.3 27 1.1 1.2
Transferred 0 0.0 0 0.0 0 0.0 0 0.0 0.0
Reversed/Vacated* 26 2.2 168 16.6 0 0.0 194 7.6 6.8
Other-Non
Dispositive 0 0.0 18 1.8 1 0.3 19 0.7 0.3
Total 1175 100.0 1014 100.0 365 100.0 2554 100.0 100.0
*The reversed and vacated categories are being reported together to make our reporting more consistent
with Administrative Office reports.

18
Table 27 - Reversal Rate by Percentage by Graph
F. WORKLOAD PER ACTIVE JUDGE
1. Opinion Output - Per Active Judge
The average opinion output for each of the active judges who participated in
disposing of cases on the merits on the summary, oral argument and conference
calendars for the reporting year from July 1, 2020, through June 30, 2021 decreased
from the previous year.
2. Opinion Output - Overall - 2016 - 2021
The opinion workload for the entire court is shown in the following table.
Affirmed
Affd. in Part
Reversed/Vacated
Remanded
Dismissed
Other-Non Dispositive
Affirmed 59.7%Dismissed 22.8%
Remanded 1.1%
Reversed 7.6%
Affd. in Part 8.1%
Other-Non Dispositive 0.7%

19
Table 28 - Opinion Output
Year
(a)*
Opinions by
Active
Judges
(b)*
Opinions by
Non-Active
Judges
(c)
Total
Opinion
Output
(d)
Opinions per
Active
Judge
20161 2436 700 3136 163
20172 2198 797 2995 157
20183 1736 1100 2836 139
20194 1941 929 2870 130
20205 2086 722 2808 130
20216 1926 628 2554 114
Table 29 - Opinion Output - Active & Non-Active Judges
1 In 2016, there were 15 active judges, 6 non-active judges and 7 visiting judges.
2 In 2017, there were 14 active judges, 7 non-active judges and 2 visiting judges.
3 In 2018, there were 16 active judges, 9 non-active judges and 2 visiting judges.
4 In 2019, there were 16 active judges, 9 non-active judges and 2 visiting judges.
5 In 2020, there were 16 active judges, 9 non-active judges and 2 visiting judges.
6 In 2021, there were 17 active judges, 8 non-active judges and 2 visiting judges.
24362198
17361941
2086 1926
700797
1100 929
722 628
0
1000
2000
3000
2016 2017 2018 2019 2020 2021
Opinions by Active Judges Opinions by Non-Active Judges

20
3. Overall Workload
The average opinions per active judge does not give a complete measure of the
active judges' overall workload. Participation in other panel members' opinions in fully
briefed cases, conference calendar panels, jurisdiction calendar panels, as well as
consideration of petitions for rehearing en banc and administrative-interim motions
are also other important work factors. Overall, active judges handled 218
fewer matters per judge than last year. Enclosure B, page 29, shows the total
average annual workload per active judge, based on the court's summary
calendar, seven sessions of court per active judge, and other workload figures as
follows:
Table 30 - Overall Workload Per Active Judge
2016 2017 2018 2019 2020 2021
Opinions and
Participations in Opinions* 489 471 417 390 405 342
Petitions for Rehearing
En Banc 200 197 179 193 188 186
Administrative-Interim
Motions 1232 1435 1204 1035 961 808
Total Workload 1921 2103 1800 1618 1554 1336

21
Table 31 - Overall Workload by Graph
*Based on figures of judges who participated in summary, oral argument and conference calendars for
the entire year.
G. SCREENING CLASSIFICATIONS
1. Cases Screened by Judges
The following table demonstrates the number and percentages of the cases
disposed of by the oral argument calendar. There was a decrease in percentage of
cases sent to the oral argument calendar.
19212103
1800
1618 15541336
1232 1435 12041035 961
808489 471 417 390 405
342200 197 179 193 188 186
0
500
1000
1500
2000
2500
2016 2017 2018 2019 2020 2021
Total Workload Administrative-Interim Motions
Opinions & Participations in Opinions Petitions for Rehearing En Banc

22
Table 32 - Screening Classifications
CLASS
Year
I and II
(No Argument)
III
(Limited
Argument)
IV
(Full
Argument) Total
No. % No. % No. % No. %
2016 21831 73.2 798 26.8 0 0.0 29811 100.0
2017 20762 71.9 810 28.1 1 0.0 28872 100.0
2018 19543 71.6 772 28.3 3 0.1 27293 100.0
2019 18274 67.2 889 32.7 4 0.1 27204 100.0
2020 17595 68.1 820 31.8 3 0.1 25825 100.00
2021 15396 66.3 781 33.6 1 0.1 23216 100.00
Total 11,3387 69.9 4,870 30.0 12 0.1 16,2207 100.0
Argument was held in 50.9% of the 782 cases designated as Class III and IV.
1 Includes 647 conference calendar opinions.
2 Includes 421 conference calendar opinions.
3 Includes 360 conference calendar opinions.
4 Includes 610 conference calendar opinions.
5 Includes 505 conference calendar opinions.
6 Includes 365 conference calendar opinions.
7 Includes 2908 conference calendar opinions.

23
Table 33 - Screening Classifications by Graph
* Includes conference calendar cases.
Several additional screening tables follow:
(a) Screening Classifications by Case Type
Enclosure C, page 30, shows the number of cases classified and the
summary calendar percentage by case type. Extracting only the
summary calendar percentages for comparison with prior years, we see:
Table 34 - Summary Calendar Percentage by Case Type
Summary Calendar Percentage (%)
Case Type 2016 2017 2018 2019 2020 2021
CRIMINAL DIRECT 88.0 84.3 86.5 85.2 86.1 88.2
CRIMINAL NON-DIRECT 91.7 91.6 96.2 85.3 82.3 78.1
2183 2076 1954 1827 17591539
798 810 772 889 820 781
0 1 3 4 3 1
2981 2887 2729 2720 25822321
0
1000
2000
3000
4000
2016 2017 2018 2019 2020 2021
Class I and II Class III Class IV Total Screeners

24
Summary Calendar Percentage (%)
Case Type 2016 2017 2018 2019 2020 2021
PRISONER CASES
W/cnsl 35.0 25.0 34.6 37.0 11.8 27.8
W/O cnsl 86.3 89.5 87.0 76.7 69.3 72.7
2255
W/cnsl 0.0 25.0 16.7 31.3 37.9 57.9
W/O cnsl 36.4 61.5 91.7 60.0 70.0 66.7
CIVIL
Diversity 39.8 41.0 30.4 33.0 41.1 24.0
Federal Question 28.5 27.7 27.4 29.1 25.7 21.0
U.S. Civil 42.1 29.5 30.2 25.6 41.5 32.4
Tax 0.0 50.0 0.0 33.3 0.0 16.7
Bankruptcy 24.4 37.1 28.1 22.6 29.8 27.8
Civil Rights 46.0 37.6 40.1 38.0 34.5 36.2
BIA 84.6 81.9 85.8 79.6 68.7 78.2
Tax Court 33.3 33.3 33.3 75.0 46.7 50.0
Other Agency 15.2 30.8 10.0 22.2 19.0 20.8
Social Security 81.0 81.8 37.5 75.0 100.00 50.0
Mandamus 0.0 0.0 0.0 0.0 0.0 0.0
TOTAL 73.2 72.0 71.6 67.2 68.1 66.3

25
H. EN BANC PETITIONS AND REHEARINGS
The court had 22 petitions for en banc rehearing pending at the beginning of the
court year and received 179 petitions for en banc rehearing during this court year, 19
fewer than the prior year (198). Parties requested en banc rehearing in 7.0% of the
cases with opinions. The court acted upon 186 petitions for en banc rehearing and 15
petitions remained pending at the end of the year. The court denied requests for
rehearing en banc in 175 cases, 11 of which were after a poll. The court granted eight
petitions for rehearing en banc by the parties. In two other cases, the court sua sponte
granted en banc rehearing. One petition for rehearing en banc was disposed of by
other means. See Enclosure D, page 31.
I. PETITIONS FOR CERTIORARI
The number of petitions filed is as follows:

26
Table 35 - Petitions for Certiorari
Petitions Filed 2016 2017 2018 2019 2020 2021
Criminal 440 349 304 259 251 324
U.S. Civil 56 59 67 83 75 68
Private Civil 238 194 244 282 227 180
Administrative Appeals 5 12 11 10 11 23
TOTAL 739 614 626 634 564 595
Opinions Rendered 3136 2995 2836 2870 2808 2554
% of Petitions filed to
Opinions 23.6 20.5 22.1 28.7 20.1 23.3
Table 36 - Petitions for Certiorari by Graph
The Supreme Court took action on 590 cases from our Court compared with 594
last year. The Court granted 41 petitions, 22 more than last year, or 6.9% of the
total. (For additional information, see Enclosure E, page 32.)
23.6 20.5 22.128.7
20.1 23.3
05
101520253035
2016 2017 2018 2019 2020 2021
P
E
R
C
E
N
T
A
G
E
Percentage of Petitions Filed to Opinions
27
J. ADMINISTRATIVE-INTERIM MOTIONS
The administrative-interim motions increased to 3606 from 3383 last year, to an
average of 212 initiating actions per active judge. When panel matters are
considered, each judge acted on 808 such motions, down from 961 last year. See
Enclosure F, page 33, for other details.

Table of New Appeals Docketed by Case Type as of 6/30/2021
(a) (b) (c) (d)
MO. % CUMULATIVE % 2019 2020
Jul Aug Sep Oct Nov Dec Jan Feb Mar Apr May Jun CASE TYPE 2020-2021 19-20 20-21 2020 2021
CRIMINAL CASES 33.16% 29.59% 31.29% 1,951 1,987 163 156 181 135 135 140 104
171
172 209 221 180 191
PRISONER CASES
w/counsel 1.04% 2.38% 2.20% 157 140 17 10 17 15 14 9 7 14 13 12 6 6
w/o counsel 27.43% 22.00% 22.25% 1,451 1,413 114 98 104 111 114 111 98 101 150 136 118 158
Succ Habeas 4.69% 8.70% 5.04% 574 320 23 38 28 31 19 29 21
46
25 40 27 12 27
Non-Pd Mandamus 3.13% 1.84% 2.06% 121 131 15 11 13 10 9 5 12 2
9 10 12 7 18
SUB-TOTAL 69.44% 64.51% 62.84% 4,254 3,991 332 313 343 302 291 294 242 325
321 422 408 323 400
CIVIL
Private Civil 10.24% 11.68% 10.88% 770 691 38 60 56 63 56 73 49
58
51 57 72 57 59
Diversity 4.86% 5.82% 5.50% 384 349 17 19 20 37 31 52 20 32
28 26 35 36 28
Fed. Quest. 5.38% 5.85% 5.38% 386 342 21 41 36 26 25 21 29 26
23 31 37 21 31
U.S. CIVIL 1.74% 1.30% 1.59% 86 101 16 3 8 6 6 8 5 5
9 12 11 7 10
Tax 0.17% 0.09% 0.16% 6 10 0 0 1 0 1 1 0
0
2 1 2 1 1
Tax Court 0.00% 0.23% 0.16% 15 10 0 2 0 1 2 0 1
4
1 1 1 1 0
Bankruptcy 0.87% 1.15% 1.35% 76 86 8 9 1 6 16 4 7 3
7 7 9 7 5
BIA 7.64% 9.49% 12.94% 626 822 93 80 62 76 86 87 39
4
4
65 64 71 55 44
Other Agency 0.35% 0.58% 0.85% 38 54 7 4 4 3 6 4 3 0
5 5 8 3 2
Civil Rights 7.29% 9.40% 7.38% 620 469 74 51 48 34 25 22 33 40
41 52 46 45 42
Soc. Security 0.17% 0.32% 0.50% 21 32 3 3 3 3 7 2 2 1
0 4 0 4 1
Mandamus 0.52% 0.45% 0.44% 30 28 7 0 1 1 1 2 2
3
3 4 2 2 3
Miscellaneous 1.56% 0.79% 0.90% 52 57 3 6 1 5 4 5 5 5
3 5 7 4 9
SUB-TOTAL 30.56% 35.49% 37.16% 2,340 2,360 205 218 185 198 210 208 146 162
187 212 229 186 176
TOTAL APPEALS 100.00% 100.00% 100.00% 6,594 6,351 537 531 528 500 501 522 388
487
508 634 637 509 576
EN
CL
OS
UR
E
A
Legend:
Col: (a): Monthly Percentage Make-Up of the New Filings
(b): The Cumulative Percentage for the corresponding months in 19-20 compared with 20-21
(c): The Cumulative Total Filings for the corresponding months in 19-20
(d): The Cumulative Total for 20-21
28
7
EN
CL
OS
UR
E A

29
ENCLOSURE BWORKLOAD PER ACTIVE JUDGE
I. SUMMARY CALENDAR CASES*
(a) Opinions or dispositions as initiating
judge 47
(b) Participations in opinions or dispositions
of other panel members 94
(c) Sub-total summary calendar
cases 141
II. CONFERENCE CALENDAR CASES*
(a) Opinions or dispositions as
initiating judge 18
(b) Participations in opinions or dispositions of
other panel members 36
(c) Sub-total conference calendar
cases 54
III. HEARING CALENDAR AND OTHER CASES*
(a) Opinions or dispositions as
writing judge 49
(b) Participations in opinions or dispositions of
other panel members 98
(c) Sub-total oral argument
cases 147
IV. TOTAL OPINIONS (I(a), II(a), III (a))* 114
V. TOTAL PANEL (NON-OPINION)
PARTICIPATIONS (I(b), II(b), III (b))* 228
VI. TOTAL OPINIONS AND
PARTICIPATIONS (I(c), II(c), III (c))* 342
VII. PETITIONS FOR REHEARING EN BANC 186
VIII. ADMINISTRATIVE-INTERIM MATTERS
(a) Single Judge Matters 133
(b) Participation in panel matters
as initiating judge 225
(c) Participation in panel matters
of other panel members 450
(d) Sub-total administrative -
interim matters 808
IX. TOTAL MATTERS PARTICIPATED IN PER JUDGE 1336
* Based on figures of judges who participated in summary, hearing, and conference calendar for entire year.

30
ENCLOSURE C
SUMMARY OF SCREENING CLASSIFICATIONS BY CASE TYPE
PERIOD: July 1, 2020 to June 30, 2021
CASE TYPE I II III IV TOTAL % OF I AND II'S TO
TOTAL CASES
CRIMINAL DIRECT 349 547 120 0 1016 88.2
CRIMINAL NON-DIRECT 22 92 32 0 146 78.1
PRISONER CASES
HC-W 0 4 11 0 15 26.7
HC-W/O 3 22 5 0 30 83.3
1983-W 0 4 12 0 16 25.0
1983-W/O 5 58 26 0 89 70.8
O. Pris.-W 0 2 4 0 6 33.3
O. Pris. W/O 1 14 7 0 22 68.2
2255-W 1 10 8 0 19 57.9
2255-W/O 1 7 4 0 12 66.7
CIVIL
Diversity 2 41 136 0 179 24.0
Fed. Question 5 30 132 0 167 21.0
U.S. Civil 1 10 23 0 34 32.4
Tax 0 1 5 0 6 16.7
Bankruptcy 1 4 13 0 18 27.8
Civ. Rights 2 90 161 1 254 36.2
BIA 0 197 55 0 252 78.2
Tax Court 0 2 2 0 4 50.0
Other Agency 0 5 19 0 24 20.8
Social Security 0 6 6 0 12 50.0
Mandamus 0 0 0 0 0 0.0
TOTAL* 393 1146 781 1 2321 66.3
*Includes 365 Conference Calendar Cases.

31
ENCLOSURE D
PETITIONS FOR REHEARING EN BANC AND EN BANC GRANTED
7/1/2020 - 6/30/2021
TOTAL
TOTAL PENDING AS OF END OF PREVIOUS COURT YEAR 22
Petitions for Rehearing En Banc FILED this Year 179
Petitions for Rehearing En Banc DENIED 175
With Poll 11
Without Poll 164
En Banc GRANTED 10
On Petition With Oral Argument
7
On Petition Without Oral Argument
1
Sua Sponte En Banc With Oral Argument
2
Sua Sponte En Banc Without Oral Argument
0
Disposed of by Other Means 0 1
TOTAL PENDING AS OF 6/30/2021 15

32
ENCLOSURE E
PETITIONS FOR CERTIORARI
FILED, ACTED ON, AND PENDING
SUMMARY
PERIOD: JULY 1, 2020 - JUNE 30, 2021
TYPE OF DISPOSITION
TYPE
PENDING
6/30/2020
NUMBER
FILED GRANTED DENIED DISMISSED REMOVED
PENDING
6/30/2021
TOTAL 65 595 37 540 4 1 78
CRIM 27 324 17 304 0 0 30
USC 11 68 4 66 0 0 9
PRIV.
CIV. 26 180 10 157 4 1 34
ADM* 1 23 6 13 0 0 5
*Administrative appeals include Applications for Enforcement or Petitions for Review of orders of an administrative
board or agency.

MONTHLY REPORT OF ADMINISTRATIVE MOTIONS SUBMITTED TO JUDGES (FY 2021)
Motion to or for: July Aug Sept Oct Nov Dec Jan Feb Mar Apr May June TOTALS
Dismiss 43 23 29 33 32 36 27 23 34 36 27 46 389
Reinstate Appeal 1 1 3 0 1 2 1 2 2 3 1 7 24
Appointment of Counsel 8 6 2 11 7 7 5 6 8 9 7 9 85
Expedite Hearing, for Continuance, or Special
Assignment 1 2 7 2 1 1 3 3 0 2 0 0 22
Stay or for Injunction and/or Supersedeas Pending
Appeal 25 24 19 28 17 16 13 16 15 16 11 17 217
Supplement the Record 3 4 16 7 8 6 2 0 4 6 1 5 62
Strike Briefs, Designations for Printing, etc 4 3 0 1 1 3 1 1 0 2 1 2 19
Excess Pages in Brief 0 0 0 1 0 0 2 0 0 4 2 0 9
Bail Pending Appeal 1 1 2 0 1 1 1 1 1 2 2 0 13
Interlocutory Appeal (Sec. 1292(b)) 0 0 4 1 6 1 3 1 3 6 1 4 30
Jurisdiction 22 31 38 45 18 46 39 8 51 18 27 13 356
Withdraw as Counsel 10 5 3 7 3 4 4 5 9 7 30 23 110
Extensions of Time 21 18 20 18 36 26 23 13 30 29 19 33 286
Certificate of Appealability/Additional COA Issues 38 29 33 37 48 27 35 48 59 39 43 45 481
Leave to Appeal In Forma Pauperis 20 20 23 20 30 20 26 16 26 26 21 22 270
Issuance of COA and Leave to Appeal In Forma
Pauperis 10 11 10 14 8 3 6 14 19 20 13 8 136
Mandamus or Prohibition 17 5 9 6 1 4 5 15 8 8 4 8 90
Successive Petitions 29 26 20 22 26 26 13 18 25 29 17 19 270
Miscellaneous Motions 77 62 45 63 47 52 59 44 63 77 68 80 737
TOTALS 330 271 283 316 291 281 268 234 357 339 295 341 3,606
33
EN
CL
OS
UR
E F