united states and south america phone: · pdf fileunited states and south america outlook...
TRANSCRIPT
UNITED STATES AND SOUTH AMERICA OUTLOOK (FULL REPORT)
Tuesday, April 24, 2018
Phone: 312.638.0993 Toll Free: 866.475.7370 Email: [email protected] Website: www.tstorm.net
1
Copyright © 2006-2018 T-storm Weather®, LLC. The publisher and its agent or employees shall not be liable for any loss or damage suffered by any person as a result of reliance on any of the contents contained within these products, whether such loss or damage arises from negligence or misrepresentation or any act or omission of the publisher or its agents or employees.
return to page 1 return to page 1 return to page 1 return to page 1 return to page 1 return to page 1
Page 2 3 4
5+
Description Today's Normal Crop Phase Table
United States Discussion
South America Discussion
Supporting Pages
return to page 1 return to page 1 return to page 1
Page 2 3 4
5+
Description United States Discussion
South America Discussion
Today's Normal Crop Phase Table
Supporting Pages
return to page 1 return to page 1 return to page 1
Page 2
3
4
5+
Description United States Discussion
South America Discussion
Today's Normal Crop Phase Table
Supporting Pages
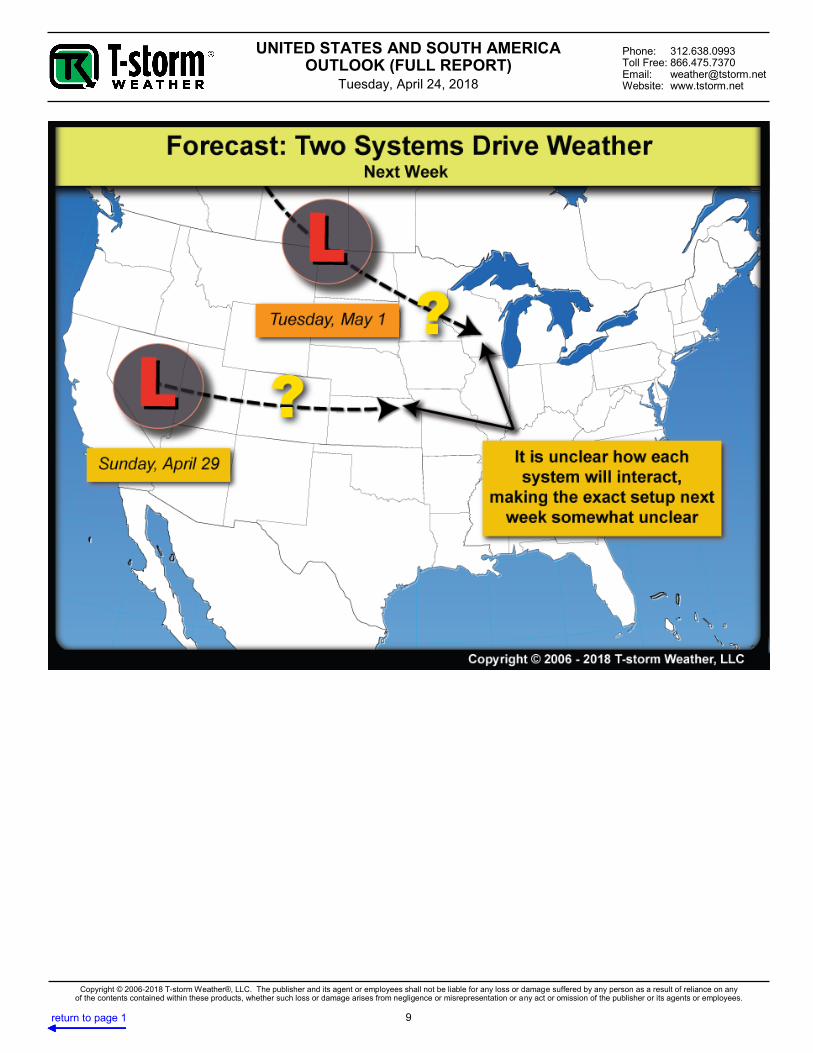
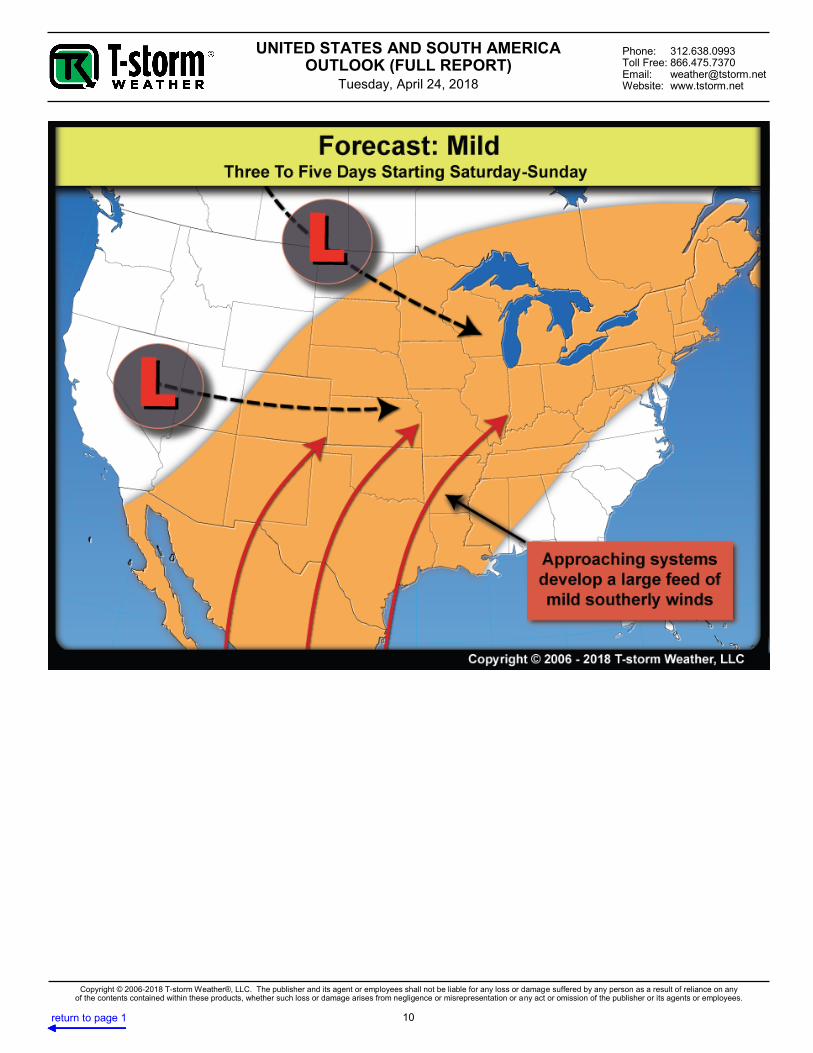
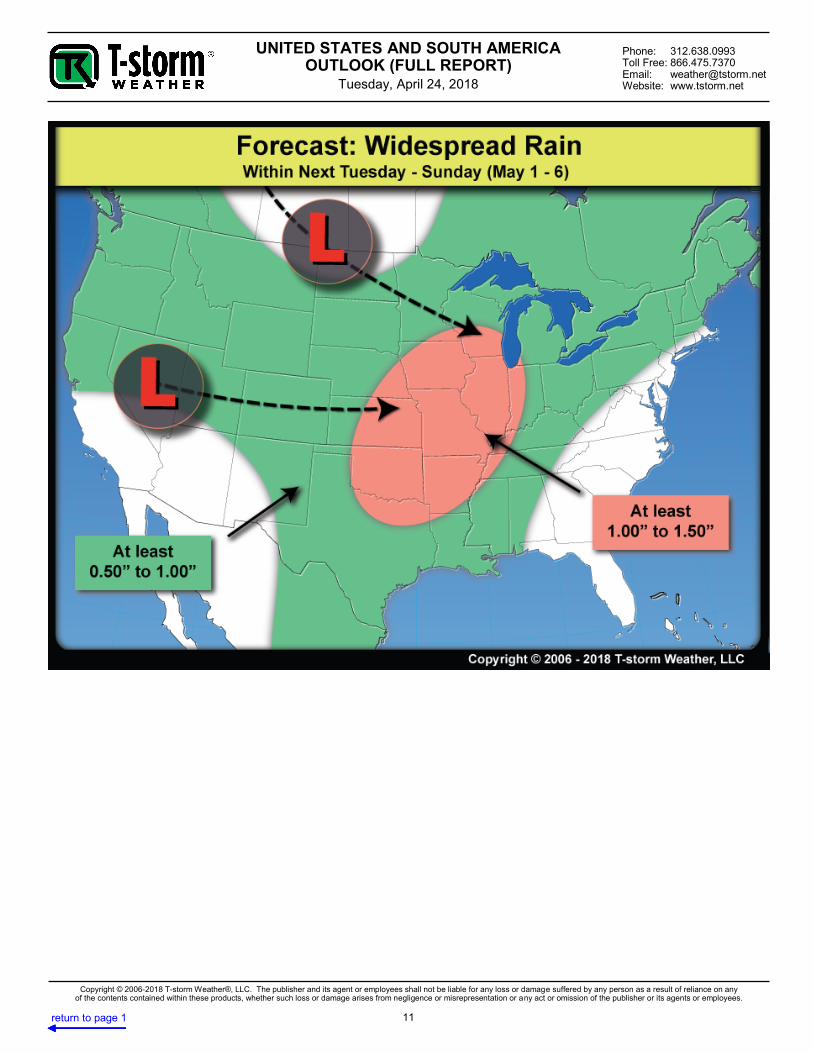
T-storm Weather® Summary The central U.S. remains cool into the weekend to produce the coldest April since 1907 or earlier in the Corn Belt, followed by three to five days of unseasonable warmth. Light to moderate rain precedes mildness in much of the Plains and Delta through Wed.-Thu., while most other areas will be fairly dry over the next week. Thereafter, rain is probable within a wide area next Tue.-Sun. (May 1-6) as a large system moves through a muggy air mass to break warmth, but the exact timing and amounts will take at least two days to determine. Elsewhere, rapid drying of second-crop corn is being monitored in Brazil, as is unfolding wetness in Argentina. T-storm Weather® Highlights
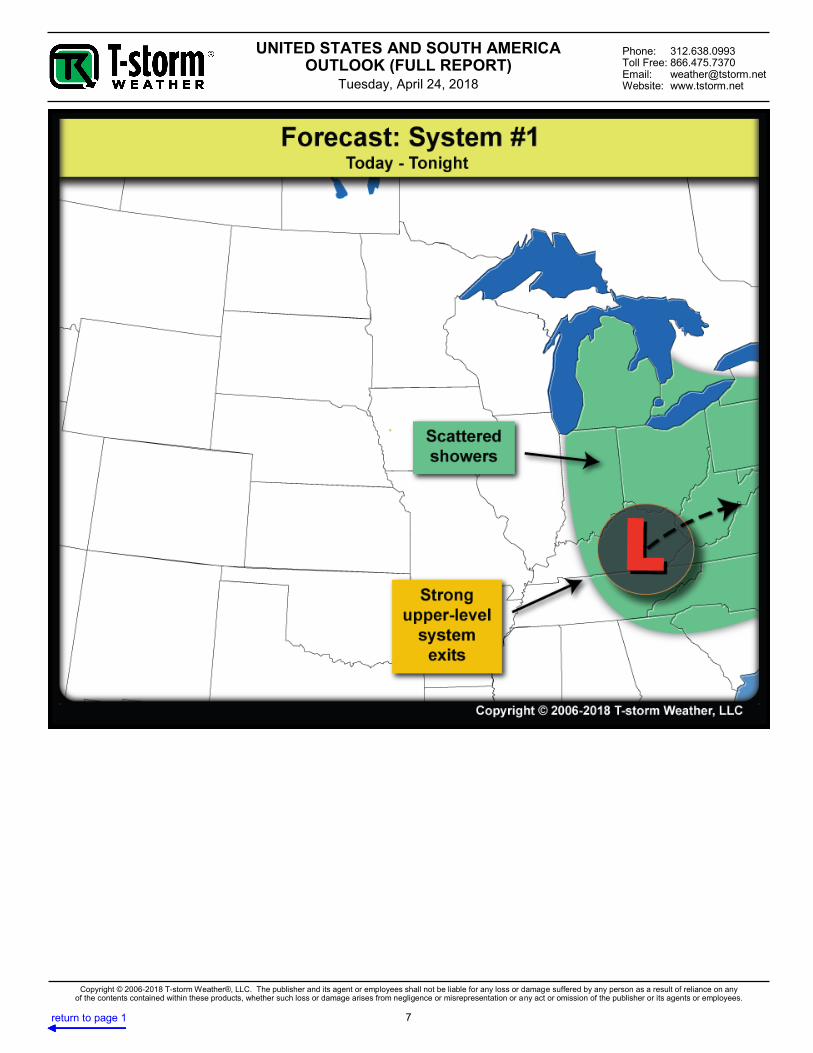
No change: showers linger today in the eastern Corn Belt.
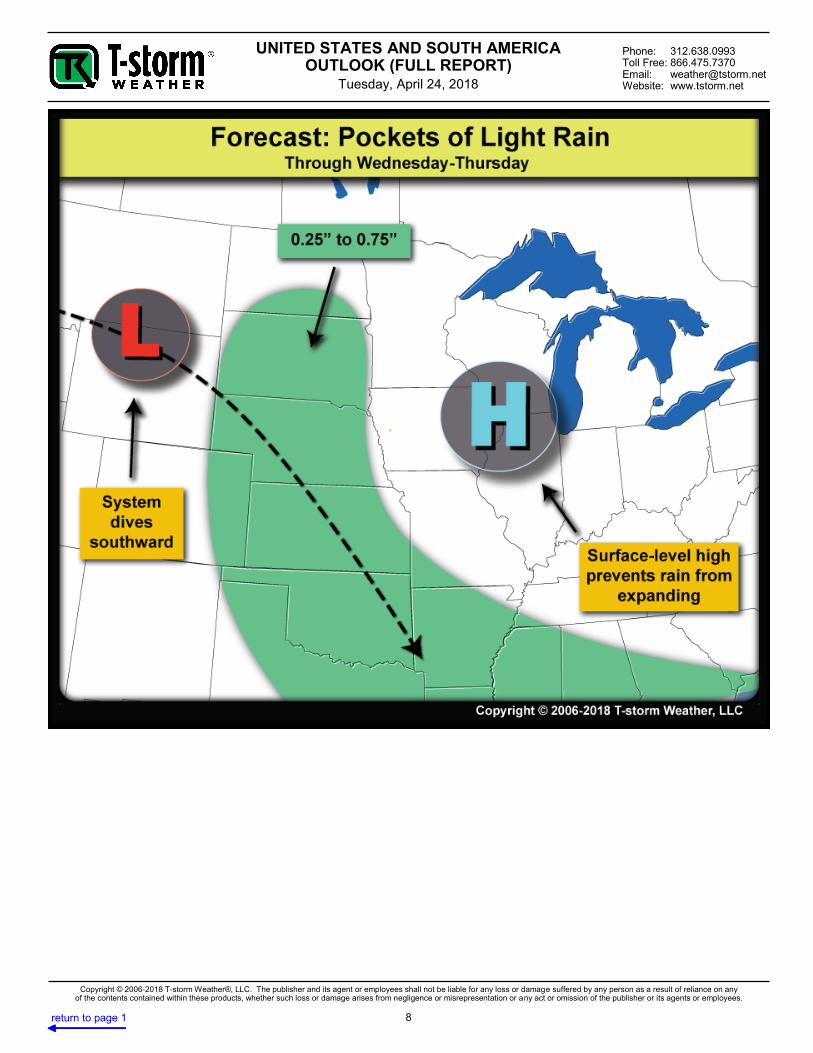
Slightly wetter: 0.25” to 0.75” of rain affects much of the Plains and Delta through Wed.-Thu.
No change: dry weather affects all of the central U.S. within Friday-Monday.
No change: 1.00” to 1.50” of rain affects much of the central U.S. within May 1-6.
No change: drying continues for at least 10 days in corn areas of Brazil, then some t-storms possible south.
No change: multiple rain events culminate in another 2.00” to 4.00” in Argentina over the next two weeks. Model Notes
None.
UNITED STATES AND SOUTH AMERICA OUTLOOK (FULL REPORT)
Tuesday, April 24, 2018
Phone: 312.638.0993 Toll Free: 866.475.7370 Email: [email protected] Website: www.tstorm.net
2
Copyright © 2006-2018 T-storm Weather®, LLC. The publisher and its agent or employees shall not be liable for any loss or damage suffered by any person as a result of reliance on any of the contents contained within these products, whether such loss or damage arises from negligence or misrepresentation or any act or omission of the publisher or its agents or employees.
return to page 1 return to page 1 return to page 1
UNIT
ED S
TATES DIS
CUSSIO
N
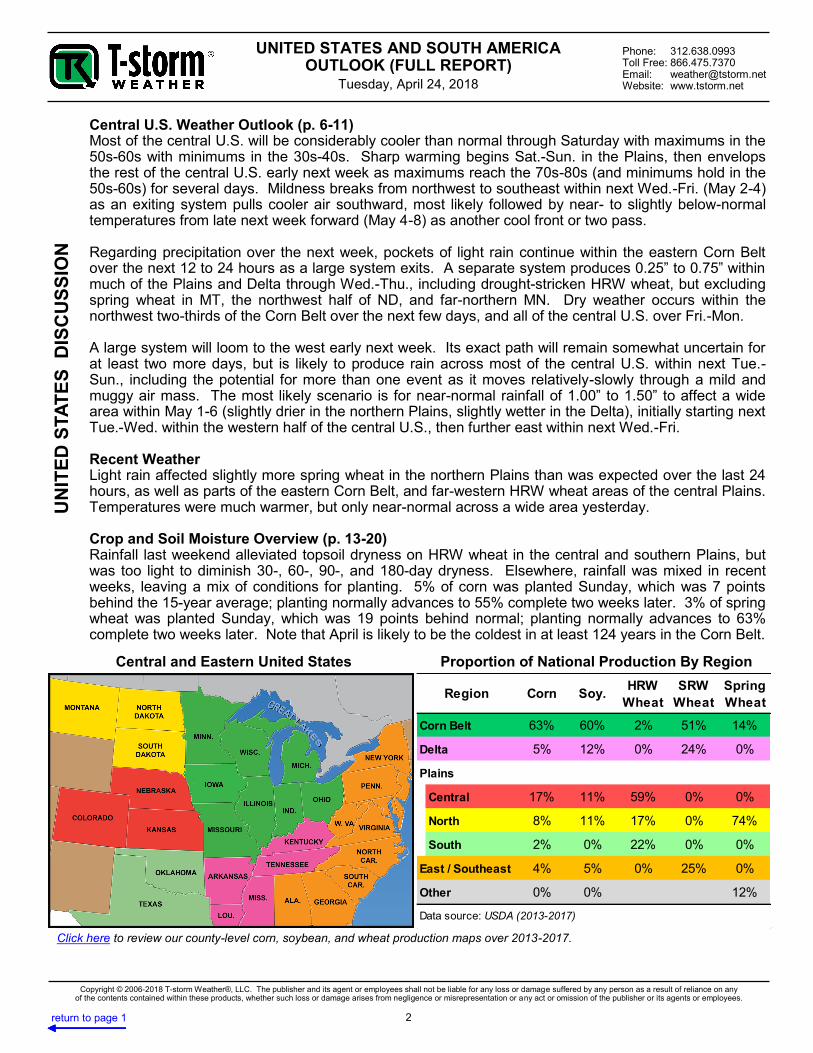
Central and Eastern United States Proportion of National Production By Region
Click here to review our county-level corn, soybean, and wheat production maps over 2013-2017.
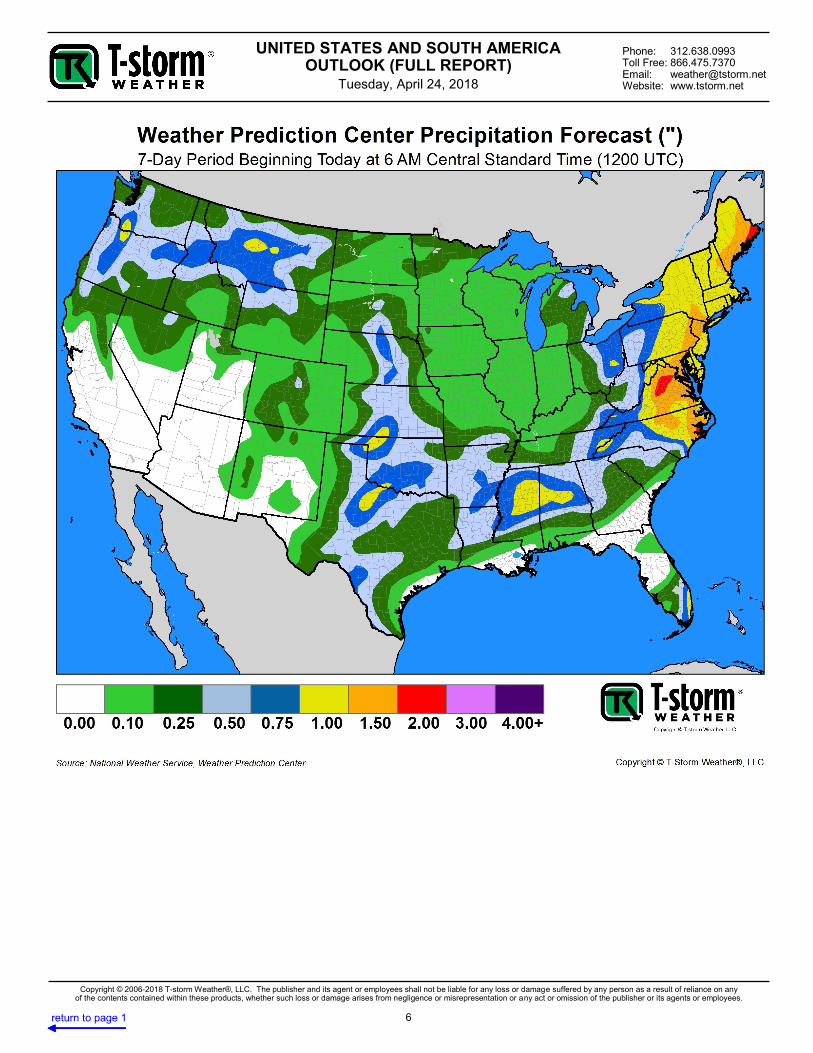
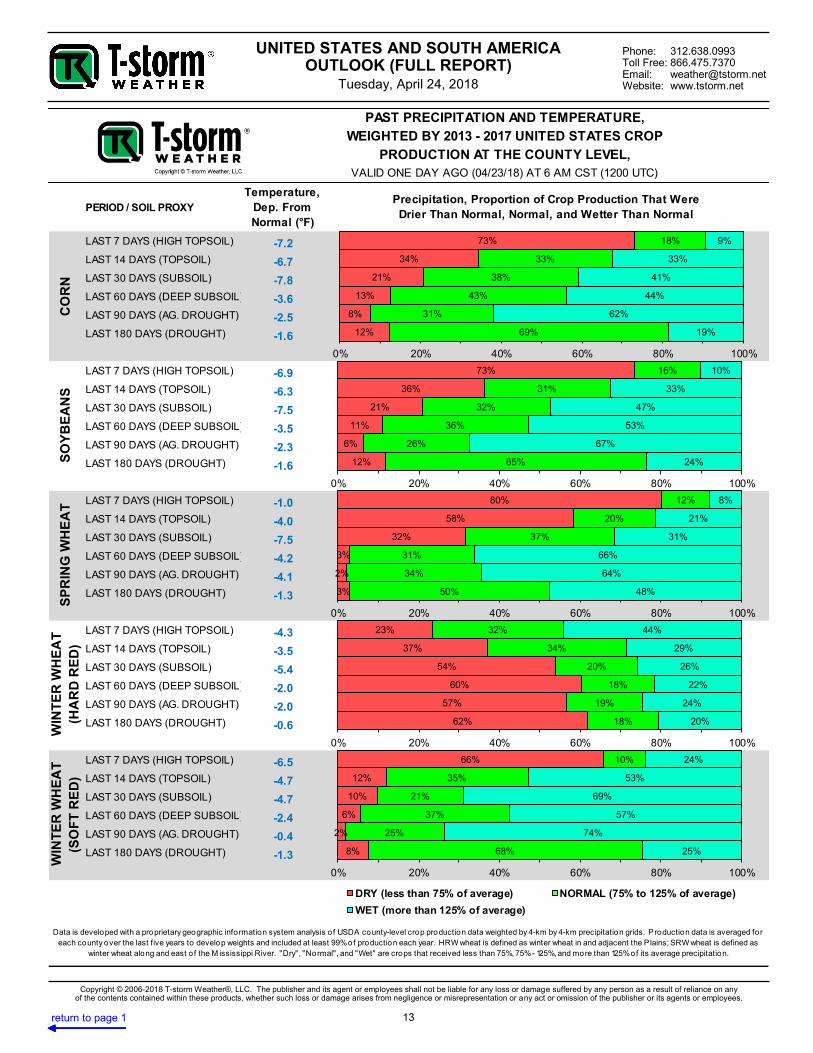
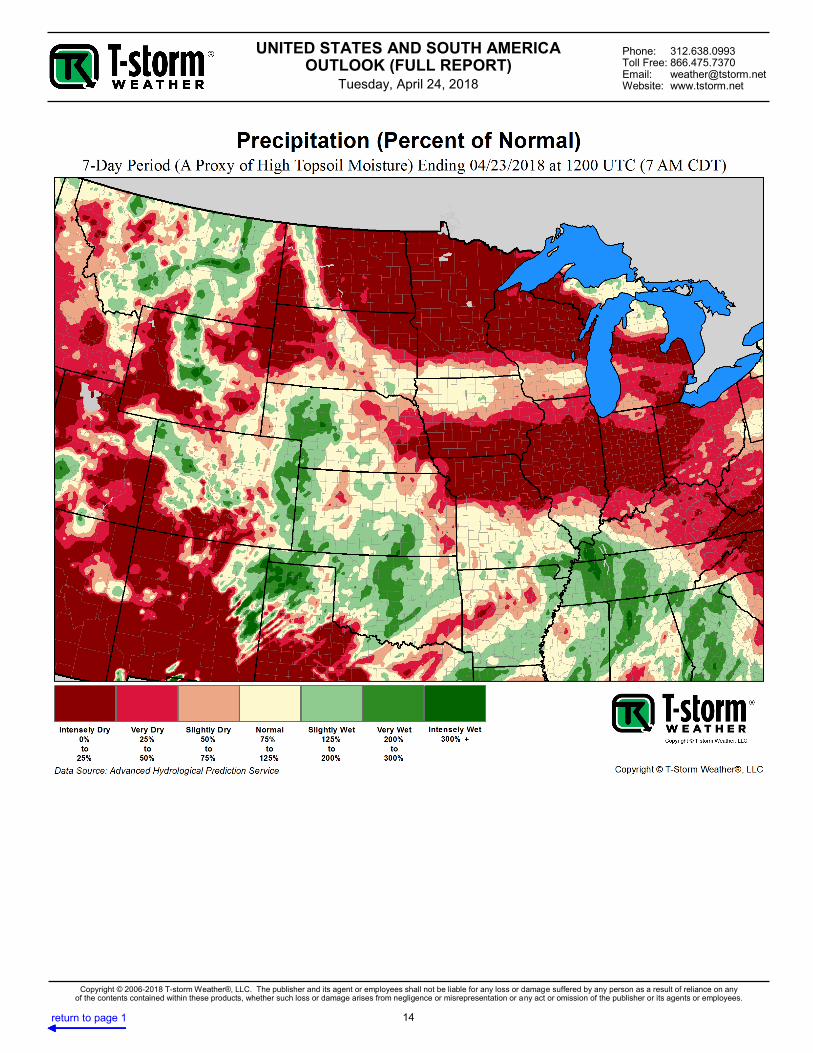
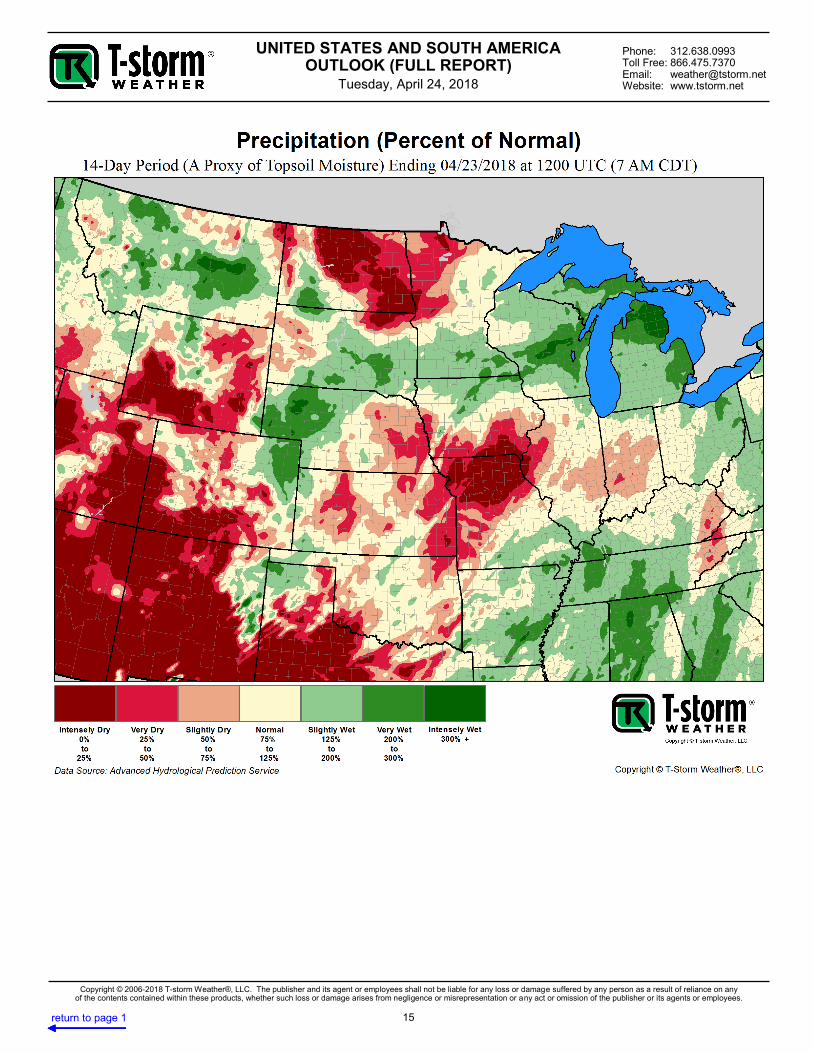
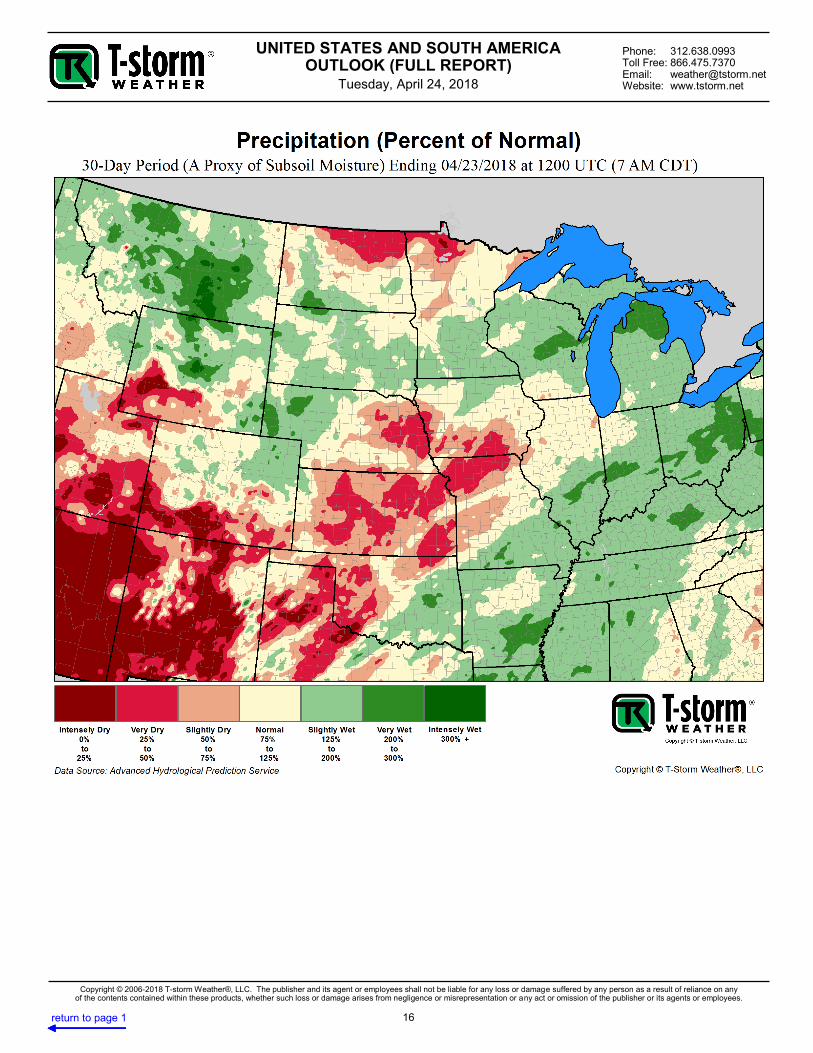
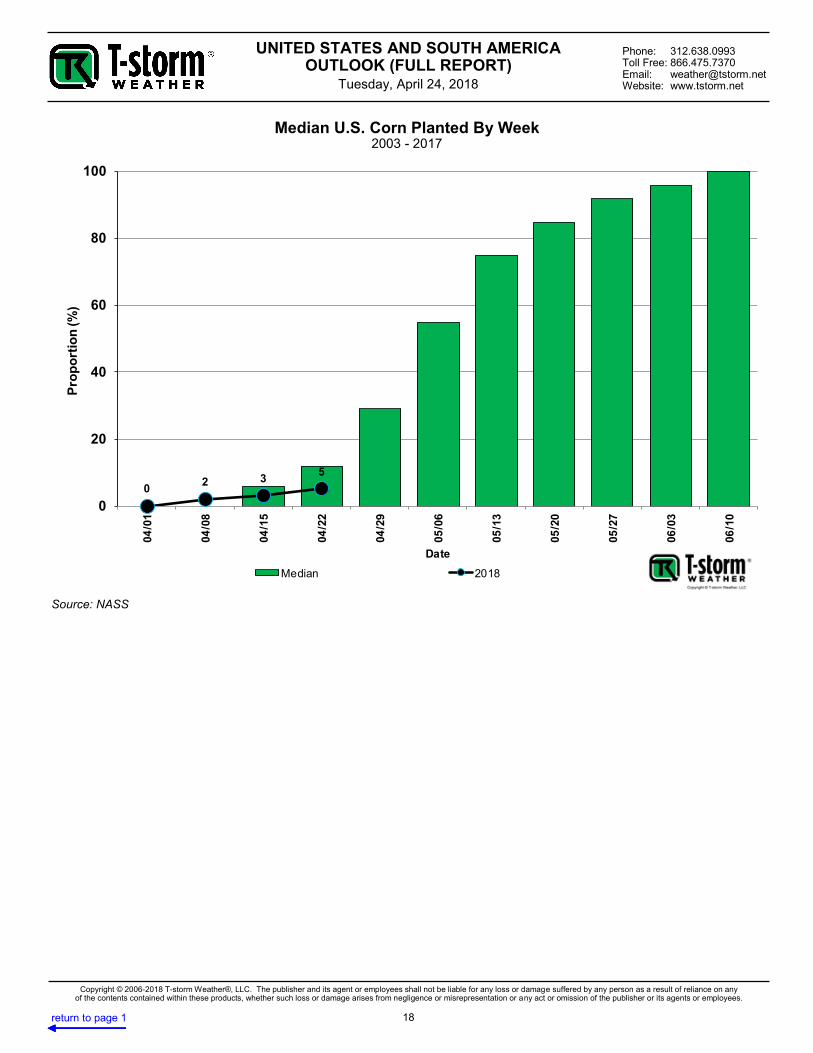
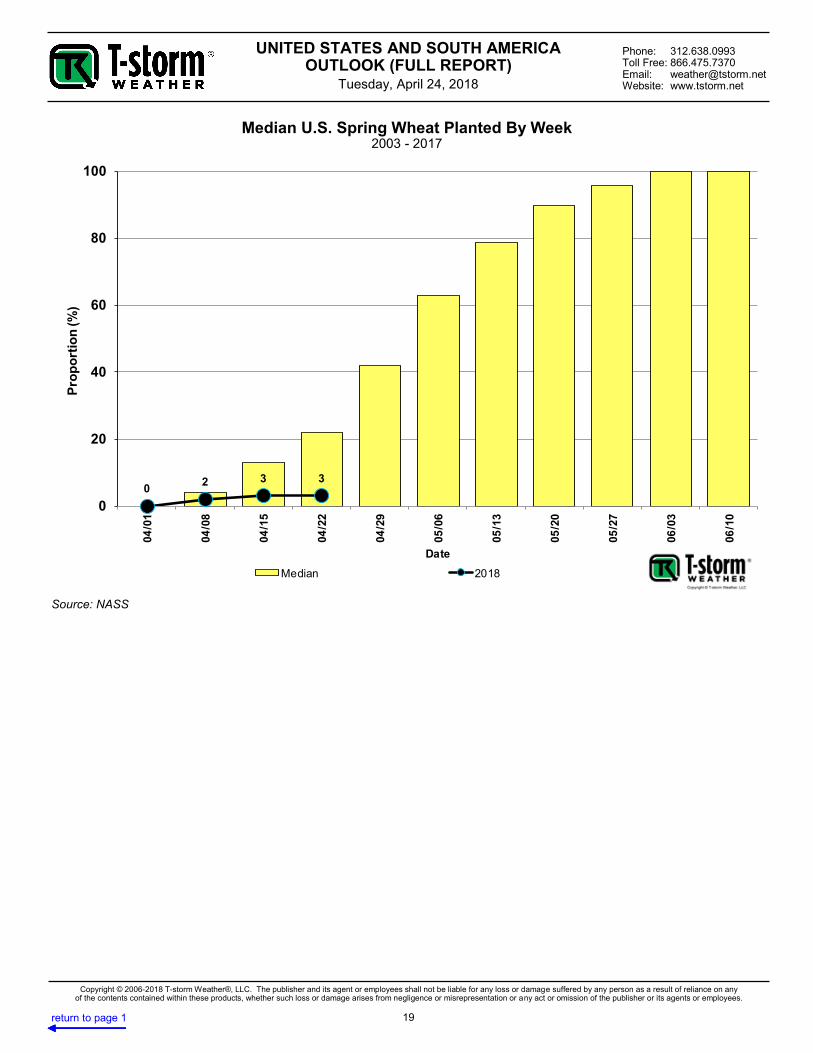
Central U.S. Weather Outlook (p. 6-11) Most of the central U.S. will be considerably cooler than normal through Saturday with maximums in the 50s-60s with minimums in the 30s-40s. Sharp warming begins Sat.-Sun. in the Plains, then envelops the rest of the central U.S. early next week as maximums reach the 70s-80s (and minimums hold in the 50s-60s) for several days. Mildness breaks from northwest to southeast within next Wed.-Fri. (May 2-4) as an exiting system pulls cooler air southward, most likely followed by near- to slightly below-normal temperatures from late next week forward (May 4-8) as another cool front or two pass. Regarding precipitation over the next week, pockets of light rain continue within the eastern Corn Belt over the next 12 to 24 hours as a large system exits. A separate system produces 0.25” to 0.75” within much of the Plains and Delta through Wed.-Thu., including drought-stricken HRW wheat, but excluding spring wheat in MT, the northwest half of ND, and far-northern MN. Dry weather occurs within the northwest two-thirds of the Corn Belt over the next few days, and all of the central U.S. over Fri.-Mon. A large system will loom to the west early next week. Its exact path will remain somewhat uncertain for at least two more days, but is likely to produce rain across most of the central U.S. within next Tue.-Sun., including the potential for more than one event as it moves relatively-slowly through a mild and muggy air mass. The most likely scenario is for near-normal rainfall of 1.00” to 1.50” to affect a wide area within May 1-6 (slightly drier in the northern Plains, slightly wetter in the Delta), initially starting next Tue.-Wed. within the western half of the central U.S., then further east within next Wed.-Fri. Recent Weather Light rain affected slightly more spring wheat in the northern Plains than was expected over the last 24 hours, as well as parts of the eastern Corn Belt, and far-western HRW wheat areas of the central Plains. Temperatures were much warmer, but only near-normal across a wide area yesterday. Crop and Soil Moisture Overview (p. 13-20) Rainfall last weekend alleviated topsoil dryness on HRW wheat in the central and southern Plains, but was too light to diminish 30-, 60-, 90-, and 180-day dryness. Elsewhere, rainfall was mixed in recent weeks, leaving a mix of conditions for planting. 5% of corn was planted Sunday, which was 7 points behind the 15-year average; planting normally advances to 55% complete two weeks later. 3% of spring wheat was planted Sunday, which was 19 points behind normal; planting normally advances to 63% complete two weeks later. Note that April is likely to be the coldest in at least 124 years in the Corn Belt.
Corn Soy.HRW
Wheat
SRW
Wheat
Spring
Wheat
Corn Belt 63% 60% 2% 51% 14%
Delta 5% 12% 0% 24% 0%
Plains
Central 17% 11% 59% 0% 0%
North 8% 11% 17% 0% 74%
South 2% 0% 22% 0% 0%
East / Southeast 4% 5% 0% 25% 0%
Other 0% 0% 12%
Region
Data source: USDA (2013-2017)
UNITED STATES AND SOUTH AMERICA OUTLOOK (FULL REPORT)
Tuesday, April 24, 2018
Phone: 312.638.0993 Toll Free: 866.475.7370 Email: [email protected] Website: www.tstorm.net
3
Copyright © 2006-2018 T-storm Weather®, LLC. The publisher and its agent or employees shall not be liable for any loss or damage suffered by any person as a result of reliance on any of the contents contained within these products, whether such loss or damage arises from negligence or misrepresentation or any act or omission of the publisher or its agents or employees.
return to page 1 return to page 1 return to page 1
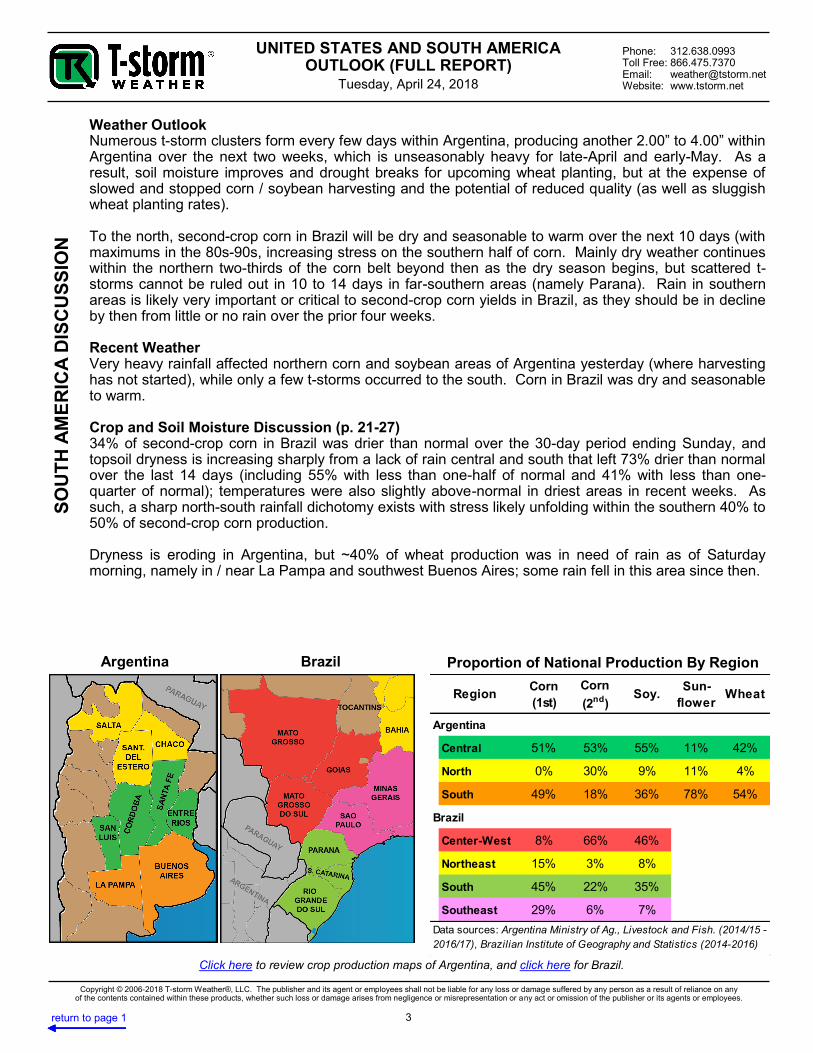
Argentina Brazil
SOUTH A
MERIC
A D
ISCUSSIO
N
Proportion of National Production By Region
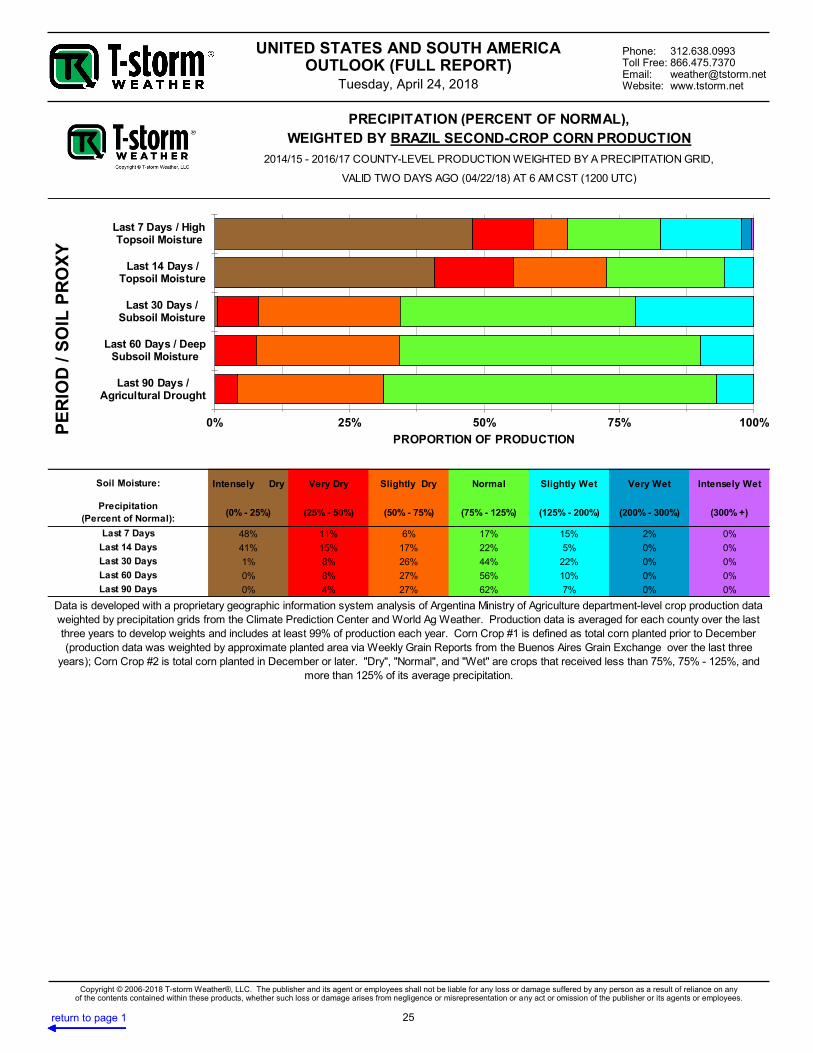
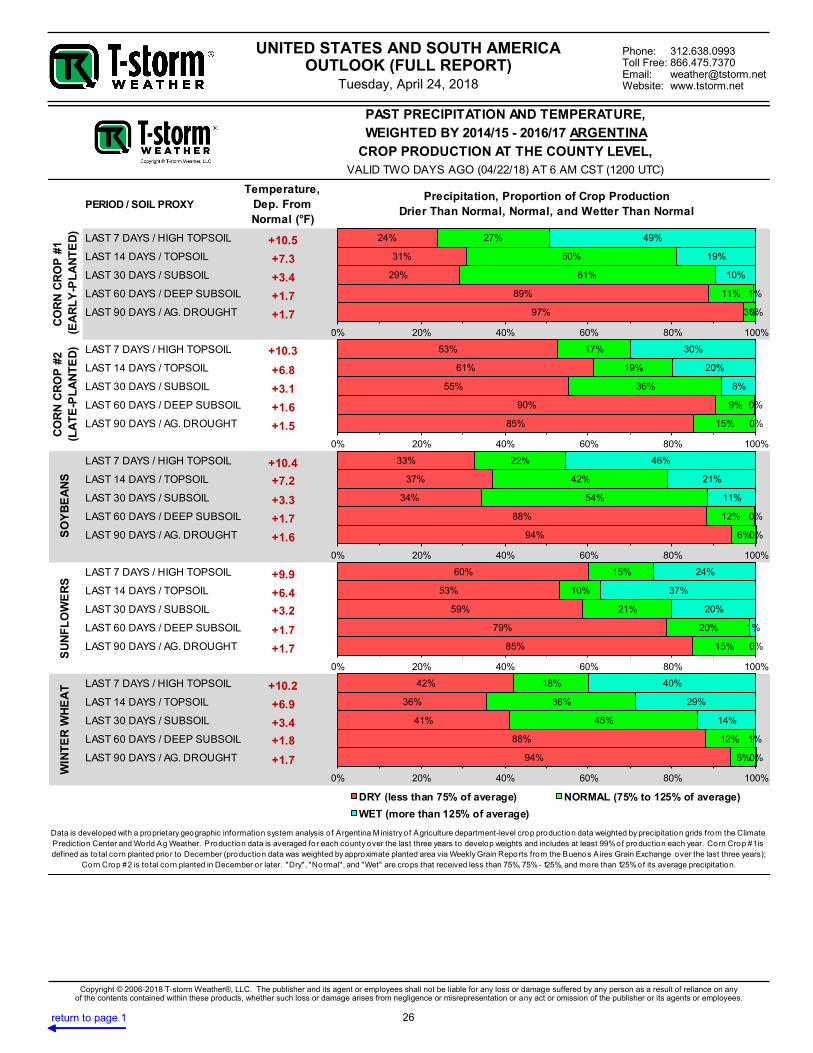
Weather Outlook Numerous t-storm clusters form every few days within Argentina, producing another 2.00” to 4.00” within Argentina over the next two weeks, which is unseasonably heavy for late-April and early-May. As a result, soil moisture improves and drought breaks for upcoming wheat planting, but at the expense of slowed and stopped corn / soybean harvesting and the potential of reduced quality (as well as sluggish wheat planting rates). To the north, second-crop corn in Brazil will be dry and seasonable to warm over the next 10 days (with maximums in the 80s-90s, increasing stress on the southern half of corn. Mainly dry weather continues within the northern two-thirds of the corn belt beyond then as the dry season begins, but scattered t-storms cannot be ruled out in 10 to 14 days in far-southern areas (namely Parana). Rain in southern areas is likely very important or critical to second-crop corn yields in Brazil, as they should be in decline by then from little or no rain over the prior four weeks. Recent Weather Very heavy rainfall affected northern corn and soybean areas of Argentina yesterday (where harvesting has not started), while only a few t-storms occurred to the south. Corn in Brazil was dry and seasonable to warm. Crop and Soil Moisture Discussion (p. 21-27) 34% of second-crop corn in Brazil was drier than normal over the 30-day period ending Sunday, and topsoil dryness is increasing sharply from a lack of rain central and south that left 73% drier than normal over the last 14 days (including 55% with less than one-half of normal and 41% with less than one-quarter of normal); temperatures were also slightly above-normal in driest areas in recent weeks. As such, a sharp north-south rainfall dichotomy exists with stress likely unfolding within the southern 40% to 50% of second-crop corn production. Dryness is eroding in Argentina, but ~40% of wheat production was in need of rain as of Saturday morning, namely in / near La Pampa and southwest Buenos Aires; some rain fell in this area since then.
Corn
(1st)
Corn
(2nd)Soy.
Sun-
flowerWheat
Argentina
Central 51% 53% 55% 11% 42%
North 0% 30% 9% 11% 4%
South 49% 18% 36% 78% 54%
Brazil
Center-West 8% 66% 46%
Northeast 15% 3% 8%
South 45% 22% 35%
Southeast 29% 6% 7%
Region
Data sources: Argentina Ministry of Ag., Livestock and Fish. (2014/15 -
2016/17), Brazilian Institute of Geography and Statistics (2014-2016)
Click here to review crop production maps of Argentina, and click here for Brazil.
UNITED STATES AND SOUTH AMERICA OUTLOOK (FULL REPORT)
Tuesday, April 24, 2018
Phone: 312.638.0993 Toll Free: 866.475.7370 Email: [email protected] Website: www.tstorm.net
4
Copyright © 2006-2018 T-storm Weather®, LLC. The publisher and its agent or employees shall not be liable for any loss or damage suffered by any person as a result of reliance on any of the contents contained within these products, whether such loss or damage arises from negligence or misrepresentation or any act or omission of the publisher or its agents or employees.
return to page 1 return to page 1 return to page 1
CropNormal Crop
PhaseCrop
Normal Crop
PhaseCrop
Normal Crop
Phase
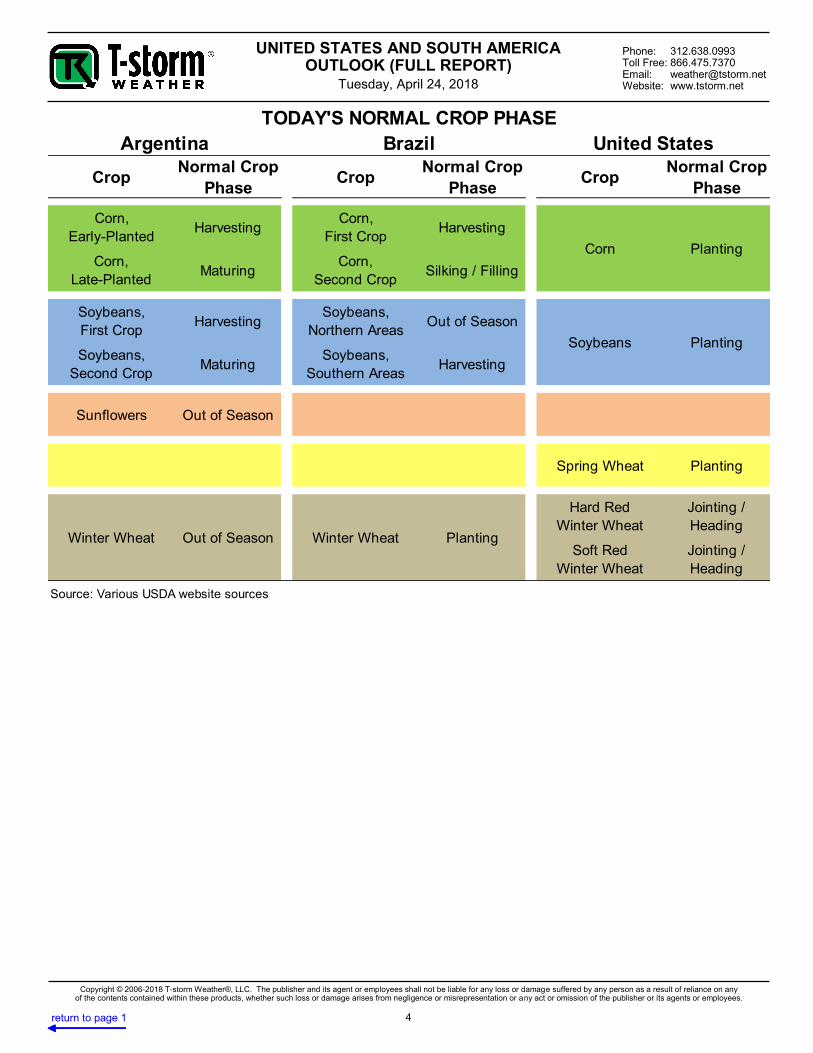
Corn,
Early-PlantedHarvesting
Corn,
First CropHarvesting
Corn,
Late-PlantedMaturing
Corn,
Second CropSilking / Filling
Soybeans,
First CropHarvesting
Soybeans,
Northern AreasOut of Season
Soybeans,
Second CropMaturing
Soybeans,
Southern AreasHarvesting
Sunflowers Out of Season
Spring Wheat Planting
Hard Red
Winter Wheat
Jointing /
Heading
Soft Red
Winter Wheat
Jointing /
Heading
Source: Various USDA website sources
Winter Wheat Out of Season Winter Wheat Planting
Soybeans Planting
TODAY'S NORMAL CROP PHASE
Argentina Brazil United States
Corn Planting
UNITED STATES AND SOUTH AMERICA OUTLOOK (FULL REPORT)
Tuesday, April 24, 2018
Phone: 312.638.0993 Toll Free: 866.475.7370 Email: [email protected] Website: www.tstorm.net
5
Copyright © 2006-2018 T-storm Weather®, LLC. The publisher and its agent or employees shall not be liable for any loss or damage suffered by any person as a result of reliance on any of the contents contained within these products, whether such loss or damage arises from negligence or misrepresentation or any act or omission of the publisher or its agents or employees.
return to page 1 return to page 1 return to page 1
United States forecast maps begin on the next page
UNITED STATES AND SOUTH AMERICA OUTLOOK (FULL REPORT)
Tuesday, April 24, 2018
Phone: 312.638.0993 Toll Free: 866.475.7370 Email: [email protected] Website: www.tstorm.net
6
Copyright © 2006-2018 T-storm Weather®, LLC. The publisher and its agent or employees shall not be liable for any loss or damage suffered by any person as a result of reliance on any of the contents contained within these products, whether such loss or damage arises from negligence or misrepresentation or any act or omission of the publisher or its agents or employees.
return to page 1 return to page 1 return to page 1
Chart not available today Chart not available today
UNITED STATES AND SOUTH AMERICA OUTLOOK (FULL REPORT)
Tuesday, April 24, 2018
Phone: 312.638.0993 Toll Free: 866.475.7370 Email: [email protected] Website: www.tstorm.net
7
Copyright © 2006-2018 T-storm Weather®, LLC. The publisher and its agent or employees shall not be liable for any loss or damage suffered by any person as a result of reliance on any of the contents contained within these products, whether such loss or damage arises from negligence or misrepresentation or any act or omission of the publisher or its agents or employees.
return to page 1 return to page 1 return to page 1
UNITED STATES AND SOUTH AMERICA OUTLOOK (FULL REPORT)
Tuesday, April 24, 2018
Phone: 312.638.0993 Toll Free: 866.475.7370 Email: [email protected] Website: www.tstorm.net
8
Copyright © 2006-2018 T-storm Weather®, LLC. The publisher and its agent or employees shall not be liable for any loss or damage suffered by any person as a result of reliance on any of the contents contained within these products, whether such loss or damage arises from negligence or misrepresentation or any act or omission of the publisher or its agents or employees.
return to page 1 return to page 1 return to page 1
UNITED STATES AND SOUTH AMERICA OUTLOOK (FULL REPORT)
Tuesday, April 24, 2018
Phone: 312.638.0993 Toll Free: 866.475.7370 Email: [email protected] Website: www.tstorm.net
9
Copyright © 2006-2018 T-storm Weather®, LLC. The publisher and its agent or employees shall not be liable for any loss or damage suffered by any person as a result of reliance on any of the contents contained within these products, whether such loss or damage arises from negligence or misrepresentation or any act or omission of the publisher or its agents or employees.
return to page 1 return to page 1 return to page 1
UNITED STATES AND SOUTH AMERICA OUTLOOK (FULL REPORT)
Tuesday, April 24, 2018
Phone: 312.638.0993 Toll Free: 866.475.7370 Email: [email protected] Website: www.tstorm.net
10
Copyright © 2006-2018 T-storm Weather®, LLC. The publisher and its agent or employees shall not be liable for any loss or damage suffered by any person as a result of reliance on any of the contents contained within these products, whether such loss or damage arises from negligence or misrepresentation or any act or omission of the publisher or its agents or employees.
return to page 1 return to page 1 return to page 1
UNITED STATES AND SOUTH AMERICA OUTLOOK (FULL REPORT)
Tuesday, April 24, 2018
Phone: 312.638.0993 Toll Free: 866.475.7370 Email: [email protected] Website: www.tstorm.net
11
Copyright © 2006-2018 T-storm Weather®, LLC. The publisher and its agent or employees shall not be liable for any loss or damage suffered by any person as a result of reliance on any of the contents contained within these products, whether such loss or damage arises from negligence or misrepresentation or any act or omission of the publisher or its agents or employees.
return to page 1 return to page 1 return to page 1
UNITED STATES AND SOUTH AMERICA OUTLOOK (FULL REPORT)
Tuesday, April 24, 2018
Phone: 312.638.0993 Toll Free: 866.475.7370 Email: [email protected] Website: www.tstorm.net
12
Copyright © 2006-2018 T-storm Weather®, LLC. The publisher and its agent or employees shall not be liable for any loss or damage suffered by any person as a result of reliance on any of the contents contained within these products, whether such loss or damage arises from negligence or misrepresentation or any act or omission of the publisher or its agents or employees.
return to page 1 return to page 1 return to page 1
United States supporting maps and charts
begin on the next page
UNITED STATES AND SOUTH AMERICA OUTLOOK (FULL REPORT)
Tuesday, April 24, 2018
Phone: 312.638.0993 Toll Free: 866.475.7370 Email: [email protected] Website: www.tstorm.net
13
Copyright © 2006-2018 T-storm Weather®, LLC. The publisher and its agent or employees shall not be liable for any loss or damage suffered by any person as a result of reliance on any of the contents contained within these products, whether such loss or damage arises from negligence or misrepresentation or any act or omission of the publisher or its agents or employees.
return to page 1 return to page 1 return to page 1
PERIOD / SOIL PROXY
Temperature,
Dep. From
Normal (°F)
-7.2
-6.7
-7.8
-3.6
-2.5
-1.6
-6.9
-6.3
-7.5
-3.5
-2.3
-1.6
-1.0
-4.0
-7.5
-4.2
-4.1
-1.3
-4.3
-3.5
-5.4
-2.0
-2.0
-0.6
-6.5
-4.7
-4.7
-2.4
-0.4
-1.3
PAST PRECIPITATION AND TEMPERATURE,
WEIGHTED BY 2013 - 2017 UNITED STATES CROP
PRODUCTION AT THE COUNTY LEVEL,
VALID ONE DAY AGO (04/23/18) AT 6 AM CST (1200 UTC)
Precipitation, Proportion of Crop Production That Were
Drier Than Normal, Normal, and Wetter Than Normal
LAST 90 DAYS (AG. DROUGHT)
LAST 180 DAYS (DROUGHT)
SO
YB
EA
NS
LAST 7 DAYS (HIGH TOPSOIL)
LAST 14 DAYS (TOPSOIL)
LAST 30 DAYS (SUBSOIL)
LAST 60 DAYS (DEEP SUBSOIL)
LAST 90 DAYS (AG. DROUGHT)
LAST 180 DAYS (DROUGHT)
CO
RN
LAST 7 DAYS (HIGH TOPSOIL)
LAST 14 DAYS (TOPSOIL)
LAST 30 DAYS (SUBSOIL)
LAST 60 DAYS (DEEP SUBSOIL)
SP
RIN
G W
HE
AT
LAST 7 DAYS (HIGH TOPSOIL)
LAST 14 DAYS (TOPSOIL)
LAST 30 DAYS (SUBSOIL)
LAST 60 DAYS (DEEP SUBSOIL)
LAST 90 DAYS (AG. DROUGHT)
LAST 180 DAYS (DROUGHT)
WIN
TE
R W
HE
AT
(HA
RD
RE
D)
LAST 7 DAYS (HIGH TOPSOIL)
LAST 14 DAYS (TOPSOIL)
LAST 30 DAYS (SUBSOIL)
LAST 60 DAYS (DEEP SUBSOIL)
LAST 90 DAYS (AG. DROUGHT)
LAST 180 DAYS (DROUGHT)
Data is developed with a proprietary geographic information system analysis o f USDA county-level crop production data weighted by 4-km by 4-km precipitation grids. Production data is averaged for
each county over the last five years to develop weights and included at least 99% of production each year. HRW wheat is defined as winter wheat in and adjacent the Plains; SRW wheat is defined as
winter wheat along and east o f the M ississippi River. "Dry", "Normal", and "Wet" are crops that received less than 75%, 75% - 125%, and more than 125% of its average precipitation.
WIN
TE
R W
HE
AT
(SO
FT
RE
D)
LAST 7 DAYS (HIGH TOPSOIL)
LAST 14 DAYS (TOPSOIL)
LAST 30 DAYS (SUBSOIL)
LAST 60 DAYS (DEEP SUBSOIL)
LAST 90 DAYS (AG. DROUGHT)
LAST 180 DAYS (DROUGHT)
12%
8%
13%
21%
34%
73%
69%
31%
43%
38%
33%
18%
19%
62%
44%
41%
33%
9%
0% 20% 40% 60% 80% 100%
0.1880483660.127477536 0.667293150.154458284
0.6685665250.472783898 0.0649148970.482994685
0.1433851090.3997385660.2677919520.362547031
SUBS…
DROU…
DRY (less than 75% of average) NORMAL (75% to 125% of average)
WET (more than 125% of average)
12%
6%
11%
21%
36%
73%
65%
26%
36%
32%
31%
16%
24%
67%
53%
47%
33%
10%
0% 20% 40% 60% 80% 100%
3%
2%
3%
32%
58%
80%
50%
34%
31%
37%
20%
12%
48%
64%
66%
31%
21%
8%
0% 20% 40% 60% 80% 100%
62%
57%
60%
54%
37%
23%
18%
19%
18%
20%
34%
32%
20%
24%
22%
26%
29%
44%
0% 20% 40% 60% 80% 100%
8%
2%
6%
10%
12%
66%
68%
25%
37%
21%
35%
10%
25%
74%
57%
69%
53%
24%
0% 20% 40% 60% 80% 100%
UNITED STATES AND SOUTH AMERICA OUTLOOK (FULL REPORT)
Tuesday, April 24, 2018
Phone: 312.638.0993 Toll Free: 866.475.7370 Email: [email protected] Website: www.tstorm.net
14
Copyright © 2006-2018 T-storm Weather®, LLC. The publisher and its agent or employees shall not be liable for any loss or damage suffered by any person as a result of reliance on any of the contents contained within these products, whether such loss or damage arises from negligence or misrepresentation or any act or omission of the publisher or its agents or employees.
return to page 1 return to page 1 return to page 1
UNITED STATES AND SOUTH AMERICA OUTLOOK (FULL REPORT)
Tuesday, April 24, 2018
Phone: 312.638.0993 Toll Free: 866.475.7370 Email: [email protected] Website: www.tstorm.net
15
Copyright © 2006-2018 T-storm Weather®, LLC. The publisher and its agent or employees shall not be liable for any loss or damage suffered by any person as a result of reliance on any of the contents contained within these products, whether such loss or damage arises from negligence or misrepresentation or any act or omission of the publisher or its agents or employees.
return to page 1 return to page 1 return to page 1
UNITED STATES AND SOUTH AMERICA OUTLOOK (FULL REPORT)
Tuesday, April 24, 2018
Phone: 312.638.0993 Toll Free: 866.475.7370 Email: [email protected] Website: www.tstorm.net
16
Copyright © 2006-2018 T-storm Weather®, LLC. The publisher and its agent or employees shall not be liable for any loss or damage suffered by any person as a result of reliance on any of the contents contained within these products, whether such loss or damage arises from negligence or misrepresentation or any act or omission of the publisher or its agents or employees.
return to page 1 return to page 1 return to page 1
UNITED STATES AND SOUTH AMERICA OUTLOOK (FULL REPORT)
Tuesday, April 24, 2018
Phone: 312.638.0993 Toll Free: 866.475.7370 Email: [email protected] Website: www.tstorm.net
17
Copyright © 2006-2018 T-storm Weather®, LLC. The publisher and its agent or employees shall not be liable for any loss or damage suffered by any person as a result of reliance on any of the contents contained within these products, whether such loss or damage arises from negligence or misrepresentation or any act or omission of the publisher or its agents or employees.
return to page 1 return to page 1 return to page 1
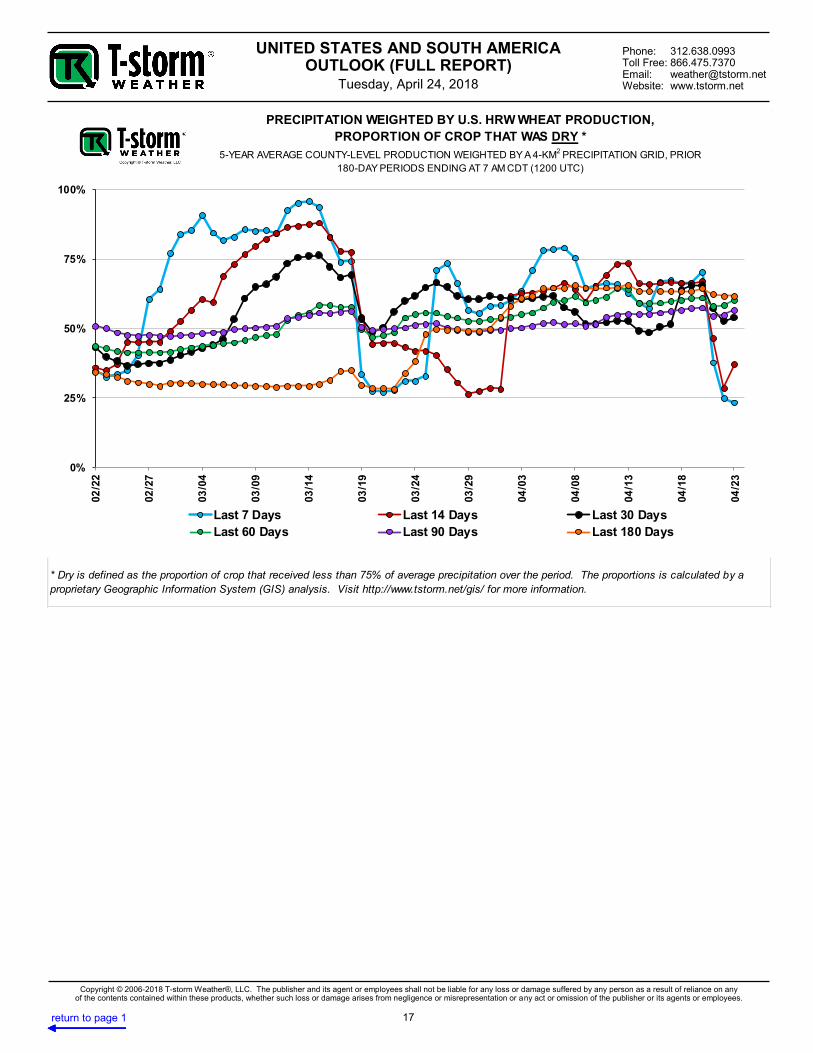
PRECIPITATION WEIGHTED BY U.S. HRW WHEAT PRODUCTION,
PROPORTION OF CROP THAT WAS DRY *
5-YEAR AVERAGE COUNTY-LEVEL PRODUCTION WEIGHTED BY A 4-KM2 PRECIPITATION GRID, PRIOR
180-DAY PERIODS ENDING AT 7 AM CDT (1200 UTC)
* Dry is defined as the proportion of crop that received less than 75% of average precipitation over the period. The proportions is calculated by a
proprietary Geographic Information System (GIS) analysis. Visit http://www.tstorm.net/gis/ for more information.
0%
25%
50%
75%
100%
02
/22
02
/27
03
/04
03
/09
03
/14
03
/19
03
/24
03
/29
04
/03
04
/08
04
/13
04
/18
04
/23
Last 7 Days Last 14 Days Last 30 Days
Last 60 Days Last 90 Days Last 180 Days
UNITED STATES AND SOUTH AMERICA OUTLOOK (FULL REPORT)
Tuesday, April 24, 2018
Phone: 312.638.0993 Toll Free: 866.475.7370 Email: [email protected] Website: www.tstorm.net
18
Copyright © 2006-2018 T-storm Weather®, LLC. The publisher and its agent or employees shall not be liable for any loss or damage suffered by any person as a result of reliance on any of the contents contained within these products, whether such loss or damage arises from negligence or misrepresentation or any act or omission of the publisher or its agents or employees.
return to page 1 return to page 1 return to page 1
Median U.S. Corn Planted By Week 2003 - 2017
Source: NASS
02 3
5
0
20
40
60
80
100
04
/01
04
/08
04
/15
04
/22
04
/29
05
/06
05
/13
05
/20
05
/27
06
/03
06
/10
Pro
po
rtio
n (%
)
Date
Median 2018
UNITED STATES AND SOUTH AMERICA OUTLOOK (FULL REPORT)
Tuesday, April 24, 2018
Phone: 312.638.0993 Toll Free: 866.475.7370 Email: [email protected] Website: www.tstorm.net
19
Copyright © 2006-2018 T-storm Weather®, LLC. The publisher and its agent or employees shall not be liable for any loss or damage suffered by any person as a result of reliance on any of the contents contained within these products, whether such loss or damage arises from negligence or misrepresentation or any act or omission of the publisher or its agents or employees.
return to page 1 return to page 1 return to page 1
Median U.S. Spring Wheat Planted By Week 2003 - 2017
Source: NASS
02 3 3
0
20
40
60
80
100
04
/01
04
/08
04
/15
04
/22
04
/29
05
/06
05
/13
05
/20
05
/27
06
/03
06
/10
Pro
po
rtio
n (%
)
Date
Median 2018
UNITED STATES AND SOUTH AMERICA OUTLOOK (FULL REPORT)
Tuesday, April 24, 2018
Phone: 312.638.0993 Toll Free: 866.475.7370 Email: [email protected] Website: www.tstorm.net
20
Copyright © 2006-2018 T-storm Weather®, LLC. The publisher and its agent or employees shall not be liable for any loss or damage suffered by any person as a result of reliance on any of the contents contained within these products, whether such loss or damage arises from negligence or misrepresentation or any act or omission of the publisher or its agents or employees.
return to page 1 return to page 1 return to page 1
-10.0
-8.0
-6.0
-4.0
-2.0
0.0
+2.0
190
7
192
0
195
0
190
4
196
1
198
3
192
8
195
3
193
6
192
6
199
7
190
9
197
5
195
1
191
8
198
2
201
3
194
4
196
6
195
6
193
5
191
7
199
5
199
6
197
9
194
0
193
9
199
3
191
6
194
7
191
1
192
3
189
8
193
7
190
5
196
2
200
7
190
2
198
4
197
2
De
pa
rtu
re F
rom
Ave
rag
e ( F
)
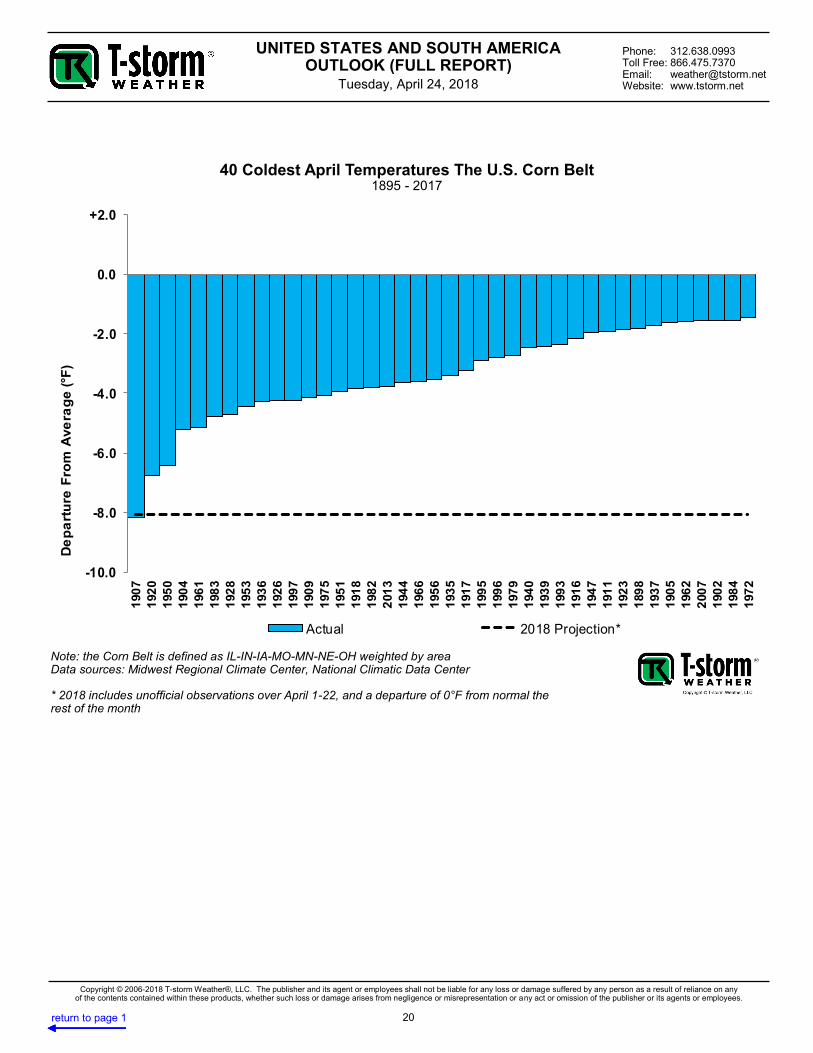
Actual 2018 Projection*
40 Coldest April Temperatures The U.S. Corn Belt 1895 - 2017
Note: the Corn Belt is defined as IL-IN-IA-MO-MN-NE-OH weighted by area Data sources: Midwest Regional Climate Center, National Climatic Data Center * 2018 includes unofficial observations over April 1-22, and a departure of 0°F from normal the rest of the month
UNITED STATES AND SOUTH AMERICA OUTLOOK (FULL REPORT)
Tuesday, April 24, 2018
Phone: 312.638.0993 Toll Free: 866.475.7370 Email: [email protected] Website: www.tstorm.net
21
Copyright © 2006-2018 T-storm Weather®, LLC. The publisher and its agent or employees shall not be liable for any loss or damage suffered by any person as a result of reliance on any of the contents contained within these products, whether such loss or damage arises from negligence or misrepresentation or any act or omission of the publisher or its agents or employees.
return to page 1 return to page 1 return to page 1
The South America section begins on the next page
UNITED STATES AND SOUTH AMERICA OUTLOOK (FULL REPORT)
Tuesday, April 24, 2018
Phone: 312.638.0993 Toll Free: 866.475.7370 Email: [email protected] Website: www.tstorm.net
22
Copyright © 2006-2018 T-storm Weather®, LLC. The publisher and its agent or employees shall not be liable for any loss or damage suffered by any person as a result of reliance on any of the contents contained within these products, whether such loss or damage arises from negligence or misrepresentation or any act or omission of the publisher or its agents or employees.
return to page 1 return to page 1 return to page 1
UNITED STATES AND SOUTH AMERICA OUTLOOK (FULL REPORT)
Tuesday, April 24, 2018
Phone: 312.638.0993 Toll Free: 866.475.7370 Email: [email protected] Website: www.tstorm.net
23
Copyright © 2006-2018 T-storm Weather®, LLC. The publisher and its agent or employees shall not be liable for any loss or damage suffered by any person as a result of reliance on any of the contents contained within these products, whether such loss or damage arises from negligence or misrepresentation or any act or omission of the publisher or its agents or employees.
return to page 1 return to page 1 return to page 1
UNITED STATES AND SOUTH AMERICA OUTLOOK (FULL REPORT)
Tuesday, April 24, 2018
Phone: 312.638.0993 Toll Free: 866.475.7370 Email: [email protected] Website: www.tstorm.net
24
Copyright © 2006-2018 T-storm Weather®, LLC. The publisher and its agent or employees shall not be liable for any loss or damage suffered by any person as a result of reliance on any of the contents contained within these products, whether such loss or damage arises from negligence or misrepresentation or any act or omission of the publisher or its agents or employees.
return to page 1 return to page 1 return to page 1
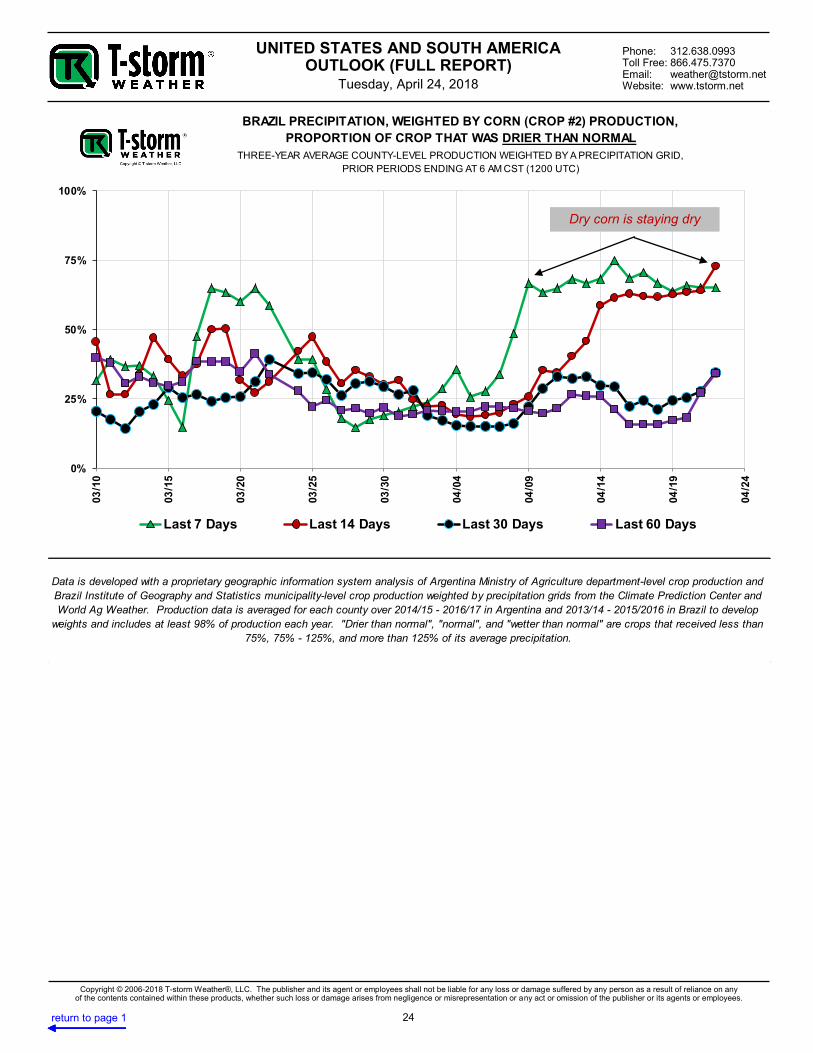
THREE-YEAR AVERAGE COUNTY-LEVEL PRODUCTION WEIGHTED BY A PRECIPITATION GRID,
PRIOR PERIODS ENDING AT 6 AM CST (1200 UTC)
Data is developed with a proprietary geographic information system analysis of Argentina Ministry of Agriculture department-level crop production and
Brazil Institute of Geography and Statistics municipality-level crop production weighted by precipitation grids from the Climate Prediction Center and
World Ag Weather. Production data is averaged for each county over 2014/15 - 2016/17 in Argentina and 2013/14 - 2015/2016 in Brazil to develop
weights and includes at least 98% of production each year. "Drier than normal", "normal", and "wetter than normal" are crops that received less than
75%, 75% - 125%, and more than 125% of its average precipitation.
BRAZIL PRECIPITATION, WEIGHTED BY CORN (CROP #2) PRODUCTION,
PROPORTION OF CROP THAT WAS DRIER THAN NORMAL
0%
25%
50%
75%
100%
03
/10
03
/15
03
/20
03
/25
03
/30
04
/04
04
/09
04
/14
04
/19
04
/24
Last 7 Days Last 14 Days Last 30 Days Last 60 Days
Dry corn is staying dry
UNITED STATES AND SOUTH AMERICA OUTLOOK (FULL REPORT)
Tuesday, April 24, 2018
Phone: 312.638.0993 Toll Free: 866.475.7370 Email: [email protected] Website: www.tstorm.net
25
Copyright © 2006-2018 T-storm Weather®, LLC. The publisher and its agent or employees shall not be liable for any loss or damage suffered by any person as a result of reliance on any of the contents contained within these products, whether such loss or damage arises from negligence or misrepresentation or any act or omission of the publisher or its agents or employees.
return to page 1 return to page 1 return to page 1
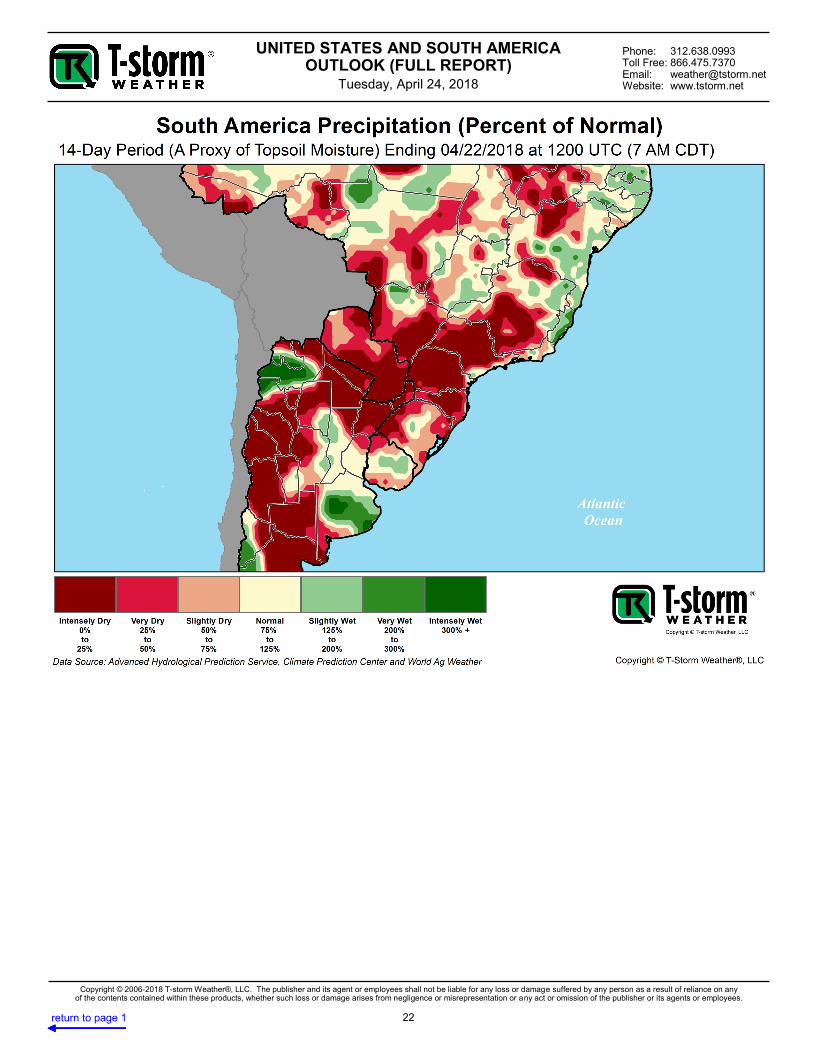
Intensely Dry Very Dry Slightly Dry Normal Slightly Wet Very Wet Intensely Wet
(0% - 25%) (25% - 50%) (50% - 75%) (75% - 125%) (125% - 200%) (200% - 300%) (300% +)
48% 11% 6% 17% 15% 2% 0%
41% 15% 17% 22% 5% 0% 0%
1% 8% 26% 44% 22% 0% 0%
0% 8% 27% 56% 10% 0% 0%
0% 4% 27% 62% 7% 0% 0%
Soil Moisture:
PRECIPITATION (PERCENT OF NORMAL),
WEIGHTED BY BRAZIL SECOND-CROP CORN PRODUCTION
2014/15 - 2016/17 COUNTY-LEVEL PRODUCTION WEIGHTED BY A PRECIPITATION GRID,
VALID TWO DAYS AGO (04/22/18) AT 6 AM CST (1200 UTC)
PE
RIO
D /
SO
IL P
RO
XY
Data is developed with a proprietary geographic information system analysis of Argentina Ministry of Agriculture department-level crop production data
weighted by precipitation grids from the Climate Prediction Center and World Ag Weather. Production data is averaged for each county over the last
three years to develop weights and includes at least 99% of production each year. Corn Crop #1 is defined as total corn planted prior to December
(production data was weighted by approximate planted area via Weekly Grain Reports from the Buenos Aires Grain Exchange over the last three
years); Corn Crop #2 is total corn planted in December or later. "Dry", "Normal", and "Wet" are crops that received less than 75%, 75% - 125%, and
more than 125% of its average precipitation.
Precipitation
(Percent of Normal):
Last 7 Days
Last 14 Days
Last 30 Days
Last 60 Days
Last 90 Days
0% 25% 50% 75% 100%
Last 90 Days /Agricultural Drought
Last 60 Days / DeepSubsoil Moisture
Last 30 Days /Subsoil Moisture
Last 14 Days /Topsoil Moisture
Last 7 Days / HighTopsoil Moisture
PROPORTION OF PRODUCTION
UNITED STATES AND SOUTH AMERICA OUTLOOK (FULL REPORT)
Tuesday, April 24, 2018
Phone: 312.638.0993 Toll Free: 866.475.7370 Email: [email protected] Website: www.tstorm.net
26
Copyright © 2006-2018 T-storm Weather®, LLC. The publisher and its agent or employees shall not be liable for any loss or damage suffered by any person as a result of reliance on any of the contents contained within these products, whether such loss or damage arises from negligence or misrepresentation or any act or omission of the publisher or its agents or employees.
return to page 1 return to page 1 return to page 1
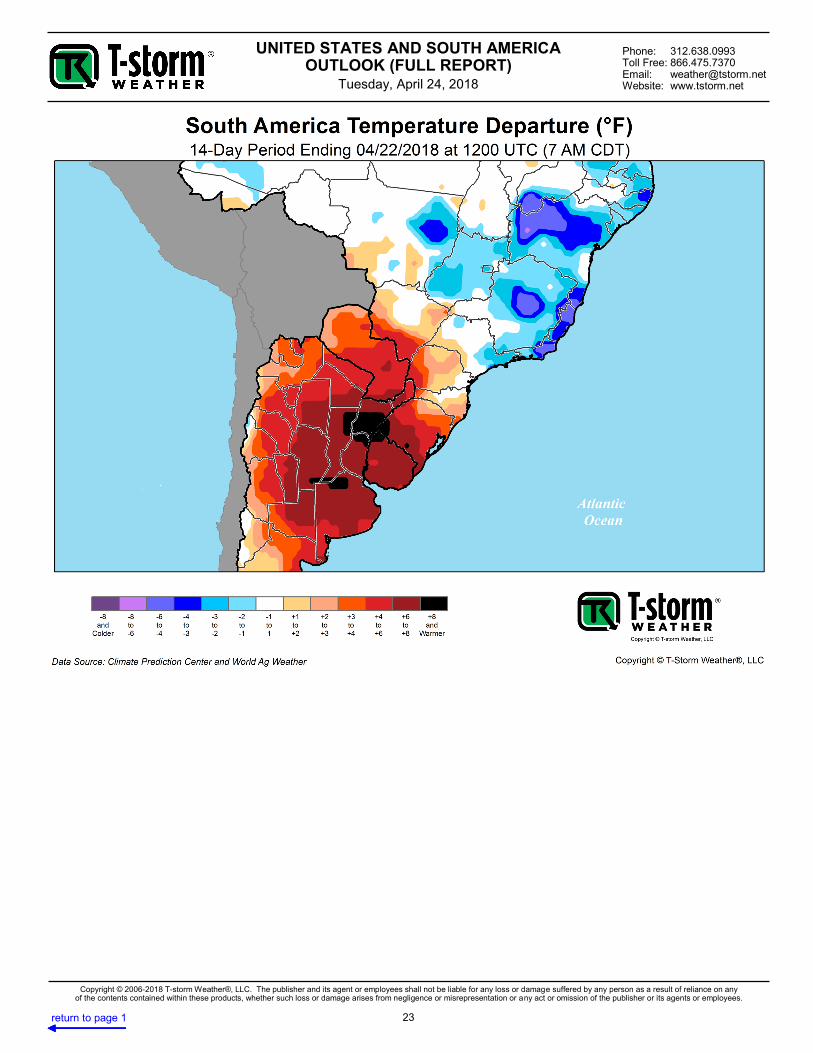
PERIOD / SOIL PROXY
Temperature,
Dep. From
Normal (°F)
+10.5
+7.3
+3.4
+1.7
+1.7
+10.3
+6.8
+3.1
+1.6
+1.5
+10.4
+7.2
+3.3
+1.7
+1.6
+9.9
+6.4
+3.2
+1.7
+1.7
+10.2
+6.9
+3.4
+1.8
+1.7
Data is developed with a proprietary geographic information system analysis o f Argentina M inistry o f Agriculture department-level crop production data weighted by precipitation grids from the Climate
Prediction Center and World Ag Weather. Production data is averaged for each county over the last three years to develop weights and includes at least 99% of production each year. Corn Crop #1 is
defined as to tal corn planted prior to December (production data was weighted by approximate planted area via Weekly Grain Reports from the Buenos Aires Grain Exchange over the last three years);
Corn Crop #2 is to tal corn planted in December or later. "Dry", "Normal", and "Wet" are crops that received less than 75%, 75% - 125%, and more than 125% of its average precipitation.
WIN
TE
R W
HE
AT LAST 7 DAYS / HIGH TOPSOIL
LAST 14 DAYS / TOPSOIL
LAST 30 DAYS / SUBSOIL
LAST 60 DAYS / DEEP SUBSOIL
LAST 90 DAYS / AG. DROUGHT
SU
NF
LO
WE
RS
LAST 7 DAYS / HIGH TOPSOIL
LAST 14 DAYS / TOPSOIL
LAST 30 DAYS / SUBSOIL
LAST 60 DAYS / DEEP SUBSOIL
LAST 90 DAYS / AG. DROUGHT
SO
YB
EA
NS
LAST 7 DAYS / HIGH TOPSOIL
LAST 14 DAYS / TOPSOIL
LAST 30 DAYS / SUBSOIL
LAST 60 DAYS / DEEP SUBSOIL
LAST 90 DAYS / AG. DROUGHT
LAST 90 DAYS / AG. DROUGHT
CO
RN
CR
OP
#2
(LA
TE
-PL
AN
TE
D) LAST 7 DAYS / HIGH TOPSOIL
LAST 14 DAYS / TOPSOIL
LAST 30 DAYS / SUBSOIL
LAST 60 DAYS / DEEP SUBSOIL
LAST 90 DAYS / AG. DROUGHT
CO
RN
CR
OP
#1
(EA
RL
Y-P
LA
NT
ED
)
LAST 7 DAYS / HIGH TOPSOIL
LAST 14 DAYS / TOPSOIL
LAST 30 DAYS / SUBSOIL
LAST 60 DAYS / DEEP SUBSOIL
PAST PRECIPITATION AND TEMPERATURE,
WEIGHTED BY 2014/15 - 2016/17 ARGENTINA
CROP PRODUCTION AT THE COUNTY LEVEL,
VALID TWO DAYS AGO (04/22/18) AT 6 AM CST (1200 UTC)
Precipitation, Proportion of Crop Production
Drier Than Normal, Normal, and Wetter Than Normal
0.1880483660.127477536 0.667293150.154458284
0.6685665250.472783898 0.0649148970.482994685
0.1433851090.3997385660.2677919520.362547031
SUBS…
DROU…
DRY (less than 75% of average) NORMAL (75% to 125% of average)
WET (more than 125% of average)
94%
88%
34%
37%
33%
6%
12%
54%
42%
22%
0%
0%
11%
21%
46%
0% 20% 40% 60% 80% 100%
94%
88%
41%
36%
42%
6%
12%
45%
36%
18%
0%
1%
14%
29%
40%
0% 20% 40% 60% 80% 100%
85%
90%
55%
61%
53%
15%
9%
36%
19%
17%
0%
0%
8%
20%
30%
0% 20% 40% 60% 80% 100%
85%
79%
59%
53%
60%
15%
20%
21%
10%
15%
0%
1%
20%
37%
24%
0% 20% 40% 60% 80% 100%
97%
89%
29%
31%
24%
3%
11%
61%
50%
27%
0%
1%
10%
19%
49%
0% 20% 40% 60% 80% 100%
UNITED STATES AND SOUTH AMERICA OUTLOOK (FULL REPORT)
Tuesday, April 24, 2018
Phone: 312.638.0993 Toll Free: 866.475.7370 Email: [email protected] Website: www.tstorm.net
27
Copyright © 2006-2018 T-storm Weather®, LLC. The publisher and its agent or employees shall not be liable for any loss or damage suffered by any person as a result of reliance on any of the contents contained within these products, whether such loss or damage arises from negligence or misrepresentation or any act or omission of the publisher or its agents or employees.
return to page 1 return to page 1 return to page 1
PERIOD / SOIL PROXY
Temperature,
Dep. From
Normal (°F)
0.0
+0.5
+0.5
+0.6
+0.2
+0.4
+0.8
+0.2
+1.0
+0.9
+0.7
+0.8
+0.4
+0.9
+0.6
-1.2
-0.1
+0.1
+0.9
+0.6
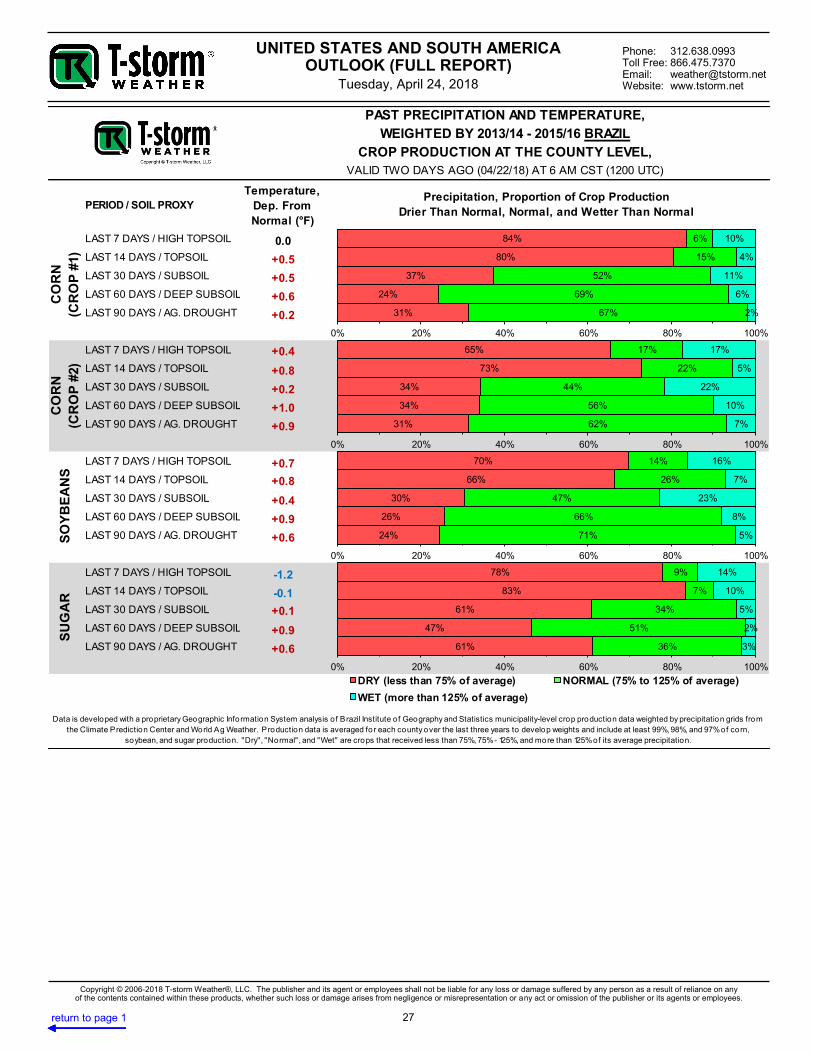
Data is developed with a proprietary Geographic Information System analysis o f Brazil Institute of Geography and Statistics municipality-level crop production data weighted by precipitation grids from
the Climate Prediction Center and World Ag Weather. Production data is averaged for each county over the last three years to develop weights and include at least 99%, 98%, and 97% of corn,
soybean, and sugar production. "Dry", "Normal", and "Wet" are crops that received less than 75%, 75% - 125%, and more than 125% of its average precipitation.
SU
GA
R
LAST 7 DAYS / HIGH TOPSOIL
LAST 14 DAYS / TOPSOIL
LAST 30 DAYS / SUBSOIL
LAST 60 DAYS / DEEP SUBSOIL
LAST 90 DAYS / AG. DROUGHT
SO
YB
EA
NS
LAST 7 DAYS / HIGH TOPSOIL
LAST 14 DAYS / TOPSOIL
LAST 30 DAYS / SUBSOIL
LAST 60 DAYS / DEEP SUBSOIL
LAST 90 DAYS / AG. DROUGHT
CO
RN
(CR
OP
#2)
LAST 7 DAYS / HIGH TOPSOIL
LAST 14 DAYS / TOPSOIL
LAST 30 DAYS / SUBSOIL
LAST 60 DAYS / DEEP SUBSOIL
LAST 90 DAYS / AG. DROUGHT
CO
RN
(CR
OP
#1)
LAST 7 DAYS / HIGH TOPSOIL
LAST 14 DAYS / TOPSOIL
LAST 30 DAYS / SUBSOIL
LAST 60 DAYS / DEEP SUBSOIL
LAST 90 DAYS / AG. DROUGHT
Precipitation, Proportion of Crop Production
Drier Than Normal, Normal, and Wetter Than Normal
PAST PRECIPITATION AND TEMPERATURE,
WEIGHTED BY 2013/14 - 2015/16 BRAZIL
CROP PRODUCTION AT THE COUNTY LEVEL,
VALID TWO DAYS AGO (04/22/18) AT 6 AM CST (1200 UTC)
0.1880483660.127477536 0.667293150.154458284
0.6685665250.472783898 0.0649148970.482994685
0.1433851090.3997385660.2677919520.362547031
SUBS…
DROU…
DRY (less than 75% of average) NORMAL (75% to 125% of average)
WET (more than 125% of average)
31%
24%
37%
80%
84%
67%
69%
52%
15%
6%
2%
6%
11%
4%
10%
0% 20% 40% 60% 80% 100%
31%
34%
34%
73%
65%
62%
56%
44%
22%
17%
7%
10%
22%
5%
17%
0% 20% 40% 60% 80% 100%
24%
26%
30%
66%
70%
71%
66%
47%
26%
14%
5%
8%
23%
7%
16%
0% 20% 40% 60% 80% 100%
61%
47%
61%
83%
78%
36%
51%
34%
7%
9%
3%
2%
5%
10%
14%
0% 20% 40% 60% 80% 100%