unit 6 a2 biology with stafford workbook answers new
DESCRIPTION
This is the marking scheme of the book A2 Biology unit six workbook! This will help the students to check the work they have done in the above book mentioned.TRANSCRIPT

Marking scheme for A2 Biology with Stafford, Unit Six Practical Workbook. Book available at http://www.amazon.com/gp/aw/s/ref=is_s_?k=AS+A2+Biology+with+stafford
A2 Biology with Stafford. Unit Six: Practical Workbook answers / Unit Six paper BIO8 Page 1
Marking schemes for
Advanced Level Biology
A2 Biology with Stafford Unit Six: Practical Workbook
Paper reference: 6BIO8
The book is available at the following link
http://www.amazon.com/gp/aw/s/ref=is_s_?k=AS+A2+Biology+with+stafford
A copy of this marking scheme and many other resources can be downloaded from the
following link
http://www.facebook.com/groups/biologywithstafford/

Marking scheme for A2 Biology with Stafford, Unit Six Practical Workbook. Book available at http://www.amazon.com/gp/aw/s/ref=is_s_?k=AS+A2+Biology+with+stafford
A2 Biology with Stafford. Unit Six: Practical Workbook answers / Unit Six paper BIO8 Page 2
Copyright © Stafford Valentine Redden
Unauthorized duplication contravenes applicable laws.
Typeset & layouts by : Mohamed Sobir
Cover designed by : Mohamed Sobir
Printed in Maldives by : Copier Repair
Published by : Author publisher
All rights reserved.
No part of this publication may be
Reproduced, stored in a database or
retrieval system, or transmitted in any
form or by any means, electronic,
mechanical, photocopying, recording,
or otherwise, without the prior
written permission of the author
ISBN: 978-81-910705-3-8
Any other queries on any aspect of the practical paper can be clarified on my FB group http://www.facebook.com/groups/biologywithstafford/
Cheers and all the best…. Stafford Valentine Redden (M.A; M.Sc.; M.Ed.; (Ph.D))
Head of Department (Biology)
Villa International School, Male’, Republic of Maldives
Email: [email protected]
Mobile: +960 7765507

Marking scheme for A2 Biology with Stafford, Unit Six Practical Workbook. Book available at http://www.amazon.com/gp/aw/s/ref=is_s_?k=AS+A2+Biology+with+stafford
A2 Biology with Stafford. Unit Six: Practical Workbook answers / Unit Six paper BIO8 Page 3
SAQ 1. a. Random Quadrat Sampling. This is because there are too many individuals to
count in the entire habitat. Random sampling will help to eliminate bias and provide a
good representation of the habitat. (3)
b. Survey the area to identify any plants that may contain toxic chemicals or irritants,
like stinging nettle. Make students aware of these plants and ask them to avoid contact
with such plants. Also look out for stinging animals, like centipedes, scorpions or bees.
Carry long forceps and gloves to handle such hazards. Protective clothing could also
help. Wearing shoes could help to prevent from cuts on the feet and legs from sharp stones
or thorns. (2)
c. Quadrat X is too small and will enclose only a very small number of plants , giving a
sample size that would be too small. Quadrat Z is too large for the area and very few
quadrats could be placed, without much overlap. At least 10 quadrats of size Y could be
placed into the habitat without any overlap and the quadrat Y is large enough to
enclose a sizeable number of plants. So, quadrat Y is most suitable. (3)
d. i. Tie two measuring tapes along the edges of the sampling area at right angles to each
other. Select pairs of random numbers and use it as coordinates to place the quadrat at
these randomly selected sites within the sampling area. (2)
ii. Grid on next page. Your results may differ.
Quadrat number Number of stars / quadrat Number of circles / quadrat
1 (2,10) 2 3 2 (4,9) 2 3 3 (2,7) 2 3 4 (6,7) 2 0 5 (2,5) 4 0 6 (4,5) 1 3 7 (6,7) 2 1 8 (5,4) 2 1 9 (3,3) 0 1 10(4,2) 1 1
Mean = 1.8 1.6
iii. Mean number of organisms / area of quadrat = 1.8 / 16cm 2 = 0.1125 stars per cm2 (2)

Marking scheme for A2 Biology with Stafford, Unit Six Practical Workbook. Book available at http://www.amazon.com/gp/aw/s/ref=is_s_?k=AS+A2+Biology+with+stafford
A2 Biology with Stafford. Unit Six: Practical Workbook answers / Unit Six paper BIO8 Page 4
[Total 15 marks]
Marking scheme for A2 Biology with Stafford, Unit Six Practical Workbook. Book available at http://www.amazon.com/gp/aw/s/ref=is_s_?k=AS+A2+Biology+with+stafford
A2 Biology with Stafford. Unit Six: Practical Workbook answers / Unit Six paper BIO8 Page 5
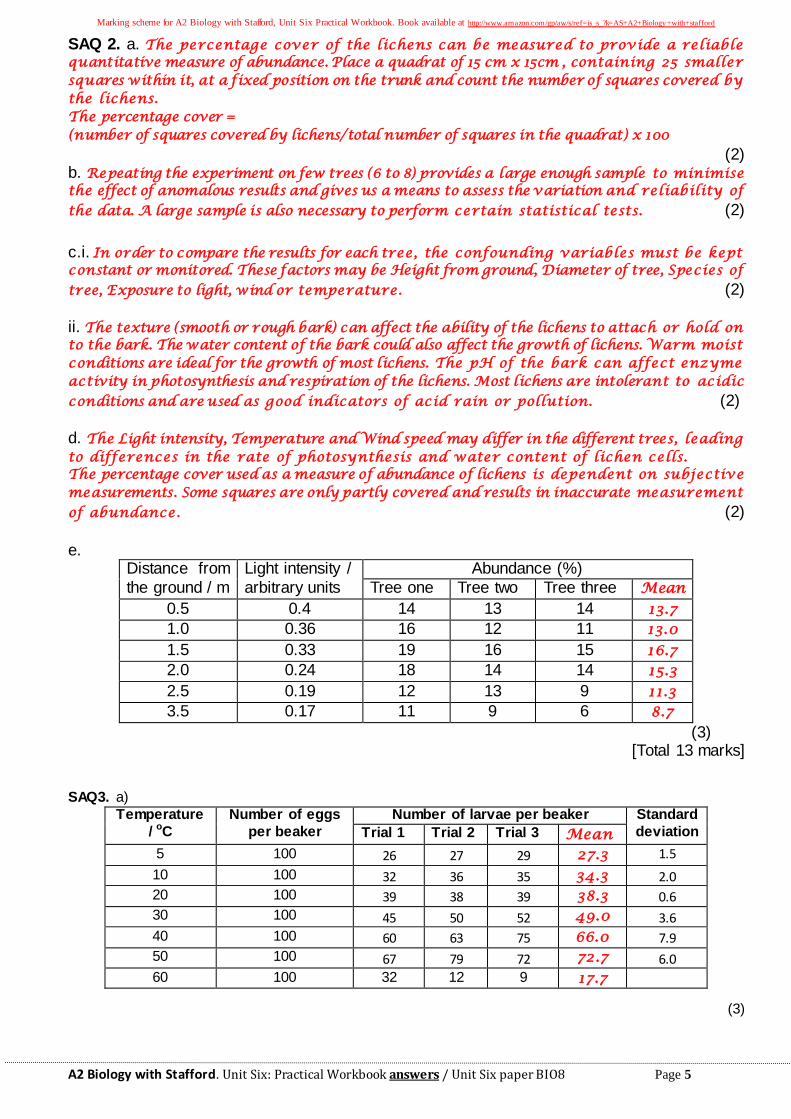
SAQ 2. a. The percentage cover of the lichens can be measured to provide a reliable quantitative measure of abundance. Place a quadrat of 15 cm x 15cm , containing 25 smaller squares within it, at a fixed position on the trunk and count the number of squares covered by the lichens. The percentage cover = (number of squares covered by lichens/total number of squares in the quadrat) x 100
(2) b. Repeating the experiment on few trees (6 to 8) provides a large enough sample to minimise the effect of anomalous results and gives us a means to assess the variation and reliability of
the data. A large sample is also necessary to perform certain statistical tests. (2)
c.i. In order to compare the results for each tree, the confounding variables must be kept constant or monitored. These factors may be Height from ground, Diameter of tree, Species of
tree, Exposure to light, wind or temperature. (2) ii. The texture (smooth or rough bark) can affect the ability of the lichens to attach or hold on to the bark. The water content of the bark could also affect the growth of lichens. Warm moist conditions are ideal for the growth of most lichens. The pH of the bark can affect enzyme activity in photosynthesis and respiration of the lichens. Most lichens are intolerant to acidic
conditions and are used as good indicators of acid rain or pollution. (2)
d. The Light intensity, Temperature and Wind speed may differ in the different trees, leading to differences in the rate of photosynthesis and water content of lichen cells. The percentage cover used as a measure of abundance of lichens is dependent on subjective measurements. Some squares are only partly covered and results in inaccurate measurement
of abundance. (2)
e. Distance from
the ground / m
Light intensity /
arbitrary units
Abundance (%)
Tree one Tree two Tree three Mean 0.5 0.4 14 13 14 13.7 1.0 0.36 16 12 11 13.0 1.5 0.33 19 16 15 16.7 2.0 0.24 18 14 14 15.3 2.5 0.19 12 13 9 11.3 3.5 0.17 11 9 6 8.7
(3) [Total 13 marks]
SAQ3. a)
Temperature
/ oC
Number of eggs
per beaker
Number of larvae per beaker Standard
deviation Trial 1 Trial 2 Trial 3 Mean 5 100 26 27 29 27.3 1.5
10 100 32 36 35 34.3 2.0
20 100 39 38 39 38.3 0.6
30 100 45 50 52 49.0 3.6
40 100 60 63 75 66.0 7.9
50 100 67 79 72 72.7 6.0
60 100 32 12 9 17.7
(3)
Marking scheme for A2 Biology with Stafford, Unit Six Practical Workbook. Book available at http://www.amazon.com/gp/aw/s/ref=is_s_?k=AS+A2+Biology+with+stafford
A2 Biology with Stafford. Unit Six: Practical Workbook answers / Unit Six paper BIO8 Page 6
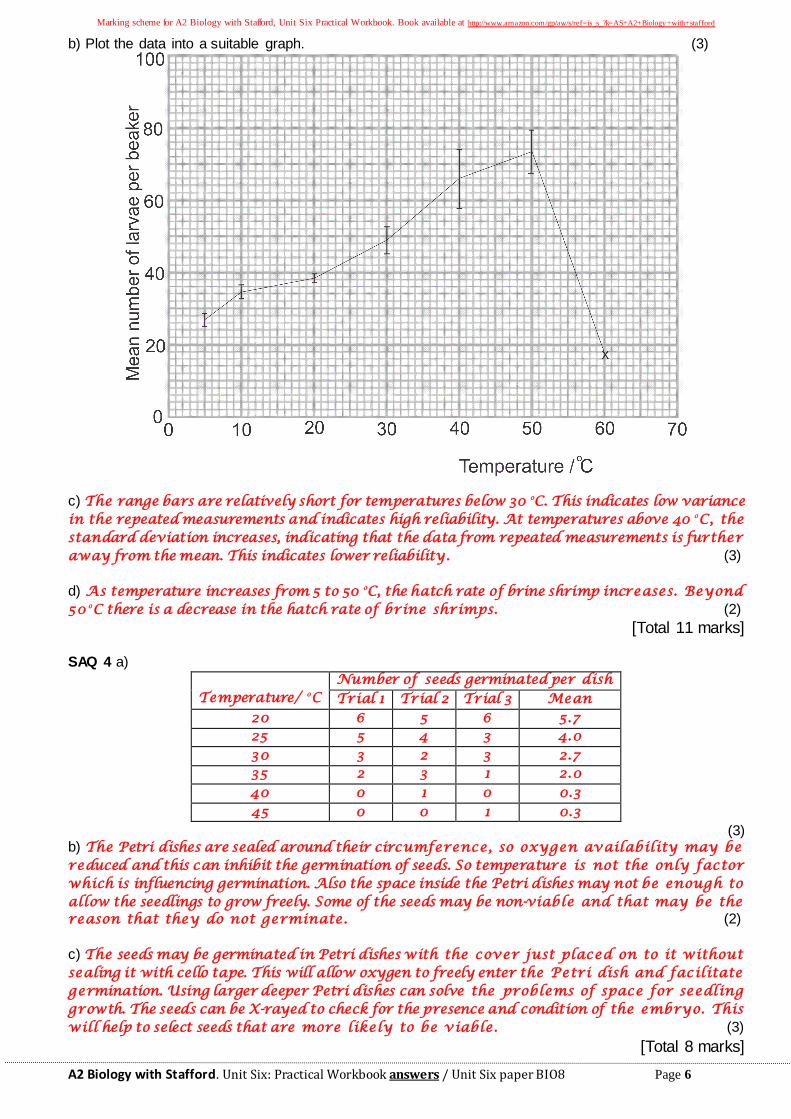
b) Plot the data into a suitable graph. (3)
c) The range bars are relatively short for temperatures below 30 oC. This indicates low variance in the repeated measurements and indicates high reliability. At temperatures above 40 oC, the standard deviation increases, indicating that the data from repeated measurements is further away from the mean. This indicates lower reliability. (3)
d) As temperature increases from 5 to 50 oC, the hatch rate of brine shrimp increases. Beyond 50 oC there is a decrease in the hatch rate of brine shrimps. (2)
[Total 11 marks] SAQ 4 a)
Temperature/ oC
Number of seeds germinated per dish Trial 1 Trial 2 Trial 3 Mean
20 6 5 6 5.7 25 5 4 3 4.0 30 3 2 3 2.7 35 2 3 1 2.0 40 0 1 0 0.3 45 0 0 1 0.3
(3) b) The Petri dishes are sealed around their circumference, so oxygen availability may be reduced and this can inhibit the germination of seeds. So temperature is not the only factor which is influencing germination. Also the space inside the Petri dishes may not be enough to allow the seedlings to grow freely. Some of the seeds may be non-viable and that may be the reason that they do not germinate. (2)
c) The seeds may be germinated in Petri dishes with the cover just placed on to it without sealing it with cello tape. This will allow oxygen to freely enter the Petri dish and facilitate germination. Using larger deeper Petri dishes can solve the problems of space for seedling growth. The seeds can be X-rayed to check for the presence and condition of the embryo. This will help to select seeds that are more likely to be viable. (3)
[Total 8 marks]
Marking scheme for A2 Biology with Stafford, Unit Six Practical Workbook. Book available at http://www.amazon.com/gp/aw/s/ref=is_s_?k=AS+A2+Biology+with+stafford
A2 Biology with Stafford. Unit Six: Practical Workbook answers / Unit Six paper BIO8 Page 7
SAQ 5 (a) Restriction Endonucleases (1)
(b) The analysis of the DNA will require DNA Fingerprinting, which requires a relatively large quantity of DNA. The sample obtained from the window sill is too small and the PCR is used to increase the quantity of DNA very rapidly. (1)
(c) DNA Nucleotides and DNA Polymerase enzyme (2)
(c) The primers are single stranded short chains of nucleotides which are complementary to the bases at the 3’ end of each parent DNA strand. If the primers contain base sequences that enable it to bind with human DNA fragments only, then only human DNA fragments will be replicated. (2)
(d) DNA is double stranded and the 3’ end of each strand has a different sequence of bases. So, a different primer will be needed to bind to each strand of the DNA fragment. (2)
(e) (i) Suspect 3. Because every dark band on the DNA profile from the window sill sample matches the bands on the DNA profile of suspect 3. (1)
(ii) To make a reliable and valid comparison, all DNA sample must be treated in the same way and cut with the same restriction enzymes. Any differences or similarities in the banding patterns will then be attributed to similarities or differences in the molecular structure of the
DNA. (1)
e) The amplification factor = 2n, where n is the number of replication cycles
= 212 = 4096 DNA fragments (2)
[Total 12 marks]
SAQ 6. a) Obtain DNA samples from many animals of the same species and carry out DNA profiles for each. Select animals which have greatest differences in the DNA banding patterns.
(1) b) The selective breeding of genetically diverse organisms increases heterozygosity in the population and increases the chances of survival of the species in a changing environment. The increased genetic diversity will allow the tigers to adapt to different environments and also increase the chances of successful reintroduction programmes in the wild. (3)
ii) The DNA is passed unchanged from parent to offspring and holds a reliable record of our ancestry. The recording of information in stud books can involve human error. (2)
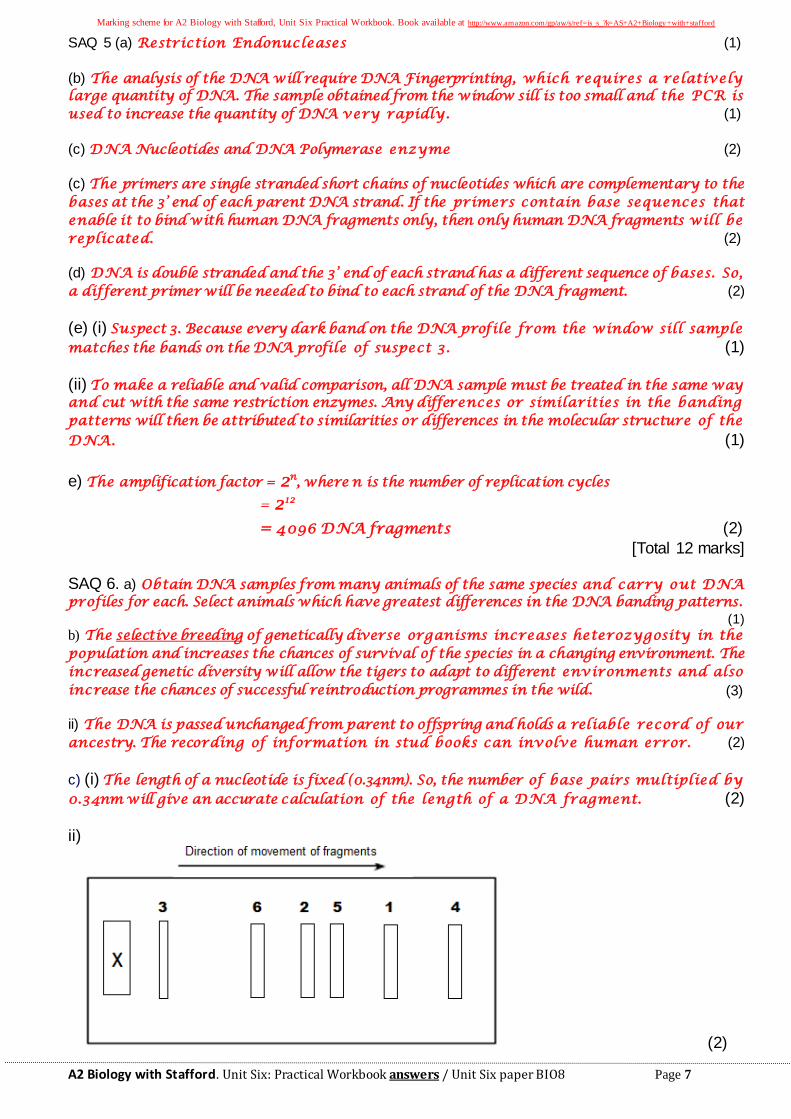
c) (i) The length of a nucleotide is fixed (0.34nm). So, the number of base pairs multiplied by 0.34nm will give an accurate calculation of the length of a DNA fragment. (2)
ii)
(2)
Marking scheme for A2 Biology with Stafford, Unit Six Practical Workbook. Book available at http://www.amazon.com/gp/aw/s/ref=is_s_?k=AS+A2+Biology+with+stafford
A2 Biology with Stafford. Unit Six: Practical Workbook answers / Unit Six paper BIO8 Page 8
iii) Distance moved by the fragment depends on the length of the fragment. Short fragments move fastest and largest fragment move slowest through the gel. (1)
iv) 5 (2)
[Total 13 marks]
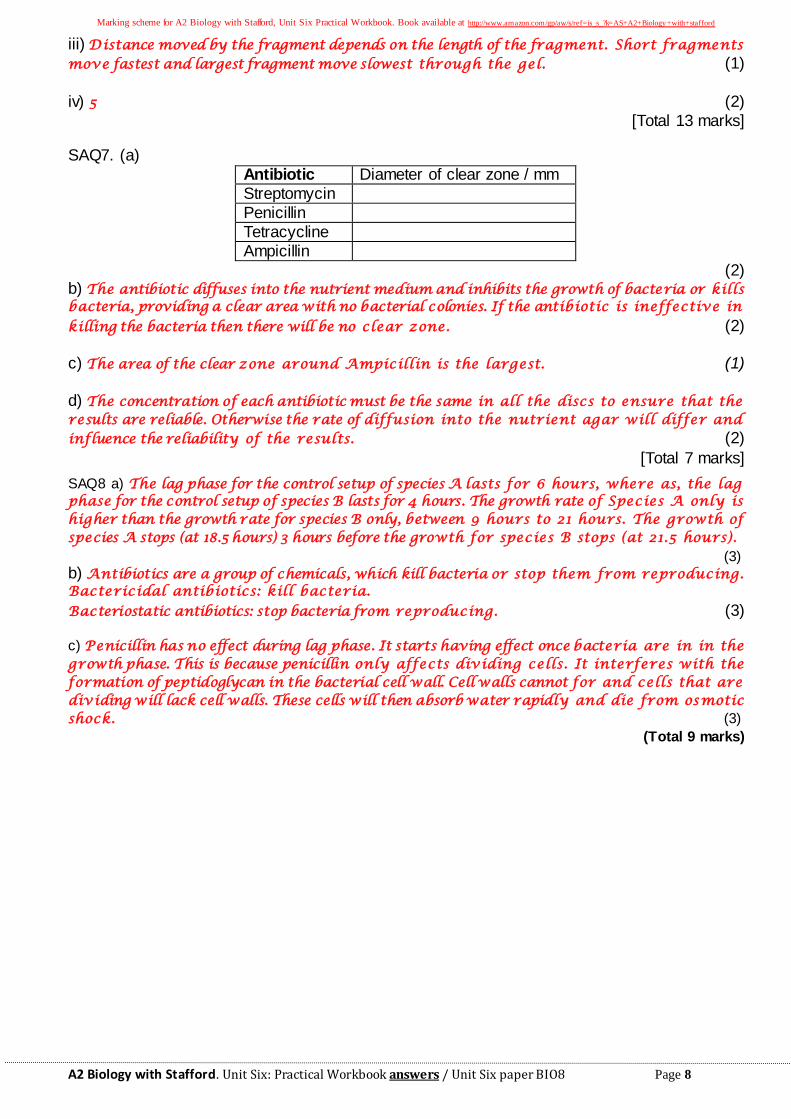
SAQ7. (a)
Antibiotic Diameter of clear zone / mm
Streptomycin
Penicillin
Tetracycline
Ampicillin
(2) b) The antibiotic diffuses into the nutrient medium and inhibits the growth of bacteria or kills bacteria, providing a clear area with no bacterial colonies. If the antibiotic is ineffective in
killing the bacteria then there will be no clear zone. (2)
c) The area of the clear zone around Ampicillin is the largest. (1)
d) The concentration of each antibiotic must be the same in all the discs to ensure that the results are reliable. Otherwise the rate of diffusion into the nutrient agar will differ and influence the reliability of the results. (2)
[Total 7 marks]
SAQ8 a) The lag phase for the control setup of species A lasts for 6 hours, where as, the lag phase for the control setup of species B lasts for 4 hours. The growth rate of Species A only is higher than the growth rate for species B only, between 9 hours to 21 hours. The growth of species A stops (at 18.5 hours) 3 hours before the growth for species B stops (at 21.5 hours).
(3)
b) Antibiotics are a group of chemicals, which kill bacteria or stop them from reproducing. Bactericidal antibiotics: kill bacteria.
Bacteriostatic antibiotics: stop bacteria from reproducing. (3) c) Penicillin has no effect during lag phase. It starts having effect once bacteria are in in the growth phase. This is because penicillin only affects dividing cells. It interferes with the formation of peptidoglycan in the bacterial cell wall. Cell walls cannot for and cells that are dividing will lack cell walls. These cells will then absorb water rapidly and die from osmotic shock. (3)
(Total 9 marks)

Marking scheme for A2 Biology with Stafford, Unit Six Practical Workbook. Book available at http://www.amazon.com/gp/aw/s/ref=is_s_?k=AS+A2+Biology+with+stafford
A2 Biology with Stafford. Unit Six: Practical Workbook answers / Unit Six paper BIO8 Page 9
SAQ9 A spirometer was used to compare a person's breathing at rest and during exercise. The results
are shown in the graphs below.
a) 10 mm on Y axis of the graph = 1 dm 3 of oxygen (8.5+8+8)÷3 mm on Y axis = 0.82 dm3 (2)
Note: it is a good practice to measure the tidal volume three times (as shown on the graph) and then find the mean tidal volume. b) breathing rate = (number of breaths ÷ time) x 60 = (5.5 ÷ 29) x 60 = 11.4 breaths per minute (2)

Marking scheme for A2 Biology with Stafford, Unit Six Practical Workbook. Book available at http://www.amazon.com/gp/aw/s/ref=is_s_?k=AS+A2+Biology+with+stafford
A2 Biology with Stafford. Unit Six: Practical Workbook answers / Unit Six paper BIO8 Page 10
c) at rest Minute ventilation rate = breathing rate x tidal volume
= 11.4 x 0.82 = 9.3 dm 3 min - 1 During exercise Minute ventilation rate = breathing rate x tidal volume = 31.6 x 1.5 = 47.4 dm 3 min - 1 (3)
d) after exercise, the breathing rate is 2.8 times more than at rest and the tidal volume is 1.8 times more after exercise. The rate of oxygen consumption is also greater following exercise. During exercise, the tissues (specially muscles) have an increased demand for oxygen for respiration to provide ATP at an increased rate for muscle contraction. The pH of the blood decreases due to increased carbon dioxide and lactic acid production. The low pH is detected by chemoreceptors in the carotid body and medulla. Respiratory centre in the medulla stimulates the intercostals muscles and diaphragm to increase the breathing rate and depth (tidal volume). (4) (Total 11 marks)
SAQ10 The diagram below shows a simple respirometer, which can be used to measure, the uptake of
oxygen by germinating seeds.
(a) The potassium hydroxide solution absorbs carbon dioxide released during respiration. This ensures that any change in volume of gases in the tube is only due to oxygen being used up for respiration. (1)
(b) The 1 cm3 syringe is used to reset the apparatus by readjusting the liquid level in the manometer U tube. This allows multiple readings to be taken without having to reinstall the entire apparatus. (1)
(c) Setup the apparatus as shown in the diagram and allow the seeds to respire. The seeds use up oxygen the liquid in the manometer U tube will begin to fall. Note the distance moved by the liquid in the U tube. The rate of oxygen uptake by the seeds is found by the following equation. rate of oxygen uptake = (π r2 l ) / t where, π = 3.14 ; r= radius of manometer U tube ; l = length moved by the liquid in the manometer U tube; t = time taken for the liquid to move. d) The antiseptic will prevent the growth of bacteria on the seed. If the bacteria are allowed to grow along with the seeds then the bacteria will respire and the readings will be unreliable.
(2) (Total 7 marks)

Marking scheme for A2 Biology with Stafford, Unit Six Practical Workbook. Book available at http://www.amazon.com/gp/aw/s/ref=is_s_?k=AS+A2+Biology+with+stafford
A2 Biology with Stafford. Unit Six: Practical Workbook answers / Unit Six paper BIO8 Page 11
SAQ11 The table below shows the data obtained when a snail is subjected to a sudden touch stimulus.
Number of times Exposed
to the Stimulus
Time taken for
tentacles to be fully re-extended / s
1 180
2 170
3 165
4 156
5 130
6 110
7 95
8 180
9 63
10 50
(a) (i) Habituation is a type of learning because it brings about a change in behaviour . (1) (ii) ignore irrelevant stimuli/prevents unnecessary behaviour; uninterrupted feeding; energy not wasted/saved; returns if stimulus changes; (2) (b) stimulate the muscle directly/change the stimulus (following habituation); muscle will contract (allow response will still occur); (accept measure pH; build-up of lactate if fatigued) (2) (c) lack of transmitter substance/depletion of Ach; (accept reference to inhibitory synapse) depolarisation affected; action potential/impulse not regenerated; (3) (d) no impulse to/ no depolarisation of motor end plate/ neuromuscular junction; muscles relax/fail to contract; (2)
(Total 8 marks) SAQ12. (a) The correlation coefficient is used to determine whether there is a signi ficant association between two measured variables. Height and weight are two measured variables.
(1) (b) Scatter diagram. (4) c) There is no significant relationship between the height and weight of boys . (1)
(d) i. Since the calculated coefficient correlation (0.558) is greater than the critical value (0.38) the null hypothesis must be rejected and we must conclude that there is a significant
relationship between the height and weight of the boys. (3) Other variables that can influence height and weight ration must be considered when
making a conclusion. For example the age of the boys can also influence the results and must
be considered or all boys of the same age should be included in this study.
e) degrees of freedom = number of pairs of measurements - 1 = 20 -1
= 19 (1) (Total 11 marks)
SAQ13. a) Scatter diagram. (4)
b) r = 1 – ((1071) / 15(152 – 1)) = 1 – ((1071) / 15 (224)) = 1 – 0.31875
= 0.68125 (2)
(c) There is no significant relationship between the number of hives in different groves
and the measured yield of oranges in each grove. (1)

Marking scheme for A2 Biology with Stafford, Unit Six Practical Workbook. Book available at http://www.amazon.com/gp/aw/s/ref=is_s_?k=AS+A2+Biology+with+stafford
A2 Biology with Stafford. Unit Six: Practical Workbook answers / Unit Six paper BIO8 Page 12
(d) Since the calculated correlation coefficient (0.68125) is greater than the critical value (0.361) (on page 58 in the book), at the 5% significance level, the null hypothesis must be rejected and it must be concluded that there is a significant relationship between the number of bee hives in
different groves and the measured yield of oranges in each grove. (3)
(Total 10 marks)
SAQ14
PHENOTYPE OF GRAIN
OBSERVED NUMBER
(O)
EXPECTED NUMBER
(E)
(O – E)2
E
Yellow and Smooth 53 56.25 0.188
Yellow and Wrinkled 20 18.75 0.083
White and Smooth 17 18.75 0.163
White and Wrinkled 10 6.25 2.25
∑ 100 100 2.684
(a) There is no significant relationship between the observed number of seeds and the expected number of seeds.
b) done in the table. (c) X axis Phenotype; Y axis number of individuals; Paired bar graph;
(d) degrees of freedom = (r-1) (c-1) = (4-1) (2-1) = 3 r – is the number of rows of data for observed and expected values c – is the number of columns of data for observed and expected values.
(e) Since the calculated 2 value (2.68) is lesser than the critical value (7.81), at p=0.05, the null hypothesis must be accepted and we must conclude that there is no significant differ ence between the observed and expected number of seeds for each phenotype.
SAQ15.
Aperture
OBSERVED
NUMBER (O)
EXPECTED
NUMBER (E)
(O – E)2 ÷ E
A 20 21 0.047 B 24 21 0.428
C 18 21 0.428 D 22 21 0.047
∑ 84 84 0.95 a) Done in the table. (4)
b) There is no significant difference between the observed and expected number of exits from each aperture by the mouse.
(d) degrees of freedom = 3
(e) Since the calculated Chi2 value (0.95) is greater than the critical value (7.82), at 3 degrees of freedom and 5% significance level, the null hypothesis must be rejected and we must conclude that there is a significant difference between then observed and expected number of exits from each aperture.

Marking scheme for A2 Biology with Stafford, Unit Six Practical Workbook. Book available at http://www.amazon.com/gp/aw/s/ref=is_s_?k=AS+A2+Biology+with+stafford
A2 Biology with Stafford. Unit Six: Practical Workbook answers / Unit Six paper BIO8 Page 13
SAQ 16 (a)
Range of light intensities (class intervals)
Tally Frequency Deciduous Coniferous Deciduous Coniferous
9.1 – 9.5 II 0 2 9.6 – 10.0 I IIII 1 4 10.1 – 10.5 IIII IIII I 4 6 10.6 – 11.0 III II 3 2 11.1 – 11.5 IIII I 4 1 11.6 – 12.0 II 2 0 12.1 – 12.5 I 1 0
(3)
(b) Bar Graph type histogram. (4)
(c) The data for deciduous woodland shows a wider range and hence a lower variability. (1)
(d) Since the calculated t value (3.42) is greater than the critical value (2 .05), at p = 0.05, the null hypothesis must be rejected and we must conclude that there is a significant difference between the mean light intensities reaching the ground in two different woodlands. (3)
(Total 11 marks)
SAQ17. (a) 13.2 – 5.7 = 7.5 7.5/9 = 0.83 0r 0.85 0r 9.0
Leaf length / cm (class intervals)
Tally Frequency Shaded Sunlit Shaded Sunlit
5.7 – 6.5 II 0 2 6.6 – 7.4 IIII 0 5 7.5 – 8.3 III 0 3 8.4 – 9.2 III IIII IIII IIII 3 14 9.3 – 10.1 II III 2 3 10.2 – 11.0 IIII IIII I 10 1 11.1 – 11.9 IIII IIII II 9 2 12.0 – 12.8 IIII 5 0 12.9 – 13.7 I 1 0

Marking scheme for A2 Biology with Stafford, Unit Six Practical Workbook. Book available at http://www.amazon.com/gp/aw/s/ref=is_s_?k=AS+A2+Biology+with+stafford
A2 Biology with Stafford. Unit Six: Practical Workbook answers / Unit Six paper BIO8 Page 14
b. (4)
a. Suggest a suitable null hypothesis for this experiment. (1)
......................................................................................................................................................................
............................................................................................................................................................
b. State the number of degrees of freedom for the data. (1)
............................................................................................................ ......................................................
c. The formula used for the t test is given below.
Where,
Calculate the value of t. Show your working. (3)
d. A statistical table showed that the critical value at the 5 % level was 2.00. What does this tell you about the difference between the mean leaf lengths from sites A and B? (1)
............................................................................................................................. .....................................
............................................................................................................................. .....................................
..................................................................................................................................................................
............................................................................................................................. .....................................
............................................................................................................................. .....................................
............................................................................... ...................................................................................
............................................................................................................................. .....................................
..................................................................................................................................................................
.................................................................................................................................................................. [Total 14 marks]

Marking scheme for A2 Biology with Stafford, Unit Six Practical Workbook. Book available at http://www.amazon.com/gp/aw/s/ref=is_s_?k=AS+A2+Biology+with+stafford
A2 Biology with Stafford. Unit Six: Practical Workbook answers / Unit Six paper BIO8 Page 15
SAQ18 A new fertilizer [‘super-grow’] has been developed. During testing, super-grow was applied to 7
plots of a wheat field. A further 8 plots were left as a control. The numbers of ‘giant’ wheat plants per metre of row in each plot were recorded. The results are shown in the table below.
Number of ‘Giant’ plants per metre of row
Without super-grow 6.2 8.5 12.3 13.2 14.1 15.8 19.4 21.0
With super-grow 3.9 8.4 9.1 11.8 12.4 14.9 18.2
(a) Suggest why a Mann-Whitney U test is appropriate to determine whether super-grow increases
the number of ‘Giant’ wheat plants. (2)
..................................................................................................................................................................
..................................................................................................................................................................
..................................................................................................................................................................
...............................................................................................................................................................
(b) State a suitable null hypothesis for this investigation. (1)
..................................................................................................................................................................
..................................................................................................................................................................
.................................................................................................................................................................. (c) The U values for the two sets of data were calculated and found to be:
U1 = 37
U2 = 19 A statistical table showed that the critical value is 11. What can you conclude from this investigation?
Explain your answer. (3)
..................................................................................................................................................................
..................................................................................................................................................................
..................................................................................................................................................................
..................................................................................................................................................................
..................................................................................................................................................................
..................................................................................................................................................................
(d) Prepare a table of the raw data and organise it in such a way that the median number of ‘Giant’ plants in each field can be identified. (4)
Marking scheme for A2 Biology with Stafford, Unit Six Practical Workbook. Book available at http://www.amazon.com/gp/aw/s/ref=is_s_?k=AS+A2+Biology+with+stafford
A2 Biology with Stafford. Unit Six: Practical Workbook answers / Unit Six paper BIO8 Page 16
(e) Use the data in your table to present the information in a suitable graphical form. (3)

Marking scheme for A2 Biology with Stafford, Unit Six Practical Workbook. Book available at http://www.amazon.com/gp/aw/s/ref=is_s_?k=AS+A2+Biology+with+stafford
A2 Biology with Stafford. Unit Six: Practical Workbook answers / Unit Six paper BIO8 Page 17
(Total 13 marks)
SAQ 19 A study was carried out to see if male birds in territories provided with extra food allocate more of their time to singing. The results of the study are shown in the table below.
a) Use the data in the table to present the data in a suitable graphical form. (3)
(b) State the null hypothesis for this investigation. (1) (c) The student decided to apply the wilcoxon signed rank test to the paired data. This statistical test uses the differences between paired samples and is equivalent to a t-test for paired data.
The calculations produced W values of 3 and 33. i) Use the table of critical values in the notes for W test and determine the critical value for this set of data. (1) …………………………………………………………………………………………………………….
ii) Use the information to draw conclusions. ............................................................................................................................................................................................................................................................................................................................................................................................................................................................
(3) (Total 7 marks)