unit 2: research methods 2: research methods ... 5. given the number of people who purchase lottery...
TRANSCRIPT

UNIT 2: RESEARCH METHODS
Need for Psychological Science
Scientific Method
Correlation & Experimentation
Statistical Reasoning
Applied Research & Ethics
Module 4NEED FOR PSYCH SCIENCE
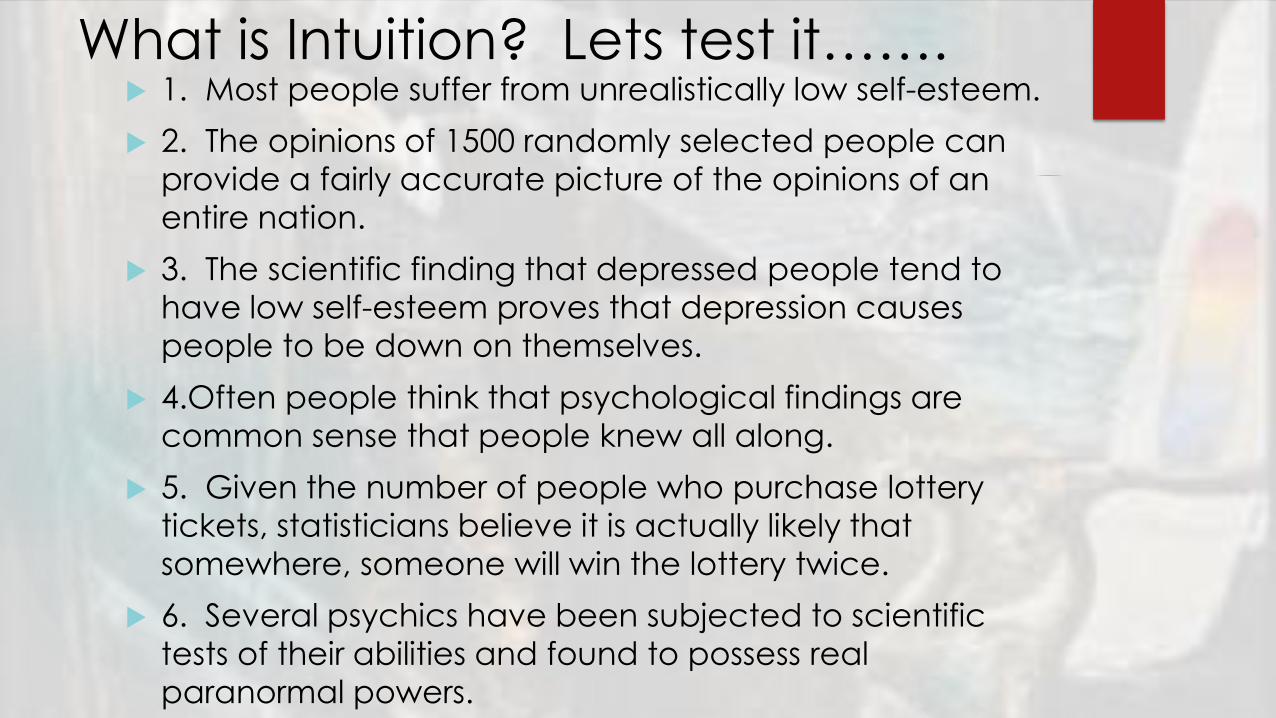
What is Intuition? Lets test it……. 1. Most people suffer from unrealistically low self-esteem.
2. The opinions of 1500 randomly selected people can
provide a fairly accurate picture of the opinions of an
entire nation.
3. The scientific finding that depressed people tend to
have low self-esteem proves that depression causes
people to be down on themselves.
4.Often people think that psychological findings are
common sense that people knew all along.
5. Given the number of people who purchase lottery
tickets, statisticians believe it is actually likely that
somewhere, someone will win the lottery twice.
6. Several psychics have been subjected to scientific
tests of their abilities and found to possess real
paranormal powers.

Intuitive Thinking……………..
1. TED Talk &
Analysis
2.Flaws of Intuition
3. Intuition Research
Flaws of Intuition
Perceiving Order
Overconfidence
Hindsight Bias
Bonus: CONFIRMATION BIAS

Scientific Attitude & Critical
Thinking
The Amazing James
Randi!
What are the
three main
components of
the “scientific
attitude”?
Foundation of Critical
Thinking?

Wrap Up: Identify whether hindsight bias (HB),
overconfidence (O), or the tendency to
perceive patterns in random events (P) is at
work below 1. Toni notices that the last four times she has been to the grocery store she has scored a
parking place right up front! She knows she is on a lucky streak!
2. Bruce is often called a Monday Morning Quarterback by his friends for saying he knew the Eagles should have put the rookie wide receiver in last Sunday’s game.
3. Amanda, a senior in high school with a 3.0 GPA, is filling out her college applications. When asked by her friends and family what schools she is applying to and what schools she thinks she will get into, she lists Princeton, Yale, Harvard and Stanford and says she thinks she will get into all of them, except maybe for Harvard, which is her reach school.
4. Shreya and Steve break up. Their classmate, Iram, tells her mother that she knew all along the two of them were not going to make it.
5. Fiona, a student in your class, is certain that the instructor does not like her. For the last three class sessions, the instructor has not called on her to answer a question, even though her hand was raised.

Module 5THE SCIENTIFIC METHOD & DESCRIPTION
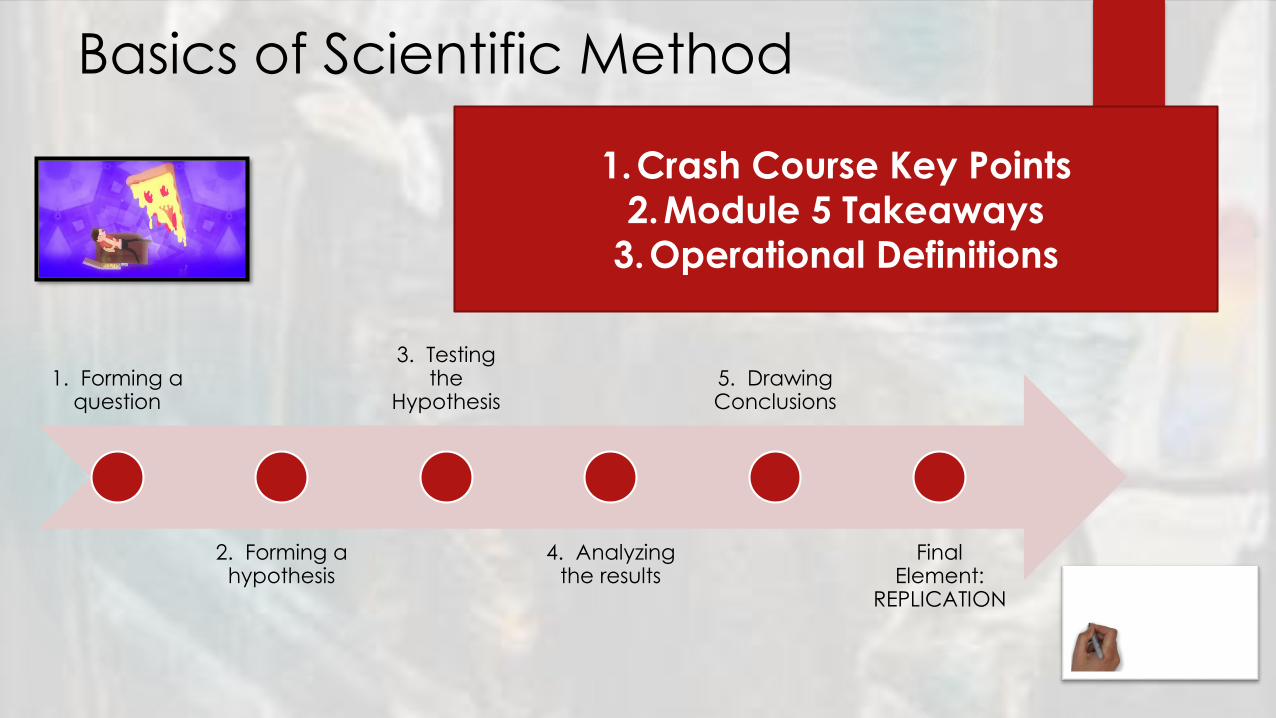
Basics of Scientific Method
1. Forming a question
2. Forming a hypothesis
3. Testing the
Hypothesis
4. Analyzing the results
5. Drawing Conclusions
Final Element:
REPLICATION
1.Crash Course Key Points
2.Module 5 Takeaways
3.Operational Definitions

Variables and Null Hypothesis
Anything that can change or be changed
Independent Variable (sleep): Experimenter manipulates this
Dependent Variable (memory): Variable that researchers measure
Null Hypothesis: IV has no impact on DV (trying to disprove/reject this)

How does a researcher choose which method to use? It
depends on the research question. Each research
method has advantages and disadvantages.

Complete Chart on
Descriptive Research

Case Studies
DISADVANTAGESADVANTAGES
• Good source of
hypotheses.
• Provides in-depth
information on
individuals.
• Unusual examples
can shed light on
situations or problems
that are unethical or
impractical to study
in other ways.
• Vital information may
be missing, making
the example difficult
to interpret.
• The person’s
memories may be
selective or
inaccurate.
• The individual may
not be representative
or typical.
DISADVANTAGESADVANTAGES
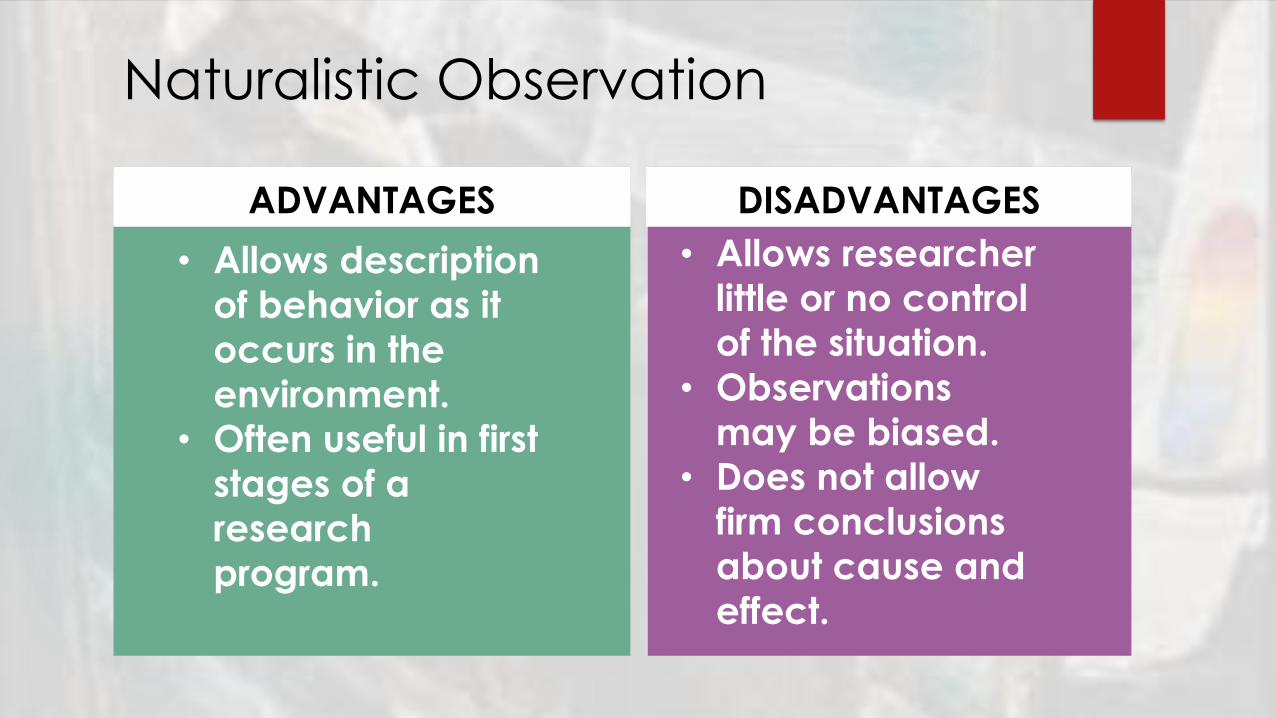
Naturalistic Observation
• Allows description
of behavior as it
occurs in the
environment.
• Often useful in first
stages of a
research
program.
• Allows researcher
little or no control
of the situation.
• Observations
may be biased.
• Does not allow
firm conclusions
about cause and
effect.

DISADVANTAGESADVANTAGES
Laboratory Observation
• Allows more
control than
naturalistic
observation.
• Allows use of
sophisticated
equipment.
• Allows researcher only
limited control of the
situation.
• Observations may be
biased.• Does not allow firm
conclusions about
cause and effect.
• Behavior may differ from
behavior in the natural environment.

DISADVANTAGESADVANTAGES
Surveys
•Provides a large
amount of
information on
large numbers of
people.
•Cheap
•Hits a lot of
people at once
• If sample is non-representative or
biased (Volunteer bias), it may be
impossible to generalize from the
results.
• Demand characteristics: people
respond in a way they know the
researcher wants them to
• The wording of surveys may be biased
and participants are not always
honest
• Low response rate

Framing (Why is Wording of
Surveys/Interviews important)
1255 people were surveyed by New York’s American Museum of Natural History:
1. 77% interested in plants and trees, but only 39% interested in botany
2. 48% interested in fossils, but only 39% interested in paleontology
3. 42% interested in rocks and minerals, but 53% interested in geology
Other EXAMPLES?
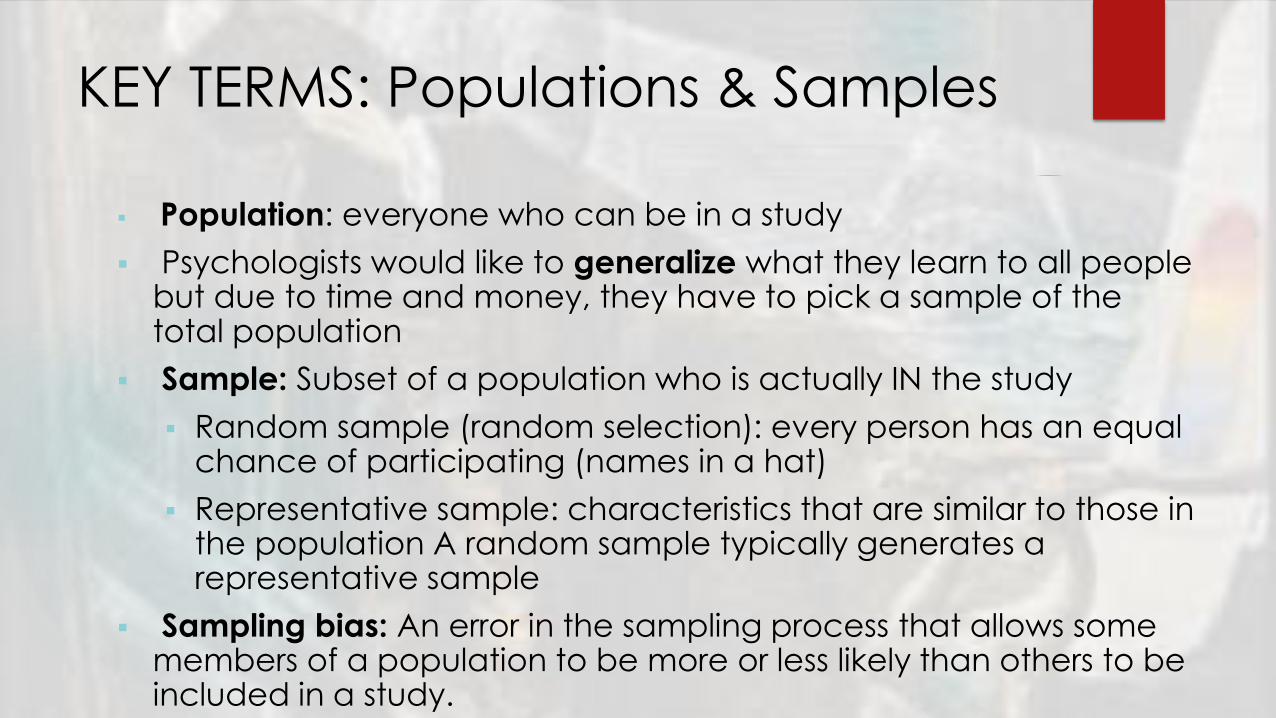
KEY TERMS: Populations & Samples
▪ Population: everyone who can be in a study
▪ Psychologists would like to generalize what they learn to all people but due to time and money, they have to pick a sample of the total population
▪ Sample: Subset of a population who is actually IN the study
▪ Random sample (random selection): every person has an equal chance of participating (names in a hat)
▪ Representative sample: characteristics that are similar to those in the population A random sample typically generates a representative sample
▪ Sampling bias: An error in the sampling process that allows some members of a population to be more or less likely than others to be included in a study.
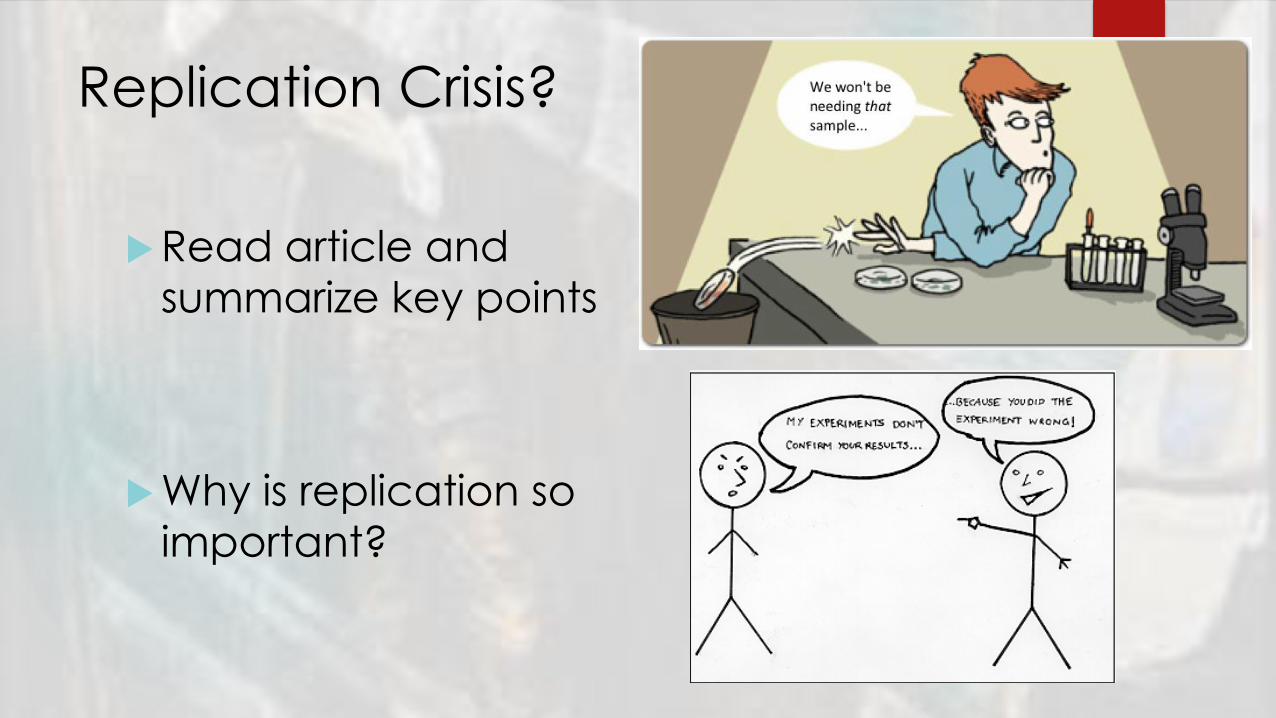
Replication Crisis?
Read article and
summarize key points
Why is replication so
important?

WRAP UP A theory….
is an explanation using an integrated set of principles that organizes observations and predicts behaviors or events, often highly researched
A hypothesis….
is a testable prediction, often implied by a theory. In psych, it is a statement between or among variables
Operationally defining the variables allows for repetition and replication, which is essential;…..
These need to be measurable and manageable.
Replication importance:….
If a result is true, it should show itself over and over. If a study shows that gratitude increases positive well-being, then replication of that study should show the same results. Replicated studies with the same results can lead to advancing our knowledge.
Generalizability….
The degree that results of a study can be applied to different types of populations

Discuss and explain

Which descriptive technique would be best utilized in each
case: a case study (CS), naturalistic observation (NO) or
survey (S).
1. Mr. Bucher wants to determine whether he should use the building funds for a
renovated student courtyard or a faculty exercise room.
2. An army doctor wants to see how soldiers are handling the transition back to civilian
life.
3. A parent is curious to know how their child behaves when away from home at school.
4. An animal researcher wants to prove that squirrels run in packs as wolves do.
5. The Central Bucks School Board is trying to determine if teachers and students feel the
building facilities are adequate and safe.
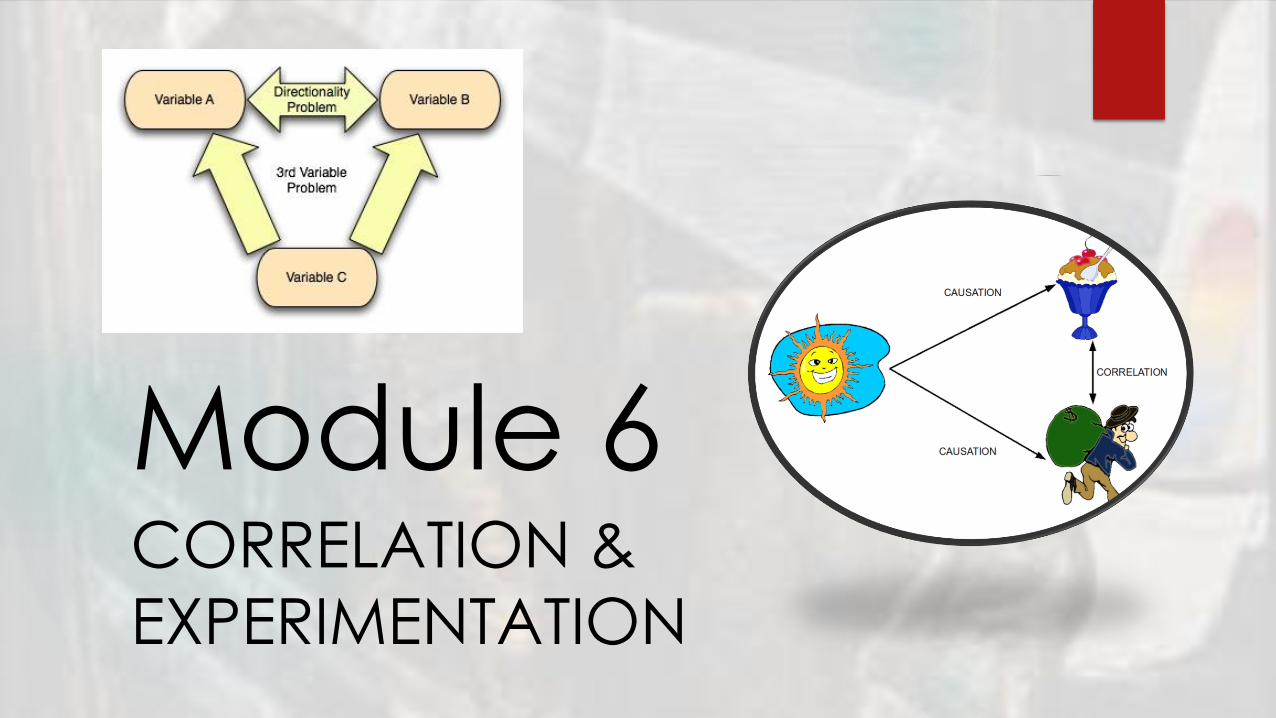
Module 6 CORRELATION &
EXPERIMENTATION

Correlation
Scatterplot Positive/Direct Negative/Inverse
Correlation Coefficient
Discuss and Identify
these basic
concepts

Correlations
▪ Shows how closely related two sets of scores are to each other
▪ How well does A predict B?
▪ No manipulation of variables in correlational studies so cannot prove causation
▪ A statistical measurement called a correlation coeffiecient (represented as r) describes the strength and direction of the relationship. You will not have to calculate!
▪ A scatterplot is a type of graph used to display correlational data so that the relationship between two variables is visible

Netflix & Not so Chill
▪ A positive or DIRECT correlation, shows variables that either rise or fall together
▪ V1: # of HW assignment turned in increases; V2: a person’s grade in AP Psych also increases
▪ A negative or INVERSE correlation, shows variables that go in opposite directions
▪ # of hours watching Netflix increases; a person’s GPA decreases

Correlations
▪ Correlation coefficients range from +1.00 to -1.00
▪ The number (-.38) represents the strength of the correlation and the sign (+/-) represents the DIRECTION
▪ A correlation coefficient of -.70 indicates a stronger relationship than a coefficient of +.65
▪ A correlation of 0 shows that the two sets are not related


How do you visually represent correlation coefficient on a scatterplot?
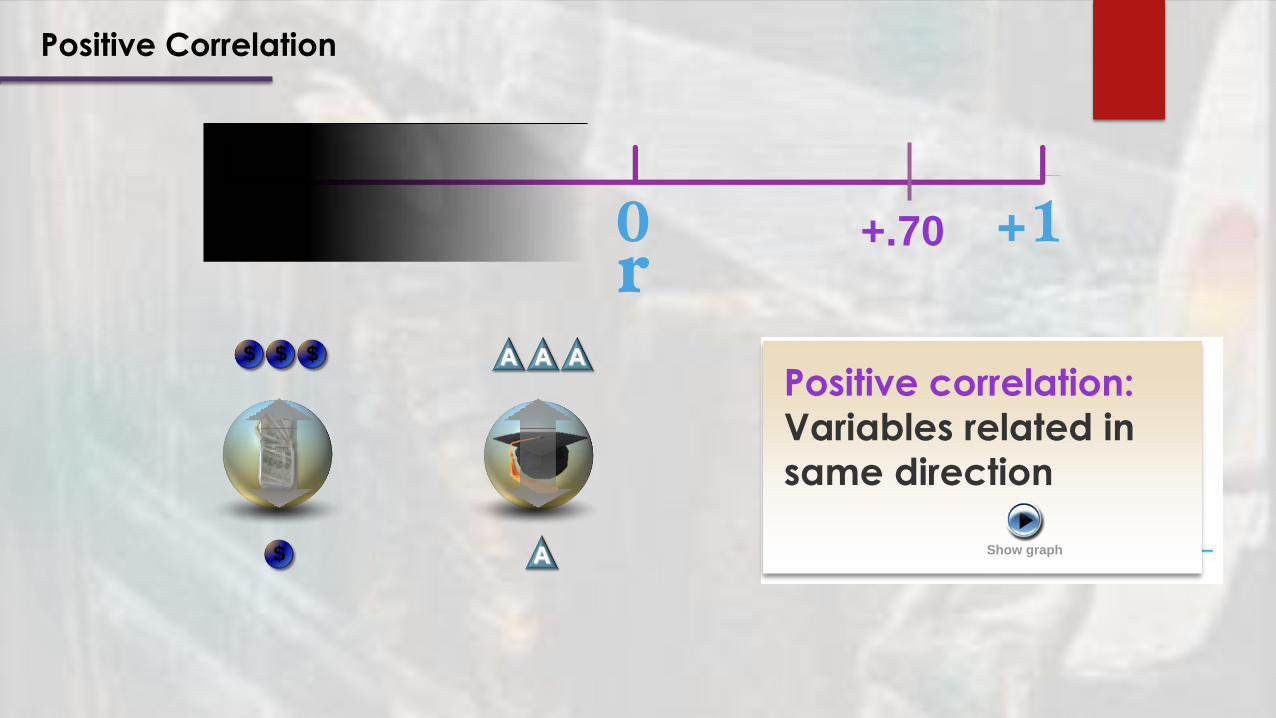
Positive Correlation
Positive correlation:
Variables related in
same direction
+.70
$ $ $
$
A A A
A Show graph

Negative correlation:
Variables related in
opposite direction
-.70
Show graph
Negative Correlation

Confounding (Third) Variables
Third variable problem: Positive correlation between murder rate and the sale of ice-cream.
Third variable which includes a confounding variable
Weather is cold, fewer people are out interacting with others and less likely to purchase ice-cream.
Hot outside, more social interaction and more ice-cream being purchased
Weather is the variable that confounds the relationship between ice-cream sales and murder

Correlation Does not mean
Causation

Correlation Does not mean
Causation

Correlation Does not mean
Causation

Correlation Does not mean
Causation

Correlation Does not mean
Causation

Illusory Correlations?
Illusory correlation: A suspected relationship
that doesn’t empirically exist
I saw a few very short students getting A’s on my
quizzes in class, therefore, short kids must be
smarter!

Predict whether the correlation would
likely be positive (P) or negative (N):
1. The number of fast food restaurants: the obesity rate in
the U.S.
2. The average U.S. household income: annual gross profit
reported by U.S. retailers.
3. The illiteracy rate: the presence of Head Start or early
intervention education programs.
4. The number of hours spent commuting to and from
work; the amount of dinners cooked at home from
scratch.
5. Hours spent learning a skill; proficiency in the skill.

Scatterplot Correlation Practice
1. Which is +/-
2. Which scatterplot is stronger?
Why?
3. Could you estimate numerical
range from this data?

Experimentation: Discuss Basic
Terms
Experimentation
Groups
Control
Experimental
Variables
Independent
Dependent

DISADVANTAGESADVANTAGES
Experiment
• Allows researcher to
control the situation.
• Permits researcher to
isolate cause and
effect and to
distinguish placebo
effects from
treatment effects.
• Situation is artificial,
and results may not
generalize well to the
real world.
• Sometimes difficult to
avoid experimenter
effects.
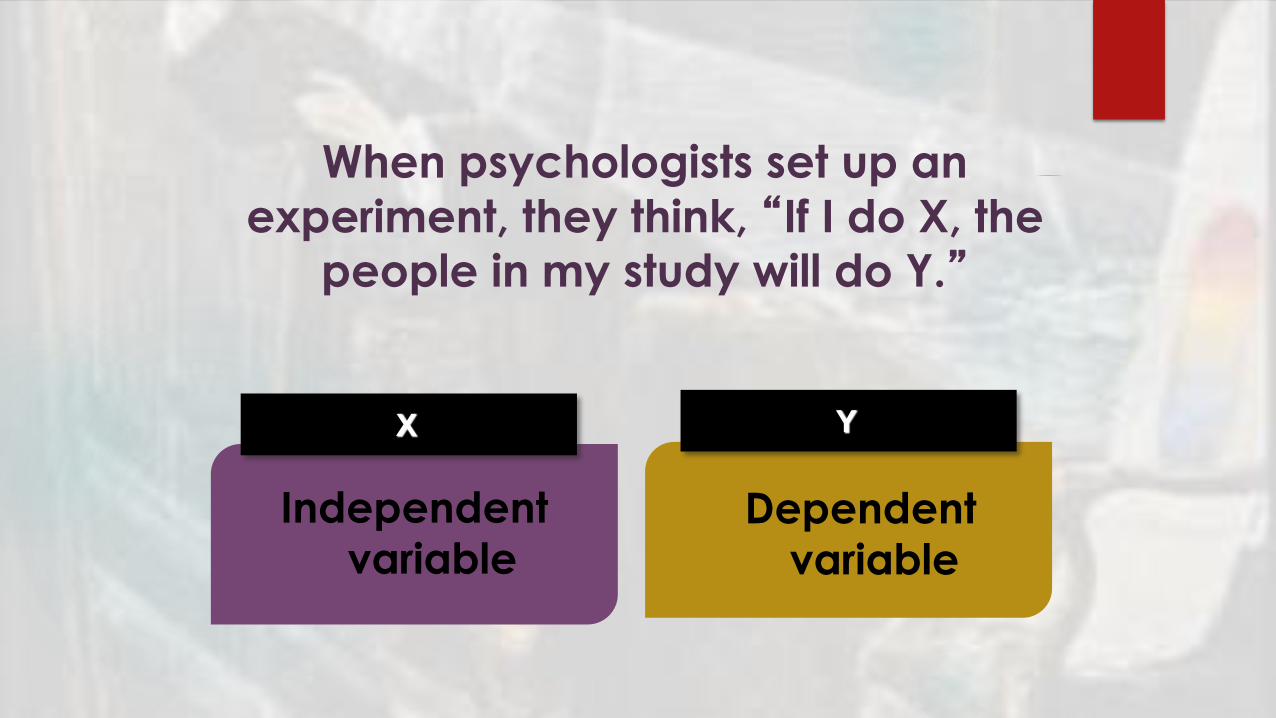
X Y
When psychologists set up an
experiment, they think, “If I do X, the
people in my study will do Y.”
Independent
variableDependent
variable
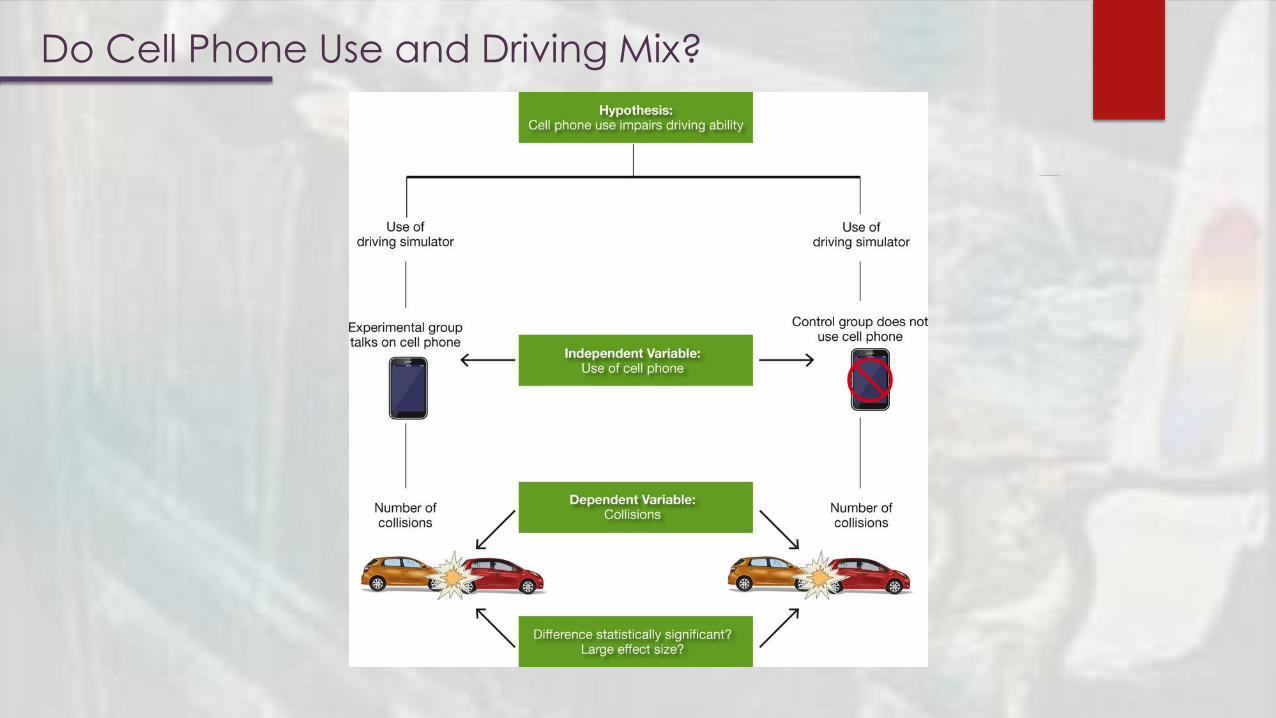
Do Cell Phone Use and Driving Mix?

In an experiment, participants are randomly assigned . . .. . . into experimental and control groups . . . which are then subject to independent and dependent variables.
Random Assignment
Controlling for confounding variables such as parental
intelligence and environment
Participants

• Participants in an experiment who are not exposed to the treatment variable; this is the comparison group.
Control group
• Members of an experiment who are exposed to the treatment variable or manipulation by the researcher; represents the
treatment group.
Experimental group
Experimental Method

•In an experimental design, the characteristic or response that is measured to determine the effect of the researcher’s manipulation
Dependent variable (DV)
•In an experimental design, the variable manipulated by the researcher to determine its effect on the dependent variable
Independent variable (IV)
Experimental Method

• Type of extraneous variable that may interfere with the independent variable, making it difficult to discern which one is causing changes in the dependent variable
• Effect of protein on running speed; other foods in diet may
confound
Confounding variable
•Variable in the environment or of the participants that could unintentionally influence the outcome of the study
Extraneous variable
Variables continued….

What does “blind” mean in
research lingo?
Single-blind study
Experimenter knows who is in which group
Participants do not
Double-blind study
Neither experimenter nor participants know who is in which group
Eliminates experimenter bias

• An action or substance given to members of the control group; the fake treatment that has no benefit, but is administered as if it does
• People taking the placebos often experience effects that are similar to those reported by the participants taking the actual drug or treatment
What is the Placebo Effect?

Does my Experiment Test what it is
supposed to test? What is validity?▪ Internal Validity: How well constructed was the experiment to control for
confounding variables?
▪ Content Validity: Learning Shakespeare, test questions on Shakespeare NOT
Geometry
▪ IQ tests are strictly timed, may be a good measure of speed of
processing. However, if researchers do not believe processing speed
is an important component of intelligence, content validity would be
questioned
▪ Face Validity: Tests appears valid to test taker
▪ Construct Validity: Self-esteem is a CONSTRUCT. What does it exactly mean
though? Difficult to operationalize, need to be clear how you are
measuring the construct

What about……Reliability?
Refers to the consistency of a research study or measuring test.
If a person weighs themselves during the course of a day they would expect to see a similar reading. Scales which measured weight differently each time would be of little use.

Exit Slip
What is meant by the phrase
“correlation” does not imply
causation? Explain using 4
terms discussed in class
today (underline the 4 terms
you use)

Module 7 STATS IN EVERYDAY LIFE


From what we have already
discussed this unit and from
module 7 why is statistical
reasoning and transparency
so important?
Importance of Statistics

Descriptive StatisticsOrganized into a frequency distribution (orderly arrangement of scores) so as to get a measure
Type of data determines the type of statisticsNominal: identifies categories(e.g. Eye color; Are you a Democrat
(1), Republican (2) or Independent (3))
Ordinal: produces data that can be ordered in a set(compare the
GPA of all kids in class, Shortest to tallest)
Interval: falls within a number line that has a zero point
(height and weight); weight of zero is no weight
Ratio: falls within a number line where zero is another
number in the line, 0 degrees doesn’t mean 0
temperature

Data Display
Pie chart: % or proportions
Bar graph: Good for when data are in categories, spaces between data
Histogram: when you have continuous data (person's height), no spaces
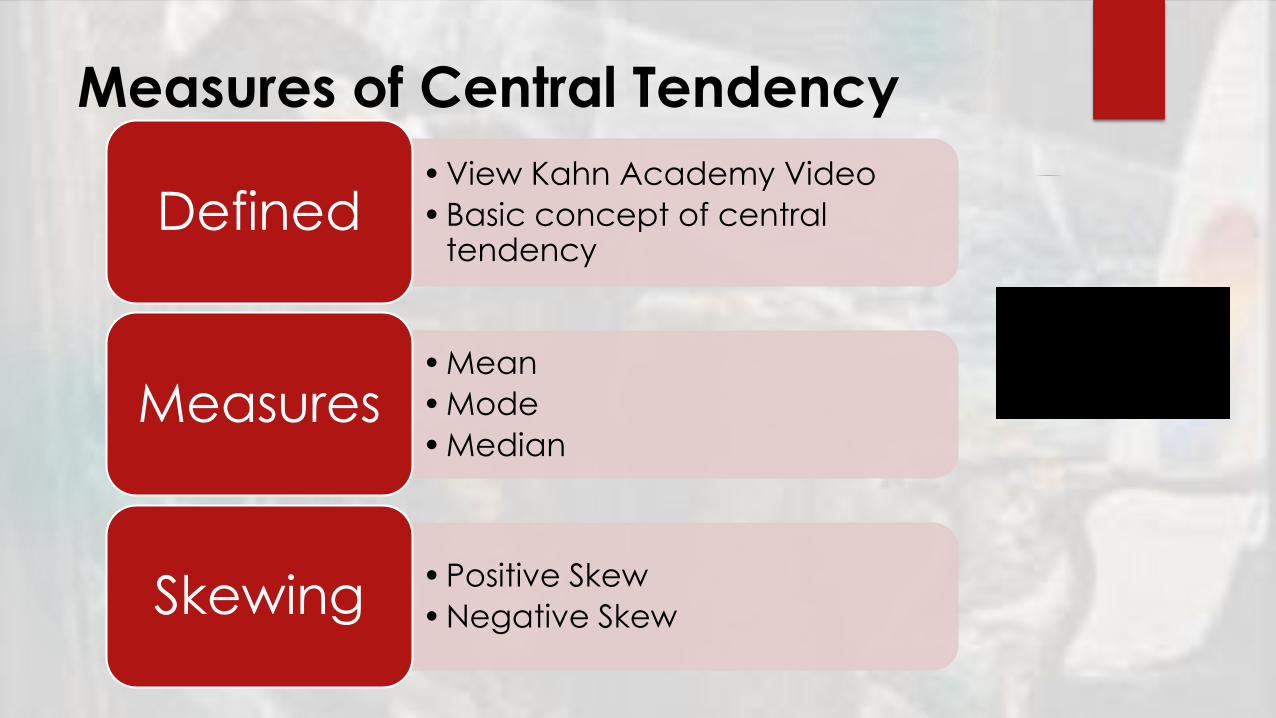
Measures of Central Tendency
• View Kahn Academy Video
• Basic concept of central tendency
Defined
• Mean
• Mode
• MedianMeasures
• Positive Skew
• Negative SkewSkewing

Central Tendency
• 3 Measures of Central Tendency (OR single scores that represents a whole set of scores)
• Mean: the arithmetic average
• Add all scores then divide by number of scores (N)
• Strongly influenced by outliers – gets pulled up or down depending on extreme data points
• Median: the middle score in a distribution
• Mode: the most frequently occurring score
• Bimodal – if two scores appear most frequently
• Multimodal – if three or more scores appear most frequently

Note that when a variable is normally distributed, the mean, median, and mode are the same number.
You can use the following two rules to provide some information about skewness even when you cannot see a line graph of the data (i.e., all you need is the mean and the median):
1. Rule One. If the mean is smaller (because of a very low score) than the median, the data are skewed to the left.
2. Rule Two. If the mean is larger (because of a very high score) than the median, the data are skewed to the right.
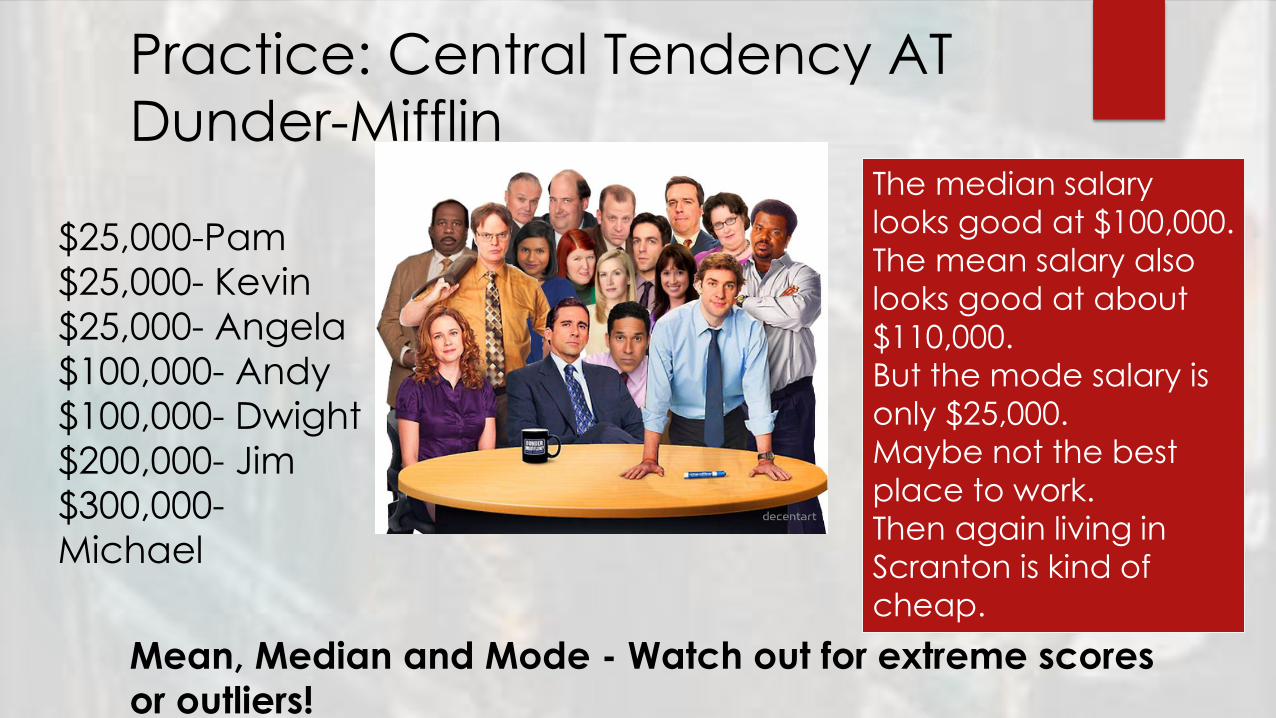
Mean, Median and Mode - Watch out for extreme scores
or outliers!
$25,000-Pam
$25,000- Kevin
$25,000- Angela
$100,000- Andy
$100,000- Dwight
$200,000- Jim
$300,000-
Michael
The median salary
looks good at $100,000.
The mean salary also
looks good at about
$110,000.
But the mode salary is
only $25,000.
Maybe not the best
place to work.
Then again living in
Scranton is kind of
cheap.
Practice: Central Tendency AT
Dunder-Mifflin
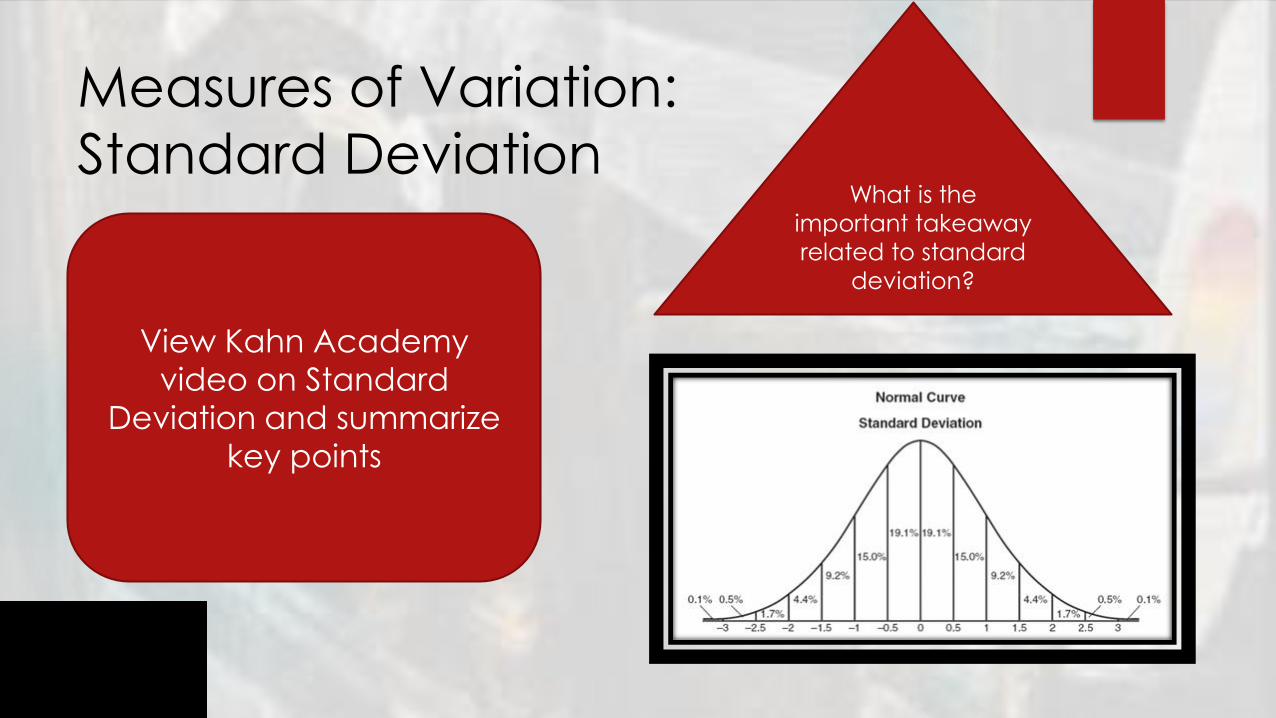
Measures of Variation:
Standard Deviation
View Kahn Academy
video on Standard
Deviation and summarize
key points
What is the
important takeaway
related to standard
deviation?

Measures of Variation (Variability)
• Variability: How spread out or
dispersed the data is
• Range: Calculated by
taking the largest data
point and subtracting
from it the smallest
data point, represents
span of scores
• Variance: The mean of
the squared difference
scores
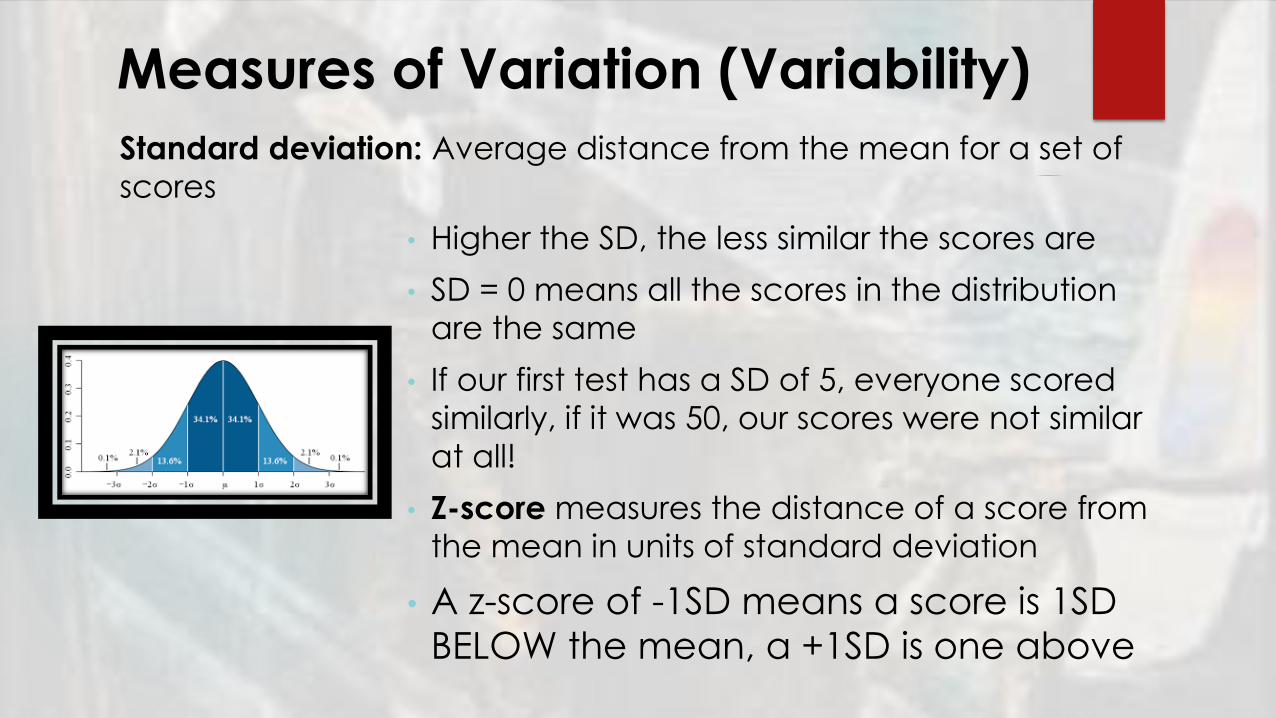
Measures of Variation (Variability)
Standard deviation: Average distance from the mean for a set of
scores
• Higher the SD, the less similar the scores are
• SD = 0 means all the scores in the distribution
are the same
• If our first test has a SD of 5, everyone scored
similarly, if it was 50, our scores were not similar
at all!
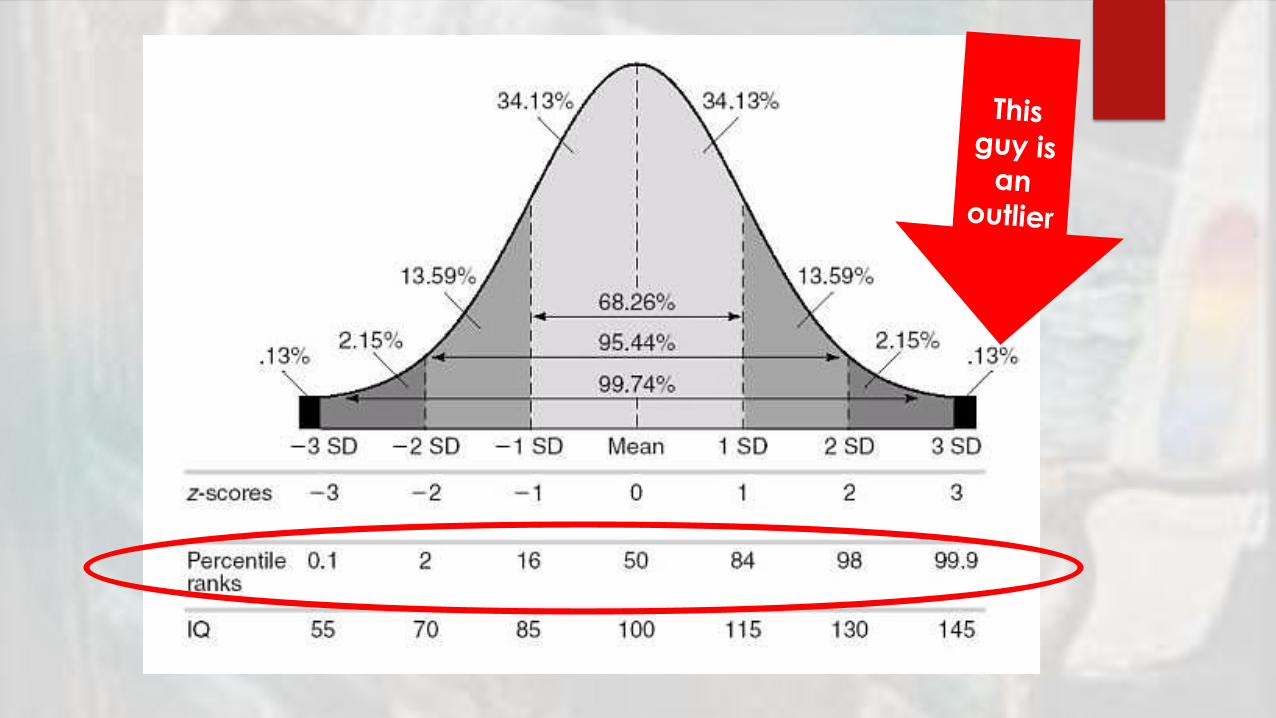
• Z-score measures the distance of a score from
the mean in units of standard deviation
• A z-score of -1SD means a score is 1SD
BELOW the mean, a +1SD is one above

Z-Score practice
IQ tests scores were compared between CB South & CB West. CB
South had a positive Z score while CB West had a negative Z score.
These scores definitively show:
a. Children at West are not as intelligent as children at South
b. Children at South scored above the mean
c. The IQ test result differences are statistically significant between the
two schools
d. Children at South are above average in intelligence
e. None of the above

To Calculate Variance
To calculate the variance for the set of
numbers 4, 5, 5, 6, 6, 6, 6, 7, 7, 8:
1. Calculate the mean (average)
1. 60÷10 = 6
2. Subtract the mean from each score in the
distribution above
3. This shows you how far each score
deviates from the mean, and when you
add all of these numbers together, they
should always equal zero.
4-6= -2
5-6= -1
5-6= -1
6-6= 0
6-6= 0
6-6= 0
6-6= 0
7-6= 1
7-6= 1
8-6= 2

To Calculate Variance (cont.)4. However, we want to convert the scores
to a form that allows us to add them up and not get zero. Therefore, we square all of the deviations scores, which removes all of the negative values.
5. Now when we add them up, we get 12. The larger this number is, the greater the dispersion of the scores is.
6. Now divide the sum above by the number of scores in the group. This gives you the variance or the estimate of the average distance that a score is away from the mean.
12 ÷ 10 = 1.2
-2
(squar
e this)
-2 x -2= 4
-1 -1 x -1= 1
-1 -1 x -1= 1
0 0 x 0= 0
0 0 x 0= 0
0 0 x 0= 0
0 0 x 0= 0
1 1 x 1= 1
1 1 x 1= 1
2 2 x 2= 4
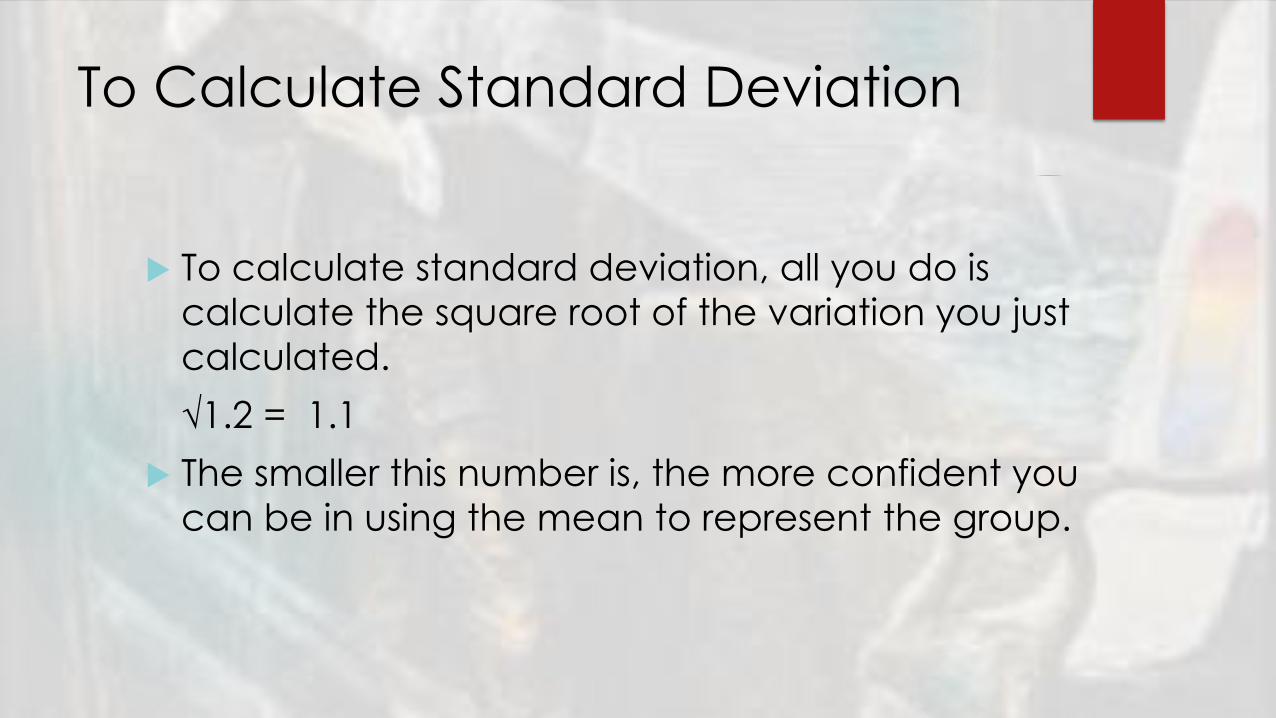
To Calculate Standard Deviation
To calculate standard deviation, all you do is
calculate the square root of the variation you just
calculated.
√1.2 = 1.1
The smaller this number is, the more confident you
can be in using the mean to represent the group.

How to find the standard deviation
when given the variance
Simply take the square root of the variance.
Ex: If the variance is 81. Take the square root of that. The
standard deviation is 9.
Try these:
If the variance is 144, the standard dev is ___.
If the variance is 9, the standard dev is ___.

Normal Distribution Of Scores
• IQ Scores, heights, shoe sizes of large groups of people usually produce a symmetrical distribution; pattern of scores on one side are a mirror of the other side
• Referred to as “Bell Curve” because of the shape
• Data in a normal distribution fall around the mean in the same way each time
• Percentile rank: Percentage of scores in a distribution that a particular score falls above

68 - 95 - 99.7 rule
• In a normal distribution:
• 68% of scores fall
within 1 SD of the
mean
• 95% fall within 2 SD
• 99.7% fall within 3 SD

Inferential Statistics
Inferential vs Descriptive
Statistical Significance
Statistical Reliability

Statistical SignificanceSignificance reported as p-value, which is the probability of getting the experimental results
• The closer the p-value is to ZERO, the less likely the result is due to chance
•ZERO indicates near certainty that the result is
due to manipulation of variables, basically
impossible
•When p (equal to or less than) ≤ 0.05 a researcher
can conclude that the result is unlikely due to
chance BUT with p ≤ 0.05, you can still expect a
different result in 1/20 trials
•When statistical analysis shows that the results of a
study are significant, the researcher can reject the
null hypothesis
•When you reject the null, you are saying that the
IV had an impact on the DV
•With p ≤ 0.05, rejecting the null will be the wrong
decision 5/100 times or less

Module 8 FREQUENTLY ASKED QUESTIONS ABOUT PSYCHOLOGY

• View video on studies from the past
• Why considered unethical?Ethical
studies in past
• What considerations are given today for animal/human research?
• what is important about the concepts of “informed consent” and “debriefing”?
• Is psychology free of value judgements?
Ethical guidelines

Meyers Text discussion
•Can laboratory experiments illuminate everyday life?
•Does behavior depend on one’s culture and gender?
Video Discussion
•Key points from video
•How does this connect to our previous modules?
Psychology
Applied
Social Media Assignment
Step 2: Social Media Analysis (Small Group/In Class)
A. Share your findings with your group and discuss patterns
B. Choose one example from your group, research the actual study or an
actual study related to the “reference”. Using terminology from this unit, write
a brief summary of your findings as to whether the study was presented in
social media accurately and properly.
Step 3: Reflection (Individual/In Class/On Back): How does this assignment reflect the themes of this unit?

Unit Review
4.1: Describe how hindsight bias, overconfidence, and the
tendency to perceive order in random events illustrate why science-
based answers are more valid than those based on intuition and
common sense.
4.2: Identify how the three main components of the scientific attitude
relate to critical thinking.
5.1: Describe how theories advance psychological science.
5.2: Describe how psychologists use case studies, naturalistic
observation, and surveys to observe and describe behavior, and
explain the importance of random sampling.

Unit Review
6.1: Describe positive and negative correlations, and explain how
correlational measures can aid the process of prediction but not
provide evidence of cause-effect relationships.
6.2: Explain illusory correlations.
6.3: Describe the characteristics of experimentation that make it
possible to isolate cause and effect.
7.1: Describe the three measures of central tendency, and discuss
the relative usefulness of the two measures of variation.

Unit Review
7.2: Explain how we know whether an observed difference can be
generalized to other populations.
8.1: Explain the value of simplified laboratory conditions in illuminating
everyday life.
8.2: Discuss whether psychological research can be generalized across
cultures and genders.
8.3: Explain why psychologists study animals, and describe the ethical
guidelines that safeguard animal research participants.
8.4: Describe the ethical guidelines that safeguard human research
participants.
8.5: Examine whether psychology is free of value judgements.