unit 1 - mrs. canale's science site · web viewunit 1 biology as a science handouts 2013 –...
TRANSCRIPT

Unit 1Biology as a Science
Handouts2013 – 2014

Controls and Variables – The Vermiculturist’s Experiment

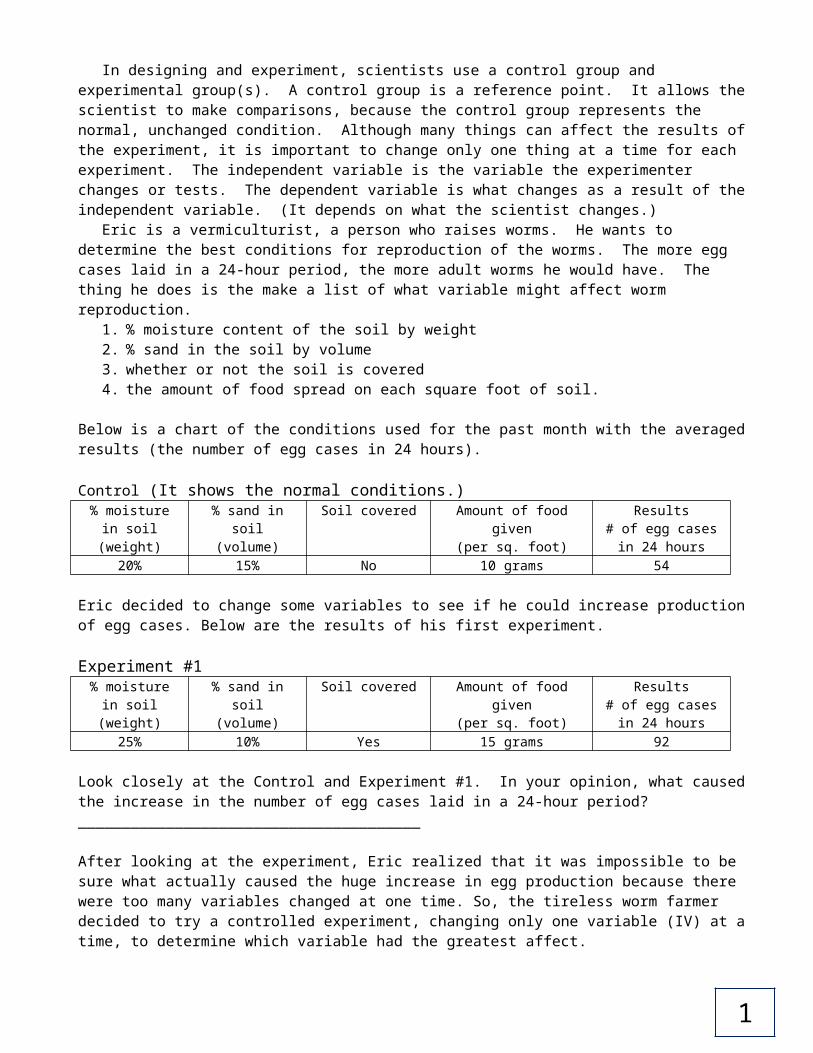
In designing and experiment, scientists use a control group and experimental group(s). A control group is a reference point. It allows the scientist to make comparisons, because the control group represents the normal, unchanged condition. Although many things can affect the results of the experiment, it is important to change only one thing at a time for each experiment. The independent variable is the variable the experimenter changes or tests. The dependent variable is what changes as a result of the independent variable. (It depends on what the scientist changes.)
Eric is a vermiculturist, a person who raises worms. He wants to determine the best conditions for reproduction of the worms. The more egg cases laid in a 24-hour period, the more adult worms he would have. The thing he does is the make a list of what variable might affect worm reproduction.
1. % moisture content of the soil by weight2. % sand in the soil by volume3. whether or not the soil is covered4. the amount of food spread on each square foot of soil.
Below is a chart of the conditions used for the past month with the averaged results (the number of egg cases in 24 hours).
Control (It shows the normal conditions.)% moisture in soil (weight)
% sand in soil (volume)
Soil covered Amount of food given (per sq. foot)
Results# of egg cases in
24 hours20% 15% No 10 grams 54
Eric decided to change some variables to see if he could increase production of egg cases. Below are the results of his first experiment.
Experiment #1% moisture in soil (weight)
% sand in soil (volume)
Soil covered Amount of food given (per sq. foot)
Results# of egg cases in
24 hours25% 10% Yes 15 grams 92
Look closely at the Control and Experiment #1. In your opinion, what caused the increase in the number of egg cases laid in a 24-hour period?_______________________________________
After looking at the experiment, Eric realized that it was impossible to be sure what actually caused the huge increase in egg production because there were too many variables changed at one time. So, the tireless worm farmer decided to try a controlled experiment, changing only one variable (IV) at a time, to determine which variable had the greatest affect.
4
1
Compare each of the experiments with the control conditions and identify the independent and dependent variable.
1. Circle the independent variable in each experiment. (IV = what changed)2. The dependent variable (what was counted/ measured) was always ___________________
Experiment% moisture
in soil (weight)
% sand in soil
(volume)
Soil covered Amount of food given
(per sq. foot)
Results# of egg
cases in 24 hours
Control 20% 15% No 10 grams 54#1 20% 10% No 10 grams 52#2 20% 15% No 15 grams 54#3 30% 15% No 10 grams 92#4 20% 15% Yes 10 grams 56
Questions1. Which independent variable (change) had the most effect on the number of egg cases produced? _______________________________________________________________________________
2. Write a hypothesis that predicts how this variable affects the number of egg cases. _______________________________________________________________________________
3. Do you know for sure if 30% moisture is the best? What could you do to find out?______________________________________________________________________________________________________________________________________________________________
4. Design a data table to show how you would change the % moisture to test your hypothesis.
5. To truly determine which factors have the greatest effect on worm egg cases how many experiments did the scientist have to perform? ________
6. Explain why one procedure could not fully answer the question. ___________________________________ ____________________________________________________________________________________
2

Scientific MethodTerms:
1. Observation: What is seen, smelled, tasted, touched, heard, or measured.
2. Inference: A conclusion based on observation or evidence.
3. Hypothesis: A prediction based on available evidence. A good hypothesis states both cause (Independent Variable) and effect (Dependent Variable).
a. A correct hypothesis can be tested and falsified (proven incorrect) using an experiment.b. The easiest way to write a correct hypothesis is as an “if-then” statement. (Ex: If I give patients this pill, then they will not get sick.)
4. Theory: An explanation of natural events that is supported by strong evidence. a. Theories tie together many scientific facts, hypotheses and laws.b. Misconception: “Theories are things that are opinions, or are not proven.” This is an incorrect use of the word “theory” in a scientific context. A scientific theory is not a simple guess or conjecture, and is strongly supported by evidence.
5. Controlled Experiment: An experiment, which tests the effect of the Independent Variable (IV) on the Dependent Variable (DV).
6. Independent Variable: The “thing” that is being tested (ex: new drug, new fertilizer).
a. There can only be ONE independent variableb. The “If” part of an “If-then” hypothesis.
7. Dependent Variable: The results- what is affected by the IV. The results are DEPENDENT upon what you are testing.
a. This is the data you collect during your experiment.b. The “then” part of an “If-then” hypothesis.
8. Control group: Group with the “NORMAL” conditions: it does not receive the new treatment/change (IV). The control group is your reference point – what you compare the experimental group results to. You have to know what normally happens in order to know how a change affected the results.
9. Experimental group: Group with the ONE change (IV) or receiving treatment. You compare this group’s results to the control group’s results to see the difference caused by the IV (one change)
10. Placebo: A sugar pill or other “fake” treatment given to the control group.
11. Constants: All the characteristics of the experiment that are kept the same (constant) so you only have one variable, the independent variable.
3


Characteristics of a good experiment:1. Can be repeated the same way and get the same results.
a. # of Trials/Repetitions – number of times an experiment is repeated to see if similar results are found. You must repeat experiment many times.
2. Have a large sample size (# of test subjects).a. Sample size – number of test subjects in each trial of experiment. You must have a large number of test subjects, this reduces the chance any variations in test subject affect results.
3. Are performed for longer periods of time.a. Especially in drug experiments – you need to see if there are any long term effects.
4. Test only one independent variable. All other characteristics of the tested groups should be the same.
5. Are peer reviewed – examined by several scientists to determine its accuracy.
6. Must test the hypothesis and show whether it is supported or refuted.
7. Is objective – the experiment and its conclusion is fair and unbiased. Fact and opinion are not mixed.
8. The experiment follows established ethical and legal standards.
a. Ethics – what is morally right and wrong
Scientific Method – method of gathering evidence to answer questions and solve problems dealing only with observable, empirical, and measurable evidence.
Steps of the Scientific Method:1. Ask a question/define a problem2. Conduct research to learn what is already known3. Form an hypothesis (prediction)4. Test hypothesis with a controlled experiment (Gather data)5. Analyze data6. Form conclusion/make inference based upon data – NOT opinion
4

Data Tables and Graphs1. Data tables are used to organize data, which usually is plotted in a graph.
a. First column in the table is for the independent variable.b. Second column is for the dependent variable. c. Each column should be titled, and include units of measurement.d. Data in the table must be arranged in ascending (small to large) or descending Order (large to small).
2. Graphs are used to “show” the relationship between the IV and DV.
a. Both the x and y axis of the graph must be labeled. These labels are typically the same ones used in the data table. Once again units of measurement must be written with the title.
b. The independent variable is always plotted on the x-axis.c. The dependent variable is always plotted on the y-axis.d. The x and y axis must be numbered.
i. These numbers must increase by a uniform increment (that is you must count by 1’s, 2’s, 5’s, 10’s, etc).
ii. Your numerical scales should take up most of the axes. Squeezing it all into the bottom corner makes the graph impossible to read and no credit will be given.
iii. The numbers must line up with the grid lines of the graph, not with spaces between them.
iv. You do not need to start numbering your axis with 0.v. You NEVER extend your line beyond the data points plotted.
e. All points plotted on your graph must be surrounded by a circle (or sometimes a square or triangle, depending on the directions).
5

Activity – Identifying Parts of a Controlled Experiment
In many cases an experiment will be presented to you with a title in the following format:
The effect of _____________________ on ______________________.
When this happens, the condition following, “The effect of” is the INDEPENDENT VARIABLE. The condition following, “on” is the DEPENDENT VARIABLE.
If you analyze the following title of an experiment:“The effect of the amount of water given to a plant on the amount of plant
growth”1. Independent Variable (IV) = ________________________________________2. Dependent Variable (DV) = __________________________________________3. A possible hypothesis would be - _____________________________________
______________________________________________________________4. The conditions of the control group would be: ___________________________5. The conditions of the experimental group would be: _______________________6. 5 constants would be:
a. _________________________________________________________b. _________________________________________________________c. _________________________________________________________d. _________________________________________________________e. _________________________________________________________
7. The data table would look like:
1. If you’re absent for any reason it is your responsibility to make up the missed work, this includes classwork, homework, exams, quizzes etc.

Graphing ProceduresStep 1: All graphs need an x-axis and a y-axis.
Draw your x & y axes. Use a ruler.
Step 2: Determine maximum values for your x & y axes from data table.Independent
VariableDependent Variable
Ramp Height(cm)
Distance (cm)Trials
1 2 3 Average2 27 30 27 284 62 61 57 606 105 100 95 100
8 123 125 127 125
Draw the y-axis on the left side leaving room for a scale and a label
Draw the x-axis near the bottom of the page. Leave room for a scale and a label
Leave room at the top for a title & your heading.In math class you may be asked to draw arrows at
the end of each axis. This is NOT necessary in science graphs.
(Sample data table from a science investigation)
Maximum value for x-axis → ←Maximum value for y-axis
7

Step 3: Add scales & labels Place minimum value at the intersection of the axes (the origin). If
the two axes have different minimum values then both minimum values need to be marked. Label each axis. Include units of measurement.
Step 4: Plot Data Points Normally (but not always), you will plot the mean values from your
data table. (mean = arithmetic average). Draw a line of best fit. That means a roughly equal number of data
points on either side of the line. It may be a curve in some cases. Again, in math class you may be asked to draw an arrow from the end of the line of best fit. This is NOT necessary in science graphs.
125
100
75
50
25
0 1 2 3 4 5 6 7 8
x
x
x
xDis
tanc
e (c
m)
Ramp Height (cm)
For most science graphs you can determine the interval to be used for each axis by dividing the maximum value for each axis by the approximate number of spaces available on the graph paper for each axis. Example below: On the y-axis, the maximum value is 125, there are 5 spaces. 125 divided by 5 = 25, so each line represents 25 centimeters. Round UP to a convenient number. The x-axis is easy—The maximum value of 8 is divided by 8 spaces = 1. Each grid line is 1 centimeter. Notice the numbers are ON THE LINES, not between them. If this is too confusing, you’ll have to use the old trial and error method – use a pencil!
125
100
75
50
25
0 1 2 3 4 5 6 7 8
Dis
tanc
e (c
m)
Ramp Height (cm)
(Independent Variable)
(Dep
ende
nt V
aria
ble)
8

Step 5: Add Title & Summary or results statement If the graph contains 2 or more lines, it also needs a key
Summary of results: As the ramp height increases the distance travelled increases.
Sample Line Graph (with checklist)
Did you place your variables on the proper axes? (X-axis - independent variable).
Are your data points plotted accurately?
Did you label your axes including units of measurement (meters, grams, minutes, etc)?
Are the numbers on your X & Y axes even increments?
Did you use colors in a neat & consistent way?
Did you connect only the data points or draw a best fit line?
Did you include a key? (Required if graph includes 2 or more lines.) Is it neat?
Is there a title?
Did you summarize in words the trend depicted in the graph?
As the ramp height increases, the distance the car travels increases.
The effect of ramp height on distance travelled
125
100
75
50
25
0 1 2 3 4 5 6 7 8
x
x
x
xDis
tanc
e (c
m)
Ramp Height (cm)
The effect of ramp height on distance travelled
9

Graphing PracticeProblem #1 – An organism known as Lepus americanus (snowshoe hare) is found in many places in North America. L. americanus is prey to Canus latrus (coyote) who lives in the same geographic location. Data on the effect of the number of L. americanus on the number of C. latrus found in a certain location is shown in the data table below.
Data TableAverage Number of Lepus americanus
per 1000 acres
Average Number of Canus LatrusPer 100 acres
75 .25112 .4190 .8235 1.0279 1.3
1. Write an appropriate title for the graph2. Label each axis correctly.3. Mark an appropriate scale on each axis.4. Plot each data point and circle.5. State what would most likely happen to the number of C. latrus per acre if the L.
americanus population was removed from the area?________________________________________________________
10

Graphing Trends(Results – Relationship between the IV and DV)
If you graph the results of an experiment, you can “see” the relationship between the independent variable (IV) and the dependent variable (DV) easier than when the data are in a data table. Once you “see” the relationship, you can state it simply in one sentence.
As the _____________________________________ increases/decreases, the
______________________________________ increases/decreases/stays the same.
**Remember – you always write the independent variable first and then the dependent variable.
Task:You can also use the relationship, written in words, to determine what the
graphed results would look like. For each relationship (trend) below, determine the IV and DV. Then, on the graphs on the following pages label the X axis with the IV and the Y axis with the DV, then draw a line that shows the relationship stated.
1. As the amount of sunlight increases, plant height increases.a. IV - ______________________ b. DV - ______________________
2. As the number of frogs increase, the number of mosquitoes decreases. a. IV - ______________________ b. DV - ______________________
3. As the number of trees decrease, the amount of carbon dioxide (CO2) increases.
a. IV - ______________________ b. DV - ______________________
4. As the amount of water decreases, the amount of plant growth decreases.a. IV - ______________________ b. DV - ______________________
5. As the amount of food increased, the weight of the guinea pig increased then stayed the same.
a. IV - ______________________ b. DV - ______________________
6. As the amount of exercise increased the subject’s heart rate increased.a. IV - ______________________ b. DV - ______________________
(Independent Variable)
(Dependent Variable)

11

Graphing Trends1
3 6
52
4
12

Metric ConversionsWhen using the metric system, it is relatively easy to convert measurements to other units (for example from centimeters to meters), but requires some practice. Because the units come in multiples of ten, converting measurements simply means moving the decimal point.
Standard units The meter (m) is the standard unit of length. The liter (L) is the standard unit of volume. The gram (g) is the standard unit of mass.
Prefixes (this term goes in front of: meter, liter, or gram): Kilo (K) = 1,000 of the standard unit (Kilometer, Kiloliter, Kilogram) Hecto (H) = 100 of the standard unit (Hectometer, Hectoliter, Hectogram) Deca (D) = 10 of the standard unit (Decameter, Hectoliter, Hectogram) Deci (d) = 0.1 (1/10) of the standard unit (Decimeter, Deciliter, Decigram) Centi (c) = 0.01 (1/100) of the standard unit (Centimeter, Centiliter, Centigram) Milli (m) = 0.001 (1/1000) of the standard unit (Millimeter, Milliliter, Milligram) Micro (u) = 0.000001 (1/1000000) of the standard unit (Micrometer, Microliter,
Microgram)
K(Kilo)
Km, Kl, Kg
H(Hecto)Hm, Hl,
Hg
D(Deca)Dm, Dl,
Dg
m (meter)l (liter)
g (gram)
d(deci)
dm ,dl, dg
c(centi)cm, cl,
cg
m(milli)
mm, ml, mg
boop(space)
boop(space)
u(micro)Um, ul,
ug
Let’s practice! Convert the following:

1. 100 cg = __________________g
2. 5769 um = _______________mm
3. 63.5 mg = ________________cg
4. 4.3 l = ___________________cl
5. 12.66 dm = _______________mm
6. 2,544 ml = _________________l
7. 0.304 Km = ________________m
8. 1,030 Dg = ________________kg
9. 0.084 Dl = ________________cl10. 19.25 Kl =
_______________dl
11. 0.344 dl = ________________Hl
12. 70005 um = ______________cm
13. 0.000045 Kg = ____________ug
14. 278.931 dl = ______________Dl
15. 16,427 m = _______________um
16. 57.39 Hg = _______________mg
17. 200 g = _________________ug
18.823.66 dg = _______________g 13

K=Kilo
km/kL/kgKing
H=hectoHm/hL/
hgHenry
D=decaDm/DL/
DgDied
Meter (m)
Liter (L)Gram (g)
d=decidm/dL/dg
Drinking
c=centicm/cL/cg
Chocolate
m=millimm/mL/mg
Milk
Boop Boop u=microum/uL/ug
1 g 10 dg 100 cg
Move the decimal point one space for every box you move, AND in the direction you move (left or right).
14

1.
6.
5.
4.
3.
2.
Laboratory Equipment In the space next to each piece of equipment, write the name of the equipment and its function.
Name Function
15

7.
8.
9.
10.
11.
Name Function
16

13.
12.
14.
15.
16.
Name Function
17

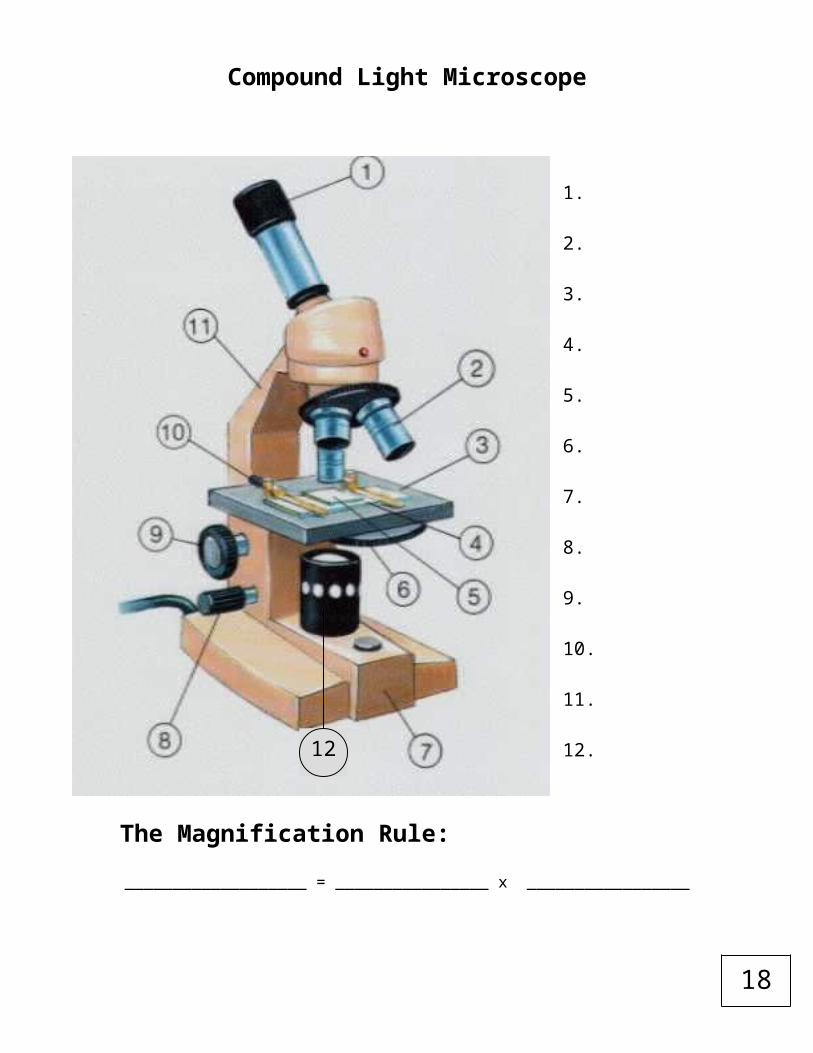
Compound Light Microscope
1.
2.
3.
4.
5.
6.
7.
8.
9.
10.
11.
12.
The
Magnification Rule:___________________ = ________________ x _________________
12
18

Procedure for Focusing the Microscope1. Turn on the light source
2. Make sure the lowest power objective is in place (the shortest one).
3. Place the slide on the stage so that the object you are viewing is under the objective, and secure the slide with the stage clips.
4. Looking from the side of the microscope, carefully raise the stage by turning the course adjustment knob until the stage is as high as it will go.
5. Look through the eyepiece (ocular) and adjust the diaphragm if it is too dark or too bright.
6. While looking through the eyepiece, slowly turn the coarse adjustment so that the stage moves away from the objective until you see the object. You may have to move the slide around to find the object if you don’t see anything after moving the stage.
7. When you find the object, turn the fine adjustment until the object is clearly focused.
8. Very gently move the slide until the object is exactly centered.
9. Without touching the slide or the adjustment knobs, turn the nosepiece so that the high power objective is in place.
10. At this point, DO NOT TOUCH THE COURSE ADJUSTMENT KNOB!
11. Focus the image using only the fine adjustment knob!
Steps for putting microscope away properly:1. Remove slides2. Turn off power and unplug3. Lower stage to lowest position4. Put lowest objective in place5. Wrap cord around base6. Cover with plastic dust cover7. Hold by arm and base to carry
19

Key points:In a _____________________________ microscope (the kind we use), images are _______________, __________________ AND __________________.
Example:If you place each slide on the stage facing you, like this:
The letter would look like this when you look through the ocular.
Therefore, when you move a slide in one direction, while looking into the ocular it appears to _________________________________.
Example:If the protist (small living organism) in the field of view below moves to the right and down on the slide, what will you view through the ocular? Draw below.
ee f h
20

Microscope - Field of View (FOV)When you look through the ocular, you should see a circle of light in which your specimen will appear. This area through which you can view specimens is called the _______________________. Depending upon which objective is being used the size (area) of the field of view will vary – either increase or decrease.
Low power:When you use a low power objective lens, the field of view is ___________, meaning you are seeing a larger ______________ of the slide.
High power:When you use a high power objective lens, the field of view is __________. The circle of light appears to be the same size, but you are seeing a MUCH ____________________________ of the slide.
1. As the magnification increases, the field of view (FOV) _______________.2. As the magnification decreases, the field of view (FOV)
_______________.3. Which objective has the smallest field of view? ________________4. Which objective has the largest field of view? _________________
Low power objective (10x)
High power objective (40x)
Field of view
21

Measuring the FOV
Field of View (FOV) under low power is measured: A metric ruler is used to measure the diameter of the field of view under low power. (Diameter = the measurement across a circle going directly through the center of the circle).
FOV under high power is calculated:Since we cannot see one whole millimeter under high power, there is no way to measure the diameter. So we must calculate it using the low power diameter.
1. Determine the ratio of magnification between 2 objectives:(how many more times does high power magnify a specimen than low power)
Ratio of magnification = High power magnification = High power divided by low power
Low power magnification
2. Determine the High Power FOV diameter:(If the high power objective is 4 times stronger (enlarges the image 4 times more) than the low power objective, then the field of view is 4 times smaller.)
High Power FOV diameter = Low power diameter = low power divided by ratioRatio of magnification of magnification
About how many millimeters is the diameter of the field of view? Estimate what portion of a millimeter the small portion to the right is, then add it to the 1 mm you see on the left (1mm + ? = _____ mm)
Diameter (low power) = _______mm
Convert to micrometers (um):Diameter (low power) = _______um
Metric ruler placed on stage to measure
diameter of FOV of low
power
1 mm

22

Practice Determining the Diameter of the Field of View
Steps:1. Use the metric ruler pictured to measure the low power FOV diameter in millimeters.
a. Remember – you have to estimate the size of the small area that is less than 1mm
2. Move the decimal 3 places to the right to convert millimeters to micrometers3. Calculate the ratio of magnification by dividing the high power magnification by the
low power magnification4. Calculate the high power diameter by dividing the low power diameter by the ratio of
magnification.5. Convert the high power diameter to micrometers.
1. Low power total magnification = 40x & High power total magnification = 400X
Low power diameter (measure with ruler pictured):_____________ mm _____________ um
Calculate ratio of magnification: High power magnification = _____________Low power magnification
High power diameter (calculate):Low power diameter (mm) = _____________ mmRatio of magnification
_____________ um
Follow the same steps as above to complete the problem below.2. Low power total magnification = 10x & High power total magnification
= 400X
Low power diameter (measure):_____________ mm
_____________ um
High power diameter (calculate):_____________ mm
_____________ um
1 mm
1 mm
24
23
Measuring the Size of a Specimen with a Microscope
Knowing the dimensions of the field of view useful for scientists examining very small organisms, why? ___________________________________________________
Determine the length and width of each specimen below (don’t forget your units).

3.0 mm
1.5 mm
1.0 mm
In millimeters:Length (side to side) = _______
Width (up and down) = _______
Convert to micrometers:Length (side to side) = _______
Width (up and down) = _______
In millimeters:Length (side to side) = _______
Width (up and down) = _______
Convert to micrometers:Length (side to side) = _______
Width (up and down) = _______
In millimeters:Length (side to side) = _______
Width (up and down) = _______
Convert to micrometers:Length (side to side) = _______
Width (up and down) = _______
24
