union assurance plc | annual report 2020
TRANSCRIPT

UNION ASSURANCE PLC | ANNUAL REPORT 2020
UN
ION
AS
SU
RA
NC
E P
LC
| AN
NU
AL
RE
PO
RT
20
20


Our report, with additional updated information is
available on our website:
www.unionassurance.com

For over 30 years at Union Assurance, we have worked tirelessly towards creating a comprehensive portfolio of products and services that span the wide-ranging needs of the Sri Lankan people.
That’s why during the year under review, driven by a dynamic team of professionals, we repositioned ourselves with a renewed purpose. As we restructured our systems and processes, adopting a 360° approach that encompasses every Stakeholder, our holistic action plan ensured business continuity even amidst the uncertainties of a global pandemic.
As we navigate through these challenges with resourceful technologies, future-ready strategies and a broad and positive outlook of the future, Union Assurance is focused on integrating a 360° delivery of value that protects and empowers our Stakeholders, whoever and wherever they may be.

VALUING GENERATIONS
VALUING AMBITIONS
CONTENTS
Union Assurance at a Glance
6 About Our Report
8 Who We Are
8 Milestones and Key Events
10 Chairman’s Message
12 CEO’s Review
14 Value Generated and Distributed
15 Performance Highlights
Management Discussion and Analysis
20 Value Creation Framework
20 A New Purpose
20 Stakeholder Engagement
22 Materiality
25 Strategy and Resource
Allocation
26 Business Model
28 Organisation Structure
29 Sustainability
31 Operating Context
35 Capital Management Review
35 Capital Management
Summary/ Trade-off
36 Financial Capital
46 Manufactured Capital
50 Natural Capital
54 Human Capital
60 Social and Relationship
Capital
68 Intellectual Capital
72 Outlook
10
12
20
35
76
78
123
CHAIRMAN’S MESSAGE
CEO’S REVIEW
VALUE CREATION
FRAMEWORK
CAPITAL MANAGEMENT
REVIEW
BOARD OF DIRECTORS
EXECUTIVE
COMMITTEE
FINANCIAL
STATEMENTS

VALUING ASPIRATIONS
VALUING RELATIONSHIPS
VALUING MOMENTS
Financial Statements
125 Annual Report of the Board of
Directors on the Affairs of the
Company
130 Chief Executive Officer’s and Chief
Financial Officer’s Responsibility
Statement
131 Actuary’s Report
132 Statement of Directors’
Responsibility
133 Independent Auditors’ Report
137 Table of Contents
138 Income Statement
139 Statement of Profit or Loss and
Other Comprehensive Income
140 Statement of Financial Position
141 Statement of Changes in Equity
143 Statement of Cash Flows
145 Notes to the Financial Statements
Supplementary Information
234 Decade at a Glance
236 Independent Assurance Report on
Non-Financial Reporting
238 GRI Content Index
244 Certificate of Carbon Footprint
245 Glossary of Insurance Terms
247 Quarterly Analysis
248 Insurance Revenue Account
249 Statement of Financial Position
250 Statement of Cash Flows
252 Notes to the Statement of Financial
Position
256 Understanding our Financials
257 Distribution Network
259 Corporate Information
260 Notice of Meeting
261 Proxy Form
Stewardship
76 Board of Directors
78 Executive Committee
80 The Chairman’s Statement on
Corporate Governance
81 Corporate Governance
Commentary
112 Enterprise Risk Management

VALUING GENERATIONS
UNION ASSURANCE AT A GLANCE
6 About Our Report8 Who We Are
8 Milestones and Key Events10 Chairman’s Message12 CEO’s Review14 Value Generated and Distributed15 Performance Highlights

6 Union Assurance PLC
ABOUT OUR REPORT
We present our Integrated Annual Report which aims to provide our Stakeholders a concise, balanced and accurate assessment of our strategy, performance and opportunities, in relation to material financial, economic, social, environmental and governance issues and our ability to create value in the short, medium and long term.
At Union Assurance, we are committed to deliver quality products and services to our customers, so that they may achieve extraordinary things in life.
Read more on page 6 Read more on page 75
As your health and safety is paramount important to us and we are moving on another step in our sustainability agenda, 34th Annual General Meeting (AGM) will be held on virtual mode. A link to join the AGM and QR code to access your Annual Report 2020 are provided in Notice of Meeting.
Scope and Boundary The Report covers the operations of Union Assurance PLC for the period from 1 January 2020 to 31 December 2020 which is the Company’s annual reporting cycle.
Information in this report pertaining to the previous year has not been restated, unless otherwise stated.
Materiality We apply the principle of materiality in our reporting, to ensure that we address all material aspects that impact our ability to deliver sustainable value to our Stakeholders. Material matters are identified through an extensive Stakeholder engagement process, through Board, Executive Committee and Corporate Management team discussions and through our risk management process.
102-12, 102-46, 102-48, 102-49, 102-50
GRI
Guiding Principles
• Integrated Reporting Framework
of the International Integrated
Reporting Council (IIRC).
• “A Preparer’s Guide to Integrated
Corporate Reporting”- issued by the
Institute of Chartered Accountants
of Sri Lanka (ICASL).
• Listing Requirements of the Colombo Stock Exchange and subsequent revisions to date.
• Code of Best Practice on Corporate Governance issued by the ICASL and Securities and Exchange Commission (SEC).
• Corporate Governance Framework for insurers issued by the Insurance Regulatory Commission of Sri Lanka (IRCSL).
• Laws and regulations of the Companies Act No. 7 of 2007.
• Insurance Industry Act No. 43 of 2000 and subsequent amendments to date.
• Guidelines, Determinations, Rules and Regulations issued by the Insurance Regulatory Commission of Sri Lanka (IRCSL).
Integrated Report Corporate Governance and Risk Management Report
Page 22
Materiality
Page 112
Risk Management
Page 20
Stakeholder Engagement
Read more on page 123
Annual Financial Statements
• Sri Lanka Accounting Standards
(SLFRS/LKAS) issued by the ICASL.
• Listing Requirements of the
Colombo Stock Exchange and
subsequent revisions to date.
• Laws and regulations of the
Companies Act No. 7 of 2007
• Insurance Industry Act No. 43 of
2000 and subsequent amendments
to date.
• Guidelines, Determinations, Rules
and Regulations issued by the
Insurance Regulatory Commission
of Sri Lanka (IRCSL).
7 Annual Report 2020
Union Assurance at a Glance Management Discussion and Analysis Stewardship Financial Statements Supplementary Information
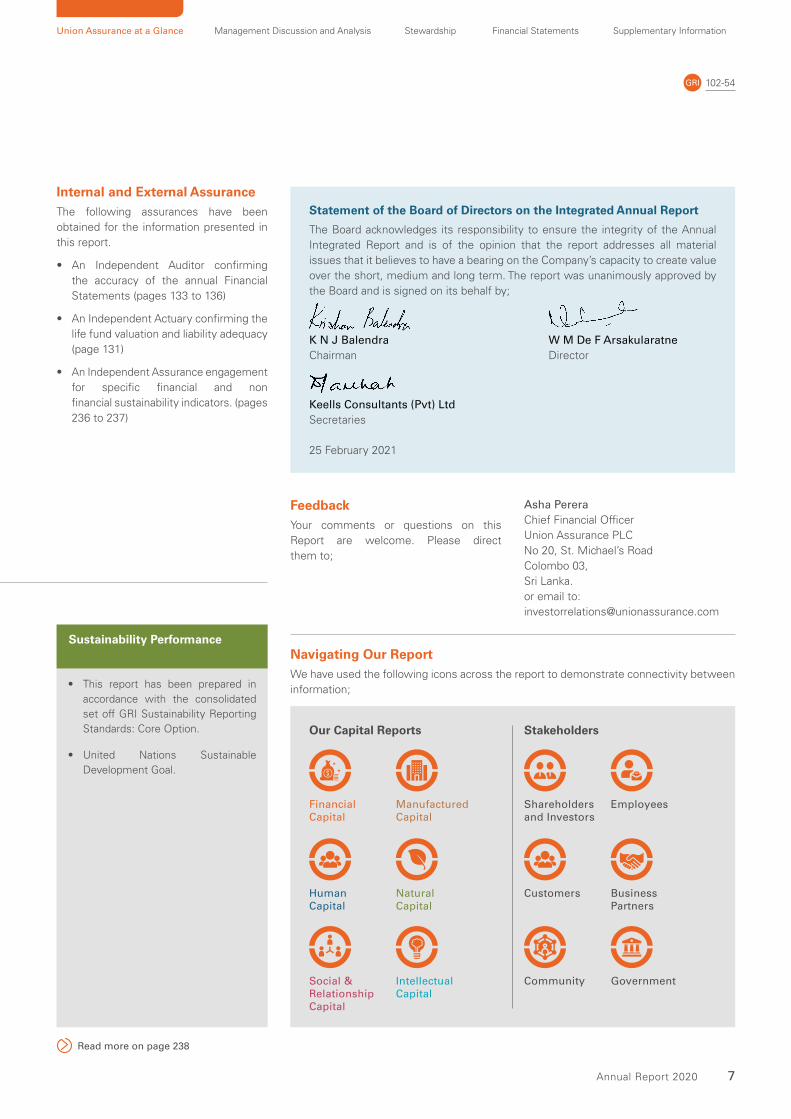
Navigating Our ReportWe have used the following icons across the report to demonstrate connectivity between
information;
Statement of the Board of Directors on the Integrated Annual Report
The Board acknowledges its responsibility to ensure the integrity of the Annual
Integrated Report and is of the opinion that the report addresses all material
issues that it believes to have a bearing on the Company’s capacity to create value
over the short, medium and long term. The report was unanimously approved by
the Board and is signed on its behalf by;
K N J Balendra W M De F Arsakularatne
Chairman Director
Keells Consultants (Pvt) Ltd
Secretaries
25 February 2021
Read more on page 238
Financial Capital
Shareholders and Investors
Social & Relationship Capital
Employees
Human Capital
Customers Business Partners
Our Capital Reports Stakeholders
Natural Capital
Intellectual Capital
Community Government
FeedbackYour comments or questions on this
Report are welcome. Please direct
them to;
Asha Perera
Chief Financial Officer
Union Assurance PLC
No 20, St. Michael’s Road
Colombo 03,
Sri Lanka.
or email to:
Internal and External Assurance The following assurances have been
obtained for the information presented in
this report.
• An Independent Auditor confirming
the accuracy of the annual Financial
Statements (pages 133 to 136)
• An Independent Actuary confirming the
life fund valuation and liability adequacy
(page 131)
• An Independent Assurance engagement
for specific financial and non
financial sustainability indicators. (pages
236 to 237)
Manufactured Capital
102-54GRI
• This report has been prepared in
accordance with the consolidated
set off GRI Sustainability Reporting
Standards: Core Option.
• United Nations Sustainable
Development Goal.
Sustainability Performance

WHO WE ARE
As one of the largest Life Insurance
solutions providers in the country, Union
Assurance has been in the business of
protecting lives, empowering people and
providing peace of mind to thousands of
Sri Lankans since 1987.
Buoyed by a team of dynamic professionals,
strong capital base and highly rated global
reinsurers we offer our customers tailor-
made insurance products and services that
meet the highest international standards.
We have realigned our strategies based on the insights we gained by Stakeholder feedback over the years. We are striving to serve them better in the years to come.
30+ YEARS OF INSURING LIVES AND
EMPOWERING PEOPLE
Val
ues
: Exc
elle
nce, C
aring, Innovation, Trust, Ethics, Inte
grity
to o
ur
Em
plo
yees
, Fie
ld S
taff, Business Partners, Shareholders and th
e Co
mm
un
ity
Mis
sio
n :
To
pro
vid
e pr
otec
tion, fi
nancial security and create wealth for our custom
ers, ad
din
g v
alu
e
Vis
ion
: To b
e the m
ost sought after provider of insurance solutions
Portfolio
LIFE FUND
ASSETS UNDER MANAGEMENT
Rs. 42 Bn
Rs. 52 Bn
Presence
BRANCHES ISLAND WIDE
75
1988 2006 2007 2008 2009
Listed on the Colombo
Stock Exchange
and commenced
operations.
• Became the first
insurance Company
to launch a fully
integrated and
automated SMS
supported facility for
motor claims.
• Launched Union Pay
Easy, the Country’s
first automated
payment system.
Entered the 20th year
of operations with the
life fund crossing
Rs. 6 Bn mark.
Launched web-based
motor insurance policy,
enabling customers
to print their motor
insurance certificates
24x7x365.
• John Keells Holdings
PLC gained an 81%
stake in UA
• UA brand was
repositioned on a
platform of Trust.
• Expanded
Bancassurance
distribution channel.
Milestones and Key Events
Our journey spanning 33 years has been marked with significant achievements that have propelled us to where we are today.
https://unionassurance.com/about-us/
102-2, 102-6GRI
8 Union Assurance PLC

Union Assurance at a Glance Management Discussion and Analysis Stewardship Financial Statements Supplementary Information
Environmental Impact
Our ProductsSocial Impact
Financial Impact
Our People
CARBON FOOT PRINT
1,062 tCo2e
TREES SAVED
265
ENERGY SAVING
323,889 kWh
WATER SAVING
4,434 m3
Universal Life
Endowments
Term Insurance
Group Life
Annuity
NO. OF LIVES
COVERED
250,000+
825
2,000Individuals
Families
REGULAR NEW
BUSINESS PREMIUMS
Rs. 3 Bn
GROSS WRITTEN
PREMIUM
Rs. 13 Bn
PROFIT BEFORE TAX
Rs. 1.8 Bn
NO. OF TOT MDRTs
5
NO. OF COT MDRTs
10
Financial Strength
MARKET CAPITALISATION
CAPITAL ADEQUACY RATIO EMPLOYEES
Rs. 18 Bn
341% 795
Partnerships
A+ GRADED REINSURERS
4Team
FIELD SALES FORCE
3,500+
Group
A SUBSIDIARY OF JOHN KEELLS HOLDINGS PLC
2011 2015 2018 2019 2020
• Launched the first
trilingual website in the
insurance industry
• Introduced the SAP
finance module to
integrate the core
business activities with
financial reporting.
Segregated Life and
Non-Life businesses
and divested 78% of
the Non-Life business to
Fairfax Asia Limited.
• Went live with a state-of-the-art web-based Policy Administration System at a cost of Rs. 800 Mn.
• Awarded as the Most Trusted Life Insurer in Asia at Asia’s Most Trusted Brand Awards 2018 and a ranking in the Forbes Asia, “Best Under A Billion” list.
• Leadership change
with the appointment
of a new Chief
Executive Officer.
• Launch of
“Octave” advanced
data analytics
transformation
projects.
• Launch of new UA brand and logo
102-45GRI
NO. OF MDRTs
GPTW CERTIFICATION
157
8thConsecutive year
NO. OF LIVES
TOUCHED
9 Annual Report 2020
10 Union Assurance PLC
CHAIRMAN’S MESSAGE
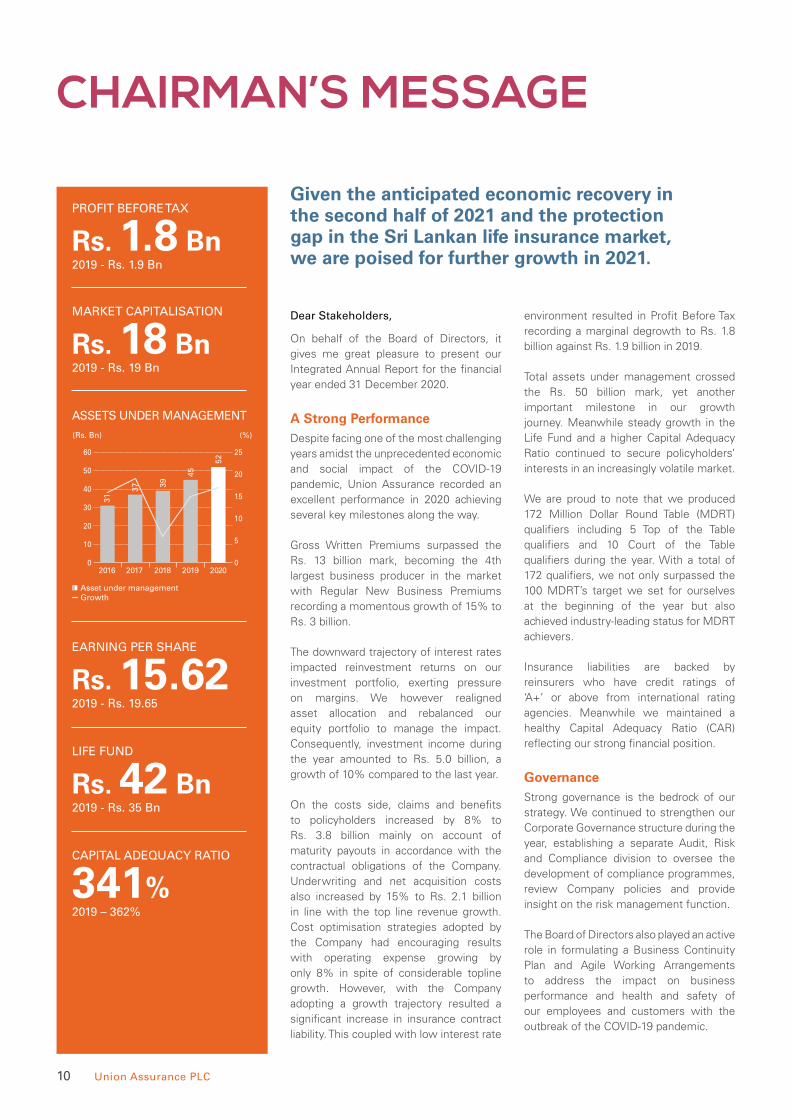
Given the anticipated economic recovery in the second half of 2021 and the protection gap in the Sri Lankan life insurance market, we are poised for further growth in 2021.
Dear Stakeholders,
On behalf of the Board of Directors, it
gives me great pleasure to present our
Integrated Annual Report for the financial
year ended 31 December 2020.
A Strong Performance Despite facing one of the most challenging
years amidst the unprecedented economic
and social impact of the COVID-19
pandemic, Union Assurance recorded an
excellent performance in 2020 achieving
several key milestones along the way.
Gross Written Premiums surpassed the
Rs. 13 billion mark, becoming the 4th
largest business producer in the market
with Regular New Business Premiums
recording a momentous growth of 15% to
Rs. 3 billion.
The downward trajectory of interest rates
impacted reinvestment returns on our
investment portfolio, exerting pressure
on margins. We however realigned
asset allocation and rebalanced our
equity portfolio to manage the impact.
Consequently, investment income during
the year amounted to Rs. 5.0 billion, a
growth of 10% compared to the last year.
On the costs side, claims and benefits
to policyholders increased by 8% to
Rs. 3.8 billion mainly on account of
maturity payouts in accordance with the
contractual obligations of the Company.
Underwriting and net acquisition costs
also increased by 15% to Rs. 2.1 billion
in line with the top line revenue growth.
Cost optimisation strategies adopted by
the Company had encouraging results
with operating expense growing by
only 8% in spite of considerable topline
growth. However, with the Company
adopting a growth trajectory resulted a
significant increase in insurance contract
liability. This coupled with low interest rate
environment resulted in Profit Before Tax
recording a marginal degrowth to Rs. 1.8
billion against Rs. 1.9 billion in 2019.
Total assets under management crossed
the Rs. 50 billion mark, yet another
important milestone in our growth
journey. Meanwhile steady growth in the
Life Fund and a higher Capital Adequacy
Ratio continued to secure policyholders’
interests in an increasingly volatile market.
We are proud to note that we produced
172 Million Dollar Round Table (MDRT)
qualifiers including 5 Top of the Table
qualifiers and 10 Court of the Table
qualifiers during the year. With a total of
172 qualifiers, we not only surpassed the
100 MDRT’s target we set for ourselves
at the beginning of the year but also
achieved industry-leading status for MDRT
achievers.
Insurance liabilities are backed by
reinsurers who have credit ratings of
‘A+’ or above from international rating
agencies. Meanwhile we maintained a
healthy Capital Adequacy Ratio (CAR)
reflecting our strong financial position.
Governance Strong governance is the bedrock of our
strategy. We continued to strengthen our
Corporate Governance structure during the
year, establishing a separate Audit, Risk
and Compliance division to oversee the
development of compliance programmes,
review Company policies and provide
insight on the risk management function.
The Board of Directors also played an active
role in formulating a Business Continuity
Plan and Agile Working Arrangements
to address the impact on business
performance and health and safety of
our employees and customers with the
outbreak of the COVID-19 pandemic.
PROFIT BEFORE TAX
MARKET CAPITALISATION
ASSETS UNDER MANAGEMENT
EARNING PER SHARE
LIFE FUND
CAPITAL ADEQUACY RATIO
2019 - Rs. 1.9 Bn
2019 - Rs. 19 Bn
2019 - Rs. 19.65
2019 - Rs. 35 Bn
2019 – 362%
Rs. 1.8 Bn
Rs. 18 Bn
Rs. 15.62
Rs. 42 Bn
341%
(Rs. Bn) (%)
2016 2017 2018 2019 20200
10
20
30
40
50
60
0
5
10
15
20
25
Asset under managementGrowth
31
37 39
45
52

11 Annual Report 2020
Union Assurance at a Glance Management Discussion and Analysis Stewardship Financial Statements Supplementary Information
A Bold New IdentityDuring the year we embarked on a
rebranding initiative aimed at re-positioning
ourselves as a new-age, customer-
centric, digital life insurer that truly
understands our customers aspirations.
Our newly-launched identity reflects our
commitment to changing and evolving to
suit emerging requirements of consumers
whilst sustaining our reputation of being a
trusted insurer. The new logo unveiled as
part of this rebranding exercise depicts the
circle of life while the new tag line “Your
Life, Our Strength” reflects the symbiotic
relationship we share with our customers.
Digital LeadershipDigitisation is rapidly transforming the life
insurance business landscape, and we are
proud to be a catalyst in this revolution.
Having embarked on our digital journey
several years ago we continued to make
strides during the year with the launch
of several innovative digital products,
continued automation of processes and
greater reliance on data analytics.
A key achievement during the year was
the launch of Clicklife, a revolutionary
end-to-end digital solution that offers
customers a seamless digital experience
from policy purchase to issuance and
servicing. This together with the Clicklife
App is transforming our customer value
proposition by making insurance simpler,
more affordable and more accessible.
The “Lapse Prevention Project” which
uses advanced data analytics to predict
insurance policies that are likely to lapse
in a 3-6 months period, and recommend
interventions based on customer type
and account size is yet another significant
milestone in our digital transformation
journey. During the year we also expanded
and strengthened our digital payment
channels for customer convenience during
the pandemic.
Supporting Our People Ensuring the health and safety of our
employees and providing them the
necessary support to navigate the
challenges faced during the year were
key priorities for us. We implemented
an agile work-from-home (WFH) policy
for all employees and strengthened our
information technology infrastructure to
support this arrangement.
We also continued to deliver on our
employee promise by effectively
leveraging digital and virtual platforms
to engage, develop and motivate our
employees. Leadership development
and skill development programmes
continued online, while virtual townhall
meetings, a virtual annual award event
and other employee engagement events
enabled us to continue to engage with our
employees despite the disruptions caused
by COVID-19 outbreak.
We are proud to have been recognised
as a Great Place to Work (GPTW) in Sri
Lanka for the 8th consecutive year, a true
testament to our unwavering commitment
to delivering on our employee promise.
Supporting Our Communities Our CSR vision is clear. To create
a knowledgeable, healthier and
better tomorrow through meaningful
interventions in our communities. Our CSR
programmes in the core areas of Health,
Education and Environment continued
during the year in partnership with the
Ministry of Health, Ceylon Deaf and
Blind School and SOS Children’s Villages.
Meanwhile as part of our efforts to
support the Government in managing the
Pandemic, we ran a co-branded campaign
with the Ministry of Health to support
public awareness in protecting against
the virus.
Recognition Our trailblazing efforts in forging a digital
roadmap and swiftly adapting to a new
operating model were recognised both
locally and internationally. Union Assurance
was adjudged No. 1 in the Insurance
Sector in the inaugural ranking of “LMD’s
Most Awarded. We were also awarded the
coveted title of “Domestic Life Insurer of
the Year” at the prestigious Insurance Asia
Awards 2020 while also being the proud
recipients of the Celent Model Insurer
Award (a part of the Oliver Wyman Group)
for Digital Insurer of the year.
A Positive Outlook Our strong performance in 2020 not
withstanding the challenges during the
year, is a validation of our forward-thinking
strategy and a testament to our resilience
amidst chaos. We are therefore confident
given the anticipated economic recovery in
the second half of 2021 and the protection
gap in the Sri Lankan Life Insurance
market, we are poised for further growth
in 2021.
AcknowledgementsOn behalf of the Board and the entire UA
team I would like to thank Mr. Harin De
Silva Wijeyeratne for his invaluable service
to the Company over the last 9 years as an
Independent Director and Chairman, Board
Audit and Compliance Committee. I would
like to welcome Mr. Daminda Gamlath and
Mr. Malinga Arsakularatne to the Board of
UA whose vast experience and knowledge
would be valuable to the long-term journey
the Company has embarked upon.
I also take this opportunity to place on
record our appreciation to the Chairman,
Director General and team at the Insurance
Regulatory Commission of Sri Lanka for
ensuring that Stakeholder concerns are
heard and addressed. Our appreciation also
goes out to the Insurance Ombudsman
for providing an efficient, independent
grievance handling mechanism.
To my fellow Directors, Chief Executive
Officer, Senior Management Team and
entire UA team, my deep appreciation goes
out for your untiring effort, commitment
and drive during this difficult year.
Krishan Balendra
Chairman
25 February 2021

12 Union Assurance PLC
CHIEF EXECUTIVE OFFICER’ S REVIEW
Looking back on 2020, I am proud to announce that we delivered on our commitments across our strategic priorities and demonstrated our ability to consistently execute as we transform Union Assurance into the most digital, customer-centric Company in our industry.
Our promise “Your Life. Our Strength” is what drives our 3,500 colleagues to deliver protection to over 250,000 Sri Lankans every day. We have stood for the protection of dreams, relationships, and lifestyles, as we empowered our customers to dream bigger and plan better. 2020 was a year of transformation for Union Assurance as we relaunched the brand with a bold new identity and positioning as the trusted protector of the Sri Lankan dream.
To live by our promise, we had to think differently about our products, services, platforms, people, and processes - all with the view of offering our customers a best-in-class experience. Needless to say, that the pandemic brought on an enormous challenge to an industry which is highly dependent on physical interactions. The vigorous overhauling of our operating model ensured we established dominating market presence and resilience, recorded growth in new business, propelled digital adaptability, re-enforced commitment to our employees, and implemented customer-centric initiatives to stay connected and relevant in a continuously evolving landscape. We made steady progress in how we supported our customers and our people amidst the challenges of two lockdowns and an economic downturn.
Among our most noteworthy achievements of 2020, I’m proud to announce that for the first time in our history, Union Assurance recorded the highest number of MDRT (Million Dollar Round Table) achievers in Sri Lanka, including 10 Court of the Table and 5 Top of the Table achievers.
We were recognised as the Domestic Life Insurer of the Year by Asia Insurance Awards, #1 Most Awarded Brand in Insurance by LMD, Best Employer Brand by World HRD Congress, Best Brand and Sustainable Marketing Excellence by CMO Global/CMO Asia, and was recognised as a Great Place to Work for the eighth consecutive year by GPTW ®.
I am exceptionally proud of the commitment and winning mindset of our colleagues in making 2020 a remarkable year for Union Assurance. Our success is fuelled by their commitment, dedication, and persistence.
Looking back on 2020, I am proud to announce that we delivered on our commitments across our strategic priorities and demonstrated our ability to consistently execute as we transform Union Assurance into the most digital, customer-centric Company in our industry.
An Outstanding Business Performance In the face of these challenging conditions, UA adopted a forward-looking strategy aimed at adapting to a fast evolving “new normal”.
Following the swift transition to a new operating model, we worked collectively towards sustaining and driving revenue. Gross Written Premiums grew by 13% and surpassed the Rs. 13 billion mark while regular New Business premiums recorded an impressive growth of 15% to Rs. 3 billion making us the 4th largest new business producer in the market.
The downward trajectory of interest rates impacted reinvestment returns on our investment portfolio, exerting pressure on margins. We however realigned asset allocation and rebalanced our equity portfolio to manage the impact. Consequently, investment income during the year amounted to Rs. 5.0 billion, a growth of 10% compared to last year.
On the costs side, claims and benefits to policyholders increased by 8% to Rs. 3.8 billion mainly on account of maturity payouts in accordance with the contractual obligations of the Company. Underwriting and net acquisition costs also increased by 15% to Rs. 2.1 billion in line with the growth in top line revenue. Cost optimisation
GROSS WRITTEN PREMIUM
REGULAR NEW BUSINESS PREMIUMS
LIFE FUND YIELD
SURPLUS
POLICYHOLDER DIVIDEND RATE
MDRTs
2019 - Rs. 11.6 Bn
2019 – 10.53%
2019 - Rs. 1 Bn
2019 - 10%
TOT MDRTs 2020 – 5 (2019 – 0)
COT MDRTs 2020 – 10 (2019 – 3)
MDRTs 2020 – 157 (2019 – 62)
Rs. 13.1 Bn
10.62%
Rs. 0.8 Bn
9%
102-6, 102-14GRI
(Rs. Bn) (%)
2016 2017 2018 2019 20200
500
1,000
1,500
2,000
2,500
3,000
3,500
(10)
(5)
0
5
10
15
20
25
Regular new business premiumsGrowth
2,4
44 3
,04
6
2,8
37
2,7
28 3,1
32

13 Annual Report 2020
Union Assurance at a Glance Management Discussion and Analysis Stewardship Financial Statements Supplementary Information
strategies adopted by the Company had encouraging results with operating expense growing by only 8% in spite of considerable topline growth. However, with the Company adopting a growth trajectory resulted a significant increase in insurance contract liability. This coupled with low interest rate environment resulted in Profit Before Tax recording a marginal degrowth to Rs. 1.8 billion against Rs. 1.9 billion in 2019.
With margins increasingly pressured by the downward trend in market interest rates, we pro-actively optimised asset allocation and rebalanced our equity portfolio to manage the impact. Our product investment decisions enabled us to generate a 10.62% yield during the year under review, a noteworthy achievement in a sluggish market. Meanwhile spend control war rooms and other cost optimisation initiatives helped us manage liquidity and cashflow while positively impacting our bottom line.
Yet another milestone achieved during the year was total Assets Under Management surpassing the Rs. 50 billion mark. Total assets grew by 13% to reach Rs. 62.6 billion. Total liabilities meanwhile grew by 17%, with the life fund which accounts for 88% of liabilities growing by 18% during the year in line with the growth in the life insurance portfolio.
A Powerful New Identity Our new identity depicted by the “circle of life” logo and the theme “Your Life, Our Strength”, re-ignites our passion to design and develop insurance solutions that suit emerging realities and marks the start of an exciting new journey with our customers. By renewing our identity and purpose we are renewing our commitment to fulfil the countless aspirations of our customers by Protecting Relationships, Protecting Growing Ambitions and Protecting Progressing Lifestyles.
Our efforts to transform our Brand to meet the demands of the new-age were recognised during the year, when we were awarded “Best Brand in 2020” at the Sri Lanka Leadership Awards. Meanwhile brand building initiatives such the “Are you OK” campaign and “I am Responsible Campaign” continued to gain traction in terms of reach and engagement on social media.
Supporting Our Colleagues Our employees continued to display their dedication and commitment, going above and beyond their call of duty to ensure business continued as usual. In turn, we remained committed to supporting our employees through this difficult time, launching an income bridging programme for our sales force and putting in place flexible working arrangements and continuing to engage with employees through digital channels.
Harnessing the Power of DigitalWe remain at the forefront of the digital revolution in the insurance industry in Sri Lanka and have in place a comprehensive digital road map that focuses on digitisation of operations, building digital capabilities and adopting disruptive digital technology.
Our progressive investments in cutting-edge digital technology enabled us to rapidly transition to a digital operating model with 400+ employees working from home and supported by digital platforms for collection and online client servicing.
We are also increasingly leveraging data analytics to improve our value proposition. The increased use of data analytics in customer retention and lapse prevention and straight through underwriting have resulted in significant gains in productivity and operational efficiencies.
Meanwhile we continue to disrupt the insurance industry with digital innovations such as ‘Clicklife’, a turnkey end-to-end digital insurance solution and the ‘Clicklife Self-Services App’ that provide customised solutions at a click of a button.
Channel DiversificationDuring the year we strengthened our Agency channel while simultaneously expanding the Bancassurance channel and exploring alternate channels to further consolidate our market position. The Agency channel which accounts for 83% of revenue continued to grow as a result of strategic branch rebranding and restructure, the implementation of a re-aligned incentive structure for agents, launch of the MRDT Talent Pool programme and the establishment of a dedicated business development unit to support channel objectives. The Bancassurance channel has recorded commendable growth over the last few years and we continue to explore new partnerships to grow this channel while
solidifying existing partnerships. Another key initiative during the year was the establishment of Alternate channel as a complementary channel to Agency and Bancassurance. We believe this channel will be a catalyst for revenue growth in the years to come.
Unique Value to Customers We are committed to offering our customers a holistic value proposition that goes beyond high investment returns and an efficient claims process. Several innovative products such as Sisumaga+, Union Life+ and Clicklife were launched during the year providing customised solutions to customer protection requirements. We also launched the Union Lifestyle Bonus campaign, a reward scheme that offers policyholders an attractive array of discounts and encourages them to live life to the fullest.
Looking AheadOur robust performance, amidst the unprecedented challenges of 2020 has set the benchmark for our future performance. We are optimistic of a gradual economic recovery towards the second half of 2021 and look forward to pushing the boundaries of the insurance industry in Sri Lanka to meet the evolving needs of our customers in the Post COVID-19 ‘new normal’. As the world gradually settles into a ‘new normal’, we will focus on diversifying our distribution channels, optimising our bancassurance partnerships, developing innovative insurance products that meet evolving needs of our customers, enhancing our market presence and driving our digital leadership agenda.
Appreciation2020 was a challenging year, but we emerged from it stronger and better due to the steadfast support of all our Stakeholders. The dedication and resilience of our team was a true inspiration during the challenging times of 2020, and I wish to place on record my sincerest appreciation to each and every one of you. To all our customers, business partners and all other Stakeholders, thank you for your continuous support; your belief in us drives us to achieve greater heights.
Jude Gomes Chief Executive Officer
25 February 2021

VALUE GENERATED AND DISTRIBUTED
201-1, 203-2GRI
TO EMPLOYEES AS SALARIES AND OTHER BENEFITS
TO LIFE POLICYHOLDERS AS BENEFITS AND CLAIMS
SHARE OF RESULTS OF EQUITY ACCOUNTED INVESTEE
TO INTERMEDIARIES AS COMMISSION TO GOVERNMENT AS TAXES
TO SHAREHOLDERS AS DIVIDENDS
2019 - Rs. 1,023 Mn 2019 - Rs. 3,504 Mn
2019 - Rs. 105 Mn
2019 - Rs. 1,858 Mn 2019 - Rs. 750 Mn 2019 - Rs. 1,179 Mn
ECONOMIC VALUE GENERATED
2019 - Rs. 15,567 Mn
Rs.17,586 Mn
ECONOMIC VALUE RETAINED
2019 - Rs. 5,262 Mn
Rs.7,518 Mn
ECONOMIC VALUE DISTRIBUTED
2019 - Rs. 10,305 Mn
Rs.10,068 Mn
DEPRECIATION
2019 - Rs. 83 Mn
Rs. 83 Mn
OPERATING COSTS
2019 - Rs. 1,991 Mn
Rs. 2,043 Mn
NET WRITTEN PREMIUM OTHER REVENUE
2019 - Rs. 11,122 Mn 2019 - Rs. 4,340 Mn
Rs. 12,519 Mn Rs. 4,951 Mn
AMORTISATION
2019 - Rs. 217 Mn
Rs. 307 MnPROFIT AFTER DIVIDENDS
2019 - Rs. (21) Mn
Rs. 921 Mn
INCREASE IN LIFE FUND
2019 - Rs. 4,983 Mn
Rs. 6,207 Mn
Rs. 1,213 Mn Rs. 3,794 Mn
Rs. 116 Mn
Rs. 2,145 Mn Rs. 873 Mn —
Market Value Added Statement (MVA) MVA is an indication of the Company’s capacity to increase Shareholder value over time. It is an evidence of efficient management and
strong operational capabilities.
Economic Value Added Statement (EVA)EVA reflects the efficiency of management performance and the manner in which we created and distributed wealth among various
Stakeholders throughout the value chain.
(Rs. Mn)
2016 2017 2018 2019 2020
Economic Value Generated
0
3,000
6,000
9,000
12,000
15,000
Net written premiumOther revenueShare of results of equity accounted investee
7,8
47
2,9
17
60
9,6
20
4,0
33
188
150
105
116
10,5
27
4,0
01
11,1
22
4,3
40
12,5
19
4,9
51
(Rs. Mn)
2016 2017 2018 2019 2020
Economic Value Retained
(1,000)
0
1,000
2,000
3,000
4,000
5,000
6,000
7,000
8,000
DepreciationAmortisationProfit after dividends Increase in Life fund
30
81
81
24
,23
8
33
3,3
83
72
2,7
10 3
,90
5 4,9
83 6
,20
7
84
71
2,1
43
21
78
3
(21
)
30
78
3
92
1
MARKET VALUE OF EQUITY
2019 - Rs. 19,446 Mn
Rs. 17,973 MnSHAREHOLDER FUND
2019 - Rs. 14,663 Mn
Rs. 15,108 MnMARKET VALUE ADDED
2019 - Rs. 4,783 Mn
Rs. 2,865 Mn
(%)
12
21
920
2019 2020
Operating costs To employees as salaries and other benefits To life policyholders as benefits and claims paidTo intermediaries as commissionTo Government as taxesTo shareholders as dividends
Economic Value Distributed
38
7 19
10
35
18
11
14 Union Assurance PLC

15 Annual Report 2020
Union Assurance at a Glance Management Discussion and Analysis Stewardship Financial Statements Supplementary Information
PERFORMANCE HIGHLIGHTS Financial Highlights
Results for the Year 2020 2019 2018
Revenue Rs. Mn 13,109 11,648 11,244
Paid in benefits and claims to policyholders Rs. Mn 3,689 3,668 3,351
Profit from operations Rs. Mn 1,677 1,804 1,983
EBIT Rs. Mn 1,794 1,908 2,132
Profit after tax Rs. Mn 921 1,158 3,244
EBITDA Rs. Mn 2,184 2,208 2,287
Profit after tax 1, 2 Rs. Mn 921 1,158 1,135
Cash EPS Rs. 140.23 113.68 88.17
Earnings per share Rs. 15.62 19.65 55.05
Recurrent earnings per share 1, 2 Rs. 15.62 19.65 19.27
Dividends Rs. Mn - 1,179 1,179
Average annual premium per policy Rs. 98,249 86,760 81,816
Persistency - Year 1 % 83 81 84
Year 2 % 72 73 73
Year 3 % 68 67 66
Investment yield % 10.62 10.53 9.63
Earning yield % 5.12 5.95 5.56
Total expenses ratio % 76 79 82
Recurrent return on equity 1, 2 % 6 8 9
Return on assets % 2 2 7
Recurrent return on assets 1, 2 % 2 2 2
Annual Shareholder Transfer Rs. Mn 825 1,000 1,100
Annualised New Business Premium Rs. Mn 4,209 4,072 3,386
Financial Position at Year End
Total assets Rs. Mn 62,600 55,249 49,117
Assets Under Management Rs. Mn 52,356 44,881 39,138
Life fund Rs. Mn 41,882 35,490 30,600
Total Shareholder funds Rs. Mn 15,108 14,663 13,672
Net asset per share Rs. 256 249 232
Net assets per share excluding restricted regulatory reserve Rs. 199 191 175
Market/Shareholder Information
Market price per share as at 31 December Rs. 305 330 347
Highest market value per share Rs. 355 375 364
Lowest market value per share Rs. 275 260 134
Market capitalisation Rs. Mn 17,973 19,446 20,466
Total Shareholder return % (8) 1 173
Price earning ratio times 19.53 16.79 18
Dividend cover 1, 2 times - 0.98 0.96
Dividend per share Rs. - 20 20
Dividend payout/effective dividend rate % - 102 104
Dividend yield % - 6.06 5.76
Statutory Requirements/Ratios
Excess in admissible assets Rs. Mn 7,764 3,731 849
Capital Adequacy Ratio (CAR) % 341 362 262
Total Available Capital Rs. Mn 21,795 18,120 14,382
1 Adjusted for notional tax credits of Rs. 0.5 Bn recognised in 2018.2 Adjusted for deferred tax asset of Rs. 1.6 Bn recognised in 2018.
* Comparative information have been amended where appropriate to ensure comparability with the current year.
102-7GRI
0,00,20,40,60,81,0
PERFORMANCE HIGHLIGHTS
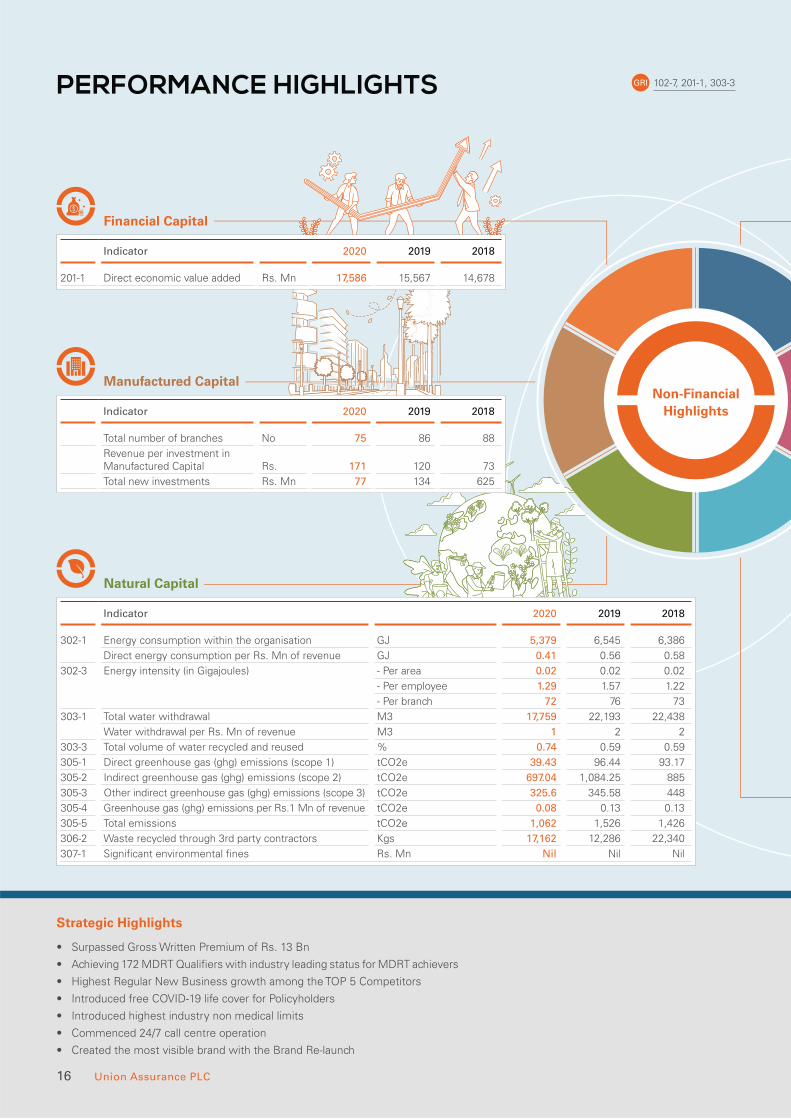
Indicator 2020 2019 2018
201-1 Direct economic value added Rs. Mn 17,586 15,567 14,678
Indicator 2020 2019 2018
Total number of branches No 75 86 88
Revenue per investment in Manufactured Capital Rs. 171 120 73
Total new investments Rs. Mn 77 134 625
Indicator 2020 2019 2018
302-1 Energy consumption within the organisation GJ 5,379 6,545 6,386
Direct energy consumption per Rs. Mn of revenue GJ 0.41 0.56 0.58
302-3 Energy intensity (in Gigajoules) - Per area 0.02 0.02 0.02
- Per employee 1.29 1.57 1.22
- Per branch 72 76 73
303-1 Total water withdrawal M3 17,759 22,193 22,438
Water withdrawal per Rs. Mn of revenue M3 1 2 2
303-3 Total volume of water recycled and reused % 0.74 0.59 0.59
305-1 Direct greenhouse gas (ghg) emissions (scope 1) tCO2e 39.43 96.44 93.17
305-2 Indirect greenhouse gas (ghg) emissions (scope 2) tCO2e 697.04 1,084.25 885
305-3 Other indirect greenhouse gas (ghg) emissions (scope 3) tCO2e 325.6 345.58 448
305-4 Greenhouse gas (ghg) emissions per Rs.1 Mn of revenue tCO2e 0.08 0.13 0.13
305-5 Total emissions tCO2e 1,062 1,526 1,426
306-2 Waste recycled through 3rd party contractors Kgs 17,162 12,286 22,340
307-1 Significant environmental fines Rs. Mn Nil Nil Nil
Non-Financial Highlights
Financial Capital
Manufactured Capital
Natural Capital
Strategic Highlights
• Surpassed Gross Written Premium of Rs. 13 Bn
• Achieving 172 MDRT Qualifiers with industry leading status for MDRT achievers
• Highest Regular New Business growth among the TOP 5 Competitors
• Introduced free COVID-19 life cover for Policyholders
• Introduced highest industry non medical limits
• Commenced 24/7 call centre operation
• Created the most visible brand with the Brand Re-launch
102-7, 201-1, 303-3GRI
16 Union Assurance PLC
Union Assurance at a Glance Management Discussion and Analysis Stewardship Financial Statements Supplementary Information
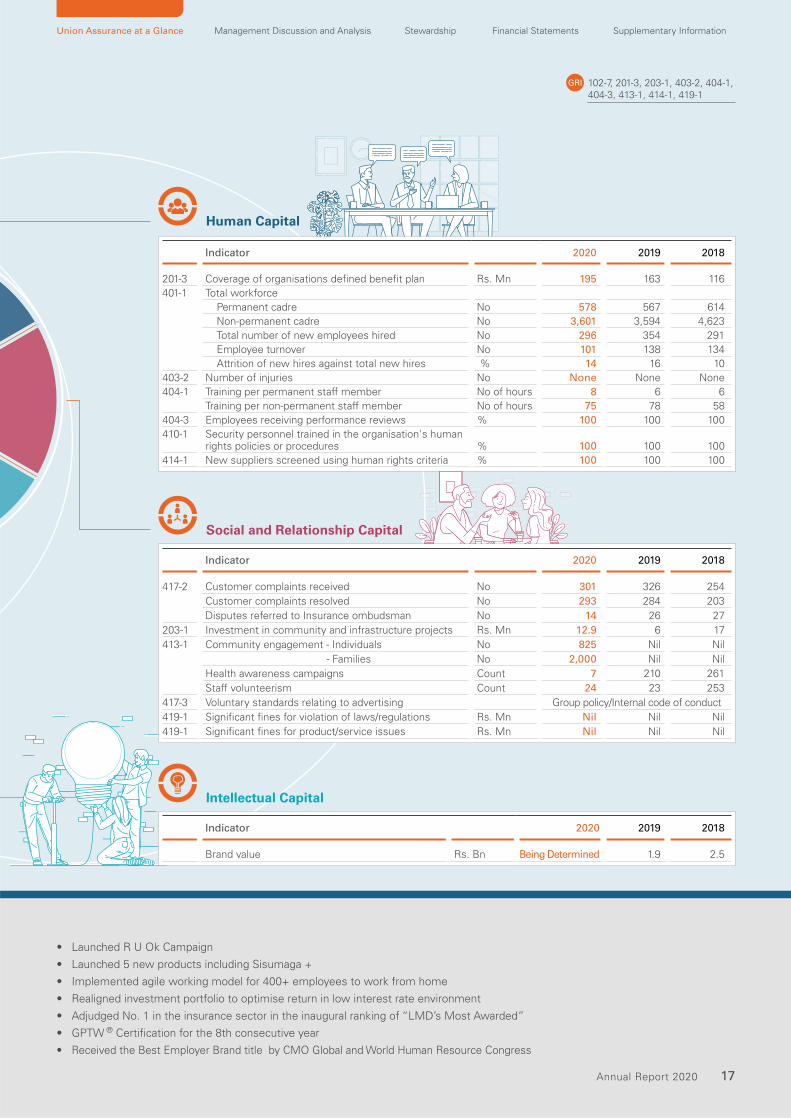
Indicator 2020 2019 2018
201-3 Coverage of organisations defined benefit plan Rs. Mn 195 163 116 401-1 Total workforce
Permanent cadre No 578 567 614Non-permanent cadre No 3,601 3,594 4,623 Total number of new employees hired No 296 354 291Employee turnover No 101 138 134Attrition of new hires against total new hires % 14 16 10
403-2 Number of injuries No None None None404-1 Training per permanent staff member No of hours 8 6 6
Training per non-permanent staff member No of hours 75 78 58404-3 Employees receiving performance reviews % 100 100 100410-1 Security personnel trained in the organisation's human
rights policies or procedures % 100 100 100414-1 New suppliers screened using human rights criteria % 100 100 100
Indicator 2020 2019 2018
417-2 Customer complaints received No 301 326 254
Customer complaints resolved No 293 284 203
Disputes referred to Insurance ombudsman No 14 26 27
203-1 Investment in community and infrastructure projects Rs. Mn 12.9 6 17
413-1 Community engagement - Individuals No 825 Nil Nil
- Families No 2,000 Nil Nil
Health awareness campaigns Count 7 210 261
Staff volunteerism Count 24 23 253
417-3 Voluntary standards relating to advertising Group policy/Internal code of conduct
419-1 Significant fines for violation of laws/regulations Rs. Mn Nil Nil Nil
419-1 Significant fines for product/service issues Rs. Mn Nil Nil Nil
Indicator 2020 2019 2018
Brand value Rs. Bn Being Determined 1.9 2.5
Human Capital
Social and Relationship Capital
Intellectual Capital
• Launched R U Ok Campaign
• Launched 5 new products including Sisumaga +
• Implemented agile working model for 400+ employees to work from home
• Realigned investment portfolio to optimise return in low interest rate environment
• Adjudged No. 1 in the insurance sector in the inaugural ranking of “LMD’s Most Awarded”
• GPTW ® Certification for the 8th consecutive year
• Received the Best Employer Brand title by CMO Global and World Human Resource Congress
102-7, 201-3, 203-1, 403-2, 404-1, 404-3, 413-1, 414-1, 419-1
GRI
17 Annual Report 2020

VALUING AMBITIONS
MANAGEMENT DISCUSSION AND ANALYSIS
20 Value Creation Framework20 A New Purpose20 Stakeholder Engagement22 Materiality 25 Strategy and Resource Allocation26 Business Model28 Organisation Structure29 Sustainability
31 Operating Context35 Capital Management Review
35 Capital Management Summary/ Trade-off36 Financial Capital 46 Manufactured Capital50 Natural Capital 54 Human Capital60 Social and Relationship Capital68 Intellectual Capital
72 Outlook

20 Union Assurance PLC
VALUE CREATION FRAMEWORK
A New Purpose A member of the John Keells Group, Union Assurance, has over the span of its history
of 30 years earned a reputation for extending the best protection in the market through
innovative, empowering Life Insurance solutions.
To consolidate our position further, we unveiled a bold new identity during the year,
re-positioning ourselves as a new-age, customer-centric, digital life insurer that truly
understands our customers’ aspirations.
Our new identity marks the start of an exciting journey with our customers and will pave
the way to help achieve the Sri Lankan dream of a better life for all.
Built on the three pillars of protecting relationships; protecting growing ambitions and
protecting progressing lifestyles, our purpose is to show people that they can go higher
if they plan better, that their children can go higher if their foundation is stronger, and that
their lives can be richer if they thought smarter.
The new logo unveiled as part of this rebranding exercise depicts the circle of life while
the new tag line “ Your Life, Our Strength” reflects the symbiotic relationship we share
with our customers.
Built on the three pillars of protecting relationships; protecting growing ambitions and protecting progressing Lifestyles, our purpose is to show people that they can go higher if they plan better, that their children can go higher if their foundation is stronger, and that their lives can be richer if they thought smarter.
Our Three Pillars of Purpose
Protecting relationships Protecting growing ambitions Protecting progressing lifestyles
Stakeholder Engagement Given the wide range of Stakeholders
and the diverse and evolving nature of
their concerns, continuous Stakeholder
engagement is important in order to
stay relevant and ensure that we are
meeting our Stakeholder expectations.
Our Stakeholder engagement process is
a continuous process that involves four
key steps; identifying and prioritising
Stakeholders based on an assessment of
the impact on our operations, formulating
and implementing customised Stakeholder
engagement mechanisms, identifying
and prioritising key concerns arising from
engagement and formulating strategy to
address these concerns.
102-42, 102-43GRI

21 Annual Report 2020
STEP 1 - Identify
Stakeholders
STEP 2 -
Engage with Stakeholders
STEP 3 -
Identify Material Issues
STEP 4 -
Formulate Strategy
Customers
Customer satisfaction surveys (Monthly)
Customer Research (As required)
One to one meetings (Monthly and as required)
Welcome calls
Complaint Management (Ongoing)
Corporate Website (Ongoing)
Social Media (Ongoing)
Media advertisements (As required)
Customer get-togethers (Annual)
Long term promise of protection and wealth accumulation
Service quality and consistency
Promoting island-wide accessibility
Performance reliability
Expanding customer service points
Leverage technology
Enhanced knowledge of internal staff and third-party service providers,
Regular service standard review
Expanding customer service points
Fair pricing of the products
Shareholders and Investors
Annual Report (Annually)
Interim Financial Statements (Quarterly)
Annual and Extraordinary General Meetings (Annually)
Announcements to CSE (As required)
Media releases and press conferences (As required)
Investor relations hotline (Ongoing)
Corporate website (Ongoing)
One-to-one meetings (As required)
Financial performance
Sustainable growth
Healthy liquidity position
Transparent reporting
Transformation and technological road map
Regular review and update of corporate governance practices
Implementation of effective performance management systems
Creating a strong leadership pipeline
Continuous investment on digitisation
Employees
Employee satisfaction survey (Annually)
Skip level meetings (Ongoing)
Brainstorming sessions with all business units when reviewing medium to long term strategies (Annually)
Corporate communication via emails, intranet, newsletters, etc. (Ongoing)
Management meetings (Quarterly)
Recreation club activities (Ongoing)
Attractive remuneration
Job security
Personal development and career progression
A sound work environment
Health and Safety
Implementation of competitive compensation process
Investment on learning and development
Developing conducive work culture
Facilitate employee engagement activities virtually
Work form home modus of operandi
Suppliers and Business Partners
On-site visits and meetings (As required)
Formal interactions with reinsurers (Ongoing)
Forming long-term and reliable partnerships
Contractual performance
Business sourcing continuity
Maintaining principle discipline
Effective management of risk
Building sustainable relationships
Community
Interactions with community representatives and institutes (Ongoing)
Corporate website and social media (Ongoing)
CSR projects (Ongoing)
Press releases (As required)
Public events (As required)
Demand for multi-pronged community development initiatives
Transparency and engagement measures
Demand for sustainable business practices
Minimising the impact on the environment
Operate on CSR brand ‘Union Manushyathwaya’ with the objective of disseminating vital information on Non-communicable diseases.
Partner with national level institutions to implement various CSR projects
Regular monitoring of carbon foot print
Leverage technology to minimise the impact on the environment
Regulators
On-site surveillances (As required)
Filling of returns (Periodic)
Directives and circulars (As required)
Press releases (As required)
Compliance with rules and regulations
Active participation and contributing to the development of industry and regulatory working groups
Proactive communications with regulatory institutions
Adherence to all the rules and regulations
Active contribution towards developing industry specific standards
Union Assurance at a Glance Management Discussion and Analysis Stewardship Financial Statements Supplementary Information
102-40, 102-42, 102-43GRI

22 Union Assurance PLC
Materiality
Performance of material issues are reported using disclosures prescribed by the GRI Sustainability Reporting Standards and where possible have been linked to the United Nation’s Sustainable Development Goals (SDGs).
Identifying material matters enables us to focus on what really impacts our value creation process. Material matters are identified through
the Stakeholder engagement process and internal analysis and are reviewed and evaluated by Management on an ongoing basis. Our
materiality determination process is graphically depicted below.
Strategy Formulation
Identification of Material Issues
• Stakeholder feedback
• Assessment of
industry risks and
opportunities
• Mapping against
strategic priorities
Assessment of
relative importance
(materiality matrix)
Prioritisation of
material mattersBoard Review
Materiality MatrixThe following materiality matrix developed through the process described above, maps out key issues based on their relative importance
to our Stakeholders and to our business. Performance of material issues is reported using disclosures prescribed by the GRI Sustainability
Reporting Standards and where possible have been linked to the United Nation’s Sustainable Development Goals (SDGs).
Rele
va
nce
to
Sta
keh
old
ers
Relevance to Organisation
17
21
18
13
22
19
14
23
20
15 16
12
24
High
Issues identified as having a high
significance and impact on both
Stakeholders and the organisation are
discussed in detail in the Annual Report.
Medium
Issues identified as having a relatively
moderate impact on the business are
reported in brief.
Low
Issues identified as having a low impact on
the business have not been reported.
102-44, 102-47GRIVALUE CREATION FRAMEWORK
1 62 73 84 95 10 11

23 Annual Report 2020
Material topic Why it is material to us Change in
materiality
Relevant GRI
standards
Relevant
SDG
1 Economic
Performance
Striking a balance between financial performance
and business outcomes will further enhance the
Company’s long-term sustainability and future growth
No change 201
2 Market Presence The requirement to contribute for economic
development of the areas of operation given the
geographical spread of the Company
No change 202
3 Indirect Economic
Impacts
The need to consider impact of the Company decisions
on the society which occur as a consequence of direct
economic performance
No change 203
4 Procurement
Practices
The need to consider the Company’s contribution
to local suppliers due to large-scale operations and
evaluate on the negative impacts on the supply chain
No change 204
5 Employment Attracting and retaining a competent workforce
ensures the quality of our human capital
No change 401
6 Labour/Management
Relations
The need to maintain positive labour/management
relations
No change 402
7 Training and
Education
The need to upgrade employee skills, performance
and continuous career progression
No change 404
8 Public Policy The need to asses the risk associated with corruption,
bribery, and undue influence, among others
No change 415
9 Customer Health and
Safety
The need to address health and safety across the life
cycle and adherence to customer health and safety
regulations and voluntary codes
Increased 416
10 Marketing and
Labelling
The need to consider fair and responsible marketing
communications, as well as access to information
about the products which can help customers to make
informed choices
No change 417
11 Customer Privacy The need to consider the events concerning breaches
of customer privacy and losses of customer data
No change 418
12 Occupational Health
and Safety
The need to consider healthy and safe work conditions
which involve both prevention of physical and mental
harm and promotion of employees’ health
Increased 403
13 Local Communities The need to consider the differentiated nature of
communities as the country being multi religious and
multi-racial
No change 413
14 Socio-Economic
Compliance
The need to consider the Company’s overall
compliance record
No change 419
15 Diversity and Equal
Opportunity
The need to promote diversity and equal opportunity
at work
No change 405
16 Non-Discrimination The need to avoid discrimination against any person at
work on any grounds
No change 406
HIG
H IM
PAC
TM
ED
IUM
IMPA
CT
Union Assurance at a Glance Management Discussion and Analysis Stewardship Financial Statements Supplementary Information
102-44, 102-47GRI

24 Union Assurance PLC
Material topic Why it is material to us Change in
materiality
Relevant GRI
standards
Relevant
SDG
17 Anti-corruption The need to identify the Company’s impact related to
corruption and methods of mitigation
No change 205
18 Energy The need to evaluate the UA’s impact related to energy
and how we manage them
No change 302
19 Water The need to understand and communicate water
related impacts created by UA
No change 303
20 Emissions The need to evaluate the emission into air created by
the Company
No change 305
21 Effluent and Waste The need to consider impact created by the water
discharges, treatment and disposal of waste and spills
of chemicals, oils, fuels, and other substances
No change 306
22 Environmental
Compliance
The requirement to consider the organisation’s
compliance with environmental laws and/or
regulations
No change 307
23 Security Practices The requirement to consider conduct of security
personal towards third parties and potential risk of
excessive behaviour
No change 410
24 Supplier Social
Assessment
The need to consider impacts created by the Company
through the supply chain
No change 414
LOW
IMPA
CT
102-44, 102-47GRI
Materiality
VALUE CREATION FRAMEWORK

25 Annual Report 2020
Our strategy is guided by our vision and mission and evolves in response to the challenges and opportunities arising from our operating
environment. This year amidst the uncertainty brought about by the COVID-19 pandemic and the need to respond to rapidly evolving
operating conditions we adopted a strategy that revolved around diversification, differentiation and collaboration to transform ourselves
to meet the changing needs of our customers. Our strategic priorities and how we allocated our resources amongst these priorities are
discussed below.
Our Strategy
Diversifi cation
Collabo
rati
on
Differentiation
Channel Diversification: During
the year under review, UA has
established an alternative distribution
channel which complements the
current Agency and Bancassurance
channels.
Product Diversification: Five new
products including digital and surgical
products were launched during
the year.
We differentiated our offering
through operational excellence and
digital leadership. Improving straight
through underwriting, shortening
the claims settlement period,
implementing digital payment and
customer engagement platforms are
some of the key initiatives undertaken
in this area.
We strengthened our partnerships
with key Stakeholders to drive
greater synergies. Re-aligning and
entering into new partnerships,
exploring new working arrangements
with our staff and strengthening our
agency relationships are some of the
initiatives we implemented during
the year.
Resource Allocation
Diversification Differentiation Collaboration
• Investment in new product development
and launches
• Invested in digitisation efforts to
enhance customer convenience
• Investment in new partnerships
• Investment in alternate distribution
channel
• Launched new brand and logo • Payments to advisors, brokers and
bancassurance partners
• Explored digital distribution channel • Investment in brand building initiatives • Investment in talent development and
employee engagement
Union Assurance at a Glance Management Discussion and Analysis Stewardship Financial Statements Supplementary Information
102-16GRI
Strategy and Resource Allocation

RIS
K U
ND
ER
WR
ITIN
G
AS
SE
T M
AN
AG
EM
EN
T
DIV
ER
SIF
ICA
TIO
N
DIF
FE
RE
NT
IAT
ION
Vision:To be the most sought-after
provider of insurance solutions
Values:
Mission: To provide protection, financial security and create wealth
for our customers, adding value to employees, field staff,
business partners, Shareholders and the community
Business Enablers
Other Business Activities
Core Business Activities
VALUE CREATION PROCESSINPUTS
Capital Management
Risk Management
Operational Excellence
Governance Framework
Financial Capital
Intellectual Capital
Social & Relationship Capital
Natural Capital
Human Capital
Manufactured Capital
• Shareholders Funds
• Policyholders Funds
• Brand Value
• Tacit Knowledge
• Information Technology
• Policyholders
• Bancassurance
Partners
• Field Staff
• Insurance
Brokers
• Reinsurers
• Suppliers
• Water
• Electricity
• Other Resources
• Employees
• HO Infrastructure
• Branch Network
• Digital Infrastructure
COLLABORATION
102-16GRI
Excellence Caring Innovation Trust Ethics and Integrity
Our Business Model
VALUE CREATION FRAMEWORK
Reserves/claims
management (Reinsurance)
Product
development
Internal
process
Channel
management
Supporting Business Activities
26 Union Assurance PLC

OUTCOMESOUTPUTS
ShareholdersProduct Segments:
Community
Customers
Regulators
KPI Contribution to SDG’s
• Attractive dividends
• Sustained growth in share price.
7CSR projects
Over 4,900Business partnerships
17,162 Kgof Solid Waste
3,100 m3
Effluents
795of employees with
4,884 hours of training
• Protection
• Savings and Investment
• Family Healthcare
• Retirement Plan
• Employee Benefit Schemes
• Group Surgical
• Loan Protection
• Education Plans
• A healthier community
• Innovative insurance offerings
• Increased customer convenience
• Compliance and support to
develop industry
Business Partners
• Mutual growth opportunities
Earnings per
share: Rs. 15.62Share price degrowth: 8%Capital adequacy ratio: 341%
Lives covered: 250,000+Policyholder Dividend
Rate: 9%New propositions: 5One day health claim settlement ratio: >85%
GPTW Score: 75%
New promotions: 28
Attrition Ratio: 17.47%
MDRT qualifiers: 172
On time settlement
to suppliers: 100%No. of A+ or above rated reinsurer partnerships: 4No. of Bancassurance partnerships: 5
Lives touched through CSR programmes
Individual: 825Families: 2,000
Carbon footprint: 1,062 tCo2e
Energy saving : 323,889 kWh
Contribution to industry
initiatives
Compliance with
regulatory
requirements: 100%
Union Assurance at a Glance Management Discussion and Analysis Stewardship Financial Statements Supplementary Information
Employees
• Career growth opportunities
27 Annual Report 2020
28 Union Assurance PLC
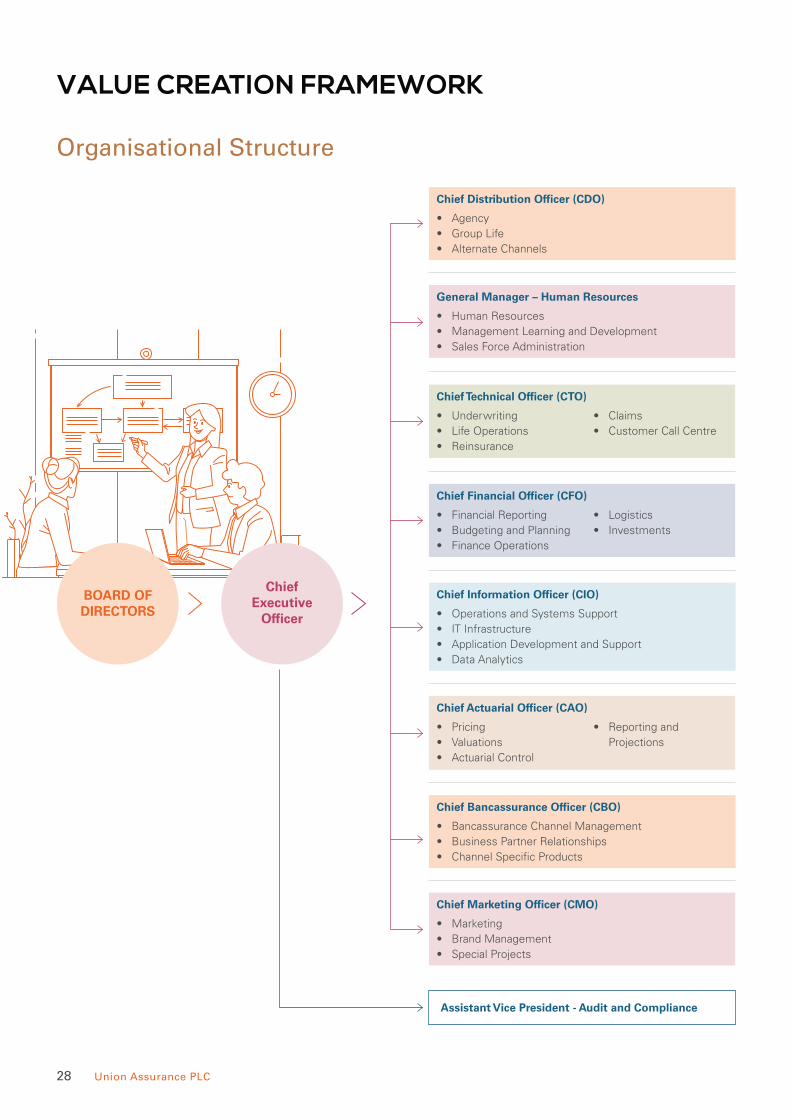
BOARD OF DIRECTORS
Chief Executive
Officer
Assistant Vice President - Audit and Compliance
Organisational Structure
VALUE CREATION FRAMEWORK
Chief Distribution Officer (CDO)
• Agency
• Group Life
• Alternate Channels
General Manager – Human Resources
• Human Resources
• Management Learning and Development
• Sales Force Administration
Chief Technical Officer (CTO)
• Underwriting
• Life Operations
• Reinsurance
• Claims
• Customer Call Centre
Chief Financial Officer (CFO)
• Financial Reporting
• Budgeting and Planning
• Finance Operations
• Logistics
• Investments
Chief Information Officer (CIO)
• Operations and Systems Support
• IT Infrastructure
• Application Development and Support
• Data Analytics
Chief Actuarial Officer (CAO)
• Pricing
• Valuations
• Actuarial Control
• Reporting and
Projections
Chief Bancassurance Officer (CBO)
• Bancassurance Channel Management
• Business Partner Relationships
• Channel Specific Products
Chief Marketing Officer (CMO)
• Marketing
• Brand Management
• Special Projects
29 Annual Report 2020
Union Assurance at a Glance Management Discussion and Analysis Stewardship Financial Statements Supplementary Information
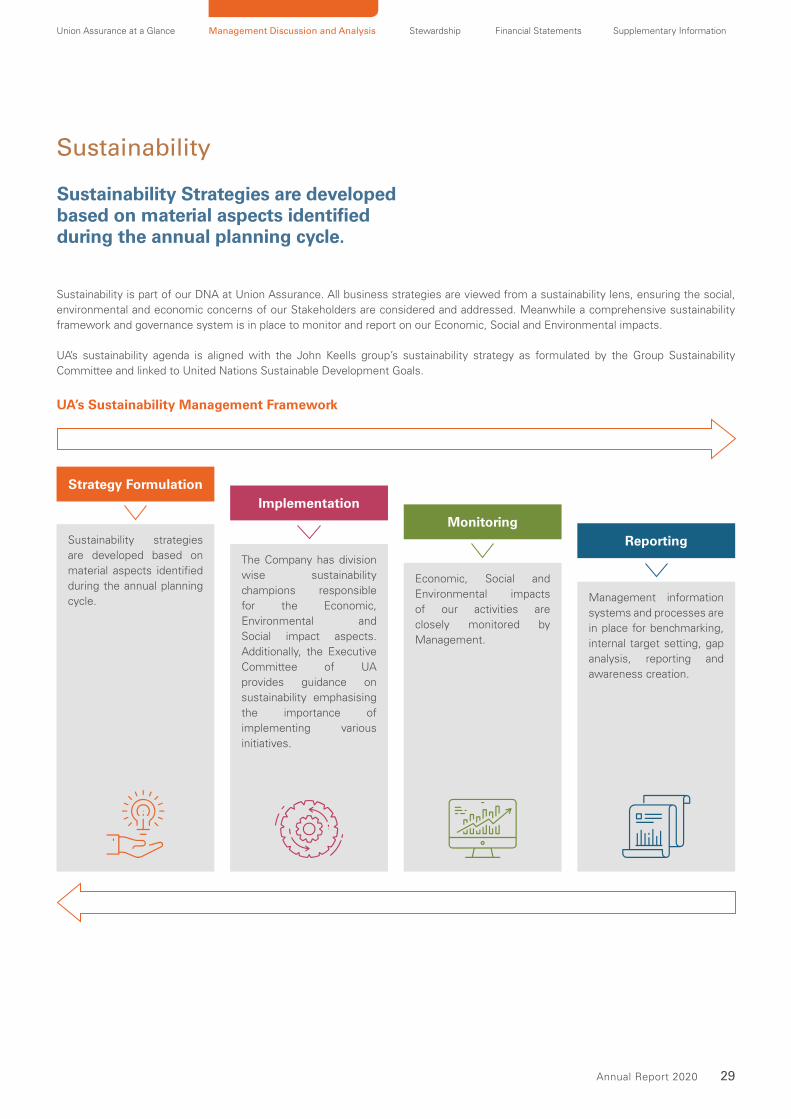
Sustainability Strategies are developed based on material aspects identified during the annual planning cycle.
Sustainability is part of our DNA at Union Assurance. All business strategies are viewed from a sustainability lens, ensuring the social,
environmental and economic concerns of our Stakeholders are considered and addressed. Meanwhile a comprehensive sustainability
framework and governance system is in place to monitor and report on our Economic, Social and Environmental impacts.
UA’s sustainability agenda is aligned with the John Keells group’s sustainability strategy as formulated by the Group Sustainability
Committee and linked to United Nations Sustainable Development Goals.
UA’s Sustainability Management Framework
Strategy FormulationImplementation
MonitoringReportingSustainability strategies
are developed based on
material aspects identified
during the annual planning
cycle.
The Company has division
wise sustainability
champions responsible
for the Economic,
Environmental and
Social impact aspects.
Additionally, the Executive
Committee of UA
provides guidance on
sustainability emphasising
the importance of
implementing various
initiatives.
Economic, Social and
Environmental impacts
of our activities are
closely monitored by
Management.
Management information
systems and processes are
in place for benchmarking,
internal target setting, gap
analysis, reporting and
awareness creation.
Sustainability
30 Union Assurance PLC
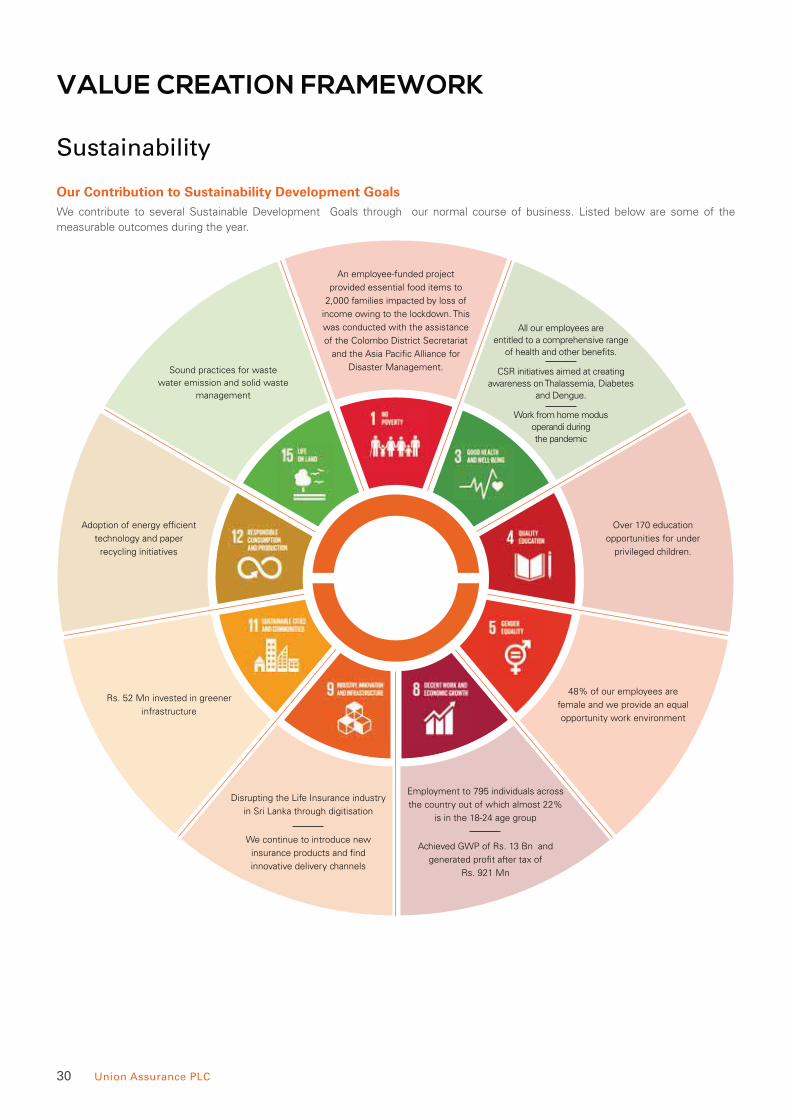
Our Contribution to Sustainability Development Goals We contribute to several Sustainable Development Goals through our normal course of business. Listed below are some of the
measurable outcomes during the year.
An employee-funded project
provided essential food items to
2,000 families impacted by loss of
income owing to the lockdown. This
was conducted with the assistance
of the Colombo District Secretariat
and the Asia Pacific Alliance for
Disaster Management.
All our employees are entitled to a comprehensive range
of health and other benefits.
CSR initiatives aimed at creating awareness on Thalassemia, Diabetes
and Dengue.
Work from home modus operandi during the pandemic
Sound practices for waste
water emission and solid waste
management
Over 170 education
opportunities for under
privileged children.
Adoption of energy efficient
technology and paper
recycling initiatives
48% of our employees are
female and we provide an equal
opportunity work environment
Rs. 52 Mn invested in greener
infrastructure
Employment to 795 individuals across
the country out of which almost 22%
is in the 18-24 age group
Achieved GWP of Rs. 13 Bn and
generated profit after tax of
Rs. 921 Mn
Disrupting the Life Insurance industry
in Sri Lanka through digitisation
We continue to introduce new
insurance products and find
innovative delivery channels
Sustainability
VALUE CREATION FRAMEWORK

31 Annual Report 2020
OPERATING CONTEXT
Union Assurance at a Glance Management Discussion and Analysis Stewardship Financial Statements Supplementary Information
Macro-Economic Environment Global Economy
The global economy is expected to contract
by an estimated 4.4% in 2020 due to the
widespread social and economic impact
of the global pandemic. Global efforts to
ramp up testing and roll out vaccines have
already commenced while governments
around the world have adopted fiscal
support and monetary easing to facilitate
economic revival. These efforts are
expected to support the gradual recovery
of the global economy in 2021.
Sri Lankan Economy
The Sri Lankan economy contracted by
5.3% during the first nine months of 2020.
The health crisis that worsened from the
second quarter of 2020 and subsequent
mobility restrictions had a significant toll
in the country’s economic growth. Both
the agriculture and industry sectors were
impacted by mobility restrictions and
health guidelines put in place to control
the pandemic. Despite the immediate
impact, the services sector including
the financial services sector recorded a
moderate growth during the period.
The Government’s efforts to introduce
fiscal stimulus through tax reductions
and targeted subsidies and transfers are
expected to contribute to the economy in
2021. The CBSL expects the economy to
contract by 3.9% in 2020 while the IMF
expects Sri Lanka to contract by 6.70% in
2020 and expand by 3.30% in 2021.
Inflation
Headline inflation, as measured by the year-on-year change in the Colombo Consumer Price Index (CCPI, 2013=100) trended downwards and stood at 4.2% at the end of 2020. The NCPI stood at 4.6% YoY significantly lower than 6.2% in 2019.
Interest Rates
The CBSL relaxed stance on monetary policy to support the revival of the economy during the year. Both deposit and lending rates declined notably, with some interest rates reaching historic lows. Yields of LKR treasury securities declined on average by 280 bps in 2020 with a greater decline seen in the short to medium end of the yield curve. Slow credit growth, a
Despite the challenging operating environment resulting from the COVID 19 pandemic, the life insurance industry recorded an overall growth of 16% in 2020 driven by expansion in Group life and single premiums by 92% and 51% respectively.
sluggish economic environment, excess liquidity and investor shifts to safe assets have pushed treasury asset yield down.
Equity Market
Despite the challenging operating
environment, the All-Share Price Index
(ASPI) surged by 10.52% in 2020. Trading
was halted for a period of 52 days from 20
March to 11 May 2020 due to island wide
lock-down and the ASPI was down by 31%
on year-to-date basis up to May 2020. The
S&PSL20 index declined by 10.18% in
2020 while falling 40% on YTD basis up
to May 2020 given the surge in net sales
by foreigners who usually invest in stocks
that comprise in the S&PSL20 index.
Net foreign sale stood at LKR 51,276
Mn, 3.3 times than 2019. However, the
overall market was driven by local retail
participation.
The new-normal post COVID-19, has accelerated the pace of digitisation within the industry requiring insurers to re-model distribution channels and digitise the entire insurance lifecycle.
(Rs. Bn)
2016 2017 2018 2019 2020E
World Real GDP Growth
(5)
(4)
(3)
(2)
(1)
0
1
2
3
4 3.3
0%
3.8
0%
3.5
0%
2.8
0%
(4.4
0%
)
(%)
201
7
201
8
201
9
202
0Q1
202
0Q2
202
0Q3
202
0E
202
1E
Economic Growth - Sri Lanka
(20)
(15)
(10)
(5)
0
5 3.5
8
3.3
1
2.2
8
(1.6
5)
(16
.25
)
1.4
5
(6.7
0) 3.3
0
(%)
Inflation
2
4
6
8
10
CCPI NCPI
Jan
uar
y
Fe
bru
ary
Mar
ch
Ap
ril
May
Jun
e
July
Au
gu
st
Se
pte
mb
er
Oct
ob
er
No
vem
be
r
De
cem
be
r
(%)
Interest Rates
4
6
8
10
SDFRSLFR
AWPLRAWDR
1year T/Bill rate
Jan
uar
y
Fe
bru
ary
Mar
ch
Ap
ril
May
Jun
e
July
Au
gu
st
Se
pte
mb
er
Oct
ob
er
No
vem
be
r
De
cem
be
r
Source: IMF
Source: Department of Census and Statistics
Source: CBSL
Source: IMF
32 Union Assurance PLC
OPERATING CONTEXT
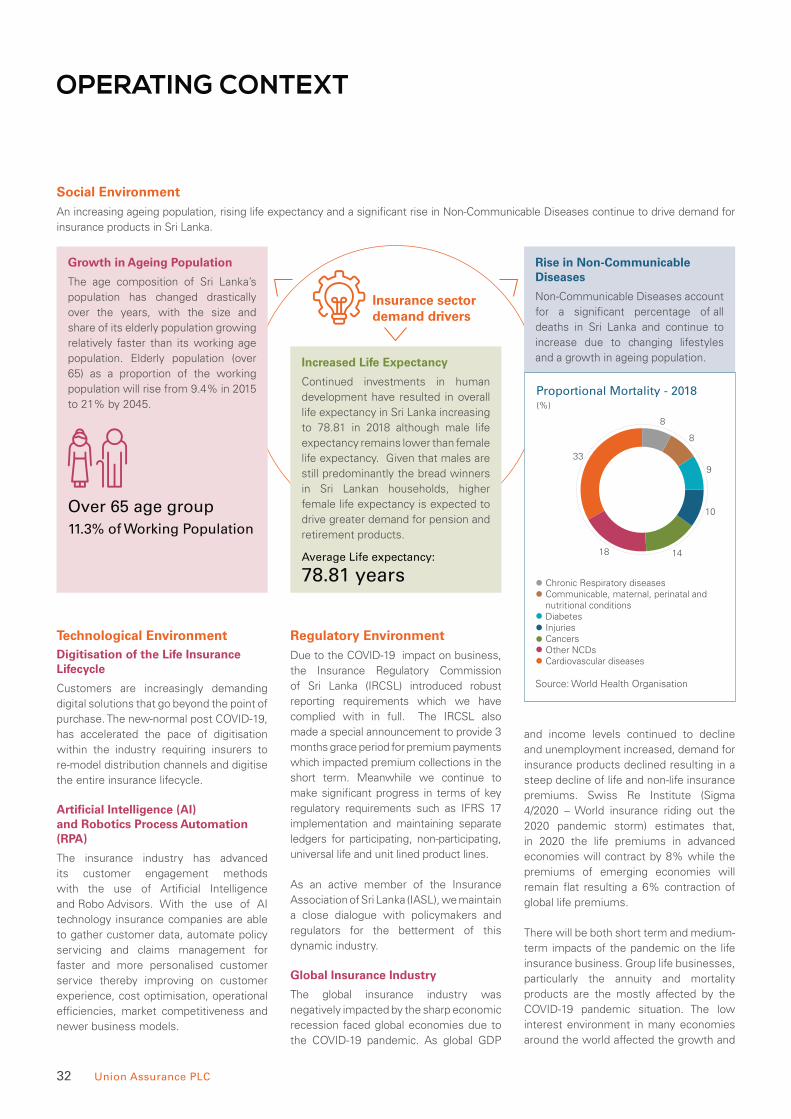
Social Environment An increasing ageing population, rising life expectancy and a significant rise in Non-Communicable Diseases continue to drive demand for
insurance products in Sri Lanka.
Growth in Ageing Population
The age composition of Sri Lanka’s
population has changed drastically
over the years, with the size and
share of its elderly population growing
relatively faster than its working age
population. Elderly population (over
65) as a proportion of the working
population will rise from 9.4% in 2015
to 21% by 2045.
Increased Life Expectancy
Continued investments in human
development have resulted in overall
life expectancy in Sri Lanka increasing
to 78.81 in 2018 although male life
expectancy remains lower than female
life expectancy. Given that males are
still predominantly the bread winners
in Sri Lankan households, higher
female life expectancy is expected to
drive greater demand for pension and
retirement products.
Rise in Non-Communicable Diseases
Non-Communicable Diseases account
for a significant percentage of all
deaths in Sri Lanka and continue to
increase due to changing lifestyles
and a growth in ageing population.
Over 65 age group
Average Life expectancy:
78.81 years
11.3% of Working Population
Source: World Health Organisation
Insurance sector demand drivers
Technological Environment Digitisation of the Life Insurance Lifecycle
Customers are increasingly demanding
digital solutions that go beyond the point of
purchase. The new-normal post COVID-19,
has accelerated the pace of digitisation
within the industry requiring insurers to
re-model distribution channels and digitise
the entire insurance lifecycle.
Artificial Intelligence (AI) and Robotics Process Automation (RPA)
The insurance industry has advanced
its customer engagement methods
with the use of Artificial Intelligence
and Robo Advisors. With the use of AI
technology insurance companies are able
to gather customer data, automate policy
servicing and claims management for
faster and more personalised customer
service thereby improving on customer
experience, cost optimisation, operational
efficiencies, market competitiveness and
newer business models.
Regulatory Environment Due to the COVID-19 impact on business,
the Insurance Regulatory Commission
of Sri Lanka (IRCSL) introduced robust
reporting requirements which we have
complied with in full. The IRCSL also
made a special announcement to provide 3
months grace period for premium payments
which impacted premium collections in the
short term. Meanwhile we continue to
make significant progress in terms of key
regulatory requirements such as IFRS 17
implementation and maintaining separate
ledgers for participating, non-participating,
universal life and unit lined product lines.
As an active member of the Insurance
Association of Sri Lanka (IASL), we maintain
a close dialogue with policymakers and
regulators for the betterment of this
dynamic industry.
Global Insurance Industry
The global insurance industry was
negatively impacted by the sharp economic
recession faced global economies due to
the COVID-19 pandemic. As global GDP
and income levels continued to decline
and unemployment increased, demand for
insurance products declined resulting in a
steep decline of life and non-life insurance
premiums. Swiss Re Institute (Sigma
4/2020 – World insurance riding out the
2020 pandemic storm) estimates that,
in 2020 the life premiums in advanced
economies will contract by 8% while the
premiums of emerging economies will
remain flat resulting a 6% contraction of
global life premiums.
There will be both short term and medium-
term impacts of the pandemic on the life
insurance business. Group life businesses,
particularly the annuity and mortality
products are the mostly affected by the
COVID-19 pandemic situation. The low
interest environment in many economies
around the world affected the growth and
(%)
1418
10
33
9
8
8
Chronic Respiratory diseasesCommunicable, maternal, perinatal andnutritional conditionsDiabetesInjuriesCancersOther NCDsCardiovascular diseases
Proportional Mortality - 2018

33 Annual Report 2020
Union Assurance at a Glance Management Discussion and Analysis Stewardship Financial Statements Supplementary Information
the profitability of both the annuity and
non-term life insurance products. Insurers
which rely on investment grade long-term
investments would be affected most by
the low interest rates prevailing in the
markets. The adverse economic conditions
caused losses through mortgage loan
products as well. The lapses of the policies
and suspensions of premium payments
driven by the economic downturn would
have a compounding impact on business
in the short term.
Cost reduction strategies, innovations and
digitalisation of business processes and work
force talent and technology developments
were some of the key strategic measures
adopted by the insurance industry during
2020 to overcome the challenges in the
pandemic environment.
Life Insurance Industry in Sri Lanka
Despite the challenging operating
environment resulting from the COVID-19
pandemic, the life insurance industry
recorded an overall growth of 16% in
2020 with total Gross Written Premium
(GWP) amounting to Rs. 102,995 million
(2019: Rs. 88,771 million). The growth in
premiums was mainly driven by growth
in group life and single premium products
which grew by 92% and 51% respectively.
During the year, regular new business
premiums remained low at 4%.
With the impact of COVID-19 intensifying
competition between market players,
customer retention (maintaining
renewal premium collection) and cost
effectiveness have become more critical,
forcing insurance companies to seek
innovative ways to increase sales and
customer satisfaction while keeping costs
low and maintaining profitability. This
has led to the emergence of alternative
distribution channels, such as online
platforms, mobile applications and social
media etc., which drive premium growth
at lower costs. Meanwhile, strategies
such as leveraging digital capabilities to
increase premium collection via digital
channels and introducing digital products
were observed during the year. The lower
interest rate trajectory will impact the
investment returns of life insurers and
limit the investment opportunities leading
to contraction in margins in the short-term.
Strategic Responses to Opportunities and ThreatsWe continue to identify the opportunities
and threats arising from the changes taking
place in the economic, social, technological
and regulatory environment of our
industry and adopt strategic responses to
these factors. The below table sets out key
opportunities and threats and the strategic
actions taken during the year.
Opportunities
Opportunity Impact Response
Ageing population, increased life expectancy
and increase in Non-Communicable
Diseases create demand for retirement and
health insurance products
Increase in new business premiums Diversified product portfolio to include
innovative retirement products and a
surgical product.
Increased requirement for digital
capabilities amidst COVID-19 pandemic
Growth in new business premiums and
maintaining renewal business
Launched digital products and
implemented digital payment channels
Existence of a protection gap in the market Growth in new business premiums Product development and channel
diversification to capture the new markets
Higher banking penetration Increased revenue from the
bancassurance channel
Optimised existing bancassurance
partnerships and explored new
bancassurance partnerships to increase
revenue
Threats
Threat Impact Response
Negative economic growth and impact on
key sectors such as tourism, exports and
worker remittances due to COVID-19
Business disruptions and negative impact
on new business
Focused on key growth sectors of the
economy for new business.
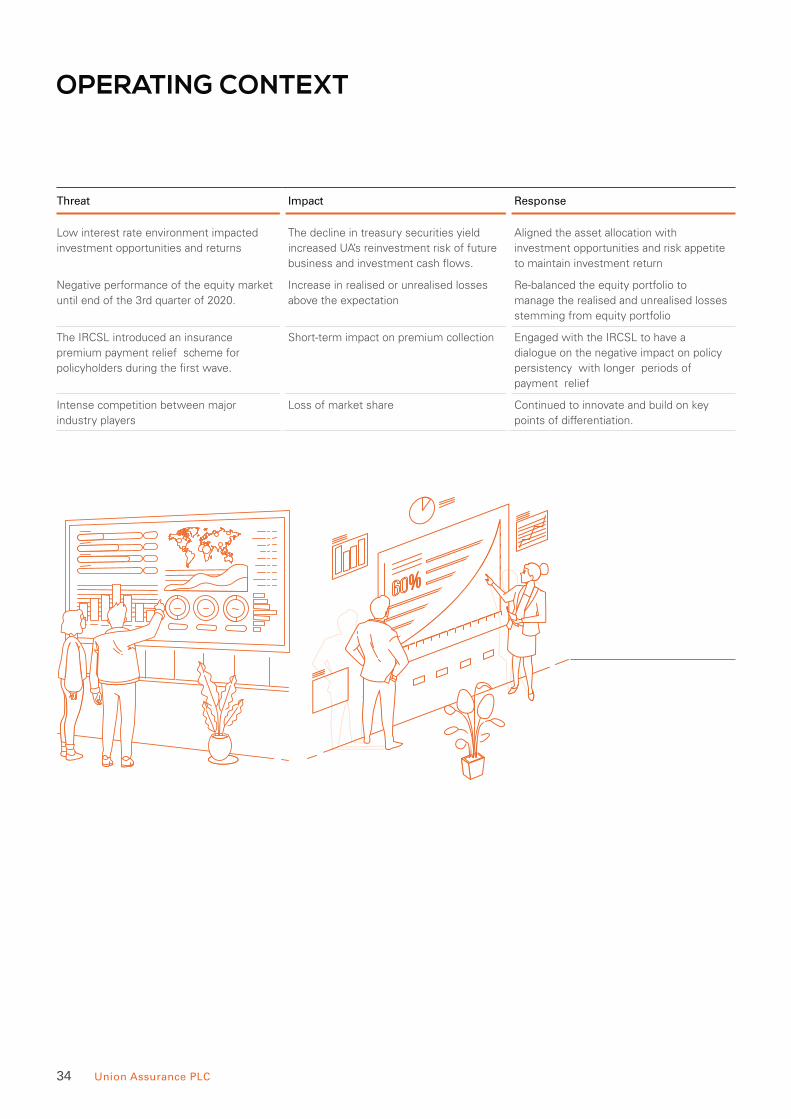
34 Union Assurance PLC
OPERATING CONTEXT
Threat Impact Response
Low interest rate environment impacted
investment opportunities and returns
The decline in treasury securities yield
increased UA’s reinvestment risk of future
business and investment cash flows.
Aligned the asset allocation with
investment opportunities and risk appetite
to maintain investment return
Negative performance of the equity market
until end of the 3rd quarter of 2020.
Increase in realised or unrealised losses
above the expectation
Re-balanced the equity portfolio to
manage the realised and unrealised losses
stemming from equity portfolio
The IRCSL introduced an insurance
premium payment relief scheme for
policyholders during the first wave.
Short-term impact on premium collection Engaged with the IRCSL to have a
dialogue on the negative impact on policy
persistency with longer periods of
payment relief
Intense competition between major
industry players
Loss of market share Continued to innovate and build on key
points of differentiation.
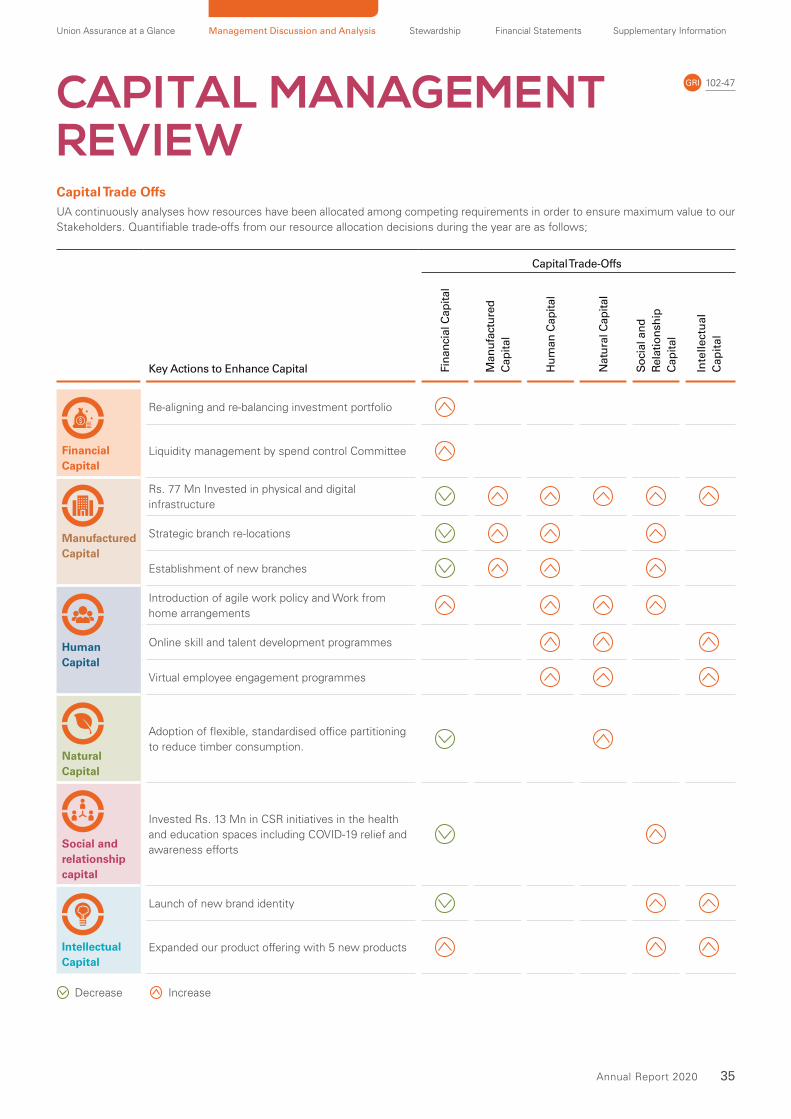
35 Annual Report 2020
Union Assurance at a Glance Management Discussion and Analysis Stewardship Financial Statements Supplementary Information
CAPITAL MANAGEMENT REVIEW
102-47GRI
Capital Trade Offs UA continuously analyses how resources have been allocated among competing requirements in order to ensure maximum value to our
Stakeholders. Quantifiable trade-offs from our resource allocation decisions during the year are as follows;
Capital Trade-Offs
Key Actions to Enhance Capital Fin
anci
al C
apit
al
Man
ufa
ctu
red
Cap
ital
Hu
man
Cap
ital
Nat
ura
l Cap
ital
So
cial
an
d
Rel
atio
nsh
ip
Cap
ital
Inte
lle
ctu
al
Ca
pit
al
Financial Capital
Re-aligning and re-balancing investment portfolio
Liquidity management by spend control Committee
Manufactured Capital
Rs. 77 Mn Invested in physical and digital
infrastructure
Strategic branch re-locations
Establishment of new branches
Human Capital
Introduction of agile work policy and Work from
home arrangements
Online skill and talent development programmes
Virtual employee engagement programmes
Natural Capital
Adoption of flexible, standardised office partitioning
to reduce timber consumption.
Social and relationship capital
Invested Rs. 13 Mn in CSR initiatives in the health
and education spaces including COVID-19 relief and
awareness efforts
Intellectual Capital
Launch of new brand identity
Expanded our product offering with 5 new products
Decrease Increase
36 Union Assurance PLC
FINANCIAL CAPITAL
SHAREHOLDERS’ EQUITY
LIFE FUND
ASSET UNDER MANAGEMENT
Rs. 15 Bn
Rs. 42 Bn
Rs. 52 Bn
We continued to enhance our financial capital during the year by aggressively driving top line growth while ensuring prudent financial management.
Our Financial Capital Resources
Future Focus
• Strike a balance between topline growth and profitability
• Cost optimisation
• Optimal asset allocation and sustainable investment portfolio growth
• Maintain a strong capital adequacy ratio
Management Approach
Our Financial Capital which includes
the monetary resources provided by
our investors enables us to ensure the
financial security and stability sought
by our policyholders while ensuring
attractive returns to our Shareholders.
We continue to enhance our Financial
Capital through careful financial
management including budgetary
controls, liquidity management,
profitability management, investment
management, planning and
performance management, risk
management and internal controls.
103-1, 103-2, 103-3GRI
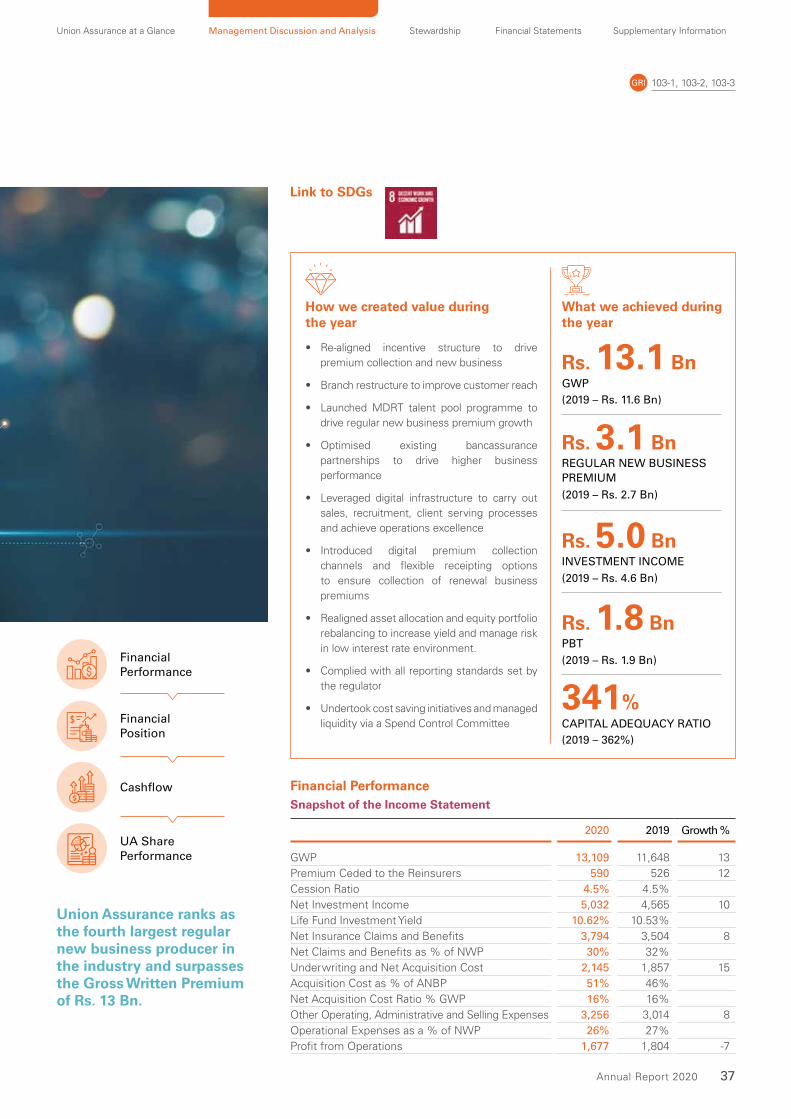
37 Annual Report 2020
Union Assurance at a Glance Management Discussion and Analysis Stewardship Financial Statements Supplementary Information
Link to SDGs
• Re-aligned incentive structure to drive
premium collection and new business
• Branch restructure to improve customer reach
• Launched MDRT talent pool programme to
drive regular new business premium growth
• Optimised existing bancassurance
partnerships to drive higher business
performance
• Leveraged digital infrastructure to carry out
sales, recruitment, client serving processes
and achieve operations excellence
• Introduced digital premium collection
channels and flexible receipting options
to ensure collection of renewal business
premiums
• Realigned asset allocation and equity portfolio
rebalancing to increase yield and manage risk
in low interest rate environment.
• Complied with all reporting standards set by
the regulator
• Undertook cost saving initiatives and managed
liquidity via a Spend Control Committee
How we created value during the year
What we achieved during the year
GWP
(2019 – Rs. 11.6 Bn)
(2019 – Rs. 2.7 Bn)
(2019 – Rs. 4.6 Bn)
(2019 – Rs. 1.9 Bn)
(2019 – 362%)
REGULAR NEW BUSINESS PREMIUM
INVESTMENT INCOME
PBT
CAPITAL ADEQUACY RATIO
Rs. 13.1 Bn
Rs. 3.1 Bn
Rs. 5.0 Bn
Rs. 1.8 Bn
341%
103-1, 103-2, 103-3GRI
Financial Performance
Financial Position
Cashflow
UA Share Performance
Financial PerformanceSnapshot of the Income Statement
2020 2019 Growth %
GWP 13,109 11,648 13
Premium Ceded to the Reinsurers 590 526 12
Cession Ratio 4.5% 4.5%
Net Investment Income 5,032 4,565 10
Life Fund Investment Yield 10.62% 10.53%
Net Insurance Claims and Benefits 3,794 3,504 8
Net Claims and Benefits as % of NWP 30% 32%
Underwriting and Net Acquisition Cost 2,145 1,857 15
Acquisition Cost as % of ANBP 51% 46%
Net Acquisition Cost Ratio % GWP 16% 16%
Other Operating, Administrative and Selling Expenses 3,256 3,014 8
Operational Expenses as a % of NWP 26% 27%
Profit from Operations 1,677 1,804 -7
Union Assurance ranks as the fourth largest regular new business producer in the industry and surpasses the Gross Written Premium of Rs. 13 Bn.
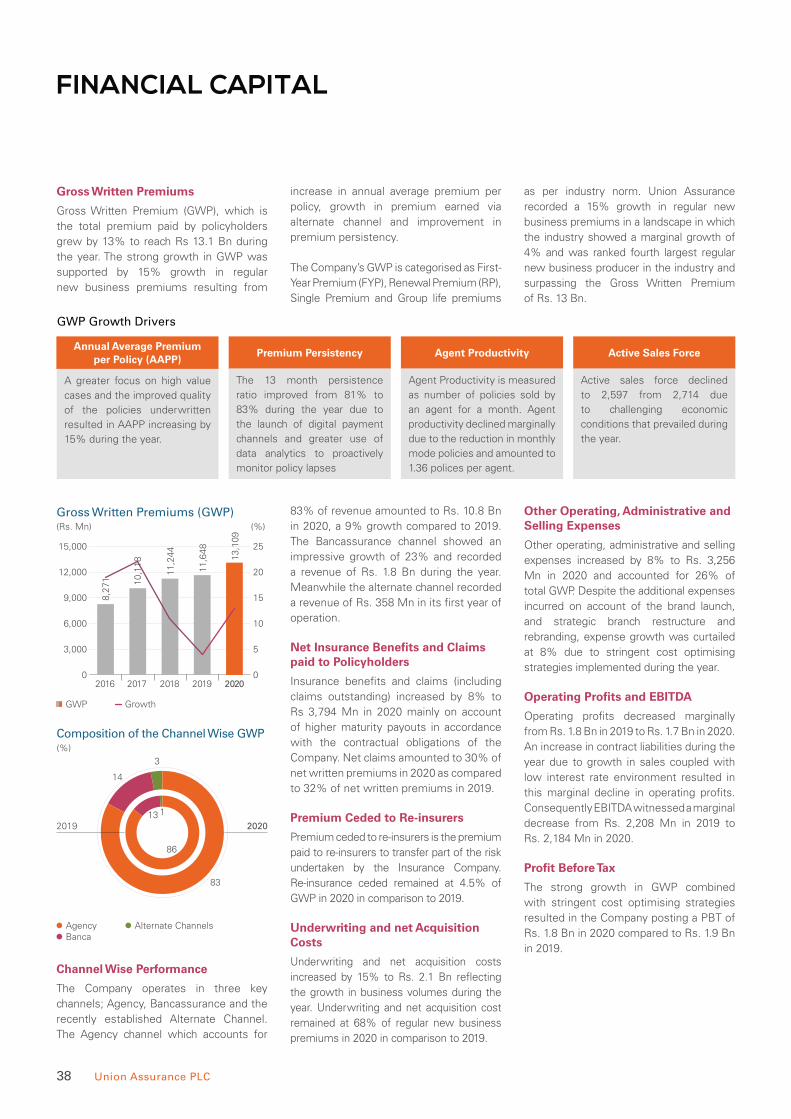
38 Union Assurance PLC
FINANCIAL CAPITAL
83% of revenue amounted to Rs. 10.8 Bn
in 2020, a 9% growth compared to 2019.
The Bancassurance channel showed an
impressive growth of 23% and recorded
a revenue of Rs. 1.8 Bn during the year.
Meanwhile the alternate channel recorded
a revenue of Rs. 358 Mn in its first year of
operation.
Net Insurance Benefits and Claims paid to Policyholders
Insurance benefits and claims (including
claims outstanding) increased by 8% to
Rs 3,794 Mn in 2020 mainly on account
of higher maturity payouts in accordance
with the contractual obligations of the
Company. Net claims amounted to 30% of
net written premiums in 2020 as compared
to 32% of net written premiums in 2019.
Premium Ceded to Re-insurers
Premium ceded to re-insurers is the premium
paid to re-insurers to transfer part of the risk
undertaken by the Insurance Company.
Re-insurance ceded remained at 4.5% of
GWP in 2020 in comparison to 2019.
Underwriting and net Acquisition Costs
Underwriting and net acquisition costs
increased by 15% to Rs. 2.1 Bn reflecting
the growth in business volumes during the
year. Underwriting and net acquisition cost
remained at 68% of regular new business
premiums in 2020 in comparison to 2019.
Other Operating, Administrative and Selling Expenses
Other operating, administrative and selling
expenses increased by 8% to Rs. 3,256
Mn in 2020 and accounted for 26% of
total GWP. Despite the additional expenses
incurred on account of the brand launch,
and strategic branch restructure and
rebranding, expense growth was curtailed
at 8% due to stringent cost optimising
strategies implemented during the year.
Operating Profits and EBITDA
Operating profits decreased marginally
from Rs. 1.8 Bn in 2019 to Rs. 1.7 Bn in 2020.
An increase in contract liabilities during the
year due to growth in sales coupled with
low interest rate environment resulted in
this marginal decline in operating profits.
Consequently EBITDA witnessed a marginal
decrease from Rs. 2,208 Mn in 2019 to
Rs. 2,184 Mn in 2020.
Profit Before Tax
The strong growth in GWP combined
with stringent cost optimising strategies
resulted in the Company posting a PBT of
Rs. 1.8 Bn in 2020 compared to Rs. 1.9 Bn
in 2019.
(Rs. Mn) (%)
2016 2017 2018 2019 2020
Gross Written Premiums (GWP)
0
3,000
6,000
9,000
12,000
15,000
0
5
10
15
20
25
GWP Growth
8,2
71 10,1
18
11,2
44
11,6
48
13,1
09
Gross Written Premiums
Gross Written Premium (GWP), which is
the total premium paid by policyholders
grew by 13% to reach Rs 13.1 Bn during
the year. The strong growth in GWP was
supported by 15% growth in regular
new business premiums resulting from
increase in annual average premium per
policy, growth in premium earned via
alternate channel and improvement in
premium persistency.
The Company’s GWP is categorised as First-
Year Premium (FYP), Renewal Premium (RP),
Single Premium and Group life premiums
as per industry norm. Union Assurance
recorded a 15% growth in regular new
business premiums in a landscape in which
the industry showed a marginal growth of
4% and was ranked fourth largest regular
new business producer in the industry and
surpassing the Gross Written Premium
of Rs. 13 Bn.
Annual Average Premium per Policy (AAPP)
Premium Persistency Agent Productivity Active Sales Force
A greater focus on high value
cases and the improved quality
of the policies underwritten
resulted in AAPP increasing by
15% during the year.
The 13 month persistence
ratio improved from 81% to
83% during the year due to
the launch of digital payment
channels and greater use of
data analytics to proactively
monitor policy lapses
Agent Productivity is measured
as number of policies sold by
an agent for a month. Agent
productivity declined marginally
due to the reduction in monthly
mode policies and amounted to
1.36 polices per agent.
Active sales force declined
to 2,597 from 2,714 due
to challenging economic
conditions that prevailed during
the year.
GWP Growth Drivers
(%)
83
14
3
2019 2020
Agency Banca
Composition of the Channel Wise GWP
Alternate Channels
86
13 1
Channel Wise Performance
The Company operates in three key
channels; Agency, Bancassurance and the
recently established Alternate Channel.
The Agency channel which accounts for

39 Annual Report 2020
Union Assurance at a Glance Management Discussion and Analysis Stewardship Financial Statements Supplementary Information
2019 was due to the absence of revaluation
gain from properties since the Company
revalues its properties once in two years.
Other comprehensive income benefited
from a valuation gain of Rs. 696 Mn on
AFS due to the decrease in the interest
rates of government debt securities.
Investment and Other Income
Investment and other income comprise
of income generated from our investment
portfolio. Despite the drop in market
interest rates, investment and other
income recorded a healthy growth of
10% amounting to Rs. 5,032 Mn in
2020 compared to Rs. 4,565 Mn in 2019
supported by re-aligning asset allocation.
Financial assets grew by 17% during
the year while the investment portfolio
generated a yield of 10.62%
Unrealised gains from equities amounting
to Rs. 258 Mn resulting from the recovery
of equity markets during the last quarter
of 2020 and rebalancing of equity
portfolio also contributed to the growth
in investment and other income. During
the year equities giving rise to a loss of
Rs. 449 Mn was sold with the purpose of
balancing the investment portfolio. Net
realised and unrealised losses amounted
to Rs. 191 Mn in 2020.
Other Comprehensive Income
Other comprehensive income during
the year amounted to Rs. 696 Mn and
included gains arising from Available for
Sale (AFS) assets and employee benefit
liabilities of the Company and its equity
accounted investee. The decrease in other
comprehensive income as compared to
Performance of Investment Portfolio
The Investment Portfolio grew by 17% during the year, amounting to Rs. 52 Bn as at
31.12.2020. Despite the low interest environment and sluggish equity market during
most part of the year, Life fund yield was 10.62% due to realigning asset allocation
and rebalancing the equity portfolio.
Fixed Income Investments Portfolio
With interest rates declining during the year, UA realigned asset
allocation to manage the impact of lower yields. Accordingly,
the investment focus was shifted away from government debt
securities to corporate debt securities, unit trust, commercial
papers and other asset classes with a short to medium
term outlook. All assets invested during the year are of
investment grade.
16.17%Fixed Income
Growth
Equity Investments Portfolio
The equity allocation of all funds under UA is managed by an
external Fund Manager from early 2020. Equity is managed
actively and is benchmarked with the S&PSL 20 total return
index. During the year the equity portfolio was rebalanced and
was invested in potential sectors targeting equities to provide
attractive returns in the long term. During the year UA’s net
investment in equity amounted to Rs. 900 Mn with Rs. 500 Mn
fresh cash injected in 2020.
44.4%Equity
portfolio
Growth
Unit Linked Investments Portfolio
UA has three unit linked investment funds; Unit Linked Fixed
income (FIXD), Unit Linked Managed (MNGD) and Unit Linked
Equity fund (EQTY). FIXD invests in a range of fixed income
securities in order to provide stable returns through regular
current income. MNGD is a balanced fund which invest in fixed
income securities and equity. EQTY’s objective is to deliver
relatively high returns over the long term on a risk adjusted
basis though equity investments. The FIXD fund is managed by
UA while management of MNGD and EQTY funds have been
outsourced to an external Fund Manager.
(15.3%)Unit Linked
Growth
(Rs. Mn) (%)
2016 2017 2018 2019 2020
Net Insurance Benefits and Claims
0
500
1,000
1,500
2,000
2,500
3,000
3,500
4,000
0
5
10
15
20
25
30
35
Net Insurance Benefits and Claims% from NWP
1,5
95
2,6
79
3,3
51
3,5
04
3,7
94
(Rs. Mn) (%)
2016 2017 2018 2019 2020
Underwriting and Net Acquisition Costs
0
500
1,000
1,500
2,000
2,500
15
16
17
18
19
20
Underwriting and Net Acquisition Costs % of GWP
1,4
42
1,8
41
2,0
55
1,8
57 2,1
45
(Rs. Mn) (%)
2016 2017 2018 2019 2020
Operating, Administration andOther Expenses
0
1,000
2,000
3,000
4,000
0
10
20
30
40
Expenses As a % of NWP
2,1
76 2,6
09
3,5
23
3,0
14
3,2
56

40 Union Assurance PLC
FINANCIAL CAPITAL
Total Assets
Total assets amounting to Rs. 62.6 Bn as
at 31.12.2020 grew by 13% during the year
supported by a 17% increase in financial
investments.
Financial Investments
Financial investments which account for
84% of total assets and amounted to
Rs. 52.3 Bn as at 31.12.2020, consist of
a diversified portfolio of financial assets.
57% of our investment portfolio in 2020
comprised of investments in Treasury
Bonds, while investments in Debentures
accounted for 20% of total financial
investments.
Property Plant and Equipment
Property plant and equipment which
accounted for 4% of total assets
amounted to Rs. 2.47 Bn as at 31.12.2020
compared to Rs. 2.5 Bn as at 31.12.2019.
The marginal decrease is on account of
depreciation of assets.
Intangible Assets
Intangible assets amounted to Rs. 1.2 Bn
as at 31.12.2020 compared to Rs. 1.3 Bn
as at 31.12.2019. The marginal decline of
Rs. 59 Mn is due to the amortisation of
the of policy administration system and
contractual relationships (Bancassurance
distribution rights) in 2020.
Total Liabilities
Total liabilities amounted to Rs. 47.5 Bn as at 31.12.2020 compared to Rs. 40.6 Bn as at 31.12.2019. The increase in liabilities during the year was in line with the 18% growth in the life insurance fund which accounts for 88% of total liabilities.
Insurance Contract Liabilities (Life Fund)
Insurance Contract Liabilities is the fund maintained for the long-term insurance business by the Company in accordance with the Regulation of Insurance Industry Act, No. 43 of 2000, (as amended). Life insurance contract liabilities including unit linked grew by 17% to Rs. 43 Bn. This was due to increase in contract liabilities by Rs. 6 Bn
Shareholders’ Funds
Shareholders’ equity increased by 3% during the year due to net of transfer of other comprehensive income of Rs. 1,616 Mn and dividend payment of Rs. 1,179 Mn in 2020. The solvency position of the Company in terms of Capital Adequacy Ratio and Determination is discussed in under Risk Management Section of the Annual Report.
Dividends
As per the IRCSL letter dated 8 June 2020,
the Company did not declare dividends
in 2020.
Return on Assets (ROA) and Return on Equity (ROE)
ROA and ROE during the year stood at 2%
and 6% respectively compared to 2% and
8% in 2019.
Total assets amounting to Rs. 62.6 Bn as at 31.12.2020 grew by 13% during the year supported by a 17% increase in financial investments.
(Rs. Mn) (%)
2016 2017 2018 2019 2020
Intangible Assets and Property,Plant and Equipment
0
500
1,000
1,500
2,000
2,500
3,000
3,500
4,000
(100)
0
100
200
300
400
500
600
PPEIntangible Assets
Growth in PPEGrowth in Intangible Assets
(Rs. Mn) (%)
2016 2017 2018 2019 2020
Total Assets
0
10,000
20,000
30,000
40,000
50,000
60,000
70,000
80,000
10
15
20
25
Total Assets Growth
35,6
93
43,0
67
49,1
17
55,2
49
62,6
00
Financial PositionSnapshot of the Financial Position
2020 2019 Growth %
Assets Total Assets 62,600 55,249 13
Financial Investments 52,356 44,881 17
Intangible Assets 1,247 1,307 -5
Property Plant and Equipment’s 2,469 2,500 -1
Liabilities Total Liabilities 47,492 40,586 17
Insurance Contract Liabilities 41,882 35,490 18
Shareholder Funds 15,108 14,663 3
(%)
7
57
20
9
4
2 1
Commercial PaperDebenturesFixed-Term DepositsReverse Repo
Composition of Financial Investments
EquitiesTreasury BondsUnit Trusts
2019 202019
75
762

41 Annual Report 2020
Union Assurance at a Glance Management Discussion and Analysis Stewardship Financial Statements Supplementary Information
During the year the investment Committee
together with the finance, actuarial and
investment team closely monitored the
maturity profiles of assets and liabilities to
manage asset liability mismatches.
During the year we implemented several initiatives to manage liquidity amidst the disruptions caused by COVID-19. Key among these initiatives was weekly cash flow monitoring and forecasting by the Spend Control Committee.
UA Share Performance UA is listed on the CSE (UAL.N0000) with a market capitalisation of Rs. 17.9 Bn as at 31.12.2020. The number of shares issued remained
unchanged during the year at 58,928,572 shares. Highlights of the UA share performance are depicted below;
Sh
are
Pri
ce
(%)
1/1
/20
2/1
/20
3/1
/20
4/1
/20
5/1
/20
6/1
/20
7/1
/20
8/1
/20
9/1
/20
10/1
/20
11/1
/20
12/1
/20
UA share performance vs Market performance (YTD)
0.6
0.8
1.0
1.2
UAL ASPI
UA’s share price declined by 8% in 2020 to close at
Rs. 305.00 and traded throughout the year with an average
daily volume of 1,473 shares. UA shares traded between a
low of Rs. 274.90 and a high of Rs. 355.00. The shares beta
against the ASPI stood at 0.34 as of fourth quarter of 2020.
(Rs. Mn) (%)
2016 2017 2018 2019 2020
Insurance Contract Liabilities
0
10,000
20,000
30,000
40,000
50,000
(5)
0
5
10
15
20
Life FundUnit Linked Fund
Growth
(Rs. Mn) (%)
2016 2017 2018 2019 2020
Shareholders' Funds
0
5,000
10,000
15,000
20,000
(5)
0
5
10
15
20
Stated CapitalRestrictedRegulatory Reserves
Retained EarningsReserves% Growth in Equity
(Rs. Mn)
2018 2019 2020
Cash Flow Generated Based on Activities
(8,000)
(6,000)
(4,000)
(2,000)
0
2,000
4,000
6,000
8,000
10,000
Operating ActivitiesInvesting Activities
Financing Activities
5,1
70
(4,1
78)
(957)
6,6
71
(5,3
71)
8,2
64
(6,6
53)
(1,2
76)
(1,2
89)
Cash Flow Net cash flows from operating activities
grew by 24% to Rs 8,264 Mn as at
31.12.2020 mainly on account of inflows
from insurance premium payments. Net
cash flow used in investment activities
recorded an outflow of Rs. 6,653 Mn
compared to the outflow of Rs. 5,371 Mn in
2019 mainly due to the increase in business
cash flows during the year. Cash outflow
from financing activities was Rs. 1,276 Mn
mainly on account of dividend payments
made in relation to 2019 and related taxes.
Consequently, Net cash increased during
the year amounted to Rs. 335 Mn. Cash
and cash equivalents grew by 72% to
Rs. 799 Mn as at 31.12 2020 compared
to Rs. 465 Mn as at 31.12.2019. The
significant growth was on account of Rs.
2 Bn GWP collected in December 2020.
During the year several initiatives were
implemented to manage liquidity amidst
the disruptions caused by COVID-19.
Key initiatives among these initiatives
was weekly cash flow monitoring
and forecasting by the Spend Control
Committee, planning expenditure based
on forecasted revenue inflows and
negotiating deferred payment terms and
monthly payment plans with vendors.
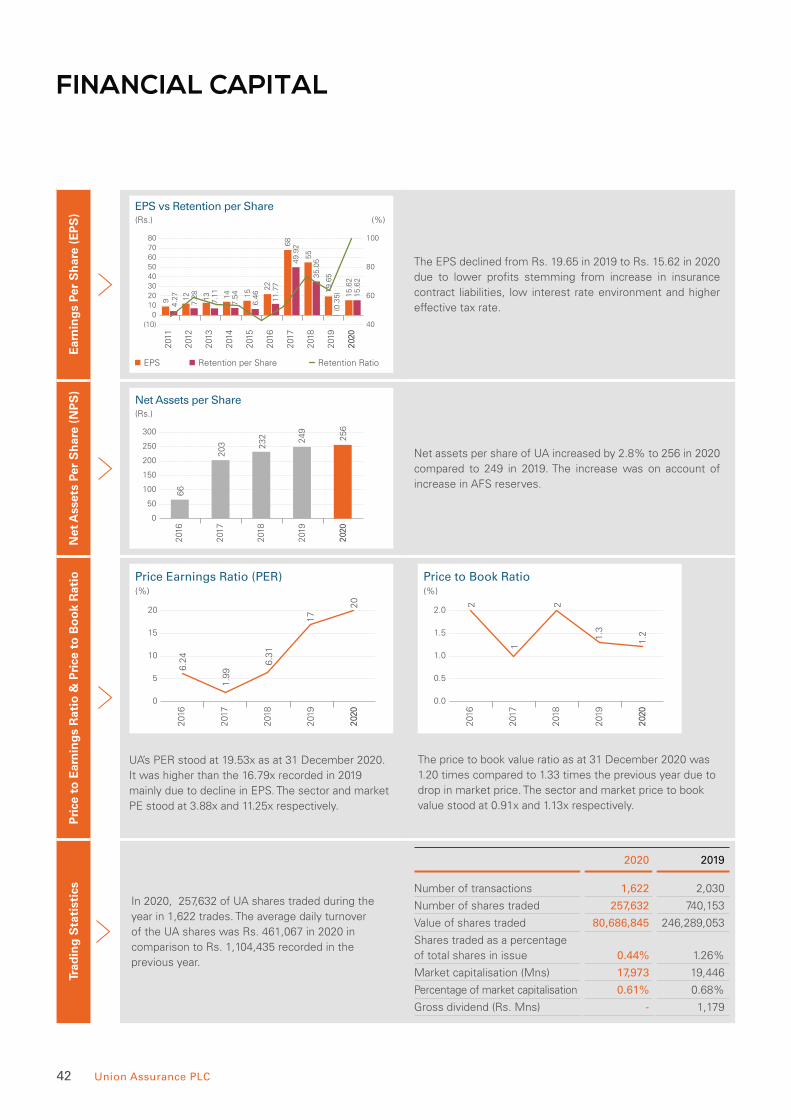
42 Union Assurance PLC
FINANCIAL CAPITALE
arn
ing
s Pe
r S
har
e (E
PS
)
(Rs.) (%)
201
1
201
2
201
3
201
4
201
5
201
6
201
7
201
8
201
9
202
0
EPS vs Retention per Share
(10)0
1020304050607080
EPS Retention per Share Retention Ratio
9 4.2
7
12
7.2
8
13
7.1
1
14
7.5
4 15
6.4
6
22
11
.77
68
49
.92
55
35
.05
19
.65
(0.3
5) 15
.62
15
.62
40
60
80
100
The EPS declined from Rs. 19.65 in 2019 to Rs. 15.62 in 2020
due to lower profits stemming from increase in insurance
contract liabilities, low interest rate environment and higher
effective tax rate.
Net
Ass
ets
Per
Sh
are
(NP
S)
(Rs.)
201
6
201
7
201
8
201
9
202
0
Net Assets per Share
0
50
100
150
200
250
300
66
20
3 23
2 24
9
25
6
Net assets per share of UA increased by 2.8% to 256 in 2020
compared to 249 in 2019. The increase was on account of
increase in AFS reserves.
Pri
ce t
o E
arn
ing
s R
atio
& P
rice
to
Bo
ok
Rat
io
201
6
201
7
201
8
201
9
202
0
0
5
10
15
20
6.2
4
1.9
9
6.3
1
17
20
(%)
Price Earnings Ratio (PER)
UA’s PER stood at 19.53x as at 31 December 2020.
It was higher than the 16.79x recorded in 2019
mainly due to decline in EPS. The sector and market
PE stood at 3.88x and 11.25x respectively.
201
6
201
7
201
8
201
9
202
0
0.0
0.5
1.0
1.5
2.0
2
1
2
1.3
1.2
(%)
Price to Book Ratio
The price to book value ratio as at 31 December 2020 was
1.20 times compared to 1.33 times the previous year due to
drop in market price. The sector and market price to book
value stood at 0.91x and 1.13x respectively.
Trad
ing
Sta
tist
ics
In 2020, 257,632 of UA shares traded during the
year in 1,622 trades. The average daily turnover
of the UA shares was Rs. 461,067 in 2020 in
comparison to Rs. 1,104,435 recorded in the
previous year.
2020 2019
Number of transactions 1,622 2,030
Number of shares traded 257,632 740,153
Value of shares traded 80,686,845 246,289,053
Shares traded as a percentage
of total shares in issue 0.44% 1.26%
Market capitalisation (Mns) 17,973 19,446
Percentage of market capitalisation 0.61% 0.68%
Gross dividend (Rs. Mns) - 1,179

43 Annual Report 2020
Union Assurance at a Glance Management Discussion and Analysis Stewardship Financial Statements Supplementary Information
Distribution and Composition of Shareholders The Company has a diversified base of Shareholders across a wide geographical spread and includes both private and institutional
Shareholders. The total number of shares remained at 58,928,572 as of 31st December 2020. UA has 1,409 registered individual
Shareholders representing 93.19% of the Shareholders. A majority of the individual Shareholders are residents of Sri Lanka and 93.73%
of the Company shareholdings consists institutional shareholding. The top 20 Shareholders hold 96.59% of UA’s share capital. The
Directors do not hold any shares in their capacity as of 31st December 2020.
Composition of Shareholders
31-Dec-20 31-Dec-19
No of
Shareholders
% No of
shares
% No of
Shareholders
% No of
shares
%
Directors & spouses: - - - - - - - -
Resident:
Individuals 1,396 92.33 3,630,761 6.16 1,295 92.11 3,650,008 6.19
Institutions 99 6.55 1,608,066 2.73 94 6.69 1,595,774 2.71
Non-Resident:
Individuals 13 0.86 66,736 0.11 3 0.21 587,294 1.00
Institutions 3 0.19 587,294 1.00 13 0.92 59,781 0.10
Shareholders holding more
than 10%: 1 0.07 53,035,715 90.00 1 0.07
53,035,715 90.00
Total 1,512 100.00 58,928,572 100.00 1,406 100.00 58,928,572 100.00
Distribution of Shareholders
Range of Shareholders 31-Dec-20 31-Dec-19
No of
Shareholders
% No of
shares
% No of
Shareholders
% No of
shares
%
Less than 1,000 1,134 75.00 259,033 0.44 1,029 73.19 248,152 0.42
1,001 to 10,000 317 20.97 1,019,920 1.73 317 22.55 994,436 1.69
10,001 to 100,000 53 3.51 1,434,860 2.43 52 3.70 1,507,226 2.56
100,001 to 1,000,000 6 0.40 1,779,044 3.02 6 0.43 1,793,043 3.04
Over 1,000,001 2 0.13 54,435,715 92.38 2 0.14 54,385,715 92.29
Total 1,512 100.00 58,928,572 100.00 1,406 100.00 58,928,572 100.00
Public Shareholding
The Company is listed on the Colombo Stock Exchange and the percentage of shares held by the public, the number of public Shareholders
and the float adjusted market capitalisation is as given below;
31-Dec-20 31-Dec-19
Public shareholding (%) 10 10
Public Shareholders 1,511 1,405
Compliant under option 1 - float adjusted market Capitalisation (Rs. Bn) 1.80 1.94

44 Union Assurance PLC
FINANCIAL CAPITAL
Directors’ Shareholdings
No. of Shares as at 31-Dec-20 31-Dec-19
Mr. Krishan Niraj Jayasekara Balendra - (Chairman) Nil Nil
Mr. Suresh Rajendra Nil Nil
Mr. Dumith Hemantha Fernando Nil Nil
Mr. Stephen Anthony Appleyard Nil Nil
Mr. Daminda Prabhath Gamlath
[Appointed w.e.f 10.06.2020] Nil Nil
Mr. Warnage Malinga De Fonseka Arsakularatne
[Appointed w.e.f 14.07. 2020] Nil Nil
Mr. Harin Amendra Joseph De Silva Wijeyeratne
[Resigned w.e.f 06.09. 2020] N/A Nil
CEO’s Share Holding
No. of Shares as at 31-Dec-20 31-Dec-19
Mr. Jude Gomes Nil Nil
Twenty Largest Shareholders
Name of Shareholder 31-Dec-20 31-Dec-19
As at No of shares % No of shares %
John Keells Holdings PLC 53,035,715 90.00 53,035,715 90.00
Mr. S. N. P. Palihena 1,400,000 2.38 1,350,000 2.29
Suktam Holdings (PVT) Ltd 609,000 1.03 609,000 1.03
Citibank Newyork S/A Norges Bank Account 2 580,294 0.98 580,294 0.98
Rubber Investment Trust Limited A/C # 01 199,000 0.34 199,000 0.34
Corporate Holdings (Private) Limited 149,373 0.25 149,373 0.25
Captain D. V. H. Palihena 138,495 0.24 138,495 0.24
People's Leasing & Finance PLC/Mr. L. P. Hapangama 102,882 0.17 116,881 0.20
Mrs. A. Selliah 100,000 0.17 100,000 0.17
People's Leasing & Finance PLC/Mr. L. H. L. M. P Haradasa 78,494 0.13 88,392 0.15
People's Leasing & Finance PLC/Dr. H. S. D. Soysa & Mrs. G.Soysa 73,135 0.12 83,135 0.14
Mr. J.D. Bandaranayake & Miss. N.Bandaranayake &
Dr. (Mrs.) V. Bandaranayake 59,019 0.10 59,019 0.10
Mr. J.D.Bandaranayake & Miss. I.Bandaranayake &
Dr. (Mrs.) V. Bandaranayake 59,019 0.10 59,019 0.10
Mr. H. A. D. Ratnapala 56,250 0.10 56,250 0.10
Mr. J. W. Nanayakkara 56,250 0.10 56,250 0.10
People's Merchant Finance PLC/P.T.S. De Silva 55,415 0.09 40,307 0.07
Dr. S. Selliah 50,000 0.08 50,000 0.08
Mr. V. Sharda 44,200 0.08 44,200 0.08
Mr. N. D.Kurukulasuriya 39,000 0.07 39,000 0.07
Dr. T. Senthilverl 34,876 0.06 - -
Others 2,008,155 3.41 2,074,242 3.52
Total number of shares issued: 58,928,572 100.00 58,928,572 100.00
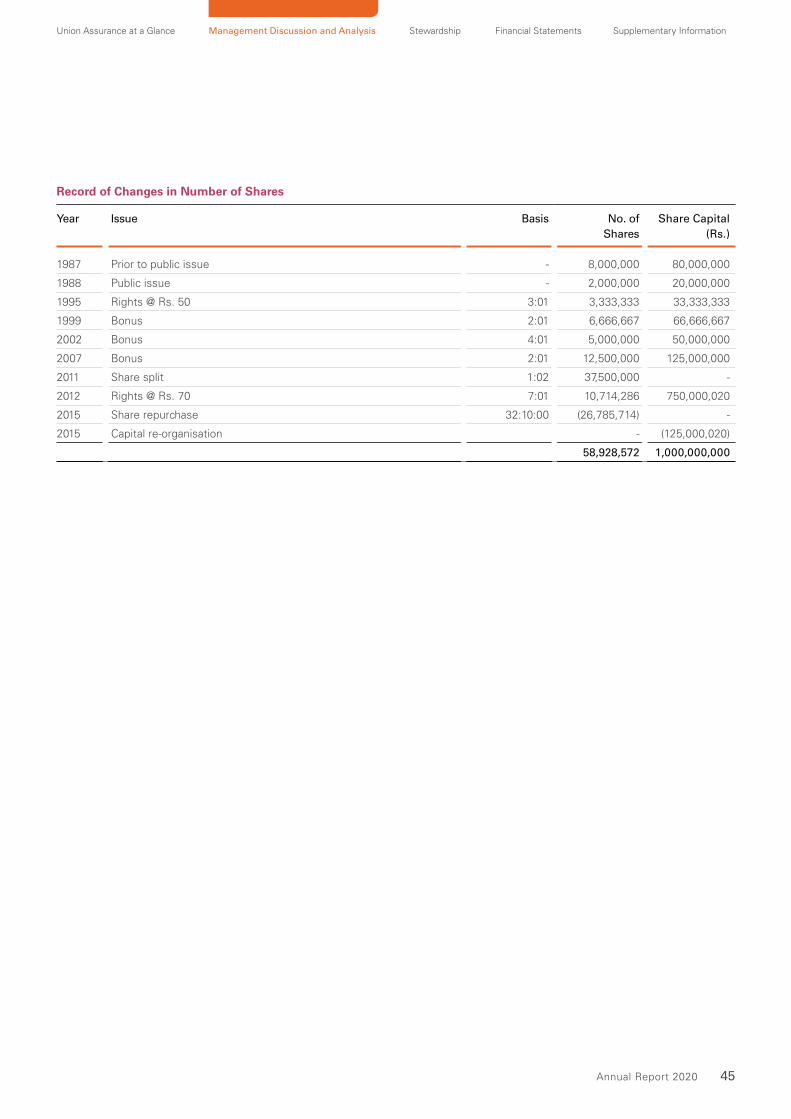
45 Annual Report 2020
Union Assurance at a Glance Management Discussion and Analysis Stewardship Financial Statements Supplementary Information
Record of Changes in Number of Shares
Year Issue Basis No. of
Shares
Share Capital
(Rs.)
1987 Prior to public issue - 8,000,000 80,000,000
1988 Public issue - 2,000,000 20,000,000
1995 Rights @ Rs. 50 3:01 3,333,333 33,333,333
1999 Bonus 2:01 6,666,667 66,666,667
2002 Bonus 4:01 5,000,000 50,000,000
2007 Bonus 2:01 12,500,000 125,000,000
2011 Share split 1:02 37,500,000 -
2012 Rights @ Rs. 70 7:01 10,714,286 750,000,020
2015 Share repurchase 32:10:00 (26,785,714) -
2015 Capital re-organisation - (125,000,020)
58,928,572 1,000,000,000

46 Union Assurance PLC
MANUFACTURED CAPITAL
BRANCHES ISLANDWIDE
CUSTOMER TOUCH POINTS
DIGITAL INSURANCE PLATFORM
(CLICKLIFE)
SELF SERVICE APP
75
OVER 900
Our forward-thinking investments to physical and digital infrastructure during the past few years enabled us to rapidly transition to a digital operating model and successfully navigate the disruptions caused by the COVID-19 Pandemic.
Our Manufactured Capital Resources
Management Approach
Future Focus
• Strategically expand our geographical footprint based on maximum impact
locations
• Leverage mobile technology to increase interaction with customers
• Strengthen digital operating model to stay relevant in the post COVID-19 new
normal
Our Manufactured Capital consisting of
our physical and digital infrastructure
are the interfaces through which we
connect with our customers. In addition
to helping us reach out to a wider
customer base, our branches and digital
platforms communicate our brand
ethos and spirit. Investments in our
physical and digital infrastructure are
therefore carefully evaluated to ensure
maximum reach, maximum efficiency,
and maximum sustainability.

47 Annual Report 2020
Link to SDGs
• Strengthened our digital capabilities
including remote working
infrastructure and digital client
interfaces to ensure minimal
disruption during the COVID-19
pandemic.
• Implemented new branch branding
initiative
• Strategically evaluated branch
network and relocated 8 branches
in key cities and townships to
maximise visibility and reach.
• Revamped 3 branches to reflect
new brand proposition
How we created value during the year
What we achieved during the year
REVENUE PER INVESTMENT IN MANUFACTURED CAPITAL
NEW BRANCHES NO. OF CONSOLIDATED BRANCHES
STRATEGIC RE-LOCATIONS
NO. OF REFURBISHED BRANCHES
BRANCH MAINTENANCE COST
TRAINING SPACE
Rs. 171
02 11
08
12
Rs. 65 Mn
48,847Sqft
We are disrupting the
life insurance industry
in the country with our
breakthrough digitisation
efforts .
Our extensive reach
provides widespread
access to insurance
products and services.
Po
siti
ve
Tra
de
-Off
s
Neg
ati
ve
Tra
de
-Off
s
Enhancing Our Geographical Footprint We continue to strategically evaluate our
branch network to ensure widest reach and
cost optimisation. To this end 8 branches
were strategically re-located to high impact
locations, while 11 branches with lower
footfall were consolidated during the year.
We also continued with our branch
revamping programme, upgrading 12
identified branches across the island.
Selected branches and our Head-Office
were re-modelled to reflect our new brand
proposition and to complement our Digital
Agency Model. We are also gradually
moving towards greener infrastructure and
continue to upgrade branches with more
environmentally friendly layouts.
Resource allocation for branches is based
on a systematic process that involves
ranking branches based on performance
matrices and assessing requirements to
ensure network cost optimisation.
Investments in physical and digital infrastructure require significant capex.
Productivity and efficiency gains for employees
Cost efficiencies will positively impact bottom line
Positive impact on customer relationships
Capital Trade-Offs
Union Assurance at a Glance Management Discussion and Analysis Stewardship Financial Statements Supplementary Information
(Rs. Mn)
2016 2017 2018 2019 2020
Investment in Manufactured Capital
0
50
100
150
200
53
40
154
97.5
51.6

48 Union Assurance PLC
MANUFACTURED CAPITAL
Our Branch Network
Expanding Our Digital Infrastructure Having embarked on our digital journey
several years ago, we were well prepared
to rapidly transition to a digital operating
model to ensure uninterrupted services
to our customers during the COVID-19
pandemic.
During the year we strengthened our
Information Technology and network
infrastructure to facilitate remote working
and drive greater productivity and efficiency.
We continued to invest in our digital client
servicing capabilities with the introduction
of Clicklife, a fully digitised end-to-end
solution and a Self-servicing App that has
digitised the policy follow up process. Key
milestones in our digital transformation
achieved during the year are listed below;
further, plans are in place to implement
end-to-end digital communication platform
across our branch network.
Northern
Eastern
Central
Uva
Southern
Western
Sabaragamuwa
NorthWestern
North Central
Northern Province
Our Presence
07 48247
North Central Province
Our Presence
06 46280
Western Province
Our Presence
21 4511,113
Uva Province
Our Presence
05 32166
Sabaragamuwa Province
Our Presence
06 46120
Eastern Province
Our Presence
05 3860
Central Province
Our Presence
06 86224
North Western Province
Our Presence
10 57490
Southern Province
Our Presence
09 105684
102-4GRI
(Rs. Mn)
2016 2017 2018 2019 2020
Intangible Assets
0
100
200
300
400
500
65.3
6 151.2
47
2.1
3
36.9
7
25.2
9
Branches
Agents
Bancassurance
Units
Contribution
to GWP
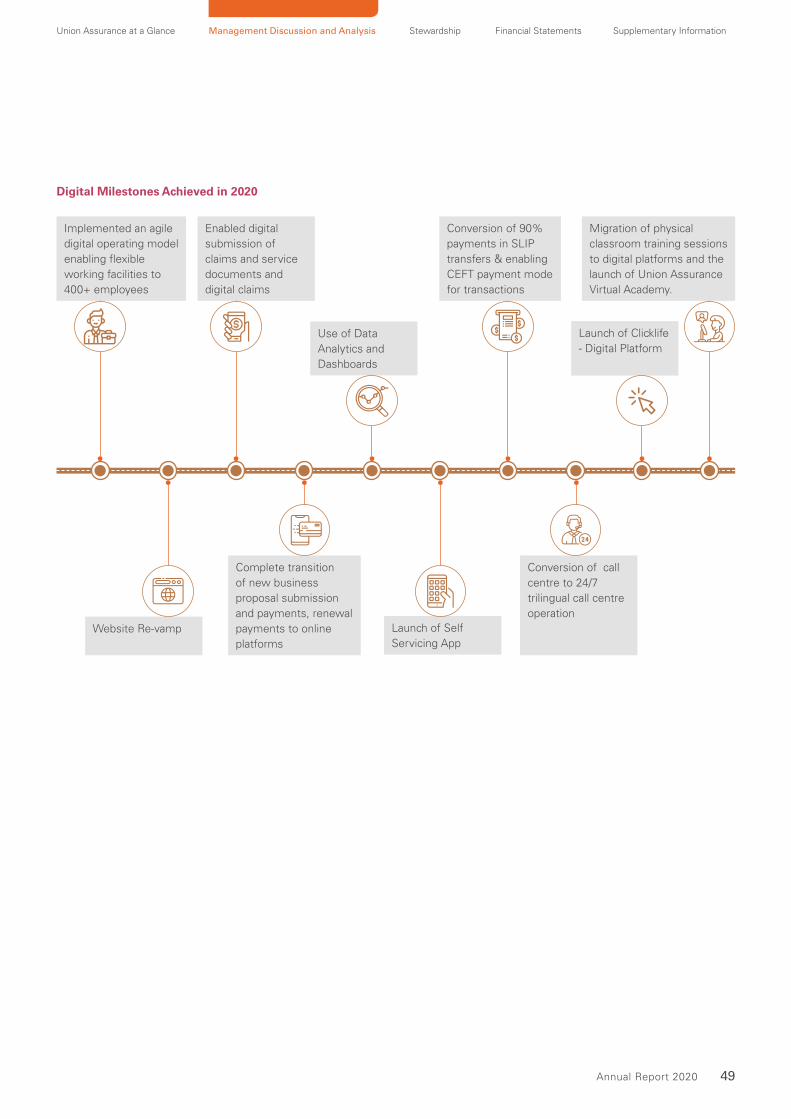
49 Annual Report 2020
Digital Milestones Achieved in 2020
Implemented an agile
digital operating model
enabling flexible
working facilities to
400+ employees
Enabled digital
submission of
claims and service
documents and
digital claims
Launch of Clicklife
- Digital Platform
Conversion of 90%
payments in SLIP
transfers & enabling
CEFT payment mode
for transactions
Use of Data
Analytics and
Dashboards
Migration of physical
classroom training sessions
to digital platforms and the
launch of Union Assurance
Virtual Academy.
Website Re-vamp Launch of Self
Servicing App
Conversion of call
centre to 24/7
trilingual call centre
operation
Complete transition
of new business
proposal submission
and payments, renewal
payments to online
platforms
Union Assurance at a Glance Management Discussion and Analysis Stewardship Financial Statements Supplementary Information

50 Union Assurance PLC
NATURAL CAPITAL
ELECTRICITY CONSUMED
WATER CONSUMED
5,379 GJ
17,759 m3
We remain committed to reducing our Carbon Footprint by adopting sustainable practices that promote responsible consumption of resources and proactive climate action.
Our Natural Capital Resources
Future Focus
• Invest in solar energy panels to the head office and portable solar panel sets for
rented buildings based on the rent period.
• Reduce carbon footprint by 5%.
• Reduce electricity usage in branches by 3%.
• Check and update on green initiatives done by our suppliers and rate them accordingly.
Management Approach
As a responsible Corporate Entity, we
are committed to safeguarding the
long-term well-being of our employees,
customers and communities. We
therefore strive to minimise negative
externalities whilst ensuring responsible
consumption of natural resources by
adopting efficient, sustainable and
ethical practices across our operations.
We have in place a comprehensive
Natural Capital Management
framework which involves assessing
and reviewing our priorities annually,
developing and implementing
environmental policies, strategies
and processes and monitoring our
impacts and outcomes. There were
no instances of non-compliance with
environmental regulations during the
period under review.
103-1, 103-2, 103-3GRI

51 Annual Report 2020
Link to SDGs
• Widespread adoption of remote
working has reduced employee
commute related emissions.
• Adoption of flexible, standardised
office partitioning to reduce timber
consumption.
• Introduction of “Green branches”
that incorporate efficient and
sustainable layouts.
How we created value during the year
What we achieved during the year
REDUCTION IN CARBON FOOTPRINT
ENERGY SAVING
PAPER RECYCLED
WASTE RECYCLED
464 tCo2e
323,889 kWh
15,572 Kg
17,162 Kg
Reviewing Our Priorities
Environmental Management System
Monitoring Our Impact
• Air Emissions
• Water Consumption
• Waste Generated
• Material Use
• Energy Consumption
• Environmental Policy
• Planning
• Implementation and Operation
• Measurement
• Internal Audit and Review
Our Environmental AgendaOur Environmental Agenda is aimed at adopting best practices in Energy Management,
Water Management, Emission Control and Effluent and Waste Management across
our value chain. Whilst ensuring that we strictly adhere to all environmental laws,
regulations and requirements we also continue to create awareness within and without
our organisation through ongoing awareness and knowledge sharing sessions about the
importance of protecting our environment.
Energy Management
Effluent and Waste Management
Water Management
Emission Control
Energy Management Total Energy consumption during the year amounted to 5,379 GJ resulting in an energy
cost of Rs. 39 Mn. Total energy consumption declined by almost 18% during the year as a
result of employees being encouraged to work from home during the COVID-19 pandemic.
This also resulted in a reduction on fuel consumption due to less people commuting to
and from work.
Union Assurance at a Glance Management Discussion and Analysis Stewardship Financial Statements Supplementary Information
103-1, 103-2, 103-3, 302-1, 302-2, 302-3, 302-4, 302-5
GRI
30%
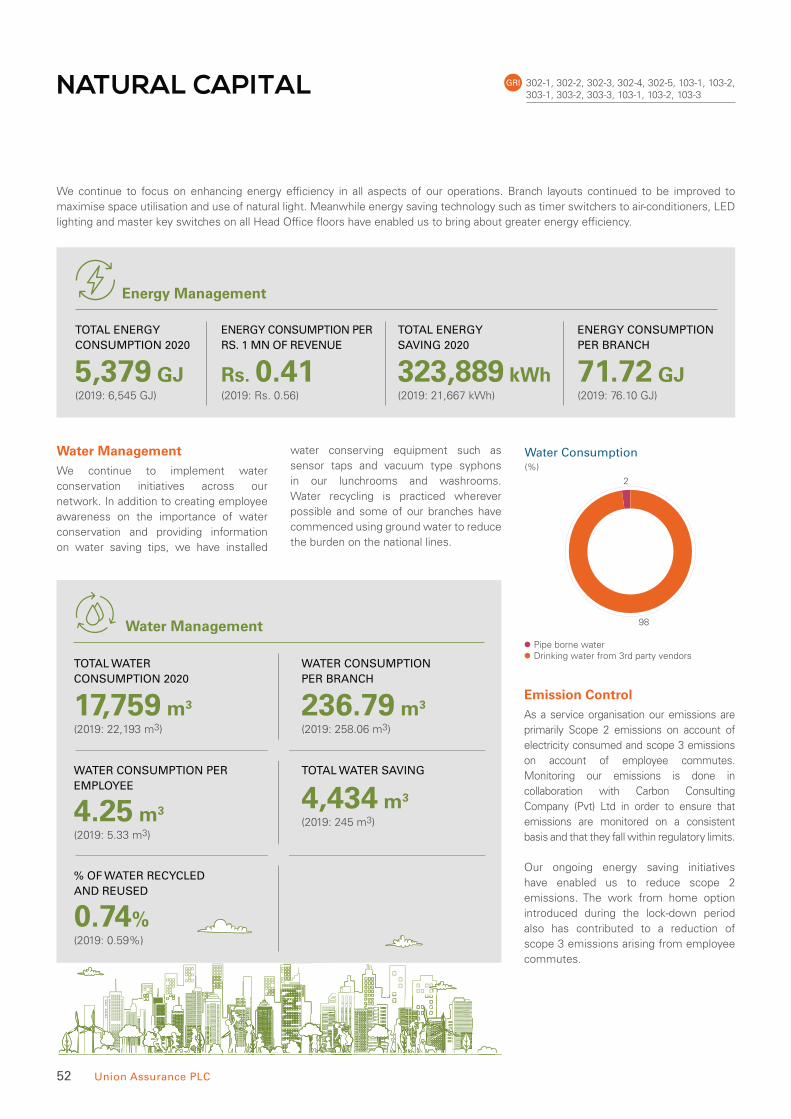
52 Union Assurance PLC
NATURAL CAPITAL
We continue to focus on enhancing energy efficiency in all aspects of our operations. Branch layouts continued to be improved to
maximise space utilisation and use of natural light. Meanwhile energy saving technology such as timer switchers to air-conditioners, LED
lighting and master key switches on all Head Office floors have enabled us to bring about greater energy efficiency.
Emission Control As a service organisation our emissions are
primarily Scope 2 emissions on account of
electricity consumed and scope 3 emissions
on account of employee commutes.
Monitoring our emissions is done in
collaboration with Carbon Consulting
Company (Pvt) Ltd in order to ensure that
emissions are monitored on a consistent
basis and that they fall within regulatory limits.
Our ongoing energy saving initiatives
have enabled us to reduce scope 2
emissions. The work from home option
introduced during the lock-down period
also has contributed to a reduction of
scope 3 emissions arising from employee
commutes.
Water Management We continue to implement water
conservation initiatives across our
network. In addition to creating employee
awareness on the importance of water
conservation and providing information
on water saving tips, we have installed
water conserving equipment such as
sensor taps and vacuum type syphons
in our lunchrooms and washrooms.
Water recycling is practiced wherever
possible and some of our branches have
commenced using ground water to reduce
the burden on the national lines.
Water Management
Energy Management
TOTAL ENERGY
CONSUMPTION 2020
ENERGY CONSUMPTION PER
RS. 1 MN OF REVENUE
TOTAL ENERGY
SAVING 2020
ENERGY CONSUMPTION
PER BRANCH
(2019: 6,545 GJ) (2019: Rs. 0.56) (2019: 21,667 kWh) (2019: 76.10 GJ)
5,379 GJ Rs. 0.41 323,889 kWh 71.72 GJ
TOTAL WATER
CONSUMPTION 2020
WATER CONSUMPTION
PER BRANCH
WATER CONSUMPTION PER
EMPLOYEE
% OF WATER RECYCLED
AND REUSED
TOTAL WATER SAVING
(2019: 22,193 m3) (2019: 258.06 m3)
(2019: 245 m3)(2019: 5.33 m3)
(2019: 0.59%)
17,759 m3 236.79 m3
4.25 m3
0.74%
4,434 m3
302-1, 302-2, 302-3, 302-4, 302-5, 103-1, 103-2, 303-1, 303-2, 303-3, 103-1, 103-2, 103-3
GRI
(%)
98
2
Pipe borne waterDrinking water from 3rd party vendors
Water Consumption
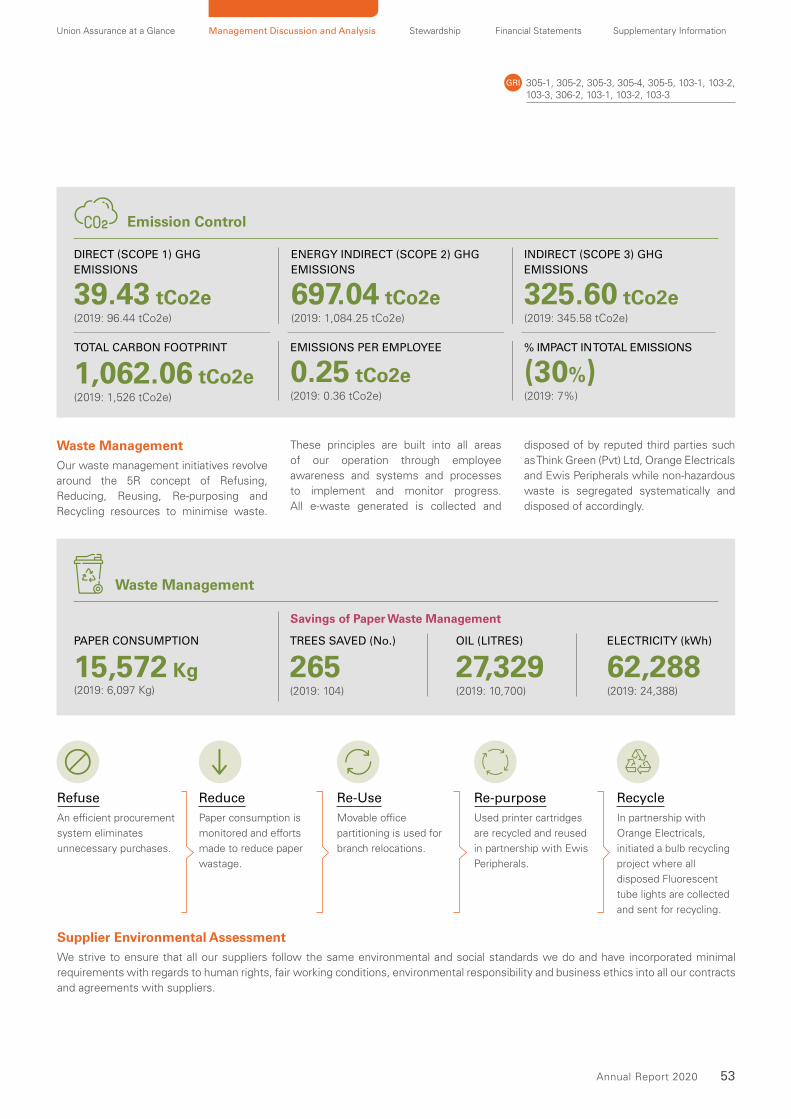
53 Annual Report 2020
Waste Management Our waste management initiatives revolve
around the 5R concept of Refusing,
Reducing, Reusing, Re-purposing and
Recycling resources to minimise waste.
These principles are built into all areas
of our operation through employee
awareness and systems and processes
to implement and monitor progress.
All e-waste generated is collected and
disposed of by reputed third parties such
as Think Green (Pvt) Ltd, Orange Electricals
and Ewis Peripherals while non-hazardous
waste is segregated systematically and
disposed of accordingly.
Emission Control
Waste Management
DIRECT (SCOPE 1) GHG
EMISSIONS
ENERGY INDIRECT (SCOPE 2) GHG
EMISSIONS
% IMPACT IN TOTAL EMISSIONS
INDIRECT (SCOPE 3) GHG
EMISSIONS
EMISSIONS PER EMPLOYEETOTAL CARBON FOOTPRINT
(2019: 96.44 tCo2e) (2019: 1,084.25 tCo2e)
(2019: 7%)(2019: 1,526 tCo2e)
(2019: 345.58 tCo2e)
(2019: 0.36 tCo2e)
39.43 tCo2e 697.04 tCo2e
(30%)
325.60 tCo2e
0.25 tCo2e1,062.06 tCo2e
PAPER CONSUMPTION
Savings of Paper Waste Management
(2019: 6,097 Kg)
15,572 Kg
TREES SAVED (No.)
(2019: 104)
265OIL (LITRES)
(2019: 10,700)
27,329ELECTRICITY (kWh)
(2019: 24,388)
62,288
Refuse
An efficient procurement
system eliminates
unnecessary purchases.
Reduce
Paper consumption is
monitored and efforts
made to reduce paper
wastage.
Re-Use
Movable office
partitioning is used for
branch relocations.
Re-purpose
Used printer cartridges
are recycled and reused
in partnership with Ewis
Peripherals.
Recycle
In partnership with
Orange Electricals,
initiated a bulb recycling
project where all
disposed Fluorescent
tube lights are collected
and sent for recycling.
Supplier Environmental Assessment We strive to ensure that all our suppliers follow the same environmental and social standards we do and have incorporated minimal
requirements with regards to human rights, fair working conditions, environmental responsibility and business ethics into all our contracts
and agreements with suppliers.
Union Assurance at a Glance Management Discussion and Analysis Stewardship Financial Statements Supplementary Information
305-1, 305-2, 305-3, 305-4, 305-5, 103-1, 103-2, 103-3, 306-2, 103-1, 103-2, 103-3
GRI

54 Union Assurance PLC
HUMAN CAPITAL
EMPLOYEES
795
Our dedicated team of 795 employees was a key strength during the COVID-19 pandemic, displaying resilience and commitment in the face of unprecedented challenges. In turn, we focused on ensuring our teams’ health and safety, and providing them the necessary support to navigate the challenges faced.
Our Human Capital
Future Focus
• Develop the UA brand as an attractive employer brand through social media
channels
• Develop an employee engagement calendar
• Strengthen exit interview process
• Revamp recruitment processes with defined SLA’s
• Implementation of lean management transformation initiative
• Strengthen work life balance initiatives
Management Approach
We are committed to ensuring a level
playing field for all our employees
and have in place a comprehensive
governance framework and robust
systems to ensure that we achieve this
objective. Our HR strategy is formulated
to achieve both corporate and employee
goals and is operationalised through
our Human Resource Department.
Our overall approach to managing our
human capital is illustrated on page 55.
103-2, 103-3GRI

55 Annual Report 2020
Union Assurance at a Glance Management Discussion and Analysis Stewardship Financial Statements Supplementary Information
Link to SDGs
• Continued with our training
initiatives through online platforms,
providing a total of 4,884 skills and
leadership training hours
• Supported our staff during the
pandemic with financial and non-
financial assistance programmes
including COVID Hotline and Work-
from-Home arrangements for all
employees.
• On-boarded a total of 296 new
employees to the team
• Agile work policy and work from
home modus of operandi to ensure
health and safety of our staff
• Conducted several events such as
virtual townhall meetings, virtual
annual awards and virtual employee
recognition event to strengthen
employee engagement
How we created value during the year
What we achieved during the year
NO. OF EMPLOYEES TRAINED
NO. OF EMPLOYEES WHO PARTICIPATED IN LEADERSHIP DEVELOPMENT PROGRAMMES
EMPLOYEE SATISFACTION SCORE
Recognised as a Great Place to work for the 8th Consecutive Year
GENDER PARITY
795
36
75%
M 52% : F 48%
Human Capital Management Process
HR Inputs Outputs Outcomes
• Comprehensive
Governance Structure
• Diverse Employee Base
• Extensive Skills and
Knowledge
• Robust HR Systems
HR Strategy
• Develop Knowledge and Skills
• Drive Innovation
• Ensure Employee Health and
Safety
• Increase Employee Engagement
• Reduce Attrition
• 8 average Training
Hours per Employee
• Total Payments to
Employees
Rs. 1,213 Mn
• 63% Retention
• Competent and Talented
Workforce
• Increased Employee
satisfaction and Engagement
• Increased Intellectual
Capital
Po
siti
ve T
rad
e-O
ffs
Neg
ati
ve T
rad
e-O
ffs
Investments in Human Capital will impact short term profitability
A more engaged and skilled workforce will improve customer relationships
Improved brand value
Capital Trade-Offs
Our recruitment policies ensure an unbiased selection process that ensures fairness to all candidates regardless of their gender, religion, nationality or age.

56 Union Assurance PLC
HUMAN CAPITAL
Human Capital Governance Structure The Human Resource Department
operates in three verticals as depicted in
following diagram. The General Manager
HR who heads the overall function reports
directly to the CEO.
CEO
General Manager
HR Life Cycle
Operations
Management
Talent
Development
and Employee
Engagement
Talent
Acquisition
and Resource
Planning
2019 2020
No. % No. %
By Employment Contract567 74 Permanent 578 73
197 26 Fixed Term Contract (FTC) 217 27
Employment by Gender370 48 Male 417 52
394 52 Female 378 48
New Hires by Gender131 37 Male 134 45
223 63 Female 162 55
Employment By Top Three Regions624 82 Western 401 50
30 4 Central 75 9
31 4 Southern 82 10
Employment By Age448 58 30 and Below 408 51
287 38 31 - 50 363 46
29 4 Above 50 24 3
354 46 New Recruits 296 37
138 24 Employee Turnover (Excluding FTC) 101 17
102-8, 103-1, 103-2, 401-1, 405-1GRI
Diverse Employee BaseOur team of 795 employees consist of
individuals from all parts of the country,
span across three generations and bring
with them a range of qualifications and
experience. 48% of our total workforce is
female; a clear indication of our ongoing
commitment to maintaining gender
diversity. Our agile work policy, flexible
working arrangements and attractive
employee value proposition continues to
attract and retain a younger demographic
which is indicative from the high
percentage of employees below the age
of 30.
Talent Attraction and Retention Talent acquisition is based on an ongoing
assessment of our talent requirements
and closely linked to our short-term and
long-term business strategies. We strive
to ensure the right person in the right job,
through a formalised recruitment process
that involves aptitude and psychometric
testing as well as structured interviews
based on a competency framework.
Despite the challenges posed by the
pandemic, we on-boarded a total of 296
new recruits during the year, by adopting
digital recruitment platforms.
Our recruitment policies ensure an
unbiased selection process that ensures
fairness to all candidates regardless of
their gender, religion, nationality or age.
Our employee value proposition enables
us to maintain a healthy retention rate.
Overall attrition rate was 17.47% while
the new hire attrition rate was 14.10%
excluding fixed term contract employees.
Talent Development We adopt a holistic approach to talent
development combining knowledge
development and leadership development
Our Team
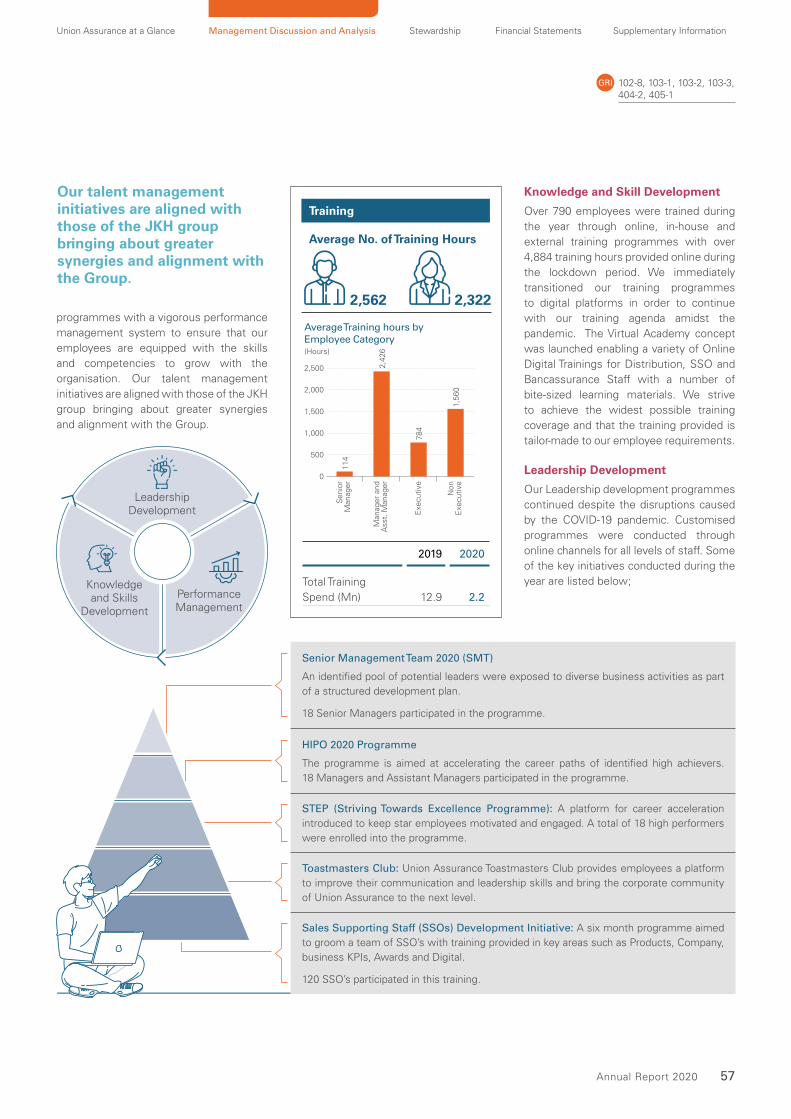
57 Annual Report 2020
Union Assurance at a Glance Management Discussion and Analysis Stewardship Financial Statements Supplementary Information
Leadership Development
Performance Management
Knowledge and Skills
Development
Training
Average No. of Training Hours
2,562 2,322
(Hours)
Senio
rM
anag
er
Man
ager
and
Ass
t. M
anag
er
Exe
cutive
Non
Exe
cutive
Average Training hours byEmployee Category
0
500
1,000
1,500
2,000
2,500
114
2,4
26
784
1,5
60
2019 2020
Total Training
Spend (Mn) 12.9 2.2
Knowledge and Skill Development
Over 790 employees were trained during
the year through online, in-house and
external training programmes with over
4,884 training hours provided online during
the lockdown period. We immediately
transitioned our training programmes
to digital platforms in order to continue
with our training agenda amidst the
pandemic. The Virtual Academy concept
was launched enabling a variety of Online
Digital Trainings for Distribution, SSO and
Bancassurance Staff with a number of
bite-sized learning materials. We strive
to achieve the widest possible training
coverage and that the training provided is
tailor-made to our employee requirements.
Leadership Development
Our Leadership development programmes
continued despite the disruptions caused
by the COVID-19 pandemic. Customised
programmes were conducted through
online channels for all levels of staff. Some
of the key initiatives conducted during the
year are listed below;
102-8, 103-1, 103-2, 103-3, 404-2, 405-1
GRI
Our talent management initiatives are aligned with those of the JKH group bringing about greater synergies and alignment with the Group.
programmes with a vigorous performance
management system to ensure that our
employees are equipped with the skills
and competencies to grow with the
organisation. Our talent management
initiatives are aligned with those of the JKH
group bringing about greater synergies
and alignment with the Group.
Senior Management Team 2020 (SMT)
An identified pool of potential leaders were exposed to diverse business activities as part
of a structured development plan.
18 Senior Managers participated in the programme.
HIPO 2020 Programme
The programme is aimed at accelerating the career paths of identified high achievers.
18 Managers and Assistant Managers participated in the programme.
STEP (Striving Towards Excellence Programme): A platform for career acceleration
introduced to keep star employees motivated and engaged. A total of 18 high performers
were enrolled into the programme.
Toastmasters Club: Union Assurance Toastmasters Club provides employees a platform
to improve their communication and leadership skills and bring the corporate community
of Union Assurance to the next level.
Sales Supporting Staff (SSOs) Development Initiative: A six month programme aimed
to groom a team of SSO’s with training provided in key areas such as Products, Company,
business KPIs, Awards and Digital.
120 SSO’s participated in this training.
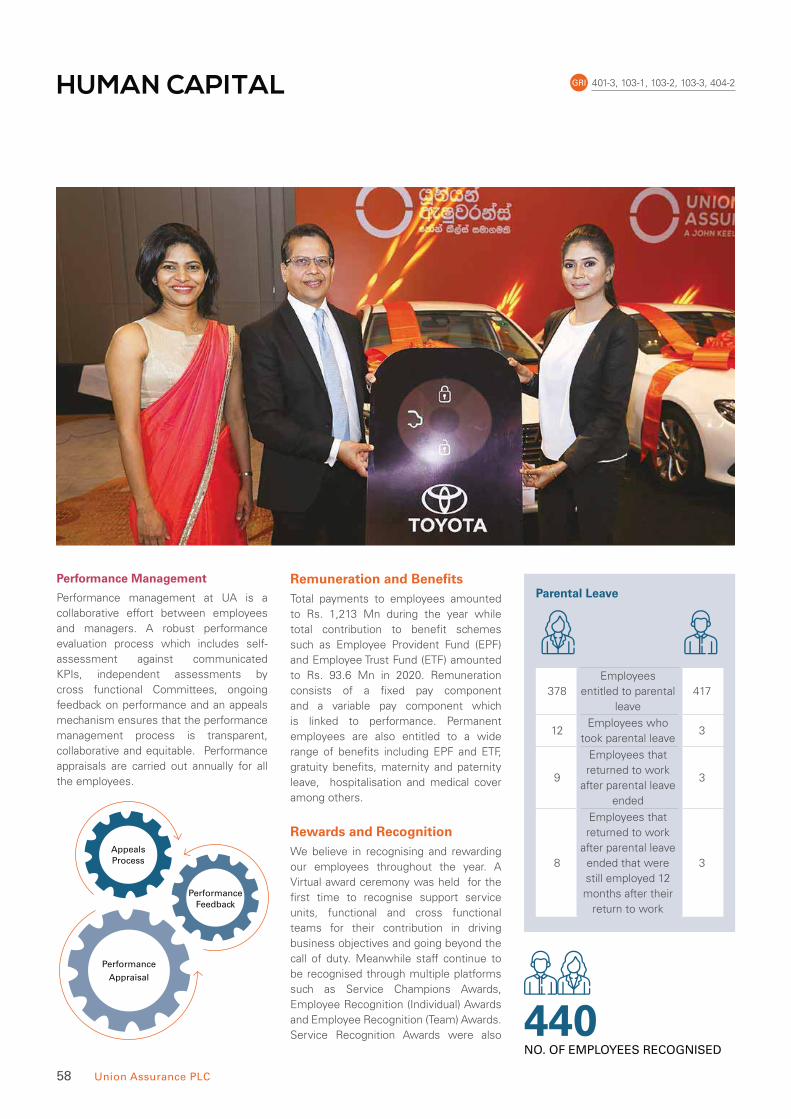
58 Union Assurance PLC
HUMAN CAPITAL
Performance Management
Performance management at UA is a
collaborative effort between employees
and managers. A robust performance
evaluation process which includes self-
assessment against communicated
KPIs, independent assessments by
cross functional Committees, ongoing
feedback on performance and an appeals
mechanism ensures that the performance
management process is transparent,
collaborative and equitable. Performance
appraisals are carried out annually for all
the employees.
Remuneration and Benefits Total payments to employees amounted
to Rs. 1,213 Mn during the year while
total contribution to benefit schemes
such as Employee Provident Fund (EPF)
and Employee Trust Fund (ETF) amounted
to Rs. 93.6 Mn in 2020. Remuneration
consists of a fixed pay component
and a variable pay component which
is linked to performance. Permanent
employees are also entitled to a wide
range of benefits including EPF and ETF,
gratuity benefits, maternity and paternity
leave, hospitalisation and medical cover
among others.
Rewards and Recognition We believe in recognising and rewarding
our employees throughout the year. A
Virtual award ceremony was held for the
first time to recognise support service
units, functional and cross functional
teams for their contribution in driving
business objectives and going beyond the
call of duty. Meanwhile staff continue to
be recognised through multiple platforms
such as Service Champions Awards,
Employee Recognition (Individual) Awards
and Employee Recognition (Team) Awards.
Service Recognition Awards were also
Appeals Process
Performance
Appraisal
Performance Feedback
Parental Leave
378
Employees
entitled to parental
leave
417
12Employees who
took parental leave3
9
Employees that
returned to work
after parental leave
ended
3
8
Employees that
returned to work
after parental leave
ended that were
still employed 12
months after their
return to work
3
NO. OF EMPLOYEES RECOGNISED
440
401-3, 103-1, 103-2, 103-3, 404-2GRI

59 Annual Report 2020
Union Assurance at a Glance Management Discussion and Analysis Stewardship Financial Statements Supplementary Information
offered to recognise staff who have
served the organisation for 5,10,15, 20, 25
and above years.
Employee Engagement We encourage employee engagement
through open communication channels,
team building activities, an unbiased
grievance management process and a
strong Whistle Blowing Policy.
Employee Engagement At UA
Open Communication
Unbiased Grievance Management
Whistle Blowing Policy
Team Building Activities
Open Communication
Maintaining constant dialogue with our
employees throughout the lock-down
period was a key priority; and we leveraged
virtual mediums to continue to engage
with our employees during this period.
“Connect with CEO” sessions and Town
Hall meetings continued through online
channels while meetings were conducted
regularly through MS teams.
Unbiased Grievance Management
Our grievance handling process ensures
that employees who are aggrieved by
alleged unfair, unjust or inequitable
practices can seek redress without
prejudice to the complainant. In addition to
having documented procedures, we have
also implemented and online grievance
handling system in order to maintain
anonymity. There were no recorded
incidents of discrimination, unfair treatment
or sexual discrimination during the year.
Whistle Blowing Policy
A comprehensive Whistle Blowing
Policy provides a formal procedure
for employees to report instances of
corruption, illegal activities, or other
wrong doing. The Whistle Blowing Policy
is reviewed routinely and communicated
to all employees to empower any worker
to raise issues with the Management, to
recognise and resolve issues in a mutually
acceptable manner.
Team Building Activities
Although many of our activities were put
on hold due to the pandemic, we carried
out several online team building activities
such as a Christmas carols competition
and Avurudu event during the year.
Caring for Our Employees Ensuring the safety and wellbeing of
our employees during the pandemic
was one of the key priorities during the
year. As a strong advocate of work-life
balance and gender parity, we had already
implemented a system of flexi hours
and working from home options on a
need basis. As the COVID-19 pandemic
unfolded we expanded the working
from home option to all employees. We
also introduced a COVID hotline for staff
members to reach out to in the event they
needed support. As part of our proactive
efforts to minimise the spread of the
COVID-19 virus among our staff, the WOP
(Work on Premise) e-form was launched to
be filled and submitted prior to reporting to
UA Head office premises.
Meanwhile we put in place strict health and
safety guidelines and implemented social
distancing, disinfecting and temperature
checking procedures at all our locations.
The Company has taken necessary action
to distribute daily essentials to affected
staff and re-imburse expenses for PCR or
Antigen tests if required.
Apart form the COVID-19 specific initiatives,
we have in place a comprehensive
Employee Health and Safety Policy which
provides employees and their dependents
medical insurance cover and free access
to the My Doctor App. We also ensure
that all our locations are accident free
spaces with necessary warning signage.
There were no significant injuries at the
workplace during the year.
Gender Parity Union Assurance initiated its Diversity &
Inclusion agenda in support of the JKH
Group gender parity target with a goal
to achieve 50% women in the workforce
by 2025. The Company established a
Committee to coordinate and report on
sector initiatives, and communicated non-
discrimination and D&I initiatives through
the Zero Tolerance awareness campaign
and online workshops.
103-1, 103-2, 103-3, 402-1, 103-1, 103-2, 103-3, 403-1, 405-2
GRI

60 Union Assurance PLC
SOCIAL AND RELATIONSHIP CAPITAL
POLICYHOLDERS
BANCASSURANCE PARTNERS
NO. OF VENDORS
AGENCY FORCE
REINSURANCE PARTNERS
250,000+
5
1,529
3,384
4
We continued to support our customers, business partners and communities ride the COVID-19 wave by pro-actively anticipating their needs and offering innovative solutions. This has further strengthened and deepened these relationships.
Our Social and Relationship Capital
Future Focus
• Strengthen digital value proposition to improve customer satisfaction and
premium persistency
• Create win-win partnerships with business partners
• Empower communities through CSR activities
Management Approach
Our relationships with our customers,
business partners and community are
an integral part of our success story as
they foster trust and confidence in our
brand. We are committed to naturing
these relationships by creating mutually
beneficial partnerships that generate
long term value.
103-1, 103-2, 103-3GRI

61 Annual Report 2020
Union Assurance at a Glance Management Discussion and Analysis Stewardship Financial Statements Supplementary Information
Link to SDGs
• Strengthened our digital value
proposition to improve customer
convenience amidst the pandemic
• Expanded our product offering with
5 new products
• Invested Rs. 13 Mn in CSR initiatives
in the health and education spaces
• Rs. 4 Mn allocated for COVID-19
Relief and awareness efforts
• Implemented end-to-end automated
payment process to ensure prompt
payment to business partners
• Negotiated highest non medical
limits in industry with reinsurers
How we created value during the year
What we achieved during the year
CLAIM PAYMENTS DURING THE YEAR
PREMIUM PERSISTENCY
INDUSTRY LARGEST MDRT TALENT POOL
LIVES TOUCHED THROUGH CSR ACTIVITIES
INDIVIDUALS FAMILIES
Rs. 3.8 Bn
83%
172
825 2,000
Po
siti
ve
Tra
de
-Off
s
Neg
ati
ve
Tra
de
-Off
s
Short term financial impact of higher investments in infrastructure, training and CSR
Stronger Relationships
Improved Brand Value
Business Growth
Efficiency Gains
Capital Trade-Offs
INPUTS OUTCOMESMANAGEMENT FOCUS
Customer
Relationships
Business
Partner
Relationships
Community Relationships
• Enhanced customer
satisfaction and loyalty
• Resilience amidst pandemic
• Increased brand equity
• Improved financial
performance
• Responsible corporate
behaviour
Superior Customer Service
Understanding Customer Needs to Offer Relevant Products
Customer Convenience
Supplier/Business Partner Engagement
Strategic Fit
Enhancing Sourcing Efficiency
Community Health Awareness
Providing Educational Opportunities for Under Privileged
103-1, 103-2, 103-3GRI
In order to provide customers with quick and easy access to customer support, we established a dedicated tri-lingual 24/7 Customer Service Unit.

62 Union Assurance PLC
SOCIAL AND RELATIONSHIP CAPITAL
Customers Our customers span the length and
breadth of Sri Lanka and consist of over
250,000 individual, corporate and loan
customers. We have built a customer
value proposition around making relevant
products accessible in a convenient
manner and strive hard to continue to
enhance this value proposition.
Responding to Customer Needs during the Pandemic
Providing our customers safe and
convenient ways to fulfill their protection
requirements with minimal disruption
was our main focus amidst the turmoil
caused by the pandemic. We rapidly
transitioned to a digital operating model
complete with efficient digital payment
platforms, an online claim submission
system and facilities for online document
submission. We also offered a Cashless
Claim Facility for hospitalisations during
the lockdown period. Meanwhile solutions
such as Clicklife and Clicklife App enabled
customers to easily carry out transactions
from the safety of their homes.
In order to provide customers quick and easy
access to customer support, we established
a dedicated tri-lingual 24/7 Customer Service
Unit. We also enabled a chat box option on
our website with two dedicated agents for
live chats while leveraging WhatsApp to
engage with our customers on a regular
basis ensuring customer privacy.
Supporting our customers also involved
pro-actively reaching out to them. We
implemented a comprehensive customer
outreach programme with Zonal and
Regional managers reaching out to our
entire customer base to understand their
requirements during the lockdown period
and offer support with premium payments
and renewals.
As part of our efforts to support our
customers through the crisis we introduced
a free COVID-19 cover for both existing and
new customers with a free death cover
up to a maximum of Rs. 1 million per
policyholder. This was a first in the market.
We were also the first life insurance
Company to offer hospital cash benefits for
quarantine treatments and hospitalisation.
Apart from this we took every precaution to
ensure that our premises complied with all
safety protocols. Safety precautions such
as socially distanced seating, protective
separators at counters, regular disinfecting
of buildings and temperature checks were
implemented at all our locations.
2020 2019
Corporate website visits 534,084 127,579
Facebook likes 164,400 161,930
Instagram followers 1,500 581
Youtube subscribers 2,280 1,300
Linkedin followers 5,524 2,665
A New Promise to Our Customers
During the year we embarked on a
rebranding initiative aimed at re-positioning
ourselves as a new-age, customer-centric,
digital life insurer that truly understands our
customer’s aspirations. The repositioning
comes with the understanding that our
customers are aspirational, tech savvy
and have evolving requirements. Our new
purpose is therefore a promise to our
customers to offer innovative, relevant
products that help fulfil their evolving
aspirations in the most convenient and
seamless manner.
Growing our Portfolio of Products
Our extensive product portfolio aims to
meet the evolving needs and aspirations
of a new age customer. We continue
to review our product portfolio to stay
relevant and introduced several innovative
products during the year. (Please refer
page 70 on Intellectual Capital for list of
new products introduced during the year).
We were the first Life Insurance Company to offer hospital cash benefits for quarantine treatments and hospitalisation.
103-1, 103-2, 103-3GRI
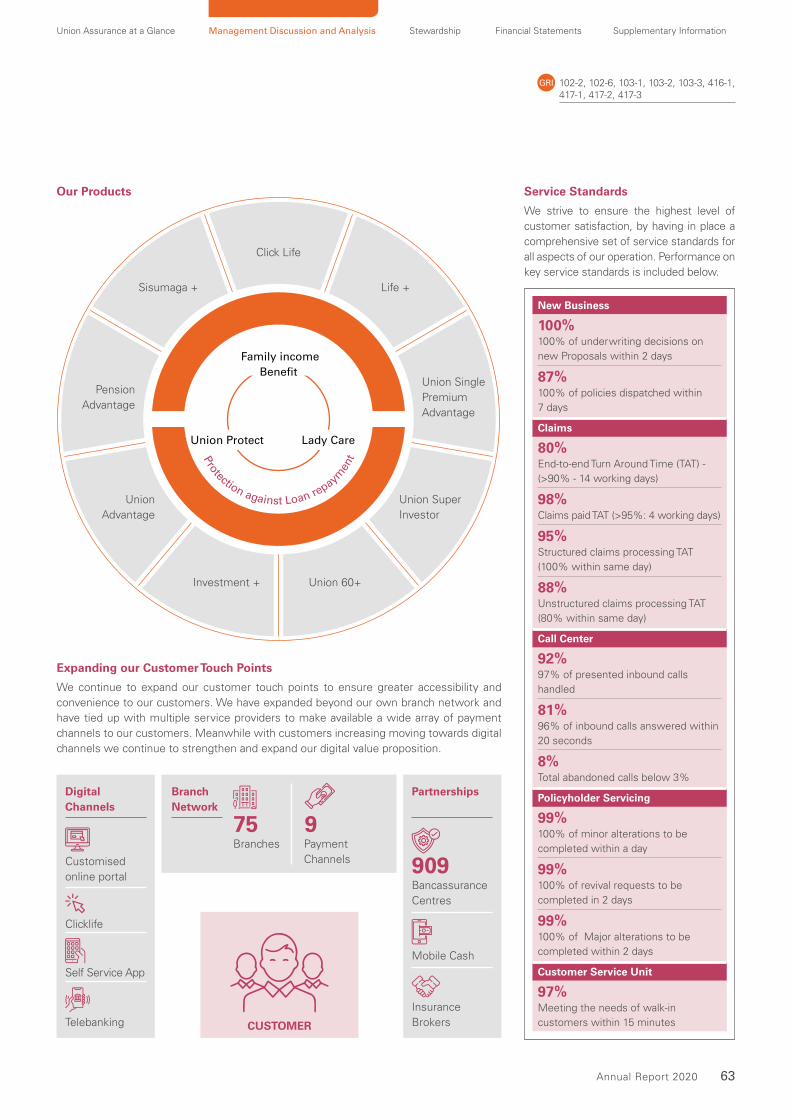
63 Annual Report 2020
Our Products
Family income
Benefit
Lady CareUnion Protect
Protection against Loan repaym
ent
Life +Sisumaga +
Click Life
Union Single
Premium
Advantage
Pension
Advantage
Union Super
Investor
Union
Advantage
Union 60+Investment +
Expanding our Customer Touch Points
We continue to expand our customer touch points to ensure greater accessibility and
convenience to our customers. We have expanded beyond our own branch network and
have tied up with multiple service providers to make available a wide array of payment
channels to our customers. Meanwhile with customers increasing moving towards digital
channels we continue to strengthen and expand our digital value proposition.
CUSTOMER
Digital Channels
Partnerships Branch Network
Customised
online portal
Branches Payment
Channels
75
Bancassurance
Centres
909
9
Clicklife
Self Service App
Mobile Cash
Telebanking
Insurance
Brokers
Service Standards
We strive to ensure the highest level of
customer satisfaction, by having in place a
comprehensive set of service standards for
all aspects of our operation. Performance on
key service standards is included below.
New Business
100%100% of underwriting decisions on
new Proposals within 2 days
87%100% of policies dispatched within
7 days
Claims
80%End-to-end Turn Around Time (TAT) -
(>90% - 14 working days)
98%Claims paid TAT (>95%: 4 working days)
95%Structured claims processing TAT
(100% within same day)
88%Unstructured claims processing TAT
(80% within same day)
Call Center
92%97% of presented inbound calls
handled
81%96% of inbound calls answered within
20 seconds
8%Total abandoned calls below 3%
Policyholder Servicing
99%100% of minor alterations to be
completed within a day
99%100% of revival requests to be
completed in 2 days
99%100% of Major alterations to be
completed within 2 days
Customer Service Unit
97%Meeting the needs of walk-in
customers within 15 minutes
Union Assurance at a Glance Management Discussion and Analysis Stewardship Financial Statements Supplementary Information
102-2, 102-6, 103-1, 103-2, 103-3, 416-1, 417-1, 417-2, 417-3
GRI

64 Union Assurance PLC
Complaint Management
Pro-actively identifying and addressing customer complaints is an important aspect of
ensuring customer satisfaction. We have in place a fully-fledged Complaint Management
System to ensure all complaints are resolved speedily and efficiently. Multiple channels
including a dedicated customer service hotline and e-mail are available in addition to
customers being able to lodge complaints in writing or verbally at any of our branch
locations. Feedback received is uploaded to an online customer feedback system (CFS)
and reviewed weekly by the CFS Committee consisting of Senior Management.
Access to Product/Claim Information
Product details are available in an easy
to understand manner on our corporate
website together with tools for inquiries
and feedback. In instances where claims
are repudiated the Company clearly
states the reasons for the repudiation
and informs the customer in writing. If
the customer does not agree with the
decision, he/she has the option of referring
the case to the Insurance Ombudsman or
the Insurance Regulatory Commission
of Sri Lanka. Additionally, our marketing
activities also focuses on the highest
level of transparency and professionalism.
We adhere to the Group policy on
voluntary standards on advertising. We
have given due regards to the aspects
of customer privacy as our business
involves gathering considerable amounts
of customer sensitive data. We have
implemented several measures to ensure
the confidentiality of this data. There have
been no instances of non-compliance
concerning product information, marketing
communications or customer privacy.
COMPLAINTS RECEIVED
COMPLAINTS RESOLVED
Incidents of non-compliance
concerning product and service
information and labelling
- None
VendorsReinsurance
Partners Agency Force
Bancassurance Partners
Regulators and Other Member
Firms
Service Providers
Incidents of non-compliance
concerning marketing communications
- None
Substantiated complaints
concerning breaches of customer
privacy and losses of customer data
- None
RESOLVE RATE
301
29397%
Complaint Management in 2020
Value Derived
Business Partners Our business partners consist of a wide
network of strategic partners and service
providers that support our value chain.
We continue to derive value from these
relationships by fostering sustainable
relationships that are based on mutual
trust and respect.
Value to Us Rs. Mn Value to our Partners Rs. Mn
Value derived from
the Bancassurance
Partnerships
52 MDRTs
FYP – 697
Payments to local
suppliers
2,801
Value derived from
Agency Force
120 MDRT
FYP – 838
Payments to foreign
suppliers
455
Value derived from
Reinsurers
Claims
recoveries
302
Premium ceded to
reinsurers
589
103-1, 103-2, 103-3GRISOCIAL AND RELATIONSHIP CAPITAL
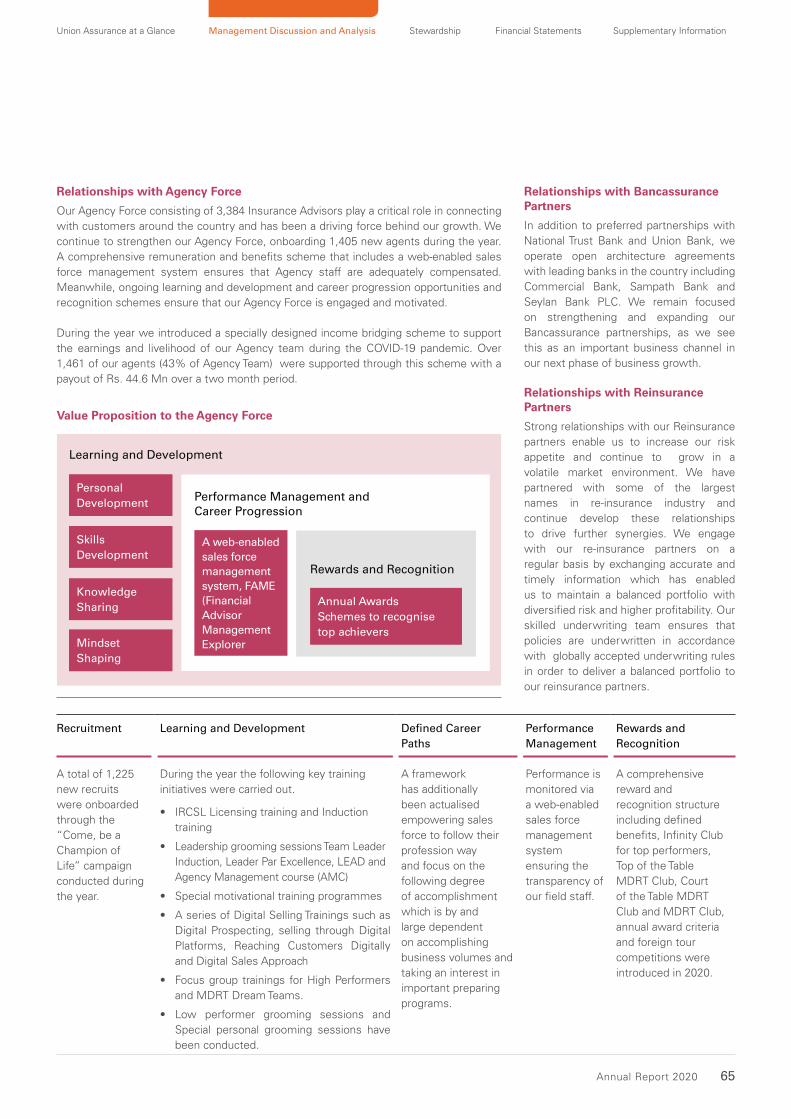
65 Annual Report 2020
Relationships with Agency Force
Our Agency Force consisting of 3,384 Insurance Advisors play a critical role in connecting
with customers around the country and has been a driving force behind our growth. We
continue to strengthen our Agency Force, onboarding 1,405 new agents during the year.
A comprehensive remuneration and benefits scheme that includes a web-enabled sales
force management system ensures that Agency staff are adequately compensated.
Meanwhile, ongoing learning and development and career progression opportunities and
recognition schemes ensure that our Agency Force is engaged and motivated.
During the year we introduced a specially designed income bridging scheme to support
the earnings and livelihood of our Agency team during the COVID-19 pandemic. Over
1,461 of our agents (43% of Agency Team) were supported through this scheme with a
payout of Rs. 44.6 Mn over a two month period.
Value Proposition to the Agency Force
Annual Awards
Schemes to recognise
top achievers
Rewards and Recognition
Performance Management and Career Progression
Learning and Development
A web-enabled sales force management system, FAME (Financial Advisor Management Explorer
Personal
Development
Skills
Development
Knowledge
Sharing
Mindset
Shaping
Relationships with Bancassurance Partners
In addition to preferred partnerships with
National Trust Bank and Union Bank, we
operate open architecture agreements
with leading banks in the country including
Commercial Bank, Sampath Bank and
Seylan Bank PLC. We remain focused
on strengthening and expanding our
Bancassurance partnerships, as we see
this as an important business channel in
our next phase of business growth.
Relationships with Reinsurance Partners
Strong relationships with our Reinsurance
partners enable us to increase our risk
appetite and continue to grow in a
volatile market environment. We have
partnered with some of the largest
names in re-insurance industry and
continue develop these relationships
to drive further synergies. We engage
with our re-insurance partners on a
regular basis by exchanging accurate and
timely information which has enabled
us to maintain a balanced portfolio with
diversified risk and higher profitability. Our
skilled underwriting team ensures that
policies are underwritten in accordance
with globally accepted underwriting rules
in order to deliver a balanced portfolio to
our reinsurance partners.
Union Assurance at a Glance Management Discussion and Analysis Stewardship Financial Statements Supplementary Information
Recruitment Learning and Development Defined Career
Paths
Performance
Management
Rewards and
Recognition
A total of 1,225
new recruits
were onboarded
through the
“Come, be a
Champion of
Life” campaign
conducted during
the year.
During the year the following key training
initiatives were carried out.
• IRCSL Licensing training and Induction
training
• Leadership grooming sessions Team Leader
Induction, Leader Par Excellence, LEAD and
Agency Management course (AMC)
• Special motivational training programmes
• A series of Digital Selling Trainings such as
Digital Prospecting, selling through Digital
Platforms, Reaching Customers Digitally
and Digital Sales Approach
• Focus group trainings for High Performers
and MDRT Dream Teams.
• Low performer grooming sessions and
Special personal grooming sessions have
been conducted.
A framework
has additionally
been actualised
empowering sales
force to follow their
profession way
and focus on the
following degree
of accomplishment
which is by and
large dependent
on accomplishing
business volumes and
taking an interest in
important preparing
programs.
Performance is
monitored via
a web-enabled
sales force
management
system
ensuring the
transparency of
our field staff.
A comprehensive
reward and
recognition structure
including defined
benefits, Infinity Club
for top performers,
Top of the Table
MDRT Club, Court
of the Table MDRT
Club and MDRT Club,
annual award criteria
and foreign tour
competitions were
introduced in 2020.
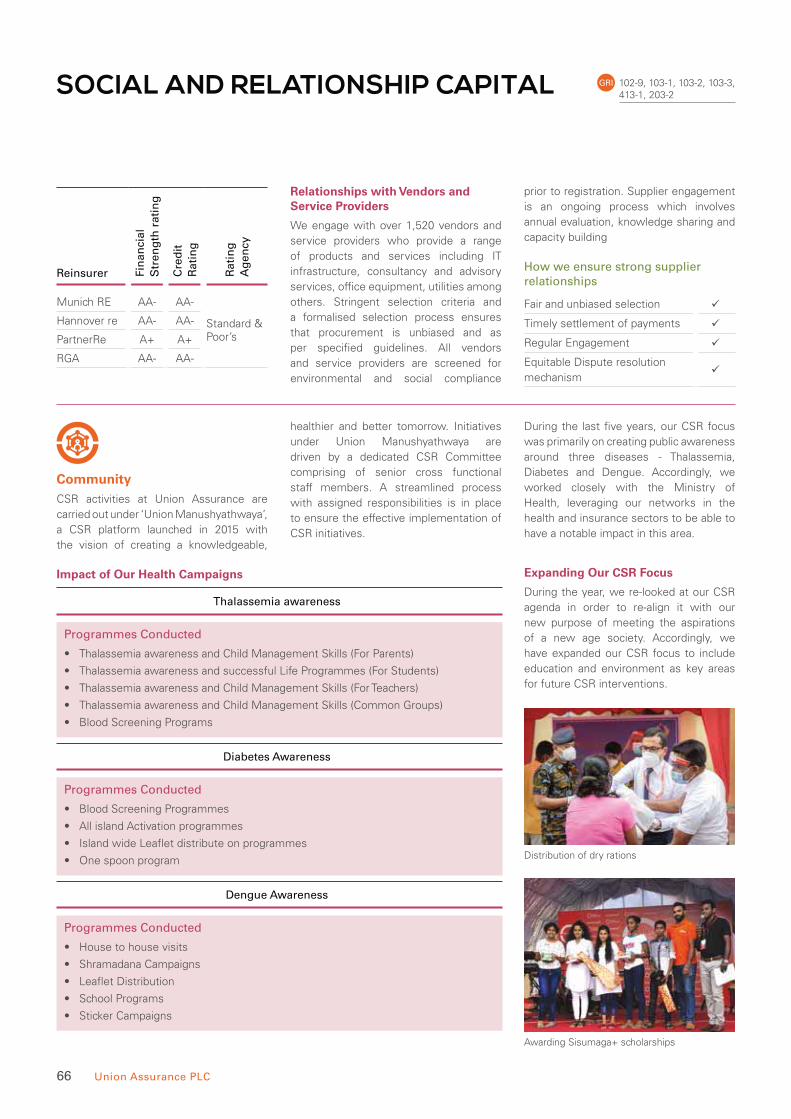
66 Union Assurance PLC
Expanding Our CSR Focus
During the year, we re-looked at our CSR
agenda in order to re-align it with our
new purpose of meeting the aspirations
of a new age society. Accordingly, we
have expanded our CSR focus to include
education and environment as key areas
for future CSR interventions.
Reinsurer Fin
an
cia
l S
tre
ng
th r
ati
ng
Cre
dit
R
ati
ng
Ra
tin
g
Ag
en
cy
Munich RE AA- AA-
Standard & Poor’s
Hannover re AA- AA-
PartnerRe A+ A+
RGA AA- AA-
Relationships with Vendors and Service Providers
We engage with over 1,520 vendors and
service providers who provide a range
of products and services including IT
infrastructure, consultancy and advisory
services, office equipment, utilities among
others. Stringent selection criteria and
a formalised selection process ensures
that procurement is unbiased and as
per specified guidelines. All vendors
and service providers are screened for
environmental and social compliance
prior to registration. Supplier engagement
is an ongoing process which involves
annual evaluation, knowledge sharing and
capacity building
How we ensure strong supplier relationships
Fair and unbiased selection
Timely settlement of payments
Regular Engagement
Equitable Dispute resolution
mechanism
Community CSR activities at Union Assurance are
carried out under ‘Union Manushyathwaya’,
a CSR platform launched in 2015 with
the vision of creating a knowledgeable,
healthier and better tomorrow. Initiatives
under Union Manushyathwaya are
driven by a dedicated CSR Committee
comprising of senior cross functional
staff members. A streamlined process
with assigned responsibilities is in place
to ensure the effective implementation of
CSR initiatives.
During the last five years, our CSR focus
was primarily on creating public awareness
around three diseases - Thalassemia,
Diabetes and Dengue. Accordingly, we
worked closely with the Ministry of
Health, leveraging our networks in the
health and insurance sectors to be able to
have a notable impact in this area.
Impact of Our Health Campaigns
Thalassemia awareness
Programmes Conducted
• Thalassemia awareness and Child Management Skills (For Parents)
• Thalassemia awareness and successful Life Programmes (For Students)
• Thalassemia awareness and Child Management Skills (For Teachers)
• Thalassemia awareness and Child Management Skills (Common Groups)
• Blood Screening Programs
Diabetes Awareness
Programmes Conducted
• Blood Screening Programmes
• All island Activation programmes
• Island wide Leaflet distribute on programmes
• One spoon program
Dengue Awareness
Programmes Conducted
• House to house visits
• Shramadana Campaigns
• Leaflet Distribution
• School Programs
• Sticker Campaigns
102-9, 103-1, 103-2, 103-3, 413-1, 203-2
GRISOCIAL AND RELATIONSHIP CAPITAL
Distribution of dry rations
Awarding Sisumaga+ scholarships

67 Annual Report 2020
Union Assurance at a Glance Management Discussion and Analysis Stewardship Financial Statements Supplementary Information
Edu
catio
n
To p
rovi
de e
duca
tiona
l opp
ortu
nities f
or those in
need t
o e
nhan
ce t
heir
futu
re e
mployability
and e
ntre
pren
eu
rship H
ealth
To foster healthy comm
unities that e
nhan
ce th
e
wellbeing and productivity of Sri L
ankan
s
Environmentpromote environmental sustainability
To minimise the impact of our operations a
nd
Refer Natural Capital from pages 50 to 53
Educational support to 170 children from SOS Children’s
villages in Mahiyanganaya and Nuwara Eliya.
Offered Sisumaga+ scholarships to 5 underprivileged
students of the Ceylon School for the Deaf & Blind.
Continuation of Diabetes Awareness Campaign in
collaboration with Ministry of Health.
COVID-19 Relief
Co-branded a COVID-19 awareness campaign with the
Ministry of Health.
Through an employee funded project provided essential
food items to 2,000 affected by the lockdown.
Collaborated with the GMOA to distribute 650 packages
of dry rations to deserving orphanages in Sri Lanka.
Tied up with o-Doc to provide telemedicine services and
pharmacy delivery during the lockdown.
102-13, 203-2, 103-1, 103-2, 103-3, 203-1
GRI
Relationships Maintained by the Regulator and Other Member Companies
We actively participate in the following
public institutions and chambers to assist
in developing policies for the interest of
the industry;
• Insurance Regulatory Commission of
Sri Lanka
• Insurance Association of Sri Lanka
• The Ceylon Chamber of Commerce.
• Employers Federation of Ceylon
• LIMRA (Life Insurance and Market
Research Association)
(Rs. Mn)
2016 2017 2018 2019 2020
Total CSR Spend
0
5
10
15
20
8.7
12.6
16.8
6.4
12.9

68 Union Assurance PLC
INTELLECTUAL CAPITAL
COLLECTIVE KNOWLEDGE OF OVER
570 Employees
Our ability to rapidly adapt and respond to the unprecedented challenges brought about by the COVID-19 pandemic was largely due to the robustness of our systems and processes, the innovative spirit of our people and the strength of our Brand.
Our Intellectual Capital Resources
DIGITAL INSURANCE PLATFORMS
Future Focus
• Drive digital transformation in all aspects of our operation by continuing to invest
in cutting edge technology.
• Nurture a culture of innovation through training and employee empowerment.
• Continue to strengthen our brand equity
Management Approach
We consider our Intellectual Capital
consisting of our brand equity, systems
and processes, innovative products and
collective knowledge as the building
blocks of new our growth trajectory.
We therefore strive hard to nurture the
different elements of our Intellectual
Capital to sustain our competitive
advantage and move forward.
BRAND RELAUNCH

69 Annual Report 2020
Link to SDGs
• Rapidly transitioned to a digital
operating model which included
remote working for employees
and Digital Insurance Platforms for
customers.
• Relaunched our Brand to be
attractive to a new generation of
customers.
• Introduced innovative products
to suit emerging requirements of
consumers
• Continued focus on skill upliftment,
knowledge sharing and mentoring
through online channels
How we created value during the year
What we achieved during the year
STEADY BUSINESS CONTINUITY AMIDST THE PANDEMIC
NO. OF NEW PRODUCTS LAUNCHED
GROWTH IN DIGITAL PAYMENTS
5
100%
Brand Innovative
Insurance
Solutions
Collective
Knowledge
of
Employees
Robust
Systems
and
Processes
Po
siti
ve T
rad
e-O
ffs
Neg
ati
ve T
rad
e-O
ffs
Investments in IT and brand building initiatives require large capital outlays in the short run
Improves efficiency and customer satisfaction levels
Helps strengthen market position
Fosters a more engaged, empowered team
Capital Trade-Offs
Robust Systems and Processes Our robust systems and processes
enabled us to rapidly activate our
Business Continuity Plan in the wake of
the COVID-19 pandemic. High quality IT
infrastructure supported the immediate
roll-out of remote working arrangements
for our entire workforce while flexible
systems and processes enabled us to
continue to carry on business as usual
with minimal disruptions to customers and
employees.
The post COVID-19 new normal is re-
shaping the way we do business, requiring
more digitisation of all aspects of our
operation. In response, we continued to
invest in our digital infrastructure during
the year, further enhancing our digital value
proposition. We invested in our digital
servicing capabilities with the launch of a
Digital Insurance Platform, Insurance Self
Care App and Bionic Agency and Omni
Channel Model.
Union Assurance at a Glance Management Discussion and Analysis Stewardship Financial Statements Supplementary Information
Undistruptive
Business
Continuity
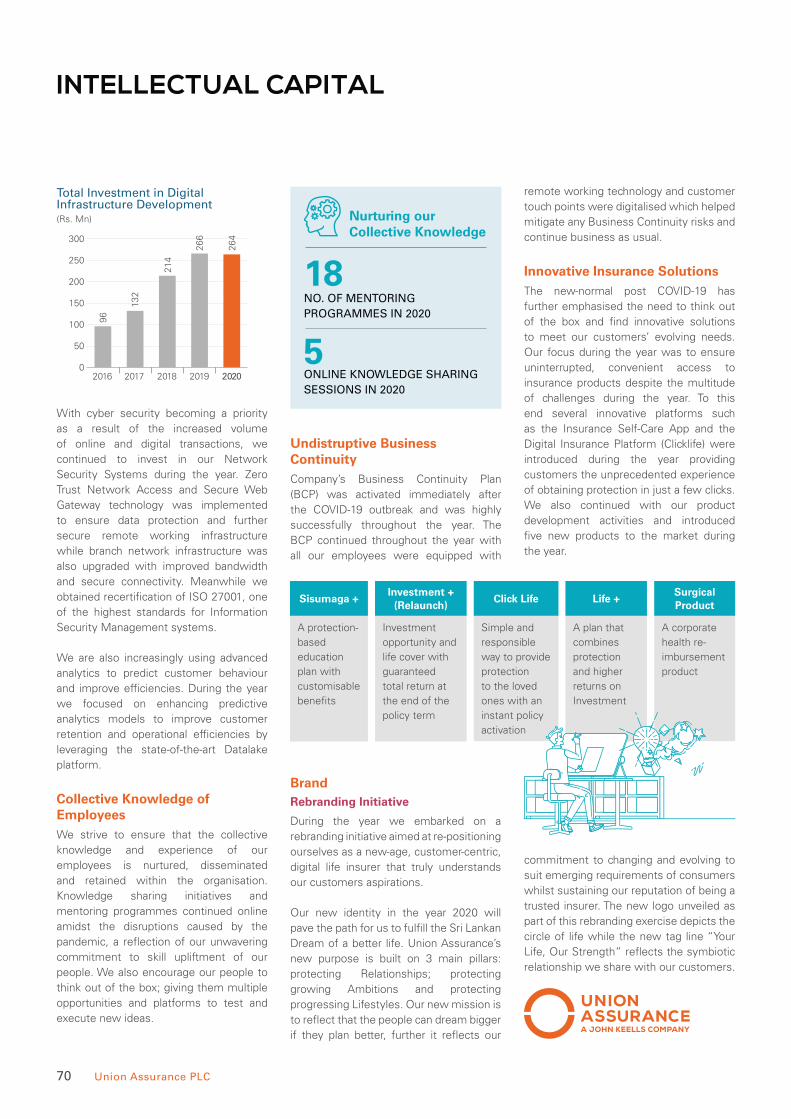
70 Union Assurance PLC
INTELLECTUAL CAPITAL
With cyber security becoming a priority
as a result of the increased volume
of online and digital transactions, we
continued to invest in our Network
Security Systems during the year. Zero
Trust Network Access and Secure Web
Gateway technology was implemented
to ensure data protection and further
secure remote working infrastructure
while branch network infrastructure was
also upgraded with improved bandwidth
and secure connectivity. Meanwhile we
obtained recertification of ISO 27001, one
of the highest standards for Information
Security Management systems.
We are also increasingly using advanced
analytics to predict customer behaviour
and improve efficiencies. During the year
we focused on enhancing predictive
analytics models to improve customer
retention and operational efficiencies by
leveraging the state-of-the-art Datalake
platform.
Collective Knowledge of Employees We strive to ensure that the collective
knowledge and experience of our
employees is nurtured, disseminated
and retained within the organisation.
Knowledge sharing initiatives and
mentoring programmes continued online
amidst the disruptions caused by the
pandemic, a reflection of our unwavering
commitment to skill upliftment of our
people. We also encourage our people to
think out of the box; giving them multiple
opportunities and platforms to test and
execute new ideas.
NO. OF MENTORING
PROGRAMMES IN 2020
ONLINE KNOWLEDGE SHARING
SESSIONS IN 2020
18
5
Nurturing our Collective Knowledge
Undistruptive Business ContinuityCompany’s Business Continuity Plan
(BCP) was activated immediately after
the COVID-19 outbreak and was highly
successfully throughout the year. The
BCP continued throughout the year with
all our employees were equipped with
Sisumaga +Investment +
(Relaunch)Life +
Surgical Product
A protection-
based
education
plan with
customisable
benefits
Investment
opportunity and
life cover with
guaranteed
total return at
the end of the
policy term
A plan that
combines
protection
and higher
returns on
Investment
A corporate
health re-
imbursement
product
BrandRebranding Initiative
During the year we embarked on a
rebranding initiative aimed at re-positioning
ourselves as a new-age, customer-centric,
digital life insurer that truly understands
our customers aspirations.
Our new identity in the year 2020 will
pave the path for us to fulfill the Sri Lankan
Dream of a better life. Union Assurance’s
new purpose is built on 3 main pillars:
protecting Relationships; protecting
growing Ambitions and protecting
progressing Lifestyles. Our new mission is
to reflect that the people can dream bigger
if they plan better, further it reflects our
commitment to changing and evolving to
suit emerging requirements of consumers
whilst sustaining our reputation of being a
trusted insurer. The new logo unveiled as
part of this rebranding exercise depicts the
circle of life while the new tag line “Your
Life, Our Strength” reflects the symbiotic
relationship we share with our customers.
(Rs. Mn)
2016 2017 2018 2019 2020
Total Investment in DigitalInfrastructure Development
0
50
100
150
200
250
3002
64
26
6
21
4
13
2
96
remote working technology and customer
touch points were digitalised which helped
mitigate any Business Continuity risks and
continue business as usual.
Innovative Insurance Solutions The new-normal post COVID-19 has
further emphasised the need to think out
of the box and find innovative solutions
to meet our customers’ evolving needs.
Our focus during the year was to ensure
uninterrupted, convenient access to
insurance products despite the multitude
of challenges during the year. To this
end several innovative platforms such
as the Insurance Self-Care App and the
Digital Insurance Platform (Clicklife) were
introduced during the year providing
customers the unprecedented experience
of obtaining protection in just a few clicks.
We also continued with our product
development activities and introduced
five new products to the market during
the year.
Click Life
Simple and
responsible
way to provide
protection
to the loved
ones with an
instant policy
activation

71 Annual Report 2020
Recognition We continue to be recognised for our contribution to the Insurance sector in Sri Lanka and were proud recipients of several awards and
accolades during the year. Key awards received during the year are listed below.
LMD’s Inaugural Most Awarded Ranking
Union Assurance was adjudged
Insurance Sector winner in the
inaugural ranking of “LMD’s Most
Awarded”.
Celent Model Insurer Award
‘Project Electric’ launched to
transform our legacy system to a new
future proof platform was recognised
by Global Research and advisory firm
Celent.
Million Dollar Round Table Achievers in Life Insurance Industry
Union Assurance made history with
an all new record of 172 Million Dollar
Round Table qualifiers to achieve No.
1 position in Sri Lanka.
CMA Excellence in Integrated Reporting 2020
Our 2019 Annual Report was ranked
among top 20 Annual Reports for
the year.
Chairman’s Award for Disruptive Innovation
Union Assurance won the Group
Chairman’s Award for disruptive
innovation for the DTA system.
Sri Lanka Leadership Awards 2020
Union Assurance was awarded
Best Brand, Sustainable Marketing
Excellence and the Best Employer
Brand at the CMO Global/CMO Asia
and the World HRD Congress.
CEO of the Year 2020
Mr Jude Gomes was selected as
the CEO of the year by the CEO
monthly.
Three Awards at Insurance Asia Award 2020
Union Assurance won awards for
Domestic Life Insurer of the Year,
New Insurance Product of the Year,
and Digital Insurance Initiative of the
Year. We were the only Sri Lankan
Life insurer to be recognised at the
prestigious awards.
Great Place to Work
Union Assurance was awarded with
the “great place to work” title for
the 8th consecutive time.
Union Assurance at a Glance Management Discussion and Analysis Stewardship Financial Statements Supplementary Information

72 Union Assurance PLC
OUTLOOK
Overall Outlook
The global roll out of the vaccination programme and efforts by individual governments to
provide fiscal stimulus are expected to support the global recovery with the IMF estimating
a global growth of 5.5% in 2021. Global trade too is expected to recover and grow by 8%
while service trade will recover at a slower pace due to subdued tourism and business travel.
The pace of the recovery however is likely to vary across countries depending on access to
medical interventions, effectiveness of policy support, exposure to cross-country spillovers, and
structural characteristics entering the crisis. The IMF projects the advance economies to grow by
4.3% while emerging and developing economies are expected to grow by 6.3% in 2021. Data
released so far indicated stronger than projected momentum across regions, however a surge
in virus due to new variants, continuation of lockdown in countries and slower than anticipated
progress in medical interventions can impact global growth.
Sri Lanka’s macro variables look positive for 2021 with the Government focusing on monetary
and fiscal policies that promote growth and normalisation. Single digit inflation, decade low
lending and rising consumer demand will promote consumption and growth in the economy. As
mobility restrictions imposed to curb the spread of the pandemic are gradually lifted, the exports
and tourism sector is also expected to recover. Meanwhile greater political stability is also a
positive sign. Increased debt repayments, pressure on reserves and the emergence of new
variants of the virus however could potentially dampen the recovery efforts. We however remain
optimistic of a gradual economic recovery towards the latter half of 2021.
Global life premium growth is expected to rebound in 2021 after the sharp contraction in 2020.
‘swissre sigma 7/2020’ report estimates a 3% growth in 2021 spurred on by the expected global
economic recovery, heightened awareness of importance of risk protection covers and rapid
transition to digital distribution channels. If interest rates continue to decline however this may
lead to asset-liability mismatch, threatening the solvency position of life insurers, particularly
those with higher exposure to annuities and contracts with guarantees. The low interest
environment is also shifting focus from saving -type products to risk protection solutions.
This trend is expected to continue in 2021. Meanwhile COVID-19 is also expected to increase
mortality risk while reducing income levels contributing to a higher mortality protection gap. This
is expected to drive demand for mortality protection.
Global Economy
Sri Lankan Economy
Global Life Insurance Industry
We remain optimistic of our prospects for 2021, given the gradual recovery of the global and local economy and remain committed to our strategic priorities of collaboration, diversification and differentiation to achieve further growth.
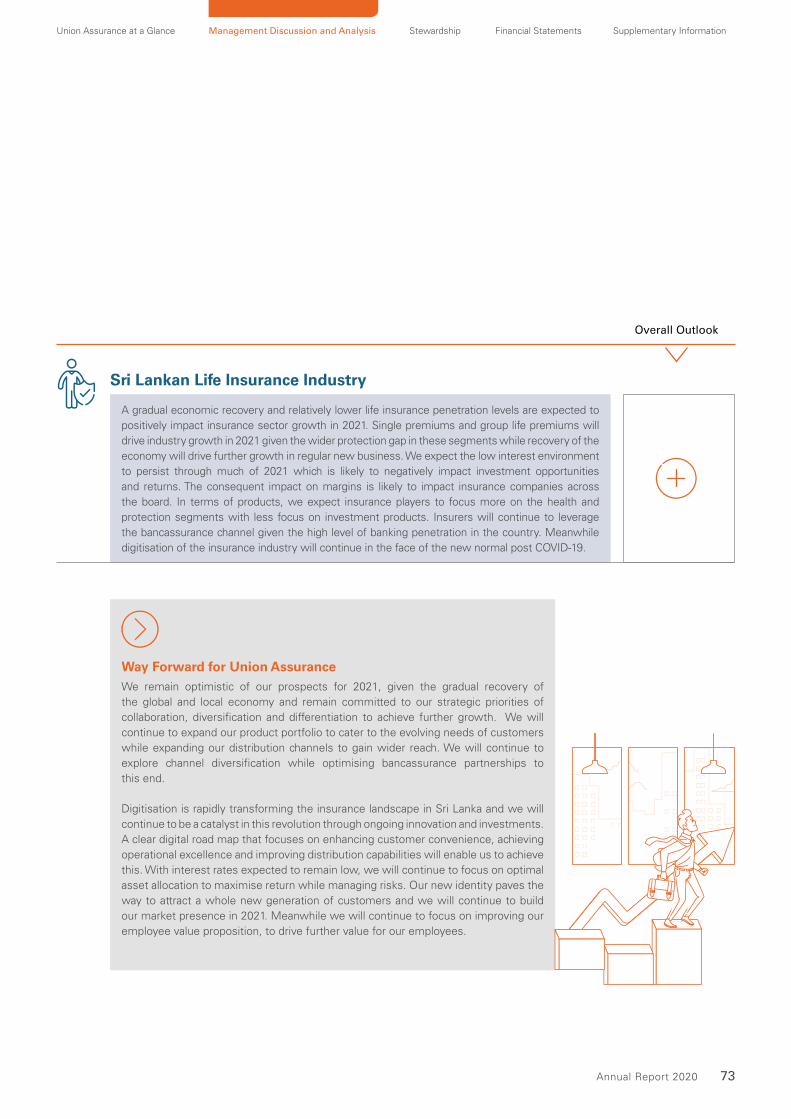
73 Annual Report 2020
Union Assurance at a Glance Management Discussion and Analysis Stewardship Financial Statements Supplementary Information
Overall Outlook
A gradual economic recovery and relatively lower life insurance penetration levels are expected to
positively impact insurance sector growth in 2021. Single premiums and group life premiums will
drive industry growth in 2021 given the wider protection gap in these segments while recovery of the
economy will drive further growth in regular new business. We expect the low interest environment
to persist through much of 2021 which is likely to negatively impact investment opportunities
and returns. The consequent impact on margins is likely to impact insurance companies across
the board. In terms of products, we expect insurance players to focus more on the health and
protection segments with less focus on investment products. Insurers will continue to leverage
the bancassurance channel given the high level of banking penetration in the country. Meanwhile
digitisation of the insurance industry will continue in the face of the new normal post COVID-19.
Sri Lankan Life Insurance Industry
Way Forward for Union AssuranceWe remain optimistic of our prospects for 2021, given the gradual recovery of
the global and local economy and remain committed to our strategic priorities of
collaboration, diversification and differentiation to achieve further growth. We will
continue to expand our product portfolio to cater to the evolving needs of customers
while expanding our distribution channels to gain wider reach. We will continue to
explore channel diversification while optimising bancassurance partnerships to
this end.
Digitisation is rapidly transforming the insurance landscape in Sri Lanka and we will
continue to be a catalyst in this revolution through ongoing innovation and investments.
A clear digital road map that focuses on enhancing customer convenience, achieving
operational excellence and improving distribution capabilities will enable us to achieve
this. With interest rates expected to remain low, we will continue to focus on optimal
asset allocation to maximise return while managing risks. Our new identity paves the
way to attract a whole new generation of customers and we will continue to build
our market presence in 2021. Meanwhile we will continue to focus on improving our
employee value proposition, to drive further value for our employees.

VALUING ASPIRATIONS
STEWARDSHIP
76 Board of Directors78 Executive Committee 80 The Chairman’s Statement on Corporate Governance 81 Corporate Governance Commentary 112 Enterprise Risk Management
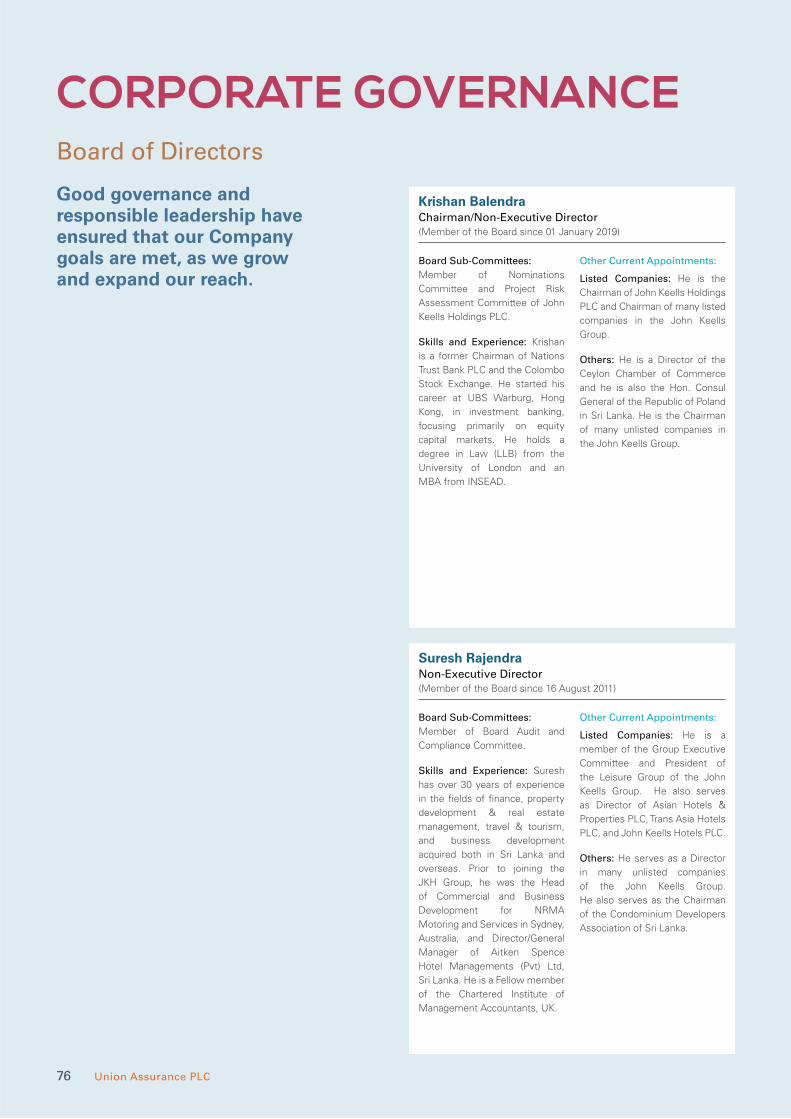
CORPORATE GOVERNANCEBoard of Directors
Good governance and responsible leadership have ensured that our Company goals are met, as we grow and expand our reach.
Krishan BalendraChairman/Non-Executive Director (Member of the Board since 01 January 2019)
Board Sub-Committees:
Member of Nominations
Committee and Project Risk
Assessment Committee of John
Keells Holdings PLC.
Skills and Experience: Krishan
is a former Chairman of Nations
Trust Bank PLC and the Colombo
Stock Exchange. He started his
career at UBS Warburg, Hong
Kong, in investment banking,
focusing primarily on equity
capital markets. He holds a
degree in Law (LLB) from the
University of London and an
MBA from INSEAD.
Other Current Appointments:
Listed Companies: He is the
Chairman of John Keells Holdings
PLC and Chairman of many listed
companies in the John Keells
Group.
Others: He is a Director of the
Ceylon Chamber of Commerce
and he is also the Hon. Consul
General of the Republic of Poland
in Sri Lanka. He is the Chairman
of many unlisted companies in
the John Keells Group.
Suresh RajendraNon-Executive Director (Member of the Board since 16 August 2011)
Board Sub-Committees:
Member of Board Audit and
Compliance Committee.
Skills and Experience: Suresh
has over 30 years of experience
in the fields of finance, property
development & real estate
management, travel & tourism,
and business development
acquired both in Sri Lanka and
overseas. Prior to joining the
JKH Group, he was the Head
of Commercial and Business
Development for NRMA
Motoring and Services in Sydney,
Australia, and Director/General
Manager of Aitken Spence
Hotel Managements (Pvt) Ltd,
Sri Lanka. He is a Fellow member
of the Chartered Institute of
Management Accountants, UK.
Other Current Appointments:
Listed Companies: He is a
member of the Group Executive
Committee and President of
the Leisure Group of the John
Keells Group. He also serves
as Director of Asian Hotels &
Properties PLC, Trans Asia Hotels
PLC, and John Keells Hotels PLC.
Others: He serves as a Director
in many unlisted companies
of the John Keells Group.
He also serves as the Chairman
of the Condominium Developers
Association of Sri Lanka.
76 Union Assurance PLC

Union Assurance at a Glance Management Discussion and Analysis Stewardship Financial Statements Supplementary Information
Stephen Anthony AppleyardIndependent Non-Executive Director (Member of the Board since 01 January 2019)
Board Sub-Committees: None
Skills and Experience: Stephen
has over 25 years of experience in
the life insurance industry across
Europe, US, and Asia. He has
been a Country Manager/CEO at
AIA (Indonesia), Allianz (Ayudhya
Allianz C.P, Thailand), and SCB
Life (Thailand), as well Regional
CEO at AIA (Hong Kong) and is
currently the Head of Distribution
for AXA Asia (Life and Non-Life
Insurance). He has served as
a Consultant to Direct Money
(Vietnam) on telco-assurance
start-up and as an Advisor to many
Fintech companies. He has deep
experience in strategy, distribution,
marketing, finance, and operational
transformation. He holds a Bachelor
of Science from Sheffield Hallam
University and an MBA from the
University of Manchester.
Other Current Appointments:
Listed Companies: He is
currently the Head of Distribution
AXA Asia Markets (Life and
Non-Life Insurance).
Others: None
Daminda GamlathNon-Executive Director (Member of the Board since 10 June 2020)
Board Sub-Committees: None
Skills and Experience: Daminda
holds a B.Sc. in Engineering from
the University of Moratuwa and
an MBA from the Univeristy
of Colombo. His areas of
specialisations are financial
accounting, management
accounting, business analysis,
sales, marketing and general
management. He is a passed
finalist of CIMA, UK. Daminda
is currently serving as President
of the Consumer Foods Industry
Group of John Keells. He was
also attached to John Keells
Computer Services (Pvt) Ltd and
the IT Industry Group at John
Keells. Prior to joining the Group,
he was with Hayleys Electronics
Ltd and Hayleys Industrial
Solutions (Pvt) Ltd.
Other Current Appointments:
Listed Companies: Daminda is
a Director of Ceylon Cold Stores
PLC and Keells Food Products
PLC.
Others: He serves as a Director
in many unlisted companies of
the John Keells Group.
Malinga ArsakularatneIndependent Non-Executive Director (Member of the Board since 14 July 2020)
Board Sub-Committees:
Chairman of Board Audit and
Compliance Committee.
Skills and Experience: Malinga
has 24 years of experience
in investment management,
corporate finance, business
strategy, and general
management. He has held
several roles during his 16 years
tenure at the Hemas Group,
including Managing Director
(Leisure Travel & Aviation Group)
and Group CFO. He has served
on the Boards of Hemas Holdings
PLC and Serendib Hotels Group.
Malinga is a CFA Charter Holder
and a past President of CFA
Sri Lanka. He is also a Fellow
Member of the Chartered
Institute of Management
Accountants, UK, and a past
Board member of the CIMA
Sri Lanka division. He holds a
BSc in Computer Science &
Engineering from the University
of Moratuwa, an MSc in
Investment Management from
Cass Business School, and an
Executive MBA from INSEAD.
Other Current Appointments:
Listed Companies: None
Others: He is a Director of
Airserve Aviation Lanka (Pvt) Ltd,
Discover the World Marketing
(Pvt) Ltd, Diethlem Travel Lanka
(Pvt) Ltd, Acorn Ventures (Pvt)
Ltd, Acorn Air Services (Pvt) Ltd,
Acorn Aviation (Pvt) Ltd, Acorn
Travels (Pvt) Ltd, Acorn Partners
(Pvt) Ltd, Aviation Services (Pvt)
Ltd, LTU Asia Aviation Services
Company Ltd, Discover the
World (Thailand) Co Ltd and Asian
Elite Holidays (Pvt) Ltd.
Dumith FernandoIndependent Non-Executive Director(Member of the Board since 03 August 2018)
Board Sub-Committees:
Member of Board Audit and
Compliance Committee.
Skills and Experience:
Dumith holds a BA in Physics
& Economics from Middlebury
College in the U.S. and an MBA
from Harvard Business School.
He has twenty-five years of
experience in international and
Sri Lankan capital markets, having
spent much of his career in global
financial centers New York and
Hong Kong with global banking
firms JPMorgan Chase and Credit
Suisse. There he held various
roles across Equities, Investment
Banking, Private Equity, and
Corporate Strategy. Prior to his
return to Sri Lanka in 2013, he was
the Managing Director and Group
Chief Operating Officer for Credit
Suisse Asia Pacific – a US$2.5
billion revenue business across 12
countries - and a member of that
firm’s Global Leadership Council.
Other Current Appointments:
Listed Companies: Dumith is an
Independent Director of Singer
(Sri Lanka) PLC.
Others: Dumith currently
serves as the Chairman of the
Colombo Stock Exchange (CSE).
He is also the Chairman of Asia
Securities Holdings (Pvt) Ltd, a
leading independent Investment
Bank in Sri Lanka which offers
Investment Banking, Wealth
Management, Stock Brokerage,
and Research services to
international and domestic
institutions, corporates, and high
net worth individuals. He is a
member of the Financial System
Stability Consultative Committee
(FSSCC) of the Central Bank of
Sri Lanka, and the Economic
Policy Steering Committee of the
Ceylon Chamber of Commerce.
77 Annual Report 2020

Executive Committee
Jude GomesChief Executive Officer
Jude joined Union Assurance on 01
December 2019.
He has over 28 years of experience
in financial services working across
key Asian markets. Previously, he was
heading Manulife China Bank Life
Assurance Co. Philippines as CEO
and President. Jude has been with
Manulife Group since 2012, pioneering
Bancassurance in Vietnam as Vice
President and Head of Partnership
Distribution.
He was founder member of Canara
HSBC OBC Life Insurance Co. as Senior
Vice President and Head of Channel and
was subsequently seconded to Hong
Kong at HSBC Insurance (Asia-Pacific)
Regional Business Development,
working across APAC markets.
Jude was among the pioneers at
India’s first privatised life insurer, HDFC
Standard Life, and also led wealth
management for Centurion Bank of
Punjab. He is a recipient of Manulife’s
Global Star of Excellence Award in 2013
and 2015 and Standard Chartered Bank’s
Regional Award in 1999. Jude was also
awarded the title ‘CEO of the Year’ in
2020 by CEO monthly magazine, United
Kingdom.
Jude holds a Bachelor of Commerce
(Hons) from the University of Calcutta
and a Masters Diploma in Business
Administration, specialising in Marketing
Management from the Symbiosis
Institute of Management Studies, Pune.
He is a Licentiate in Insurance (III), and
is a Certified Associate of the Indian
Institute of Bankers (CAIIB-1), Mumbai.
Suresh MuttiahGeneral Manager; Human Resources
Suresh joined Union Assurance in
May 2016.
Prior to joining Union Assurance, he has
been with the John Keells Group for 5 years
serving in the capacity of Vice President -
Human Resources, Retail Sector. Suresh
has more than 18 years’ experience in
HR management and Operations, having
worked in leadership positions at Dialog
Axiata PLC, Carsons Cumberbatch PLC,
and Lion Brewery PLC.
Suresh holds a professional qualification
in Human Resource Management
(CIPM Sri Lanka), a Post Graduate
Diploma and MBA from the University
of Southern Queensland - Australia.
He is a member of SHRM (USA), IPMA
- HR (USA), and The Association of HR
Professionals – AHRP (Sri Lanka).
Harsha SenanayakeChief Information Officer
Harsha joined Union Assurance in
October 2016.
He has been with the John Keells Group
for more than 15 years where he has
gained experience in IT and management.
During his tenure at JKH, he was
instrumental in the implementation of
SAP and also promoting it as an ERP
solution to many leading organisations
in Sri Lanka. He also plays a key role in
the Group’s digitisation initiatives and in
driving technology innovation to all areas
of business.
In addition to his current role at Union
Assurance, he also oversees the IT
function of John Keells Stockbrokers
and assumed responsibilities as Head
of Business Systems, Financial Services
Sector in October 2020.
Harsha holds a BSc in Computer
Science from the London Metropolitan
University and a Post Graduate Diploma
in Information Systems Management
from the University of Colombo.
Asha PereraChief Financial Officer
Asha joined Union Assurance in
September 2018.
Prior to joining the John Keells Group
in 2005, she held multiple operational
and financial responsibilities in the
apparel industry. Asha also serves as a
Vice President of John Keells Holdings
PLC with multi-sectoral experience in
information technology, leisure, and
plantation services with an overall
tenure of 15 years and 24 years of
professional experience respectively.
Asha holds a Master of Business
Administration (MBA) from the Post
Graduate Institute of Management
(PIMA), BSc Management (Human
Resource Management) from the
University of Sri Jayawardenepura -
Sri Lanka and is an Associate Member of
the Chartered Institute of Management
Accountants, UK.
Senath JayatilakeChief Distribution Officer
Senath joined Union Assurance in
November 2019.
Prior to joining Union Assurance, he
served as the Chief Executive Officer,
John Keells Logistics (Pvt) Limited. He is
also a Vice President of the John Keells
Group and accounts for over 13 years
of experience in business development
operations management, sales and
marketing, financial analysis, and strategy.
Senath holds a BA (Hons) in Finance
and Accounting from the University
of Nottingham (UK), an Associate
membership from the Chartered
Institute of Management Accountants,
UK, and an MBA from the University of
Sri Jayawardenapura.
CORPORATE GOVERNANCE
78 Union Assurance PLC

Union Assurance at a Glance Management Discussion and Analysis Stewardship Financial Statements Supplementary Information
Rumesh ModarageChief Technical Officer
Rumesh joined Union Assurance in
December 2019.
Prior to joining Union Assurance, he
served as Senior Manager at Softlogic
Life Insurance PLC and counts over
10 years of experience in the fields of
Insurance Finance, Life Operations, and
Alternate sales.
Rumesh holds a Master’s in
Business Administration (MBA)
from the Postgraduate Institute of
Management (PIM) – the University of
Sri Jayawardenepura, an Associate
Member of Chartered Institute of
Management Accountants UK – CIMA
and he is also a Fellow Member of
Chartered Insurance Institute UK (FCII)
and a Chartered Insurer.
Lucille DiazChief Marketing Officer
Lucille joined Union Assurance in July
2020.
Prior to joining Union Assurance,
Lucille held the position of Manager –
Communications at Cinnamon Hotels
& Resorts. She counts over 15 years of
experience in the fields of advertising,
wellness, and hospitality.
Lucille holds a Master’s in Business
Administration (MBA) specialised in
Project Management from the Cardiff
Metropolitan University, a Diploma
in Chartered Global Management
Accountant from Chartered Institute of
Management Accountants, and a Post
Graduate Diploma in Marketing from
Sri Lanka Institute of Marketing.
Bimanee MeepagalaChief Bancassurance Officer
Bimanee joined Union Assurance in
August 2020.
Prior to joining Union Assurance, she
served as a Vice President at NDB Wealth
Management Limited; the largest private
sector fund management Company
in Sri Lanka. She oversaw institutional
and retail funds including insurance
and pension funds in both fixed income
and equity markets. She also serves
as a lecturer and a resource person
for market awareness and educational
sessions organised by the Securities
and Exchange Commission (SEC) of
Sri Lanka. Bimanee counts over 15 years
of experience in capital markets.
Bimanee holds a Master of Arts in
Financial Economics (MAFE) from the
University of Colombo and a Bachelor of
Arts Degree from the same University.
She is also a Fellow Member of the
Chartered Institute of Management
Accountants (UK) FCMA, and a member
of Chartered Global Management
Accountant (CGMA).
Nalin SubasingheChief Actuarial Officer
Nalin joined Union Assurance in August
2020.
Prior to joining Union Assurance, he
was at Sri Lanka Insurance Corporation
Limited as its Deputy General Manager -
Actuarial and Risk Management Services.
He counts extensive actuarial, investment
administration, and overall insurance
business experience with more than 16
years of service in the insurance field.
Apart from his core responsibility in
actuarial and risk management, he also
acted as the Head of Investments at Sri
Lanka Insurance Corporation Limited for
a one-year period where he managed
more than Rs. 150 billion worth of
investment asset portfolio. He was
also the nominee Director of Sri Lanka
Insurance Corporation Limited to Capital
Allianz Investment Limited and Ceylon
Asset Management Limited where
he acted as the Chairman of the latter.
Currently, Nalin serves as the Chairman
of the actuarial Sub-Committee of the
Insurance Association of Sri Lanka.
Nalin holds a Master of Science Degree in
Actuarial Management from Heriot-Watt
University, UK, and a Bachelor of Science
(Hons) Degree in Finance, Business &
Computational Mathematics from the
University of Colombo. Currently, he is
reading for fellowship from the Institute
and Faculty of Actuaries, UK.
79 Annual Report 2020
80 Union Assurance PLC
CORPORATE GOVERNANCE
The Chairman’s Statement on Corporate Governance
Dear Stakeholder,
On behalf of the Board of Union Assurance
PLC (UA), I am pleased to present our
Corporate Governance Statement for
the financial year ended 31st December
2020. At UA, we believe good corporate
governance is key to maintaining the
trust that our investors and customers
have placed in us. At UA, we recognise
that sound corporate governance
practices provide a strong foundation
for ensuring sustainable growth and
trusted relationships. This Report explains
and demonstrates the framework and
activities carried out during the year to
ensure the highest standards of corporate
governance and compliance within UA.
Governance AttitudeThe highest standards of transparency,
reliability and ethical business conduct
are well established guiding principles
within the Company and are articulated
in a comprehensive policy framework and
a Code of Conduct which is communicated
to and understood by all employees.
In addition to legal requirements, the
Company’s policy framework embraces
international best practices and complies
with voluntary frameworks, providing
a solid foundation for performance
as well as effectively managing risks arising
from economic, social and environmental
impacts. Formal governance structures
serve to ensure judicious empowerment
and create an appropriate balance of
authority and responsibility within the
organisation.
Governance Structure and LeadershipThe Company operates within a clearly
defined governance structure enabling
the Board to provide strategic guidance
and risk oversight whilst adhering to
regulatory requirements. The structure
also provides for delegation of authority
while retaining effective control. The Board
delegates authority to the relevant Board
Sub-Committees and the Executive
Committee of UA with clearly defined
mandates and authority levels whilst
maintaining its accountability.
We are mindful that it is important for
the Board to be composed of personnel
that are best placed to provide guidance
on UA’s strategic direction with a diverse
range of skills and experiences which
collectively are both complementary and
directly relevant to the Company strategy.
Therefore, an appraisal of the Board’s
performance is conducted annually.
We also work closely with all relevant
regulators to ensure that our internal
governance standards meet their
increasing expectations.
Culture and EthicsOur culture is shaped by the Code of
Conduct and Ethics which articulates
the standards of conduct expected of
Directors and Employees. The Code is
reviewed and updated from time to time
to ensure it is fit for purpose in a rapidly
evolving business environment.
Accountability and RiskSetting a robust system of internal
controls and risk management processes
is a key responsibility of the Board and we
are assisted in this by the Board Audit and
Compliance Committee (BACC). The BACC
plays an important role in monitoring the
Company’s risk and assurance systems
and regularly reviewing the efficiency and
effectiveness of internal controls.
An Audit, Risk and Compliance division
was established during the year to
oversee Internal Audit, Risk Management,
Legal and Compliance functions, to further
strengthen the control environment and
governance of the Company. The Middle
Office of the investment division which
was established in the previous year was
also assigned under this division.
Engagement with StakeholdersThe feedback obtained from our robust
Stakeholder engagement mechanisms
form a key input in strategy formulation,
ensuring that the Company’s growth
is responsible and sustainable. Our
Stakeholder engagement mechanisms are
structured and comprehensive, providing
valuable insights into Stakeholder
concerns and enabling us to provide
appropriate responses while balancing
multiple interests.
Future DirectionThe Board’s priorities for 2021 remain
consistent with last year’s priorities.
We will continue to monitor progress
against our strategy to ensure that we
drive growth and improve returns. We are
committed to investing in and supporting
our people so that the Company maintains
an appropriate balance of management
skills and capabilities as it grows and
develops.
Statement of DeclarationI also wish to state that to the best of
my knowledge and available information,
I am not aware of any material violations of
any of the provisions of the Code of Best
Practice on Corporate Governance issued
by the Institute of Chartered Accountants
of Sri Lanka.
Krishan Balendra
Chairman
25 February 2021
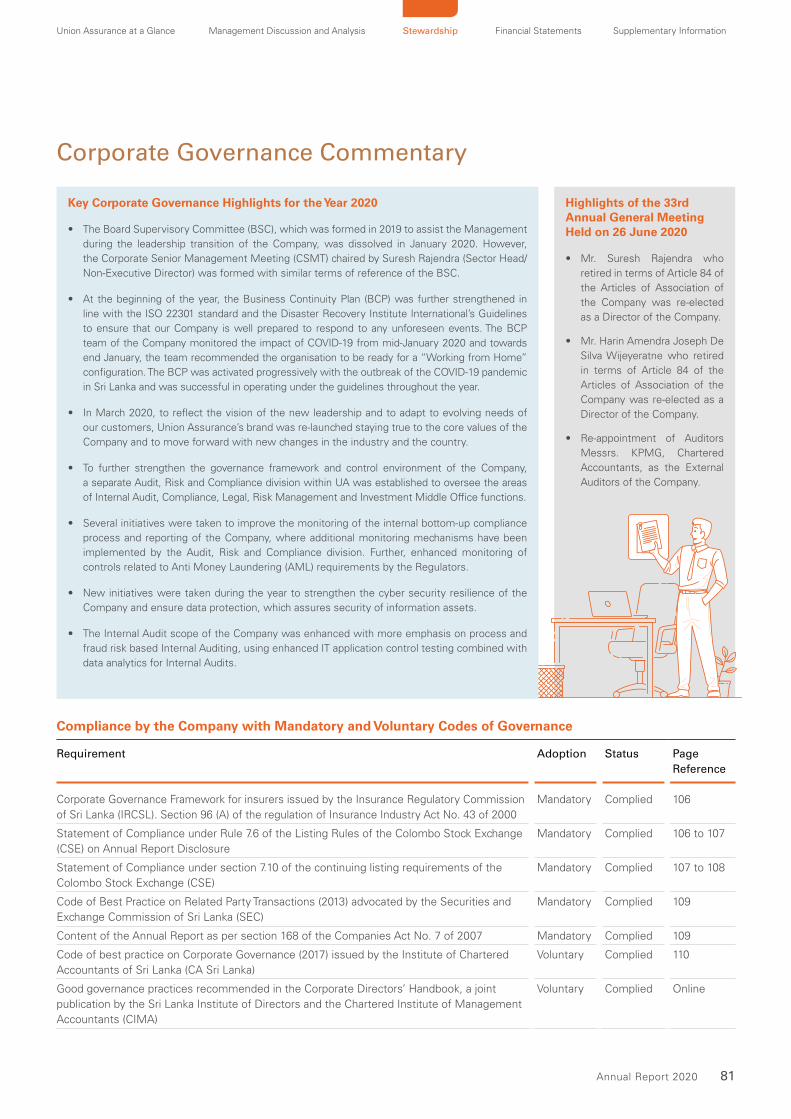
81 Annual Report 2020
Union Assurance at a Glance Management Discussion and Analysis Stewardship Financial Statements Supplementary Information
Corporate Governance Commentary
Highlights of the 33rd Annual General Meeting Held on 26 June 2020
• Mr. Suresh Rajendra who
retired in terms of Article 84 of
the Articles of Association of
the Company was re-elected
as a Director of the Company.
• Mr. Harin Amendra Joseph De
Silva Wijeyeratne who retired
in terms of Article 84 of the
Articles of Association of the
Company was re-elected as a
Director of the Company.
• Re-appointment of Auditors
Messrs. KPMG, Chartered
Accountants, as the External
Auditors of the Company.
Compliance by the Company with Mandatory and Voluntary Codes of Governance
Requirement Adoption Status Page
Reference
Corporate Governance Framework for insurers issued by the Insurance Regulatory Commission
of Sri Lanka (IRCSL). Section 96 (A) of the regulation of Insurance Industry Act No. 43 of 2000
Mandatory Complied 106
Statement of Compliance under Rule 7.6 of the Listing Rules of the Colombo Stock Exchange
(CSE) on Annual Report Disclosure
Mandatory Complied 106 to 107
Statement of Compliance under section 7.10 of the continuing listing requirements of the
Colombo Stock Exchange (CSE)
Mandatory Complied 107 to 108
Code of Best Practice on Related Party Transactions (2013) advocated by the Securities and
Exchange Commission of Sri Lanka (SEC)
Mandatory Complied 109
Content of the Annual Report as per section 168 of the Companies Act No. 7 of 2007 Mandatory Complied 109
Code of best practice on Corporate Governance (2017) issued by the Institute of Chartered
Accountants of Sri Lanka (CA Sri Lanka)
Voluntary Complied 110
Good governance practices recommended in the Corporate Directors’ Handbook, a joint
publication by the Sri Lanka Institute of Directors and the Chartered Institute of Management
Accountants (CIMA)
Voluntary Complied Online
Key Corporate Governance Highlights for the Year 2020
• The Board Supervisory Committee (BSC), which was formed in 2019 to assist the Management
during the leadership transition of the Company, was dissolved in January 2020. However,
the Corporate Senior Management Meeting (CSMT) chaired by Suresh Rajendra (Sector Head/
Non-Executive Director) was formed with similar terms of reference of the BSC.
• At the beginning of the year, the Business Continuity Plan (BCP) was further strengthened in
line with the ISO 22301 standard and the Disaster Recovery Institute International’s Guidelines
to ensure that our Company is well prepared to respond to any unforeseen events. The BCP
team of the Company monitored the impact of COVID-19 from mid-January 2020 and towards
end January, the team recommended the organisation to be ready for a “Working from Home”
configuration. The BCP was activated progressively with the outbreak of the COVID-19 pandemic
in Sri Lanka and was successful in operating under the guidelines throughout the year.
• In March 2020, to reflect the vision of the new leadership and to adapt to evolving needs of
our customers, Union Assurance’s brand was re-launched staying true to the core values of the
Company and to move forward with new changes in the industry and the country.
• To further strengthen the governance framework and control environment of the Company,
a separate Audit, Risk and Compliance division within UA was established to oversee the areas
of Internal Audit, Compliance, Legal, Risk Management and Investment Middle Office functions.
• Several initiatives were taken to improve the monitoring of the internal bottom-up compliance
process and reporting of the Company, where additional monitoring mechanisms have been
implemented by the Audit, Risk and Compliance division. Further, enhanced monitoring of
controls related to Anti Money Laundering (AML) requirements by the Regulators.
• New initiatives were taken during the year to strengthen the cyber security resilience of the
Company and ensure data protection, which assures security of information assets.
• The Internal Audit scope of the Company was enhanced with more emphasis on process and
fraud risk based Internal Auditing, using enhanced IT application control testing combined with
data analytics for Internal Audits.
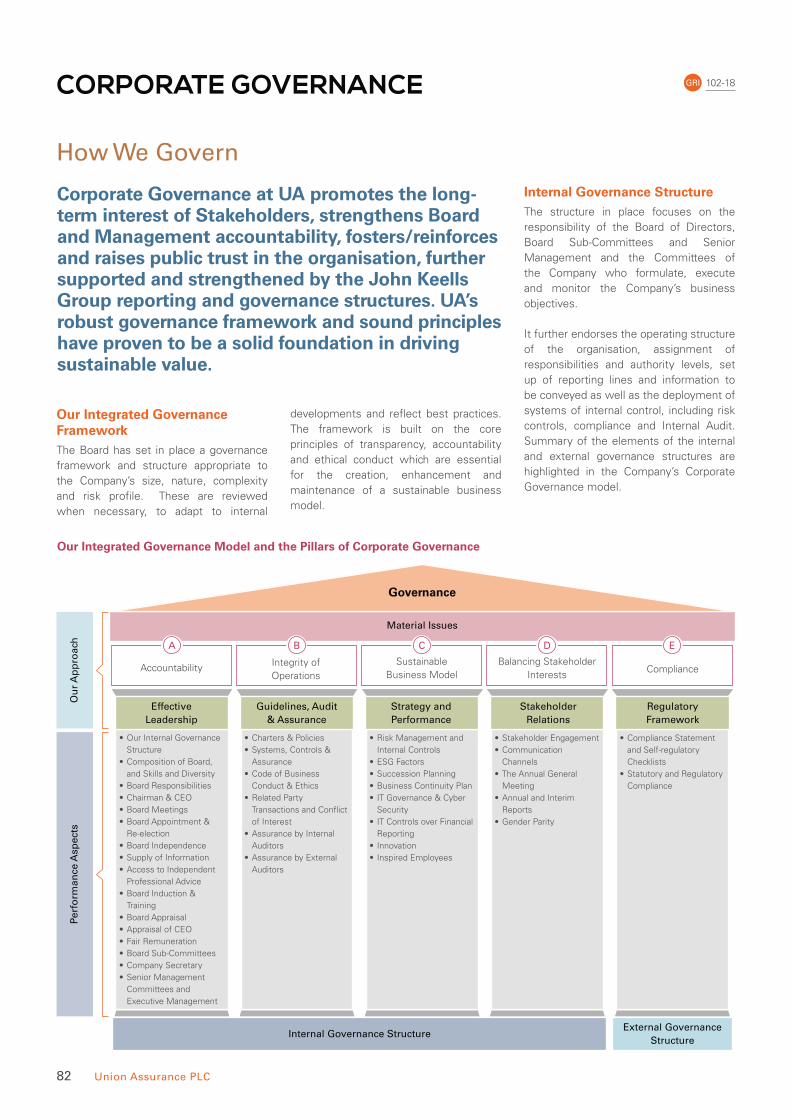
82 Union Assurance PLC
CORPORATE GOVERNANCE
How We Govern
Corporate Governance at UA promotes the long-term interest of Stakeholders, strengthens Board and Management accountability, fosters/reinforces and raises public trust in the organisation, further supported and strengthened by the John Keells Group reporting and governance structures. UA’s robust governance framework and sound principles have proven to be a solid foundation in driving sustainable value.
Our Integrated Governance FrameworkThe Board has set in place a governance
framework and structure appropriate to
the Company’s size, nature, complexity
and risk profile. These are reviewed
when necessary, to adapt to internal
developments and reflect best practices.
The framework is built on the core
principles of transparency, accountability
and ethical conduct which are essential
for the creation, enhancement and
maintenance of a sustainable business
model.
Internal Governance StructureThe structure in place focuses on the
responsibility of the Board of Directors,
Board Sub-Committees and Senior
Management and the Committees of
the Company who formulate, execute
and monitor the Company’s business
objectives.
It further endorses the operating structure
of the organisation, assignment of
responsibilities and authority levels, set
up of reporting lines and information to
be conveyed as well as the deployment of
systems of internal control, including risk
controls, compliance and Internal Audit.
Summary of the elements of the internal
and external governance structures are
highlighted in the Company’s Corporate
Governance model.
Our Integrated Governance Model and the Pillars of Corporate Governance
Governance
Material Issues
Accountability
A B C D E
Integrity of Operations
Sustainable Business Model
Balancing Stakeholder Interests
Compliance
Effective Leadership
Guidelines, Audit & Assurance
Internal Governance Structure
Perf
orm
an
ce A
spect
sO
ur
Ap
pro
ach
External Governance Structure
Strategy and Performance
Stakeholder Relations
Regulatory Framework
• Our Internal Governance
Structure
• Composition of Board,
and Skills and Diversity
• Board Responsibilities
• Chairman & CEO
• Board Meetings
• Board Appointment &
Re-election
• Board Independence
• Supply of Information
• Access to Independent
Professional Advice
• Board Induction &
Training
• Board Appraisal
• Appraisal of CEO
• Fair Remuneration
• Board Sub-Committees
• Company Secretary
• Senior Management
Committees and
Executive Management
• Charters & Policies
• Systems, Controls &
Assurance
• Code of Business
Conduct & Ethics
• Related Party
Transactions and Conflict
of Interest
• Assurance by Internal
Auditors
• Assurance by External
Auditors
• Risk Management and
Internal Controls
• ESG Factors
• Succession Planning
• Business Continuity Plan
• IT Governance & Cyber
Security
• IT Controls over Financial
Reporting
• Innovation
• Inspired Employees
• Stakeholder Engagement
• Communication
Channels
• The Annual General
Meeting
• Annual and Interim
Reports
• Gender Parity
• Compliance Statement
and Self-regulatory
Checklists
• Statutory and Regulatory
Compliance
102-18GRI

83 Annual Report 2020
Union Assurance at a Glance Management Discussion and Analysis Stewardship Financial Statements Supplementary Information
(A) Accountability1.0 Effective LeadershipThe Board of Union Assurance PLC appointed by the Shareholders, has ultimate responsibility and accountability for the performance of the Company and its state of affairs. The Board seeks to provide effective leadership in driving
sustainable value while balancing the interests of all Stakeholders. The Board determines strategic direction of the Company, manages risk and sets in place a sound governance framework. Certain responsibilities have been delegated to Board Sub-Committees and Executive Management of UA.
The Nominations Committee, Human Resources and Compensation Committee, Related Party Transaction Review Committee and Project Risk Assessment Committee of John Keells Holdings PLC being the parent Company of UA (“Parent Company”) serves as Sub-Committees for the Board of UA.
Chairman
Krishan Balendra
Key Objectives
• Provide leadership and governance, ensure
effectiveness of the Board and sets the agenda
for the Board.
Chief Executive Officer (CEO)
Key Objectives
• Implementation of Board
strategy and policies.
• Responsible for the
management of the business.
Human Resources and Compensation Committee of the Parent Company (HRCC)
Chairman Amal Cabraal
Three Independent Non-Executive Directors
Key Objectives
• To assess and make recommendations to the Board on the policy on Executive
remuneration.
• Review the ongoing appropriateness and relevance of the Remuneration Policy.
Related Party Transaction Review Committee of the Parent Company (RPTRC)
Chairperson Premila Perera
Three Independent Non-Executive Directors
Key Objectives
• To ensure on behalf of the Board that all related party transactions are
consistent with the Listing Rules of the CSE.
Project Risk Assessment Committee of the Parent Company (PRAC)
Chairman: Hans Wijayasuriya
Two Independent Non-Executive Directors and Two Executive Directors
Key Objectives
• Evaluate and assess risks associated with significant new investments at the
initial stages of formulation and in any event prior to making any contractual
commitments for the long term.
Executive Committee (ExCo)
Nine members of the Senior Management team including the Chief Executive Officer provide advice on key functions and operations of the Company.
Key Objectives
• Review and implementation of business plans.
• Establish strong HRM practices and policies.
• Continuous performance management and review.
The Board
Six Directors as at 31 December 2020
Three Non-Executive Directors including the Chairman
and three Independent Non-Executive Directors
Key Objectives
• Monitoring responsibilities delegated to its
Sub-Committees.
• Establish a risk assessment and management
framework.
• Determine Company’s values and standards.
• Review management performance and strategic
business plans.
• Develop a succession plan for Board and KMPs.
• Ensure effectiveness of governance practices.
Read more on page 76
Read more on page 94
Read more on page 94
Read more on page 95
Read more on page 97
Read more on page 76
Read more on page 78
Read more on page 78
Corporate Senior Management Committee (CSMT - established in February 2020)
Chairman Suresh Rajendra
Sector Head/ Non-Executive Director
Key Objectives
• Review performance
of the Company.
• Review strategies and
annual plans.
• Advise and guide the
Executive Committee
on corporate initiatives.
De
leg
ate
d a
uth
ori
ty
Acc
ou
nta
bil
ity
th
rou
gh
re
po
rtin
g
ob
lig
ati
on
s
Management
delegated authority
Provides advice
to the CEO on key
decisions made
under Management
delegation
102-18GRI
Nominations Committee of the Parent Company (NC)
Chairman Ashroff Omar
One Executive Director and Three Independent Non-Executive Directors
Key Objectives
• Define and establish the nomination process for Non-Executive Directors.
• Lead the process of Board appointments and make recommendations to the
Board on the appointment of Non-Executive Directors.
Read more on page 89
Investment Committee (IC)
Chairman Gihan Cooray
Chairman of the Committee appointed by the Board
Key Objectives
• To formulate the investment strategy.
• Review performance of the funds.
• Ensure compliance with internal and external investment regulations.
Read more on page 92
Board Audit and Compliance Committee (BACC)
Chairman Malinga Arsakularatne (appointed w.e.f. 14.07.2020)
Harin Wijeyeratne(retired w.e.f. 06.09.2020)
Two Independent Non-Executive Directors and One Non-Executive Director
Key Objectives
Effective governance over
• Financial reporting.
• Internal and external audit.
• Compliance with legal and regulatory requirements.
• Internal controls.
Read more on page 90
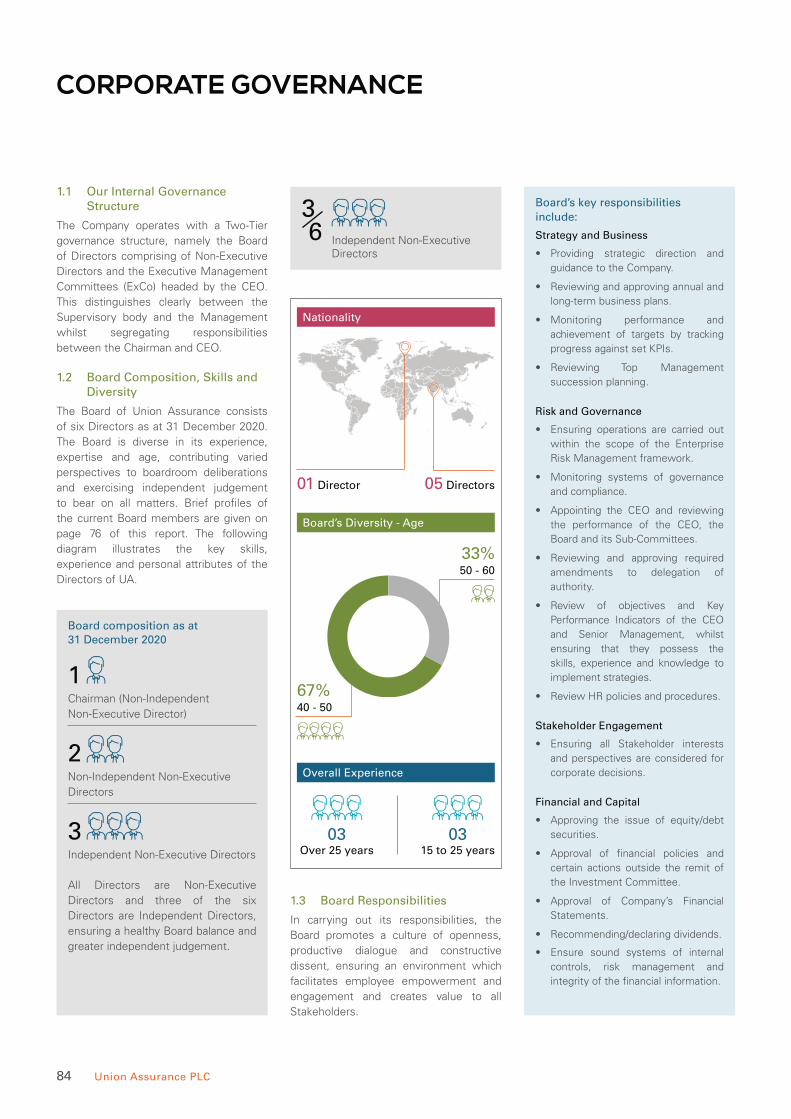
84 Union Assurance PLC
CORPORATE GOVERNANCE
1.1 Our Internal Governance Structure
The Company operates with a Two-Tier
governance structure, namely the Board
of Directors comprising of Non-Executive
Directors and the Executive Management
Committees (ExCo) headed by the CEO.
This distinguishes clearly between the
Supervisory body and the Management
whilst segregating responsibilities
between the Chairman and CEO.
1.2 Board Composition, Skills and Diversity
The Board of Union Assurance consists
of six Directors as at 31 December 2020.
The Board is diverse in its experience,
expertise and age, contributing varied
perspectives to boardroom deliberations
and exercising independent judgement
to bear on all matters. Brief profiles of
the current Board members are given on
page 76 of this report. The following
diagram illustrates the key skills,
experience and personal attributes of the
Directors of UA.
Board composition as at 31 December 2020
1Chairman (Non-Independent
Non-Executive Director)
2Non-Independent Non-Executive
Directors
3Independent Non-Executive Directors
All Directors are Non-Executive
Directors and three of the six
Directors are Independent Directors,
ensuring a healthy Board balance and
greater independent judgement.
Nationality
Board’s Diversity - Age
Overall Experience
01 Director 05 Directors
33%50 - 60
67%40 - 50
Over 25 years 15 to 25 years
36 Independent Non-Executive
Directors
1.3 Board Responsibilities
In carrying out its responsibilities, the
Board promotes a culture of openness,
productive dialogue and constructive
dissent, ensuring an environment which
facilitates employee empowerment and
engagement and creates value to all
Stakeholders.
Board’s key responsibilities include:
Strategy and Business
• Providing strategic direction and
guidance to the Company.
• Reviewing and approving annual and
long-term business plans.
• Monitoring performance and
achievement of targets by tracking
progress against set KPIs.
• Reviewing Top Management
succession planning.
Risk and Governance
• Ensuring operations are carried out
within the scope of the Enterprise
Risk Management framework.
• Monitoring systems of governance
and compliance.
• Appointing the CEO and reviewing
the performance of the CEO, the
Board and its Sub-Committees.
• Reviewing and approving required
amendments to delegation of
authority.
• Review of objectives and Key
Performance Indicators of the CEO
and Senior Management, whilst
ensuring that they possess the
skills, experience and knowledge to
implement strategies.
• Review HR policies and procedures.
Stakeholder Engagement
• Ensuring all Stakeholder interests
and perspectives are considered for
corporate decisions.
Financial and Capital
• Approving the issue of equity/debt
securities.
• Approval of financial policies and
certain actions outside the remit of
the Investment Committee.
• Approval of Company’s Financial
Statements.
• Recommending/declaring dividends.
• Ensure sound systems of internal
controls, risk management and
integrity of the financial information.
03 03

85 Annual Report 2020
Union Assurance at a Glance Management Discussion and Analysis Stewardship Financial Statements Supplementary Information
Regular items on the Board agenda
• Feedback on key matters from Board
Sub-Committee Chairmen.
• The Chief Executive’s brief on the
long-term business plan, strategies
adopted, its implementation and
other business developments.
• Progress relating to strategic
Bancassurance Partnerships both
existing and potential.
• Details pertaining to brand and
market research.
• Progress relating to Corporate Social
Responsibility and Sustainability.
• Approval of Quarterly and Annual
Financial Statements.
• Review of Company risk register.
• IT and Digital Road Map.
1.4 Chairman & Chief Executive Officer
The roles and responsibilities of the Chairman and Chief Executive Officer are segregated, ensuring an appropriate balance of power
and authority.
Chairman Chief Executive Officer (CEO)
Role Role
Critical to preserving good Corporate Governance, the Chairman
provides leadership to the Board, preserving order and facilitating
the discharge of duties.
Provides executive leadership and expertise in the implementation
of plans and achievement of strategic objectives. The CEO is held
accountable to the Board for the performance of the Company.
Responsibilities Responsibilities
• Ensuring the effective participation of all Directors at meetings.
• Maintaining open lines of communication with Key Management
Personnel.
• Ensure constructive working relations between the Executive
and Non-Executive Directors.
• Ensure, with the assistance of the Board Secretary that,
– Board procedures are followed.
– Information is disseminated in a timely manner to the Board.
• Execute strategies and policies of the Board.
• Ensure efficient management of business.
• Ensure the operating model is aligned with short and long-term
strategies of the Company.
• Succession planning of Senior Management.
1.5 Board Meetings
The UA Board is well engaged and dedicates
adequate time and effort to Company
matters. Board meetings are usually held
once in every two months, unless business
exigencies demand the convening of
additional meetings. During the year 2020,
the Board met on six (6) occasions.
The Board agenda is prepared by the
Company Secretary and reviewed and
approved by the Chairman, where
necessary, in consultation with the CEO
and members of the Board. The agenda
and Board papers are generally sent seven
(7) days prior to the meeting, allowing
sufficient time to review the same.
The attendance of Board meetings in 2020 is given below.
Name of Director Date of
Appointment
to the Board
Eligibility Attendance
Non-Executive Directors
Krishan Balendra 01.01.2019 6 6
Suresh Rajendra 16.08.2011 6 6
Daminda Gamlath 10.06.2020 3 3
Independent Non-Executive Directors
Harin De Silva Wijeyeratne
(resigned w.e.f. 06.09.2020) 07.09.2011 4 4
Dumith Fernando 03.08.2018 6 6
Stephen Appleyard 01.01.2019 6 4
Malinga Arsakularatne 14.07.2020 3 3
(%)
69
39
24
22
FinanceGovernanceHuman Capital
Board Activities During 2020
OtherPerformance & Strategy

86 Union Assurance PLC
CORPORATE GOVERNANCE
1.6 Board Appointments and Re-election
Board appointments follow a structured and formal process within the purview of the
Nominations Committee. Terms of Reference of the Nominations Committee and the
Committee Report can be found on page 89.
Key Considerations for Board Appointments
Skills, expertise and experience not
adequately represented at the Board.
Process followed to ensure the
selection of a candidate who possesses
the required qualities.
Skills, expertise and experience
necessary to meet the strategic vision
for the business.
Ways of enhancing Board performance.
KEY
CONSIDERATIONS
FOR BOARD
APPOINTMENTS
The details of new Directors are disclosed to the Shareholders at the time of their
appointment by way of announcement through the CSE as well as in the Annual Report. The
Directors are required to report any substantial changes in their professional responsibilities
and business associations to the Nominations Committee, which will examine the facts
and circumstances and make recommendations to the Board accordingly.
Re-election
In accordance with the Articles of Association of the Company, one third of the Directors
retire from office at each Annual General Meeting (AGM). The Directors except the
Chairman to retire, shall be those who being subject to retirement by rotation, have been
the longest in office since their last election or appointment of a retiring Director would
be eligible for re-election by the Shareholders. Any Director who has been appointed to
the Board during the year, holds office until the next AGM, and is eligible for re-election
by the Shareholders.
Appointments
Retirements
Resignations
Re-Election
Mr. Daminda Prabath Gamlath
w.e.f. 10 June 2020.
Mr. Malinga Arsakularatne
w.e.f. 14 July 2020.
Mr. Harin De Silva Wijeyeratne
w.e.f. 06.09.2020.
None
Mr. D. H. Fernando will offer himself for
re-election at the AGM to be held on 31
March 2021 in terms of Article 84 of the
Articles of Association of the Company.
Mr. W. M. Arsakularatne and
Mr. D. P. Gamlath will offer themselves
for re-election at the AGM to be held
on 31 March 2021 in terms of Article
90 of the Articles of Association of the
Company.
1.7 Board Independence
All Directors are Non-Executive,
Independent of Management of the
Company and free of business dealings
that may be perceived to interfere with
the exercise of their unfettered and
independent judgement. They submit
annual declarations to this effect which
are evaluated to ensure compliance with
criteria for determining independence in
line with regulatory requirements.

87 Annual Report 2020
Union Assurance at a Glance Management Discussion and Analysis Stewardship Financial Statements Supplementary Information
Compliance of Independent Non-Executive Directors in terms of their interest in business is as follows;
Director Employment
in the
Company
Material
Business
Relationship
Close Family
Member is
a Director or
CEO
Carrying
not Less
than 10%
of Voting
Rights
Continuously
Served for
more than
Nine Years
Business
Connection
Director/
Shareholder
in another
Entity
(A) (B) (C) (D) (E) (F) (G) and (H)
Malinga Arsakularatne Compliant Compliant Compliant Compliant Compliant Compliant Compliant
Dumith Fernando Compliant Compliant Compliant Compliant Compliant Compliant Compliant
Stephen Appleyard Compliant Compliant Compliant Compliant Compliant Compliant Compliant
(A) Has not been employed by the Company during the period of two years immediately preceding appointment as a Director.
(B) Currently has no material business relationship with the Company directly or indirectly, nor had any during the period of two years
immediately preceding appointment as a Director.
(C) Does not have any close family member/s who is a Director or CEO or Key Management Personnel in the Company.
(D) Does not have a significant shareholding in the Company (more than 10% of voting rights of the Company).
(E) Has not served on the Board of the Company for a period exceeding nine years from the date of first appointment.
(F) Self or close family member is not a Director or employee of another Company or a trustee which is materially connected to the
Company in terms of shareholding or business relationship.
(G) Not a Director of another Company in which majority of the other Directors are employed/Directors have a significant shareholding.
(H) Does not have any material business relationship or a significant shareholding in another Company in which majority of the other
Directors are employed/Directors have a significant shareholding.
Directorship Details of the Board Members
The following table illustrates the total number of Board seats held in other listed and
unlisted companies by each Director.
Name of Director Total
Number of
Directorships
No of Board seats held in
Listed Companies
No of Board
Seats Held
in Unlisted
CompaniesExecutive
Capacity
Non-
Executive
Capacity
Krishan Balendra
(Chairman) 19 1 7 11
Dumith Fernando 18 - 1 17
Stephen Appleyard - - - -
Suresh Rajendra 18 1 2 15
Malinga
Arsakularatne 15 - - 15
Daminda Gamlath 19 1 1 17
1.8 Supply of Information
The Board pack is circulated at least 7 days in advance and provides comprehensive
qualitative and quantitative information on issues to be raised at the meeting,
ensuring robust discussion, informed deliberation and effective decision making.
The Chairman ensures that all Directors are
briefed on the same by requiring the presence
of members of the Senior Management of
the Company when necessary. Directors
have independent access to the Senior
Management and unrestricted access to
organisation information and resources
to discharge their duties. They may
seek independent professional advice,
coordinated through the Company Secretary,
at the Company’s expense. The Senior
Management regularly makes presentations
and keeps the Board abreast of important
matters including strategy, regulatory
updates, risk management, etc.
1.9 Access to Independent Professional Advice
To preserve the independence of the Board
and to strengthen the decision making, the
Board is encouraged to seek independent
professional advice, in furtherance of
their duties, at the Company’s expense.
This is coordinated through the Company
Secretary, as and when requested.

88 Union Assurance PLC
CORPORATE GOVERNANCE
1.10 Board Induction and Training
Directors undergo a comprehensive
induction on appointment, where they are
apprised, inter-alia, of the Company values
and culture, its operating model, policies,
governance framework and processes,
the Code of Conduct and the operational
strategies of the Company. Additionally,
they are provided with the opportunity to
meet with Key Management Personnel,
External and Internal Auditors and visit key
areas of operations, to obtain a greater
understanding of the business.
The Board of Directors recognises the
need for continuous training, expansion
of knowledge and undertakes such
professional development as they consider
necessary in assisting them to carry out
their duties as Directors.
1.11 Board Appraisal
The annual appraisal to assess the
effectiveness of the Board was carried out
in November 2020 using a questionnaire
covering the operations of the Board and
each of its principal Committees. The
findings were tabled and discussed at the
Board meeting held on 27 January 2021.
1.12 Appraisal of the Chief Executive Officer (CEO)
The Board discusses and sets financial
and non-financial targets at the beginning
of each financial year to be achieved during
the year by the CEO, aligned to the short,
medium and long-term objectives of UA.
Performance is reviewed at the end of the
year against the backdrop of the operating
environment, and remuneration revised
based on performance.
1.13 Fair Remuneration
The Company has established a
formal and transparent procedure for
the determination of remuneration of
individual Directors. No Director is involved
in deciding his or her own remuneration.
Accordingly, the Human Resources and
Compensation Committee comprised
solely of Independent Non-Executive
Directors of the Parent Company, John
Keells Holdings PLC, functions as the
Remuneration Committee of the Company
as permitted by the Listing Rules of
the CSE.
Due care is taken to ensure that the
remuneration paid to Board members
is commensurate with their skills,
knowledge, competencies and involvement
in Board activities and in reference to fees
paid to other Non-Executive Directors
of comparable companies. The Non-
Executive Director fee was reviewed and
no changes were made during the year
2020. However, there was a temporary fee
reduction effected during the year in lieu of
the COVID-19 pandemic.
The break-up of remuneration paid to
Directors is disclosed among the other
disclosures regarding remuneration in
Note 22 of the Annual Report.
1.14 Board Sub-Committees as at 31 December 2020
The Board has delegated some of its
functions to Board Sub-Committees, while
retaining decision rights. Members of
these Sub-Committees are able to focus
on their designated areas of responsibility
and impart knowledge and oversight in
areas where they have greater expertise.
Recommendations of these Committees
are addressed directly to the Board and
minutes of meetings are tabled and
discussed at the main Board meetings.
The Board Sub Committees are as follows;
1. Board Audit and Compliance Committee
(BACC)
2. Investment Committee (IC)
3. Nominations Committee (NC)
4. Human Resources and Compensation
Committee (HRCC)
5. Related Party Transaction Review
Committee (RPTRC)
6. Project Risk Assessment Committee
(PRAC)
Board Sub Committees comprised predominantly of Independent Non-Executive Directors.
Board Committee Areas of Oversight Composition Further
Information
No of
Meetings
during 2020
Board Audit and
Compliance
Committee (BACC)
• Financial reporting
• Internal controls
• Internal & External Audits
Two Independent Non-
Executive Directors and One
Non-Executive Director.
Report of
the BACC on
page 90
6
Investment
Committee (IC)
• Review of Investment Policies
• Manage risk exposure
• Review investments
• Review performance
Deputy Chairman/Group
Finance Director of John
Keells Holdings PLC, CEO,
CFO, Chief Acturial Officer
and Head of Investments.
Report of the
IC on page 92
11
Nominations
Committee (NC)
• Appointment of Key Management Personnel
• Succession planning
• Effectiveness of the Board and its Committees
John Keells Holdings PLC’s
(Parent Company) NC acts as
the NC of UA.
Report of
the NC on
page 89
3
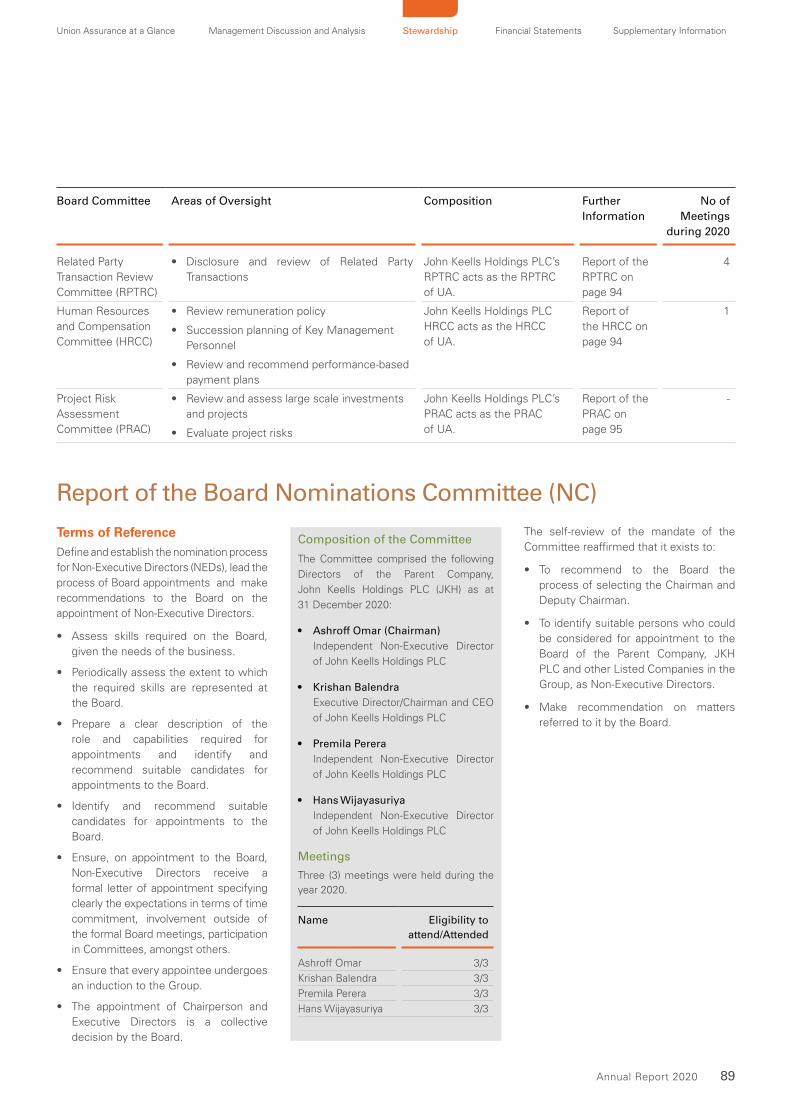
89 Annual Report 2020
Union Assurance at a Glance Management Discussion and Analysis Stewardship Financial Statements Supplementary Information
Board Committee Areas of Oversight Composition Further
Information
No of
Meetings
during 2020
Related Party
Transaction Review
Committee (RPTRC)
• Disclosure and review of Related Party
Transactions
John Keells Holdings PLC’s
RPTRC acts as the RPTRC
of UA.
Report of the
RPTRC on
page 94
4
Human Resources
and Compensation
Committee (HRCC)
• Review remuneration policy
• Succession planning of Key Management
Personnel
• Review and recommend performance-based
payment plans
John Keells Holdings PLC
HRCC acts as the HRCC
of UA.
Report of
the HRCC on
page 94
1
Project Risk
Assessment
Committee (PRAC)
• Review and assess large scale investments
and projects
• Evaluate project risks
John Keells Holdings PLC’s
PRAC acts as the PRAC
of UA.
Report of the
PRAC on
page 95
-
Report of the Board Nominations Committee (NC)
Terms of ReferenceDefine and establish the nomination process
for Non-Executive Directors (NEDs), lead the
process of Board appointments and make
recommendations to the Board on the
appointment of Non-Executive Directors.
• Assess skills required on the Board,
given the needs of the business.
• Periodically assess the extent to which
the required skills are represented at
the Board.
• Prepare a clear description of the
role and capabilities required for
appointments and identify and
recommend suitable candidates for
appointments to the Board.
• Identify and recommend suitable
candidates for appointments to the
Board.
• Ensure, on appointment to the Board,
Non-Executive Directors receive a
formal letter of appointment specifying
clearly the expectations in terms of time
commitment, involvement outside of
the formal Board meetings, participation
in Committees, amongst others.
• Ensure that every appointee undergoes
an induction to the Group.
• The appointment of Chairperson and
Executive Directors is a collective
decision by the Board.
The self-review of the mandate of the
Committee reaffirmed that it exists to:
• To recommend to the Board the
process of selecting the Chairman and
Deputy Chairman.
• To identify suitable persons who could
be considered for appointment to the
Board of the Parent Company, JKH
PLC and other Listed Companies in the
Group, as Non-Executive Directors.
• Make recommendation on matters
referred to it by the Board.
Composition of the Committee
The Committee comprised the following
Directors of the Parent Company,
John Keells Holdings PLC (JKH) as at
31 December 2020:
• Ashroff Omar (Chairman)
Independent Non-Executive Director
of John Keells Holdings PLC
• Krishan Balendra
Executive Director/Chairman and CEO
of John Keells Holdings PLC
• Premila Perera
Independent Non-Executive Director
of John Keells Holdings PLC
• Hans Wijayasuriya
Independent Non-Executive Director
of John Keells Holdings PLC
Meetings
Three (3) meetings were held during the
year 2020.
Name Eligibility to
attend/Attended
Ashroff Omar 3/3
Krishan Balendra 3/3
Premila Perera 3/3
Hans Wijayasuriya 3/3
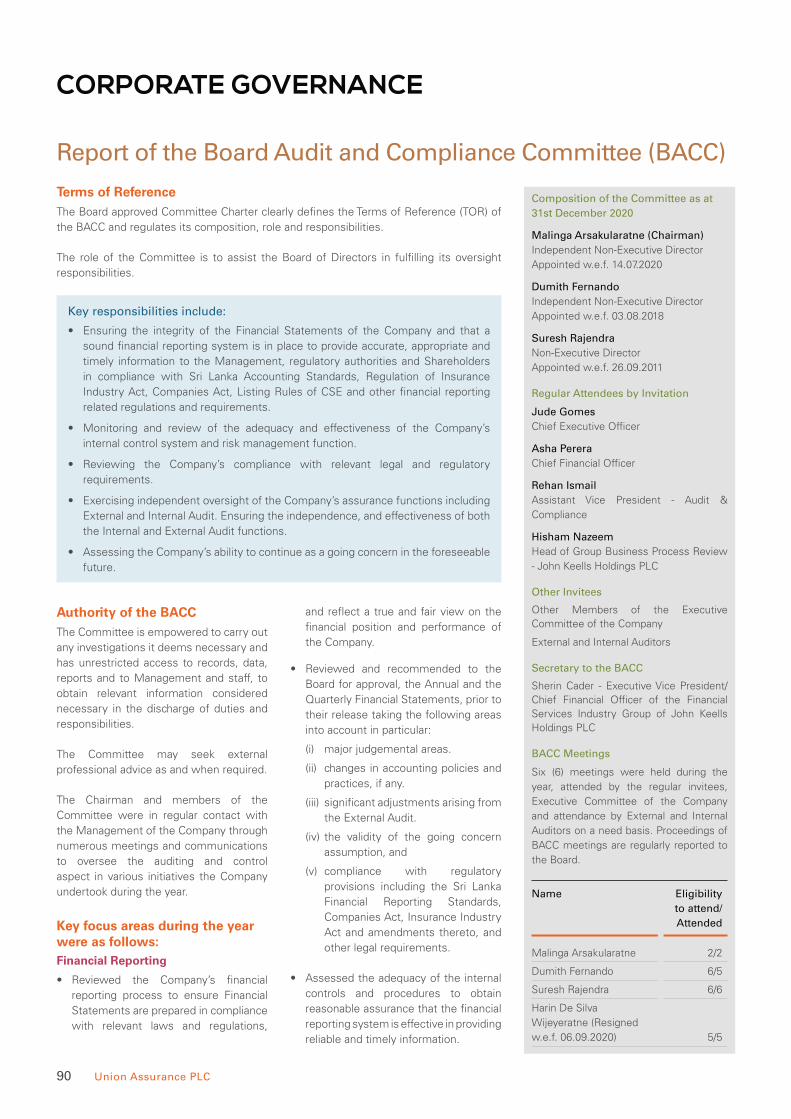
90 Union Assurance PLC
CORPORATE GOVERNANCE
Report of the Board Audit and Compliance Committee (BACC)
Terms of ReferenceThe Board approved Committee Charter clearly defines the Terms of Reference (TOR) of
the BACC and regulates its composition, role and responsibilities.
The role of the Committee is to assist the Board of Directors in fulfilling its oversight
responsibilities.
Key responsibilities include:
• Ensuring the integrity of the Financial Statements of the Company and that a
sound financial reporting system is in place to provide accurate, appropriate and
timely information to the Management, regulatory authorities and Shareholders
in compliance with Sri Lanka Accounting Standards, Regulation of Insurance
Industry Act, Companies Act, Listing Rules of CSE and other financial reporting
related regulations and requirements.
• Monitoring and review of the adequacy and effectiveness of the Company’s
internal control system and risk management function.
• Reviewing the Company’s compliance with relevant legal and regulatory
requirements.
• Exercising independent oversight of the Company’s assurance functions including
External and Internal Audit. Ensuring the independence, and effectiveness of both
the Internal and External Audit functions.
• Assessing the Company’s ability to continue as a going concern in the foreseeable
future.
Authority of the BACCThe Committee is empowered to carry out
any investigations it deems necessary and
has unrestricted access to records, data,
reports and to Management and staff, to
obtain relevant information considered
necessary in the discharge of duties and
responsibilities.
The Committee may seek external
professional advice as and when required.
The Chairman and members of the
Committee were in regular contact with
the Management of the Company through
numerous meetings and communications
to oversee the auditing and control
aspect in various initiatives the Company
undertook during the year.
Key focus areas during the year were as follows:Financial Reporting
• Reviewed the Company’s financial
reporting process to ensure Financial
Statements are prepared in compliance
with relevant laws and regulations,
and reflect a true and fair view on the
financial position and performance of
the Company.
• Reviewed and recommended to the
Board for approval, the Annual and the
Quarterly Financial Statements, prior to
their release taking the following areas
into account in particular:
(i) major judgemental areas.
(ii) changes in accounting policies and
practices, if any.
(iii) significant adjustments arising from
the External Audit.
(iv) the validity of the going concern
assumption, and
(v) compliance with regulatory
provisions including the Sri Lanka
Financial Reporting Standards,
Companies Act, Insurance Industry
Act and amendments thereto, and
other legal requirements.
• Assessed the adequacy of the internal
controls and procedures to obtain
reasonable assurance that the financial
reporting system is effective in providing
reliable and timely information.
Composition of the Committee as at
31st December 2020
Malinga Arsakularatne (Chairman)
Independent Non-Executive Director
Appointed w.e.f. 14.07.2020
Dumith Fernando
Independent Non-Executive Director
Appointed w.e.f. 03.08.2018
Suresh Rajendra
Non-Executive Director
Appointed w.e.f. 26.09.2011
Regular Attendees by Invitation
Jude Gomes
Chief Executive Officer
Asha Perera
Chief Financial Officer
Rehan Ismail
Assistant Vice President - Audit &
Compliance
Hisham Nazeem
Head of Group Business Process Review
- John Keells Holdings PLC
Other Invitees
Other Members of the Executive Committee of the Company
External and Internal Auditors
Secretary to the BACC
Sherin Cader - Executive Vice President/ Chief Financial Officer of the Financial Services Industry Group of John Keells Holdings PLC
BACC Meetings
Six (6) meetings were held during the
year, attended by the regular invitees,
Executive Committee of the Company
and attendance by External and Internal
Auditors on a need basis. Proceedings of
BACC meetings are regularly reported to
the Board.
Name Eligibility
to attend/
Attended
Malinga Arsakularatne 2/2
Dumith Fernando 6/5
Suresh Rajendra 6/6
Harin De Silva
Wijeyeratne (Resigned
w.e.f. 06.09.2020) 5/5
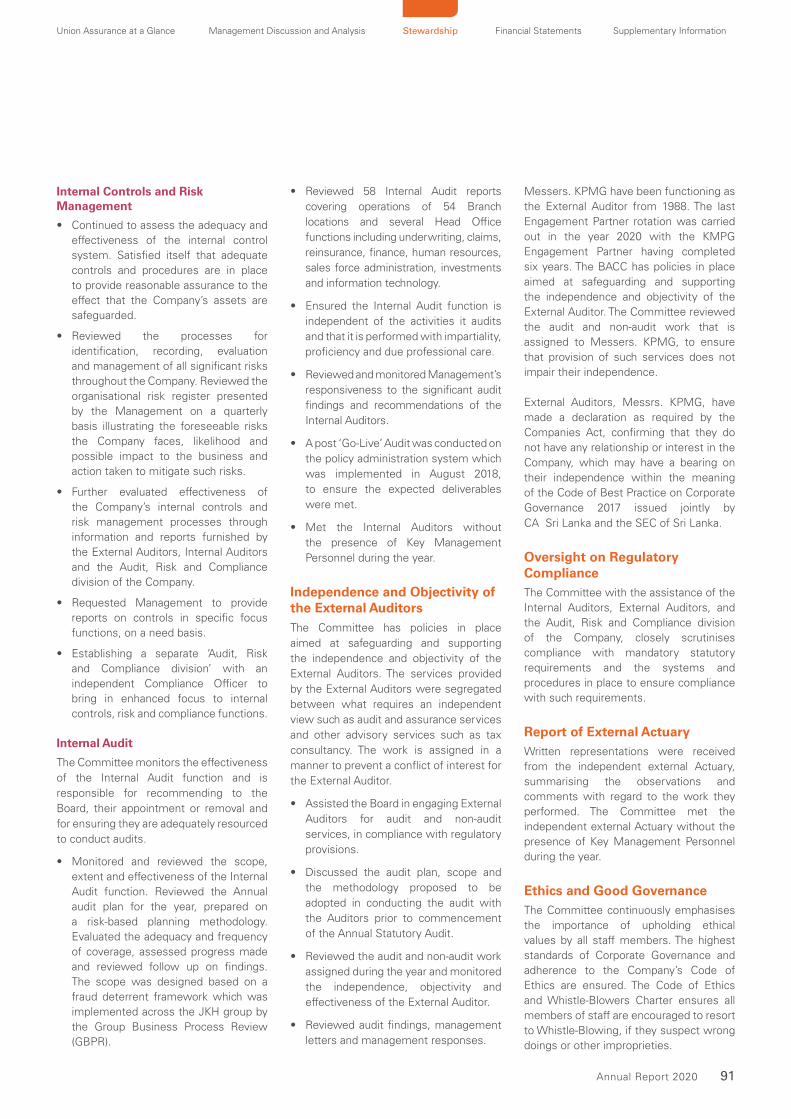
91 Annual Report 2020
Union Assurance at a Glance Management Discussion and Analysis Stewardship Financial Statements Supplementary Information
Internal Controls and Risk Management
• Continued to assess the adequacy and effectiveness of the internal control system. Satisfied itself that adequate controls and procedures are in place to provide reasonable assurance to the effect that the Company’s assets are safeguarded.
• Reviewed the processes for identification, recording, evaluation and management of all significant risks throughout the Company. Reviewed the organisational risk register presented by the Management on a quarterly basis illustrating the foreseeable risks the Company faces, likelihood and possible impact to the business and action taken to mitigate such risks.
• Further evaluated effectiveness of the Company’s internal controls and risk management processes through information and reports furnished by the External Auditors, Internal Auditors and the Audit, Risk and Compliance division of the Company.
• Requested Management to provide reports on controls in specific focus functions, on a need basis.
• Establishing a separate ‘Audit, Risk and Compliance division’ with an independent Compliance Officer to bring in enhanced focus to internal controls, risk and compliance functions.
Internal Audit
The Committee monitors the effectiveness
of the Internal Audit function and is
responsible for recommending to the
Board, their appointment or removal and
for ensuring they are adequately resourced
to conduct audits.
• Monitored and reviewed the scope, extent and effectiveness of the Internal Audit function. Reviewed the Annual audit plan for the year, prepared on a risk-based planning methodology. Evaluated the adequacy and frequency of coverage, assessed progress made and reviewed follow up on findings. The scope was designed based on a fraud deterrent framework which was implemented across the JKH group by the Group Business Process Review (GBPR).
• Reviewed 58 Internal Audit reports
covering operations of 54 Branch
locations and several Head Office
functions including underwriting, claims,
reinsurance, finance, human resources,
sales force administration, investments
and information technology.
• Ensured the Internal Audit function is
independent of the activities it audits
and that it is performed with impartiality,
proficiency and due professional care.
• Reviewed and monitored Management’s
responsiveness to the significant audit
findings and recommendations of the
Internal Auditors.
• A post ‘Go-Live’ Audit was conducted on
the policy administration system which
was implemented in August 2018,
to ensure the expected deliverables
were met.
• Met the Internal Auditors without
the presence of Key Management
Personnel during the year.
Independence and Objectivity of the External AuditorsThe Committee has policies in place
aimed at safeguarding and supporting
the independence and objectivity of the
External Auditors. The services provided
by the External Auditors were segregated
between what requires an independent
view such as audit and assurance services
and other advisory services such as tax
consultancy. The work is assigned in a
manner to prevent a conflict of interest for
the External Auditor.
• Assisted the Board in engaging External
Auditors for audit and non-audit
services, in compliance with regulatory
provisions.
• Discussed the audit plan, scope and
the methodology proposed to be
adopted in conducting the audit with
the Auditors prior to commencement
of the Annual Statutory Audit.
• Reviewed the audit and non-audit work
assigned during the year and monitored
the independence, objectivity and
effectiveness of the External Auditor.
• Reviewed audit findings, management
letters and management responses.
Messers. KPMG have been functioning as the External Auditor from 1988. The last Engagement Partner rotation was carried out in the year 2020 with the KMPG Engagement Partner having completed six years. The BACC has policies in place aimed at safeguarding and supporting the independence and objectivity of the External Auditor. The Committee reviewed the audit and non-audit work that is assigned to Messers. KPMG, to ensure that provision of such services does not impair their independence.
External Auditors, Messrs. KPMG, have made a declaration as required by the Companies Act, confirming that they do not have any relationship or interest in the Company, which may have a bearing on their independence within the meaning of the Code of Best Practice on Corporate Governance 2017 issued jointly by
CA Sri Lanka and the SEC of Sri Lanka.
Oversight on Regulatory ComplianceThe Committee with the assistance of the Internal Auditors, External Auditors, and the Audit, Risk and Compliance division of the Company, closely scrutinises compliance with mandatory statutory requirements and the systems and procedures in place to ensure compliance with such requirements.
Report of External ActuaryWritten representations were received from the independent external Actuary, summarising the observations and comments with regard to the work they performed. The Committee met the independent external Actuary without the presence of Key Management Personnel during the year.
Ethics and Good GovernanceThe Committee continuously emphasises the importance of upholding ethical values by all staff members. The highest standards of Corporate Governance and adherence to the Company’s Code of Ethics are ensured. The Code of Ethics and Whistle-Blowers Charter ensures all members of staff are encouraged to resort to Whistle-Blowing, if they suspect wrong doings or other improprieties.

92 Union Assurance PLC
CORPORATE GOVERNANCE
Report of the Board Audit and Compliance Committee (BACC)
All appropriate procedures are in place to conduct independent investigations into incidents reported through Whistle-Blowing or identified through other means. The Whistle-Blowers Charter guarantees maintenance of strict confidentiality of the identity of Whistle-Blowers. The Committee reviewed and revised the Whistle-Blowing policy during the year.
Evaluation of the CommitteeA self-evaluation exercise is conducted annually with input by each member of the Committee and in addition by the External and Internal Auditors, CEO, CFO and the Secretary of the Committee. The outcome of the evaluation was presented to the Board and was determined that the Committee was effective.
Re-Appointment of the External AuditorsThe Committee has recommended to the
Board that Messrs. KPMG be re-appointed
as auditors for the financial year ending 31
December 2021, subject to approval by the
Shareholders at the next Annual General
Meeting. The Committee recommends the
fees payable to the auditors for approval by
the Board.
ConclusionThe Committee is satisfied that internal
controls have been operating as designed
and the Company’s assets have been
adequately safeguarded during the period
under review.
The Committee is also satisfied that the
Company’s Internal and External Auditors
have been effective and independent
throughout the period. The Committee
believes that the Company’s accounting
policies are appropriate and have been
applied accurately.
Malinga Arsakularatne
Chairman
Board Audit and Compliance Committee
25 February 2021
Report of the Investment Committee (IC)
Terms of ReferenceThe Committee is guided by the Board
approved Investment Policy Statements
(IPS). The purpose of the Committee
is to assist the Board of Directors to
fulfil their responsibility to Shareholders
and Policyholders, in relation to the
Management of the investment portfolios
including the development of overall and
portfolio specific investment guidelines.
Within this framework, the Committee
performs the following duties.
• Advice on the formulation of the
investment strategy
• Review and develop broad
investment policies and guidelines for
implementation
• Provide guidance on the asset allocation
of the investment funds
• Review Funds and External Fund
Manager performance
• Manage risk exposure
• Ensure compliance with internal
investment policies and procedures,
and external investment regulations
During the year, the Committee reviewed
and updated the investment policies
and procedures to reflect changes to
applicable regulatory requirements and
market conditions.
CompositionThe Chairman of the Committee, Gihan
Cooray has extensive knowledge and
experience in the field of Accounting,
Taxation, Corporate Finance and Strategy,
Treasury and Information Technology.
He is the Deputy Chairman/Group Finance
Director of John Keells Holdings PLC and
Chairman of Nations Trust Bank PLC. He
serves as a Committee Member of the
Ceylon Chamber of Commerce.
The Committee solicits the services of
economists and other experts in related
fields to aid in the decision making
process.
Composition of the Committee
Gihan Cooray - (Chairman)
Executive Director/Deputy Chairman/Group
Finance Director - John Keells Holdings PLC
Jude Gomes
Chief Executive Officer
Asha Perera
Chief Financial Officer
Nalin Subasinghe
Chief Actuarial Officer
Angelo Keil
Head of Investment
Regular Attendees by Invitation
Sherin Cader
Executive Vice President/Chief Financial
Officer of the Financial Services Industry
Group of John Keells Holdings PLC
Aruni Fernando
Manager Middle Office
Independent Professional in the fields
of economics, risk and investment
management.
External outsourced Equity Fund
Manager
Meetings
Name Eligibility to
attend/Attended
Gihan Cooray 11/11
Jude Gomes 11/11
Asha Perera 11/11
Nalin Subasinghe 5/5
Nimesha Liyanage* 5/5
* resigned w.e.f. 03.08.2020
11 meetings were held during the year.
The minutes of the Committee
meetings are presented to the Board
of Directors along with a detailed list
of investments and their performance
during the period.

93 Annual Report 2020
Union Assurance at a Glance Management Discussion and Analysis Stewardship Financial Statements Supplementary Information
Summary of ActivitiesStrategic Planning
• Obtained independent expert advice on macroeconomic forecasts, yield curve predictions and other factors, including key macro-economic indicators such as inflation, interest rates, exchange rates and their impact on the performance of capital markets. Assigned probabilities for different macro-economic scenarios in assessment of risk and forecasting.
• Reviewed budgeted investment income and profit plan for the life fund and advised investment strategies considering the maturity profiles and risk tolerance of the respective funds.
• Reviewed and provided guidance on the interim dividend rate for Universal Life products having estimated the Universal Life Fund yield and market environment.
Policies and Guidelines
• Updated investment policies and procedures to reflect changes to regulatory requirements, market conditions and risk return profile. The investment policies were updated to widen the scope which allowed the Asset Manager to invest in new asset classes to improve returns when market interest rates continued to decline.
Asset Allocation
• Adopted an active Asset Management approach with a medium to long term perspective. Ensured all cash flows were invested efficiently, following assessment of expected yield curve movements.
• Evaluated new asset classes to optimise returns when market interest rates declined and relooked at the strategic asset allocation to optimise returns.
Performance Review
• Reviewed the performance of each fund against benchmarks and targets, including returns, duration of assets, return from equity investments, maturity analysis of fixed income securities, exposure limits and Unit Linked investment returns.
• Conducted monthly and annual performance reviews of the External Fund Manager.
Compliance
• Life fund was segregated into Par, Non-Par and Universal Life in 2019 and is currently managed independently
by considering the cash flows and the nature of liabilities of each fund.
• Regularly reviewed compliance with internal and external investment regulations, including IRCSL regulations and guidelines related to solvency and approved assets.
The following core principles of asset management continued to be adopted during the year:
1. An effective and efficient Governance structure
• UA’s investment function is driven by a Board appointed Investment Committee which comprises of the Deputy Chairman/Group Finance Director of John Keells Holdings PLC, as the Chairman of the Committee, members of the Senior Management team and Fund Management Specialists.
• Solicited external expertise to advice on the economic climate and any other specialised areas.
• Reviewed investment performance on a monthly basis, appraised investment proposals submitted by the Management and set the investment strategy.
2. Develop an investment strategy and implement policies and procedures to execute the strategy at the operational level.
• Documented Investment Policies for each of the Funds.
• Adopted suitable investment strategies, considering the prevailing economic environment and uncertainties.
3. UA has an in-house investment division which operationalises the strategies set by the Committee and monitors and controls the investment portfolio effectively and efficiently.
• UA has invested in a world class ERP system (SAP) to provide MIS support to manage its investment portfolios. The Committee is provided with information on a monthly basis. The valuations of investments are carried out automatically by the system and manual processes minimised to increase accuracy and integrity.
• A rigorous appraisal on market conditions and Issuer’s performance is conducted in the selection of investments, in addition to considering
reports from rating agencies. The Company strictly complies with regulatory requirements on Related Party Transactions. All transactions are entered into on an arm`s length basis and follows guidelines set by the Parent Company’s Related Party Transactions Review Committee.
• Implemented an online system that linked with the Custodian. The Front Office uses this system to instruct the Custodian. This created a paperless mechanism when dealing with the Custodian and this facilitated work from home for the Investment Front Office staff during the intermittent lockdown and travel restrictions due to the ongoing Pandemic.
4. Establish internal control mechanisms specifically with respect to investment activities.
• Processes were streamlined to ensure the integrity of the investment activities. Front Office, Middle Office and Back Office segregation was established and signatories and system controls structured to ensure proper work flow segregation.
• Strictly enforced Authority and dealing limits via the Manual of Financial Authority (MOFA).
5. The Middle Office function
• The Middle Office makes sure the Front Office complies with all internal limits and external regulatory requirements. Valuation of securities is carried out by the Middle Office and reported to the Investment Committee monthly. The Middle Office function is assigned under the Audit, Risk & Compliance division of the Company.
ConclusionIn view of all of the above, the Committee was satisfied with the performance of the Funds under management during the year and the policies and procedures in place for the management of the invested funds.
Gihan CoorayChairmanInvestment Committee
25 February 2021
94 Union Assurance PLC
CORPORATE GOVERNANCE
Report of the Human Resources and Compensation Committee (HRCC)
Report of the Related Party Transactions Review Committee (RPTRC)
Terms of Reference• Review and recommend overall
remuneration philosophy, strategy,
policies and practice, and performance-
based pay plans for the Group.
• Determine and agree with the Board
a framework for remuneration of
Chairman and Executive Directors
based on performance targets,
benchmark principles, performance
related pay schemes, industry trends
and past remuneration.
• Succession planning of Key
Management Personnel.
• Determining compensation of
Non-Executive Directors will not be
under the scope of this Committee.
Composition of the Committee
The Committee comprised the following
Directors of the Parent Company,
John Keells Holdings PLC (JKH) as at
31 December 2020:
• Premila Perera (Chairperson)
Independent Non-Executive Director
of John Keells Holdings PLC
Appointed w.e.f 24.07.2014
• Amal Cabraal
Independent Non-Executive Director
of John Keells Holdings PLC
Appointed w.e.f. 01.04.2014
• Nihal Fonseka
Independent Non-Executive Director
of John Keells Holdings PLC
Appointed w.e.f. 01.04.2014
Regular Attendees by Invitation
• Krishan Balendra**
Executive Director/Chairman and CEO
of John Keells Holdings PLC
• Gihan Cooray
Executive Director/Deputy Chairman/
Group Finance Director of John Keells
Holdings PLC
• Mohan Thanthirige
Group Financial Controller of John
Keells Holdings PLC
Secretary to the Committee
• Hisham Nazeem
Head of Group Business Process
Review of John Keells Holdings PLC
Meetings
Four (4) meetings were held during the year
2020.
Name Eligibility to
attend/Attended
Premila Perera 4/4
Amal Cabraal 4/4
Nihal Fonseka 4/4
**Composition of the Related Party
Transactions Review Committee was
reconstituted at the Board Meeting of John
Keells Holdings PLC held on 31 March
2020, following which Mr. K. Balendra was
released from his role in the Committee.
Mr. Balendra will attend meetings, as
required, by invitation.
As the Parent Company is also a listed
Company, the Securities and Exchange
Commission of Sri Lanka (SEC) has
permitted the Related Party Transactions
Review Committee of the Parent Company,
to represent the listed Companies in the
JKH Group, of which UA is a member.
ObjectiveTo exercise oversight on behalf of the
Board of UA in complying with the Code
on Related Party Transactions (RPTs)
issued by the Securities and Exchange
Commission of Sri Lanka (“The Code”)
and with the Listing Rules of the Colombo
Stock Exchange (CSE). The Committee
has also adopted best practices as
recommended by CA Sri Lanka and
the CSE.
FunctionsThe Committee primarily relied on
processes that were validated from time
to time and periodic reporting by the
relevant entities and Key Management
Personnel (KMP) with a view to ensuring:
• compliance with the Code;
• protection of Shareholder interests; and
• maintenance of fairness and
transparency.
The Committee reviewed and pre-
approved all proposed non recurrent RPT’s
of the Company.
Further recurrent RPTs were reviewed
annually by the Committee.
ConclusionThe activities and views of the Committee are communicated to the Board of Directors
quarterly through verbal briefings and by tabling the minutes of the Committee meetings.

95 Annual Report 2020
Union Assurance at a Glance Management Discussion and Analysis Stewardship Financial Statements Supplementary Information
The Committee was established in July
2018 with the following objectives:
Purpose• Identify, review and assess risks
associated with large-scale investments
and the mitigatory plans thereto.
• Ensure Stakeholder interests are
aligned, as applicable, in making
investment decisions.
• Where appropriate, obtain specialised
expertise from external sources to
evaluate risks, in consultation with the
Group Finance Director.
• Recommend to the Board the
necessary action required to mitigate
risks that are identified in the course
of evaluating a project, to ensure that
those risks are captured for monitoring
and mitigation.
Composition of the Committee
The Committee comprised the following
Directors of the Parent Company,
John Keells Holdings PLC (JKH) as at
31 December 2020:
• Amal Cabraal (Chairman)
Independent Non-Executive Director of
John Keells Holdings PLC
• Ashroff Omar
Independent Non-Executive Director of
John Keells Holdings PLC
• Hans Wijayasuriya
Independent Non-Executive Director of
John Keells Holdings PLC
Regular Attendees by Invitation
• Krishan Balendra
Executive Director/Chairman/CEO
of John Keells Holdings PLC (unless
Chairman/CEO or Executive Director
remuneration is under discussion)
• Gihan Cooray
Executive Director/Deputy Chairman/
Group Finance Director of John Keells
Holdings PLC (unless Executive Director
Remuneration is under discussion)
One (1) meeting was held during the year
2020.
Name Eligibility to
attend/Attended
Ashroff Omar 1/1
Amal Cabraal 1/1
Hans Wijayasuriya 1/1
Composition of the Committee
The Committee comprised the following
Directors of the Parent Company,
John Keells Holdings PLC (JKH) as at
31 December 2020:
• Hans Wijayasuriya (Chairman)
Independent Non-Executive Director of
John Keells Holdings PLC
• Premila Perera
Independent Non-Executive Director of
John Keells Holdings PLC
• Krishan Balendra
Executive Director/Chairman and CEO
of John Keells Holdings PLC
• Gihan Cooray
Executive Director/Deputy Chairman/
Group Finance Director of John Keells
Holdings PLC
The mandate requires the Committee to
comprise a minimum of four Directors,
including two Non-Executive Directors, the
Group Chairman and the Group Finance
Director.
The Committee Chairman must be a
Non-Executive Director.
Meetings
As per the Mandate, the Committee
convenes only when there is a need to
transact in business.
No meeting was held during the year 2020.
Report of the Project Risk Assessment Committee (PRAC)
96 Union Assurance PLC
CORPORATE GOVERNANCE
Directors’ Statement on Internal Controls
The following statement fulfils the requirement to publish the Directors’ statement on Internal Controls as per the Code of Corporate Governance issued jointly by CA Sri Lanka and the Securities and Exchange Commission of Sri Lanka (SEC).
The Board of Directors is responsible for the adequacy and effectiveness of the Internal Controls System of the Company. It is designed to manage the Company’s key risk areas within an acceptable risk profile. The Board has established a continuous process for identifying, evaluating and managing the significant risks faced by the Company, and this process includes enhancing the system of Internal Controls as required based on the changes to the operating environment and/or regulatory guidelines.
The Board has structured an Enterprise Risk Management (ERM) process to identify the key risks impacting the business and mitigating actions by the Management. The Company’s Management implements policies on risk and control set by the Board and are accountable to the Board for monitoring and providing assurance as to their effectiveness. The Company has commissioned PricewaterhouseCoopers (PwC), as independent Internal Auditors to ensure the effectiveness of the Internal Control Systems and several processes have been improved during the year as a result of these audit engagements. The Management assists the Board in the implementation of the Board’s policies and procedures on risk and control by identifying and assessing the risks faced, and in the design, operation and monitoring of suitable Internal Controls to mitigate and control such risks.
The Board has implemented the following actions to obtain reasonable assurance that proper systems of Internal Controls are in place;
• Delegated certain responsibilities to Board Sub-Committees where the members of these Committees have expertise to assist in discharging the Board’s duties and to improve governance.
• Maintained an effective Board Audit and Compliance Committee (BACC) and an independent Internal Auditor to review and report on the Internal Control Environment of the Company.
• The minutes of the BACC meetings are tabled at regular Board meetings. The BACC reviews and approves the Internal Audit plan for the year and the plan is structured on a matrix based on key risk areas and delivery dates. The report of the BACC provided on page 90 of the Annual Report provides details of the oversight responsibilities of the BACC performed to assist the Board.
• The Internal Auditors conducted regular reviews to ensure the effective design and implementation of Internal Controls. The reports are discussed and reviewed by the BACC and improvements to the processes have been implemented where required.
• An Audit, Risk and Compliance division was established during the year to oversee Internal Audit, Risk Management, Legal, Investment Middle Office and Compliance functions. The Head of the division functionally reports to the Board Audit and Compliance Committee with administrative reporting to the CEO. This key initiative was undertaken to strengthen the control environment of the Company and for improved governance.
• On Information Technology (IT) controls, the Board has initiated and maintained multiple mechanisms; IT system audits were carried out to ensure the integrity of financial information, data security and adequate access controls are in place with regards to processing of data. In addition to the year-end system review, the External Auditors performed a follow up on all critical IT applications/systems reviewed during the previous year.
• The Company continued to implement a bottom-up Enterprise Risk Management (ERM) process and is an ongoing process for identifying, evaluating and managing the risks faced by the Company. A summary of the key risks is updated in a risk register and reported to the BACC on a Quarterly basis. Quarterly updates also include new risks, mitigating actions and changes of risk status of previously identified risks. The process continued to be effective during the year under review.
• Policies/Charters are developed covering all functional areas of the Company and these are approved by the Board
or Board approved Committees. Such policies and Charters are reviewed and approved periodically.
• Business Continuity Plan was tested during the year under review and the BCP was updated with the support of an external consultant in the changing operating environment. The BCP was activated progressively with the objective of being ahead of the COVID-19 pandemic and was successful in implementing same throughout the year.
• BACC continued to monitor the progress of the bottom-up compliance sign off process which strengthened the control environment and provides comfort to Senior Management and Board that staff at all functions are aware and conduct business transactions as per laid down rules and procedures. This process is also verified by auditors as part of the scope of the Internal Audits.
ConclusionThe Board having implemented the above is aware that such systems are designed to manage rather than eliminate the risk of failure to achieve business objectives and can only provide reasonable and not absolute assurance against material misstatements of loss.
The Board confirms that the financial reporting system has been designed to provide reasonable assurance regarding the reliability of financial reporting and Financial Statements have been prepared in accordance with applicable accounting standards, requirements of the Companies Act No.7 of 2007, Regulation of Insurance Industry Act No. 43 of 2000 and subsequent amendments and the listing rules of the Colombo Stock Exchange.
Krishan BalendraChairman
Dumith FernandoDirector
Malinga ArsakularatneChairmanBoard Audit and Compliance Committee
25 February 2021

97 Annual Report 2020
Union Assurance at a Glance Management Discussion and Analysis Stewardship Financial Statements Supplementary Information
1.15 Corporate Senior Management Committee (CSMT)
The Board Supervisory Committee (BSC)
established during 2019 to assist the Board
of Directors (as a Board Sub-Committee)
during the period of leadership transition
of the Company, was dissolved in January
2020 and the Corporate Senior Management
Committee (CSMT) was formed with similar
terms of reference under the BSC.
The CSMT Committee is chaired by
Suresh Rajendra, Sector Head/Non-
Executive Director, and this Committee
further ensures a well devolved Executive
Committee structure.
Key focus areas include;
• Review strategies and annual
plans prior to recommendation to
the Board for approval.
• Review performance of the
Company and its business lines
to ensure Management is focused
towards achievement of plans
approved and objectives set by the
Board.
• Evaluate capital and other
expenditure which are not of a
day-to-day operational nature.
• Advise and guide the CEO and
ExCo on corporate initiatives
including IT systems, products,
and distribution channels, etc.
• Review, advise and make
recommendations on policy papers,
business plans and proposals
impacting the operations.
Key focus areas include;
• Strategic, competitor and market
analysis.
• Strategy implementation and
progress review.
• Measure and manage corporate
performance and benchmarking.
• Review of business units, key
initiatives and industry developments.
• Business development and project
risk management.
• Review of operations of functional
departments.
1.16 Executive Committee (ExCo)
Ch
ief
Exe
cuti
ve O
ffice
r
Chief Distribution Officer (CDO)
• Agency
• Group Life
• Alternate Channels
General Manager – Human Resources
• Human Resources
• Management Learning and Development
• Sales Force Administration
Chief Technical Officer (CTO)
• Underwriting
• Life Operations
• Reinsurance
• Claims
• Customer Call Centre
Chief Financial Officer (CFO)
• Financial Reporting
• Budgeting and Planning
• Finance Operations
• Logistics
• Investments
Chief Information Officer (CIO)
• Operations and Systems Support
• IT Infrastructure
• Application Development and Support
• Data Analytics
Chief Actuarial Officer (CAO)
• Pricing
• Valuations
• Actuarial Control
• Reporting and Projections
Chief Bancassurance Officer (CBO)
• Bancassurance Channel Management
• Business Partner Relationships
• Channel Specific Products
Chief Marketing Officer (CMO)
• Marketing
• Brand Management
• Special Projects
98 Union Assurance PLC
CORPORATE GOVERNANCE
Led by the CEO, the ExCo drives corporate strategy and operationalises Company policies. They are responsible for the day-to-day
operational management of the business.
In addition, the following specific Committees comprising of Senior Management personnel have been set up to manage operations of
the Company in an efficient, transparent and effective manner:
Resource Management
Committee
Objectives & Functions Composition
Capital Expenditure
(CAPEX) Committee
• Review and rationalise CAPEX (excluding IT-related
expenses)
CEO (Chair)
CFO
GM - HR
CTO
The relevant Division Head where the
CAPEX is required (without voting rights)
IT Steering Committee Review and rationalise IT-related capital and revenue expenditure
in order to:
• Improve overall productivity, efficiency and effectiveness
across distribution and service functions
• Improve quality of management information
• Provide secured and uninterrupted IT facilities
• Ensure IT resource readiness for future advancements, while
optimising the usage of existing IT resources
CIO (Chair)
All Senior Managers and Managers of the
IT division
Supplies Committee • Transparent supplier registration
• Optimise purchases and ensure quality, reliability and Value
For Money (VFM)
CFO (Chair)
CDO
GM - HR
AGM - Logistics
Staff Committee • Review cadre increases in line with expected volume growth
and required service standards. Recommend promotions
based on an annual performance appraisal process and
review any organisational requirements outside this cycle
GM - HR (Chair)
All other divisional heads
Salvage Committee • Transparent salvage process CFO (Chair)
CDO
CIO
AGM- Logistics
Complimentary Items
Committee
• Complimentary items meet expected quality and
compliance with brand criteria
• Ensure procurement as per Company policies and
procedures
CTO
CFO
CDO
AGM - Logistics
Spend Control
Steering Committee
(SCS)
• Purpose of the Committee is to manage and monitor
expenditure and cashflows, to ensure effective and efficient
utilisation of funds
CEO (Chair)
CAO
CFO
Head of Finance
Head of Investment

99 Annual Report 2020
Union Assurance at a Glance Management Discussion and Analysis Stewardship Financial Statements Supplementary Information
1.17 Company Secretary
All Directors have access to the advice and services of the Company Secretary; Keells
Consultants (Private) Limited.
The Shareholders may contact the Company Secretary, Keells Consultants (Private)
Limited on 011-2306245 at any time, for any Company related information requirements.
Key responsibilities include:
• Guiding the Board and individual Directors in the proper discharge of their duties
and responsibilities.
• Acting as a central source of guidance on matters of ethics and governance.
• Ensuring Board compliance with relevant rules and regulations.
• Keeping and maintaining minutes, registers and similar records of the Company.
• Induction of new Directors.
• Assisting the Chairman and Chief Executive Officer in determining the Annual
Board plan.
• Making necessary disclosures on Related Party Transactions required by laws and
regulations.
• Acting as a channel of communication with Shareholders to ensure a strong
relationship with Shareholders.
(B) Integrity of Operations2.0 Guideline, Audit and Assurance
Stakeholders rely on the integrity of
underlying operations for the presentation
of credible information to make decisions.
At UA, Audit and Assurance practices and
activities are monitored by the Board Audit
& Compliance Committee supported by
the Audit, Risk and Compliance division of
UA, ensuring the integrity of operations.
These include compliance with laws and
regulations (explained under External
Governance Structure – page 105)
adoption of appropriate internal policies,
implementation of systems of internal
control, adherence to a Code of Conduct,
management of conflicts of interest,
Internal Audit checks and restrictive
assurance by Independent External
Auditors.
• IT security
• Prevention of Money Laundering
and Terrorist Financing
• Anti-corruption
2.2 Systems, Controls & Assurance
Corporate Management with the
guidance of the BACC, the Audit, Risk
and Compliance division and through
Internal Audits, periodically reviews the
adequacy of internal controls for process
optimisation and efficacy. During the
year, the internal assurance process
was reviewed and further strengthened.
The key areas of process controls at UA,
include the following:
i. Compliance assurance
ii. Employee participation in assurance
iii. Financial Resource Management
iv. Fraud Risk Assessment and Internal
Audits
v. IT Governance - refer page 102
i. Compliance Assurance
Compliance Assurance is derived through
a bottom-up sign-off process. Sign off
checklists are based on internal policies
and procedure manuals covering financial
controls, regulatory compliance and
operational compliance.
The financial and operational compliance
statements are signed off and submitted
to the BACC on a quarterly basis, and
consequently reported to the JKH Group
Audit and Compliance Committee.
Regulatory sign-off is maintained on a
monthly basis.
The Audit, Risk and Compliance division
closely oversees the bottom up compliance
process of the Company and reports on
the same to the BACC. Further, the bottom
up compliance process was improved by
enhancing the content of the bottom up
compliance checklists and by automation
of compliance submissions.
2.1 Charters and Policies
Combined with laws and regulations, our
internally formulated charters and policies
define how we operate.
The Union Assurance Policy Framework
includes the following:
• Recruitment and selection
• Financial integrity and financial
authority levels
• Outside employment
• Confidentiality of information
• Use of Company property including
computers
• Harassment and non-discrimination in
the workplace
• Environmental, Health and Safety at
work
• Fraud
• Media
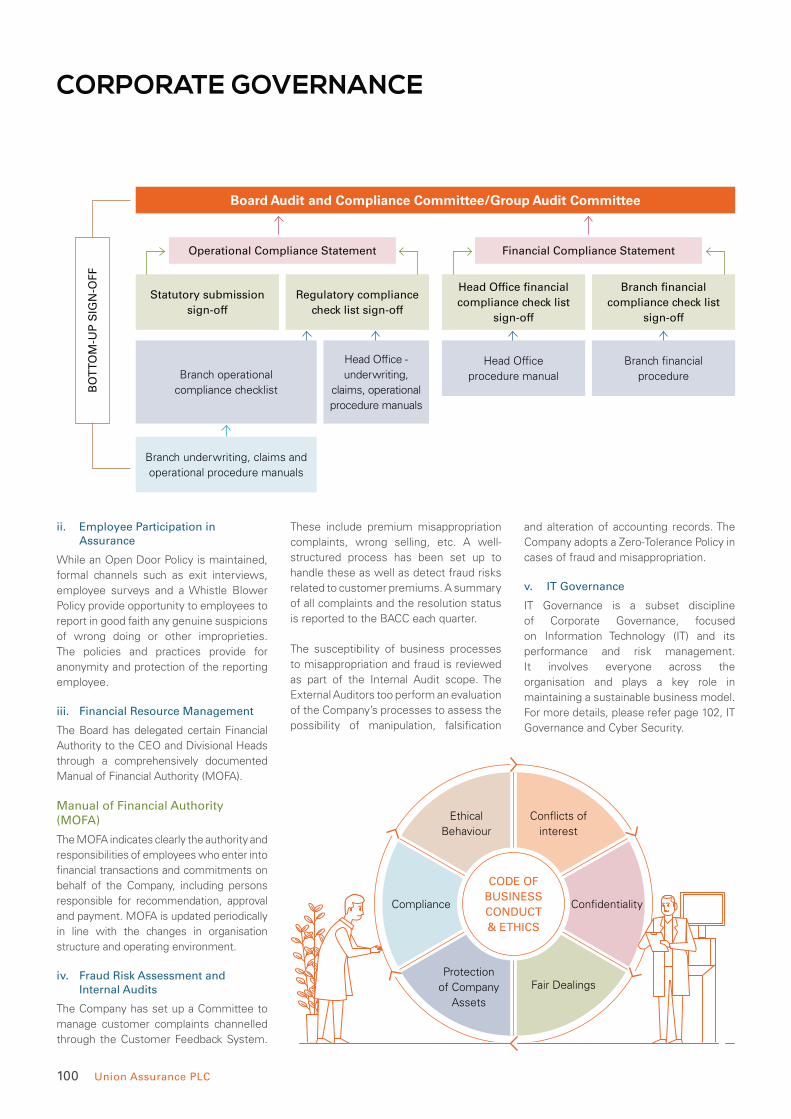
100 Union Assurance PLC
CORPORATE GOVERNANCE
Board Audit and Compliance Committee/Group Audit Committee
Operational Compliance Statement
BO
TT
OM
-UP
SIG
N-O
FF
Statutory submission
sign-off
Branch operational
compliance checklist
Branch underwriting, claims and
operational procedure manuals
Head Office financial
compliance check list
sign-off
Head Office
procedure manual
Regulatory compliance
check list sign-off
Head Office -
underwriting,
claims, operational
procedure manuals
Branch financial
compliance check list
sign-off
Branch financial
procedure
Financial Compliance Statement
ii. Employee Participation in Assurance
While an Open Door Policy is maintained,
formal channels such as exit interviews,
employee surveys and a Whistle Blower
Policy provide opportunity to employees to
report in good faith any genuine suspicions
of wrong doing or other improprieties.
The policies and practices provide for
anonymity and protection of the reporting
employee.
iii. Financial Resource Management
The Board has delegated certain Financial
Authority to the CEO and Divisional Heads
through a comprehensively documented
Manual of Financial Authority (MOFA).
Manual of Financial Authority (MOFA)
The MOFA indicates clearly the authority and
responsibilities of employees who enter into
financial transactions and commitments on
behalf of the Company, including persons
responsible for recommendation, approval
and payment. MOFA is updated periodically
in line with the changes in organisation
structure and operating environment.
iv. Fraud Risk Assessment and Internal Audits
The Company has set up a Committee to
manage customer complaints channelled
through the Customer Feedback System.
These include premium misappropriation
complaints, wrong selling, etc. A well-
structured process has been set up to
handle these as well as detect fraud risks
related to customer premiums. A summary
of all complaints and the resolution status
is reported to the BACC each quarter.
The susceptibility of business processes
to misappropriation and fraud is reviewed
as part of the Internal Audit scope. The
External Auditors too perform an evaluation
of the Company’s processes to assess the
possibility of manipulation, falsification
and alteration of accounting records. The
Company adopts a Zero-Tolerance Policy in
cases of fraud and misappropriation.
v. IT Governance
IT Governance is a subset discipline
of Corporate Governance, focused
on Information Technology (IT) and its
performance and risk management.
It involves everyone across the
organisation and plays a key role in
maintaining a sustainable business model.
For more details, please refer page 102, IT
Governance and Cyber Security.
CODE OF
BUSINESS
CONDUCT
& ETHICS
Conflicts of
interest
Ethical
Behaviour
ConfidentialityCompliance
Fair DealingsProtection
of Company
Assets
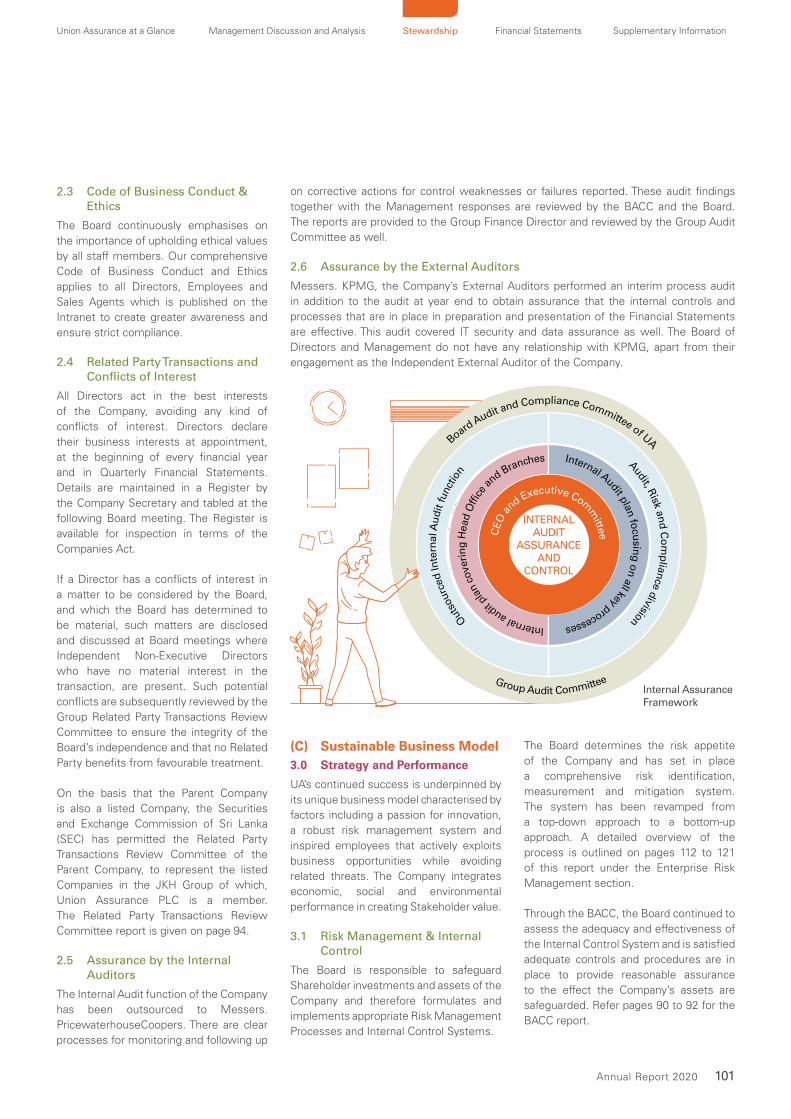
101 Annual Report 2020
Union Assurance at a Glance Management Discussion and Analysis Stewardship Financial Statements Supplementary Information
2.3 Code of Business Conduct & Ethics
The Board continuously emphasises on
the importance of upholding ethical values
by all staff members. Our comprehensive
Code of Business Conduct and Ethics
applies to all Directors, Employees and
Sales Agents which is published on the
Intranet to create greater awareness and
ensure strict compliance.
2.4 Related Party Transactions and Conflicts of Interest
All Directors act in the best interests
of the Company, avoiding any kind of
conflicts of interest. Directors declare
their business interests at appointment,
at the beginning of every financial year
and in Quarterly Financial Statements.
Details are maintained in a Register by
the Company Secretary and tabled at the
following Board meeting. The Register is
available for inspection in terms of the
Companies Act.
If a Director has a conflicts of interest in
a matter to be considered by the Board,
and which the Board has determined to
be material, such matters are disclosed
and discussed at Board meetings where
Independent Non-Executive Directors
who have no material interest in the
transaction, are present. Such potential
conflicts are subsequently reviewed by the
Group Related Party Transactions Review
Committee to ensure the integrity of the
Board’s independence and that no Related
Party benefits from favourable treatment.
On the basis that the Parent Company
is also a listed Company, the Securities
and Exchange Commission of Sri Lanka
(SEC) has permitted the Related Party
Transactions Review Committee of the
Parent Company, to represent the listed
Companies in the JKH Group of which,
Union Assurance PLC is a member.
The Related Party Transactions Review
Committee report is given on page 94.
2.5 Assurance by the Internal Auditors
The Internal Audit function of the Company
has been outsourced to Messers.
PricewaterhouseCoopers. There are clear
processes for monitoring and following up
on corrective actions for control weaknesses or failures reported. These audit findings
together with the Management responses are reviewed by the BACC and the Board.
The reports are provided to the Group Finance Director and reviewed by the Group Audit
Committee as well.
2.6 Assurance by the External Auditors
Messers. KPMG, the Company’s External Auditors performed an interim process audit
in addition to the audit at year end to obtain assurance that the internal controls and
processes that are in place in preparation and presentation of the Financial Statements
are effective. This audit covered IT security and data assurance as well. The Board of
Directors and Management do not have any relationship with KPMG, apart from their
engagement as the Independent External Auditor of the Company.
INTERNAL AUDIT
ASSURANCE AND
CONTROL
Group Audit Committee
Board Audit and Compliance Committee of UA
Out
sour
ced
Inte
rnal
Au
dit fu
nctio
n
Audit, Risk an
d C
om
plian
ce division
Internal Audit plan fo
cusin
g o
n all key processesInternal audit
plan
cov
erin
g H
ead
Offi
ce a
nd Branches
CEO
and Executive Com
mittee
Internal Assurance Framework
(C) Sustainable Business Model3.0 Strategy and Performance
UA’s continued success is underpinned by
its unique business model characterised by
factors including a passion for innovation,
a robust risk management system and
inspired employees that actively exploits
business opportunities while avoiding
related threats. The Company integrates
economic, social and environmental
performance in creating Stakeholder value.
3.1 Risk Management & Internal Control
The Board is responsible to safeguard
Shareholder investments and assets of the
Company and therefore formulates and
implements appropriate Risk Management
Processes and Internal Control Systems.
The Board determines the risk appetite
of the Company and has set in place
a comprehensive risk identification,
measurement and mitigation system.
The system has been revamped from
a top-down approach to a bottom-up
approach. A detailed overview of the
process is outlined on pages 112 to 121
of this report under the Enterprise Risk
Management section.
Through the BACC, the Board continued to
assess the adequacy and effectiveness of
the Internal Control System and is satisfied
adequate controls and procedures are in
place to provide reasonable assurance
to the effect the Company’s assets are
safeguarded. Refer pages 90 to 92 for the
BACC report.
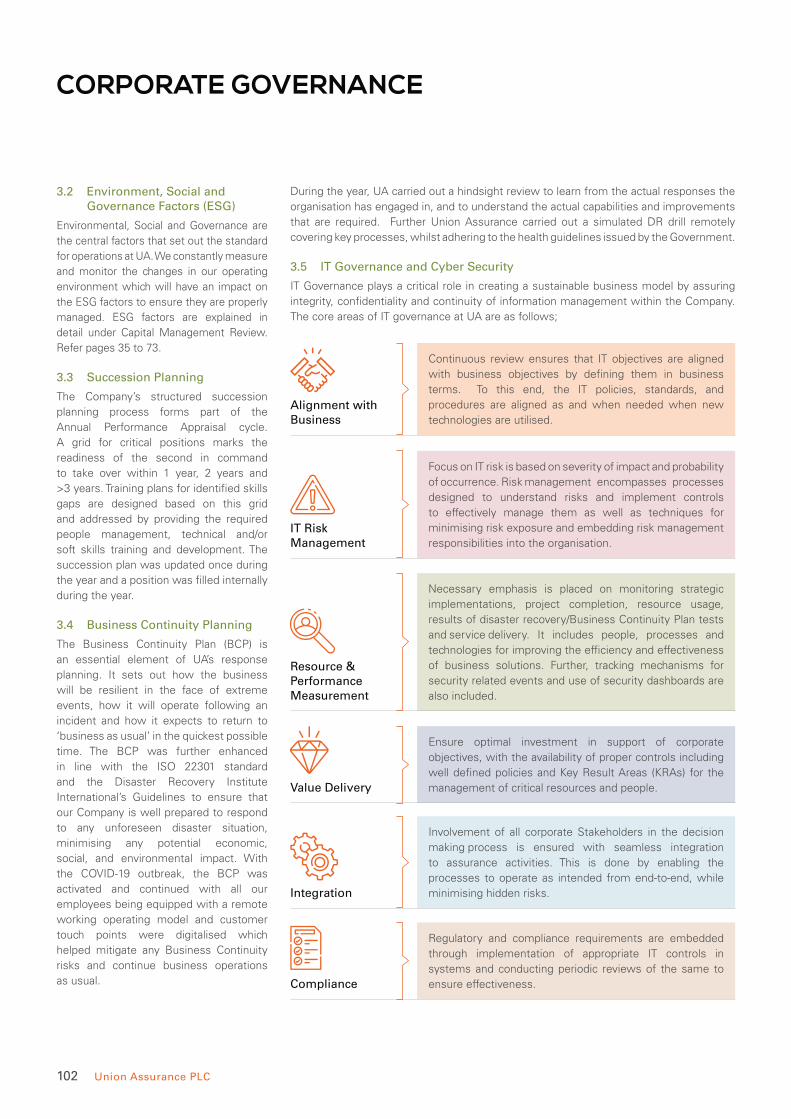
102 Union Assurance PLC
CORPORATE GOVERNANCE
3.2 Environment, Social and Governance Factors (ESG)
Environmental, Social and Governance are
the central factors that set out the standard
for operations at UA. We constantly measure
and monitor the changes in our operating
environment which will have an impact on
the ESG factors to ensure they are properly
managed. ESG factors are explained in
detail under Capital Management Review.
Refer pages 35 to 73.
3.3 Succession Planning
The Company’s structured succession
planning process forms part of the
Annual Performance Appraisal cycle.
A grid for critical positions marks the
readiness of the second in command
to take over within 1 year, 2 years and
>3 years. Training plans for identified skills
gaps are designed based on this grid
and addressed by providing the required
people management, technical and/or
soft skills training and development. The
succession plan was updated once during
the year and a position was filled internally
during the year.
3.4 Business Continuity Planning
The Business Continuity Plan (BCP) is
an essential element of UA’s response
planning. It sets out how the business
will be resilient in the face of extreme
events, how it will operate following an
incident and how it expects to return to
‘business as usual’ in the quickest possible
time. The BCP was further enhanced
in line with the ISO 22301 standard
and the Disaster Recovery Institute
International’s Guidelines to ensure that
our Company is well prepared to respond
to any unforeseen disaster situation,
minimising any potential economic,
social, and environmental impact. With
the COVID-19 outbreak, the BCP was
activated and continued with all our
employees being equipped with a remote
working operating model and customer
touch points were digitalised which
helped mitigate any Business Continuity
risks and continue business operations
as usual.
During the year, UA carried out a hindsight review to learn from the actual responses the
organisation has engaged in, and to understand the actual capabilities and improvements
that are required. Further Union Assurance carried out a simulated DR drill remotely
covering key processes, whilst adhering to the health guidelines issued by the Government.
3.5 IT Governance and Cyber Security
IT Governance plays a critical role in creating a sustainable business model by assuring
integrity, confidentiality and continuity of information management within the Company.
The core areas of IT governance at UA are as follows;
Alignment with Business
IT Risk Management
Value Delivery
Integration
Compliance
Resource & Performance Measurement
Continuous review ensures that IT objectives are aligned
with business objectives by defining them in business
terms. To this end, the IT policies, standards, and
procedures are aligned as and when needed when new
technologies are utilised.
Focus on IT risk is based on severity of impact and probability
of occurrence. Risk management encompasses processes
designed to understand risks and implement controls
to effectively manage them as well as techniques for
minimising risk exposure and embedding risk management
responsibilities into the organisation.
Ensure optimal investment in support of corporate
objectives, with the availability of proper controls including
well defined policies and Key Result Areas (KRAs) for the
management of critical resources and people.
Involvement of all corporate Stakeholders in the decision
making process is ensured with seamless integration
to assurance activities. This is done by enabling the
processes to operate as intended from end-to-end, while
minimising hidden risks.
Regulatory and compliance requirements are embedded
through implementation of appropriate IT controls in
systems and conducting periodic reviews of the same to
ensure effectiveness.
Necessary emphasis is placed on monitoring strategic
implementations, project completion, resource usage,
results of disaster recovery/Business Continuity Plan tests
and service delivery. It includes people, processes and
technologies for improving the efficiency and effectiveness
of business solutions. Further, tracking mechanisms for
security related events and use of security dashboards are
also included.
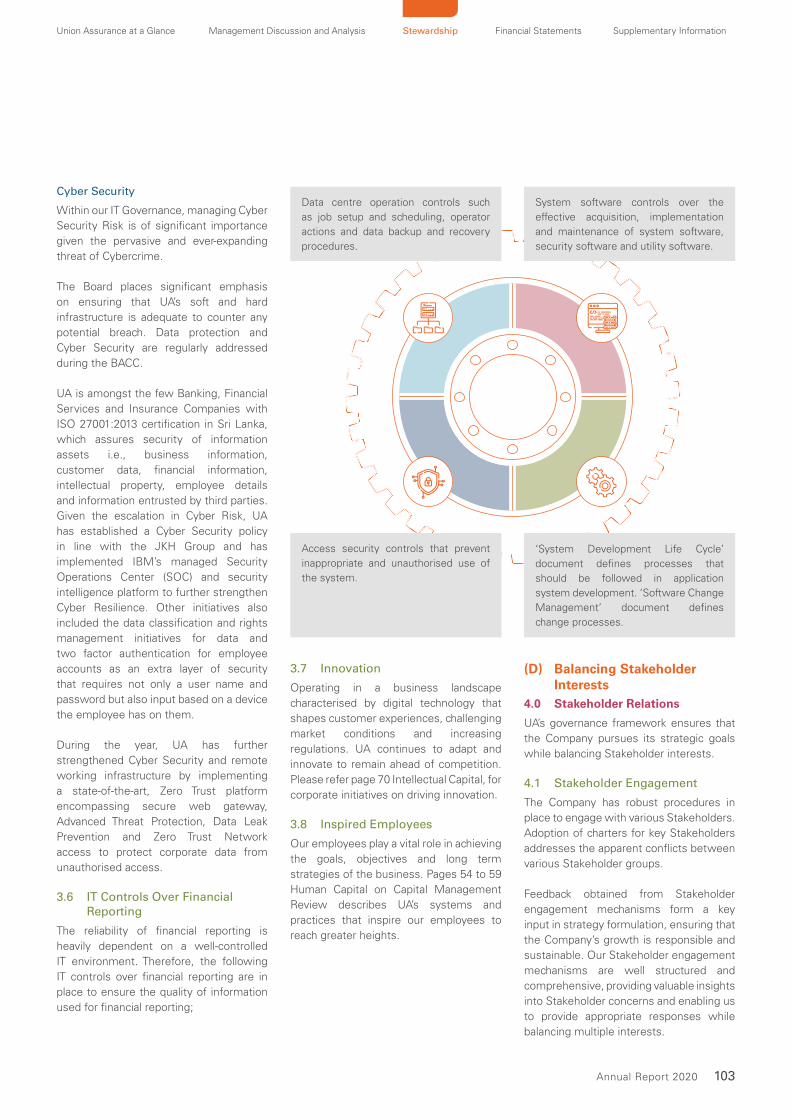
103 Annual Report 2020
Union Assurance at a Glance Management Discussion and Analysis Stewardship Financial Statements Supplementary Information
Cyber Security
Within our IT Governance, managing Cyber
Security Risk is of significant importance
given the pervasive and ever-expanding
threat of Cybercrime.
The Board places significant emphasis
on ensuring that UA’s soft and hard
infrastructure is adequate to counter any
potential breach. Data protection and
Cyber Security are regularly addressed
during the BACC.
UA is amongst the few Banking, Financial
Services and Insurance Companies with
ISO 27001:2013 certification in Sri Lanka,
which assures security of information
assets i.e., business information,
customer data, financial information,
intellectual property, employee details
and information entrusted by third parties.
Given the escalation in Cyber Risk, UA
has established a Cyber Security policy
in line with the JKH Group and has
implemented IBM’s managed Security
Operations Center (SOC) and security
intelligence platform to further strengthen
Cyber Resilience. Other initiatives also
included the data classification and rights
management initiatives for data and
two factor authentication for employee
accounts as an extra layer of security
that requires not only a user name and
password but also input based on a device
the employee has on them.
During the year, UA has further
strengthened Cyber Security and remote
working infrastructure by implementing
a state-of-the-art, Zero Trust platform
encompassing secure web gateway,
Advanced Threat Protection, Data Leak
Prevention and Zero Trust Network
access to protect corporate data from
unauthorised access.
3.6 IT Controls Over Financial Reporting
The reliability of financial reporting is
heavily dependent on a well-controlled
IT environment. Therefore, the following
IT controls over financial reporting are in
place to ensure the quality of information
used for financial reporting;
Access security controls that prevent
inappropriate and unauthorised use of
the system.
Data centre operation controls such
as job setup and scheduling, operator
actions and data backup and recovery
procedures.
System software controls over the
effective acquisition, implementation
and maintenance of system software,
security software and utility software.
‘System Development Life Cycle’
document defines processes that
should be followed in application
system development. ‘Software Change
Management’ document defines
change processes.
3.7 Innovation
Operating in a business landscape
characterised by digital technology that
shapes customer experiences, challenging
market conditions and increasing
regulations. UA continues to adapt and
innovate to remain ahead of competition.
Please refer page 70 Intellectual Capital, for
corporate initiatives on driving innovation.
3.8 Inspired Employees
Our employees play a vital role in achieving
the goals, objectives and long term
strategies of the business. Pages 54 to 59
Human Capital on Capital Management
Review describes UA’s systems and
practices that inspire our employees to
reach greater heights.
(D) Balancing Stakeholder Interests
4.0 Stakeholder Relations
UA’s governance framework ensures that
the Company pursues its strategic goals
while balancing Stakeholder interests.
4.1 Stakeholder Engagement
The Company has robust procedures in
place to engage with various Stakeholders.
Adoption of charters for key Stakeholders
addresses the apparent conflicts between
various Stakeholder groups.
Feedback obtained from Stakeholder
engagement mechanisms form a key
input in strategy formulation, ensuring that
the Company’s growth is responsible and
sustainable. Our Stakeholder engagement
mechanisms are well structured and
comprehensive, providing valuable insights
into Stakeholder concerns and enabling us
to provide appropriate responses while
balancing multiple interests.

104 Union Assurance PLC
CORPORATE GOVERNANCE
Townhall
sessions
Management
meetings/CMT
meetings/SMT
meetings
Employee
Feedback forms
UA Corporate
communication
Employee Surveys
including 360
Surveys/GPTW
surveys
UA
Portal
Coffee with CEO/
Connect with CEO/
Direct to CEO
4.2 Communication Channels
Employee Communications
UA adopts a number of effective
communications channels to ensure
every Employee is aware of its strategic
direction, policies and procedures, high
standards expected, and the corporate
values each must display in their
day-to-day interactions with external and
internal customers.
Shareholder Communications
UA used the following channels to
disseminate timely information during the
year;
• Shareholder meetings including the
Annual General Meeting (AGM)
• Integrated Annual Report
• Financial and other notices as and
when required through the Colombo
Stock Exchange
• Corporate website -
www.unionassurance.com
• Press notices
Shareholders may also contact;
• Chief Executive Officer, Union
Assurance Centre, 20, St. Michael’s
Road, Colombo 3, Sri Lanka.
• The Chairman, Union Assurance PLC,
117, Sir Chittampalam A Gardiner
Mawatha, Colombo 02.
• Investor relations Hotline on
011-2990314 or email to
4.3 The Annual General Meeting (AGM)
The Board uses the AGM to communicate
with Shareholders and encourages their
participation. The AGM provides a forum
for the Board to inform the Shareholders
of the Company’s business and how it
has performed during the year. Investors
have an opportunity to ask questions
from the Directors and to use their votes
responsibly. Notice of meeting and related
documents are circulated 15 working days
prior to the AGM. The Chairman ensures
that the Chairman of the Board Audit and
Compliance Committee, Directors, Senior
Management and representatives of the
External Auditors are available to answer
questions at the AGM, if required.
SHAREHOLDER VOTING - All Shareholders
are encouraged to participate at general
meetings and cast their votes. Each matter
is proposed as a separate resolution at
the AGM. Proxy forms are sent with the
Annual Report to Shareholders who are
unable to be physically present at the AGM
to cast their vote.
4.4 Annual and Interim Reports
These reports contain sufficient
information for investors and other
Stakeholders to carry out their own
analysis and make informed judgements
regarding the performance and position
of the Company. The Board of Directors
take reasonable steps in ensuring that
all Financial Statements are prepared in
accordance with the Sri Lanka Accounting
Standards (SLFRSs/LKASs) issued by
CA Sri Lanka and the requirements of
the CSE and other applicable authorities.
Information contained in the Financial
Statements of this Annual Report are
supplemented by a detailed discussion and
analysis which explains to Stakeholders
the strategic, operational, investment,
sustainability and risk related aspects of
the Company, and the means by which
value is created and is likely to influence
future results.
4.5 Gender Parity
UA appreciates the positive impact on
productivity and competitiveness in
engaging a gender diverse workforce.
The Company has adopted policies
that ensure equal opportunity, a safe
workplace and has implemented practices
that support female employees to fulfill
their career aspirations. The success of
these initiatives is demonstrated in the
increase in female representation to
48% of the workforce. Please refer the
HR Capital report on page 59 for polices,
practices and gender representative data.
Furthermore, female representation on
the Executive Committee stands at 33%.
Our HR policies and processes seek
to provide equal opportunity and a safe
environment, in the workplace;
• Non-Discrimination Policy
• Equality and Diversity Policy
• Grievance Management Processes
• Code of Conduct & Ethics
• Anti-Harassment Policy
• Whistle Blowing Policy
External Governance StructureExternal mechanisms are often imposed
on the Company by external Stakeholders
in the forms of relevant laws, contracts,
regulatory guidelines or best practices.
The Company is governed by mandatory
rules and regulations and voluntary
adoption of codes of best practice.
CHARTERS
Co
mm
un
ity
Cu
sto
me
rs
Em
plo
yee
s
Env
iro
nm
en
t
Sh
are
ho
lde
rs
105 Annual Report 2020
Union Assurance at a Glance Management Discussion and Analysis Stewardship Financial Statements Supplementary Information
(E) Compliance5.0 Regulatory Framework
The Company is compliant with all relevant statutory and regulatory requirements. UA has checks and controls in place to ensure it
complies with all laws, rules and regulations that govern the Company.
5.1 Compliance Framework and Self-Regulation Checklists
A statutory submission checklist is signed off on a monthly basis by persons responsible for ensuring compliance with such requirements.
Changes to regulations are updated in the checklist on a regular basis with relevant evidence of compliance. This is a proactive measure to
ensure that no violations take place. Any deviations detected are reported to the BACC with the quarterly compliance sign-off. Similarly,
a regulatory compliance checklist is signed off on a quarterly basis by the respective head of department.
5.2 Statutory and Regulatory Compliance
Requirement Compliance
As required by the IRCSL, the Company
submits compliance Certificate (A) and (B)
to IRCSL on a quarterly basis signed off by
the Chief Executive Officer (in his capacity
as the Company’s Principal Officer (PO) and
the CFO on behalf of the Board of Directors
of the Company.
Compliance Certificate A - Certifies that the Company has;
• Complied with all provisions in the Regulation of Insurance Industry (RII) Act No.43 of
2000, rules, regulations, determinations, directions issued by IRCSL; Complied with all
orders made by the Ministry of Finance and Planning under the RII Act, No.43 of 2000,
• Complied with terms and conditions pertaining to reinsurance placements issued by
IRCSL in terms of section 31(1) of the RII Act, No. 43 of 2000,
• Complied with conditions pertaining to co-insurance issued by IRCSL and complied
with all applicable circulars issued by IRCSL
Compliance Certificate B - Certifies that the Company has;
• Complied with all applicable provisions in the Financial Transactions Reporting Act
No 6 of 2006
• Complied with rules on Know Your Customer (KYC) and Customer Due Diligence (CDD)
for the Insurance Industry issued by the Financial Intelligence Unit established under
the Financial Transactions Reporting Act, No. 6 of 2006
• Complied with guidelines on Anti Money Laundering Programme for Insurers issued
by IRCSL.
Compliance with Regulations governing
Investments
The Life fund is adequately backed by ‘approved investments’ as per Section 25 (1) of the
RII Act and subsequent determinations.
Ability to Meet Policyholder Obligations An Insurance Company’s ability to meet its obligations to policyholders is measured by
the Capital Adequacy Ratio (CAR). CAR reflects UA’s Total Available Capital (TAC) as against
Risk Capital required at a particular date. The CAR as of 31st December 2020 is 341% and
the minimum regulatory requirement is 120%.
Actuarial Valuation of Insurance Liabilities Life Insurance liabilities have been validated by an independent External Actuary in
accordance with the RII Act. Refer Actuarial Report on page 131.
Re-Insurance Arrangements The IRCSL has stipulated that Insurance Companies must enter into reinsurance
arrangements with companies which at a minimum having a rating of BBB. As per details
on page 116 all of our re-insurance arrangements are with companies that have been
assigned at the minimum an ‘A+‘rating by international rating agencies.
Capital Structure As at 31 December 2020 the Company’s stated capital of Rs. 1,000 Mn, exceeds the
minimum share capital requirement set by the IRCSL for a Life Insurance Company of
Rs. 500 Mn.
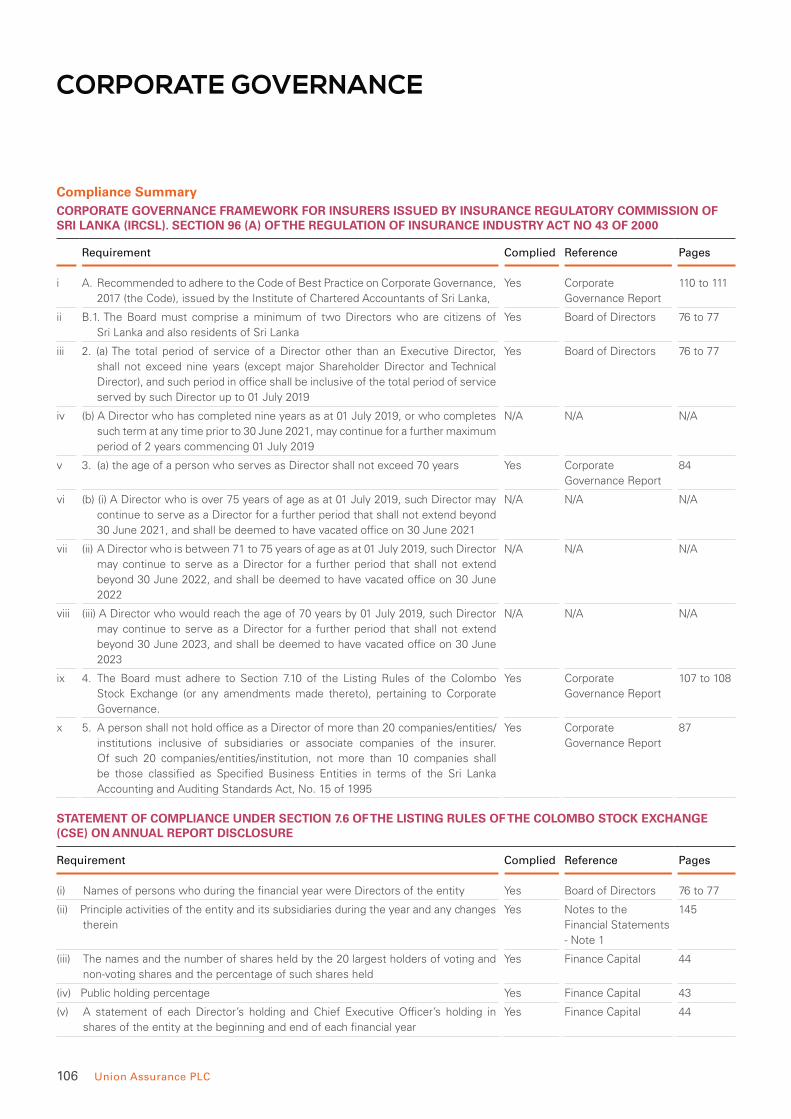
106 Union Assurance PLC
CORPORATE GOVERNANCE
Compliance SummaryCORPORATE GOVERNANCE FRAMEWORK FOR INSURERS ISSUED BY INSURANCE REGULATORY COMMISSION OF SRI LANKA (IRCSL). SECTION 96 (A) OF THE REGULATION OF INSURANCE INDUSTRY ACT NO 43 OF 2000
Requirement Complied Reference Pages
i A. Recommended to adhere to the Code of Best Practice on Corporate Governance,
2017 (the Code), issued by the Institute of Chartered Accountants of Sri Lanka,
Yes Corporate
Governance Report
110 to 111
ii B.1. The Board must comprise a minimum of two Directors who are citizens of
Sri Lanka and also residents of Sri Lanka
Yes Board of Directors 76 to 77
iii 2. (a) The total period of service of a Director other than an Executive Director,
shall not exceed nine years (except major Shareholder Director and Technical
Director), and such period in office shall be inclusive of the total period of service
served by such Director up to 01 July 2019
Yes Board of Directors 76 to 77
iv (b) A Director who has completed nine years as at 01 July 2019, or who completes
such term at any time prior to 30 June 2021, may continue for a further maximum
period of 2 years commencing 01 July 2019
N/A N/A N/A
v 3. (a) the age of a person who serves as Director shall not exceed 70 years Yes Corporate
Governance Report
84
vi (b) (i) A Director who is over 75 years of age as at 01 July 2019, such Director may
continue to serve as a Director for a further period that shall not extend beyond
30 June 2021, and shall be deemed to have vacated office on 30 June 2021
N/A N/A N/A
vii (ii) A Director who is between 71 to 75 years of age as at 01 July 2019, such Director
may continue to serve as a Director for a further period that shall not extend
beyond 30 June 2022, and shall be deemed to have vacated office on 30 June
2022
N/A N/A N/A
viii (iii) A Director who would reach the age of 70 years by 01 July 2019, such Director
may continue to serve as a Director for a further period that shall not extend
beyond 30 June 2023, and shall be deemed to have vacated office on 30 June
2023
N/A N/A N/A
ix 4. The Board must adhere to Section 7.10 of the Listing Rules of the Colombo
Stock Exchange (or any amendments made thereto), pertaining to Corporate
Governance.
Yes Corporate
Governance Report
107 to 108
x 5. A person shall not hold office as a Director of more than 20 companies/entities/
institutions inclusive of subsidiaries or associate companies of the insurer.
Of such 20 companies/entities/institution, not more than 10 companies shall
be those classified as Specified Business Entities in terms of the Sri Lanka
Accounting and Auditing Standards Act, No. 15 of 1995
Yes Corporate
Governance Report
87
STATEMENT OF COMPLIANCE UNDER SECTION 7.6 OF THE LISTING RULES OF THE COLOMBO STOCK EXCHANGE (CSE) ON ANNUAL REPORT DISCLOSURE
Requirement Complied Reference Pages
(i) Names of persons who during the financial year were Directors of the entity Yes Board of Directors 76 to 77
(ii) Principle activities of the entity and its subsidiaries during the year and any changes
therein
Yes Notes to the
Financial Statements
- Note 1
145
(iii) The names and the number of shares held by the 20 largest holders of voting and
non-voting shares and the percentage of such shares held
Yes Finance Capital 44
(iv) Public holding percentage Yes Finance Capital 43
(v) A statement of each Director’s holding and Chief Executive Officer’s holding in
shares of the entity at the beginning and end of each financial year
Yes Finance Capital 44
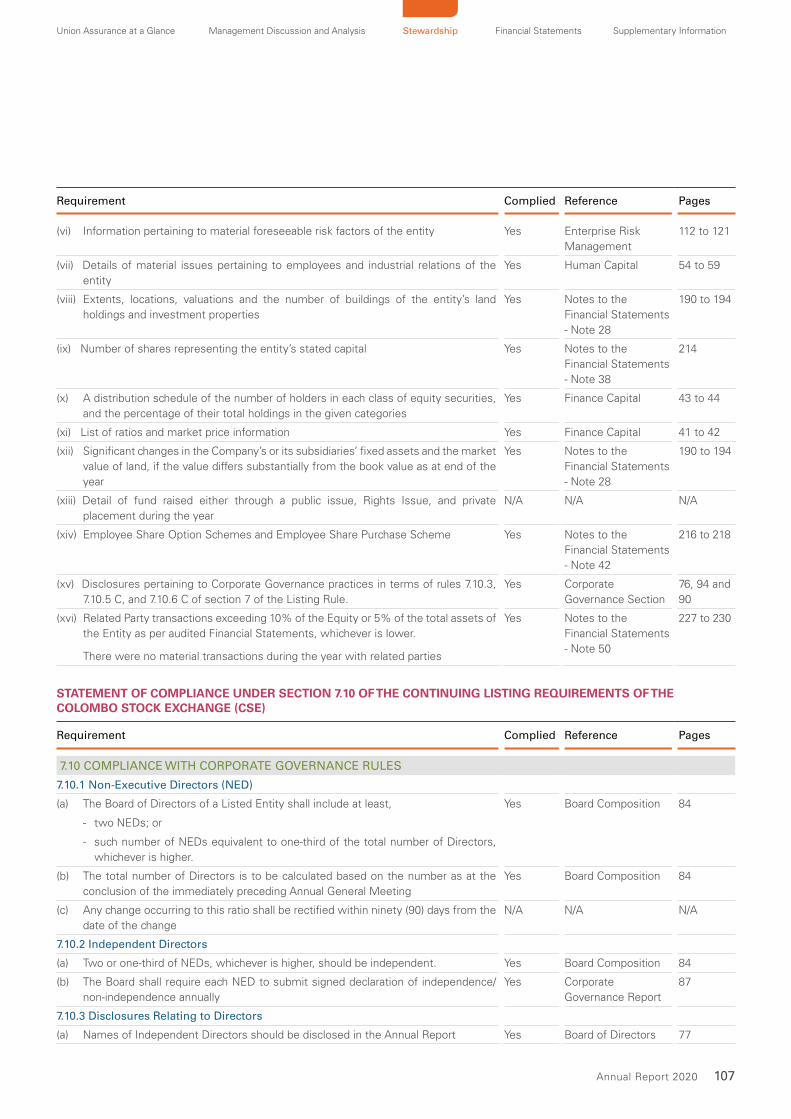
107 Annual Report 2020
Union Assurance at a Glance Management Discussion and Analysis Stewardship Financial Statements Supplementary Information
Requirement Complied Reference Pages
(vi) Information pertaining to material foreseeable risk factors of the entity Yes Enterprise Risk
Management
112 to 121
(vii) Details of material issues pertaining to employees and industrial relations of the
entity
Yes Human Capital 54 to 59
(viii) Extents, locations, valuations and the number of buildings of the entity’s land
holdings and investment properties
Yes Notes to the
Financial Statements
- Note 28
190 to 194
(ix) Number of shares representing the entity’s stated capital Yes Notes to the
Financial Statements
- Note 38
214
(x) A distribution schedule of the number of holders in each class of equity securities,
and the percentage of their total holdings in the given categories
Yes Finance Capital 43 to 44
(xi) List of ratios and market price information Yes Finance Capital 41 to 42
(xii) Significant changes in the Company’s or its subsidiaries’ fixed assets and the market
value of land, if the value differs substantially from the book value as at end of the
year
Yes Notes to the
Financial Statements
- Note 28
190 to 194
(xiii) Detail of fund raised either through a public issue, Rights Issue, and private
placement during the year
N/A N/A N/A
(xiv) Employee Share Option Schemes and Employee Share Purchase Scheme Yes Notes to the
Financial Statements
- Note 42
216 to 218
(xv) Disclosures pertaining to Corporate Governance practices in terms of rules 7.10.3,
7.10.5 C, and 7.10.6 C of section 7 of the Listing Rule.
Yes Corporate
Governance Section
76, 94 and
90
(xvi) Related Party transactions exceeding 10% of the Equity or 5% of the total assets of
the Entity as per audited Financial Statements, whichever is lower.
There were no material transactions during the year with related parties
Yes Notes to the
Financial Statements
- Note 50
227 to 230
STATEMENT OF COMPLIANCE UNDER SECTION 7.10 OF THE CONTINUING LISTING REQUIREMENTS OF THE COLOMBO STOCK EXCHANGE (CSE)
Requirement Complied Reference Pages
7.10 COMPLIANCE WITH CORPORATE GOVERNANCE RULES
7.10.1 Non-Executive Directors (NED)
(a) The Board of Directors of a Listed Entity shall include at least,
- two NEDs; or
- such number of NEDs equivalent to one-third of the total number of Directors,
whichever is higher.
Yes Board Composition 84
(b) The total number of Directors is to be calculated based on the number as at the
conclusion of the immediately preceding Annual General Meeting
Yes Board Composition 84
(c) Any change occurring to this ratio shall be rectified within ninety (90) days from the
date of the change
N/A N/A N/A
7.10.2 Independent Directors
(a) Two or one-third of NEDs, whichever is higher, should be independent. Yes Board Composition 84
(b) The Board shall require each NED to submit signed declaration of independence/
non-independence annually
Yes Corporate
Governance Report
87
7.10.3 Disclosures Relating to Directors
(a) Names of Independent Directors should be disclosed in the Annual Report Yes Board of Directors 77

108 Union Assurance PLC
CORPORATE GOVERNANCE
Requirement Complied Reference Pages
(b) In the event a Director does not qualify as independent as per the rules on Corporate
Governance but if the Board is of the opinion that the Director is nevertheless
independent, it shall specify the basis of the determination in the Annual Report
N/A N/A N/A
(c) A brief resume of each Director should be published in the annual report including
the areas of expertise
Yes Board of Directors 76 to 77
(d) A brief resume of any new Director appointed to the Board should be provided to
the Exchange for dissemination to the public
Yes Board of Directors 77
7.10.4 Criteria for Defining Independence
(a to h) Requirements for meeting the criteria to be an Independent Director Yes Corporate
Governance
86 to 87
7.10.5 Human Resources and Compensation Committee (HRCC)
A Listed Entity shall have a HRCC Yes HRCC Report 94
(a) The remuneration Committee shall comprise of NEDs a majority of whom shall be
independent
Yes HRCC Report 95
(b) Functions of the HRCC shall be to recommend the remuneration of the CEO and
the Executive Directors
Yes HRCC Report 94
(c) The Annual Report shall set out: The names of the Directors that comprise the
HRCC.
A Statement of Remuneration Policy. Aggregate remuneration paid to Executive
and Non-Executive Directors.
Yes HRCC Report
Notes to the
Financial Statements
- Note 22
95
181
7.10.6 (A) Composition and role of the Audit Committee
7.10.6 A listed Company shall have an Audit Committee Yes BACC Report 90
(a) The Audit Committee shall comprise Non-Executive Directors a majority of whom
shall be independent
The Chairman or one member of the Committee should be a member of a
recognised professional accounting body
Yes BACC Report
Board of Directors
90
77
7.10.6 (B) Audit Committee - Functions
(b) The functions of the Audit Committee shall include;
Overseeing of the preparation, presentation and adequacy of disclosures in the
Financial Statements in accordance with Sri Lanka Accounting Standards,
Overseeing the compliance with financial reporting and information requirements
as per laws and regulations,
Overseeing the process to ensuring the internal controls and risk management are
adequate to meet the requirements of the Sri Lanka Auditing Standards,
Assessing of the independence and performance of the External auditors, and
Make recommendations to the Board pertaining to appointment, re-appointment
and removal of External Auditors and to approve the remuneration and terms of
engagement of the External auditors.
Yes BACC Report 90 to 92
(c) The Annual Report shall set out; the names of the Directors who comprise the Audit
Committee
The Audit Committee shall make a determination of the independence of the
External Auditors and disclose the basis for such determination.
A report by the Audit Committee setting-out the manner of compliance of the
functions set out in above, during the period to which the annual report relates.
Yes BACC Report 90 to 92

109 Annual Report 2020
Union Assurance at a Glance Management Discussion and Analysis Stewardship Financial Statements Supplementary Information
STATEMENT OF COMPLIANCE UNDER CODE OF BEST PRACTICE ON RELATED PARTY TRANSACTIONS (2013) ADVOCATED BY THE SECURITIES AND EXCHANGE COMMISSION OF SRI LANKA (SEC)
Requirement Complied Reference Pages
(a) Details pertaining to Non-Recurrent Related Party Transactions Yes Notes to the
Financial Statements
- Note 50
227
(b) Details pertaining to Recurrent Related Party Transactions Yes
(c ) Report of the Related Party Transactions Review Committee Yes RPTRC Report 94
(d) Declaration by the Board of Directors as an affirmative statement of compliance
with the rules pertaining to Related Party Transactions, or a negative statement
otherwise
Yes Corporate
Governance Report
101
CONTENT OF THE ANNUAL REPORT AS PER SECTION 168 OF THE COMPANIES ACT NO. 7 OF 2007
Rule Complied Reference Pages
168 (1) (a) The nature of the business together with any change thereof Yes Notes to the
Financial Statements
- Note 1
145
168 (1) (b) Signed Financial Statements of the Company Yes Financial statements 138 to 231
168 (1) (c) Auditors’ Report on Financial Statements Yes Independent
Auditors’ Report
133 to 136
168 (1) (d) Accounting policies and any changes therein Yes Notes to the
Financial Statements
145 to 231
168 (1) (e) Particulars of the entries made in the Interests Register Yes Annual Report of the
Board of Directors
on the affairs of the
Company
127
168 (1) (f) Remuneration and other benefits paid to Directors of the Company Yes Notes to the
Financial Statements
- Note 22
181
168 (1) (g) Corporate donations made by the Company Yes Annual Report of the
Board of Directors
on the affairs of the
Company
128
168 (1) (h) Information on Directorate of the Company at the end of the accounting
period
Yes Board of Directors 76 to 77
168 (1) (i) Amounts paid/payable to the External Auditor as audit fees and fees for other
services rendered
Yes Notes to the
Financial Statements
- Note 22
181
168 (1) (j) Auditors’ relationship or any interest with the Company Yes BACC Report 91
168 (1) (k) Acknowledgement of the contents of this Report and signatures on behalf
of the Board
Yes Annual Report of the
Board of Directors
on the affairs of the
Company
125 to 129
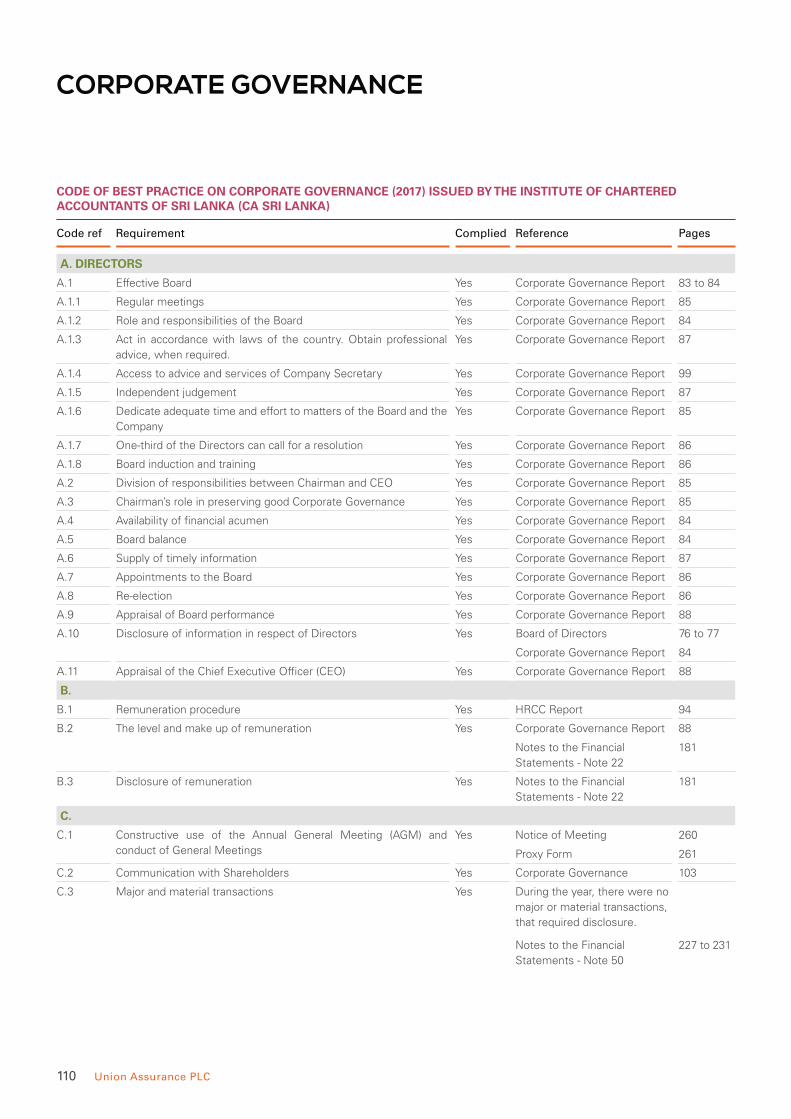
110 Union Assurance PLC
CORPORATE GOVERNANCE
CODE OF BEST PRACTICE ON CORPORATE GOVERNANCE (2017) ISSUED BY THE INSTITUTE OF CHARTERED ACCOUNTANTS OF SRI LANKA (CA SRI LANKA)
Code ref Requirement Complied Reference Pages
A. DIRECTORS
A.1 Effective Board Yes Corporate Governance Report 83 to 84
A.1.1 Regular meetings Yes Corporate Governance Report 85
A.1.2 Role and responsibilities of the Board Yes Corporate Governance Report 84
A.1.3 Act in accordance with laws of the country. Obtain professional
advice, when required.
Yes Corporate Governance Report 87
A.1.4 Access to advice and services of Company Secretary Yes Corporate Governance Report 99
A.1.5 Independent judgement Yes Corporate Governance Report 87
A.1.6 Dedicate adequate time and effort to matters of the Board and the
Company
Yes Corporate Governance Report 85
A.1.7 One-third of the Directors can call for a resolution Yes Corporate Governance Report 86
A.1.8 Board induction and training Yes Corporate Governance Report 86
A.2 Division of responsibilities between Chairman and CEO Yes Corporate Governance Report 85
A.3 Chairman’s role in preserving good Corporate Governance Yes Corporate Governance Report 85
A.4 Availability of financial acumen Yes Corporate Governance Report 84
A.5 Board balance Yes Corporate Governance Report 84
A.6 Supply of timely information Yes Corporate Governance Report 87
A.7 Appointments to the Board Yes Corporate Governance Report 86
A.8 Re-election Yes Corporate Governance Report 86
A.9 Appraisal of Board performance Yes Corporate Governance Report 88
A.10 Disclosure of information in respect of Directors Yes Board of Directors
Corporate Governance Report
76 to 77
84
A.11 Appraisal of the Chief Executive Officer (CEO) Yes Corporate Governance Report 88
B.
B.1 Remuneration procedure Yes HRCC Report 94
B.2 The level and make up of remuneration Yes Corporate Governance Report
Notes to the Financial
Statements - Note 22
88
181
B.3 Disclosure of remuneration Yes Notes to the Financial
Statements - Note 22
181
C.
C.1 Constructive use of the Annual General Meeting (AGM) and
conduct of General Meetings
Yes Notice of Meeting
Proxy Form
260
261
C.2 Communication with Shareholders Yes Corporate Governance 103
C.3 Major and material transactions Yes During the year, there were no
major or material transactions,
that required disclosure.
Notes to the Financial
Statements - Note 50
227 to 231
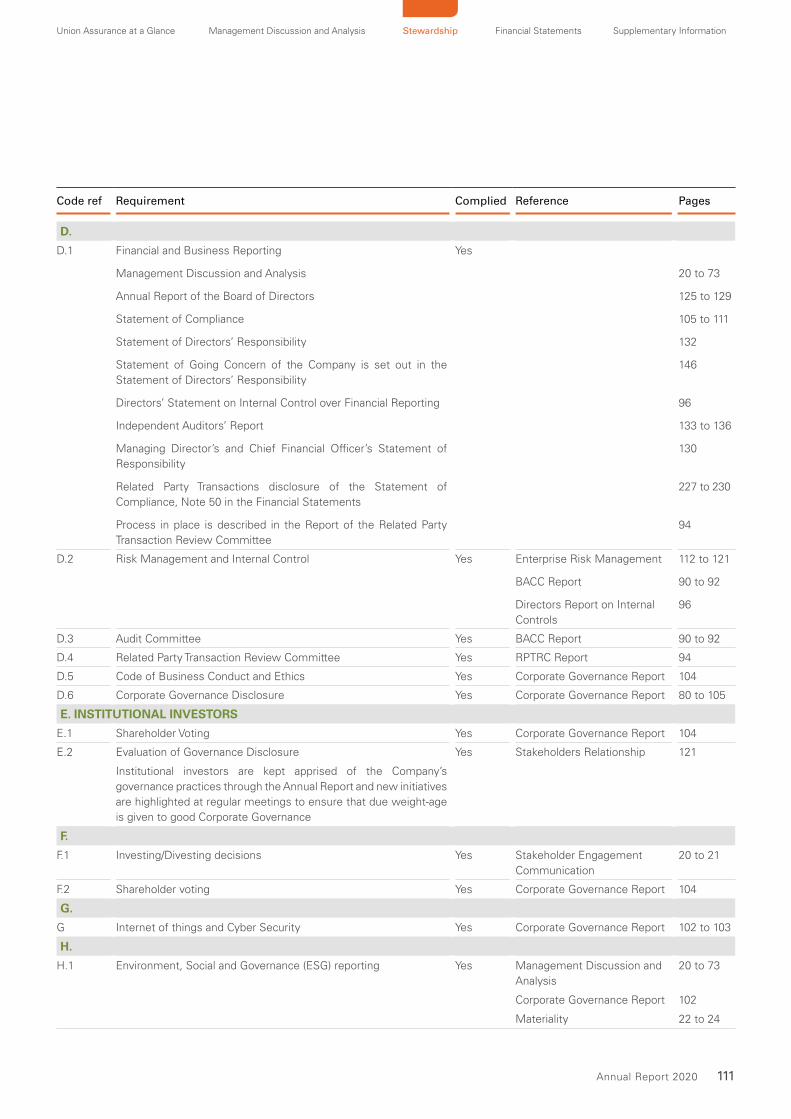
111 Annual Report 2020
Union Assurance at a Glance Management Discussion and Analysis Stewardship Financial Statements Supplementary Information
Code ref Requirement Complied Reference Pages
D.
D.1 Financial and Business Reporting
Management Discussion and Analysis
Annual Report of the Board of Directors
Statement of Compliance
Statement of Directors’ Responsibility
Statement of Going Concern of the Company is set out in the
Statement of Directors’ Responsibility
Directors’ Statement on Internal Control over Financial Reporting
Independent Auditors’ Report
Managing Director’s and Chief Financial Officer’s Statement of
Responsibility
Related Party Transactions disclosure of the Statement of
Compliance, Note 50 in the Financial Statements
Process in place is described in the Report of the Related Party
Transaction Review Committee
Yes
20 to 73
125 to 129
105 to 111
132
146
96
133 to 136
130
227 to 230
94
D.2 Risk Management and Internal Control Yes Enterprise Risk Management
BACC Report
Directors Report on Internal
Controls
112 to 121
90 to 92
96
D.3 Audit Committee Yes BACC Report 90 to 92
D.4 Related Party Transaction Review Committee Yes RPTRC Report 94
D.5 Code of Business Conduct and Ethics Yes Corporate Governance Report 104
D.6 Corporate Governance Disclosure Yes Corporate Governance Report 80 to 105
E. INSTITUTIONAL INVESTORS
E.1 Shareholder Voting Yes Corporate Governance Report 104
E.2 Evaluation of Governance Disclosure
Institutional investors are kept apprised of the Company’s
governance practices through the Annual Report and new initiatives
are highlighted at regular meetings to ensure that due weight-age
is given to good Corporate Governance
Yes Stakeholders Relationship 121
F.
F.1 Investing/Divesting decisions Yes Stakeholder Engagement
Communication
20 to 21
F.2 Shareholder voting Yes Corporate Governance Report 104
G.
G Internet of things and Cyber Security Yes Corporate Governance Report 102 to 103
H.
H.1 Environment, Social and Governance (ESG) reporting Yes Management Discussion and
Analysis
Corporate Governance Report
Materiality
20 to 73
102
22 to 24
112 Union Assurance PLC
ENTERPRISE RISK MANAGEMENTEnterprise Risk Management (ERM) is fundamental to our strategy and how we do business. UA has a sound Risk Management Framework that ensures risks are managed in a consistent way across the Company with appropriate oversight and accountability.
Risk Management Highlights 2020• Establishing a separate Audit, Risk & Compliance division to bring in enhanced
focus to internal controls, risk and compliance functions
• Updates to the Company Risk Register to accommodate changes in the operating
environment
• Maintenance of ISO 27001:2013 certification
• Enhanced the Business Continuity Plan to accommodate the changes in the
operating environment and respond to any unforeseen events
• Strategic partnership with an External Fund Manager to manage the equity
portfolio of the Company
Risk PolicyUA’s Risk Policy specifies the
Company’s risk tolerance, risk
limits and authorities, reporting
requirements, procedures to approve
any exceptions & procedures for
referring risk issues to the Board
Audit and Compliance Committee
(BACC) and the Board of Directors.
Risk Management & Internal ControlThe Board considers Risk
Management and Internal Controls
as integral to the Management of
UA and its business processes. The
Board has overall responsibility for
the Company’s Risk Management
and Internal Controls, in particular
for their adequacy and integrity. UA’s
Internal Control System increases
the reliability of its financial reporting,
makes operations more effective, and
aims to ensure legal and regulatory
compliance. Management, as the
first line of defence, is responsible for
identifying, evaluating and addressing
significant risks, and designing,
implementing and maintaining
mitigating strategies and internal
controls.
VisionTo enhance the value of UA
by embedding disciplined risk
management culture, ensuring
risk-reward trade-offs are transparent,
understood and risks taken are
appropriately rewarded.
Objectives• Protect the capital base by
continuous monitoring to ensure
that risks are not taken beyond the
Company’s risk tolerance levels
• Transferring, minimising and
mitigating risks
• Enhance value creation,
contributing to an optimal risk-
return profile by providing the basis
for efficient capital deployment
• Support decision making process
by providing consistent, reliable
and timely risk information
• Protect UA’s reputation and
brand by promoting a sound
culture of risk awareness and
informed risk taking
• Integrating risk management with
strategy development
Risk CultureUA promotes a strong Risk Culture,
encourages risk awareness and
understanding of controls by way of
clear communication and training.
Every employee is responsible for
managing risks in his/her working
environment and is accountable for
the implementation and oversight of
risk policies.
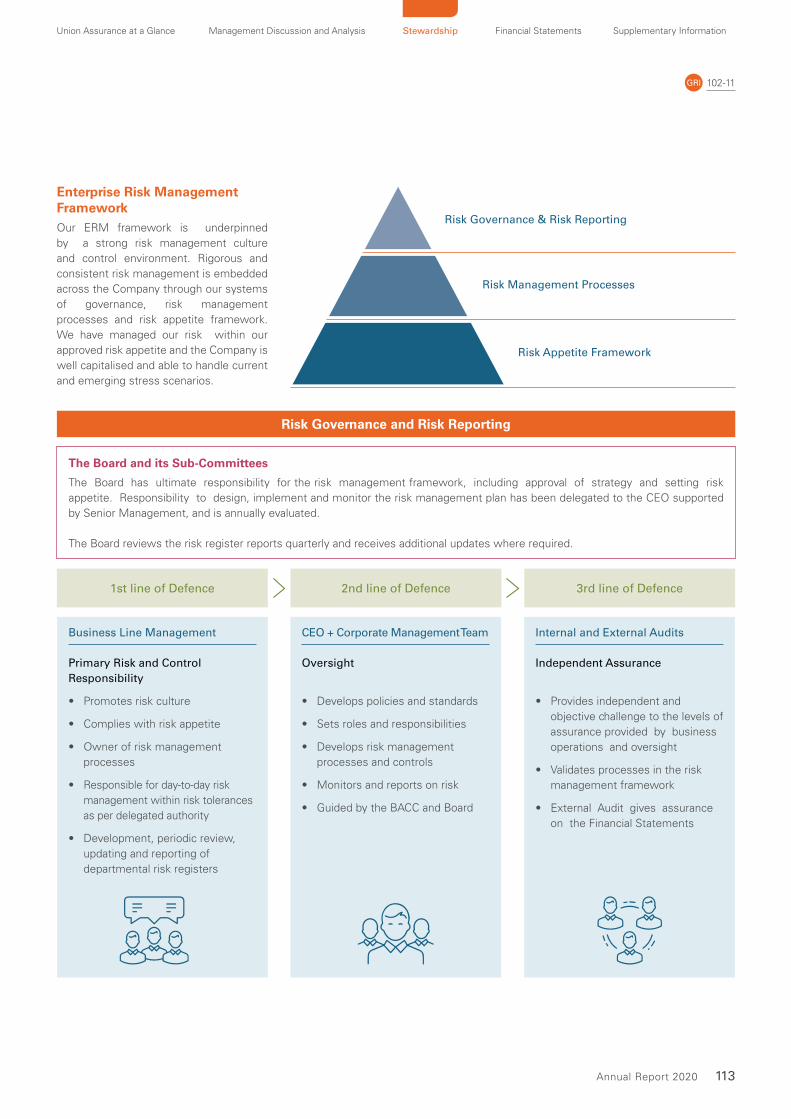
113 Annual Report 2020
Union Assurance at a Glance Management Discussion and Analysis Stewardship Financial Statements Supplementary Information
Risk Governance and Risk Reporting
1st line of Defence 2nd line of Defence 3rd line of Defence
Business Line Management
Primary Risk and Control
Responsibility
• Promotes risk culture
• Complies with risk appetite
• Owner of risk management
processes
• Responsible for day-to-day risk
management within risk tolerances
as per delegated authority
• Development, periodic review,
updating and reporting of
departmental risk registers
CEO + Corporate Management Team
Oversight
• Develops policies and standards
• Sets roles and responsibilities
• Develops risk management
processes and controls
• Monitors and reports on risk
• Guided by the BACC and Board
Internal and External Audits
Independent Assurance
• Provides independent and
objective challenge to the levels of
assurance provided by business
operations and oversight
• Validates processes in the risk
management framework
• External Audit gives assurance
on the Financial Statements
Enterprise Risk Management FrameworkOur ERM framework is underpinned
by a strong risk management culture
and control environment. Rigorous and
consistent risk management is embedded
across the Company through our systems
of governance, risk management
processes and risk appetite framework.
We have managed our risk within our
approved risk appetite and the Company is
well capitalised and able to handle current
and emerging stress scenarios.
Risk Governance & Risk Reporting
Risk Management Processes
Risk Appetite Framework
The Board and its Sub-Committees
The Board has ultimate responsibility for the risk management framework, including approval of strategy and setting risk
appetite. Responsibility to design, implement and monitor the risk management plan has been delegated to the CEO supported
by Senior Management, and is annually evaluated.
The Board reviews the risk register reports quarterly and receives additional updates where required.
102-11GRI

114 Union Assurance PLC
ENTERPRISE RISK MANAGEMENT
Risk Management Process
Our Risk Management process including risk models,
stress and scenario testing enables UA to identify, measure,
manage, monitor and report risks to ensure the Company
remains within the approved risk appetite. These processes
facilitate dynamic risk-based decision-making and effective
day-to-day risk management.
Risk Appetite Framework
This refers to the aggregate level and type of risk
that UA is willing to accept to meet strategic objectives. It
includes risks UA accepts but seeks to minimise, risks the
Company seeks to avoid or transfer to third parties.
Risk Models
Scenario and Stress Testing
RISK MANAGEMENT FRAMEWORK
Measure
ManageIdentify
MonitorReport
Capacity
Types of Risk
Tolerance
Key Risk Indicators
The CAR under the Risk Based Capital
Regime measures adequacy of the Total
Available Capital (TAC) against the Risk
Capital Required (RCR). As per regulations,
the minimum CAR should be consistently
maintained in excess of 120%, with a
significant margin (that is above 160%),
to avoid any regulatory interventions.
In addition, the Insurance Regulatory
Commission of Sri Lanka (IRCSL), stipulates
a minimum Total Available Capital of
Rs. 500 Mn. UA maintained a healthy
CAR in excess of 120%, with a significant
margin on a consistent basis.
102-11GRI
(Rs. Mn) (%)
2017 2018 2019 2020
Capital Adequacy Ratio (CAR)
0
5,000
10,000
15,000
20,000
25,000
0
100
200
300
400
Total Available Capital (TAC)Risk Capital Required (RCR)Capital Adequacy Ratio
13,6
93
5,3
87
14,3
82
5,4
96
18,1
20
5,0
03
6,3
96
21,7
95
CAPITAL ADEQUACY RATIO
341%
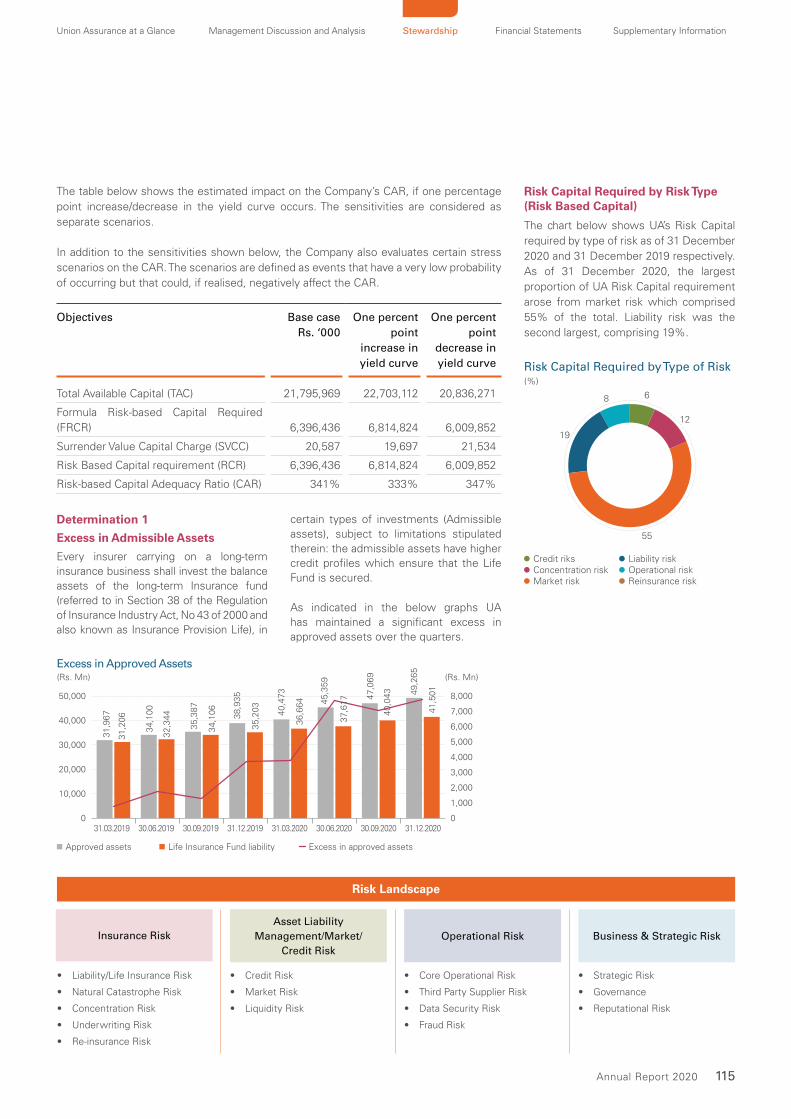
115 Annual Report 2020
Union Assurance at a Glance Management Discussion and Analysis Stewardship Financial Statements Supplementary Information
The table below shows the estimated impact on the Company’s CAR, if one percentage
point increase/decrease in the yield curve occurs. The sensitivities are considered as
separate scenarios.
In addition to the sensitivities shown below, the Company also evaluates certain stress
scenarios on the CAR. The scenarios are defined as events that have a very low probability
of occurring but that could, if realised, negatively affect the CAR.
Objectives Base case
Rs. ‘000
One percent
point
increase in
yield curve
One percent
point
decrease in
yield curve
Total Available Capital (TAC) 21,795,969 22,703,112 20,836,271
Formula Risk-based Capital Required
(FRCR) 6,396,436 6,814,824 6,009,852
Surrender Value Capital Charge (SVCC) 20,587 19,697 21,534
Risk Based Capital requirement (RCR) 6,396,436 6,814,824 6,009,852
Risk-based Capital Adequacy Ratio (CAR) 341% 333% 347%
Determination 1
Excess in Admissible Assets
Every insurer carrying on a long-term insurance business shall invest the balance assets of the long-term Insurance fund (referred to in Section 38 of the Regulation of Insurance Industry Act, No 43 of 2000 and also known as Insurance Provision Life), in
certain types of investments (Admissible assets), subject to limitations stipulated therein: the admissible assets have higher credit profiles which ensure that the Life Fund is secured.
As indicated in the below graphs UA has maintained a significant excess in approved assets over the quarters.
Risk Capital Required by Risk Type (Risk Based Capital)
The chart below shows UA’s Risk Capital
required by type of risk as of 31 December
2020 and 31 December 2019 respectively.
As of 31 December 2020, the largest
proportion of UA Risk Capital requirement
arose from market risk which comprised
55% of the total. Liability risk was the
second largest, comprising 19%.
Risk Landscape
Insurance RiskAsset Liability
Management/Market/
Credit Risk
Operational Risk Business & Strategic Risk
• Liability/Life Insurance Risk
• Natural Catastrophe Risk
• Concentration Risk
• Underwriting Risk
• Re-insurance Risk
• Credit Risk
• Market Risk
• Liquidity Risk
• Core Operational Risk
• Third Party Supplier Risk
• Data Security Risk
• Fraud Risk
• Strategic Risk
• Governance
• Reputational Risk
(Rs. Mn) (Rs. Mn)
31.03.2019 30.06.2019 30.09.2019 31.12.2019 31.03.2020 30.06.2020 30.09.2020 31.12.2020
Excess in Approved Assets
0
10,000
20,000
30,000
40,000
50,000
0
1,000
2,000
3,000
4,000
5,000
6,000
7,000
8,000
Approved assets Life Insurance Fund liability Excess in approved assets
31
,96
7
31
,20
6
34
,10
0
32
,34
4
35
,38
7
34
,10
6
35
,20
3
40
,47
3
36
,66
4 45
,35
9
37
,61
7 47
,06
9
40
,04
3 49
,26
5
41
,50
1
38
,93
5
(%)
55
12
6
19
8
Credit riks Concentration risk Market risk
Risk Capital Required by Type of Risk
Liability risk Operational risk Reinsurance risk

116 Union Assurance PLC
ENTERPRISE RISK MANAGEMENT
Key Risk Summary
Key Risk Mitigants to Risk
Insurance Risk
Liability/Life Insurance Risk
Inherent uncertainty regarding the
occurrence, amount or timing of insurance
liabilities. Exposure is transferred to UA
through the underwriting process.
• Establishing limits for underwriting authority
• Requiring specific approvals for transactions above established limits or new products
• Using a variety of reserving and modelling methods
• Ceding insurance risk through external proportional or non-proportional reinsurance
treaties and facultative single-risk placements
Natural Catastrophe Risk
Impact from natural catastrophes such as
spread of contagious diseases.
Retention of sufficient excess of loss limits per annum and per event.
Introduced a free COVID-19 cover for both existing and new customers with a free death cover
up to a maximum of Rs. 1 million per policyholder.
Concentration Risk
Risk of exposure to increased losses
arising from inadequately diversified
portfolios of assets or obligations.
Concentration risk is managed by maintaining a diversified portfolio of assets.
(%)
97
21
Banking, Finance and Insurance TelecommunicationsDiversified Holdings
Coporate Debt Securities(%)
24
17
9
51
40
4
BanksCapital GoodsFood, Beverage & TobaccoConsumer Durables & Apparel
Quoted Equity
Food & Staples RetailingTelecommunication ServicesConsumer Services
• 97% of UA corporate debt securities
represent investments in the Banking
sector. This is mainly due to credit quality
and stability in the sector.
• 40% of UA quoted equities represent
the Banking sector. UA predominantly
invested in equities of the Banking sector
considering credit risk and stability.
Underwriting Risk
Risk of insured losses being higher than
expectations.
• In measuring loss provisions, the Company follows a cautious approach and assesses uncertainties conservatively. In every quarter, we also compare notified losses with our loss expectancy, in order to sustain an adequate level of reserves.
• Sound underwriting standards and grids considering re-insurance standards.
Re-Insurance Risk
Inability for UA to obtain insurance from
the reinsurer at the right time and at an
appropriate cost.
We select reinsurers with an ‘A+’ or above
Credit Rating from international rating
agencies.
Reinsurer Fin
an
cial
Str
en
gth
rati
ng
Cre
dit
R
ati
ng
Rati
ng
A
gen
cy
Munich RE AA- AA-
Standard & Poor’s
Hannover re AA- AA-
PartnerRe A+ A+
RGA AA- AA-
The cession rate
The cession rate for reinsurers was 4.5%
31 December 2020
(%)
2017 2018 2019 20200
1
2
3
4
5
6
7
8
4.9
6.4
4.5
4.5
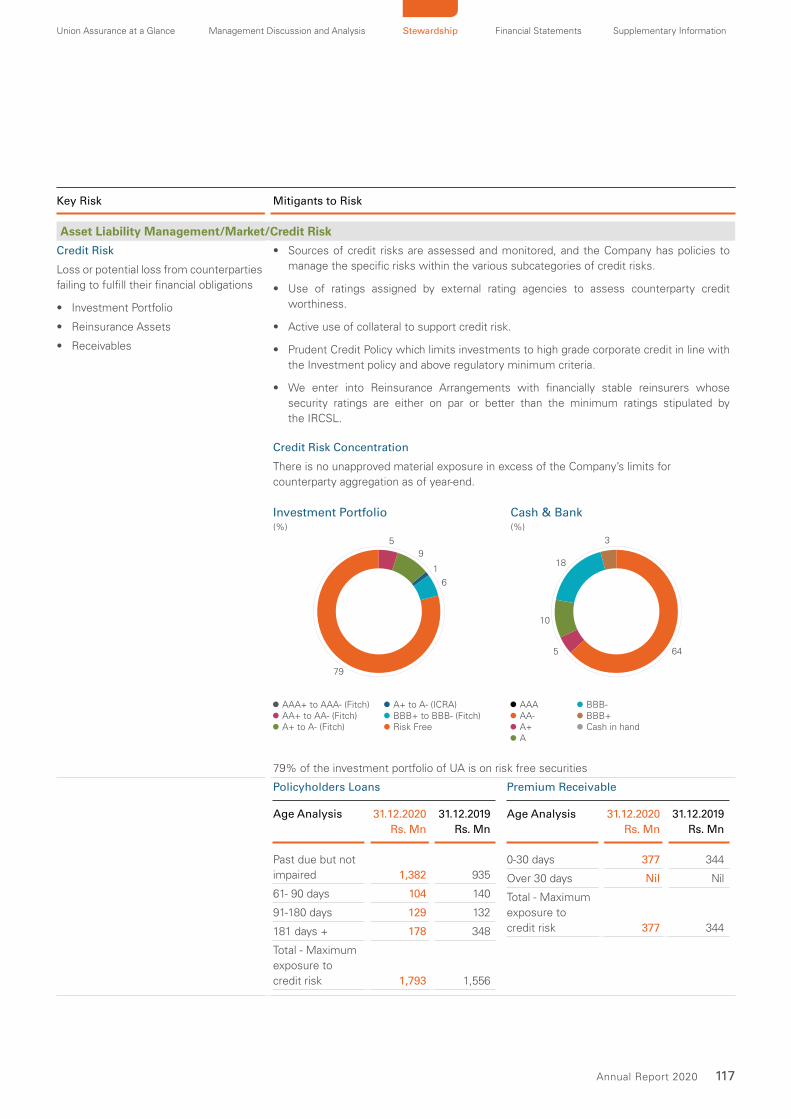
117 Annual Report 2020
Union Assurance at a Glance Management Discussion and Analysis Stewardship Financial Statements Supplementary Information
Key Risk Mitigants to Risk
Asset Liability Management/Market/Credit Risk
Credit Risk
Loss or potential loss from counterparties
failing to fulfill their financial obligations
• Investment Portfolio
• Reinsurance Assets
• Receivables
• Sources of credit risks are assessed and monitored, and the Company has policies to
manage the specific risks within the various subcategories of credit risks.
• Use of ratings assigned by external rating agencies to assess counterparty credit
worthiness.
• Active use of collateral to support credit risk.
• Prudent Credit Policy which limits investments to high grade corporate credit in line with
the Investment policy and above regulatory minimum criteria.
• We enter into Reinsurance Arrangements with financially stable reinsurers whose
security ratings are either on par or better than the minimum ratings stipulated by
the IRCSL.
Credit Risk Concentration
There is no unapproved material exposure in excess of the Company’s limits for
counterparty aggregation as of year-end.
(%)
6
1
9
5
79
AAA+ to AAA- (Fitch)AA+ to AA- (Fitch) A+ to A- (Fitch)
Investment Portfolio
A+ to A- (ICRA) BBB+ to BBB- (Fitch) Risk Free
(%)
64
3
18
10
5
AAAAA-A+A
Cash & Bank
BBB-BBB+Cash in hand
79% of the investment portfolio of UA is on risk free securities
Policyholders Loans
Age Analysis 31.12.2020
Rs. Mn
31.12.2019
Rs. Mn
Past due but not
impaired 1,382 935
61- 90 days 104 140
91-180 days 129 132
181 days + 178 348
Total - Maximum
exposure to
credit risk 1,793 1,556
Premium Receivable
Age Analysis 31.12.2020
Rs. Mn
31.12.2019
Rs. Mn
0-30 days 377 344
Over 30 days Nil Nil
Total - Maximum
exposure to
credit risk 377 344

118 Union Assurance PLC
ENTERPRISE RISK MANAGEMENTENTERPRISE RISK MANAGEMENT
Key Risk Mitigants to Risk
Market Risk
Risk associated with UA’s financial
position where the value or cash flow
depends on financial markets.
Risk factors include:
• Equity market prices - price fluctuations
on equity securities may affect the
Company’s liquidity, reported income,
surplus and regulatory capital position.
• Property market prices.
• Interest rates - risk of loss resulting
from changes in interest rates,
including changes in the shape of
yield curves; of instruments such as
debt securities, reserves for insurance
contracts, employee benefit plans,
loans and receivables.
• Market risk is managed on an economic total balance sheet basis of assets relative to
liabilities, to achieve maximum risk-adjusted excess return on assets while considering
UA’s risk tolerance and local regulatory constraints.
• Setting limits on concentration in investments in single issuers and certain asset classes.
• Monitoring and review by the Investment Committee of the Company’s strategic
asset allocation, tactical boundaries and Company asset/liability exposure. Please refer
Investment Committee report on page 92 for further information.
• Actively managing the equity portfolio to ensure realised gains are capitalised and to
protect the equity base from any possible mark to market losses. Further, the Company
has partnered with an external outsourced Equity Fund Manager to manage the equity
portfolio of the Company.
• Monitoring interest rate risk on a monthly basis by analysing the movement in the interest
rate-sensitive asset duration, allocation to interest rate-sensitive assets, sensitivity of
interest rate movements on the solvency margin, leverage derivatives such as forward
interest rate bookings to mitigate interest rate risk.
• Managing credit spread risk, which describes the sensitivity of the values of assets and
liabilities due to changes in the level or the volatility of credit spreads over the risk-free
interest rate yield curves. Movements of credit spreads are driven by expected probability
of defaults, expected losses in cases of defaults of issuers, the uncertainty of default
probabilities and losses, as well as actual defaults of issuers.
• Evaluating alternative investment opportunities
(%)
97
21
Banking, Finance and Insurance TelecommunicationsDiversified Holdings
Coporate Debt Securities
Investments in the banking, finance and insurance industry are significant due to better
credit quality and stability.
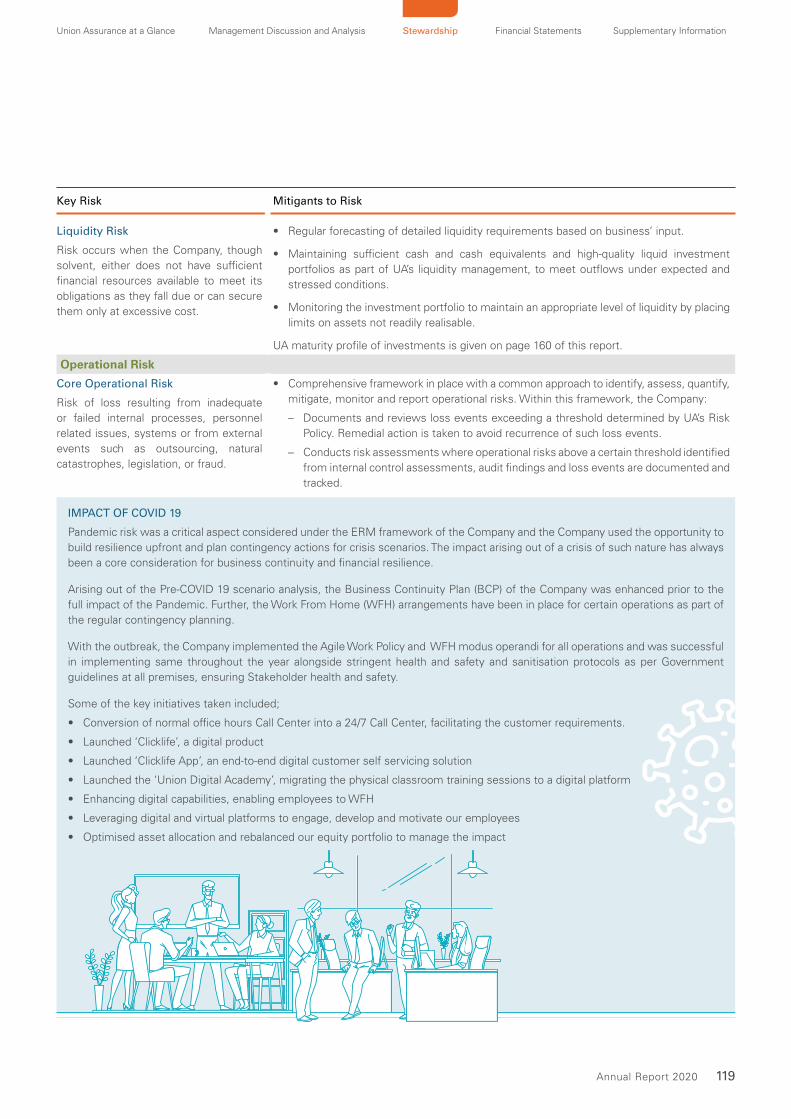
119 Annual Report 2020
Union Assurance at a Glance Management Discussion and Analysis Stewardship Financial Statements Supplementary Information
Key Risk Mitigants to Risk
Liquidity Risk
Risk occurs when the Company, though
solvent, either does not have sufficient
financial resources available to meet its
obligations as they fall due or can secure
them only at excessive cost.
• Regular forecasting of detailed liquidity requirements based on business’ input.
• Maintaining sufficient cash and cash equivalents and high-quality liquid investment
portfolios as part of UA’s liquidity management, to meet outflows under expected and
stressed conditions.
• Monitoring the investment portfolio to maintain an appropriate level of liquidity by placing
limits on assets not readily realisable.
UA maturity profile of investments is given on page 160 of this report.
Operational Risk
Core Operational Risk
Risk of loss resulting from inadequate
or failed internal processes, personnel
related issues, systems or from external
events such as outsourcing, natural
catastrophes, legislation, or fraud.
• Comprehensive framework in place with a common approach to identify, assess, quantify,
mitigate, monitor and report operational risks. Within this framework, the Company:
– Documents and reviews loss events exceeding a threshold determined by UA’s Risk
Policy. Remedial action is taken to avoid recurrence of such loss events.
– Conducts risk assessments where operational risks above a certain threshold identified
from internal control assessments, audit findings and loss events are documented and
tracked.
IMPACT OF COVID 19
Pandemic risk was a critical aspect considered under the ERM framework of the Company and the Company used the opportunity to
build resilience upfront and plan contingency actions for crisis scenarios. The impact arising out of a crisis of such nature has always
been a core consideration for business continuity and financial resilience.
Arising out of the Pre-COVID 19 scenario analysis, the Business Continuity Plan (BCP) of the Company was enhanced prior to the
full impact of the Pandemic. Further, the Work From Home (WFH) arrangements have been in place for certain operations as part of
the regular contingency planning.
With the outbreak, the Company implemented the Agile Work Policy and WFH modus operandi for all operations and was successful
in implementing same throughout the year alongside stringent health and safety and sanitisation protocols as per Government
guidelines at all premises, ensuring Stakeholder health and safety.
Some of the key initiatives taken included;
• Conversion of normal office hours Call Center into a 24/7 Call Center, facilitating the customer requirements.
• Launched ‘Clicklife’, a digital product
• Launched ‘Clicklife App’, an end-to-end digital customer self servicing solution
• Launched the ‘Union Digital Academy’, migrating the physical classroom training sessions to a digital platform
• Enhancing digital capabilities, enabling employees to WFH
• Leveraging digital and virtual platforms to engage, develop and motivate our employees
• Optimised asset allocation and rebalanced our equity portfolio to manage the impact
120 Union Assurance PLC
ENTERPRISE RISK MANAGEMENTENTERPRISE RISK MANAGEMENT
Key Risk Mitigants to Risk
3rd Party Supplier Risk UA regularly assesses the risk associated with strategic suppliers to verify that suppliers
remain financially viable and able to deliver services and that the Company is not exposed to
geographic and supplier concentration risk.
Data Security Risk
Cyber risks and threats to data security.
• Protection of data held with business partners through contractual arrangements
and controls built into ‘cloud governance’ procedures, in compliance with regulatory
requirements and UA’s Information Security Policies.
• Establishment of a Cyber Security Policy in line with the JKH Group policy.
• Implementation of IBM’s managed Security Operations Centre (SOC) and security
intelligence platforms.
• Periodic vulnerability assessments/penetration testing for internal network segment.
• With the implementation of WFH due to the ongoing Pandemic, the Company conducted
extensive user awareness to address social engineering on an ongoing basis. Further, risk
mitigation initiatives included data classification and rights management and two-factor
authentication for employee accounts as an extra layer of security.
Fraud Risk
When a claimant attempts to obtain
a benefit or advantage they are not
entitled to.
• Preventing, detecting and responding to fraud is embedded in UA’s business. Both claims
and non-claims fraud are included in the common framework for assessing and managing
operational risks.
• Forestpin, an analytical and risk alert tool is used to identify outliers in a timely manner.
Strategic Risk
Reputational Risk
Risk that negative publicity regarding
Company’s business practices will
lead to a loss of confidence amongst
Stakeholders.
Complying with applicable laws and regulations, and by following the core values,
principles and code of conduct of the Company, which promotes integrity and good
business practices.
Governance Risk
Risk of not adhering to the Company’s
governance framework and this results
in negative impact to progress and
achievements of the Company.
A robust governance structure and a mechanism is in place to ensure good governance
Please refer Corporate Governance report on pages 76 to 111 for further information.

121 Annual Report 2020
Union Assurance at a Glance Management Discussion and Analysis Stewardship Financial Statements Supplementary Information
Key Risk Mitigants to Risk
Strategic Risk
Risk that UA is unable to achieve its
strategic targets which arise from
• Inadequate assessment of strategic
plans
• Ineffective implementation of strategic
plans, and
• Unexpected changes to assumptions
underlying strategic plans
UA defines strategy as the long term plan of action designed to allow the Company to
achieve its goals and aspirations. The Company works to reduce unintended risks of
strategic business decisions through its risk assessment processes and tools. In the
year 2020, the Executive Committee assessed the key strategic risk scenarios, looking
at the year and beyond. UA assessed risks in executing the Company’s transformation
programmes for Agency, Bancassurance and Operations, delivering on its customer
strategy, information security and cyber risks.
We have put mitigating actions in place to adequately manage and carry out the
Company’s transformation; to meet the challenge of evolving customer needs and changes
in the distribution model affected by digitalisation; and to strengthen UA’s ability to handle
and protect data and information in anticipation of a rapidly evolving external environment.


VALUING RELATIONSHIPS
FINANCIAL STATEMENTS
125 Annual Report of the Board of Directors on the Affairs of the Company
130 Chief Executive Officer’s and Chief Financial Officer’s Responsibility Statement
131 Actuary’s Report132 Statement of Directors’ Responsibility133 Independent Auditors’ Report 137 Table of Contents138 Income Statement139 Statement of Profit or Loss and Other
Comprehensive Income140 Statement of Financial Position 141 Statement of Changes in Equity143 Statement of Cash Flows145 Notes to the Financial Statements

124 Union Assurance PLC
FINANCIAL CALENDAR2020 2021
34 Annual General Meeting to be held on N/A 31-Mar-21
33 Annual General Meeting held on 31-Mar-20 N/A
The first and final dividends for the year 2019 paid on 19-Mar-20 N/A
Audited financial statements of proceeding year authorized on 28-Feb-20 25-Feb-21
Interim financial statements will be published as per rule 7.4 of the Colombo Stock Exchange
Interim results for the three months ended 31 March (Unaudited) 14-May-20 14-May-21
Interim results for the three months ended 30 June (Unaudited) 11-Aug-20 13-Aug-21
Interim results for the three months ended 30 September (Unaudited) 12-Nov-20 15-Nov-21
Interim results for the three months ended 31 December (Unaudited) 25-Feb-21 28-Feb-22
Union Assurance at a Glance Management Discussion and Analysis Stewardship Financial Statements Supplementary Information
125Annual Report 2020
ANNUAL REPORT OF THE BOARD OF DIRECTORS ON THE AFFAIRS OF THE COMPANYOverviewThe Directors have pleasure in presenting
the Annual Report of your Company
together with the audited financial
statements for the year ended 31st
December 2020.
Principal ActivitiesThe principal activity of the Company, which
is ‘Life Insurance’, remained unchanged
during the financial year. The Company
has not engaged in any activities, which
contravene laws and relevant regulations.
Vision, Mission and Corporate ConductThe corporate vision and mission are
provided on page 8 of this report. In
achieving its vision and mission, the
Company has ensured that all Directors
and employees conduct their activities
in compliance with the highest level of
ethical standards and integrity as set out
in the Code of Conduct.
Review of Business and Future DevelopmentsA review of the financial and operational
performance and future business
developments of the Company is
contained in the Chairman’s Message,
Chief Executive Officer’s Review and the
Management Discussion and Analysis
section of the Annual Report, as required
under Section 168 (1) (a) of the Companies
Act No 07 of 2007 (‘Companies Act’).
These reports form an integral part of the
report of the Directors and together with
the audited financial statements reflect
the state of affairs of the Company.
TurnoverThe total gross written premium generated
by the Company for the year 2020 was Rs.
13,109 million (2019 – Rs. 11,648 million).
Financial Results and AppropriationsThe net profit after tax of the Company
was Rs. 921 million for the year (2019 -
Rs.1,158 million).
A synopsis of the performance is presented below;
For the year ended 31 December
Union Assurance PLC
2020
Rs. ‘000
2019
Rs. ‘000
Profit after tax 920,596 1,158,030
Balance brought forward from previous year 7,609,868 7,625,794
Profit available for appropriations 8,530,464 8,783,824
Appropriations
Dividend paid for previous year (1,178,571) (1,178,571)
Transfer from revaluation reserve 3,716 4,615
Un–appropriated profit carried forward 7,355,609 7,609,868
Financial Statements and Auditors’ ReportThe financial statements for the year
ended 31st December 2020 have been
prepared in accordance with the Sri Lanka
Accounting Standards (SLFRSs / LKASs)
issued by the Institute of Chartered
Accountants of Sri Lanka. The financial
statements duly signed by the Directors
are provided on pages 138 to 231 and
the Auditors’ Report on the financial
statements is provided on pages 133 to
136 of this Annual Report.
Accounting PoliciesDetails of accounting policies are presented
on Pages 145 to 231 to the financial
statements and comply with Section
168 (1) (d) of the Companies Act. There
have been no changes in the accounting
policies adopted by the Company during
the year under review. For all periods
up to and including the year ended 31st
December 2020, the Company prepared
its financial statements in accordance
with the Sri Lanka Accounting Standards
(SLFRSs / LKASs) which have materially
converged with the International Financial
Reporting Standards (IFRSs) as issued by
the International Accounting Standards
Board (IASB).
DividendsIn compliance with circular IRCSL/DG/
SUP/2020/06/546 dated 8 June 2020
issued by IRCSL, company has not
declared shareholder dividends as at the
reporting date.
Provision for TaxationThe company is liable to income tax in
terms of the Inland Revenue Act No 24
of 2017 and amendments thereto. As per
the proposed changes by the government,
the tax rate for insurance companies
has changed from 28% to 24% with
effect from 1 January 2020 (2019 - 28%).
However, as the changes have not been
gazetted and enacted as at the reporting
date, the prevailing income tax rate of
28% has been used for the income tax
computation as at 31 December 2020. The
tax position of the Company is disclosed
in Note 23 to the financial statements on
page 182.
Property, Plant and EquipmentDuring the financial year, the Company
acquired property, plant and equipment
to the aggregate value of Rs. 52 million.
The carrying value of property, plant and
equipment as at 31st December 2020
was Rs. 2,469 million (2019 - Rs. 2,500
million). The details of property, plant and
equipment are shown in Note 28 to the
financial statements on page 190.
Intangible AssetsDuring the financial year, the Company
acquired intangible assets to the aggregate
value of Rs. 120 million. The carrying value
of intangible assets was Rs. 1,247 million
as at the reporting date (2019 - Rs. 1,307
million). The details of intangible assets
are shown in Note 27 to the financial
statements on page 188.
126 Union Assurance PLC
ANNUAL REPORT OF THE BOARD OF DIRECTORSON THE AFFAIRS OF THE COMPANY
Market Value of Freehold PropertiesThe land and building owned by the Company at No. 6, Rajapihilla Road, Kurunegala and at No. 20, St. Michael’s Road Colombo 03 were revalued as at 31st December 2019 to reflect its market value as per Company policy.
The revaluation was performed by Mr. P B Kalugalagedera and Associates, Chartered Valuation Surveyor. The details of the revaluation and relevant accounting policies are provided in Note 28 to the financial statements on page 190.
InvestmentsDetails of investments held by the Company are disclosed in Note 32 to the financial statements on page 203.
Stated Capital and ReservesIn compliance with the Companies Act, the financial statements reflect the stated capital of the Company. The stated capital is the total of all amounts received by the Company in respect of the issued share capital. The stated capital of the Company as at 31st December 2020 was Rs. 1,000 million (2019 - Rs. 1,000 million) and the total capital and reserves was Rs. 15,108 million (2019 - Rs. 14,663 million).
As explained in Note 41 on page 216, based on the directions issued by IRCSL dated 20 March 2018 and subsequent approval, the Company has transferred the one - off surplus of Rs. 3,382 million attributable to non-participating and non unit fund of unit linked business from life policyholder fund to life shareholder fund (SHF) through Income Statement as at 31 December 2017. The distribution of this one – off surplus to shareholders, held as part of the Restricted Regulatory Reserve, is subject to meeting governance requirements stipulated by the IRCSL and can only be released upon receiving approval from the IRCSL. The one - off surplus in the SHF is invested in government debt securities as per the directions of the IRCSL.
Share InformationInformation relating to earnings, dividends,
net assets and market value per share
is given in the UA share performance on
pages 36 to 45 of this report.
Share HoldingsThere were 1,512 registered shareholders,
holding ordinary voting shares as at 31st
December 2020 (2019 - 1,406). The
distribution of shareholding including the
percentage held by the public is given on
page 43 of this report.
Equitable Treatment to all ShareholdersThe Company has made every endeavour
to ensure the equitable treatment of
all shareholders and adopted adequate
measures to prevent information
asymmetry.
Substantial ShareholdingsThe list of top twenty shareholders as at
31st December 2020 is given on page 44
of this report, together with comparative
shareholding as at 31st December 2019.
Information to ShareholdersThe Board strives to be transparent
and provide accurate information to
shareholders in all published material. The
quarterly financial information during the
year has been sent to the Colombo Stock
Exchange in a timely manner.
Corporate GovernanceThe Board of Directors is committed
to maintaining an effective corporate
governance structure and process. A
more comprehensive report on corporate
governance is found on pages 76 to 111.
Directors’ DeclarationThe Directors declare that;
a) The Company has not engaged in any
activity, which contravenes laws and
regulations
b) The Directors have declared all material
interests in contracts involving the
Company and refrained from voting on
matters in which they were materially
interested
c) The Company has made all endeavours
to ensure the equitable treatment of
shareholders
d) The business is a going concern
e) A review of the internal controls covering, financial, operational and compliance controls and risk management has been conducted, and the Directors have obtained reasonable assurance of their effectiveness and successful adherence therewith
f) The Company, being listed on the Colombo Stock Exchange (CSE), is compliant with the rules on corporate governance under the listing rules of the CSE with regard to the composition of the Board and its sub committees
g) The Company is in compliance with the Code of Best Practice on Corporate Governance (2017) issued by the Institute of Chartered Accountants of Sri Lanka (CA Sri Lanka).
Board Audit and Compliance CommitteeThe composition of the Board Audit and Compliance Committee comprising of Non Executive Directors is provided on page 90. The Chief Executive Officer (CEO), other Executive Committee members and internal and external auditors attend the meetings by invitation. The report of the Board Audit and Compliance Committee is provided on pages 90 to 92 of this report.
System of Internal ControlsThe Board of Directors has put in place
an effective and comprehensive system
of internal controls covering financial,
operational and compliance controls and
have obtained reasonable assurance
of their effectiveness. An enterprise
risk management initiative has been
implemented. The Board is satisfied that
the process is sufficiently robust to identify
and manage risks which have an impact on
the Company’s performance.
Risk ManagementThe Board and the executive management
of the Company have put in place a
comprehensive risk identification,
measurement and mitigation process.
The risk management process is an
integral part of the annual strategic
planning cycle. A detailed overview of
the process is outlined in the Enterprise
Risk Management report in the Corporate
Governance section on page 112.

Union Assurance at a Glance Management Discussion and Analysis Stewardship Financial Statements Supplementary Information
127Annual Report 2020
The Board of DirectorsAs at 31st December 2020 the Board
of Directors of Union Assurance PLC
consisted of Directors with diverse
knowledge and experience. Brief profiles
of the Directors are given in the Corporate
Governance section on page 76.
Resignation and Appointment of DirectorsMr. H. A. J. De Silva Wijeyeratne resigned
from the Board of Directors of the Company
with effect from 06th September 2020.
Mr. D. P. Gamlath was appointed to the
Board as a Non - Executive Director of
the Company with effect from 10th June
2020. Mr. W. M. D. F Arsakularatne was
appointed to the Board as an Independent
Non-Executive Director of the Company
with effect from 14th July 2020.
Retirement and Re-Election / Re-Appointment of DirectorsIn terms of Article 84 of the Articles of
Association of the Company, Mr. Dumith
Hemantha Fernando retires by rotation and
is eligible for re - election. A brief profile of
the said Director is given on page 77.
Mr. W. M. De F. Arsakularatne and
Mr. D. P. Gamlath retire in terms of Article
90 of the Articles of Association of the
Company and both being eligible offer
themselves for re-election. Brief profiles
of the said Directors are given on page 77.
Responsibility of the BoardDetails of responsibilities of the Board and
the manner in which those responsibilities
were discharged during the year are
disclosed in the Corporate Governance
section on page 84.
Review of Performance of the BoardThe performance of the Board has
been appraised through a formalised
process, where each individual Director
anonymously comments on the dynamics
of the Board.
Board Sub CommitteesThe Board while assuming the overall
responsibility and accountability in the
management of the Company has also
appointed Board sub committees to
ensure control over certain affairs of the
Company.
Details of the sub committees, their
mandates and composition are provided
in the Corporate Governance section on
pages 88 to 95.
Directors’ Interests RegisterThe Company, in compliance with the
requirements of the Companies Act
maintains an Interests Register.
The particulars of the Company’s interest
register are given below.
a) Directors’ Interests in Transactions
The Directors of the Company have made
general declarations as provided for in
Section 192 (2) of the Companies Act.
Arising from this, details of contracts
in which they have an interest are
provided in Note 50 on page 227 to the
financial statements, under related party
transactions.
b) Directors’ Interests in Shares
The Directors’ individual shareholdings in
the Company is provided on page 44 of
the Annual Report.
c) Share Dealings
There have been no share dealings by the
Directors during the year.
d) Indemnities and Remuneration to Directors
Directors’ remuneration is established
within a framework approved by the
Remuneration Committee. The Directors
are of the opinion that the framework
assures appropriateness of remuneration
and fairness for the Company. The
remuneration of the Non - Executive
Directors is determined according to
scales of payment decided upon by the
Board. Details of Directors’ fees and
emoluments paid during the year along
with the corresponding amounts for the
previous year are set out in Note 22 of the
financial statements.
Mr. D. P. Gamlath was appointed
Non - Executive Director from 10th June
2020 and Mr. W. M. De F Arsakularatne was
appointed as Non-Executive Independent
Director of Union Assurance PLC from
14th July 2020 at the standard Non -
Executive fees approved by the Board for
Non - Executive Directors (if applicable)
which fees are commensurate with the
market complexities of the Company.
Directors’ MeetingsDetails of Board meetings and Board
subcommittee meetings are presented on
page 85 of the Annual Report.
Directors’ Responsibility for Financial ReportingThe Directors are responsible for the
preparation of the financial statements of
the Company to reflect a true and fair view
of the state of its affairs. The Directors are
of the view that these financial statements
have been prepared in conformity with the
requirements of the Sri Lanka Accounting
Standards (SLFRSs / LKASs) issued by
CA Sri Lanka, Companies Act, Sri Lanka
Accounting and Auditing Standards Act
No. 15 of 1995, Regulation of Insurance
Industry Act No. 43 of 2000, Statement
of Recommended Practice (SORP) issued
by the ICASL and the Listing Rules of
the CSE.
Related Party TransactionsThere are no related party transactions
which exceed the lower of 10% of
equity or 5% of the total assets of the
Company. Directors have disclosed the
transactions with related parties in terms
of Sri Lanka Accounting Standard LKAS
24 – Related Party Disclosures, in Note
50 to the financial statements and have
complied with CSE Listing Rule 9.3.2 and
Code of Best Practice on Related Party
Transactions under the Securities and
Exchange Commission Directive issued
under Section 13 (C) of the Securities and
Exchange Commission (SEC) Act.
128 Union Assurance PLC
ANNUAL REPORT OF THE BOARD OF DIRECTORSON THE AFFAIRS OF THE COMPANY
Compliance with the Transfer Pricing RegulationsAll transactions entered into with
associated persons during the period
are on an arm’s length basis and are
comparable with transactions carried out
with non - associated persons.
DonationsThere were no donations made during
the year.
Corporate Social ResponsibilityThe Company manages a range of
programmes towards its stakeholders
in order to bring about sustainable
development in all areas of business.
The CSR initiatives are detailed in the
Social and Relationship Capital section on
pages 60 to 67.
Compliance with Laws and RegulationsThe Company has complied with all
applicable laws and regulations. A
compliance checklist is signed off on a
monthly basis by responsible officers and
any violations are reported to the Board
Audit and Compliance Committee. Refer
pages 105 to 111 for the statement of
compliances.
Risk Based Capital Requirement (RBC)With effect from 1 January 2016, all
insurance companies were required to
maintain a capital amount as computed
under the risk based capital framework
introduced by the IRCSL or Rs. 500 million
whichever is higher. From the first quarter
of 2016 onwards, the Company reported
RBC requirements on a quarterly and
annual basis within the reporting time
lines. Refer pages 114 to 115 for details on
RBC of the Company.
Integrated Corporate ReportingThe integrated annual report has been
prepared in accordance with the Integrated
Reporting Framework of the International
Integrated Reporting Council (IIRC). The
Board Audit and Compliance Committee
has reviewed the framework presented
in this Annual Report and based on their
recommendation, the Board has adopted
the framework as a transparent basis to
report the Company’s activities and results
to all stakeholder groups.
SustainabilityThe Company is aware of the need
to pursue its business goals from a
stakeholder perspective of business
governance. Hence, through the structured
stakeholder engagement process, the
Company has identified material issues
in relation to each stakeholder group
and endeavours to achieve its business
goals with due respect to all stakeholder
needs. This integrated Annual Report,
combining financial information with
sustainability information aims to provide
its stakeholders a more holistic set of
information.
Messrs. KPMG has issued an assurance of
the financial performance data disclosed
and the content of the report which
represents the Company’s sustainability
policies, objectives, management
approach and performance, and as
prepared under the requirements of the
GRI Standards. The report has also gone
through a GRI Materiality Disclosures
Service.
Human ResourcesThe Company continued to implement
appropriate human resource management
policies to develop employees and
optimize their contribution towards the
achievement of corporate objectives.
These policies and procedures ensure
the equitable treatment of all employees.
The Company also adopts equality of
opportunity for all employees irrespective
of ethnic origin, religion, political opinion,
gender, marital status or physical ability/
disability. Some of the processes and
procedures adopted in this regard are
mentioned in the Human Capital Report
on pages 54 to 59. The number of persons
employed by the Company as at 31st
December 2020 was 795 (2019 - 764).
There were no material issues pertaining
to employees and industrial relations of
the Company during the year under review.
Code of ConductThe Company demands impeccable
standards of conduct from its Directors
and employees in the performance of their
official duties and in situations that could
affect the Company’s image. The Company
has also implemented a code of conduct
for field staff covering their responsibility,
commitment and level of service to
the client. During the year no material
violations of the code was noted.
Environment ProtectionInitiatives taken by the Company to
preserve the environment are presented in
the Natural Capital Report on pages 50 to
53. The Company has not engaged in any
activity that is harmful to the environment.
Supplier PolicyThe Company applies an overall policy of
agreeing and clearly communicating terms
of payments as part of the commercial
agreements negotiated with suppliers,
and endeavours to pay for all items
properly charged in accordance with those
agreed terms. As at 31st December 2020,
the other payments of the Company
amounted to Rs. 1,809 million (2019 - Rs.
2,932 million).
Statutory PaymentsThe Directors, to the best of their
knowledge and belief are satisfied
that all statutory payments due to the
government, other regulatory institutions
and in relation to employees as at the
reporting date have been paid or, where
relevant provided for, except as detailed
in Note 53 to the financial statements,
relating to contingent liabilities.
Capital CommitmentsNo significant capital commitments exist
as at 31st December 2020.
Contingencies and Outstanding LitigationIn the opinion of the Directors and in
consultation with the Company lawyers,
litigation currently pending against the
Company will not have a material impact
on the reported financial results or future
operations of the Company.

Union Assurance at a Glance Management Discussion and Analysis Stewardship Financial Statements Supplementary Information
129Annual Report 2020
Events After the Reporting DateThere have been no events subsequent to
the reporting date, which would have any
material effect on the Company, other than
those disclosed in Note 52 to the financial
statements.
Going ConcernAfter considering the financial position,
operating conditions, regulatory and other
factors including macro environmental
factors arising due to COVID-19 pandemic
and such matters required to be addressed
in the Code of Best Practice on Corporate
Governance, issued jointly by the CA
Sri Lanka and the SEC of Sri Lanka, the
Directors have a reasonable expectation
that the Company possesses adequate
resources to continue in operation for
the foreseeable future. For this reason,
the going concern basis is adopted in
preparing the financial statements.
AuditorsThe Company’s external auditors during
the period under review were Messrs.
KPMG. The fee amount paid / payable for
the services provided to the Company
during the year 2020 and 2019 is presented
below.
Rs’000 2020 2019
Audit and audit
related fees 7,873 8,382
Non audit fees 2,423 3,059
Independence of AuditorsBased on the declaration from Messrs.
KPMG, and as far as the Directors are
aware, the Auditors do not have any
relationship or interest other than that of
an Auditor of the Company.
Re-Appointment of AuditorsThe retiring auditor Messrs. KPMG have
intimated their willingness to continue in
office and a resolution to re - appoint them
as Auditors and authorizing the Directors
to fix their remuneration will be proposed
at the next Annual General Meeting.
Auditors’ ReportAuditors’ Report on the financial
statements is given on page 133 of this
annual report.
Approval of Financial StatementsThe audited financial statements were
approved by the Board of Directors on 25
February 2021. The appropriate number of
copies of this report will be submitted to
the CSE and to the Sri Lanka Accounting
and Auditing Standards Monitoring Board.
Annual General MeetingThe Annual General Meeting of the
Company will be held as a virtual meeting,
on Wednesday, 31 March 2021 at 9.00
a.m. The notice of the meeting relating to
the thirty fourth Annual General Meeting is
given on page 260.
This Annual Report is signed for and on
behalf of the Board of Directors by:
K.N.J Balendra
Chairman
W. M. De F. Arsakularatne
Director
Keells Consultants (Private) Limited
Secretaries
25 February 2021
130 Union Assurance PLC
CHIEF EXECUTIVE OFFICER’S AND CHIEF FINANCIAL OFFICER’S RESPONSIBILITY STATEMENTThe financial statements of Union
Assurance PLC as at 31st December 2020
are prepared and presented in compliance
with the following;
• Sri Lanka Accounting Standards
(SLFRSs / LKASs) issued by the
Institute of Chartered Accountants of
Sri Lanka (CASL)
• Requirements of the Companies Act
No. 7 of 2007
• Sri Lanka Accounting and Auditing
Standards Act No 15 of 1995
• Statement of Recommended Practice
(SORP) issued by the ICASL
• Listing rules of the Colombo Stock
Exchange (CSE)
• The Regulation of Insurance Industry
(RII) Act No. 43 of 2000 and subsequent
amendments thereto
• Code of best practice on corporate
governance issued by the ICASL
Accordingly, the Company has prepared
the financial statements which comply
with SLFRSs / LKASs and related
interpretations applicable for the year
ended 31st December 2020, together
with the comparative data as at and for the
year ended 31st December 2019, where
required, as described in the accounting
policies.
The accounting policies used in the
preparation of the financial statements
are appropriate and are consistently
applied, unless otherwise stated in
the notes accompanying the financial
statements. There have been no changes
in the accounting policies adopted by the
Company during the year under review.
Significant accounting policies and
estimates that involve a high degree of
judgement and complexity were discussed
with our external auditors and the Board
Audit and Compliance Committee (BACC).
We confirm that to the best of our
knowledge, the financial statements
and other financial information included
in this annual report, fairly present in all
material respects the financial position,
results of operations and cash flows
of the Company as of, and for, the
periods presented in this Annual Report.
We are responsible for establishing
and maintaining internal controls and
procedures to be designed under our
supervision, and procedures. We have
designed such controls and procedures,
or caused such controls and procedures
to be designed under our supervision, to
ensure that material information relating
to the Company is made known to us and
for safeguarding the Company’s assets
and preventing and detecting fraud and
error. We have evaluated the effectiveness
of the Company’s internal controls and
procedures and are satisfied that the
controls and procedures were effective as
of the end of the period covered by this
annual report and on an ongoing basis.
We confirm, based on our evaluations
that there were no significant deficiencies
and material weaknesses in the design
or operation of internal controls and any
significant fraud that involves management
or other employees.
Whilst the Internal audit function of
the Company continuously conducts
internal audit checks ,our external Internal
Auditors conduct periodic reviews to
ensure that the internal controls and
procedures are consistently followed.
The financial statements were audited by
Messrs. KPMG, Chartered Accountants,
Independent Auditors.
The BACC pre - approves the audit and
non - audit services provided by Messrs.
KPMG, in order to ensure that the provision
of such services does not impair KPMG’s
independence. The BACC also reviews the
external audit plan, the internal audit plan,
all internal audit reviews and management
letters and follows up on any issues raised
during the statutory audit as well as the
internal audits. The BACC also meets with
the external and internal auditors to review
the effectiveness of the audits.
We confirm that the company has complied
with all applicable laws and regulations and
guidelines and that there are no material
litigations that are pending against the
Company other than those arising in the
normal course of conducting insurance
business. We also confirm that the
Company has complied with the following
Insurance Regulatory Commission of Sri
Lanka (IRCSL) requirements;
• All provisions in the RII Act No. 43 of
2000, and subsequent amendments
there to, and all rules, regulations,
determinations, directions issued by
IRCSL; complied with all orders made
by the Ministry of Finance and Planning
under the RII Act, No. 43 of 2000
• Terms and conditions pertaining to
reinsurance placements issued by
IRCSL in terms of section 31(1) of the
RII Act, No. 43 of 2000.
• All applicable circulars issued by IRCSL
• All provisions in the Financial
Transactions Reporting Act, No. 06 of
2006
• Rules on Know Your Customer (KYC)
and Customer Due Diligence (CDD) for
the Insurance Industry issued by the
Financial Intelligence Unit established
under the Financial Transactions
Reporting Act, No. 06 of 2006
• Guidelines on Anti Money Laundering
Programme for Insurers issued by
IRCSL
Jude Gomes
Chief Executive Officer
Asha Perera
Chief Financial Officer
25 February 2021
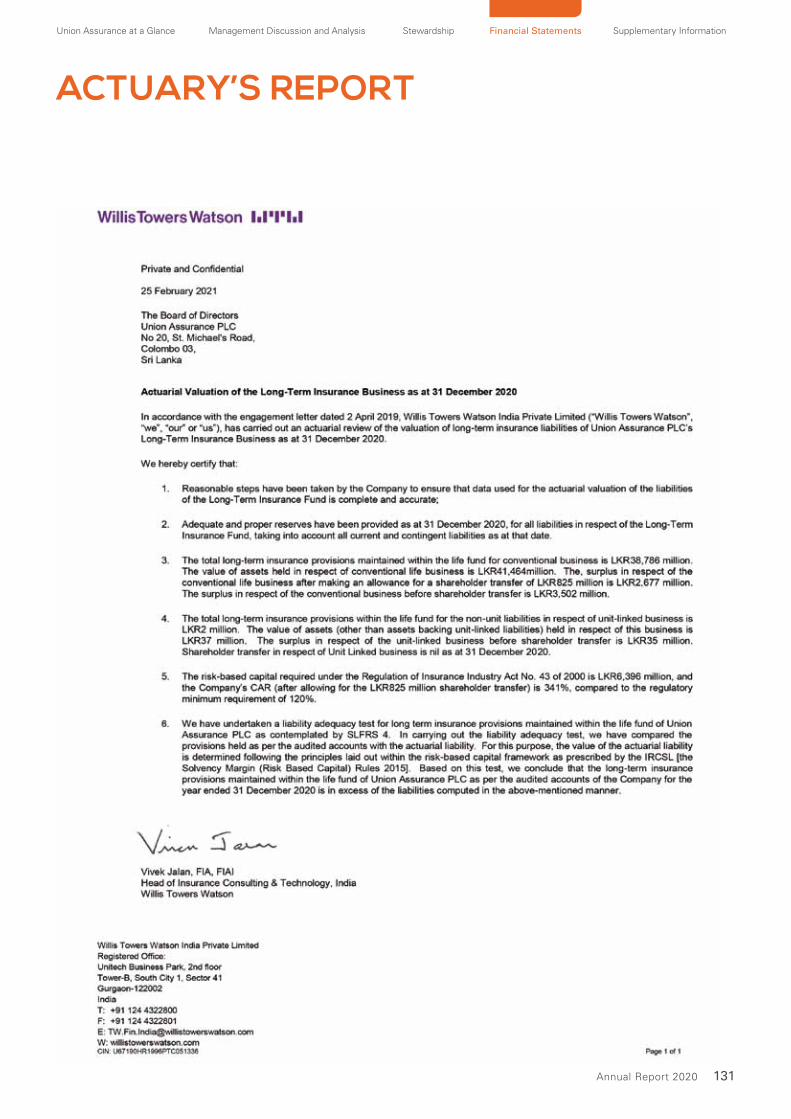
Union Assurance at a Glance Management Discussion and Analysis Stewardship Financial Statements Supplementary Information
131Annual Report 2020
ACTUARY’S REPORT
132 Union Assurance PLC
STATEMENT OF DIRECTORS’ RESPONSIBILITY
The responsibility of the Directors in
relation to the financial statements is
set out in the following statement. The
responsibility of the Auditors in relation
to the financial statements prepared in
accordance with the provision of the
Companies Act No. 7 of 2007 is set out
in the Report of the Auditors on pages
133 to 136. As per the provisions of the
Companies Act No. 7 of 2007 the Directors
are required to prepare, for each financial
year and place before a general meeting,
financial statements which comprise of;
• income statement and statement of
profit or loss and other comprehensive
income of the Company which present
a true and fair view of the profit or loss
of the Company for the financial year;
and
• a statement of financial position, which
presents a true and fair view of the
state of affairs of the Company as at
the end of the financial year; and
• a statement of changes in equity; and
• a statement of cash flows for the
year ended and notes to the financial
statements.
The Directors have ensured that, in
preparing these financial statements;
• the appropriate accounting policies
have been selected and applied in
a consistent manner and material
departures, if any, have been disclosed
and explained; and
• all applicable accounting standards
in accordance with the Sri Lanka
Accounting Standards (SLFRSs /
LKASs) as relevant have been applied;
and
• reasonable and prudent judgements
and estimates have been made so that
the form and substance of transactions
are properly reflected; and
• it provides the information required
by and otherwise complies with
the Companies Act No. 7 of 2007,
Regulation of Insurance Industry
Act No. 43 of 2000 and subsequent
amendments thereto and the Listing
Rules of the Colombo Stock Exchange
and requirements of any other
regulatory authority as applicable to the
Company.
The Directors have also ensured that
the Company has adequate resources to
continue in operation to justify applying
the going concern basis in preparing these
financial statements.
Further, the Directors have a responsibility
to ensure that the Company maintains
sufficient accounting records to disclose,
with reasonable accuracy the financial
position of the Company.
The Directors are also responsible for
taking reasonable steps to safeguard
the assets of the Company and in this
regard to give proper consideration to
the establishment of appropriate internal
control systems with a view to preventing
and detecting fraud and other irregularities.
The Directors are required to prepare the
financial statements and to provide the
Auditors with every opportunity to take
whatever steps and undertake whatever
inspections they may consider to be
appropriate to enable them to give their
audit opinion.
In compliance with circular IRCSL/DG/
SUP/2020/06/546 dated 8 June 2020
issued by IRCSL, the Company has not
declared shareholder dividends as at the
reporting date.
The Directors are of the view that they
have discharged their responsibilities as
set out in this statement.
Compliance ReportThe Directors confirm that to the best
of their knowledge, all taxes, duties
and levies payable by the Company, all
contributions levies and taxes payable on
behalf of and in respect of the employees
of the Company, and all other known
statutory dues, as were due and payable
by the Company, as at the reporting
date have been paid or, where relevant
provided for, except as detailed in Note
53 to the financial statements, relating to
contingent liabilities.
By order of the Board
Keells Consultants (Private) Limited
Secretaries
25 February 2021
Union Assurance at a Glance Management Discussion and Analysis Stewardship Financial Statements Supplementary Information
133Annual Report 2020
INDEPENDENT AUDITORS’ REPORT
To the Shareholders of Union Assurance PLC Report on the Audit of the Financial Statements
Opinion
We have audited the financial statements
of Union Assurance PLC (“the Company”),
which comprise the statement of financial
position as at December 31, 2020, and
the income statement, statement of
profit or loss and other comprehensive
income, statement of changes in equity
and statement of cash flows for the year
then ended, and notes to the financial
statements, including a summary of
significant accounting policies as set out
on pages 138 to 231.
In our opinion, the accompanying financial
statements of the Company give a true
and fair view of the financial position of the
Company as at December 31, 2020, and of
their financial performance and cash flows
for the year then ended in accordance with
Sri Lanka Accounting Standards.
Basis for Opinion
We conducted our audit in accordance
with Sri Lanka Auditing Standards
(SLAuSs). Our responsibilities under
those standards are further described
in the Auditor’s Responsibilities for the
Audit of the Financial Statements section
of our report. We are independent of the
Company and the investee in accordance
with the Code of Ethics issued by CA
Sri Lanka (Code of Ethics), and we have
fulfilled our other ethical responsibilities in
accordance with the Code of Ethics. We
believe that the audit evidence we have
obtained is sufficient and appropriate to
provide a basis for our opinion.
Key Audit Matters
Key audit matters are those matters that, in
our professional judgment, were of most
significance in our audit of the Company’s
financial statements of the current period.
These matters were addressed in the
context of our audit of the Company’s
financial statements as a whole, and in
forming our opinion thereon, and we do
not provide a separate opinion on these
matters.
Insurance Contract Liabilities
Refer to Note 44 (page 218) and Note 45 (page 223) to these financial statements.
Risk Description Our Response
Union Assurance PLC has recognized insurance contract liabilities
and Insurance contract liabilities – unit linked amounting to Rs. 41,
882 Mn and Rs. 1,062 Mn respectively as at 31st December 2020.
The Company’s insurance contract liabilities in total including unit
linked fund represents 90 per cent of the Company’s total liabilities.
This is an area that involves significant judgement over uncertain
future outcomes, mainly the ultimate total settlement value of long
term policyholder liabilities. Economic assumptions, including risk
free rate, inflation, and operating assumptions including mortality,
morbidity, expenses, fund yield, bonus rate, dividend rates and
lapse ratio (including consideration of policyholder behavior) are the
key inputs used to estimate these long term liabilities.
Further these liabilities are measured on a market consistent basis
in accordance with the Solvency Margin (Risk Based Capital) Rules
2015 with effect from 01st January 2016, issued under Sections
105 and 26 (1) of the Regulation of Insurance Industry Act, No. 43
of 2000.
Our audit procedures among others included;
• Assessing the competence, capabilities and objectivity of
management’s external actuarial expert and company’s staff
involved in the policy holders liability valuation process.
• Assessing the controls adopted (including IT related controls)
by the Company in providing accurate and complete information
to the independent appointed actuary for the purpose of the
policy holders liability valuation.
• Assessing the Company’s methodology for calculating the
policyholder liabilities to be in line with guidelines of Insurance
Regulatory Commission of Sri Lanka (Risk Based Capital Rules
2015).
• Reconciling the movements in policyholder liabilities during the
year with the movements in the financial results reported in
separate funds.

134 Union Assurance PLC
INDEPENDENT AUDITORS’ REPORT
Risk Description Our Response
Accordingly, due to the value of the liability balance relative to total
liabilities and subjectivity of the significant judgments involved and
estimate uncertainty associated with the valuation, we considered
Insurance contract liabilities as a Key Audit Matter.
• Assessing and challenging the key assumptions and reserving
methodologies driving the value of the insurance liabilities by,
– Comparing the assumptions to expectations based on,
current trends and our own industry knowledge
– Evaluating the level of prudence applied and compared this
to prior periods;
– Applying our industry knowledge to benchmark the
Company’s reserving methodologies assumptions, and
estimates of losses
• Independently re-calculating of the Universal Life fund balances
as at the reporting period for selected products of the Company.
• Verifying the existence, market valuation of the financial
investments and the related investment income in relation to
the financial instruments attributed to the unit-linked fund.
• Assessing adequacy of the disclosures in the financial
statements.
We used an actuarial specialist to assist us in performing our
procedures in this area.
IT Systems and Controls
Risk Description Our Response
Many financial reporting controls of the Company depend on the
correct functioning of operational and financial IT systems. For
example interfaces between policy administration and financial
reporting systems, or automated controls that prevent or detect
inaccurate or incomplete transfers of financial information etc. If
these systems or controls fail, a significant risk of error in reported
financial information can arise from the failure to transfer data
appropriately between systems and/or inappropriate changes being
made to financial data or systems.
This is an area of significant risk in our audit due to the dependency
of the financial reporting process on the IT systems and controls
and accordingly identified as a Key Audit Matter.
Our audit procedures among others included;
• Assessing the governance and higher-level controls in place
across the IT Environment, including the approach to policy
design, review and awareness, and IT Risk Management
practices.
• Testing general IT controls involving restrictions on system
access, permissions and responsibilities of the authorized
users, process for approving changes to the systems etc.
• Testing controls over specific application controls which are
required to be operating effectively to mitigate the risk of
misstatement in the financial statements.
• Testing manual compensating controls, such as reconciliations
between systems and other information sources and performed
additional substantive testing such as using extended sample
sizes and performing data analysis routines over the full
population of transactions.
Union Assurance at a Glance Management Discussion and Analysis Stewardship Financial Statements Supplementary Information
135Annual Report 2020
Other Information
Management is responsible for the
other information. The other information
comprises the information included in
the annual report, but does not include
the financial statement and our auditor’s
report there on.
Our opinion on the financial statements
does not cover the other information and
we will not express any form of assurance
conclusion thereon.
In connection with our audit of the
financial statements, our responsibility is
to read the other information identified
above when it becomes available and,
in doing so, consider whether the other
information is materially inconsistent with
the financial statements or our knowledge
obtained in the audit, or otherwise appears
to be materially misstated.
When we read the annual report, if
we conclude that there is a material
misstatement therein, we are required to
communicate the matter to those charged
with governance. We have nothing to
report in this regard.
Responsibilities of Management and Those Charged with Governance for the Financial Statements
Management is responsible for the
preparation of financial statements that
give a true and fair view in accordance
with Sri Lanka Accounting Standards, and
for such internal control as management
determines is necessary to enable the
preparation of financial statements that
are free from material misstatement,
whether due to fraud or error.
In preparing the financial statements,
management is responsible for assessing
the Company and Investee’s ability to
continue as a going concern, disclosing,
as applicable, matters related to going
concern and using the going concern
basis of accounting unless management
either intends to liquidate the Company
or to cease operations, or has no realistic
alternative but to do so.
Those charged with governance are
responsible for overseeing the Company
and Investee’s financial reporting process.
Auditor’s Responsibilities for the Audit of the Financial Statements
Our objectives are to obtain reasonable
assurance about whether the financial
statements as a whole are free from
material misstatement, whether due to
fraud or error, and to issue an auditor’s
report that includes our opinion. Reasonable
assurance is a high level of assurance, but
is not a guarantee that and audit conducted
in accordance with SLAuSs will always
detect a material misstatement when
it exists. Misstatements can arise from
fraud or error and are considered material
if, individually or in the aggregate, they
could reasonably be expected to influence
the economic decisions of users taken on
the basis of these financial statements.
As part of an audit in accordance with
SLAuSs, we exercise professional
judgment and maintain professional
skepticism throughout the audit. We also:
• Identify and assess the risks of
material misstatement of the financial
statements, whether due to fraud
or error, design and perform audit
procedures responsive to those risks,
and obtain audit evidence that is
sufficient and appropriate to provide
a basis for our opinion. The risk of not
detecting a material misstatement
resulting from fraud is higher than for
one resulting from error, as fraud may
involve collusion, forgery, intentional
omissions, misrepresentations, or the
override of internal control.
• Obtain an understanding of internal
control relevant to the audit in order
to design audit procedures that are
appropriate in the circumstances, but
not for the purpose of expressing an
opinion on the effectiveness of the
Company’s internal control.
• Evaluate the appropriateness of
accounting policies used and the
reasonableness of accounting
estimates and related disclosures
made by management.
• Conclude on the appropriateness
of management’s use of the going
concern basis of accounting and,
based on the audit evidence obtained,
whether a material uncertainty exists
related to events or conditions that
may cast significant doubt on the
Company’s ability to continue as a going
concern. If we conclude that a material
uncertainty exists, we are required to
draw attention in our auditor’s report to
the related disclosures in the financial
statements or, if such disclosures are
inadequate, to modify our opinion. Our
conclusions are based on the audit
evidence obtained up to the date of
our auditor’s report. However, future
events or conditions may cause the
Company to cease to continue as a
going concern.
• Evaluate the overall presentation,
structure and content of the financial
statements, including the disclosures,
and whether the financial statements
represent the underlying transactions
and events in a manner that achieves
fair presentation.
We communicate with those charged
with governance regarding, among other
matters, the planned scope and timing
of the audit and significant audit findings,
including any significant deficiencies in
internal control that we identify during
our audit.

136 Union Assurance PLC
INDEPENDENT AUDITORS’ REPORT
We also provide those charged with
governance with a statement that we
have complied with ethical requirements
in accordance with the Code of Ethics
regarding independence, and to
communicate with them all relationships
and other matters that may reasonably be
thought to bear on our independence, and
where applicable, related safeguards.
From the matters communicated with
those charged with governance, we
determine those matters that were of
most significance in the audit of the
financial statements of the current period
and are therefore the key audit matters.
We describe these matters in our auditor’s
report unless law or regulation precludes
public disclosure about the matter or
when, in extremely rare circumstances,
we determine that a matter should not be
communicated in our report because the
adverse consequences of doing so would
reasonably be expected to outweigh
the public interest benefits of such
communication.
Report on Other Legal and Regulatory Requirements
As required by section 163 (2) of the
Companies Act No. 07 of 2007, we
have obtained all the information and
explanations that were required for the
audit and, as far as appears from our
examination, proper accounting records
have been kept by the Company.
As required by Section 47(2) of the
Regulation of Insurance Industry Act,
No.43 of 2000 and amendments thereto,
as far as appears from our examination, the
accounting records of the Company have
been maintained in the manner required
by the rules issued by the Insurance
Regulatory Commission of Sri Lanka, so
as to clearly indicate the true and fair view
of the financial position of the Company.
CA Sri Lanka membership number of
the engagement partner responsible for
signing this independent auditor’s report
is FCA 3272
CHARTERED ACCOUNTANTS
Colombo, Sri Lanka
25 February 2021
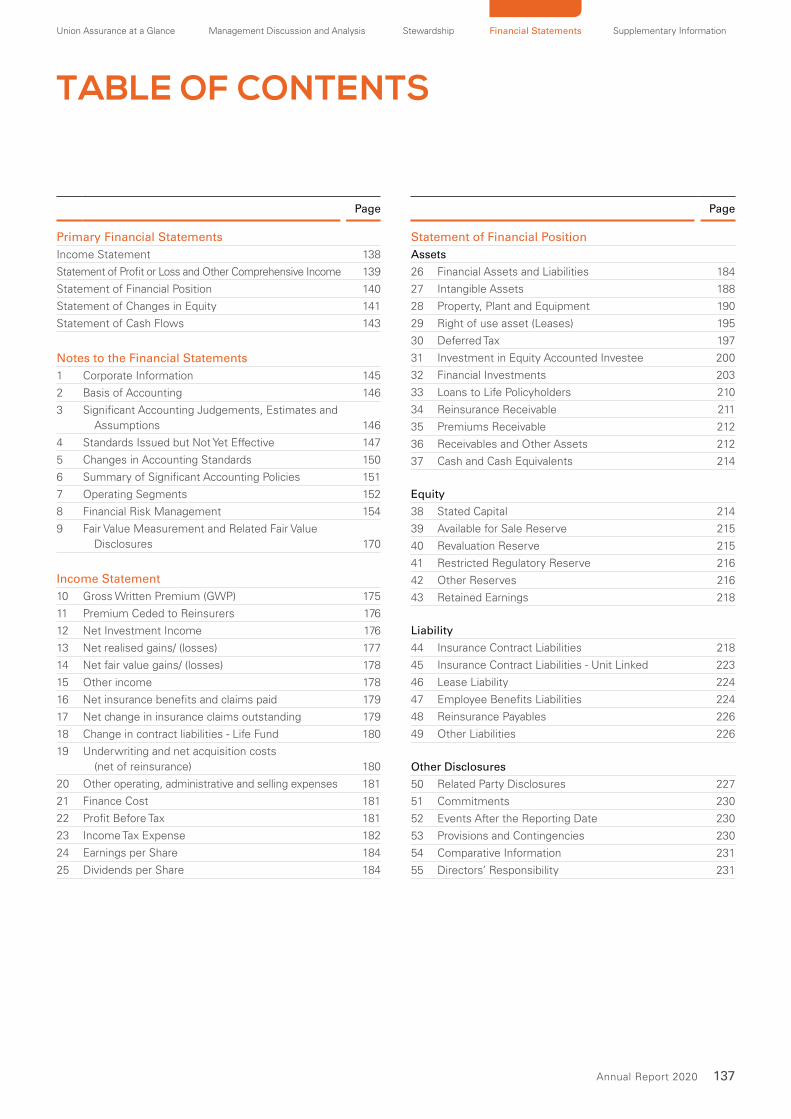
Union Assurance at a Glance Management Discussion and Analysis Stewardship Financial Statements Supplementary Information
137Annual Report 2020
TABLE OF CONTENTS
Page
Primary Financial Statements
Income Statement 138
Statement of Profit or Loss and Other Comprehensive Income 139
Statement of Financial Position 140
Statement of Changes in Equity 141
Statement of Cash Flows 143
Notes to the Financial Statements
1 Corporate Information 145
2 Basis of Accounting 146
3 Significant Accounting Judgements, Estimates and
Assumptions 146
4 Standards Issued but Not Yet Effective 147
5 Changes in Accounting Standards 150
6 Summary of Significant Accounting Policies 151
7 Operating Segments 152
8 Financial Risk Management 154
9 Fair Value Measurement and Related Fair Value
Disclosures 170
Income Statement
10 Gross Written Premium (GWP) 175
11 Premium Ceded to Reinsurers 176
12 Net Investment Income 176
13 Net realised gains/ (losses) 177
14 Net fair value gains/ (losses) 178
15 Other income 178
16 Net insurance benefits and claims paid 179
17 Net change in insurance claims outstanding 179
18 Change in contract liabilities - Life Fund 180
19 Underwriting and net acquisition costs
(net of reinsurance) 180
20 Other operating, administrative and selling expenses 181
21 Finance Cost 181
22 Profit Before Tax 181
23 Income Tax Expense 182
24 Earnings per Share 184
25 Dividends per Share 184
Page
Statement of Financial Position
Assets
26 Financial Assets and Liabilities 184
27 Intangible Assets 188
28 Property, Plant and Equipment 190
29 Right of use asset (Leases) 195
30 Deferred Tax 197
31 Investment in Equity Accounted Investee 200
32 Financial Investments 203
33 Loans to Life Policyholders 210
34 Reinsurance Receivable 211
35 Premiums Receivable 212
36 Receivables and Other Assets 212
37 Cash and Cash Equivalents 214
Equity
38 Stated Capital 214
39 Available for Sale Reserve 215
40 Revaluation Reserve 215
41 Restricted Regulatory Reserve 216
42 Other Reserves 216
43 Retained Earnings 218
Liability
44 Insurance Contract Liabilities 218
45 Insurance Contract Liabilities - Unit Linked 223
46 Lease Liability 224
47 Employee Benefits Liabilities 224
48 Reinsurance Payables 226
49 Other Liabilities 226
Other Disclosures
50 Related Party Disclosures 227
51 Commitments 230
52 Events After the Reporting Date 230
53 Provisions and Contingencies 230
54 Comparative Information 231
55 Directors’ Responsibility 231

138 Union Assurance PLC
INCOME STATEMENT
For the year ended 31 December 2020 2019 Change
Note Page Rs. ‘000 Rs. ‘000 %
Gross written premium 10 175 13,108,605 11,647,756 13
Premium ceded to reinsurers 11 176 (589,877) (525,782) 12
Net written premium 12,518,728 11,121,974 13
Other revenue
Net investment income 12 176 5,032,432 4,564,844 10
Net realised gains/ (losses) 13 177 (402,181) 24,313 (1,754)
Net fair value gains/ (losses) 14 178 277,179 (297,847) 193
Other income 15 178 43,584 48,644 (10)
Total other revenue 4,951,014 4,339,954 14
Total net revenue 17,469,742 15,461,928 13
Benefits, claims and expenses
Net insurance benefits and claims paid 16 179 (3,688,507) (3,668,351) 1
Net change in insurance claims outstanding 17 179 (105,072) 164,467 (164)
Change in contract liabilities - Life Fund 18 180 (6,207,253) (4,983,273) 25
Underwriting and net acquisition costs (net of reinsurance) 19 180 (2,145,130) (1,857,396) 15
Other operating, administrative and selling expenses 20 181 (3,256,106) (3,013,755) 8
Depreciation and amortisation 27/28/29 188/190/195 (390,271) (299,894) 30
Total benefits, claims and expenses (15,792,339) (13,658,202) 16
Profit from operations 1,677,403 1,803,726 (7)
Share of results of equity accounted investee, net of tax 31 200 116,438 104,736 11
Profit before tax 22 181 1,793,841 1,908,462 (6)
Income tax expenses 23 182 (873,245) (750,432) 16
Profit for the year 920,596 1,158,030 (21)
Earnings per share
Basic (Rs.) 24 184 15.62 19.65 (21)
Diluted (Rs.) 24 184 15.62 19.65 (21)
The notes to the financial statements as set out on pages 145 to 231 form an integral part of these financial statements.
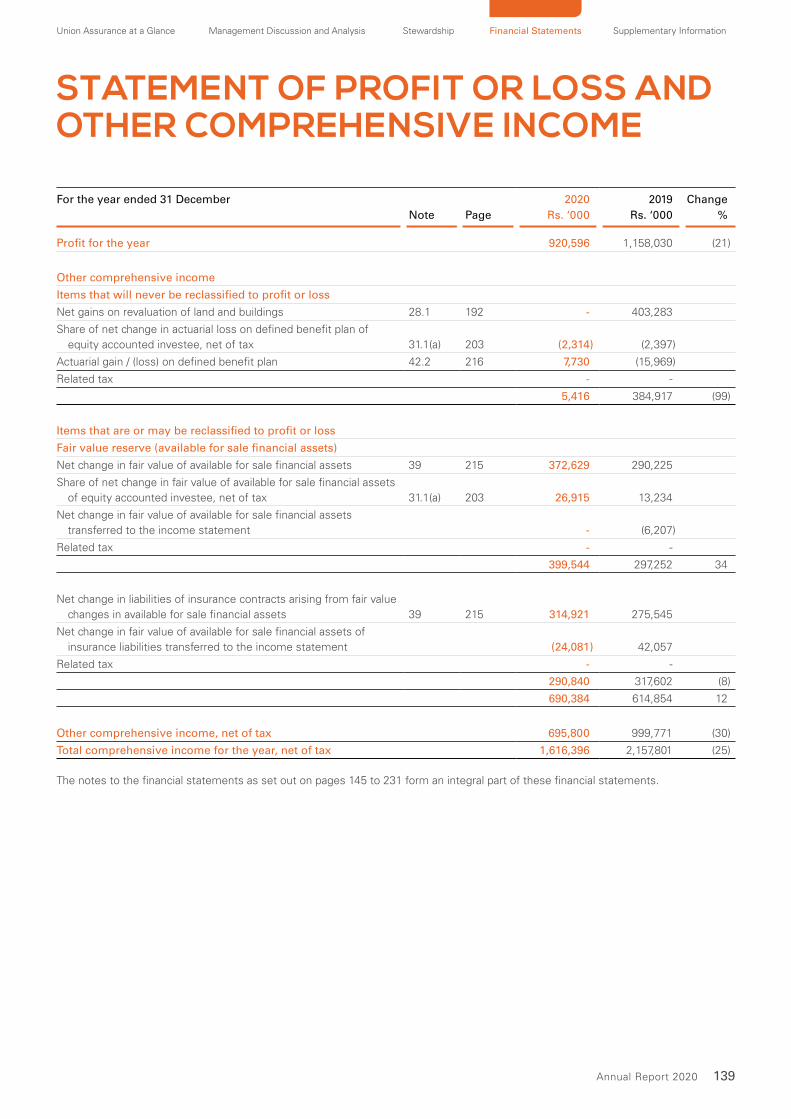
Union Assurance at a Glance Management Discussion and Analysis Stewardship Financial Statements Supplementary Information
139Annual Report 2020
STATEMENT OF PROFIT OR LOSS AND OTHER COMPREHENSIVE INCOME
For the year ended 31 December 2020 2019 Change
Note Page Rs. ‘000 Rs. ‘000 %
Profit for the year 920,596 1,158,030 (21)
Other comprehensive income
Items that will never be reclassified to profit or loss
Net gains on revaluation of land and buildings 28.1 192 - 403,283
Share of net change in actuarial loss on defined benefit plan of
equity accounted investee, net of tax 31.1(a) 203 (2,314) (2,397)
Actuarial gain / (loss) on defined benefit plan 42.2 216 7,730 (15,969)
Related tax - -
5,416 384,917 (99)
Items that are or may be reclassified to profit or loss
Fair value reserve (available for sale financial assets)
Net change in fair value of available for sale financial assets 39 215 372,629 290,225
Share of net change in fair value of available for sale financial assets
of equity accounted investee, net of tax 31.1(a) 203 26,915 13,234
Net change in fair value of available for sale financial assets
transferred to the income statement - (6,207)
Related tax - -
399,544 297,252 34
Net change in liabilities of insurance contracts arising from fair value
changes in available for sale financial assets 39 215 314,921 275,545
Net change in fair value of available for sale financial assets of
insurance liabilities transferred to the income statement (24,081) 42,057
Related tax - -
290,840 317,602 (8)
690,384 614,854 12
Other comprehensive income, net of tax 695,800 999,771 (30)
Total comprehensive income for the year, net of tax 1,616,396 2,157,801 (25)
The notes to the financial statements as set out on pages 145 to 231 form an integral part of these financial statements.
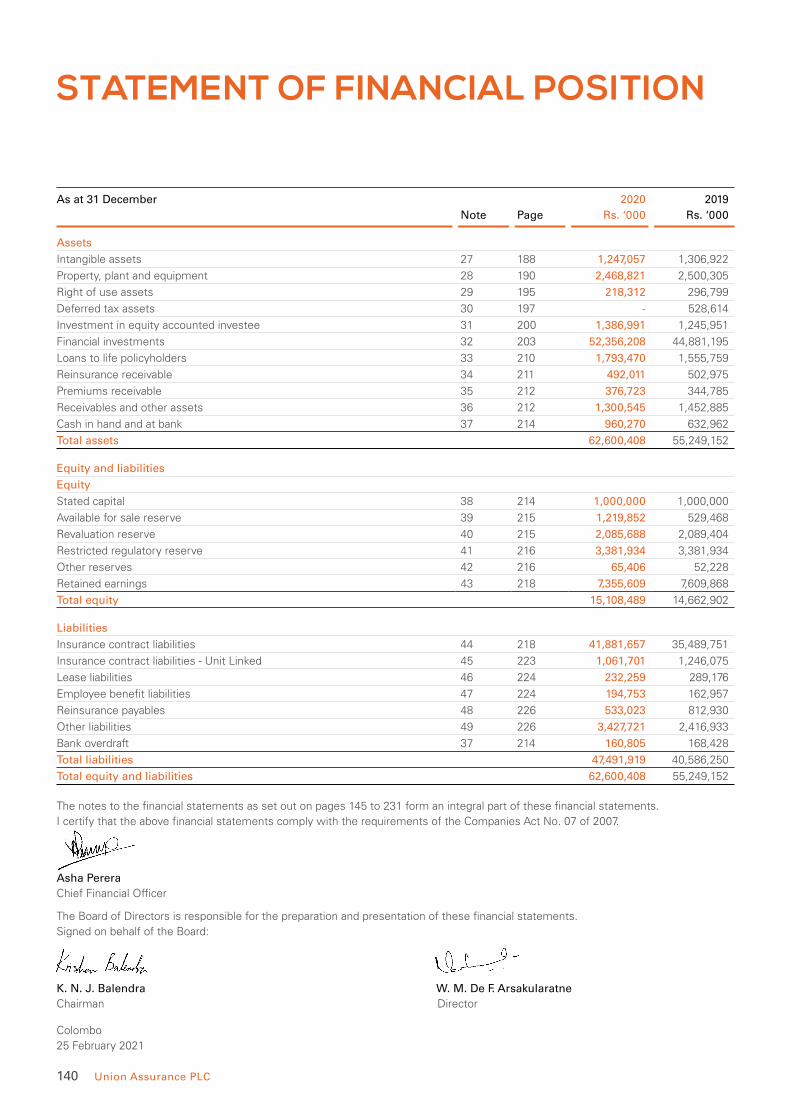
140 Union Assurance PLC
As at 31 December 2020 2019
Note Page Rs. ‘000 Rs. ‘000
Assets
Intangible assets 27 188 1,247,057 1,306,922
Property, plant and equipment 28 190 2,468,821 2,500,305
Right of use assets 29 195 218,312 296,799
Deferred tax assets 30 197 - 528,614
Investment in equity accounted investee 31 200 1,386,991 1,245,951
Financial investments 32 203 52,356,208 44,881,195
Loans to life policyholders 33 210 1,793,470 1,555,759
Reinsurance receivable 34 211 492,011 502,975
Premiums receivable 35 212 376,723 344,785
Receivables and other assets 36 212 1,300,545 1,452,885
Cash in hand and at bank 37 214 960,270 632,962
Total assets 62,600,408 55,249,152
Equity and liabilities
Equity
Stated capital 38 214 1,000,000 1,000,000
Available for sale reserve 39 215 1,219,852 529,468
Revaluation reserve 40 215 2,085,688 2,089,404
Restricted regulatory reserve 41 216 3,381,934 3,381,934
Other reserves 42 216 65,406 52,228
Retained earnings 43 218 7,355,609 7,609,868
Total equity 15,108,489 14,662,902
Liabilities
Insurance contract liabilities 44 218 41,881,657 35,489,751
Insurance contract liabilities - Unit Linked 45 223 1,061,701 1,246,075
Lease liabilities 46 224 232,259 289,176
Employee benefit liabilities 47 224 194,753 162,957
Reinsurance payables 48 226 533,023 812,930
Other liabilities 49 226 3,427,721 2,416,933
Bank overdraft 37 214 160,805 168,428
Total liabilities 47,491,919 40,586,250
Total equity and liabilities 62,600,408 55,249,152
The notes to the financial statements as set out on pages 145 to 231 form an integral part of these financial statements.
I certify that the above financial statements comply with the requirements of the Companies Act No. 07 of 2007.
Asha Perera
Chief Financial Officer
The Board of Directors is responsible for the preparation and presentation of these financial statements.
Signed on behalf of the Board:
K. N. J. Balendra W. M. De F. Arsakularatne
Chairman Director
Colombo
25 February 2021
STATEMENT OF FINANCIAL POSITION
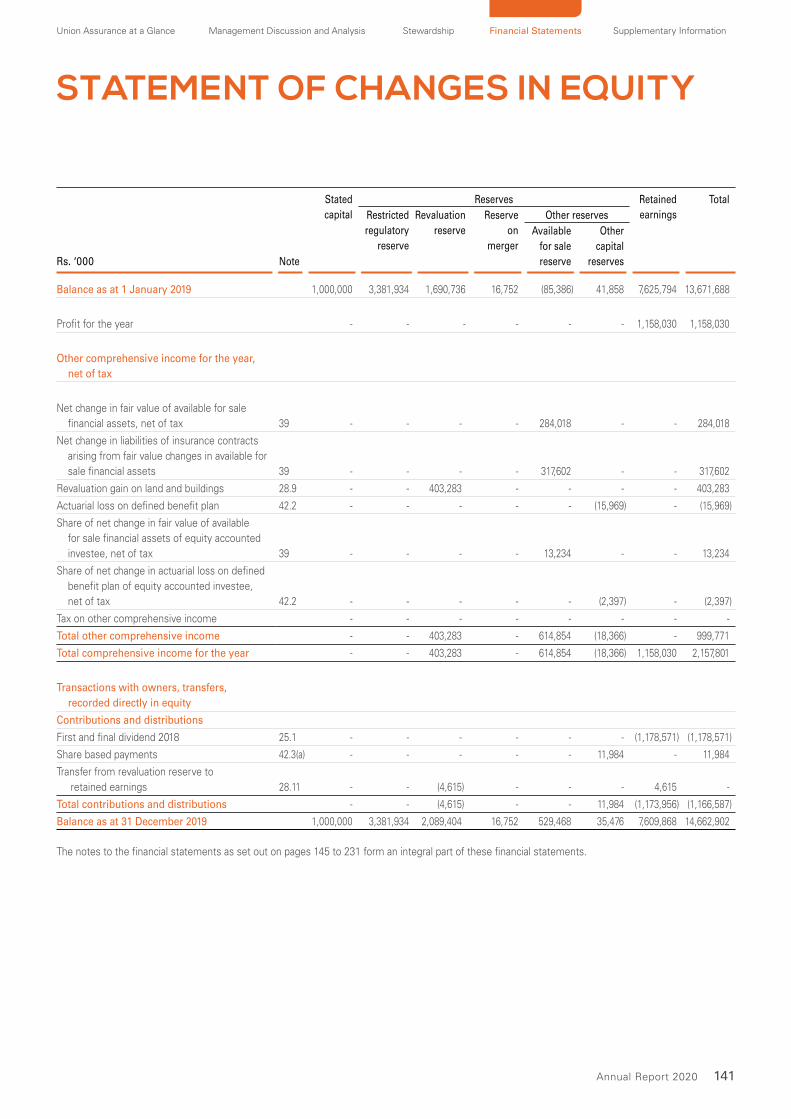
Union Assurance at a Glance Management Discussion and Analysis Stewardship Financial Statements Supplementary Information
141Annual Report 2020
Stated
capital
Reserves Retained
earnings
Total
Restricted
regulatory
reserve
Revaluation
reserve
Reserve
on
merger
Other reserves
Rs. ‘000 Note
Available
for sale
reserve
Other
capital
reserves
Balance as at 1 January 2019 1,000,000 3,381,934 1,690,736 16,752 (85,386) 41,858 7,625,794 13,671,688
Profit for the year - - - - - - 1,158,030 1,158,030
Other comprehensive income for the year,
net of tax
Net change in fair value of available for sale
financial assets, net of tax 39 - - - - 284,018 - - 284,018
Net change in liabilities of insurance contracts
arising from fair value changes in available for
sale financial assets 39 - - - - 317,602 - - 317,602
Revaluation gain on land and buildings 28.9 - - 403,283 - - - - 403,283
Actuarial loss on defined benefit plan 42.2 - - - - - (15,969) - (15,969)
Share of net change in fair value of available
for sale financial assets of equity accounted
investee, net of tax 39 - - - - 13,234 - - 13,234
Share of net change in actuarial loss on defined
benefit plan of equity accounted investee,
net of tax 42.2 - - - - - (2,397) - (2,397)
Tax on other comprehensive income - - - - - - - -
Total other comprehensive income - - 403,283 - 614,854 (18,366) - 999,771
Total comprehensive income for the year - - 403,283 - 614,854 (18,366) 1,158,030 2,157,801
Transactions with owners, transfers,
recorded directly in equity
Contributions and distributions
First and final dividend 2018 25.1 - - - - - - (1,178,571) (1,178,571)
Share based payments 42.3(a) - - - - - 11,984 - 11,984
Transfer from revaluation reserve to
retained earnings 28.11 - - (4,615) - - - 4,615 -
Total contributions and distributions - - (4,615) - - 11,984 (1,173,956) (1,166,587)
Balance as at 31 December 2019 1,000,000 3,381,934 2,089,404 16,752 529,468 35,476 7,609,868 14,662,902
The notes to the financial statements as set out on pages 145 to 231 form an integral part of these financial statements.
STATEMENT OF CHANGES IN EQUITY

142 Union Assurance PLC
STATEMENT OF CHANGES IN EQUITY
Stated
capital
Reserves Retained
earnings
Total
Restricted
regulatory
reserve
Revaluation
reserve
Reserve
on
merger
Other reserves
Rs. ‘000 Note
Available
for sale
reserve
Other
capital
reserves
Balance as at 1 January 2020 1,000,000 3,381,934 2,089,404 16,752 529,468 35,476 7,609,868 14,662,902
Profit for the year - - - - - - 920,596 920,596
Other comprehensive income for the year,
net of tax
Net change in fair value of available for sale
financial assets 39 - - - - 372,629 - - 372,629
Net change in liabilities of insurance contracts
arising from fair value changes in available for
sale financial assets 39 - - - - 290,840 - - 290,840
Revaluation gain on land and buildings 28.9 - - - - - - - -
Actuarial gain on defined benefit plan 42.2 - - - - - 7,730 - 7,730
Share of net change in fair value of available
for sale financial assets of equity accounted
investee, net of tax 39 - - - - 26,915 - - 26,915
Share of net change in actuarial loss on defined
benefit plan of equity accounted investee,
net of tax 42.2 - - - - - (2,314) - (2,314)
Tax on other comprehensive income - - - - - - - -
Total other comprehensive income - - - - 690,384 5,416 - 695,800
Total comprehensive income for the year - - - - 690,384 5,416 920,596 1,616,396
Transactions with owners, transfers,
recorded directly in equity
Contributions and distributions
First and final dividend 2019 25.1 - - - - - - (1,178,571) (1,178,571)
Share based payments 42.3(a) - - - - - 7,762 - 7,762
Transfer from revaluation reserve to retained
earnings 28.11 - - (3,716) - - - 3,716 -
Total contributions and distributions - - (3,716) - - 7,762 (1,174,855) (1,170,809)
Balance as at 31 December 2020 1,000,000 3,381,934 2,085,688 16,752 1,219,852 48,654 7,355,609 15,108,489
The notes to the financial statements as set out on pages 145 to 231 form an integral part of these financial statements.
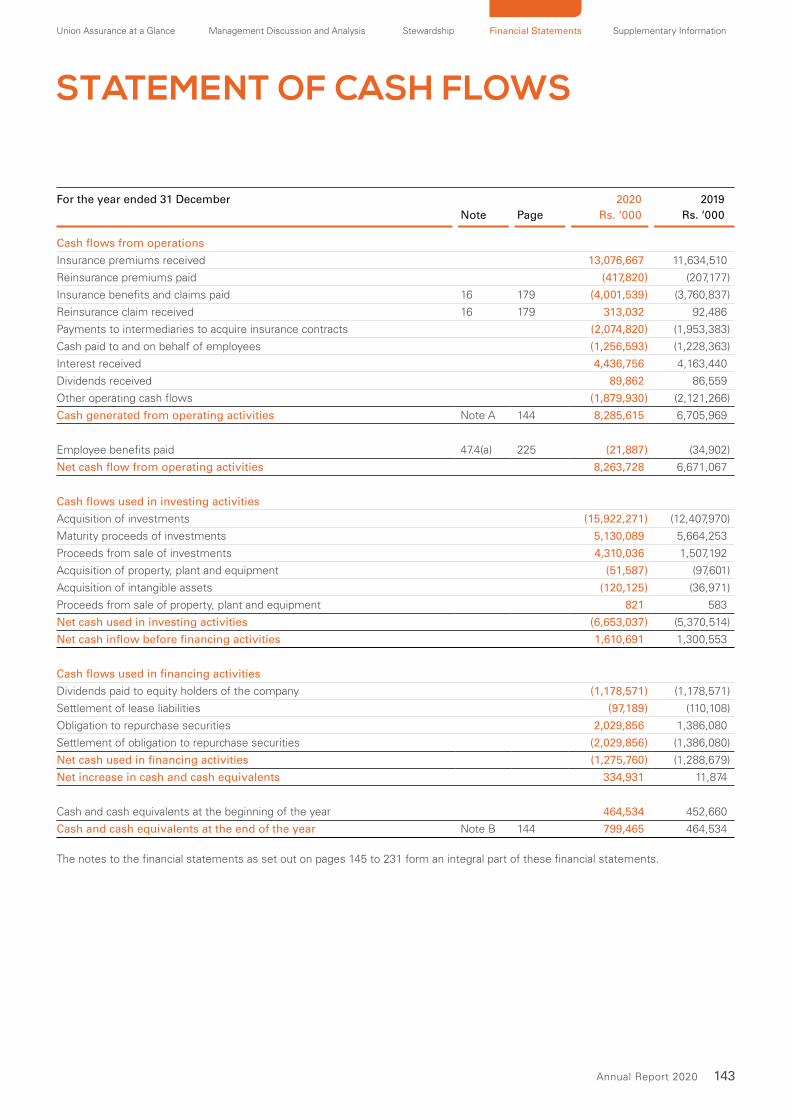
Union Assurance at a Glance Management Discussion and Analysis Stewardship Financial Statements Supplementary Information
143Annual Report 2020
STATEMENT OF CASH FLOWS
For the year ended 31 December 2020 2019
Note Page Rs. ‘000 Rs. ‘000
Cash flows from operations
Insurance premiums received 13,076,667 11,634,510
Reinsurance premiums paid (417,820) (207,177)
Insurance benefits and claims paid 16 179 (4,001,539) (3,760,837)
Reinsurance claim received 16 179 313,032 92,486
Payments to intermediaries to acquire insurance contracts (2,074,820) (1,953,383)
Cash paid to and on behalf of employees (1,256,593) (1,228,363)
Interest received 4,436,756 4,163,440
Dividends received 89,862 86,559
Other operating cash flows (1,879,930) (2,121,266)
Cash generated from operating activities Note A 144 8,285,615 6,705,969
Employee benefits paid 47.4(a) 225 (21,887) (34,902)
Net cash flow from operating activities 8,263,728 6,671,067
Cash flows used in investing activities
Acquisition of investments (15,922,271) (12,407,970)
Maturity proceeds of investments 5,130,089 5,664,253
Proceeds from sale of investments 4,310,036 1,507,192
Acquisition of property, plant and equipment (51,587) (97,601)
Acquisition of intangible assets (120,125) (36,971)
Proceeds from sale of property, plant and equipment 821 583
Net cash used in investing activities (6,653,037) (5,370,514)
Net cash inflow before financing activities 1,610,691 1,300,553
Cash flows used in financing activities
Dividends paid to equity holders of the company (1,178,571) (1,178,571)
Settlement of lease liabilities (97,189) (110,108)
Obligation to repurchase securities 2,029,856 1,386,080
Settlement of obligation to repurchase securities (2,029,856) (1,386,080)
Net cash used in financing activities (1,275,760) (1,288,679)
Net increase in cash and cash equivalents 334,931 11,874
Cash and cash equivalents at the beginning of the year 464,534 452,660
Cash and cash equivalents at the end of the year Note B 144 799,465 464,534
The notes to the financial statements as set out on pages 145 to 231 form an integral part of these financial statements.
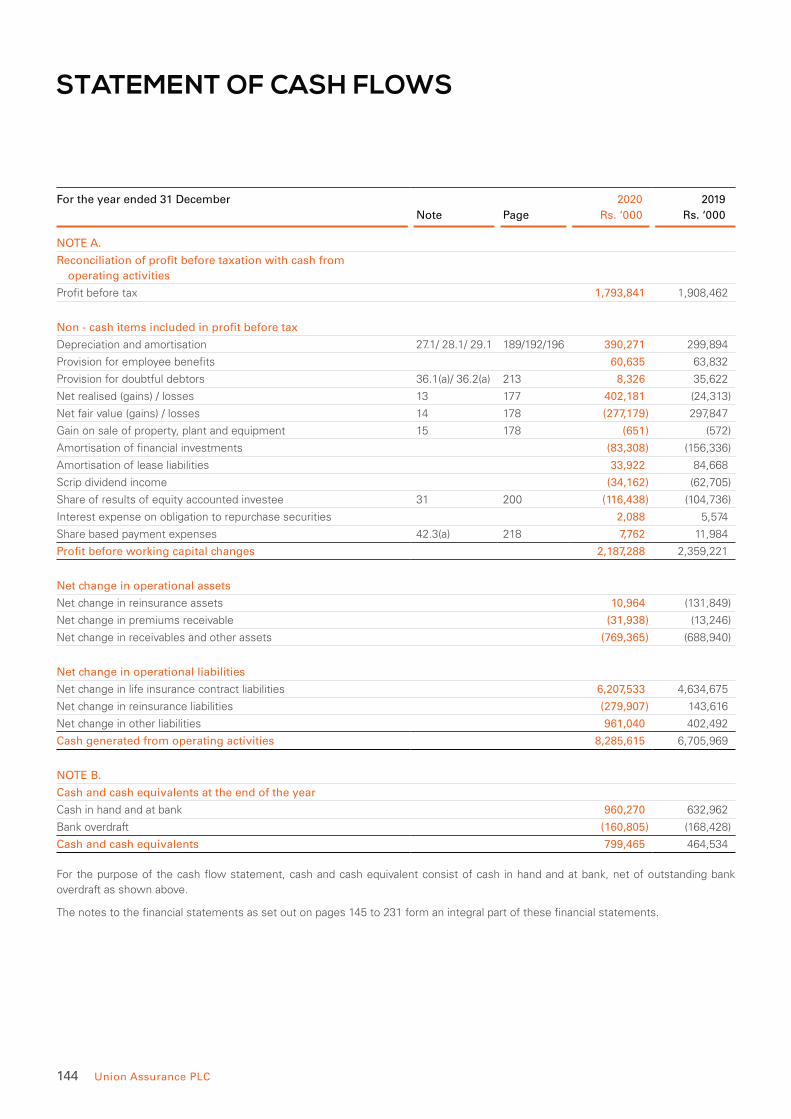
144 Union Assurance PLC
STATEMENT OF CASH FLOWS
For the year ended 31 December 2020 2019
Note Page Rs. ‘000 Rs. ‘000
NOTE A.
Reconciliation of profit before taxation with cash from
operating activities
Profit before tax 1,793,841 1,908,462
Non - cash items included in profit before tax
Depreciation and amortisation 27.1/ 28.1/ 29.1 189/192/196 390,271 299,894
Provision for employee benefits 60,635 63,832
Provision for doubtful debtors 36.1(a)/ 36.2(a) 213 8,326 35,622
Net realised (gains) / losses 13 177 402,181 (24,313)
Net fair value (gains) / losses 14 178 (277,179) 297,847
Gain on sale of property, plant and equipment 15 178 (651) (572)
Amortisation of financial investments (83,308) (156,336)
Amortisation of lease liabilities 33,922 84,668
Scrip dividend income (34,162) (62,705)
Share of results of equity accounted investee 31 200 (116,438) (104,736)
Interest expense on obligation to repurchase securities 2,088 5,574
Share based payment expenses 42.3(a) 218 7,762 11,984
Profit before working capital changes 2,187,288 2,359,221
Net change in operational assets
Net change in reinsurance assets 10,964 (131,849)
Net change in premiums receivable (31,938) (13,246)
Net change in receivables and other assets (769,365) (688,940)
Net change in operational liabilities
Net change in life insurance contract liabilities 6,207,533 4,634,675
Net change in reinsurance liabilities (279,907) 143,616
Net change in other liabilities 961,040 402,492
Cash generated from operating activities 8,285,615 6,705,969
NOTE B.
Cash and cash equivalents at the end of the year
Cash in hand and at bank 960,270 632,962
Bank overdraft (160,805) (168,428)
Cash and cash equivalents 799,465 464,534
For the purpose of the cash flow statement, cash and cash equivalent consist of cash in hand and at bank, net of outstanding bank
overdraft as shown above.
The notes to the financial statements as set out on pages 145 to 231 form an integral part of these financial statements.

Union Assurance at a Glance Management Discussion and Analysis Stewardship Financial Statements Supplementary Information
145Annual Report 2020
NOTES TO THE FINANCIAL STATEMENTS
1 CORPORATE INFORMATION Reporting Entity
Union Assurance PLC (the ‘Company’) is a public limited
liability Company incorporated and domiciled in Sri Lanka
and the ordinary shares of the Company are listed on
the Colombo Stock Exchange. The registered office and
principal place of business of the Company is located at
No. 20, St. Michael’s Road, Colombo 03.
Parent Entity and Ultimate Parent Entity
The Company’s controlling entity and ultimate parent
undertaking is John Keells Holdings PLC which is
incorporated in Sri Lanka.
Principal Activities and Nature of Operations The Company
Union Assurance PLC is in the Life insurance business
providing Life insurance solutions for both Individual and
corporate customers. There were no significant changes
in the nature of the principal activities of the Company
during the financial year under review.
Associate Company
Fairfirst Insurance Limited is in the Non - Life insurance
business and there were no significant changes in the
nature of the principal activity of the associate during
the year. Union Assurance PLC owns 22% stake of the
Fairfirst Insurance Limited (2019 - 22%). The registered
office and principal place of business of the Company is
located at Access Towers 11 (14th floor), 278/4, Union
Place Colombo 02, Sri Lanka.
Number of Employees
The staff strength of the Company as at 31 December
2020 is 795 (2019 – 764).
Financial Statements
The financial statements for the year ended 31 December
2020, comprise of the Company and the results of
the equity accounted investee. The results of equity
accounted investee of the Company, Fairfirst Insurance
Limited has been presented in the financial statements in
accordance with LKAS 27.
Approval of Financial Statements
The financial statements for the year ended 31 December
2020 were authorised for issue by the Directors on
25 February 2021.
Responsibility for Financial Statements
The responsibility of the Board of Directors in relation to
the financial statements is set out in the Statement of
Directors’ Responsibility in the annual report.
Statement of Compliance
The financial statements have been prepared in
accordance with the Sri Lanka Accounting Standards
(SLFRSs / LKASs) as issued by the Institute of Chartered
Accountants of Sri Lanka (ICASL), the requirements
of the Companies Act No. 07 of 2007, Regulation of
Insurance Industry (RII) Act No. 43 of 2000, Statement of
Recommended Practice (SORP) issued by the ICASL and
the listing rules of the Colombo Stock Exchange.
These financial statements include the following
components:
• an Income Statement and Statement of Profit or
Loss and Other Comprehensive Income providing
information on the financial performance of the
Company for the year under review; (Refer pages 138
and 139)
• a Statement of Financial Position providing information
on the financial position of the Company as at the year
end; (Refer page 140)
• a Statement of Changes in Equity depicting all changes
in shareholders’ funds during the year under review of
the Company; (Refer pages 141 and 142)
• a Statement of Cash Flows providing information to
the users, on the ability of the Company to generate
cash and cash equivalents and utilisation of those cash
flows in the business; (Refer pages 143 and 144)
• Notes to the financial statements comprising
accounting policies and other explanatory information.
(Refer pages 145 to 231)
The Company has opted to defer full application of SLFRS
9 - Financial Instruments, until the earlier of 2023 or
adopting of SLFRS 17 - Insurance Contracts, exercising
the temporary exemption provided to an insurance
company. (Refer Note 4.1).

146 Union Assurance PLC
NOTES TO THE FINANCIAL STATEMENTS
2 BASIS OF ACCOUNTING Basis of Measurement
These financial statements have been prepared on an accruals basis and under the historical cost convention except for the
following material items, which are measured on an alternative basis on each reporting date:
Items Measurement basis Note Page
Financial assets
Non - derivative financial assets at fair value
through profit or loss
Fair value
9 170
Available for sale financial assets Fair value 9 170
Financial assets - Unit linked Fair value 9 170
Non-Financial assets / liabilities
Freehold land and buildings Fair value 28.7 193
Insurance contract liabilities Actuarially valued in line with the guidelines issued by the
Insurance Regulatory Commission of Sri Lanka (IRCSL) 44 218
Net defined benefit liabilities Actuarially valued and recognised at present value 47 224
No adjustments have been made for inflationary factors affecting the financial statements.
Functional and Presentation Currency
The Financial Statements of the Company are presented
in Sri Lankan Rupees (LKR), which is the primary economic
environment in which the Company operates and is also
the Functional Currency.
There was no change in the Company’s Presentation and
Functional Currency during the year under review.
Materiality and Aggregation
Each item which is similar in nature is presented together
if material. Items of dissimilar nature or function are
presented separately unless they are immaterial as
permitted by the Sri Lanka Accounting Standard LKAS 1 -
Presentation of financial statements.
All values presented in rupees have been rounded to
the nearest rupees thousand (Rs’000), except when
otherwise indicated.
Going Concern
Notwithstanding the Company concluding the reporting
year on a positive note the Directors have made an
assessment of the Company’s ability to continue as a
going concern and is satisfied that it has the resources
to continue in business for the foreseeable future.
The management has also assessed the existing and
anticipated effects of COVID-19 on the Company and the
appropriateness of the use of the going concern basis.
Furthermore, management is not aware of any material
uncertainties that may cast significant doubt upon
the Company’s ability to continue as a going concern.
Therefore, the financial statements continue to be
prepared on a going concern basis.
Supplementary Statements - Statement of Financial Position of the Life Insurance Fund
Supplementary statement of financial position of the Life
insurance fund together with the notes are disclosed in
pages 248 to 255, continuing the past practice which is a
requirement of the Statement of Recommended Practice
(SoRP) for insurance contracts then applicable, adopted
by the ICASL.
Comparative Information
The presentation and classification of assets and liabilities
in the financial statements of the previous year have been
amended, where relevant for better presentation and to
be comparable with those of the current year.
3 SIGNIFICANT ACCOUNTING JUDGEMENTS, ESTIMATES AND ASSUMPTIONSIn preparing these financial statements, management has
made judgements, estimates and assumptions that affect
the application of the Company’s accounting policies and
the reported amounts of assets, liabilities, income and
expenses. Actual results may differ from these estimates.
Estimates and underlying assumptions are reviewed on
an ongoing basis. Revisions to estimates are recognised
prospectively.

Union Assurance at a Glance Management Discussion and Analysis Stewardship Financial Statements Supplementary Information
147Annual Report 2020
3.1 Information about judgements made in applying accounting policies that have the most significant effects on the amounts recognised in the financial statements is included in the following notes:
Critical Judgements Note Page
Classification of financial assets 26 184
Classification of insurance, reinsurance and investment contracts: assessing whether the
contract transfers significant insurance risk and whether an insurance contract contains direct
participation features. 44 218
Equity accounted investee : whether the Company has significant influence over an investee 31 200
Measurement of insurance and reinsurance contracts : determining the techniques for estimating
risk adjustments for non-financial risk and the quantity of benefits provided under a contract. 44 218
3.2 Information about assumptions and estimation uncertainties that have a significant risk of resulting in material adjustments to the carrying amounts of assets and liabilities is included in the following notes:
Critical Accounting Estimates Note Page
Impairment of financial assets 26 184
Determination of the fair value of financial instruments and investments and owner occupied
properties with significant unobservable inputs 28 190
Measurement of defined benefit obligations: key actuarial assumptions 47 224
Recognition and measurement of provisions and contingencies: key assumptions on the
likelihood and magnitude of an outflow of resources 53 230
Recognition of deferred tax assets and notional tax credits: availability of future taxable profits
against which tax losses carried forward and notional tax credits can be used 30/12 197/176
Impairment of non financial assets: key assumptions underlying recoverable amounts 6 151
Measuring insurance and reinsurance contracts: key assumptions 44 218
Liability Adequacy Test 44 218
Measurement of GWP accrual adjustment 10 175
Revaluation of land and buildings 28 190
4 STANDARDS ISSUED BUT NOT YET EFFECTIVEThe following new standards have been issued and are
effective for annual periods beginning after 1 January
2020, early application was permitted with transitional
rules.
Accordingly, these standards have not been applied to
these financial statements.
4.1 SLFRS 9 - Financial Instruments
The standard became mandatorily effective for the annual
periods beginning on or after 1 January 2018.
The Company met the eligibility criteria for temporary
exemption under the Amendments to SLFRS 4 from
applying SLFRS 9 in 2018 and has accordingly deferred
the adoption of SLFRS 9 until SLFRS 17, ‘Insurance
Contracts’ is adopted upon its mandatory effective date.
The Company is eligible as its activities are predominantly
to issue insurance contracts based on the criteria as set
out in the amendments to SLFRS 4.
Disclosures on Qualifying for the Temporary Exemptions
Based on the proposed SLFRS 17 - Insurance Contracts,
the Company is permitted to apply the temporary
exemption as the Company meets the following eligibility
criteria:
1 The Company has not applied SLFRS 9 before; and
2 The Company’s activities are predominantly connected
with insurance as the ratio of its liabilities connected
with insurance, including investment contracts
measured at fair value through profit or loss, compared
with total liabilities which is greater than 90%.
Accordingly, the Company qualifies as a pure insurance
company.
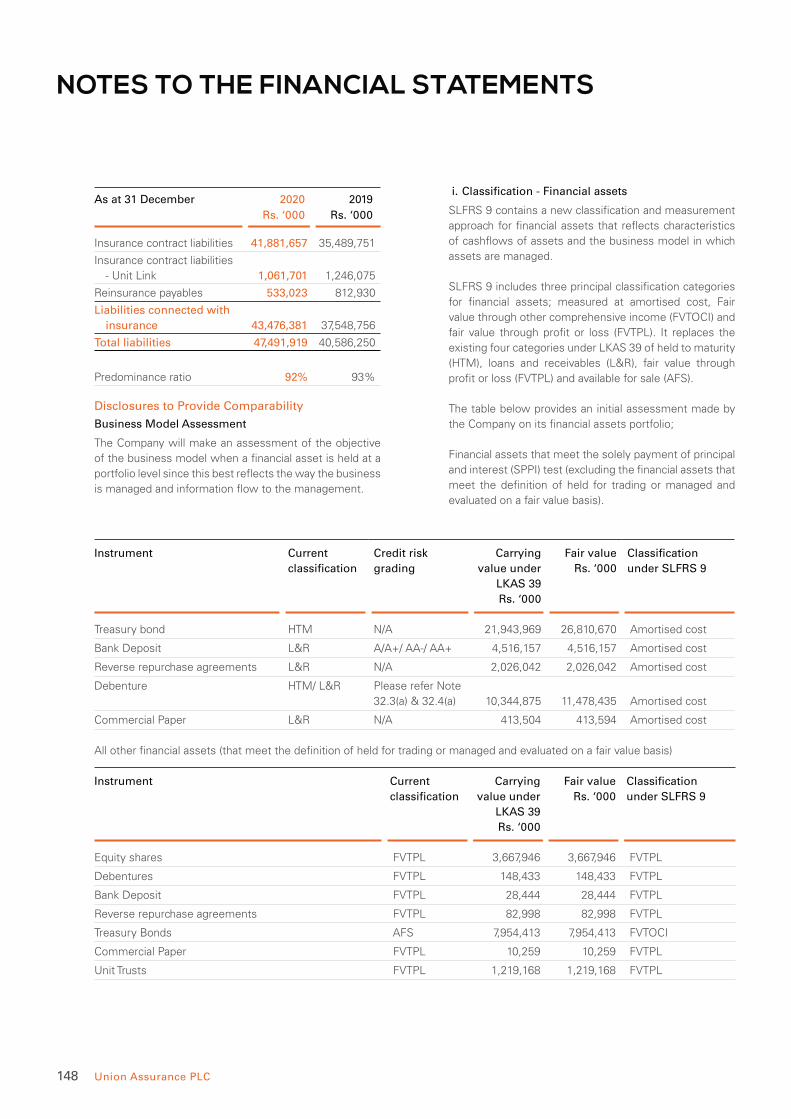
148 Union Assurance PLC
NOTES TO THE FINANCIAL STATEMENTS
As at 31 December 2020 2019
Rs. ‘000 Rs. ‘000
Insurance contract liabilities 41,881,657 35,489,751
Insurance contract liabilities
- Unit Link 1,061,701 1,246,075
Reinsurance payables 533,023 812,930
Liabilities connected with
insurance 43,476,381 37,548,756
Total liabilities 47,491,919 40,586,250
Predominance ratio 92% 93%
Disclosures to Provide Comparability
Business Model Assessment
The Company will make an assessment of the objective
of the business model when a financial asset is held at a
portfolio level since this best reflects the way the business
is managed and information flow to the management.
i. Classification - Financial assets
SLFRS 9 contains a new classification and measurement
approach for financial assets that reflects characteristics
of cashflows of assets and the business model in which
assets are managed.
SLFRS 9 includes three principal classification categories
for financial assets; measured at amortised cost, Fair
value through other comprehensive income (FVTOCI) and
fair value through profit or loss (FVTPL). It replaces the
existing four categories under LKAS 39 of held to maturity
(HTM), loans and receivables (L&R), fair value through
profit or loss (FVTPL) and available for sale (AFS).
The table below provides an initial assessment made by
the Company on its financial assets portfolio;
Financial assets that meet the solely payment of principal
and interest (SPPI) test (excluding the financial assets that
meet the definition of held for trading or managed and
evaluated on a fair value basis).
Instrument Current
classification
Credit risk
grading
Carrying
value under
LKAS 39
Rs. ‘000
Fair value
Rs. ‘000
Classification
under SLFRS 9
Treasury bond HTM N/A 21,943,969 26,810,670 Amortised cost
Bank Deposit L&R A/A+/ AA-/ AA+ 4,516,157 4,516,157 Amortised cost
Reverse repurchase agreements L&R N/A 2,026,042 2,026,042 Amortised cost
Debenture HTM/ L&R Please refer Note
32.3(a) & 32.4(a) 10,344,875 11,478,435 Amortised cost
Commercial Paper L&R N/A 413,504 413,594 Amortised cost
All other financial assets (that meet the definition of held for trading or managed and evaluated on a fair value basis)
Instrument Current
classification
Carrying
value under
LKAS 39
Rs. ‘000
Fair value
Rs. ‘000
Classification
under SLFRS 9
Equity shares FVTPL 3,667,946 3,667,946 FVTPL
Debentures FVTPL 148,433 148,433 FVTPL
Bank Deposit FVTPL 28,444 28,444 FVTPL
Reverse repurchase agreements FVTPL 82,998 82,998 FVTPL
Treasury Bonds AFS 7,954,413 7,954,413 FVTOCI
Commercial Paper FVTPL 10,259 10,259 FVTPL
Unit Trusts FVTPL 1,219,168 1,219,168 FVTPL

Union Assurance at a Glance Management Discussion and Analysis Stewardship Financial Statements Supplementary Information
149Annual Report 2020
Impact Assessment
The standard will affect the classification and measurement
of financial assets held, as follows;
• Trading assets and derivative assets held for risk
management, which are classified as held for trading
and measured at fair value under LKAS 39, will also be
measured at fair value under SLFRS 9.
• Loans and receivables measured at amortised cost
under LKAS 39 will also be measured at amortised
cost under SLFRS 9.
• Held to maturity investment securities measured at
amortised cost under LKAS 39 will be measured at
amortised cost under SLFRS 9.
• Debt investment securities that are classified as
available for sale under LKAS 39 may, under SLFRS
9, be classified under FVTOCI or amortised cost and
measured at fair value / amortised cost depending on
the particular circumstance.
• The equity investment securities that are classified
as fair value through profit or loss under LKAS 39 will
be remained under FVTPL and measured at fair value
under SLFRS 9.
ii. Impairment - Financial Assets, Loan Commitments
and Financial Guarantee Contracts
SLFRS 9 replaces the ‘incurred loss’ model in LKAS 39 with
a forward looking ‘expected credit loss’ model. This will be
required considerable judgement over how changes in
economic factors affect Expected Credit Loss (ECL), which
will be determined on a probability weighted basis.
The new impairment model applies to financial assets that
are debt instruments, that are not measured at FVTPL.
SLFRS 9 requires a loss allowance to be recognised at an
amount equal to either 12 month ECLs or lifetime ECLs.
Lifetime ECLs are the ECLs that result from all possible
default events over the expected life of a financial
instrument, whereas 12 month ECLs are the portion of
ECLs that result from default events that are possible
within the 12 months after the reporting date.
iii. Hedge Accounting
Hedge accounting requirements which are more closely
aligned with the risk management activities of the
Company. No significant change is currently anticipated
from hedge accounting.
4.2 SLFRS 17 - Insurance Contracts
As recommended by the Accounting Standards
Committee, the Institute of Charted Accountants of Sri
Lanka has decided to adopt SLFRS 17 Insurance Contracts
with effective from annual reporting periods beginning on
or after 1 January 2023.
Early adoption is permitted if the regulator permits along
with the adoption of SLFRS 9 Financial Instruments and
SLFRS 15 Revenue from Contracts with Customers.
SLFRS 17 supersedes SLFRS 4 Insurance Contracts.
SLFRS 4 permitted insurers to continue to use the
statutory basis of accounting for insurance assets and
liabilities that existed in their jurisdictions prior to January
2005. SLFRS 17 replaces this with a new measurement
model for all insurance contracts.
SLFRS 17 requires liabilities for insurance contracts to
be recognised as the present value of future cash flows,
incorporating an explicit risk adjustment, which is updated
at each reporting date to reflect current conditions, and
a contractual service margin (CSM) that is equal and
opposite to any day-one gain arising on initial recognition.
Losses are recognised directly into the income statement.
For measurement purposes, contracts are grouped
together into contracts of similar risk, profitability profile
and issue year, with further divisions for contracts that are
managed separately.
Profit for insurance contracts under SLFRS 17 is
represented by the recognition of the services provided to
policyholders in the period (release of the CSM), release
from non-economic risk (release of risk adjustment) and
investment profit.
The CSM is released as profit over the coverage period of
the insurance contract, reflecting the delivery of services
to the policyholder. For certain contracts with participating
features (where a substantial share of the fair value of
the related investments and other underlying items
is paid to policyholders) the CSM reflects the variable
fee to shareholders. For these contracts, the CSM is
adjusted to reflect the changes in economic experience
and assumptions. For all other contracts the CSM is only
adjusted for non-economic assumptions.
SLFRS 17 introduces a new measure of insurance
revenue, based on the delivery of services to policyholders
and excluding any premiums related to the investment
elements of policies, which will be significantly different
from existing premium revenue measures, currently
reported in the income statement. In order to transition to
SLFRS 17, the amount of deferred profit, being the CSM
at transition date, needs to be determined.
150 Union Assurance PLC
NOTES TO THE FINANCIAL STATEMENTS
SLFRS 17 requires, this CSM to be calculated as if
the standard had applied retrospectively. If this is not
practical, an entity is required to choose either a simplified
retrospective approach or determine the CSM by
reference to the fair value of the liabilities at the transition
date. The approach for determining the CSM will have a
significant impact on both shareholders’ equity and on the
amount of profits on in-force business in future reporting
periods.
SLFRS 17 Implementation Programme
SLFRS 17 is expected to have a significant impact, as
the requirements of the new standard are complex
and requires a fundamental change to accounting for
insurance contracts as well as the application of significant
judgement and new estimation techniques. The effect of
changes required to the Company’s accounting policies
as a result of implementing these standards are currently
uncertain, but these changes can be expected to, among
other things, alter the timing of profit recognition. Given
the implementation of this standard is likely to involve
significant enhancements to IT, actuarial and finance
systems of the Company, it will also have an impact on
the Company’s expenses.
The Company has an implementation programme
underway to implement SLFRS 17 and SLFRS 9. The
scope of the programme consists of setting accounting
policies and developing application methodologies,
establishing appropriate processes and controls, sourcing
appropriate data and implementing actuarial and finance
system changes.
The Steering Committee, chaired by both Chief Financial
Officer and Chief Actuarial Officer provides oversight and
strategic direction to the implementation programme
along with the involvement of external consultants.
The Company remains on track to providing SLFRS 17
financial statements in line with the requirements for
interim reporting at its effective date, which is currently
expected to be 2023.
4.3 Amendment to LKAS 37 Provisions, Contingent Liabilities and Contingent Assets - Onerous contracts - Cost of fulfilling a contract
The amendments specify which costs an entity includes
in determining the cost of fulfilling a contract for the
purpose of assessing whether the contract is onerous.
The amendments apply for annual reporting periods
beginning on or after 1 January 2022 to contracts existing
at the date when the amendments are first applied. At the
date of initial application, the cumulative effect of applying
the amendments is recognised as an opening balance
adjustment to retained earnings or other components of
equity, as appropriate. The comparative are not restated.
The Company has determined that all contracts existing
at 31 December 2020 will be completed before the
amendments become effective.
4.4 Amendments to SLFRS 9, LKAS 39, SLFRS 7, SLFRS 4 and SLFRS 16 - Interest Rate Benchmark Reform - Phase 2
The amendments address issues that might affect
financial reporting as a result of the reform of an interest
rate benchmark, including the effects of changes to
contractual cashflows or hedging relationships arising
from the replacement of an interest rate benchmark with
an alternative benchmark rate. The amendments provide
practical relief from certain requirements in SLFRS 9,
LKAS 39,SLFRS 7,SLFRS 4 and SLFRS 16 relation to :
• changes in the basis for determining contractual cash
flows of financial assets, financial liabilities and lease
liabilities: and
• hedge accounting.
4.5 Other new accounting pronouncements
The following amended standards are not expected to
have a significant impact on the Company’s financial
statements.
• Amendments to References to Conceptual Framework
in SLFRS Standards
• Definition of a Business (Amendments to SLFRS 3).
• Definition of Material (Amendments to LKAS 1 and
LKAS 8)
5 CHANGES IN ACCOUNTING STANDARDS5.1 Amendments to SLFRS 16 Covid-19 Related Rent
Concessions
The Company adopted COVID-19 - Related Rent
Concessions - Amendments to SLFRS 16 issued on
28 May 2020.The amendment introduces an optional
practical expedient for leases in which the Company is
a lessee - i.e. for leases to which the Company applies
the practical expedient, the Company is not required
to assess whether eligible rent concessions that are a
direct consequence of the COVID-19 pandemic are lease
modifications. The Company has applied the amendment
retrospectively. The amendment has no impact on
retained earnings at 1 January 2020.

Union Assurance at a Glance Management Discussion and Analysis Stewardship Financial Statements Supplementary Information
151Annual Report 2020
6 SUMMARY OF SIGNIFICANT ACCOUNTING POLICIESThe Company has consistently applied the following
accounting policies to all periods presented in these
financial statements. The accounting policies are
presented along with the respective notes.
Set out below is an index of the significant policies;
Note Significant Accounting Policies Page
6.1 Impairment of non financial assets 151
6.2 Foreign currency 152
7 Operating segments 152
8 Financial risk management 154
9 Fair value measurement and related fair
value disclosures 170
10 Gross written premium 175
11 Premium ceded to reinsurers 176
12 Net investment income 176
13 Net realised gains / (losses) 177
14 Net fair value gains / (losses) 178
15 Other income 178
16 Net insurance benefits and claims paid 179
17 Net change in insurance claims
outstanding 179
18 Change in contract liabilities - Life Fund 180
19 Underwriting and net acquisition costs -
(Net of reinsurance) 180
20 Other operating, administrative and
selling expenses 181
23 Income tax expenses 182
24 Earnings per share 184
25 Dividends per share 184
26 Financial assets and liabilities 184
27 Intangible assets 188
28 Property, plant and equipment 190
29 Right of use assets (Leases) 195
30 Deferred tax 197
31 Investment in equity accounted
investee 200
32 Financial investments 203
33 Loans to life policyholders 210
34 Reinsurance receivable 211
35 Premiums receivable 212
36 Receivables and other assets 212
37 Cash in hand and at bank 214
Note Significant Accounting Policies Page
38 Stated capital 214
44 Insurance contract liabilities 218
45 Insurance contract liabilities - unit linked 223
46 Lease liabilities 224
47 Employee benefits liabilities 224
48 Reinsurance payables 226
49 Other liabilities 226
50 Related party disclosures 227
51 Commitments 230
52 Events after the reporting date 230
53 Provisions and contingencies 230
Other Significant Accounting Policies Not Covered With Individual Notes
Following accounting policies which have been applied
consistently by the Company, are considered to be
significant but are not covered in any other section.
6.1 Impairment of Non Financial Assets
The carrying amounts of the Company’s non financial
assets (other than insurance and reinsurance contract
assets, deferred tax assets and employee benefit assets)
are reviewed at each reporting date to determine whether
there is any indication of impairment. If any such indication
exists, then the assets’ recoverable amount is estimated.
For intangible assets that have indefinite useful lives or
that are not yet available for use, the recoverable amount
is estimated annually. An impairment loss is recognised
if the carrying amount of an asset exceeds its estimated
recoverable amount.
The recoverable amount of an asset is the greater of
its value in use and its fair value less costs to sell. In
assessing value in use, the estimated future cash flows
are discounted to their present value using a pre tax
discount rate that reflects current market assessments
of the time value of money and the risks specific to the
asset. For the purpose of impairment testing, assets that
cannot be tested individually are grouped together into
the smallest group of assets that generate cash inflows
from continuing use that are largely independent of the
cash inflows of other assets.
Impairment losses are recognised in profit or loss. An
impairment loss is reversed only to the extent that the
asset’s carrying amount does not exceed the carrying
amount that would have been determined, net of
depreciation or amortisation, if no impairment loss had
been recognised.
152 Union Assurance PLC
NOTES TO THE FINANCIAL STATEMENTS
6.2 Foreign currency
6.2 (a) Foreign currency transactions
Transactions in foreign currencies are converted into the
functional currency of the Company at the exchange rates
prevailing at the time the transactions are effected.
Monetary assets and liabilities denominated in foreign
currencies are translated into the functional currency
at the exchange rate at the reporting date. The foreign
currency gain or loss on monetary items is the difference
between the amortised cost in the functional currency at
the beginning of the year, adjusted for effective interest,
impairment and payments during the year, and the
amortised cost in the foreign currency translated at the
spot exchange rate at the end of the year.
Non-monetary assets and liabilities that are measured
at fair value in a foreign currency are translated into
the functional currency at the exchange rate when the
fair value is determined. Non-monetary items that are
measured based on historical cost in a foreign currency
are translated at the exchange rate at the date of the
transaction. The gain or loss arising on transactions of
non-monetary items is treated in line with the recognition
of gain or loss on fair value of the item.
6.2 (b) Foreign operations
The Company does not have any foreign operations
that is a subsidiary, associate, joint venture or a branch.
Therefore, there is no exchange differences recognised in
other comprehensive income.
7 OPERATING SEGMENTSFor management purposes the Company has only one
business segment, which is the life insurance business.
All operating results are reviewed regularly by the Chief
Executive Officer (CEO) and corporate management to
make decisions regarding resource allocation and assess
its performance, and for which financial information is
available.
Accounting policy
An operating segment is a component of the Company
that engages in business activities from which it may
earn revenues and incur expenses, including revenues
and expenses relating to transactions with any of the
Company’s other components, whose operating results
are regularly reviewed by the Company’s chief operating
decision maker (CODM) to make decisions about
resources to be allocated to the segment and assess its
performance, and for which discrete financial information
is available.
Segment results that are reported to the Company’s Chief
Executive Officer (being the CODM) include items that
are directly attributable to a segment as well as those
that can be allocated on a reasonable basis. Unallocated
items comprise mainly corporate assets (primarily the
shareholders), head office expenses and tax assets and
liabilities.
7.1 Basis for segmentation
The Company has the following two strategic segments, which are its reportable segments.
The following summary describes the operations of each reportable segment
Reportable Segment Description
Policyholder Fund UA maintains five separate policy holder funds according to the following product types: Participating,
Non-participating, Universal life, Unit linked, and Non-unit linked. The combination of above five funds
is collectively known as the “life insurance fund”. Transactions of each product type are entered in the
account maintained for that business. Assets belonging to each fund, are maintained separately and the
policyholder liabilities in each category are matched with suitable assets (by amount and duration). The
investments in each fund complies with the regulatory requirements specified under Determination 1.
Shareholder Fund Assets belonging to the shareholders are maintained separately in the “shareholder fund”. Income
and expenses arising from shareholders account are accounted under the shareholders fund. Every
year, the surplus arising from policyholder funds are transferred to the shareholder fund based on the
actuary’s recommendation. Currently, the Company holds the one-off surplus that arose from changing
the policy liability valuation as a restricted reserve within the shareholders fund.

Union Assurance at a Glance Management Discussion and Analysis Stewardship Financial Statements Supplementary Information
153Annual Report 2020
7.2 Information about Reportable Segments
Information related to each reportable segment is set out below. Segment profit / loss before tax is used to measure performance
because management believes that this information is the most relevant in evaluating the results of the respective segments
relative to other entities that operate in the same industry.
Summary of Segment Performance
For the Year ended
31 December
Rs. ‘000
2020 2019
Policyholder
Fund
Shareholder
Fund
Total Policyholder
Fund
Shareholder
Fund
Total
Segment revenue
Gross Written Premium 13,108,605 - 13,108,605 11,647,756 - 11,647,756
Net Written Premium 12,518,728 - 12,518,728 11,121,974 - 11,121,974
Total Investment Income and
Other Revenue 4,041,160 909,854 4,951,014 3,442,849 897,105 4,339,954
Total Net Revenue 16,559,888 909,854 17,469,742 14,564,823 897,105 15,461,928
Total Claims and Expenses (9,456,331) (128,755) (9,585,086) (8,581,550) (93,379) (8,674,929)
Change in Contract Liabilities (6,207,253) - (6,207,253) (4,983,273) - (4,983,273)
Share of results of equity
accounted investee, net of tax - 116,438 116,438 - 104,736 104,736
Segment Profit Before Tax 896,304 897,537 1,793,841 1,000,000 908,462 1,908,462
Income Tax Expenses (71,304) (801,941) (873,245) - (750,432) (750,432)
Segment Profit After Tax 825,000 95,596 920,596 720,000 438,030 1,158,030
All revenues are from external customers. There is no revenue from transactions between operating segments
For the Year ended
31 December
Rs. ‘000
2020 2019
Policyholder
Fund
Shareholder
Fund
Total Policyholder
Fund
Shareholder
Fund
Total
Segment Assets 50,124,790 12,475,618 62,600,408 43,317,153 11,931,999 55,249,152
Segment Equity 2,169,203 12,939,286 15,108,489 1,874,352 12,788,550 14,662,902
Segment Liabilities 47,955,587 (463,468) 47,491,919 41,442,801 (856,551) 40,586,250
Segmental cash flows have not been presented since the Company manages it’s cash flows at company level.
7.3 Major Customer
The company does not have any major single customer.
7.4 Geographic Information
The Company functions in one geographic location (only in Sri Lanka). Accordingly, geographic information is not presented in the
financial statements.
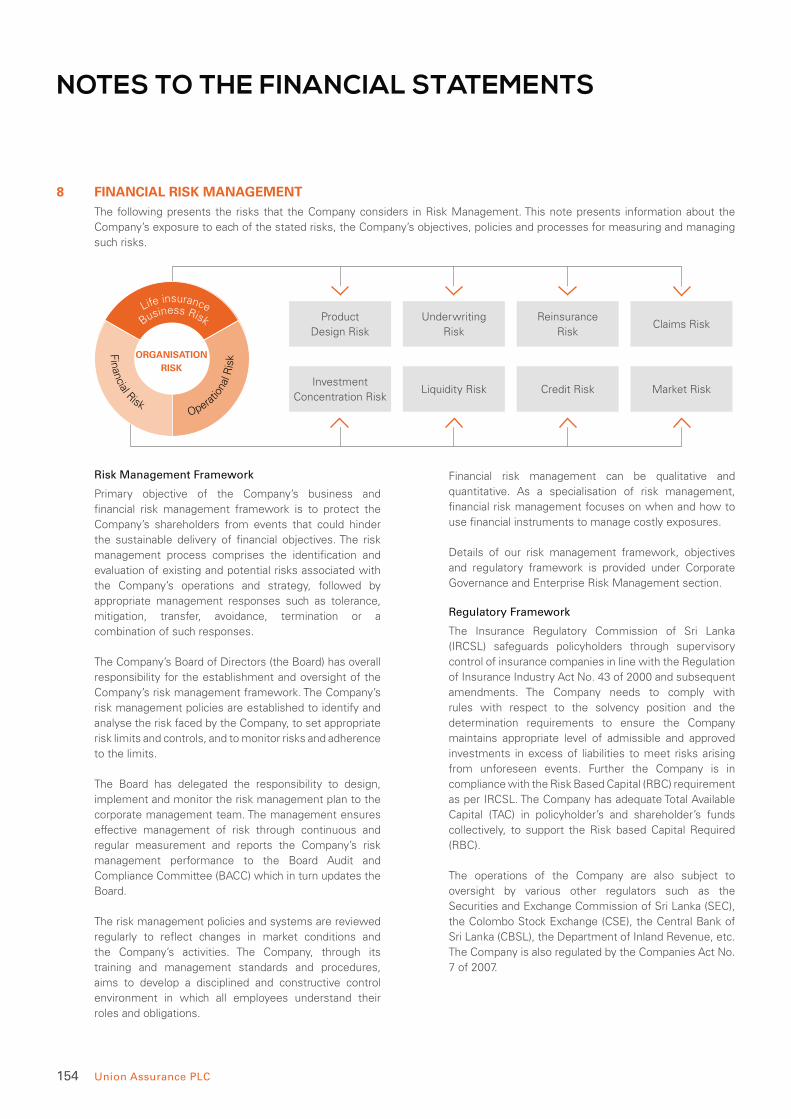
154 Union Assurance PLC
NOTES TO THE FINANCIAL STATEMENTS
8 FINANCIAL RISK MANAGEMENTThe following presents the risks that the Company considers in Risk Management. This note presents information about the
Company’s exposure to each of the stated risks, the Company’s objectives, policies and processes for measuring and managing
such risks.
Product
Design Risk
Investment
Concentration Risk
Underwriting
Risk
Liquidity Risk
Reinsurance
Risk
Credit Risk
Claims Risk
Market Risk
Business RiskLife insurance
Opera
tiona
l Ris
k
Fin
ancial Risk
ORGANISATION RISK
Risk Management Framework
Primary objective of the Company’s business and
financial risk management framework is to protect the
Company’s shareholders from events that could hinder
the sustainable delivery of financial objectives. The risk
management process comprises the identification and
evaluation of existing and potential risks associated with
the Company’s operations and strategy, followed by
appropriate management responses such as tolerance,
mitigation, transfer, avoidance, termination or a
combination of such responses.
The Company’s Board of Directors (the Board) has overall
responsibility for the establishment and oversight of the
Company’s risk management framework. The Company’s
risk management policies are established to identify and
analyse the risk faced by the Company, to set appropriate
risk limits and controls, and to monitor risks and adherence
to the limits.
The Board has delegated the responsibility to design,
implement and monitor the risk management plan to the
corporate management team. The management ensures
effective management of risk through continuous and
regular measurement and reports the Company’s risk
management performance to the Board Audit and
Compliance Committee (BACC) which in turn updates the
Board.
The risk management policies and systems are reviewed
regularly to reflect changes in market conditions and
the Company’s activities. The Company, through its
training and management standards and procedures,
aims to develop a disciplined and constructive control
environment in which all employees understand their
roles and obligations.
Financial risk management can be qualitative and
quantitative. As a specialisation of risk management,
financial risk management focuses on when and how to
use financial instruments to manage costly exposures.
Details of our risk management framework, objectives
and regulatory framework is provided under Corporate
Governance and Enterprise Risk Management section.
Regulatory Framework
The Insurance Regulatory Commission of Sri Lanka
(IRCSL) safeguards policyholders through supervisory
control of insurance companies in line with the Regulation
of Insurance Industry Act No. 43 of 2000 and subsequent
amendments. The Company needs to comply with
rules with respect to the solvency position and the
determination requirements to ensure the Company
maintains appropriate level of admissible and approved
investments in excess of liabilities to meet risks arising
from unforeseen events. Further the Company is in
compliance with the Risk Based Capital (RBC) requirement
as per IRCSL. The Company has adequate Total Available
Capital (TAC) in policyholder’s and shareholder’s funds
collectively, to support the Risk based Capital Required
(RBC).
The operations of the Company are also subject to
oversight by various other regulators such as the
Securities and Exchange Commission of Sri Lanka (SEC),
the Colombo Stock Exchange (CSE), the Central Bank of
Sri Lanka (CBSL), the Department of Inland Revenue, etc.
The Company is also regulated by the Companies Act No.
7 of 2007.
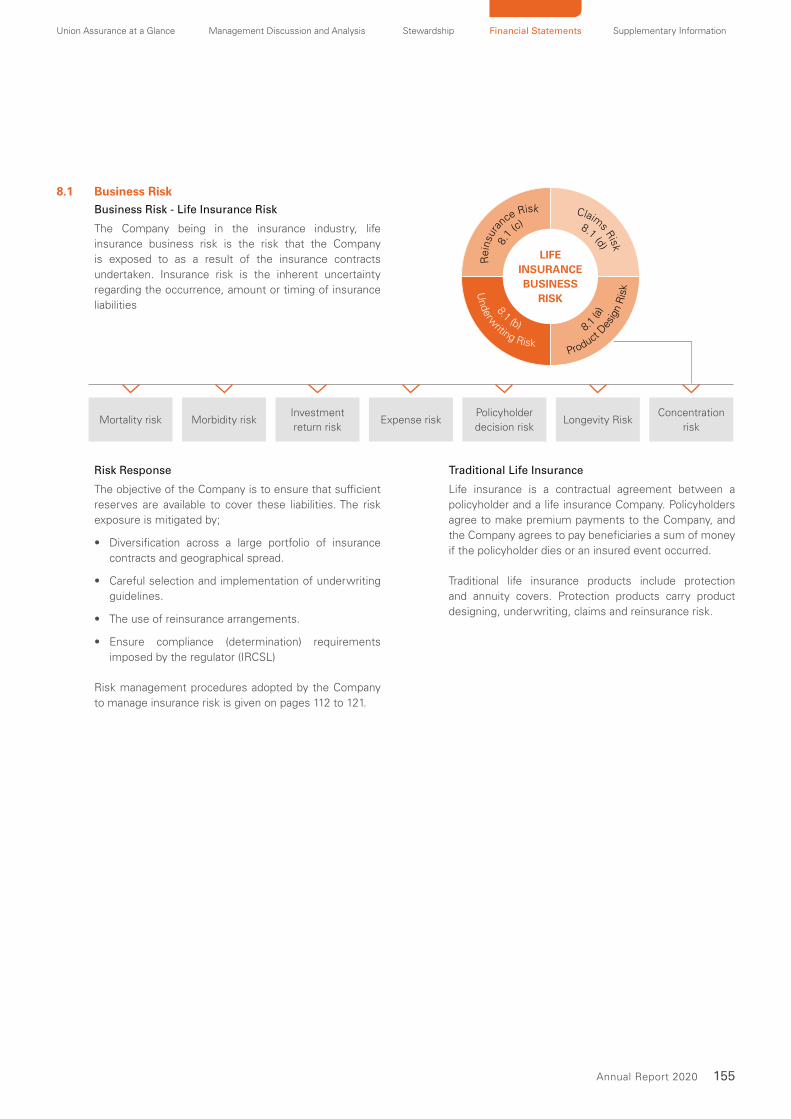
Union Assurance at a Glance Management Discussion and Analysis Stewardship Financial Statements Supplementary Information
155Annual Report 2020
8.1 Business Risk Business Risk - Life Insurance Risk
The Company being in the insurance industry, life
insurance business risk is the risk that the Company
is exposed to as a result of the insurance contracts
undertaken. Insurance risk is the inherent uncertainty
regarding the occurrence, amount or timing of insurance
liabilities
Mortality risk Morbidity riskInvestment
return riskExpense risk
Policyholder
decision riskLongevity Risk
Concentration
risk
LIFE INSURANCE BUSINESS
RISK
8.1
(c)
Rein
sura
nce Risk
8.1 (d)
Claim
s Risk
8.1 (a
)
Product
Desig
n R
isk
8.1 (b)
Underw
riting Risk
Risk Response
The objective of the Company is to ensure that sufficient
reserves are available to cover these liabilities. The risk
exposure is mitigated by;
• Diversification across a large portfolio of insurance
contracts and geographical spread.
• Careful selection and implementation of underwriting
guidelines.
• The use of reinsurance arrangements.
• Ensure compliance (determination) requirements
imposed by the regulator (IRCSL)
Risk management procedures adopted by the Company
to manage insurance risk is given on pages 112 to 121.
Traditional Life Insurance
Life insurance is a contractual agreement between a
policyholder and a life insurance Company. Policyholders
agree to make premium payments to the Company, and
the Company agrees to pay beneficiaries a sum of money
if the policyholder dies or an insured event occurred.
Traditional life insurance products include protection
and annuity covers. Protection products carry product
designing, underwriting, claims and reinsurance risk.

156 Union Assurance PLC
NOTES TO THE FINANCIAL STATEMENTS
8.1 (a) Product Design Risk
Life insurance product design largely depends on futuristic hypothetical assumptions. Accordingly there is a risk of introducing
unprofitable products to the market due to inappropriate use of assumptions or judgements. The fundamental assumptions used
in product development are explained below.
Risk Description Assumptions Used / Risk Response
Mortality risk Risk of loss arising due to
policyholders death experience being
different from expected
Use of standard mortality tables with adjustments to reflect
the Company’s mortality experience after allowing for adverse
deviation having conducted stress analysis.
Morbidity risk Risk of loss arising due to
policyholders health experience
being different from expected
Assumptions are based on reinsurance tables, adjustments made
when appropriate to reflect the Company’s own risk experience
after allowing for adverse deviation having conducted stress
analysis.
Investment return
risk
Risk of loss arising from actual
returns being different from expected
The weighted average rate of return is derived based on a model
portfolio that is assumed to back liabilities, consistent with the
long term asset allocation strategy. Stress analysis is carried to
check the sensitivity and allow for adverse deviation.
Expense risk Risk of loss arising from the expense
experience being different from
expected
Operating expense assumptions reflect the projected costs
of maintaining and servicing in – force policies and associated
overhead expenses. Expense assumptions have been set
based on the latest expense investigation carried out on the
expenses incurred.
Policyholder
decision risk
Risk of loss arising due to
policyholders experiences (lapses
and surrenders) being different from
expected
Lapse and surrender rates are projected according to the
Company’s past experience. Stress analysis is carried to check the
sensitivity and allow for adverse deviation.
Longevity Risk Risk of loss arising due to the
annuitant living longer than expected
Terms and conditions included in insurance applications have been
designed to address non standard and unpredictable risks.
Concentration risk Risk of losses due to not maintaining
a balanced product portfolio
Developing a proper product mix in line with Company strategy.
Stress analysis is carried out to check the sensitivity of the
business mix within the products.
Overall Risk Mitigation Approach in Traditional Life Insurance
Product Key risks Risk mitigation
Traditional
participating
• Market risk: Investment return on underlying
items falling below guaranteed minimum rates
• Policyholder behaviour risk
• Management discretion to determine amount and
timing of policyholder bonuses (within limits)
• Surrender penalties
Non Participating • Market risk: Insufficient fees to cover cost of
guarantees and expenses
• Policyholder behaviour risk
• Derivative hedging programme
• Surrender penalties
Universal life • Interest rate risk: Differences in duration and
yield of assets and liabilities
• Investment credit risk
• Matching of asset and liability cash flows
• Investing in investment grade assets
Unit linked product • Market risk: Insufficient fees to cover expenses
• Policyholder behaviour risk
• Surrender penalties

Union Assurance at a Glance Management Discussion and Analysis Stewardship Financial Statements Supplementary Information
157Annual Report 2020
Unit Linked Products
Unit linked products have been designed in order
to reduce much of the market and credit risks
associated with traditional products. It is a type of
insurance vehicle in which the policyholder purchases
units at their net asset values and also makes contributions
toward another investment vehicle. Unit linked insurance
plans allow for the coverage of an insurance policy.
Under unit linked contracts, risks are largely passed on
to the policyholder, although a portion of the Company’s
management fees are linked to the value of funds under
management and hence are at risk if the fund values
decrease.
Unit linked products carry mortality risk and market risk to
the extent that there are guarantees built into the product
design. Contracts may have minimum guaranteed death
benefits where the sum at risk depends on the fair value
of the underlying investments. For certain contracts these
risks are minimised by explicit mortality and morbidity
charges.
Participating Fund vs Non-Participating Fund
The following table shows the concentration of the
Participating and Non Participating funds position of the
Company.
As at 31 December 2020 2019
Type of contract Rs. ‘000 % Rs. ‘000 %
Participating 8,898,635 21 9,442,525 27
Non Participating 32,928,312 79 26,005,509 73
Total traditional 41,826,947 100 35,448,034 100
Non unit fund of linked insurance 54,710 41,717
Total value of insurance liabilities 41,881,657 35,489,751
The table below presents the sensitivity of the value of
insurance liabilities to movements in the key assumptions
used in the estimation of insurance liabilities with other
assumptions held constant. For liabilities under life
insurance contracts with fixed and guaranteed terms,
changes in assumptions will not cause a change to
the amount of the liability, unless the change is severe
enough to trigger a liability adequacy test adjustment. No
adjustments were required in 2020 or 2019, based on the
results of the liability adequacy test.
As at 31 December Impact on liabilities % Impact on liabilities Rs. ‘000
Assumption Change
%
2020 2019 2020 2019
Mortality +10 0.19 0.31 66,700 86,540
-10 (0.19) (0.08) (67,230) (23,602)
Discount rate +1 (2.30) (2.01) (817,918) (567,914)
-1 2.43 2.35 863,785 664,002

158 Union Assurance PLC
NOTES TO THE FINANCIAL STATEMENTS
8.1 (b) Underwriting Risk
Underwriting risk arise from an inaccurate assessment
of the risks entailed in writing an insurance policy. As a
result, the policy may cost the insurer much more than it
has earned in premiums.
Underwriting risk can be identified through following 3
main risk categories.
• Insurance risk: the risk transferred from the policyholder
to the Company, other than financial risk. Insurance
risk arises from the inherent uncertainty about the
occurrence, amount or timing of claims.
• Policyholder behaviour risk: the risk that a policyholder
will cancel a contract (i.e. lapse or persistency risk),
increase or reduce premiums, withdraw deposits, or
annuitise a contract earlier or later than expected.
• Expense risk: the risk of unexpected increases in the
administrative costs associated with the servicing of
a contract (rather than in the costs associated with
insured events).
Risk Response
• Validation of policyholder data before underwriting.
Accordingly, policyholder undergoes a medical test at
Company’s expense.
• Appropriate training is provided to insurance advisors.
• Use of common pricing policy.
8.1 (c) Reinsurance Risk
Notwithstanding the advantages reinsurance provide,
it can expose them at varying degrees to various risks
inherent in its use. A new or continuing reinsurance
contract could give rise to one or more of the following
risks:
• Residual insurance risk may arise from discrepancies
between reinsurance needs and the actual coverage
provided for in the contract, resulting in the insurer
retaining greater risk than anticipated.
• Legal risk may arise when the terms of the contract do
not accurately reflect the intent of the insurer or when
the contract cannot be legally enforced.
• Counterparty risk may result from the inability or
potential refusal of the reinsurer, or a stakeholder in
the case of an alternative risk transfer mechanism, to
honour its obligations towards the ceding insurer.
• Liquidity risk may arise from the possible lag time
between the payment of a claim by the insurer to its
insured and receipt of the reinsurance recoverable.
• Operational risk may result from inadequate contractual
arrangements or from insufficient technological or
administrative capacity to manage and collect sums
owed by reinsurers.
Risk Response
• Reinsurance is placed in line with policy guidelines
approved by the Board of Directors on an annual basis
based on the guidelines issued by the IRCSL.
• Management assesses the credit worthiness of
reinsurers on a regular basis to update the reinsurance
strategy and ascertain the suitable allowance for
impairment of reinsurance assets.
The Company reinsures approximately 4% - 5% of gross
written premium.
For the year
ended
31 December
2020 2019
Rs. ‘000 % Rs. ‘000 %
Gross Written
premium 13,108,605 11,647,756
Reinsurance (589,877) 4 (525,782) 5
Net Written
Premium 12,518,728 11,121,974
The Company has recovered approximately 8% of gross
claims from reinsurers during the period under review.
For the year
ended
31 December
2020 2019
Rs. ‘000 % Rs. ‘000 %
Gross claims
paid 4,001,539 3,760,837
Claims recovered
from reinsurers (313,032) 8 (92,486) 2
Net claims 3,688,507 3,668,351
8.1 (d) Claim Risk
The possibility of adverse variance in claim pattern of the
product which is not expected at the product development
stage.
Risk Response
• Obtaining adequate reinsurance cover.
• Adequate information is gathered to confirm the event
occurred prior to processing the claim.
• In-house actuarial department closely monitors claim
reserves.
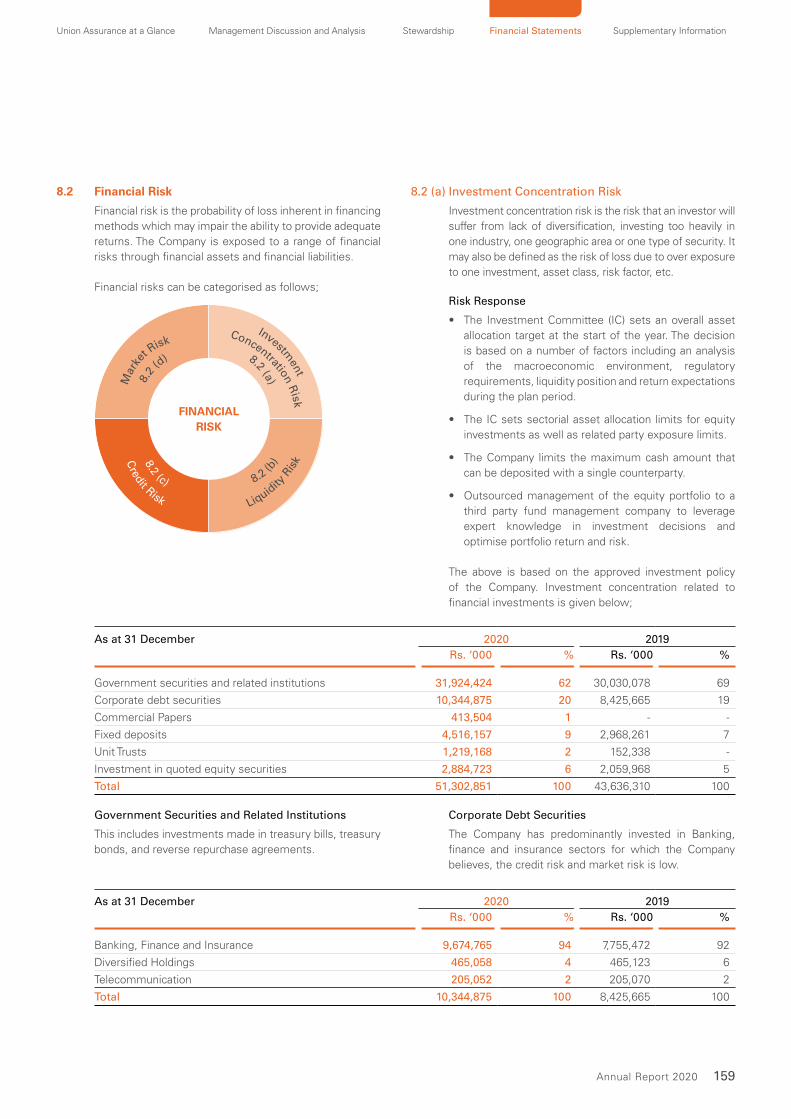
Union Assurance at a Glance Management Discussion and Analysis Stewardship Financial Statements Supplementary Information
159Annual Report 2020
8.2 Financial Risk
Financial risk is the probability of loss inherent in financing
methods which may impair the ability to provide adequate
returns. The Company is exposed to a range of financial
risks through financial assets and financial liabilities.
Financial risks can be categorised as follows;
FINANCIAL RISK
8.2
(d)
Mar
ke
t Risk
8.2 (a)
Investment
Concentration Risk
8.2 (b)
Liquidity
Ris
k8.2 (c)
Credit Risk
8.2 (a) Investment Concentration Risk
Investment concentration risk is the risk that an investor will
suffer from lack of diversification, investing too heavily in
one industry, one geographic area or one type of security. It
may also be defined as the risk of loss due to over exposure
to one investment, asset class, risk factor, etc.
Risk Response
• The Investment Committee (IC) sets an overall asset
allocation target at the start of the year. The decision
is based on a number of factors including an analysis
of the macroeconomic environment, regulatory
requirements, liquidity position and return expectations
during the plan period.
• The IC sets sectorial asset allocation limits for equity
investments as well as related party exposure limits.
• The Company limits the maximum cash amount that
can be deposited with a single counterparty.
• Outsourced management of the equity portfolio to a
third party fund management company to leverage
expert knowledge in investment decisions and
optimise portfolio return and risk.
The above is based on the approved investment policy
of the Company. Investment concentration related to
financial investments is given below;
As at 31 December 2020 2019
Rs. ‘000 % Rs. ‘000 %
Government securities and related institutions 31,924,424 62 30,030,078 69
Corporate debt securities 10,344,875 20 8,425,665 19
Commercial Papers 413,504 1 - -
Fixed deposits 4,516,157 9 2,968,261 7
Unit Trusts 1,219,168 2 152,338 -
Investment in quoted equity securities 2,884,723 6 2,059,968 5
Total 51,302,851 100 43,636,310 100
Government Securities and Related Institutions
This includes investments made in treasury bills, treasury
bonds, and reverse repurchase agreements.
Corporate Debt Securities
The Company has predominantly invested in Banking,
finance and insurance sectors for which the Company
believes, the credit risk and market risk is low.
As at 31 December 2020 2019
Rs. ‘000 % Rs. ‘000 %
Banking, Finance and Insurance 9,674,765 94 7,755,472 92
Diversified Holdings 465,058 4 465,123 6
Telecommunication 205,052 2 205,070 2
Total 10,344,875 100 8,425,665 100

160 Union Assurance PLC
NOTES TO THE FINANCIAL STATEMENTS
Fixed Deposits
This includes investments made in fixed deposits issued
by licensed commercial banks and licensed finance
companies.
Investment in Quoted Equity Securities
Considering the market return and risk, the Company
has predominantly invested in Banking and Capital goods
sectors and regularly reviews market risk of the portfolio
to assess adequacy of diversification.
As at 31 December 2020 2019
Rs. ‘000 % Rs. ‘000 %
Industry Group
Banks 1,121,871 39 1,251,818 60
Capital Goods 696,368 24 109,159 5
Consumer Durables & Apparel 253,799 9 113,526 6
Consumer Services 27,606 1 9,889 -
Diversified Financials - - 115,930 6
Food and Staples Retailing 148,256 5 - -
Food Beverage & Tobacco 478,612 17 208,183 10
Materials - - 217,189 11
Retailing - - 1,100 -
Telecommunication Services 158,211 5 33,174 2
Total 2,884,723 100 2,059,968 100
8.2 (b) Liquidity Risk
Liquidity risk is the risk, that the Company may not have
sufficient liquid financial resources to meet its obligations
when they fall due, or would have to incur excessive costs
to do so. In respect of catastrophic / unexpected large
claim events there is also a liquidity risk associated with
the timing differences between gross cash outflows and
expected reinsurance recoveries
Company implemented a mixed approach that combines
elements of the cash flow matching approach and the
liquid assets approach. The Company attempts to match
cash outflows in each time bucket against the combination
of contractual cash inflows plus other inflows that can be
generated through investment cashflows.
The Company considered that Cash flow scrutiny is
paramount at uncertain times and adopted a disciplined
approach across the Company including setting up of
Spend Control Steering Committee for preserving and
increasing liquidity, particularly to respond to possible
future liquidity constraints arising from COVID-19
pandemic.
Risk Response
• The Investment Committee manages this risk by
diversifying investment durations and reviewing cash
flow projections regularly
• Guidelines are set for asset allocations, portfolio limit
structures and maturity profiles of assets, in order
to ensure availability of sufficient funding to meet
insurance and investment contract obligations.
• Reinsurance contracts contain clauses permitting
the immediate draw down of funds to meet claim
payments when claim events exceed a certain size.
• Availability of stand by overdraft facility to be used only
in the event of an emergency.
• Reviewing the maturity mix of the investment portfolio
by the management and the Investment Committee
on a regular basis.
• Maintaining sufficient cash balances, overnight
investments and other short tenure investments to
accommodate expected obligations and commitments
of the Company.
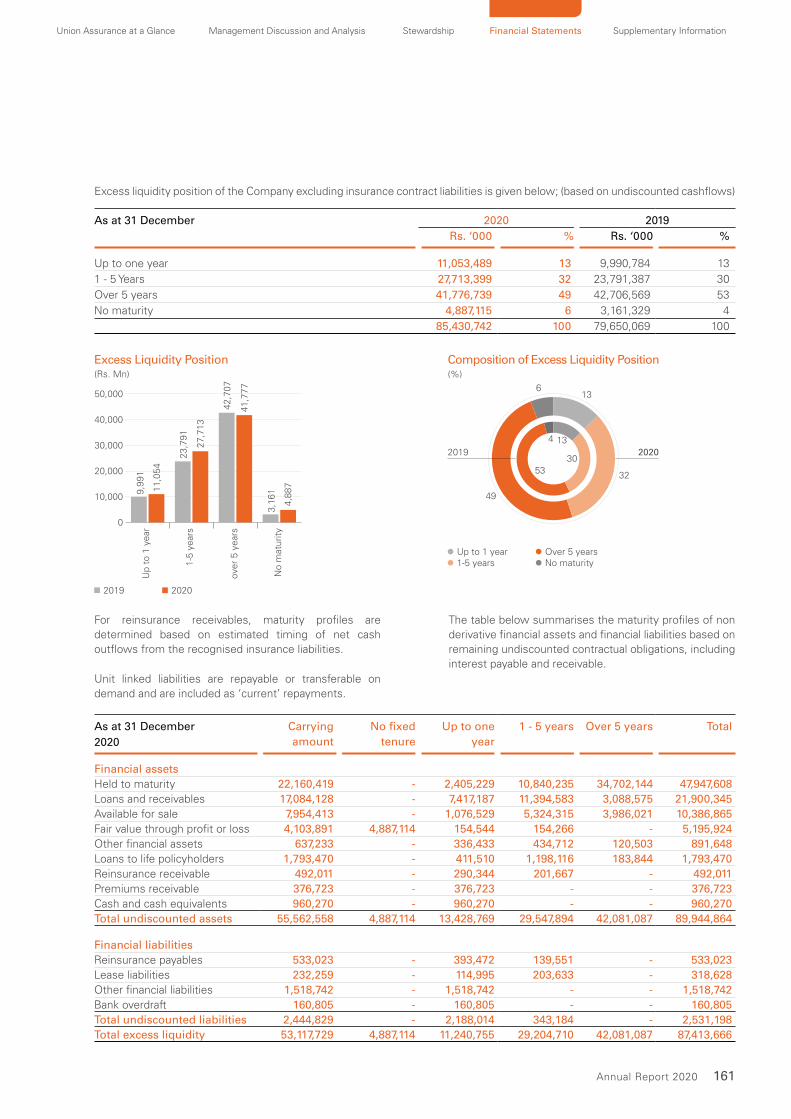
Union Assurance at a Glance Management Discussion and Analysis Stewardship Financial Statements Supplementary Information
161Annual Report 2020
Excess liquidity position of the Company excluding insurance contract liabilities is given below; (based on undiscounted cashflows)
As at 31 December 2020 2019
Rs. ‘000 % Rs. ‘000 %
Up to one year 11,053,489 13 9,990,784 13
1 - 5 Years 27,713,399 32 23,791,387 30
Over 5 years 41,776,739 49 42,706,569 53
No maturity 4,887,115 6 3,161,329 4
85,430,742 100 79,650,069 100
(Rs. Mn)
Excess Liquidity Position
0
10,000
20,000
30,000
40,000
50,000
Up t
o 1
year
1-5
year
s
ove
r 5 y
ear
s
No m
aturity
11,0
54
9,9
91
27,7
13
23,7
91
41
,77
7
42
,70
7
4,8
87
3,1
61
2019 2020
(%)
49
32
136
Up to 1 year1-5 years
Composition of Excess Liquidity Position
Over 5 yearsNo maturity
2019 202030
134
53
For reinsurance receivables, maturity profiles are determined based on estimated timing of net cash outflows from the recognised insurance liabilities.
Unit linked liabilities are repayable or transferable on demand and are included as ‘current’ repayments.
The table below summarises the maturity profiles of non derivative financial assets and financial liabilities based on remaining undiscounted contractual obligations, including interest payable and receivable.
As at 31 December Carrying
amount
No fixed
tenure
Up to one
year
1 - 5 years Over 5 years Total
2020
Financial assetsHeld to maturity 22,160,419 - 2,405,229 10,840,235 34,702,144 47,947,608Loans and receivables 17,084,128 - 7,417,187 11,394,583 3,088,575 21,900,345Available for sale 7,954,413 - 1,076,529 5,324,315 3,986,021 10,386,865Fair value through profit or loss 4,103,891 4,887,114 154,544 154,266 - 5,195,924Other financial assets 637,233 - 336,433 434,712 120,503 891,648Loans to life policyholders 1,793,470 - 411,510 1,198,116 183,844 1,793,470 Reinsurance receivable 492,011 - 290,344 201,667 - 492,011 Premiums receivable 376,723 - 376,723 - - 376,723 Cash and cash equivalents 960,270 - 960,270 - - 960,270Total undiscounted assets 55,562,558 4,887,114 13,428,769 29,547,894 42,081,087 89,944,864
Financial liabilitiesReinsurance payables 533,023 - 393,472 139,551 - 533,023 Lease liabilities 232,259 - 114,995 203,633 - 318,628Other financial liabilities 1,518,742 - 1,518,742 - - 1,518,742Bank overdraft 160,805 - 160,805 - - 160,805Total undiscounted liabilities 2,444,829 - 2,188,014 343,184 - 2,531,198Total excess liquidity 53,117,729 4,887,114 11,240,755 29,204,710 42,081,087 87,413,666

162 Union Assurance PLC
NOTES TO THE FINANCIAL STATEMENTS
As at 31 December Carrying
amount
No fixed
tenure
Up to one
year
1 - 5 years Over 5 years Total
2019
Financial assets
Held to maturity 20,376,303 - 2,667,552 9,496,107 34,610,464 46,774,123
Loans and receivables 13,199,658 - 5,414,978 9,181,168 3,116,587 17,712,733
Available for sale 7,848,043 - 1,735,872 4,936,507 4,979,517 11,651,896
Fair value through profit or loss 2,212,306 3,161,329 172,382 177,606 - 3,511,317
Other financial assets 563,376 - 141,564 452,274 123,234 717,072
Loans to life policyholders 1,555,759 - 620,453 803,421 131,885 1,555,759
Reinsurance receivable 502,975 - 275,256 227,719 - 502,975
Premiums receivable 344,785 - 344,785 - - 344,785
Cash in hand and at bank 632,962 - 632,962 - - 632,962
Total undiscounted assets 47,236,167 3,161,329 12,005,804 25,274,802 42,961,687 83,403,622
Financial liabilities
Reinsurance payables 812,930 - 622,458 190,472 - 812,930
Lease liabilities 289,176 - 106,411 251,897 - 358,308
Other financial liabilities 1,121,143 - 1,121,143 - - 1,121,143
Bank overdraft 168,428 - 168,428 - - 168,428
Total undiscounted liabilities 2,391,677 - 2,018,440 442,369 - 2,460,808
Total excess liquidity 44,844,490 3,161,329 9,987,365 24,832,433 42,961,687 80,942,814
The table below sets out the availability of the company’s financial assets to support future funding.
As at 31 December 2020 2019
Unencumbered
Rs.’000
Restricted as
collateral
Available as
collateral
Total Restricted as
collateral
Available as
collateral
Total
Held to maturity 18,710,892 3,449,527 22,160,419 17,402,472 2,973,831 20,376,303
Loans and receivables 15,513,028 1,571,100 17,084,128 11,201,304 1,998,354 13,199,658
Available for sale 3,524,525 4,429,888 7,954,413 4,132,224 3,715,819 7,848,043
Fair value through profit or loss 4,605,706 551,542 5,157,248 3,406,412 50,779 3,457,191
Loans to life policyholders 1,793,470 - 1,793,470 1,555,759 - 1,555,759
Reinsurance receivable 492,011 - 492,011 502,975 - 502,975
Premiums receivable 376,723 - 376,723 344,785 - 344,785
Other financial assets 313,916 323,317 637,233 288,200 275,176 563,376
Cash in hand and at bank 951,139 9,131 960,270 624,552 8,410 632,962
Total 46,281,410 10,334,505 56,615,915 39,458,683 9,022,369 48,481,052
Assets restricted as collateral represents the assets owned by the policyholders of the Company.
Financial assets available as collateral represents the assets owned by the shareholders of the Company. There were no financial
assets pledged as collateral during the year ended 31 December 2020.

Union Assurance at a Glance Management Discussion and Analysis Stewardship Financial Statements Supplementary Information
163Annual Report 2020
8.2(c) Credit Risk
Credit risk is the risk associated with a loss or potential loss from counterparties failing to fulfil their financial obligations.
The Company’s exposure to credit risk is derived from the following main categories of assets and the analysis of maximum credit
exposure is given below.
As at 31 December 2020 2019
Risk element Rs. ‘000 % Rs. ‘000 %
Financial investments 47,198,961 92 41,424,004 92
Loans to life policyholders and others 2,274,978 4 2,059,617 5
Reinsurance receivable 492,011 1 502,975 1
Premiums receivable 376,723 1 344,785 1
Cash in hand and at bank 960,270 2 632,962 1
Total 51,302,943 100 44,964,343 100
Credit risk related to financial investments
The Company is exposed to credit risk from counterparties
where the Company holds securities issued by those
entities.
Risk Response
• The Company’s investment policy prohibits non-graded
investments, unless specifically authorised.
• Appropriate actions are implemented when the
Company identifies investments that are expected to
be downgraded.
• The Company identifies and selectively reduces
unsecured and subordinated credit exposure issued by
third parties with weak credit profiles.
• Structured finance exposures are assessed on a look
through basis prior to acquisition and not merely on the
strength of prevailing credit ratings or credit profiles.
Company implemented several initiatives such as periodic
review of the creditworthiness of its counterparties using
external ratings, financial statements reviews, credit
agency information and industry information. Further,
economic environment was scrutinized in response to
Covid-19 pandemic limiting exposure to counterparties
who were severely affected.
The Company actively manages its investment portfolio to
ensure that there is no significant concentration of credit
risk. The Company monitors concentration of credit risk
by sector and instrument. An analysis of concentration of
credit risk and credit quality of financial investments are
shown below.
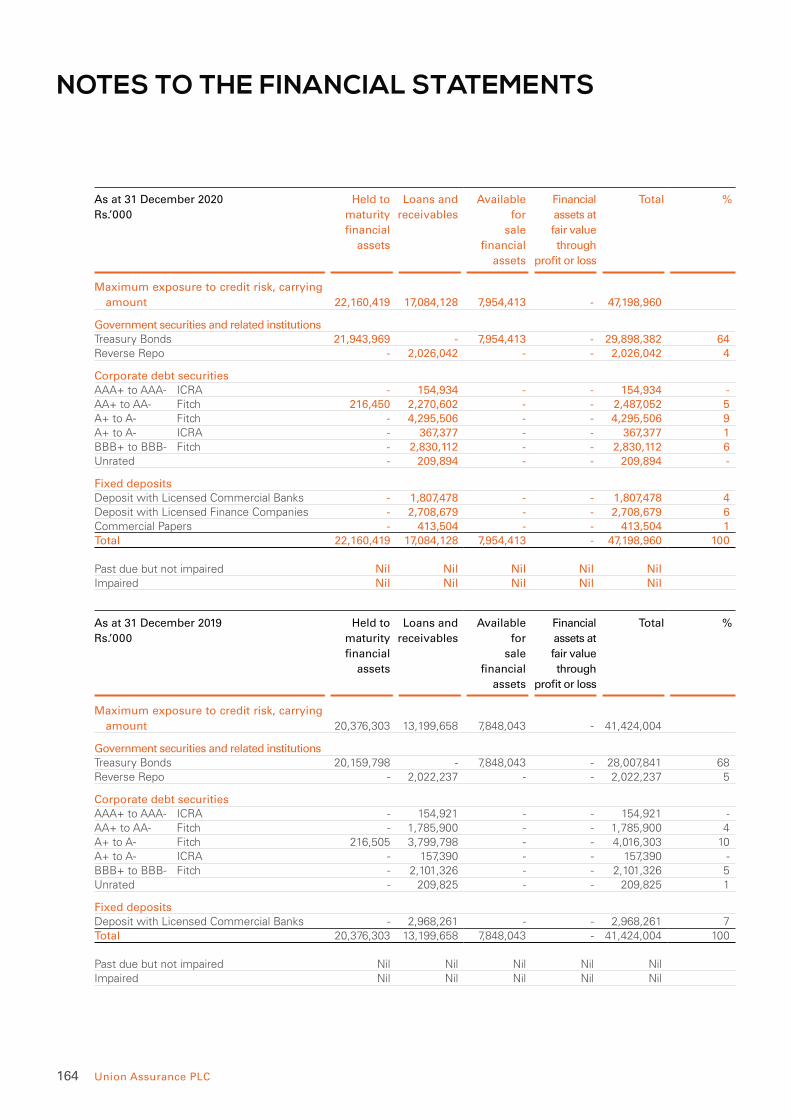
164 Union Assurance PLC
NOTES TO THE FINANCIAL STATEMENTS
As at 31 December 2020
Rs.’000
Held to
maturity
financial
assets
Loans and
receivables
Available
for
sale
financial
assets
Financial
assets at
fair value
through
profit or loss
Total %
Maximum exposure to credit risk, carrying
amount 22,160,419 17,084,128 7,954,413 - 47,198,960
Government securities and related institutionsTreasury Bonds 21,943,969 - 7,954,413 - 29,898,382 64 Reverse Repo - 2,026,042 - - 2,026,042 4
Corporate debt securitiesAAA+ to AAA- ICRA - 154,934 - - 154,934 - AA+ to AA- Fitch 216,450 2,270,602 - - 2,487,052 5 A+ to A- Fitch - 4,295,506 - - 4,295,506 9 A+ to A- ICRA - 367,377 - - 367,377 1 BBB+ to BBB- Fitch - 2,830,112 - - 2,830,112 6 Unrated - 209,894 - - 209,894 -
Fixed depositsDeposit with Licensed Commercial Banks - 1,807,478 - - 1,807,478 4 Deposit with Licensed Finance Companies - 2,708,679 - - 2,708,679 6 Commercial Papers - 413,504 - - 413,504 1 Total 22,160,419 17,084,128 7,954,413 - 47,198,960 100
Past due but not impaired Nil Nil Nil Nil NilImpaired Nil Nil Nil Nil Nil
As at 31 December 2019
Rs.’000
Held to
maturity
financial
assets
Loans and
receivables
Available
for
sale
financial
assets
Financial
assets at
fair value
through
profit or loss
Total %
Maximum exposure to credit risk, carrying
amount 20,376,303 13,199,658 7,848,043 - 41,424,004
Government securities and related institutionsTreasury Bonds 20,159,798 - 7,848,043 - 28,007,841 68 Reverse Repo - 2,022,237 - - 2,022,237 5
Corporate debt securitiesAAA+ to AAA- ICRA - 154,921 - - 154,921 - AA+ to AA- Fitch - 1,785,900 - - 1,785,900 4 A+ to A- Fitch 216,505 3,799,798 - - 4,016,303 10 A+ to A- ICRA - 157,390 - - 157,390 - BBB+ to BBB- Fitch - 2,101,326 - - 2,101,326 5 Unrated - 209,825 - - 209,825 1
Fixed depositsDeposit with Licensed Commercial Banks - 2,968,261 - - 2,968,261 7 Total 20,376,303 13,199,658 7,848,043 - 41,424,004 100
Past due but not impaired Nil Nil Nil Nil NilImpaired Nil Nil Nil Nil Nil
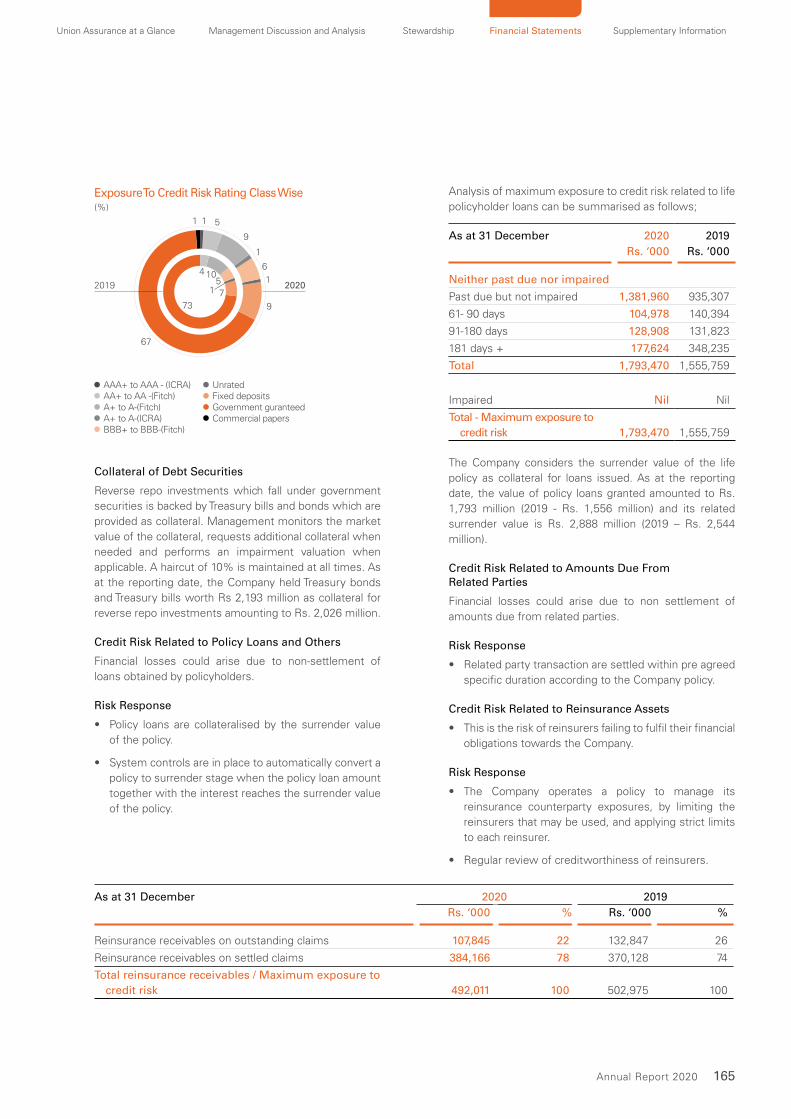
Union Assurance at a Glance Management Discussion and Analysis Stewardship Financial Statements Supplementary Information
165Annual Report 2020
(%)
9
67
6
1
1
9
511
2019 2020
AAA+ to AAA - (ICRA)AA+ to AA -(Fitch)A+ to A-(Fitch)A+ to A-(ICRA)BBB+ to BBB-(Fitch)
Exposure To Credit Risk Rating Class Wise
UnratedFixed depositsGovernment guranteedCommercial papers
15
104
737
Collateral of Debt Securities
Reverse repo investments which fall under government
securities is backed by Treasury bills and bonds which are
provided as collateral. Management monitors the market
value of the collateral, requests additional collateral when
needed and performs an impairment valuation when
applicable. A haircut of 10% is maintained at all times. As
at the reporting date, the Company held Treasury bonds
and Treasury bills worth Rs 2,193 million as collateral for
reverse repo investments amounting to Rs. 2,026 million.
Credit Risk Related to Policy Loans and Others
Financial losses could arise due to non-settlement of
loans obtained by policyholders.
Risk Response
• Policy loans are collateralised by the surrender value
of the policy.
• System controls are in place to automatically convert a
policy to surrender stage when the policy loan amount
together with the interest reaches the surrender value
of the policy.
Analysis of maximum exposure to credit risk related to life
policyholder loans can be summarised as follows;
As at 31 December 2020 2019
Rs. ‘000 Rs. ‘000
Neither past due nor impaired
Past due but not impaired 1,381,960 935,307
61- 90 days 104,978 140,394
91-180 days 128,908 131,823
181 days + 177,624 348,235
Total 1,793,470 1,555,759
Impaired Nil Nil
Total - Maximum exposure to
credit risk 1,793,470 1,555,759
The Company considers the surrender value of the life
policy as collateral for loans issued. As at the reporting
date, the value of policy loans granted amounted to Rs.
1,793 million (2019 - Rs. 1,556 million) and its related
surrender value is Rs. 2,888 million (2019 – Rs. 2,544
million).
Credit Risk Related to Amounts Due From Related Parties
Financial losses could arise due to non settlement of
amounts due from related parties.
Risk Response
• Related party transaction are settled within pre agreed
specific duration according to the Company policy.
Credit Risk Related to Reinsurance Assets
• This is the risk of reinsurers failing to fulfil their financial
obligations towards the Company.
Risk Response
• The Company operates a policy to manage its
reinsurance counterparty exposures, by limiting the
reinsurers that may be used, and applying strict limits
to each reinsurer.
• Regular review of creditworthiness of reinsurers.
As at 31 December 2020 2019
Rs. ‘000 % Rs. ‘000 %
Reinsurance receivables on outstanding claims 107,845 22 132,847 26
Reinsurance receivables on settled claims 384,166 78 370,128 74
Total reinsurance receivables / Maximum exposure to
credit risk 492,011 100 502,975 100
166 Union Assurance PLC
NOTES TO THE FINANCIAL STATEMENTS
As at 31 December 2020, 100% (2019 - 100%) of our reinsurance receivables was due from reinsurers with a rating of AA- or
above. There were no collateral against reinsurance receivables as at reporting date.
As at 31 December 2020 2019
Reinsurers Rating Agency Rating Reinsurance
receivables
% Reinsurance
receivables
%
Munich Fitch AA 464,705 94 482,725 96
Hannover Standard & Poor's AA- 23,827 5 19,496 4
RGA Fitch AA- 3,479 1 754 -
Total 492,011 100 502,975 100
Credit Risk Related to Premiums Receivable
Premiums receivable consist of premiums receivable
from intermediaries that create the risk of financial losses
due to non settlement of dues or taking substantial time
to settle dues.
Risk Response
• Only designated institutions are employed as
intermediary parties
• Agreements have been signed with the intermediaries
committing them to settle dues within a specified time
period.
Maximum exposure to credit risk related to premium
receivables as at 31 December 2020 is Rs. 377 million
(2019 - Rs. 345 million).
As at 31 December 2020 2019
Rs. ‘000 Rs. ‘000
Neither past due nor impaired
0 - 30 days 376,723 344,785
Pass due but not impaired Nil Nil
Total - Maximum exposure to
credit risk 376,723 344,785
Credit Risk Related to Cash At Bank
Risk Response
The Company maintains an authorised list of acceptable bank counterparties based on current ratings and economic outlook, taking into account analysis of fundamentals and market indicators.
The Company manages credit risk by maintaining its deposits with various banking institutions with quality credit ratings. A list of such banking partners is provided below. Majority i.e 44% of funds are deposited in banking institutions backed by government of Sri Lanka.
As at 31 December 2020 2019
Bank Amount
Rs. ‘000
% Amount
Rs. ‘000
%
Bank of Ceylon 324,985 34 228,862 36 Commercial Bank of Ceylon PLC 58,480 6 8,042 1 Deutsche Bank AG 34,052 4 25,099 4 DFCC Bank PLC 838 - 638 - HDFC Bank of Sri Lanka 7 - 7 - Hatton National Bank PLC 92,211 10 10,007 2 National Development Bank PLC 44,563 5 10,011 2 National Savings Bank 13,601 1 6,636 1 Nations Trust Bank PLC 66,322 7 79,865 13 People's Bank 83,772 9 21,796 3 Sampath Bank PLC 51,290 5 13,220 2 Standard Chartered Bank 4,250 - 7,935 1 Seylan Bank PLC 14,538 1 11,145 2 Union Bank of Colombo PLC 168,435 18 206,543 33 Total cash at banks 957,344 100 629,806 100
Cash in hand 2,926 3,156 Total cash in hand 2,926 3,156
Total cash in hand and at bank 960,270 632,962
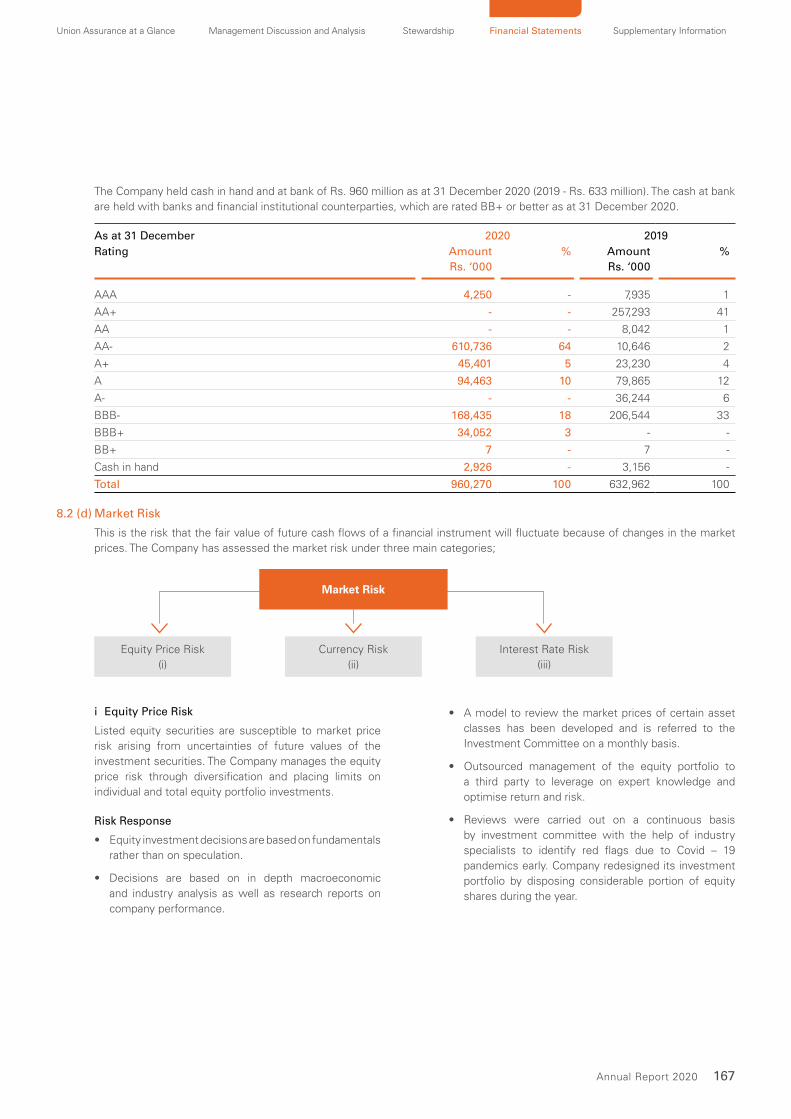
Union Assurance at a Glance Management Discussion and Analysis Stewardship Financial Statements Supplementary Information
167Annual Report 2020
The Company held cash in hand and at bank of Rs. 960 million as at 31 December 2020 (2019 - Rs. 633 million). The cash at bank
are held with banks and financial institutional counterparties, which are rated BB+ or better as at 31 December 2020.
As at 31 December 2020 2019
Rating Amount
Rs. ‘000
% Amount
Rs. ‘000
%
AAA 4,250 - 7,935 1
AA+ - - 257,293 41
AA - - 8,042 1
AA- 610,736 64 10,646 2
A+ 45,401 5 23,230 4
A 94,463 10 79,865 12
A- - - 36,244 6
BBB- 168,435 18 206,544 33
BBB+ 34,052 3 - -
BB+ 7 - 7 -
Cash in hand 2,926 - 3,156 -
Total 960,270 100 632,962 100
8.2 (d) Market Risk
This is the risk that the fair value of future cash flows of a financial instrument will fluctuate because of changes in the market
prices. The Company has assessed the market risk under three main categories;
Equity Price Risk
(i)Currency Risk
(ii)Interest Rate Risk
(iii)
Market Risk
i Equity Price Risk
Listed equity securities are susceptible to market price
risk arising from uncertainties of future values of the
investment securities. The Company manages the equity
price risk through diversification and placing limits on
individual and total equity portfolio investments.
Risk Response
• Equity investment decisions are based on fundamentals
rather than on speculation.
• Decisions are based on in depth macroeconomic
and industry analysis as well as research reports on
company performance.
• A model to review the market prices of certain asset
classes has been developed and is referred to the
Investment Committee on a monthly basis.
• Outsourced management of the equity portfolio to
a third party to leverage on expert knowledge and
optimise return and risk.
• Reviews were carried out on a continuous basis
by investment committee with the help of industry
specialists to identify red flags due to Covid – 19
pandemics early. Company redesigned its investment
portfolio by disposing considerable portion of equity
shares during the year.

168 Union Assurance PLC
NOTES TO THE FINANCIAL STATEMENTS
As at 31 December 2020, the Company has invested 6% (2019 - 5%) in equity as shown in the table below.
As at 31 December 2020 2019
Rs.’000 Value % of
allocation
Value % of
allocation
Banks 1,121,871 2 1,251,818 3
Capital Goods 696,368 2 109,159 -
Consumer Durables & Apparel 253,799 1 113,526 -
Consumer Services 27,606 - 9,889 -
Diversified Financials - - 115,930 -
Food and Staples Retailing 148,256 - - -
Food Beverage & Tobacco 478,612 1 208,183 1
Materials - - 217,189 1
Retailing - - 1,100 -
Telecommunication Services 158,211 - 33,174 -
Total value of equity 2,884,723 6 2,059,968 5
Total value of investments 51,302,852 43,636,310
The following shows the estimated impact from a 10% change in the stock market prices on the portfolio with indicative
comparatives.
Sensitivity of Fund Inflow to Change in Equity Prices
2020 2019
Rs.’000 Impact on
fund inflow
Impact on
equity
Impact on
fund inflow
Impact on
equity
10% increase in equity prices 288,472 288,472 205,997 205,997
10% decrease in equity prices (288,472) (288,472) (205,997) (205,997)
ii Currency Risk
Currency risk is the risk that the fair value / present value
of the future cash flows of a financial instrument will
fluctuate because of changes in foreign exchange rates.
The Company’s principal transactions are carried out in
Sri Lankan Rupees and its exposure to foreign exchange
risk primarily arises when transacting with reinsurers,
professional services providers and software vendors
who operates outside the country.
The Sri Lankan Rupee witnessed a sharp depreciation
against the US Dollar from March 2020 on the back of
economic turmoil in global, regional and local markets
resulting from the COVID-19 pandemic.
Risk Response
• Company does not carry foreign currency dominated
assets or liabilities and any foreign payment is promptly
processed.
iii Interest Rate Risk
Interest rate risk is the risk of fluctuation of the value or
cash flows of an instrument due to changes in market
interest rates. Floating rate instruments expose the
Company to cash flow fluctuations, whereas fixed interest
rate instruments expose the Company to changes in fair
values.
The global outbreak of the novel COVID-19 pandemic
has resulted in a consecutive reduction in policy rates
and monetary easing policies by CBSL. Further there is a
reduction in yield of Treasury bill and bond Market.
Risk Response
• The Investment Committee keeps a regular track of
macroeconomic scenarios and their likely impact on
interest rates.
• Initial recognition of investments is closely monitored.
• Proactively evaluate and execute forward purchases to
lock in future cash flows at favourable interest rates.
• Re-design of investment portfolio to keep in par with
the interest rate movements.
The following provides details of the quantum of investment
exposed to fluctuations in fair values. No instrument is
exposed to fluctuations in cash flows as the Company
does not hold any instruments with variable interest rates.
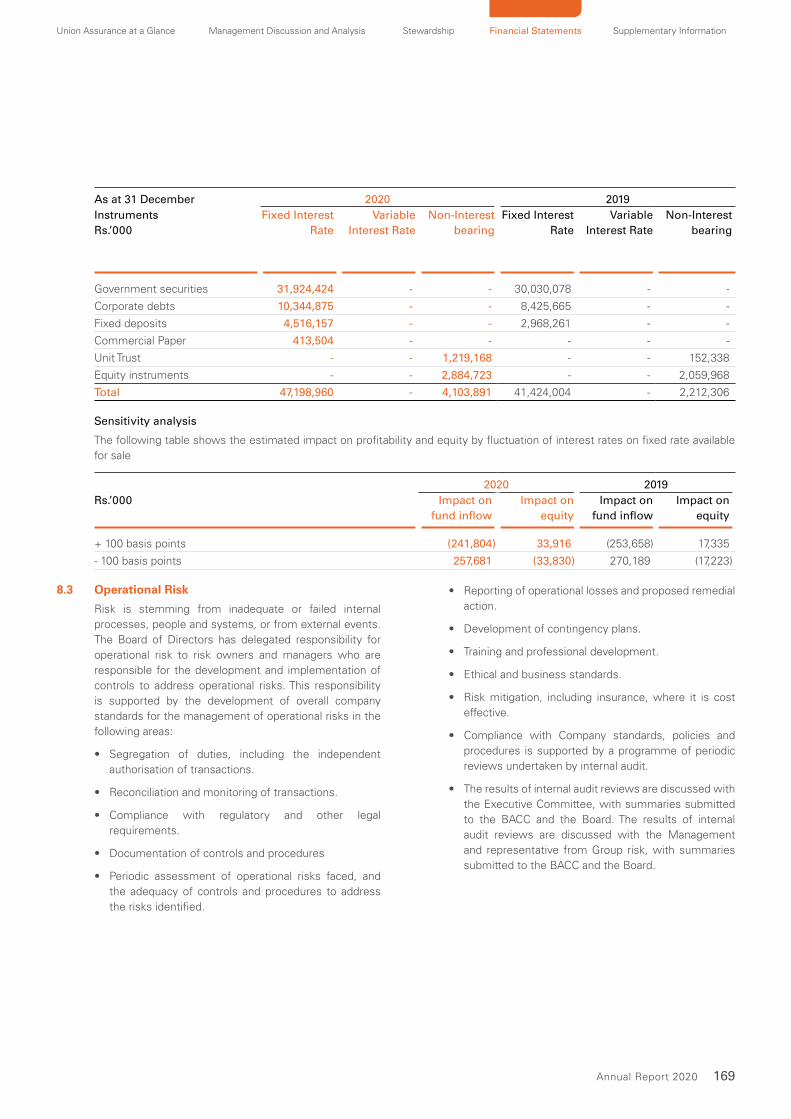
Union Assurance at a Glance Management Discussion and Analysis Stewardship Financial Statements Supplementary Information
169Annual Report 2020
As at 31 December 2020 2019
Instruments
Rs.’000
Fixed Interest
Rate
Variable
Interest Rate
Non-Interest
bearing
Fixed Interest
Rate
Variable
Interest Rate
Non-Interest
bearing
Government securities 31,924,424 - - 30,030,078 - -
Corporate debts 10,344,875 - - 8,425,665 - -
Fixed deposits 4,516,157 - - 2,968,261 - -
Commercial Paper 413,504 - - - - -
Unit Trust - - 1,219,168 - - 152,338
Equity instruments - - 2,884,723 - - 2,059,968
Total 47,198,960 - 4,103,891 41,424,004 - 2,212,306
Sensitivity analysis
The following table shows the estimated impact on profitability and equity by fluctuation of interest rates on fixed rate available
for sale
2020 2019
Rs.’000 Impact on
fund inflow
Impact on
equity
Impact on
fund inflow
Impact on
equity
+ 100 basis points (241,804) 33,916 (253,658) 17,335
- 100 basis points 257,681 (33,830) 270,189 (17,223)
8.3 Operational Risk
Risk is stemming from inadequate or failed internal
processes, people and systems, or from external events.
The Board of Directors has delegated responsibility for
operational risk to risk owners and managers who are
responsible for the development and implementation of
controls to address operational risks. This responsibility
is supported by the development of overall company
standards for the management of operational risks in the
following areas:
• Segregation of duties, including the independent
authorisation of transactions.
• Reconciliation and monitoring of transactions.
• Compliance with regulatory and other legal
requirements.
• Documentation of controls and procedures
• Periodic assessment of operational risks faced, and
the adequacy of controls and procedures to address
the risks identified.
• Reporting of operational losses and proposed remedial
action.
• Development of contingency plans.
• Training and professional development.
• Ethical and business standards.
• Risk mitigation, including insurance, where it is cost
effective.
• Compliance with Company standards, policies and
procedures is supported by a programme of periodic
reviews undertaken by internal audit.
• The results of internal audit reviews are discussed with
the Executive Committee, with summaries submitted
to the BACC and the Board. The results of internal
audit reviews are discussed with the Management
and representative from Group risk, with summaries
submitted to the BACC and the Board.
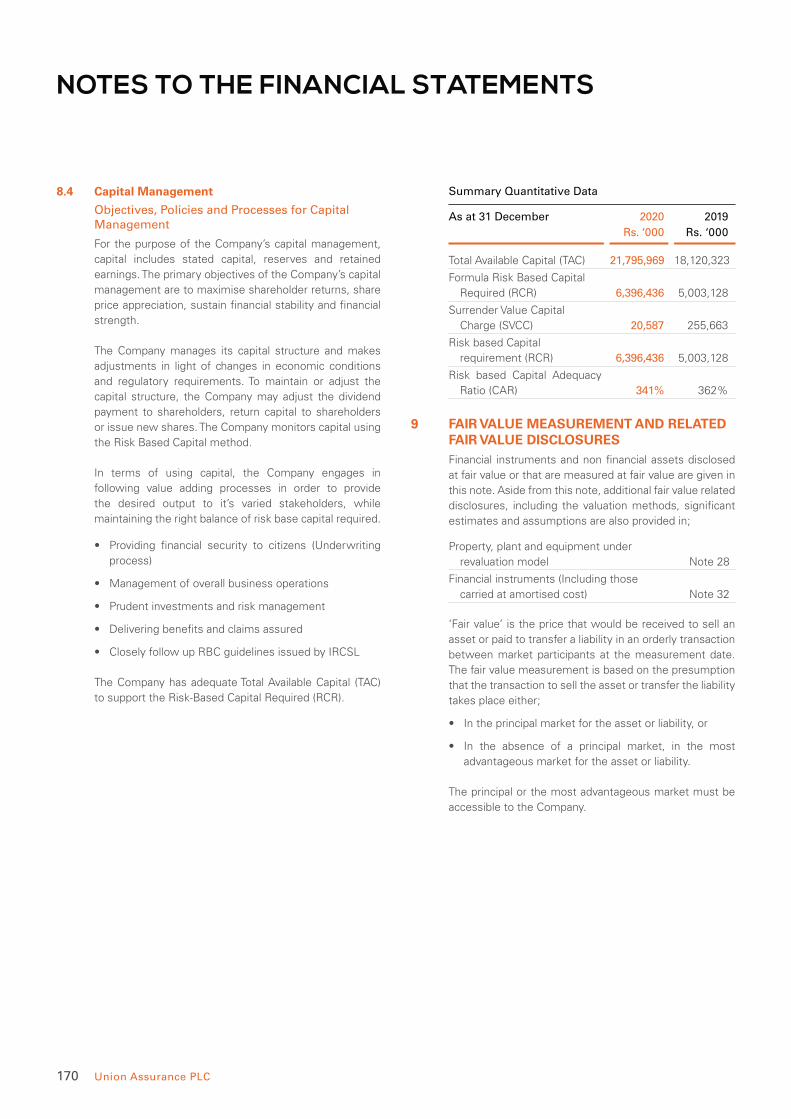
170 Union Assurance PLC
NOTES TO THE FINANCIAL STATEMENTS
8.4 Capital Management
Objectives, Policies and Processes for Capital Management
For the purpose of the Company’s capital management,
capital includes stated capital, reserves and retained
earnings. The primary objectives of the Company’s capital
management are to maximise shareholder returns, share
price appreciation, sustain financial stability and financial
strength.
The Company manages its capital structure and makes
adjustments in light of changes in economic conditions
and regulatory requirements. To maintain or adjust the
capital structure, the Company may adjust the dividend
payment to shareholders, return capital to shareholders
or issue new shares. The Company monitors capital using
the Risk Based Capital method.
In terms of using capital, the Company engages in
following value adding processes in order to provide
the desired output to it’s varied stakeholders, while
maintaining the right balance of risk base capital required.
• Providing financial security to citizens (Underwriting
process)
• Management of overall business operations
• Prudent investments and risk management
• Delivering benefits and claims assured
• Closely follow up RBC guidelines issued by IRCSL
The Company has adequate Total Available Capital (TAC)
to support the Risk-Based Capital Required (RCR).
Summary Quantitative Data
As at 31 December 2020 2019
Rs. ‘000 Rs. ‘000
Total Available Capital (TAC) 21,795,969 18,120,323
Formula Risk Based Capital
Required (RCR) 6,396,436 5,003,128
Surrender Value Capital
Charge (SVCC) 20,587 255,663
Risk based Capital
requirement (RCR) 6,396,436 5,003,128
Risk based Capital Adequacy
Ratio (CAR) 341% 362%
9 FAIR VALUE MEASUREMENT AND RELATED FAIR VALUE DISCLOSURESFinancial instruments and non financial assets disclosed
at fair value or that are measured at fair value are given in
this note. Aside from this note, additional fair value related
disclosures, including the valuation methods, significant
estimates and assumptions are also provided in;
Property, plant and equipment under
revaluation model Note 28
Financial instruments (Including those
carried at amortised cost) Note 32
‘Fair value’ is the price that would be received to sell an
asset or paid to transfer a liability in an orderly transaction
between market participants at the measurement date.
The fair value measurement is based on the presumption
that the transaction to sell the asset or transfer the liability
takes place either;
• In the principal market for the asset or liability, or
• In the absence of a principal market, in the most
advantageous market for the asset or liability.
The principal or the most advantageous market must be
accessible to the Company.

Union Assurance at a Glance Management Discussion and Analysis Stewardship Financial Statements Supplementary Information
171Annual Report 2020
The fair value of an asset or a liability is measured using
the assumptions that market participants would use
when pricing the asset or liability, assuming that market
participants act in their economic best interest.
A fair value measurement of a non financial asset takes
into account a market participant’s ability to generate
economic benefits by using the asset in its highest and
best use or by selling it to another market participant
that would use the asset in its highest and best use.
External professional valuers are involved for valuation of
significant assets such as land and buildings.
Fair value hierarchy
The Company measures the fair value using the following
fair value hierarchy, which reflects the significance of the
inputs used in making the measurement.
Level 1
Inputs that are unadjusted quoted market prices in an active market for identical instruments
When available, the Company measures the fair value of
an instrument using active quoted prices or dealer price
quotations (assets and long positions are measured at a
bid price; liabilities and short positions are measured at an
ask price), without any deduction for transaction costs. A
market is regarded as active if transactions for asset or
liability take place with sufficient frequency and volume to
provide pricing information on an ongoing basis.
Level 2
Inputs other than quoted prices included within level 1 that are observable either directly (i.e. as prices) or indirectly (i.e. derived from prices)
This category includes instruments valued using;
• quoted market prices in active markets for similar
instruments,
• quoted prices for identical or similar instruments in
markets that are considered to be less active, or
• other valuation techniques in which almost all
significant inputs are directly or indirectly observable
from market data.
Level 3
Inputs that are unobservable
This category includes all instruments for which the
valuation technique includes inputs not based on
observable data and the unobservable inputs have a
significant effect on the instruments value.
Valuation techniques include net present value and
discounted cash flow models comparisons with similar
instruments for which observable market prices exist,
option pricing models and other valuation models.
Assumptions and inputs used in valuation techniques
include risk free and benchmark interest rates, risk
premiums in estimating discount rates, bond and equity
prices, foreign exchange rates, expected price volatilities
and corrections.
Observable prices or model inputs such as market
interest rates are usually available in the market for listed
equity securities and government securities such as
treasury bills and bonds. Availability of observable prices
and model inputs reduces the need for management
judgement and estimation while reducing uncertainty
associated in determining the fair values.
Models are adjusted to reflect the spread for bid and
ask prices to reflect costs to close out positions, credit
and debit valuation adjustments, liquidity spread and
limitations in the models. Also profit or loss calculated
when such financial instruments are first recorded (‘Day
1’ profit or loss), is deferred and recognised only when
the inputs become observable or on recognition of the
instrument.

172 Union Assurance PLC
NOTES TO THE FINANCIAL STATEMENTS
Following note explains the methodology for valuing our financial assets and provides an analysis of these according to the ‘fair
value hierarchy’.
Instrument Category Fair value basis Fair value hierarchy
Government Securities
Treasury Bonds Valued using the market yield Level 1
Treasury Bills Valued using the market yield Level 1
Investment in Shares
Investment in Listed Shares Closing Market prices Level 1
Corporate Debt
Listed Published Market Prices Level 1 / Level 2*
Fixed and Term Deposits
Deposit over one year Discounted Cash Flow (DCF) Method
Using Treasury Bond rates for similar maturity plus a risk premium.
The risk premium is determined based on the upgrade / downgrade
of the credit rating of the institution.
Level 2
*Listed corporate debts which have been traded during the period have been classified under Level 1 and others under level 2.
Use of Judgments and Estimates
Where the fair value of financial assets and financial
liabilities recorded in the statement of financial position
cannot be derived from active markets, their fair value
is determined using valuation techniques including the
discounted cash flow model. The inputs to these models
are taken from observable markets where possible.
Where this is not feasible, a degree of judgement
is required in establishing fair values. The
judgements include considerations of inputs such
as liquidity risk, credit risk and volatility. Changes
in assumptions about these factors could affect the
reported fair value of financial instruments.
9.1 Valuation framework
The Company has established a control framework with
respect to the measurement of fair values of investments.
The investment committee has overall responsibility for
the results of trading and investment operations and all
significant fair value measurements carried out by the
investment division, which include;
• Verification of observable pricing.
• Re-performance of model valuations.
• Quarterly calibration and back-testing of models
against observed market transactions.
• Review of significant unobservable inputs, valuation,
adjustments and significant changes of the fair value
measurement of level 3 instruments compared with
the previous
When third party information, such as broker quotes
or pricing services are used to measure fair value,
documentary evidence is obtained from third parties to
support the conclusion that such valuations meet the
requirements of SLFRSs / LKASs.
9.2 Assets measured at fair value
The following table analyses financial assets measured
at fair value at the reporting date, by the level in the fair
value hierarchy into which the fair value measurement is
categorised. Whenever available, quoted prices in active
markets are obtained for identical assets at the reporting
date to measure fixed maturity securities at fair value in
trading and AFS portfolios. Market price data is generally
obtained from dealer markets.

Union Assurance at a Glance Management Discussion and Analysis Stewardship Financial Statements Supplementary Information
173Annual Report 2020
Fair value hierarchy
As at 31 December 2020 2019
Rs.’000 Note Level 1 Level 2 Level 3 Total Level 1 Level 2 Level 3 Total
Non-Financial Assets
Property, Plant & Equipment
Land and Building 28.1 - - 2,265,819 2,265,819 - - 2,265,227 2,265,227
Total Non-Financial Assets at
Fair Value - - 2,265,819 2,265,819 - - 2,265,227 2,265,227
Financial Assets
Financial assets at FVTPL
Financial assets held for trading:
Equity securities 32.6 2,884,723 - - 2,884,723 2,059,968 - - 2,059,968
Unit Trusts 32.6 1,219,168 - - 1,219,168 152,338 - - 152,338
Designated at FVTPL
Investments for the benefit of
Life insurance policyholders
who bear the investment risk
Equity securities 32.6 783,223 - - 783,223 949,024 - - 949,024
Commercial Paper 32.6 - 10,259 - 10,259 - - - -
Debt securities 32.6 - 148,433 - 148,433 - 140,534 - 140,534
Government securities 32.6 - 82,998 - 82,998 26,649 112,386 - 139,035
Fixed deposits 32.6 - 28,444 - 28,444 - 16,292 - 16,292
4,887,114 270,134 - 5,157,248 3,187,979 269,212 - 3,457,191
AFS financial assets:
Treasury bonds 32.5 7,954,413 - - 7,954,413 7,848,043 - - 7,848,043
7,954,413 - - 7,954,413 7,848,043 - - 7,848,043
Total of financial assets carried
at fair value
12,841,527 270,134 - 13,111,661
11,036,022 269,212 -
11,305,234
Total of assets carried at fair value 12,841,527 270,134 2,265,819 15,377,480 11,036,022 269,212 2,265,227 13,570,461
9.3 Transfer between levels
As of 31 March 2020, all listed equity instruments
amounting to Rs. 2,870 Mn were transferred from
level 1 to level 2 since as at 31 March 2020 it showed
factors which were indicative of an inactive market
due to COVID-19 pandemic. The Company determined
the fair value of equity portfolio as of 31 March 2020,
based on closing traded prices that existed as of
31 December 2019.
However, by 30 June 2020, investor sentiment
improved, providing tailwind to the market’s recovery
and recommencing trading activities. Therefore, all
listed equity instruments were measured based on the
market prices as at 30 June 2020 and Rs. 2,260 Mn were
transferred back from Level 2 to Level 1 since there was
an active market.
There were no transfers in 2020 other than above.
(2019 - Nil)
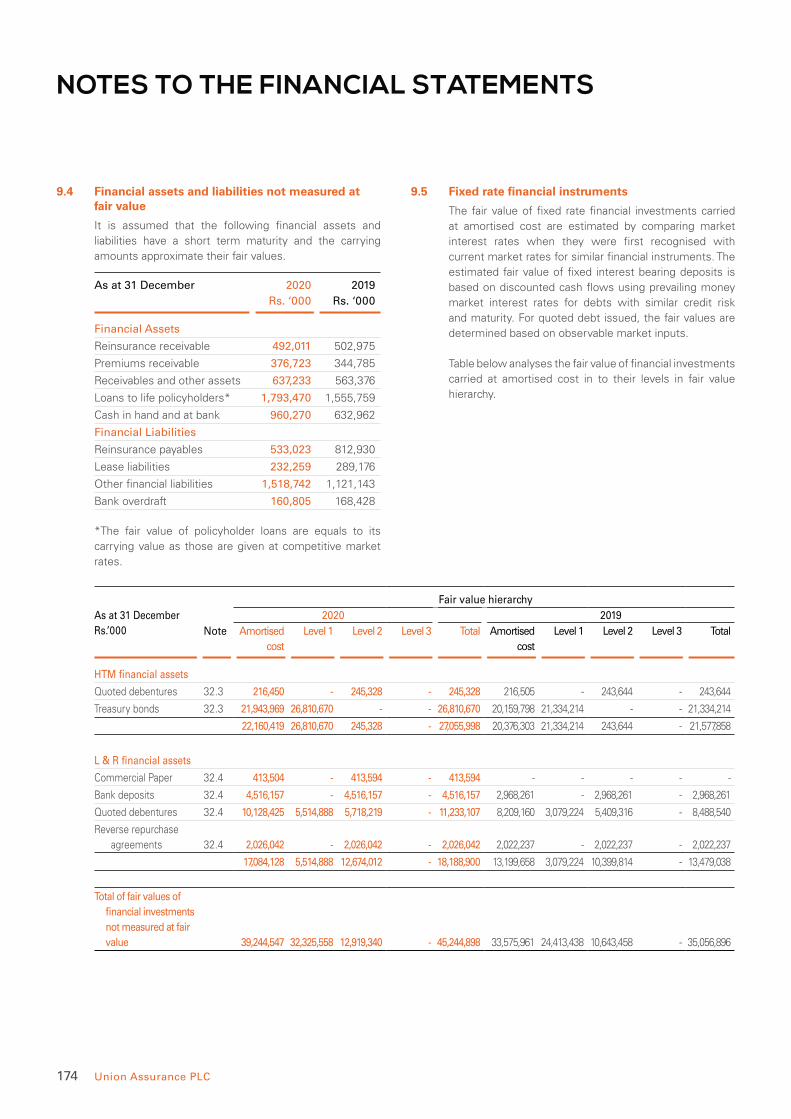
174 Union Assurance PLC
NOTES TO THE FINANCIAL STATEMENTS
9.4 Financial assets and liabilities not measured at fair value
It is assumed that the following financial assets and
liabilities have a short term maturity and the carrying
amounts approximate their fair values.
As at 31 December 2020 2019
Rs. ‘000 Rs. ‘000
Financial Assets
Reinsurance receivable 492,011 502,975
Premiums receivable 376,723 344,785
Receivables and other assets 637,233 563,376
Loans to life policyholders* 1,793,470 1,555,759
Cash in hand and at bank 960,270 632,962
Financial Liabilities
Reinsurance payables 533,023 812,930
Lease liabilities 232,259 289,176
Other financial liabilities 1,518,742 1,121,143
Bank overdraft 160,805 168,428
*The fair value of policyholder loans are equals to its
carrying value as those are given at competitive market
rates.
9.5 Fixed rate financial instruments
The fair value of fixed rate financial investments carried
at amortised cost are estimated by comparing market
interest rates when they were first recognised with
current market rates for similar financial instruments. The
estimated fair value of fixed interest bearing deposits is
based on discounted cash flows using prevailing money
market interest rates for debts with similar credit risk
and maturity. For quoted debt issued, the fair values are
determined based on observable market inputs.
Table below analyses the fair value of financial investments
carried at amortised cost in to their levels in fair value
hierarchy.
Fair value hierarchy
As at 31 December
Rs.’000
2020 2019
Note Amortised
cost
Level 1 Level 2 Level 3 Total Amortised
cost
Level 1 Level 2 Level 3 Total
HTM financial assets
Quoted debentures 32.3 216,450 - 245,328 - 245,328 216,505 - 243,644 - 243,644
Treasury bonds 32.3 21,943,969 26,810,670 - - 26,810,670 20,159,798 21,334,214 - - 21,334,214
22,160,419 26,810,670 245,328 - 27,055,998 20,376,303 21,334,214 243,644 - 21,577,858
L & R financial assets
Commercial Paper 32.4 413,504 - 413,594 - 413,594 - - - - -
Bank deposits 32.4 4,516,157 - 4,516,157 - 4,516,157 2,968,261 - 2,968,261 - 2,968,261
Quoted debentures 32.4 10,128,425 5,514,888 5,718,219 - 11,233,107 8,209,160 3,079,224 5,409,316 - 8,488,540
Reverse repurchase
agreements 32.4 2,026,042 - 2,026,042 - 2,026,042 2,022,237 - 2,022,237 - 2,022,237
17,084,128 5,514,888 12,674,012 - 18,188,900 13,199,658 3,079,224 10,399,814 - 13,479,038
Total of fair values of
financial investments
not measured at fair
value 39,244,547 32,325,558 12,919,340 - 45,244,898 33,575,961 24,413,438 10,643,458 - 35,056,896
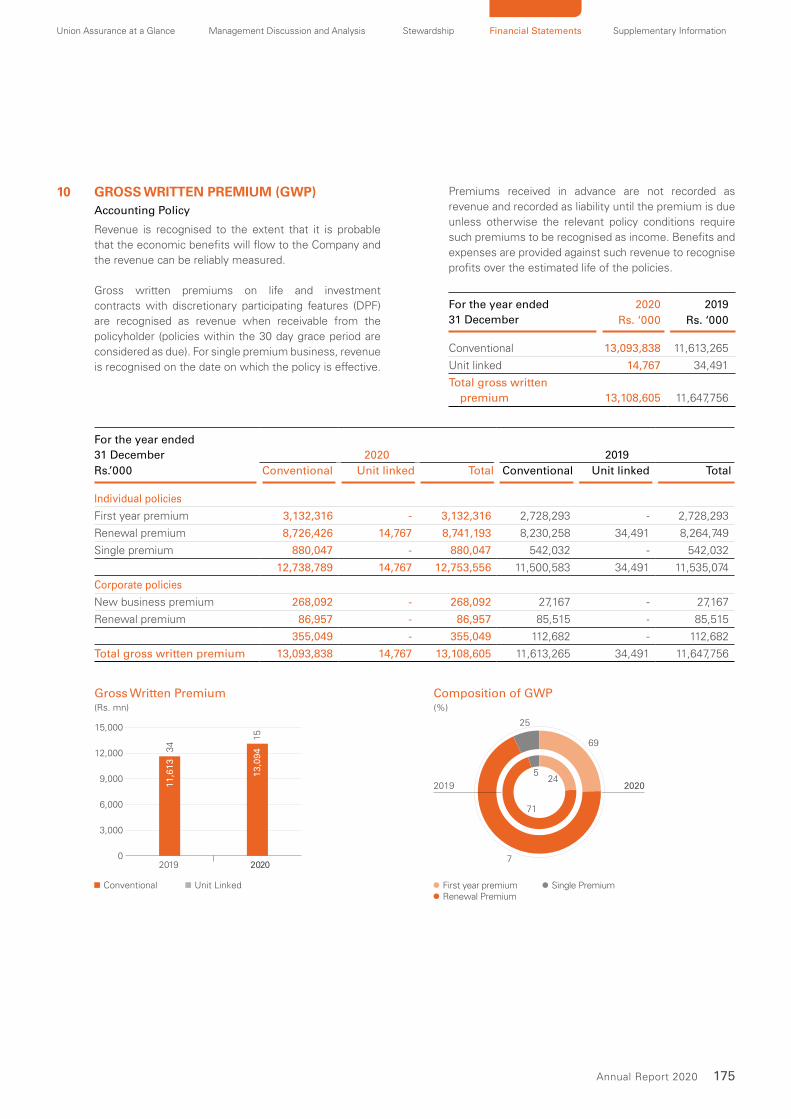
Union Assurance at a Glance Management Discussion and Analysis Stewardship Financial Statements Supplementary Information
175Annual Report 2020
10 GROSS WRITTEN PREMIUM (GWP) Accounting Policy
Revenue is recognised to the extent that it is probable
that the economic benefits will flow to the Company and
the revenue can be reliably measured.
Gross written premiums on life and investment
contracts with discretionary participating features (DPF)
are recognised as revenue when receivable from the
policyholder (policies within the 30 day grace period are
considered as due). For single premium business, revenue
is recognised on the date on which the policy is effective.
Premiums received in advance are not recorded as
revenue and recorded as liability until the premium is due
unless otherwise the relevant policy conditions require
such premiums to be recognised as income. Benefits and
expenses are provided against such revenue to recognise
profits over the estimated life of the policies.
For the year ended
31 December
2020 2019
Rs. ‘000 Rs. ‘000
Conventional 13,093,838 11,613,265
Unit linked 14,767 34,491
Total gross written
premium 13,108,605 11,647,756
For the year ended
31 December 2020 2019
Rs.’000 Conventional Unit linked Total Conventional Unit linked Total
Individual policies
First year premium 3,132,316 - 3,132,316 2,728,293 - 2,728,293
Renewal premium 8,726,426 14,767 8,741,193 8,230,258 34,491 8,264,749
Single premium 880,047 - 880,047 542,032 - 542,032
12,738,789 14,767 12,753,556 11,500,583 34,491 11,535,074
Corporate policies
New business premium 268,092 - 268,092 27,167 - 27,167
Renewal premium 86,957 - 86,957 85,515 - 85,515
355,049 - 355,049 112,682 - 112,682
Total gross written premium 13,093,838 14,767 13,108,605 11,613,265 34,491 11,647,756
(%)
7
69
25
2019 2020
First year premiumRenewal Premium
Composition of GWP
Single Premium
245
71
(Rs. mn)
2019 2020
Gross Written Premium
0
3,000
6,000
9,000
12,000
15,000
11,6
13
34
15
13,0
94
Conventional Unit Linked
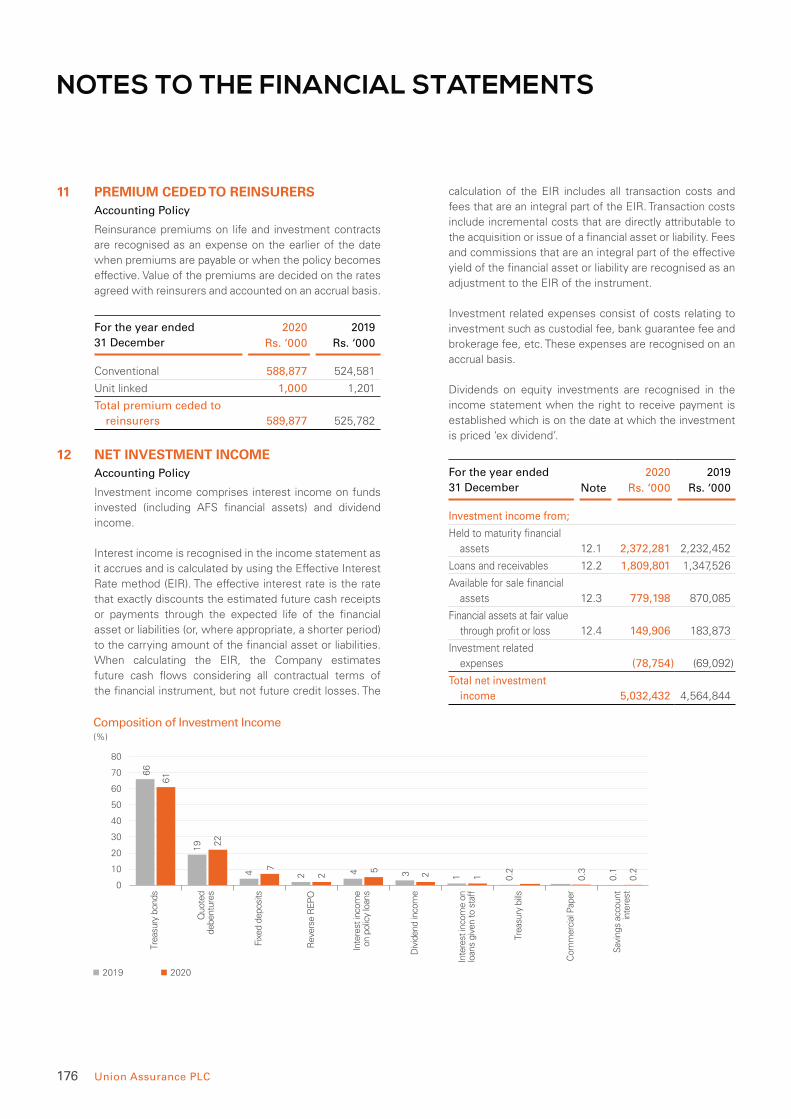
176 Union Assurance PLC
NOTES TO THE FINANCIAL STATEMENTS
11 PREMIUM CEDED TO REINSURERS Accounting Policy
Reinsurance premiums on life and investment contracts
are recognised as an expense on the earlier of the date
when premiums are payable or when the policy becomes
effective. Value of the premiums are decided on the rates
agreed with reinsurers and accounted on an accrual basis.
For the year ended
31 December
2020 2019
Rs. ‘000 Rs. ‘000
Conventional 588,877 524,581
Unit linked 1,000 1,201
Total premium ceded to
reinsurers 589,877 525,782
12 NET INVESTMENT INCOME Accounting Policy
Investment income comprises interest income on funds
invested (including AFS financial assets) and dividend
income.
Interest income is recognised in the income statement as
it accrues and is calculated by using the Effective Interest
Rate method (EIR). The effective interest rate is the rate
that exactly discounts the estimated future cash receipts
or payments through the expected life of the financial
asset or liabilities (or, where appropriate, a shorter period)
to the carrying amount of the financial asset or liabilities.
When calculating the EIR, the Company estimates
future cash flows considering all contractual terms of
the financial instrument, but not future credit losses. The
calculation of the EIR includes all transaction costs and
fees that are an integral part of the EIR. Transaction costs
include incremental costs that are directly attributable to
the acquisition or issue of a financial asset or liability. Fees
and commissions that are an integral part of the effective
yield of the financial asset or liability are recognised as an
adjustment to the EIR of the instrument.
Investment related expenses consist of costs relating to
investment such as custodial fee, bank guarantee fee and
brokerage fee, etc. These expenses are recognised on an
accrual basis.
Dividends on equity investments are recognised in the
income statement when the right to receive payment is
established which is on the date at which the investment
is priced ‘ex dividend’.
For the year ended
31 December
2020 2019
Note Rs. ‘000 Rs. ‘000
Investment income from;
Held to maturity financial
assets 12.1 2,372,281 2,232,452
Loans and receivables 12.2 1,809,801 1,347,526
Available for sale financial
assets 12.3 779,198 870,085
Financial assets at fair value
through profit or loss 12.4 149,906 183,873
Investment related
expenses (78,754) (69,092)
Total net investment
income 5,032,432 4,564,844
(%)
Trea
sury
bon
ds
Quo
ted
debe
ntur
es
Fixe
d de
posi
ts
Rev
erse
RE
PO
Inte
rest
inco
me
on p
olic
y lo
ans
Div
iden
d in
com
e
Inte
rest
inco
me
onlo
ans
give
n to
sta
ff
Trea
sury
bills
Com
mer
cial
Pap
er
Sav
ings
acc
ount
inte
rest
Composition of Investment Income
0
10
20
30
40
50
60
70
80
2019 2020
66
61
19 22
4
7
2 4 5 3 2 1 1 0.2
0.3
0.1
0.22

Union Assurance at a Glance Management Discussion and Analysis Stewardship Financial Statements Supplementary Information
177Annual Report 2020
12.1 Investment Income from Held to Maturity Financial Assets
For the year ended
31 December
2020 2019
Rs. ‘000 Rs. ‘000
Interest income
Quoted debentures 33,446 33,453
Treasury bonds 2,338,835 2,198,999
2,372,281 2,232,452
12.2 Investment Income from Loans and Receivables
For the year ended
31 December
2020 2019
Rs. ‘000 Rs. ‘000
Interest income
Interest income on policy loans 235,820 197,438
Reverse repurchase agreements 77,755 67,227
Fixed deposits 342,096 200,103
Interest income on loans given
to staff 42,523 41,503
Quoted debentures 1,089,936 834,419
Commercial Paper 13,503 -
Savings account interest 8,168 6,836
1,809,801 1,347,526
12.3 Investment Income from Available for Sale Financial Assets
For the year ended
31 December
2020 2019
Rs. ‘000 Rs. ‘000
Interest income
Treasury bonds 779,198 868,249
Treasury bills - 1,836
779,198 870,085
12.4 Investment Income from Fair Value Through Profit or Loss
For the year ended
31 December
2020 2019
Rs. ‘000 Rs. ‘000
Interest income
Treasury bills 471 6,243
Treasury bonds - 1,301
Quoted debentures 17,601 13,087
Reverse repurchase
agreements 7,284 10,164
Commercial Papers 1,019 -
Fixed deposits 2,806 1,292
29,181 32,087
Dividend income
Held for trading - Conventional 89,461 107,346
Held for trading - Unit linked 31,264 44,440
120,725 151,786
149,906 183,873
13 NET REALISED GAINS/ (LOSSES) Accounting Policy
Realised gains and losses recorded in the income
statement on investments include gains and losses on
sale of financial assets
Gains and losses on the sale of investments are calculated
as the difference between net sales proceeds and the
carrying value, and are recorded on occurrence of the sale
transaction.
On derecognition of an investment classified as AFS, the
cumulative gain or loss previously recognised in other
comprehensive income is recognised in the income
statement.
For the year ended
31 December
2020 2019
Rs. ‘000 Rs. ‘000
Realised gains 86,697 38,716
Realised losses (488,878) (14,403)
Total net realised gains/
(losses) (402,181) 24,313
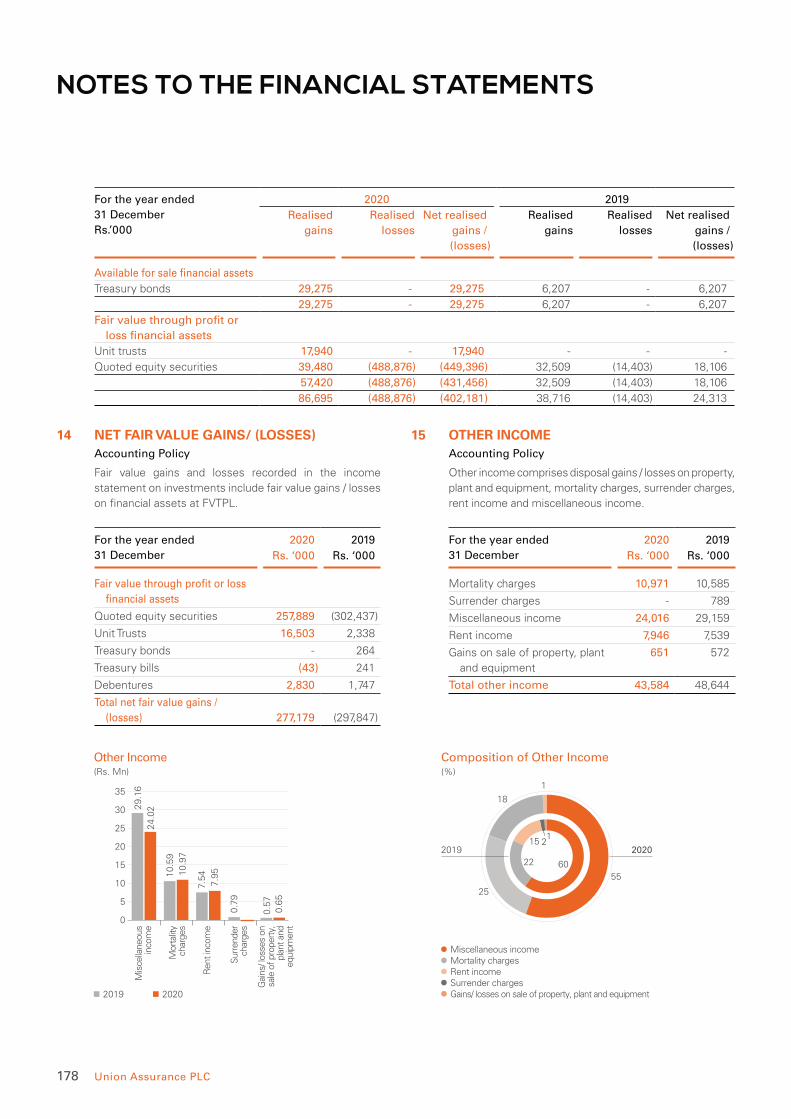
178 Union Assurance PLC
NOTES TO THE FINANCIAL STATEMENTS
For the year ended
31 December
Rs.’000
2020 2019
Realised
gains
Realised
losses
Net realised
gains /
(losses)
Realised
gains
Realised
losses
Net realised
gains /
(losses)
Available for sale financial assets
Treasury bonds 29,275 - 29,275 6,207 - 6,207
29,275 - 29,275 6,207 - 6,207
Fair value through profit or
loss financial assets
Unit trusts 17,940 - 17,940 - - -
Quoted equity securities 39,480 (488,876) (449,396) 32,509 (14,403) 18,106
57,420 (488,876) (431,456) 32,509 (14,403) 18,106
86,695 (488,876) (402,181) 38,716 (14,403) 24,313
14 NET FAIR VALUE GAINS/ (LOSSES) Accounting Policy
Fair value gains and losses recorded in the income
statement on investments include fair value gains / losses
on financial assets at FVTPL.
For the year ended
31 December
2020 2019
Rs. ‘000 Rs. ‘000
Fair value through profit or loss
financial assets
Quoted equity securities 257,889 (302,437)
Unit Trusts 16,503 2,338
Treasury bonds - 264
Treasury bills (43) 241
Debentures 2,830 1,747
Total net fair value gains /
(losses) 277,179 (297,847)
15 OTHER INCOME Accounting Policy
Other income comprises disposal gains / losses on property,
plant and equipment, mortality charges, surrender charges,
rent income and miscellaneous income.
For the year ended
31 December
2020 2019
Rs. ‘000 Rs. ‘000
Mortality charges 10,971 10,585
Surrender charges - 789
Miscellaneous income 24,016 29,159
Rent income 7,946 7,539
Gains on sale of property, plant
and equipment
651 572
Total other income 43,584 48,644
(Rs. Mn)
Other Income
0
5
10
15
20
25
30
35
2019 2020
29.1
6
24.0
2
10.5
9
10.9
7
7.5
4
7.9
5
0.7
9
0.5
70.6
5
Mis
cella
neou
sin
com
e
Mor
talit
ych
arge
s
Ren
t inc
ome
Sur
rend
erch
arge
s
Gai
ns/ l
osse
s on
sale
of p
rope
rty,
plan
t and
equi
pmen
t
(%)
55
25
18
1
2019 2020
Miscellaneous incomeMortality chargesRent incomeSurrender chargesGains/ losses on sale of property, plant and equipment
Composition of Other Income
2
60
151
22
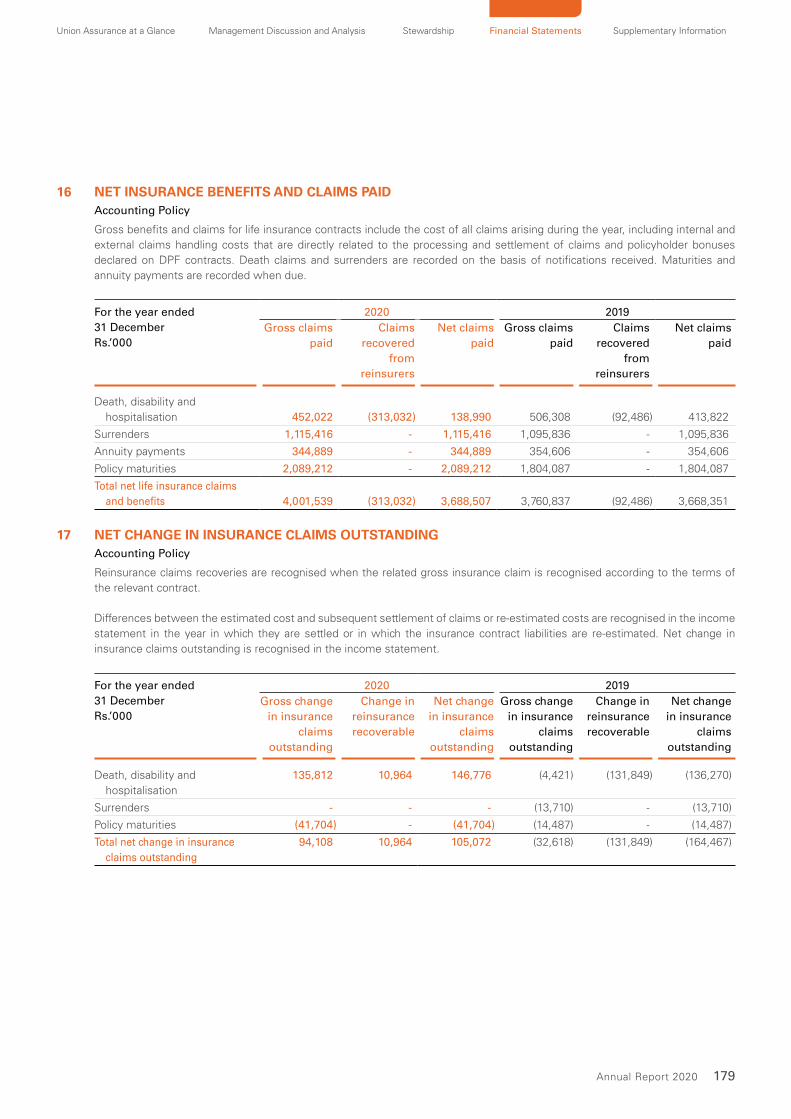
Union Assurance at a Glance Management Discussion and Analysis Stewardship Financial Statements Supplementary Information
179Annual Report 2020
16 NET INSURANCE BENEFITS AND CLAIMS PAID Accounting Policy
Gross benefits and claims for life insurance contracts include the cost of all claims arising during the year, including internal and
external claims handling costs that are directly related to the processing and settlement of claims and policyholder bonuses
declared on DPF contracts. Death claims and surrenders are recorded on the basis of notifications received. Maturities and
annuity payments are recorded when due.
For the year ended
31 December
Rs.’000
2020 2019
Gross claims
paid
Claims
recovered
from
reinsurers
Net claims
paid
Gross claims
paid
Claims
recovered
from
reinsurers
Net claims
paid
Death, disability and
hospitalisation 452,022 (313,032) 138,990 506,308 (92,486) 413,822
Surrenders 1,115,416 - 1,115,416 1,095,836 - 1,095,836
Annuity payments 344,889 - 344,889 354,606 - 354,606
Policy maturities 2,089,212 - 2,089,212 1,804,087 - 1,804,087
Total net life insurance claims
and benefits 4,001,539 (313,032) 3,688,507 3,760,837 (92,486) 3,668,351
17 NET CHANGE IN INSURANCE CLAIMS OUTSTANDING Accounting Policy
Reinsurance claims recoveries are recognised when the related gross insurance claim is recognised according to the terms of
the relevant contract.
Differences between the estimated cost and subsequent settlement of claims or re-estimated costs are recognised in the income
statement in the year in which they are settled or in which the insurance contract liabilities are re-estimated. Net change in
insurance claims outstanding is recognised in the income statement.
For the year ended
31 December
Rs.’000
2020 2019
Gross change
in insurance
claims
outstanding
Change in
reinsurance
recoverable
Net change
in insurance
claims
outstanding
Gross change
in insurance
claims
outstanding
Change in
reinsurance
recoverable
Net change
in insurance
claims
outstanding
Death, disability and
hospitalisation
135,812 10,964 146,776 (4,421) (131,849) (136,270)
Surrenders - - - (13,710) - (13,710)
Policy maturities (41,704) - (41,704) (14,487) - (14,487)
Total net change in insurance
claims outstanding
94,108 10,964 105,072 (32,618) (131,849) (164,467)

180 Union Assurance PLC
NOTES TO THE FINANCIAL STATEMENTS
(Rs. Mn)
Changes in Insurance Claims Outstanding
-200
-150
-100
-50
0
50
100
150
2019 2020
(33
)
94
(13
2)
11
(16
4)
105
Gro
ss c
hang
ein
sura
nce
clai
ms
outs
tand
ing
Cha
nge
inre
insu
ance
reco
vera
ble
Net
cha
nge
in in
sura
nce
clai
ms
outs
tand
ing
17.1 Net Insurance Benefits and Claims Expense
For the year ended
31 December
2020 2019
Note Rs. ‘000 Rs. ‘000
Net insurance benefits
and claims paid 16 3,688,507 3,668,351
Net change in insurance
claims outstanding 17 105,072 (164,467)
Total net insurance
benefits and claims
expense 3,793,579 3,503,884
18 CHANGE IN CONTRACT LIABILITIES - LIFE FUND Accounting Policy
Changes in the valuation of insurance contract liabilities are recognised in the income statement under change in contract liabilities.
For the year ended 31 December 2020 2019
Rs.’000 Note Gross Reinsurance Net Gross Reinsurance Net
Premiums written 10/ 11 13,108,605 (589,877) 12,518,728 11,647,756 (525,782) 11,121,974
Insurance benefits and claims incurred 17.1 (4,095,647) 302,068 (3,793,579) (3,728,219) 224,335 (3,503,884)
Underwriting and net acquisition costs
(including reinsurance) 19 (2,284,063) 138,933 (2,145,130) (1,939,899) 82,503 (1,857,396)
Other operating, selling and
administrative expenses attributable
to policyholders (3,517,622) - (3,517,622) (3,220,270) - (3,220,270)
Investment and other income
attributable to policyholders 4,041,160 - 4,041,160 3,442,849 - 3,442,849
Income tax reversal (71,304) - (71,304) - - -
Surplus from life insurance fund
transferred to Life shareholder’s
fund (825,000) - (825,000) (1,000,000) - (1,000,000)
Change in contract liabilities -
Life Fund 6,356,129 (148,876) 6,207,253 5,202,217 (218,944) 4,983,273
19 UNDERWRITING AND NET ACQUISITION COSTS (NET OF REINSURANCE) Accounting Policy
All acquisition costs are recognised as an expense when incurred. Reinsurance commission income on outward reinsurance
contracts is recognised when receivable.
For the year ended
31 December
2020 2019
Rs. ‘000 Rs. ‘000
Acquisition cost 2,284,063 1,939,899
Reinsurance commission (including profit commission) (138,933) (82,503)
Total underwriting and net acquisition costs 2,145,130 1,857,396

Union Assurance at a Glance Management Discussion and Analysis Stewardship Financial Statements Supplementary Information
181Annual Report 2020
20 OTHER OPERATING, ADMINISTRATIVE AND SELLING EXPENSES
Accounting Policy
Expenses are recognised in the income statement on the
basis of a direct association between the cost incurred and
the earning of specific items of income. All expenditure
incurred in the running of the business and in maintaining
the property, plant and equipment in a state of efficiency
has been charged to the income statement.
For the year ended
31 December
2020 2019
Note Rs. ‘000 Rs. ‘000
Employee benefits expenses 20.1 1,213,321 1,023,067
Administration and establishment expenses 1,070,742 1,189,075
Finance cost 21.1 56,417 114,314 Selling expenses 915,626 687,299 Total other operating,
administrative and selling expenses 3,256,106 3,013,755
20.1 Employee Benefits Expenses Refer Note 47 for the Accounting Policy.
Short term employee benefit obligations are measured on
an undiscounted basis and are expensed as the related
service is provided. A liability is recognised for the amount
expected to be paid under short - term cash bonus if the
Company has a present legal or constructive obligation to
pay this amount as a result of past service provided by the
employee, and the obligation can be estimated reliably.
For the year ended 31
December
2020 2019
Note Rs. ‘000 Rs. ‘000
Short Term Employee Benefits
Staff remuneration 981,390 781,007 Defined contribution plan
cost - EPF 47.1 74,886 68,403 Defined contribution plan
cost - ETF 47.1 18,721 17,101 Staff welfare 17,561 35,859 Training expenses 24,601 28,991 Other costs 27,765 15,890
1,144,924 947,251
Long Term Employee Benefits
Defined benefit plan cost 47.4(a) 28,994 27,493 Share based payment
expense 42.3(a) 7,762 11,984 Other long term
employee benefit cost 47.4(b) 31,641 36,33968,397 75,816
Total employee benefits expenses 1,213,321 1,023,067
21 FINANCE COSTSInterest cost is recognised using the effective interest
rate method.
The ‘effective interest rate’ is the rate that exactly
discounts estimated future cash payments or receipts
through the expected life of the financial instrument to:
• the gross carrying amount of the financial asset; or
• the amortised cost of the financial liability.
In calculating interest expense, the effective interest rate
is applied to the gross carrying amount of the asset (when
the asset is not credit-impaired) or to the amortised cost
of the liability.
21.1 Finance Cost
For the year ended
31 December
2020 2019
Rs. ‘000 Rs. ‘000
Interest expenses 33,922 84,670
Bank Charges 22,495 29,644
56,417 114,314
22 PROFIT BEFORE TAX Accounting Policy
Operating profit is the result generated from the
continuing principal revenue-producing activities of the
Company as well as other income and expenses related
to operating activities. Operating profit excludes share of
profit of equity-accounted investees and income taxes.
Profit before tax is stated after charging all expenses
including the following;
For the year ended
31 December
2020 2019
Note Rs. ‘000 Rs. ‘000
Directors fee and
emoluments 85,497 50,987
Auditors remuneration
– Statutory audit and
audit related services 7,873 8,382
– Non audit related
services 2,423 3,059
Legal fees 2,794 5,158
Depreciation of property
plant and equipment 28.1 82,899 83,113
Amortisation of
intangible assets 27.1 179,990 122,240
Depreciation of Right of
use assets 29.1 127,382 94,541
Amortisation of Lease
rentals paid in advance 4,567 12,922
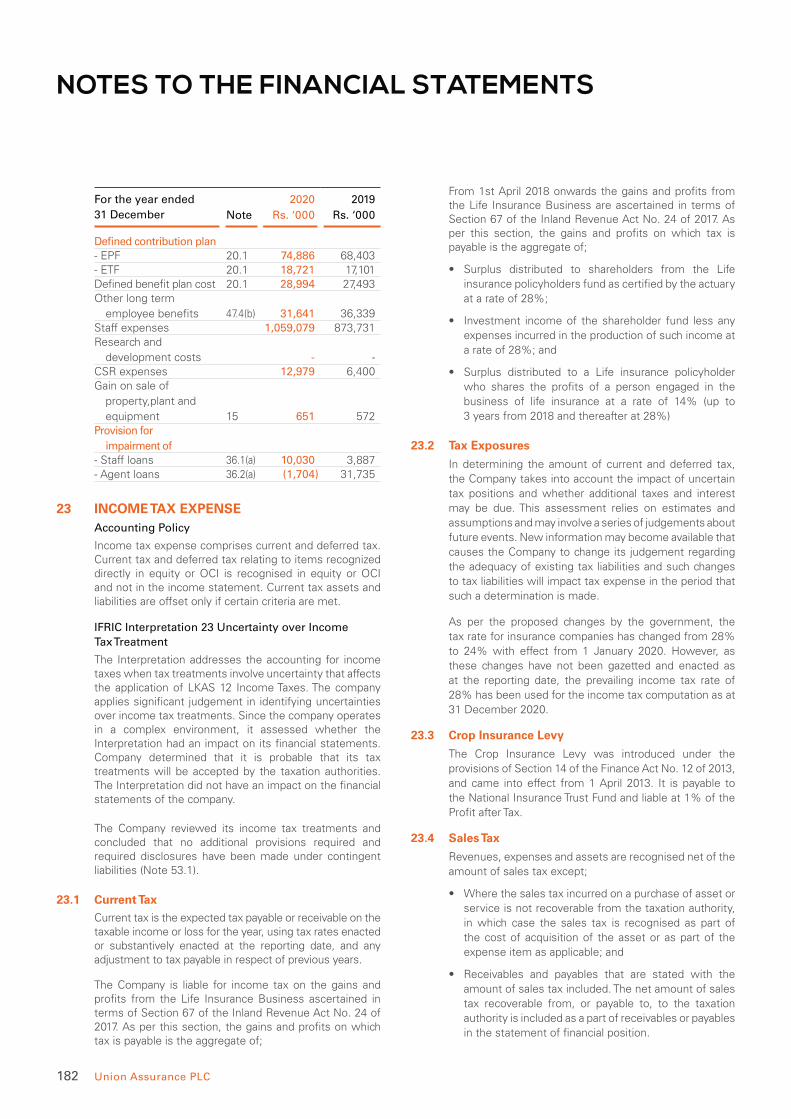
182 Union Assurance PLC
NOTES TO THE FINANCIAL STATEMENTS
For the year ended
31 December
2020 2019
Note Rs. ‘000 Rs. ‘000
Defined contribution plan- EPF 20.1 74,886 68,403 - ETF 20.1 18,721 17,101 Defined benefit plan cost 20.1 28,994 27,493 Other long term
employee benefits 47.4(b) 31,641 36,339 Staff expenses 1,059,079 873,731Research and
development costs - - CSR expenses 12,979 6,400 Gain on sale of
property,plant and
equipment 15 651 572 Provision for
impairment of- Staff loans 36.1(a) 10,030 3,887 - Agent loans 36.2(a) (1,704) 31,735
23 INCOME TAX EXPENSE Accounting Policy
Income tax expense comprises current and deferred tax. Current tax and deferred tax relating to items recognized directly in equity or OCI is recognised in equity or OCI and not in the income statement. Current tax assets and liabilities are offset only if certain criteria are met.
IFRIC Interpretation 23 Uncertainty over Income Tax Treatment
The Interpretation addresses the accounting for income taxes when tax treatments involve uncertainty that affects the application of LKAS 12 Income Taxes. The company applies significant judgement in identifying uncertainties over income tax treatments. Since the company operates in a complex environment, it assessed whether the Interpretation had an impact on its financial statements. Company determined that it is probable that its tax treatments will be accepted by the taxation authorities. The Interpretation did not have an impact on the financial statements of the company.
The Company reviewed its income tax treatments and concluded that no additional provisions required and required disclosures have been made under contingent liabilities (Note 53.1).
23.1 Current TaxCurrent tax is the expected tax payable or receivable on the taxable income or loss for the year, using tax rates enacted or substantively enacted at the reporting date, and any adjustment to tax payable in respect of previous years.
The Company is liable for income tax on the gains and profits from the Life Insurance Business ascertained in terms of Section 67 of the Inland Revenue Act No. 24 of 2017. As per this section, the gains and profits on which tax is payable is the aggregate of;
From 1st April 2018 onwards the gains and profits from the Life Insurance Business are ascertained in terms of Section 67 of the Inland Revenue Act No. 24 of 2017. As per this section, the gains and profits on which tax is payable is the aggregate of;
• Surplus distributed to shareholders from the Life insurance policyholders fund as certified by the actuary at a rate of 28%;
• Investment income of the shareholder fund less any expenses incurred in the production of such income at a rate of 28%; and
• Surplus distributed to a Life insurance policyholder who shares the profits of a person engaged in the business of life insurance at a rate of 14% (up to 3 years from 2018 and thereafter at 28%)
23.2 Tax Exposures
In determining the amount of current and deferred tax, the Company takes into account the impact of uncertain tax positions and whether additional taxes and interest may be due. This assessment relies on estimates and assumptions and may involve a series of judgements about future events. New information may become available that causes the Company to change its judgement regarding the adequacy of existing tax liabilities and such changes to tax liabilities will impact tax expense in the period that such a determination is made.
As per the proposed changes by the government, the tax rate for insurance companies has changed from 28% to 24% with effect from 1 January 2020. However, as these changes have not been gazetted and enacted as at the reporting date, the prevailing income tax rate of 28% has been used for the income tax computation as at 31 December 2020.
23.3 Crop Insurance Levy
The Crop Insurance Levy was introduced under the provisions of Section 14 of the Finance Act No. 12 of 2013, and came into effect from 1 April 2013. It is payable to the National Insurance Trust Fund and liable at 1% of the Profit after Tax.
23.4 Sales Tax
Revenues, expenses and assets are recognised net of the amount of sales tax except;
• Where the sales tax incurred on a purchase of asset or service is not recoverable from the taxation authority, in which case the sales tax is recognised as part of the cost of acquisition of the asset or as part of the expense item as applicable; and
• Receivables and payables that are stated with the amount of sales tax included. The net amount of sales tax recoverable from, or payable to, to the taxation authority is included as a part of receivables or payables in the statement of financial position.

Union Assurance at a Glance Management Discussion and Analysis Stewardship Financial Statements Supplementary Information
183Annual Report 2020
23.5 Withholding Tax on Dividends Distributed by the Company
Withholding tax that arises from the distribution of dividends by the Company is recognised at the time the
related dividend payment is recognised.
23.6 Amount Recognised in the Profit or Loss
For the year ended
31 December
2020 2019
Note Rs. ‘000 Rs. ‘000
Current tax expense
Current tax expense for
the year (73,731) -
(73,731) -
Deferred tax expense
Reversal of deferred tax
assets 30.1 (534,225) (550,432)
Origination of deferred
tax assets 5,611 -
Reversal of deferred tax
liabilities - -
Taxes Written-off
Notional tax and ESC
written-off (270,900) (200,000)
Income tax expenses
recognised in the
profit or loss (873,245) (750,432)
Income tax expenses excludes the Company’s share of
income tax expenses of equity accounted investee of Rs.
45 million (2019 - Rs. 41 million), which has been included
in share of profit of equity accounted investee, net of tax.
23.7 Notional tax income Notional Tax Credit for Withholding Tax on Treasury
Bills and Bonds.
The Inland Revenue Act No.10 of 2006 as amended
by subsequent legislation provides that a Company
which derives interest income from secondary market
transactions in government securities on or after 1 April
2002 would be entitled to a notional tax credit being
one ninth of the net interest income, provided such
interest income forms part of the statutory income of
the Company.
As per the Inland Revenue Act No. 24 of 2017, which
became effective from 1 April 2018, the notional taxes
(withholding tax) on the interest of government securities
have been withdrawn. Based on the transition provisions
issued, the Company is allowed to carry forward the
notional tax credits (the Company was entitled to, up to
31 March 2018) for a period of 3 years from 1 April 2018.
The Company had not recognised notional tax credit
in the financial statements up to 31 December 2017
(disclosures were made), due to the uncertainty of
availability of taxable profits against which such notional
tax credits could be realised. Based on the amendments
to the tax base by the IRD Act No 24 of 2017, the Company
has become liable for income tax from the year ended 31
December 2018. Accordingly, Company recognized Rs.
608 million notional tax credits as at 31 December 2018
based on internal taxable profit projection. Impairment
loss of Rs. 267 million was recognized during the year
ended 31 December 2020 (2019 - Rs. 200 million).
The unrecognised notional tax credit in financials of the
Company is as follows;
For the year ended
31 December
2020 2019
Rs. ‘000 Rs. ‘000
Unutilised Notional tax
credits as at 1 January 1,271,133 1,071,133
Notional tax credits during
the year - -
Notional tax recognized as
expense during the year
(Note 23.8) 267,573 200,000
Unutilised Notional tax
credits as at 31 December 1,538,706 1,271,133
23.8 Notional Tax Recognized as Expense During the Year
For the year ended
31 December
2020 2019
Rs. ‘000 Rs. ‘000
Participating fund (71,304) -
Non participating fund - -
Shareholder fund (196,269) (200,000)
(267,573) (200,000)
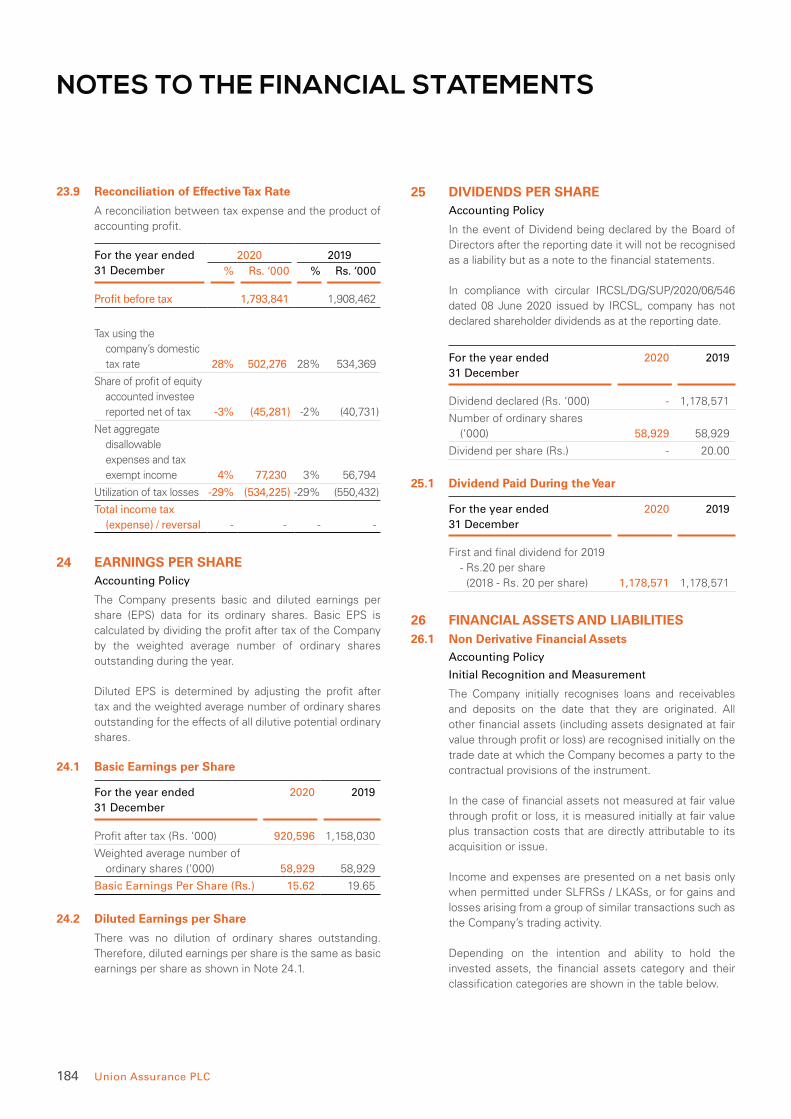
184 Union Assurance PLC
NOTES TO THE FINANCIAL STATEMENTS
23.9 Reconciliation of Effective Tax Rate
A reconciliation between tax expense and the product of
accounting profit.
For the year ended
31 December
2020 2019
% Rs. ‘000 % Rs. ‘000
Profit before tax 1,793,841 1,908,462
Tax using the
company’s domestic
tax rate 28% 502,276 28% 534,369
Share of profit of equity
accounted investee
reported net of tax -3% (45,281) -2% (40,731)
Net aggregate
disallowable
expenses and tax
exempt income 4% 77,230 3% 56,794
Utilization of tax losses -29% (534,225) -29% (550,432)
Total income tax
(expense) / reversal - - - -
24 EARNINGS PER SHARE Accounting Policy
The Company presents basic and diluted earnings per
share (EPS) data for its ordinary shares. Basic EPS is
calculated by dividing the profit after tax of the Company
by the weighted average number of ordinary shares
outstanding during the year.
Diluted EPS is determined by adjusting the profit after
tax and the weighted average number of ordinary shares
outstanding for the effects of all dilutive potential ordinary
shares.
24.1 Basic Earnings per Share
For the year ended
31 December
2020 2019
Profit after tax (Rs. ‘000) 920,596 1,158,030
Weighted average number of
ordinary shares (‘000) 58,929 58,929
Basic Earnings Per Share (Rs.) 15.62 19.65
24.2 Diluted Earnings per Share
There was no dilution of ordinary shares outstanding.
Therefore, diluted earnings per share is the same as basic
earnings per share as shown in Note 24.1.
25 DIVIDENDS PER SHARE Accounting Policy
In the event of Dividend being declared by the Board of
Directors after the reporting date it will not be recognised
as a liability but as a note to the financial statements.
In compliance with circular IRCSL/DG/SUP/2020/06/546
dated 08 June 2020 issued by IRCSL, company has not
declared shareholder dividends as at the reporting date.
For the year ended
31 December
2020 2019
Dividend declared (Rs. ‘000) - 1,178,571
Number of ordinary shares
(‘000) 58,929 58,929
Dividend per share (Rs.) - 20.00
25.1 Dividend Paid During the Year
For the year ended
31 December
2020 2019
First and final dividend for 2019
- Rs.20 per share
(2018 - Rs. 20 per share) 1,178,571 1,178,571
26 FINANCIAL ASSETS AND LIABILITIES26.1 Non Derivative Financial Assets Accounting Policy
Initial Recognition and Measurement
The Company initially recognises loans and receivables
and deposits on the date that they are originated. All
other financial assets (including assets designated at fair
value through profit or loss) are recognised initially on the
trade date at which the Company becomes a party to the
contractual provisions of the instrument.
In the case of financial assets not measured at fair value
through profit or loss, it is measured initially at fair value
plus transaction costs that are directly attributable to its
acquisition or issue.
Income and expenses are presented on a net basis only
when permitted under SLFRSs / LKASs, or for gains and
losses arising from a group of similar transactions such as
the Company’s trading activity.
Depending on the intention and ability to hold the
invested assets, the financial assets category and their
classification categories are shown in the table below.

Union Assurance at a Glance Management Discussion and Analysis Stewardship Financial Statements Supplementary Information
185Annual Report 2020
Classification Classification criteria
Held-To-Maturity (HTM)
Financial assets with fixed or determinable payments and fixed maturities are classified as held to maturity when the Company has the positive intention and ability to hold it to maturity.
Loans and Receivables (L&R)
Loans and receivables are financial assets with fixed or determinable payments that are not quoted in an active market.
Fair Value Through Profit or Loss (FVTPL)
Financial assets held for trading and those designated upon initial recognition at FVTPL and investments typically bought with the intention to sell in the near future.
For investments designated at FVTPL, the following criteria must be met;
The designation eliminates or significantly reduces the inconsistent treatment that would otherwise arise from measuring the assets or liabilities or recognising gains or losses on a different basis, Or
The assets and liabilities are part of a Company’s financial assets, financial liabilities or both, which are managed and their performance evaluated on a fair value basis, in accordance with the Company’s investment strategy.
Available for Sale (AFS)
Financial assets that are designated as AFS and that are not classified in any of the previous categories.
AFS financial investments include equity and debt securities. Equity investments classified as AFS are those that are neither classified as held for trading nor designated at FVTPL. Debt securities in this category are those that are intended to be held for an indefinite period of time and which maybe sold in response to the need for liquidity or in response to changes in the market conditions.
Subsequent Measurement
Held-to Maturity Financial Assets (HTM)
Subsequent to initial recognition held to maturity financial
assets are measured at amortised cost using the effective
interest method, less any impairment losses.
Amortised cost is calculated by taking into account any
discount or premium on acquisition and fees or costs that
are an integral part of the effective interest rate (EIR). The
EIR amortisation is included in net investment income in
the income statement.
Loans and Receivables (L&R)
Subsequent to initial recognition, loans and receivables
are measured at amortised cost using the effective
interest method, less any impairment losses.
Fair Value Through Profit or Loss (FVTPL)
Financial assets at fair value through profit or loss are
carried in the statement of financial position at fair value
with changes in fair value recognised in the income
statement.
Available for Sale Financial Assets (AFS)
Subsequent to initial recognition, they are measured at fair
value and changes therein, other than impairment losses
on available for sale equity instruments, are recognised in
the statement of profit or loss and other comprehensive
income and presented within equity in the available for
sale reserve.
Company’s non derivative financial assets and their
classifications are summarised as follows;
Financial Asset Category
HTM AFS L & R FVTPL
Treasury bonds - - Treasury bills - - - * Reverse repurchase agreements - - * Quoted shares - - - * Unit Trusts - - - Corporate debts - * Term deposits - - * Commercial Papers - - * Policy loans - - - Staff and advisor loans - - - Reinsurance receivables - - - Premiums receivable - - - Other receivables - - - Cash in hand and at bank - - -
* Financial assets are designated as FVTPL relating to Unit Linked fund

186 Union Assurance PLC
NOTES TO THE FINANCIAL STATEMENTS
Impairment of Financial Assets
The Company assesses at each reporting date whether
there is any objective evidence that a financial asset or
a group of financial assets is impaired. A financial asset
or a group of finance assets is deemed to be impaired if,
and only if, there is objective evidence of impairment as
a result of one or more events that has occurred after the
initial recognition of the asset and the loss event has an
impact on the estimated future cash flows of the financial
asset or the group of financial assets that can be reliably
estimated.
Objective evidence that financial assets (including equity
securities) are impaired may include;
• Significant financial difficulty of the borrower or user,
• Default or delinquency by debtor,
• It becoming probable that the issuer or debtor will
enter bankruptcy or other financial reorganization,
• Adverse change in the payment status of issuers or
debtors in the Company, or
• In the case of equity a significant or prolonged decline
in its fair value below its cost.
Impairment Losses on Financial Assets Carried at Amortised Cost
The Company considers evidence of impairment for
financial assets measured at amortised cost (L&R
and HTM financial assets) at both a specific asset and
collective level. All individually significant assets are
assessed for specific impairment. Those found not to be
specifically impaired are then collectively assessed or any
impairment that has been incurred but not yet identified.
Assets that are not individually significant are collectively
assessed for impairment by grouping together assets
with similar risk characteristics.
An impairment loss in respect of a financial asset
measured at amortised cost is calculated as the difference
between its carrying amount and the present value of the
estimated future cash flows discounted at the asset’s
original effective interest rate. Losses are recognised
in income statement under other cost and reflected in
an allowance account against L&R or HTM investment
securities. Interest on the impaired asset continues to be
recognised. When an event occurring after the impairment
was recognised causes the amount of impairment loss
to decrease, the decrease in impairment loss is reversed
through the income statement.
Impairment Losses on AFS Financial Assets
Impairment losses on AFS financial assets are recognised
by reclassifying the losses accumulated in the fair value
reserve in equity to the income statement. The cumulative
loss that is reclassified from equity to profit or loss is
the difference between the acquisition cost, net of any
principal repayment and amortisation, and the current fair
value, less any impairment loss recognised previously in
profit or loss. Changes in cumulative impairment losses
attributable to application of the effective interest method
are reflected as a component of interest income. In the
case of equity investments impairment, the cumulative
loss is measured as the difference between the acquisition
cost and the current fair value, less any impairment loss
on that investment previously recognised in the income
statement.
If, in a subsequent period, the fair value of an impaired AFS
debt security increases and the increase can be related
objectively to an event occurring after the impairment loss
was recognised, then the impairment loss is reversed,
with the amount of the reversal recognised in profit or
loss. However, impairment losses on equity investments
are not reversed through the income statement and
increases in their fair value after impairment is recognised
directly in the statement of profit or loss and other
comprehensive income.
Derecognition
The Company derecognises a financial asset when;
The rights to receive cash flows from the asset have
expired, or
The rights to receive cash flows from the asset have
expired, or the Company has transferred its rights to
receive cash flows from the asset or has assumed an
obligation to pay the received cash flows in full without
material delay to a third party under a ‘pass through’
arrangement and either;
(a) the Company has transferred substantially all the risks
and rewards of the asset, or
(b) the Company has neither transferred nor retained
substantially all the risks and rewards of the asset, but
has transferred control of the asset.
On derecognition of a financial asset, the difference
between the carrying amount of the asset (or the carrying
amount allocated to the portion of the asset transferred),
and the sum of;
(a) the consideration received (including any new asset
obtained less any new liability assumed) and
(b) In case of AFS financial investments, any cumulative
gain or loss that had been recognised in the statement
of profit or loss and other comprehensive income is
recognised in the income statement.

Union Assurance at a Glance Management Discussion and Analysis Stewardship Financial Statements Supplementary Information
187Annual Report 2020
26.2 Non Derivative Financial Liabilities Accounting Policy
Initial Recognition and Measurement
The Company initially recognises debt securities issued
and subordinated liabilities on the date that they are
originated. All other liabilities are recognised initially on
the trade date at which the Company becomes a party to
the contractual provisions of the instrument.
The Company classifies non derivative financial liabilities
into other financial liabilities category. Such financial
liabilities are recognised initially at fair value less any
directly attributable transaction costs. Subsequent to
initial recognition, these financial liabilities are measured
at amortised cost using the effective interest method.
Other financial liabilities comprise, reinsurance payables,
other liabilities and bank overdraft.
Derecognition
The Company derecognises a financial liability when
its contractual obligations are discharged, cancelled or
expired.
26.3 Offsetting of Financial Instruments
Financial assets and financial liabilities are offset and the
net amount reported in the statement of financial position
if, and only if, there is a currently enforceable legal right to
offset the recognised amounts and there is an intention
to settle on a net basis, or to realise the assets and settle
the liabilities simultaneously. Income and expenses are
presented on a net basis only when it is required or
permitted by a standard.
26.4 Amortised Cost Measurement
The amortised cost of a financial asset or liability is the
amount at which the financial asset or liability is measured
at initial recognition, minus principal repayments, plus or
minus the cumulative amortisation using the effective
interest method of any difference between the initial
amount recognised and the maturity amount, minus any
reduction for impairment.
26.5 Reclassification of Financial Assets and Liabilities
The Company reclassifies non derivative financial assets
out of the held for trading category and into the AFS,
L&R, or HTM categories as permitted by the Sri Lanka
Accounting Standard LKAS 39 - Financial Instruments:
Recognition and Measurement. Further, in certain
circumstances, the Company is permitted to reclassify
financial instruments out of the AFS category and into
the L&R category. Reclassifications are recorded at fair
value at the date of reclassification, which becomes the
new amortised cost. Reclassification to held to maturity
is permitted only when the entity has the ability and
intention to hold the financial asset until maturity.
For a financial asset with a fixed maturity reclassified out
of the AFS category, any previous gain or loss on that asset
that has been recognised in equity is amortised to profit
or loss over the remaining life of the asset using the EIR.
Any difference between the new amortised cost and the
expected cash flows is also amortised over the remaining
life of the asset using the EIR. If the asset is subsequently
determined to be impaired,then the amount recorded in
equity is reclassified to the income statement.
The Company may reclassify a non derivative trading
asset out of the held for trading category and into the L&R
category, if it meets the definition of loans and receivables
and the Company has the intention and ability to hold the
financial asset for the foreseeable future or until maturity.
If a financial asset is reclassified and if the Company
subsequently increases its estimates of future cash
receipts as a result of increased recoverability of those
cash receipts, the effect of that increase is recognised as
an adjustment to the EIR from the date of the change in
estimate.
Reclassification is at the election of the management and
is determined on an instrument by instrument basis.
The Company does not reclassify any financial instrument
into the FVTPL category after initial recognition. Further,
the Company does not reclassify any financial instrument
out of the FVTPL category if upon initial recognition it was
designated as fair value through profit or loss.
26.6 Derivatives Held for Risk Management Purposes
Derivatives held for risk management purposes include
all derivative assets and liabilities that are not classified
as trading assets or liabilities. Derivatives held for risk
management purposes are measured at fair value in the
statement of financial position.
Other Non Trading Derivatives
If a derivative is not held for trading, and is not designated
in a qualifying hedge relationship, then all changes in
its fair value are recognised immediately in profit or
loss as a component of net income from other financial
instruments at FVTPL.
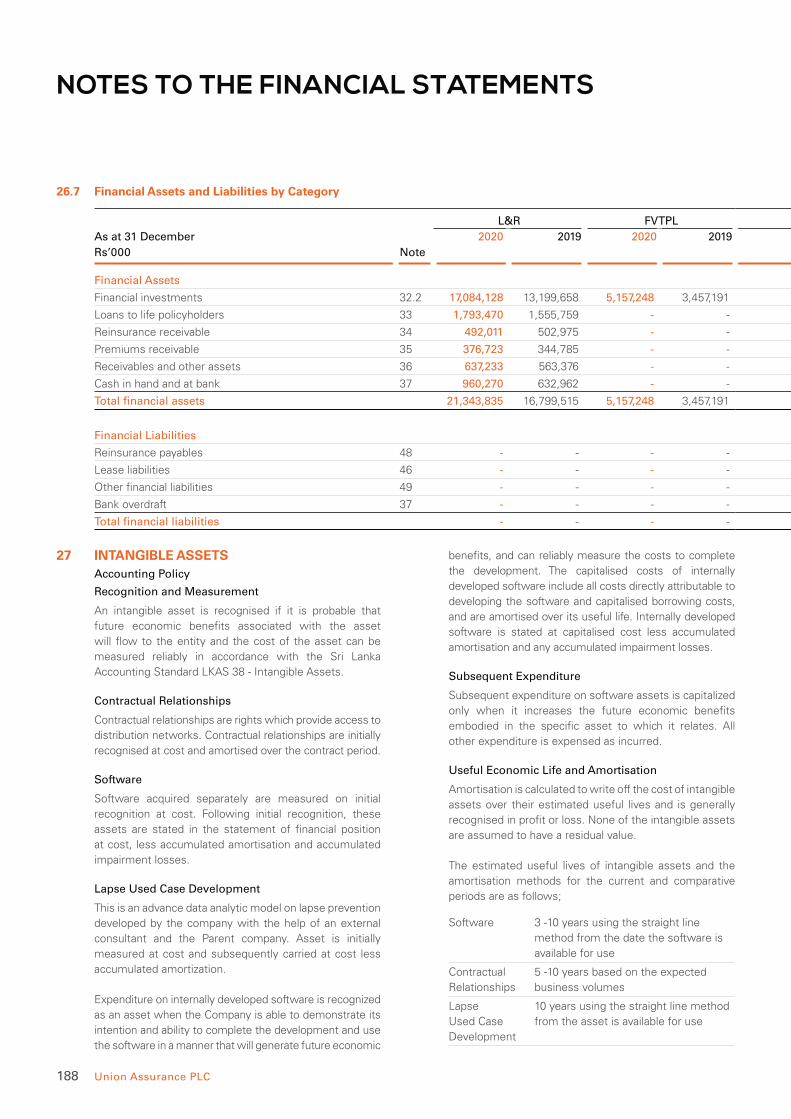
188 Union Assurance PLC
NOTES TO THE FINANCIAL STATEMENTS
26.7 Financial Assets and Liabilities by Category
L&R FVTPL
As at 31 December 2020 2019 2020 2019
Rs’000 Note
Financial Assets
Financial investments 32.2 17,084,128 13,199,658 5,157,248 3,457,191
Loans to life policyholders 33 1,793,470 1,555,759 - -
Reinsurance receivable 34 492,011 502,975 - -
Premiums receivable 35 376,723 344,785 - -
Receivables and other assets 36 637,233 563,376 - -
Cash in hand and at bank 37 960,270 632,962 - -
Total financial assets 21,343,835 16,799,515 5,157,248 3,457,191
Financial Liabilities
Reinsurance payables 48 - - - -
Lease liabilities 46 - - - -
Other financial liabilities 49 - - - -
Bank overdraft 37 - - - -
Total financial liabilities - - - -
27 INTANGIBLE ASSETS Accounting Policy
Recognition and Measurement
An intangible asset is recognised if it is probable that
future economic benefits associated with the asset
will flow to the entity and the cost of the asset can be
measured reliably in accordance with the Sri Lanka
Accounting Standard LKAS 38 - Intangible Assets.
Contractual Relationships
Contractual relationships are rights which provide access to
distribution networks. Contractual relationships are initially
recognised at cost and amortised over the contract period.
Software
Software acquired separately are measured on initial
recognition at cost. Following initial recognition, these
assets are stated in the statement of financial position
at cost, less accumulated amortisation and accumulated
impairment losses.
Lapse Used Case Development
This is an advance data analytic model on lapse prevention
developed by the company with the help of an external
consultant and the Parent company. Asset is initially
measured at cost and subsequently carried at cost less
accumulated amortization.
Expenditure on internally developed software is recognized
as an asset when the Company is able to demonstrate its
intention and ability to complete the development and use
the software in a manner that will generate future economic
benefits, and can reliably measure the costs to complete
the development. The capitalised costs of internally
developed software include all costs directly attributable to
developing the software and capitalised borrowing costs,
and are amortised over its useful life. Internally developed
software is stated at capitalised cost less accumulated
amortisation and any accumulated impairment losses.
Subsequent Expenditure
Subsequent expenditure on software assets is capitalized
only when it increases the future economic benefits
embodied in the specific asset to which it relates. All
other expenditure is expensed as incurred.
Useful Economic Life and Amortisation
Amortisation is calculated to write off the cost of intangible
assets over their estimated useful lives and is generally
recognised in profit or loss. None of the intangible assets
are assumed to have a residual value.
The estimated useful lives of intangible assets and the
amortisation methods for the current and comparative
periods are as follows;
Software 3 -10 years using the straight line
method from the date the software is
available for use
Contractual
Relationships
5 -10 years based on the expected
business volumes
Lapse
Used Case
Development
10 years using the straight line method
from the asset is available for use

Union Assurance at a Glance Management Discussion and Analysis Stewardship Financial Statements Supplementary Information
189Annual Report 2020
AFS HTM Other financial liabilities Total
2020 2019 2020 2019 2020 2019 2020 2019
7,954,413 7,848,043 22,160,419 20,376,303 - - 52,356,208 44,881,195
- - - - - - 1,793,470 1,555,759
- - - - - - 492,011 502,975
- - - - - - 376,723 344,785
- - - - - - 637,233 563,376
- - - - - - 960,270 632,962
7,954,413 7,848,043 22,160,419 20,376,303 - - 56,615,915 48,481,052
- - - - 533,023 812,930 533,023 812,930
- - - - 232,259 289,176 232,259 289,176
- - - - 1,518,742 1,121,143 1,518,742 1,121,143
- - - - 160,805 168,428 160,805 168,428
- - - - 2,444,829 2,391,677 2,444,829 2,391,677
Amortisation methods, useful lives and residual values are reviewed at each reporting date and adjusted if appropriate.
Changes in the expected useful life or the expected pattern of future economic benefits embodied in the assets is accounted for
by changing the amortisation period or method as appropriate and are treated as changes in accounting estimates.
De-Recognition
An Intangible Asset is de - recognised on disposal or when no future economic benefits are expected from it. The gain or loss
arising from de - recognition of such Intangible Assets is included in income statement.
27.1 Reconciliation of Carrying Amounts of Intangible Assets
As at 31 December Software Contractual
Relationships
Lapse
Used Case
Development
2020
Total
2019
Total
Rs.’000 Licensed Purchased
Cost
Balance as at 1 January 39,063 897,720 791,238 - 1,728,021 1,691,050
Acquisitions during the year -
separately acquired - 25,287 - 94,838 120,125 36,971
Balance as at 31 December 39,063 923,007 791,238 94,838 1,848,146 1,728,021
Accumulated amortisation
and impairment losses
Balance as at 1 January 39,011 316,334 65,754 - 421,099 298,859
Amortisation 47 87,815 82,644 9,484 179,990 122,240
Balance as at 31 December 39,058 404,149 148,398 9,484 601,089 421,099
Carrying value
As at 31 December 2020 5 518,858 642,840 85,354 1,247,057
As at 31 December 2019 52 581,386 725,484 - 1,306,922

190 Union Assurance PLC
NOTES TO THE FINANCIAL STATEMENTS
27.2 Assessment of Impairment of Intangible Assets
Contractual relationships are valued at the present value
of the contractual inflows, by recognizing the relevant
asset and the liability. There are two such contractual
relationship agreements with two financial institutions.
With the prevailing COVID-19 situation, actual performance
was compared with contractual arrangement and the
management has assessed that no impairment is required
for the said asset as of the reporting date.
The Board of Directors has assessed the potential
impairment loss of other intangible assets as at
31 December 2020. Based on the assessment, no
impairment provision is required to be made in the
financial statements as at the reporting date.
27.3 Title Restriction on Intangible Assets
There are no restrictions that existed on the title of the
intangible assets of the Company as at the reporting date.
27.4 Intangible Assets pledged as Security
None of the Intangible assets have been pledged as
security as at the reporting date.
27.5 Acquisition of Intangible Assets During the Year
During the financial year, the Company acquired intangible
assets to the aggregate value of Rs. 120 million (2019 - Rs.
37 million). Cash payments amounting to Rs. 120 million
(2019 - Rs. 37 million) were made for purchase software
during the year.
27.6 Amount of Contractual Commitments for the Acquisition of Intangible Assets
There are no contractual commitments for the acquisition
of Intangible Assets as at the reporting date.
27.7 Fully Amortised Intangible Assets in Use
Intangible assets include fully amortised computer
software which are in use in the normal business activities
to the gross carrying value of Rs. 211 million (2019 -
Rs. 191 million).
28 PROPERTY, PLANT AND EQUIPMENT Accounting Policy
Recognition and Measurement
The Company applies the requirements of the Sri Lanka
Accounting Standard LKAS 16 - Property, Plant and
Equipment, in accounting for its owned assets which
are held and used in the provision of services or for
administrative purposes and are expected to be used for
more than one year.
Basis of Recognition
Property, plant and equipment are recognised if it is
probable that future economic benefits associated with
the asset will flow to the Company and cost of the asset
can be reliably measured.
Basis of Measurement
An item of property, plant and equipment that qualifies
for recognition as an asset is initially measured at its
cost. Except for land and buildings, the Company applies
the cost model for all property, plant and equipment and
records at cost of purchase together with any incidental
expenses thereon, less accumulated depreciation and
any accumulated impairment losses. Cost includes
expenditure that is directly attributable to the acquisition
of the asset. The cost of self constructed assets includes
the following;
• The cost of materials and direct labour;
• Any other costs directly attributable to bringing the
assets to a working condition for their intended use
• When the Company has an obligation to remove the
asset or restore the site, an estimate of the costs of
dismantling and removing the items and restoring the
site on which they are located, and
• Capitalised borrowing costs.
Purchased software that is integral to the functionality
of the related equipment is capitalised as part of that
equipment. When parts of an item of property, plant and
equipment have different useful lives, they are accounted
for as separate items (major components) of property,
plant and equipment.
Any gain or loss on disposal of an item of property, plant
and equipment (calculated as the difference between the
net proceeds from disposal and the carrying amount of
the item) is recognised in ‘other income’ in the income
statement.
Subsequent Costs
Subsequent expenditure is capitalised only if it is probable
that the future economic benefits associated with the
expenditure will flow to the Company.
Repairs and Maintenance
Repairs and maintenance are charged to the income
statement during the financial period in which they are
incurred. The cost of major renovations is included in the
carrying amount of the assets when it is probable that future
economic benefits in excess of the most recently assessed
standard of performance of the existing assets will flow to
the Company and the renovation replaces an identifiable
part of the asset. Major renovations are depreciated during
the remaining useful life of the related asset.

Union Assurance at a Glance Management Discussion and Analysis Stewardship Financial Statements Supplementary Information
191Annual Report 2020
Revaluations
Freehold land and buildings are measured at fair value less
accumulated depreciation on buildings and impairment
losses are recognised after the date of the revaluation.
Valuations are performed every two years to ensure that
the fair value of a revalued asset does not differ materially
from its carrying amount.
Any revaluation surplus is recognised in the statement
of profit or loss and other comprehensive income and
accumulated in equity in the revaluation reserve, except
to the extent that it reverses a revaluation decrease of
the same asset previously recognised in the Income
Statement, in which case the increase is recognised in
the Income Statement. A revaluation deficit is recognised
in the Income Statement, except to the extent that it
offsets an existing surplus on the same asset recognised
in the revaluation reserve.
An annual transfer from the revaluation reserve to
retained earnings is made for the difference between
depreciation based on the revalued carrying amount of
the assets and depreciation based on the assets’ original
cost. Additionally, accumulated depreciation as at the
revaluation date is eliminated against the gross carrying
amount of the asset and the net amount is restated to
the revalued amount of the asset. Upon disposal, any
revaluation reserve relating to the particular asset being
sold is transferred to retained earnings.
Useful Economic Life and Depreciation
Depreciation is recognised in the Income Statement on
a straight line basis over the estimated useful lives of
each part of an item of property, plant and equipment
since this most closely reflects the expected pattern of
consumption of the future economic benefits embodied
in the asset. Land is not depreciated.
The estimated useful lives for the current and comparative
periods are as follows:
Asset Class Basis
Freehold buildings 50 years
Office furniture 5 years
Furniture and fittings 5 years
Computer equipment 2-5 years
Motor vehicles 5 years
Depreciation methods, useful lives and residual values
are reassessed at each reporting date and adjusted if
appropriate.
The depreciation rates are determined separately for
each significant part of an item of property, plant and
equipment and depreciation commences when it is
available for use, i.e. when it is in the location and in the
condition necessary for it to be capable of operating in
the manner intended by the management. Depreciation
of an asset ceases at the earlier of the date that the asset
is classified as held for sale or the date that the asset is
derecognised.
Carrying Amount
The carrying amount of an asset or significant group of
assets within the class is assessed annually, if there are
impairment indicators with its fair value and where the
fair value is less than the carrying amount, the asset is
written down to its fair value. The consequent adjustment
is recognised in the income statement.
The residual values of assets that are significant are
reassessed annually.
Depreciation on revalued classes of assets is based on
the remaining useful life of the assets at the time of the
revaluation.
De - Recognition
An item of property, plant and equipment is de - recognized
upon disposal or when no future economic benefits are
expected from its use. Any gain or loss arising on de -
recognition of the asset (calculated as the difference
between the net disposal proceeds and the carrying
amount of the asset) is included in the income statement
in the year the asset is de - recognised.
Capital Work in Progress
Capital work in progress is stated at cost. These are
expenses of a capital nature directly incurred in property,
plant and equipment, awaiting for capitalisation.
Borrowing Cost
Borrowing Cost that are directly attributable to the
acquisition, construction or production of a qualifying
asset is capitalised as part of the cost of the asset as per
the Sri Lanka Accounting Standard – LKAS 23 Borrowing
Costs. A qualifying asset is an asset which takes a
substantial period of time to get ready for its intended
use or sale. Capitalisation ceases when substantially all
the activities necessary to prepare the qualifying asset for
its intended use are completed. Other borrowing costs
are recognized in the Profit or Loss in the period in which
they occur.
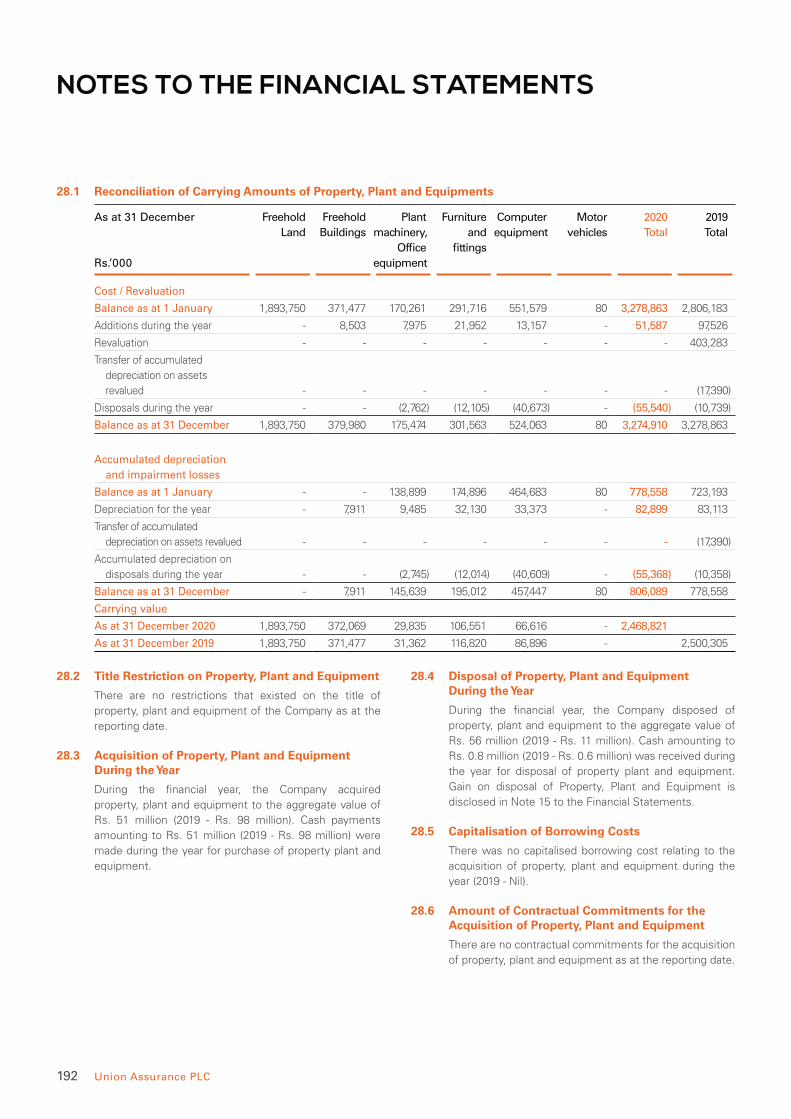
192 Union Assurance PLC
NOTES TO THE FINANCIAL STATEMENTS
28.1 Reconciliation of Carrying Amounts of Property, Plant and Equipments
As at 31 December
Rs.’000
Freehold
Land
Freehold
Buildings
Plant
machinery,
Office
equipment
Furniture
and
fittings
Computer
equipment
Motor
vehicles
2020
Total
2019
Total
Cost / Revaluation
Balance as at 1 January 1,893,750 371,477 170,261 291,716 551,579 80 3,278,863 2,806,183
Additions during the year - 8,503 7,975 21,952 13,157 - 51,587 97,526
Revaluation - - - - - - - 403,283
Transfer of accumulated
depreciation on assets
revalued - - - - - - - (17,390)
Disposals during the year - - (2,762) (12,105) (40,673) - (55,540) (10,739)
Balance as at 31 December 1,893,750 379,980 175,474 301,563 524,063 80 3,274,910 3,278,863
Accumulated depreciation
and impairment losses
Balance as at 1 January - - 138,899 174,896 464,683 80 778,558 723,193
Depreciation for the year - 7,911 9,485 32,130 33,373 - 82,899 83,113
Transfer of accumulated
depreciation on assets revalued - - - - - - - (17,390)
Accumulated depreciation on
disposals during the year - - (2,745) (12,014) (40,609) - (55,368) (10,358)
Balance as at 31 December - 7,911 145,639 195,012 457,447 80 806,089 778,558
Carrying value
As at 31 December 2020 1,893,750 372,069 29,835 106,551 66,616 - 2,468,821
As at 31 December 2019 1,893,750 371,477 31,362 116,820 86,896 - 2,500,305
28.2 Title Restriction on Property, Plant and Equipment
There are no restrictions that existed on the title of
property, plant and equipment of the Company as at the
reporting date.
28.3 Acquisition of Property, Plant and Equipment During the Year
During the financial year, the Company acquired
property, plant and equipment to the aggregate value of
Rs. 51 million (2019 - Rs. 98 million). Cash payments
amounting to Rs. 51 million (2019 - Rs. 98 million) were
made during the year for purchase of property plant and
equipment.
28.4 Disposal of Property, Plant and Equipment During the Year
During the financial year, the Company disposed of
property, plant and equipment to the aggregate value of
Rs. 56 million (2019 - Rs. 11 million). Cash amounting to
Rs. 0.8 million (2019 - Rs. 0.6 million) was received during
the year for disposal of property plant and equipment.
Gain on disposal of Property, Plant and Equipment is
disclosed in Note 15 to the Financial Statements.
28.5 Capitalisation of Borrowing Costs
There was no capitalised borrowing cost relating to the
acquisition of property, plant and equipment during the
year (2019 - Nil).
28.6 Amount of Contractual Commitments for the Acquisition of Property, Plant and Equipment
There are no contractual commitments for the acquisition
of property, plant and equipment as at the reporting date.
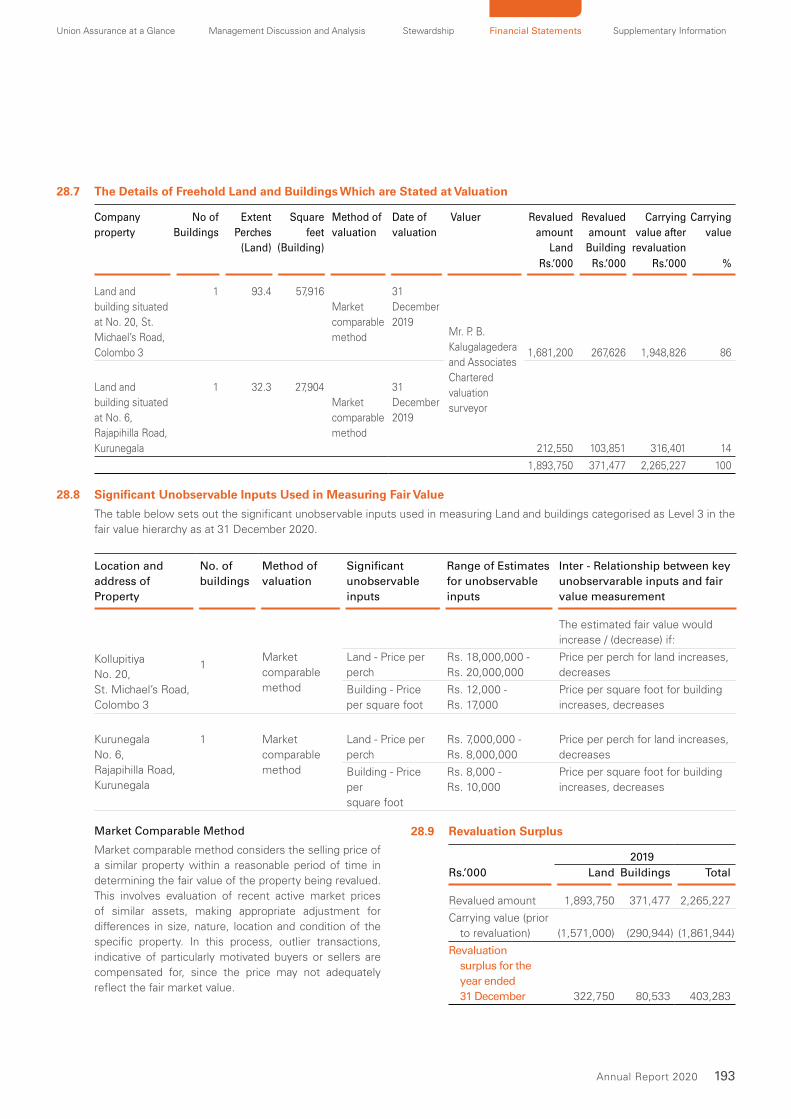
Union Assurance at a Glance Management Discussion and Analysis Stewardship Financial Statements Supplementary Information
193Annual Report 2020
28.7 The Details of Freehold Land and Buildings Which are Stated at Valuation
Company
property
No of
Buildings
Extent
Perches
(Land)
Square
feet
(Building)
Method of
valuation
Date of
valuation
Valuer Revalued
amount
Land
Revalued
amount
Building
Carrying
value after
revaluation
Carrying
value
Rs.’000 Rs.’000 Rs.’000 %
Land and
building situated
at No. 20, St.
Michael’s Road,
Colombo 3
1 93.4 57,916
Market
comparable
method
31
December
2019Mr. P. B.
Kalugalagedera
and Associates
Chartered
valuation
surveyor
1,681,200 267,626 1,948,826 86
Land and
building situated
at No. 6,
Rajapihilla Road,
Kurunegala
1 32.3 27,904
Market
comparable
method
31
December
2019
212,550 103,851 316,401 14
1,893,750 371,477 2,265,227 100
28.8 Significant Unobservable Inputs Used in Measuring Fair Value
The table below sets out the significant unobservable inputs used in measuring Land and buildings categorised as Level 3 in the
fair value hierarchy as at 31 December 2020.
Location and
address of
Property
No. of
buildings
Method of
valuation
Significant
unobservable
inputs
Range of Estimates
for unobservable
inputs
Inter - Relationship between key
unobservarable inputs and fair
value measurement
Kollupitiya
No. 20,
St. Michael’s Road,
Colombo 3
1
Market
comparable
method
The estimated fair value would
increase / (decrease) if:
Land - Price per
perch
Rs. 18,000,000 -
Rs. 20,000,000
Price per perch for land increases,
decreases
Building - Price
per square foot
Rs. 12,000 -
Rs. 17,000
Price per square foot for building
increases, decreases
Kurunegala
No. 6,
Rajapihilla Road,
Kurunegala
1 Market
comparable
method
Land - Price per
perch
Rs. 7,000,000 -
Rs. 8,000,000
Price per perch for land increases,
decreases
Building - Price
per
square foot
Rs. 8,000 -
Rs. 10,000
Price per square foot for building
increases, decreases
Market Comparable Method
Market comparable method considers the selling price of
a similar property within a reasonable period of time in
determining the fair value of the property being revalued.
This involves evaluation of recent active market prices
of similar assets, making appropriate adjustment for
differences in size, nature, location and condition of the
specific property. In this process, outlier transactions,
indicative of particularly motivated buyers or sellers are
compensated for, since the price may not adequately
reflect the fair market value.
28.9 Revaluation Surplus
2019
Rs.’000 Land Buildings Total
Revalued amount 1,893,750 371,477 2,265,227
Carrying value (prior
to revaluation) (1,571,000) (290,944) (1,861,944)
Revaluation
surplus for the
year ended
31 December 322,750 80,533 403,283

194 Union Assurance PLC
NOTES TO THE FINANCIAL STATEMENTS
28.10 If Land and Buildings were stated at Historical Cost, the Amounts would have been as follows;
As at 31 December 2020 2019
Rs. ‘000 Rs. ‘000
Cost 251,124 251,124
Accumulated depreciation (93,645) (89,631)
Carrying value 157,479 161,493
28.11 The Effect of Revaluation of Freehold Buildings on the Statement of Income during the year was as follows;
As at 31 December 2020 2019
Rs. ‘000 Rs. ‘000
Depreciation charge per annum
after revaluation 7,730 8,629
Depreciation charge per annum
prior to revaluation (4,014) (4,014)
Decrease in profit in
subsequent period 3,716 4,615
28.12 Impairment of Property, Plant and Equipment
Impairment exists when the carrying value of an asset
or cash generating unit exceeds its recoverable amount,
which is the higher of its fair value less costs to sell and its
value in use (VIU). The fair value less costs to sell calculation
is based on available data from an active market, in an arm’s
length transaction, of similar assets or observable market
prices less incremental costs for disposing of the asset.
The value in use calculation is based on a discounted cash
flow model. The cash flows are derived from the budget
for the next five years and do not include restructuring
activities that the Company is not yet committed to or
significant future investments that will enhance the
asset’s performance of the cash generating unit being
tested. The recoverable amount is most sensitive to the
discount rate used for the discounted cash flow model as
well as the expected future cash inflows and the growth
rate used for extrapolation purposes.
The Management has assessed the potential impairment
loss of property, plant and equipment as at 31 December
2020. Based on the assessment, the Company does not
foresee any indications of Impairment as at the reporting
date due to the COVID-19 pandemic, and functions under
the business continuity plan as per the Company risk
management strategy, allowing operations to function
through alternate working arrangements, whilst strictly
adhering to and supporting government directives.
28.13 Fully Depreciated Property, Plant and Equipment
The initial cost of fully depreciated property, plant and
equipment which are still in use as at the reporting date
is as follows;
As at 31 December 2020 2019
Rs. ‘000 Rs. ‘000
Computer equipment 367,191 361,715
Office equipment 125,289 120,433
Furniture and fittings 131,777 141,168
Motor Vehicle 80 80
Total 624,337 623,396
28.14 Property, Plant and Equipment pledged as Security
None of the property, plant or equipment have been
pledged as security as at the reporting date.
28.15 Permanent Fall in Value of Property, Plant and Equipment
There has been no permanent fall in value of PPE
which require an impairment provision in the Financial
Statements.
28.16 Temporarily Idle Property, Plant and Equipment
There are no temporarily idle property, plant or equipment
as at the reporting date.
28.17 Compensation from Third Parties for Items of Property, Plant and Equipment
There were no compensation received / receivable from
third parties for items of property, plant or equipment that
were impaired, lost or given up.
28.18 Property, Plant & Equipment retired from active use
There were no property plant and equipment which are
retired from active use as at the reporting date (2019 - Nil)
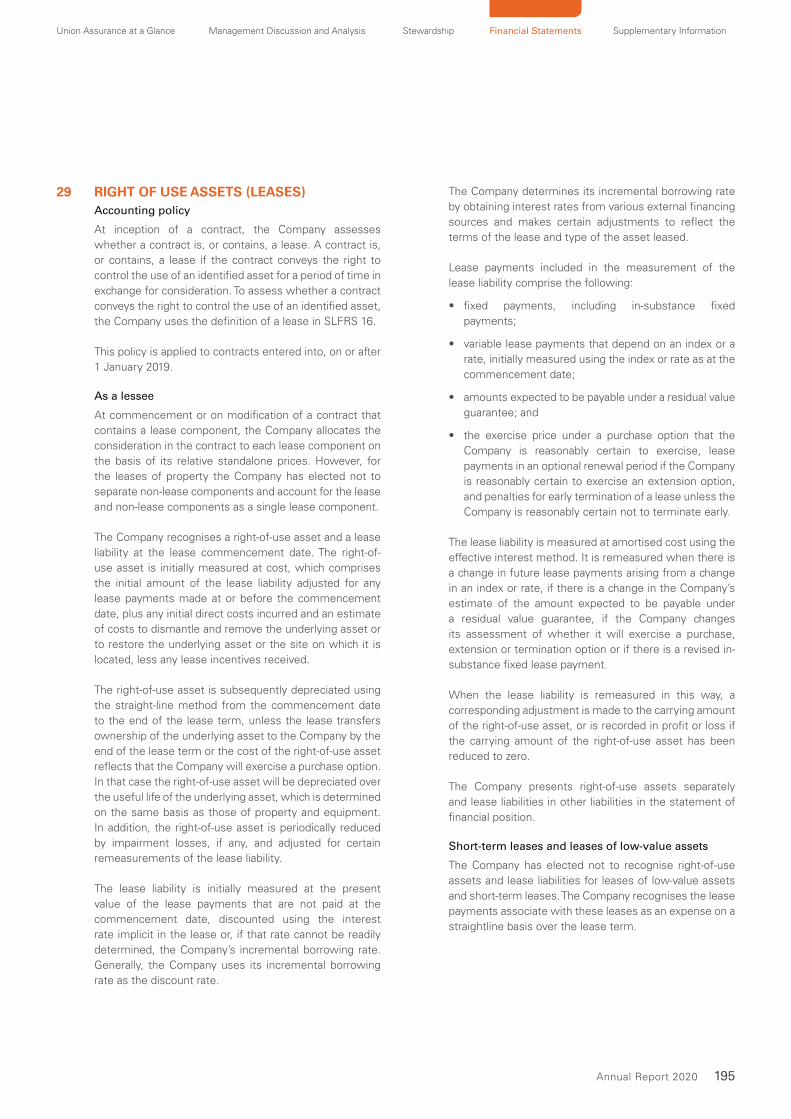
Union Assurance at a Glance Management Discussion and Analysis Stewardship Financial Statements Supplementary Information
195Annual Report 2020
29 RIGHT OF USE ASSETS (LEASES) Accounting policy
At inception of a contract, the Company assesses
whether a contract is, or contains, a lease. A contract is,
or contains, a lease if the contract conveys the right to
control the use of an identified asset for a period of time in
exchange for consideration. To assess whether a contract
conveys the right to control the use of an identified asset,
the Company uses the definition of a lease in SLFRS 16.
This policy is applied to contracts entered into, on or after
1 January 2019.
As a lessee
At commencement or on modification of a contract that
contains a lease component, the Company allocates the
consideration in the contract to each lease component on
the basis of its relative standalone prices. However, for
the leases of property the Company has elected not to
separate non-lease components and account for the lease
and non-lease components as a single lease component.
The Company recognises a right-of-use asset and a lease
liability at the lease commencement date. The right-of-
use asset is initially measured at cost, which comprises
the initial amount of the lease liability adjusted for any
lease payments made at or before the commencement
date, plus any initial direct costs incurred and an estimate
of costs to dismantle and remove the underlying asset or
to restore the underlying asset or the site on which it is
located, less any lease incentives received.
The right-of-use asset is subsequently depreciated using
the straight-line method from the commencement date
to the end of the lease term, unless the lease transfers
ownership of the underlying asset to the Company by the
end of the lease term or the cost of the right-of-use asset
reflects that the Company will exercise a purchase option.
In that case the right-of-use asset will be depreciated over
the useful life of the underlying asset, which is determined
on the same basis as those of property and equipment.
In addition, the right-of-use asset is periodically reduced
by impairment losses, if any, and adjusted for certain
remeasurements of the lease liability.
The lease liability is initially measured at the present
value of the lease payments that are not paid at the
commencement date, discounted using the interest
rate implicit in the lease or, if that rate cannot be readily
determined, the Company’s incremental borrowing rate.
Generally, the Company uses its incremental borrowing
rate as the discount rate.
The Company determines its incremental borrowing rate
by obtaining interest rates from various external financing
sources and makes certain adjustments to reflect the
terms of the lease and type of the asset leased.
Lease payments included in the measurement of the
lease liability comprise the following:
• fixed payments, including in-substance fixed
payments;
• variable lease payments that depend on an index or a
rate, initially measured using the index or rate as at the
commencement date;
• amounts expected to be payable under a residual value
guarantee; and
• the exercise price under a purchase option that the
Company is reasonably certain to exercise, lease
payments in an optional renewal period if the Company
is reasonably certain to exercise an extension option,
and penalties for early termination of a lease unless the
Company is reasonably certain not to terminate early.
The lease liability is measured at amortised cost using the
effective interest method. It is remeasured when there is
a change in future lease payments arising from a change
in an index or rate, if there is a change in the Company’s
estimate of the amount expected to be payable under
a residual value guarantee, if the Company changes
its assessment of whether it will exercise a purchase,
extension or termination option or if there is a revised in-
substance fixed lease payment.
When the lease liability is remeasured in this way, a
corresponding adjustment is made to the carrying amount
of the right-of-use asset, or is recorded in profit or loss if
the carrying amount of the right-of-use asset has been
reduced to zero.
The Company presents right-of-use assets separately
and lease liabilities in other liabilities in the statement of
financial position.
Short-term leases and leases of low-value assets
The Company has elected not to recognise right-of-use
assets and lease liabilities for leases of low-value assets
and short-term leases. The Company recognises the lease
payments associate with these leases as an expense on a
straightline basis over the lease term.
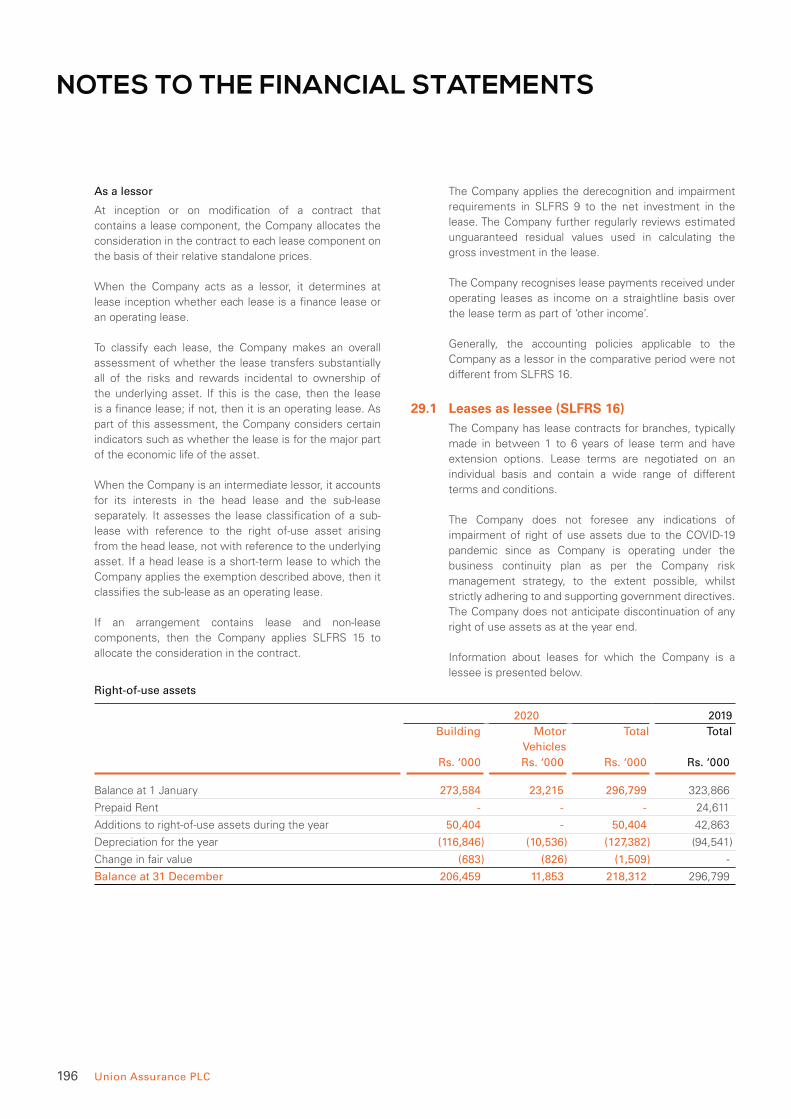
196 Union Assurance PLC
NOTES TO THE FINANCIAL STATEMENTS
As a lessor
At inception or on modification of a contract that
contains a lease component, the Company allocates the
consideration in the contract to each lease component on
the basis of their relative standalone prices.
When the Company acts as a lessor, it determines at
lease inception whether each lease is a finance lease or
an operating lease.
To classify each lease, the Company makes an overall
assessment of whether the lease transfers substantially
all of the risks and rewards incidental to ownership of
the underlying asset. If this is the case, then the lease
is a finance lease; if not, then it is an operating lease. As
part of this assessment, the Company considers certain
indicators such as whether the lease is for the major part
of the economic life of the asset.
When the Company is an intermediate lessor, it accounts
for its interests in the head lease and the sub-lease
separately. It assesses the lease classification of a sub-
lease with reference to the right of-use asset arising
from the head lease, not with reference to the underlying
asset. If a head lease is a short-term lease to which the
Company applies the exemption described above, then it
classifies the sub-lease as an operating lease.
If an arrangement contains lease and non-lease
components, then the Company applies SLFRS 15 to
allocate the consideration in the contract.
The Company applies the derecognition and impairment
requirements in SLFRS 9 to the net investment in the
lease. The Company further regularly reviews estimated
unguaranteed residual values used in calculating the
gross investment in the lease.
The Company recognises lease payments received under
operating leases as income on a straightline basis over
the lease term as part of ‘other income’.
Generally, the accounting policies applicable to the
Company as a lessor in the comparative period were not
different from SLFRS 16.
29.1 Leases as lessee (SLFRS 16)The Company has lease contracts for branches, typically
made in between 1 to 6 years of lease term and have
extension options. Lease terms are negotiated on an
individual basis and contain a wide range of different
terms and conditions.
The Company does not foresee any indications of
impairment of right of use assets due to the COVID-19
pandemic since as Company is operating under the
business continuity plan as per the Company risk
management strategy, to the extent possible, whilst
strictly adhering to and supporting government directives.
The Company does not anticipate discontinuation of any
right of use assets as at the year end.
Information about leases for which the Company is a
lessee is presented below.
Right-of-use assets
2020 2019
Building Motor
Vehicles
Total Total
Rs. ‘000 Rs. ‘000 Rs. ‘000 Rs. ‘000
Balance at 1 January 273,584 23,215 296,799 323,866
Prepaid Rent - - - 24,611
Additions to right-of-use assets during the year 50,404 - 50,404 42,863
Depreciation for the year (116,846) (10,536) (127,382) (94,541)
Change in fair value (683) (826) (1,509) -
Balance at 31 December 206,459 11,853 218,312 296,799
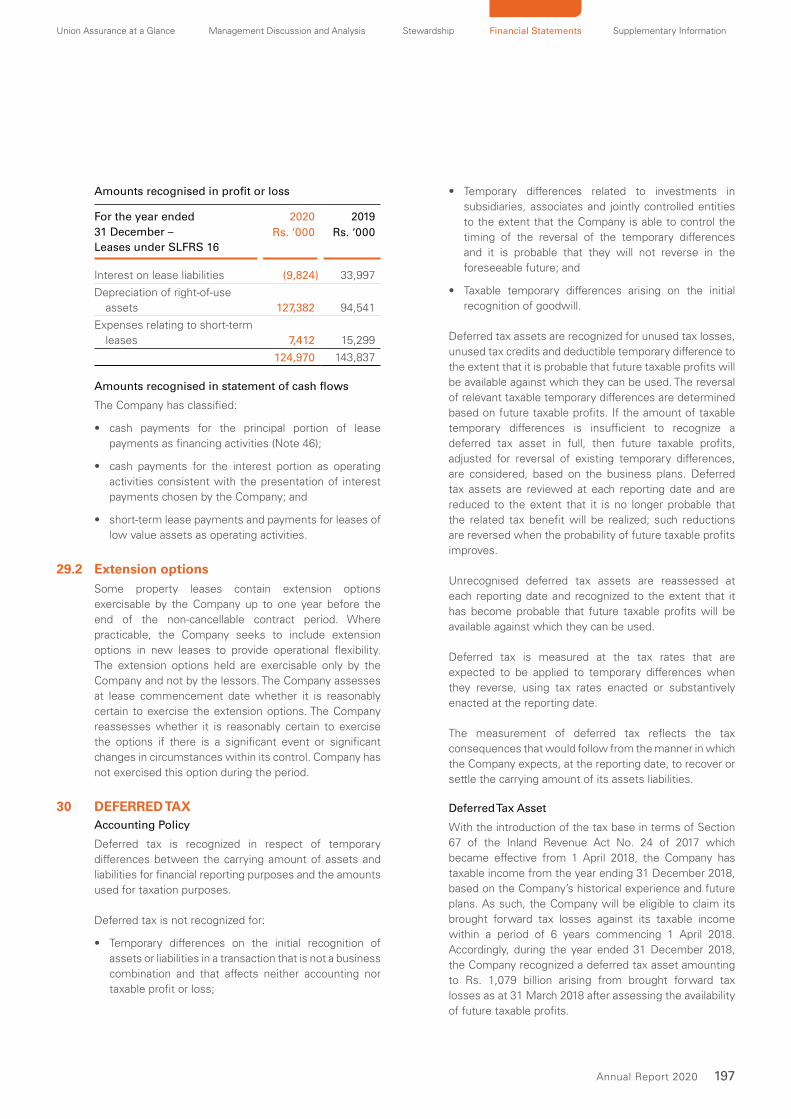
Union Assurance at a Glance Management Discussion and Analysis Stewardship Financial Statements Supplementary Information
197Annual Report 2020
Amounts recognised in profit or loss
For the year ended
31 December –
Leases under SLFRS 16
2020 2019
Rs. ‘000 Rs. ‘000
Interest on lease liabilities (9,824) 33,997
Depreciation of right-of-use
assets 127,382 94,541
Expenses relating to short-term
leases 7,412 15,299
124,970 143,837
Amounts recognised in statement of cash flows
The Company has classified:
• cash payments for the principal portion of lease
payments as financing activities (Note 46);
• cash payments for the interest portion as operating
activities consistent with the presentation of interest
payments chosen by the Company; and
• short-term lease payments and payments for leases of
low value assets as operating activities.
29.2 Extension optionsSome property leases contain extension options
exercisable by the Company up to one year before the
end of the non-cancellable contract period. Where
practicable, the Company seeks to include extension
options in new leases to provide operational flexibility.
The extension options held are exercisable only by the
Company and not by the lessors. The Company assesses
at lease commencement date whether it is reasonably
certain to exercise the extension options. The Company
reassesses whether it is reasonably certain to exercise
the options if there is a significant event or significant
changes in circumstances within its control. Company has
not exercised this option during the period.
30 DEFERRED TAX Accounting Policy
Deferred tax is recognized in respect of temporary
differences between the carrying amount of assets and
liabilities for financial reporting purposes and the amounts
used for taxation purposes.
Deferred tax is not recognized for:
• Temporary differences on the initial recognition of
assets or liabilities in a transaction that is not a business
combination and that affects neither accounting nor
taxable profit or loss;
• Temporary differences related to investments in
subsidiaries, associates and jointly controlled entities
to the extent that the Company is able to control the
timing of the reversal of the temporary differences
and it is probable that they will not reverse in the
foreseeable future; and
• Taxable temporary differences arising on the initial
recognition of goodwill.
Deferred tax assets are recognized for unused tax losses,
unused tax credits and deductible temporary difference to
the extent that it is probable that future taxable profits will
be available against which they can be used. The reversal
of relevant taxable temporary differences are determined
based on future taxable profits. If the amount of taxable
temporary differences is insufficient to recognize a
deferred tax asset in full, then future taxable profits,
adjusted for reversal of existing temporary differences,
are considered, based on the business plans. Deferred
tax assets are reviewed at each reporting date and are
reduced to the extent that it is no longer probable that
the related tax benefit will be realized; such reductions
are reversed when the probability of future taxable profits
improves.
Unrecognised deferred tax assets are reassessed at
each reporting date and recognized to the extent that it
has become probable that future taxable profits will be
available against which they can be used.
Deferred tax is measured at the tax rates that are
expected to be applied to temporary differences when
they reverse, using tax rates enacted or substantively
enacted at the reporting date.
The measurement of deferred tax reflects the tax
consequences that would follow from the manner in which
the Company expects, at the reporting date, to recover or
settle the carrying amount of its assets liabilities.
Deferred Tax Asset
With the introduction of the tax base in terms of Section
67 of the Inland Revenue Act No. 24 of 2017 which
became effective from 1 April 2018, the Company has
taxable income from the year ending 31 December 2018,
based on the Company’s historical experience and future
plans. As such, the Company will be eligible to claim its
brought forward tax losses against its taxable income
within a period of 6 years commencing 1 April 2018.
Accordingly, during the year ended 31 December 2018,
the Company recognized a deferred tax asset amounting
to Rs. 1,079 billion arising from brought forward tax
losses as at 31 March 2018 after assessing the availability
of future taxable profits.
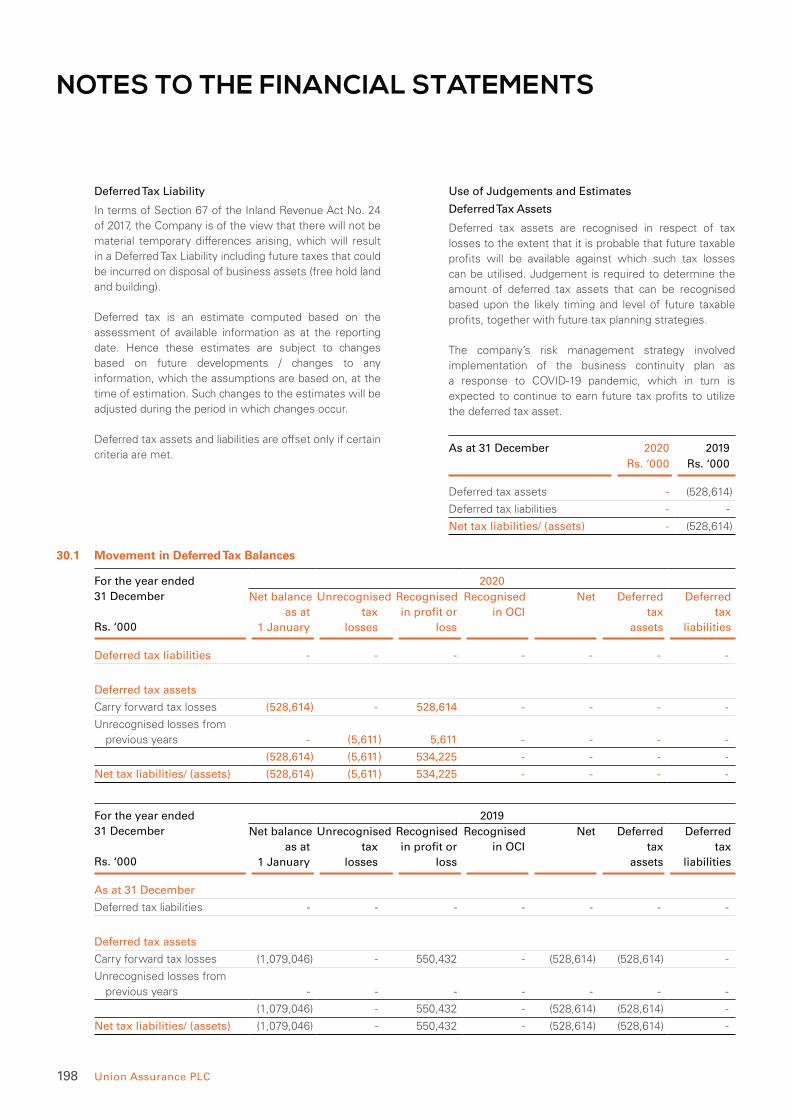
198 Union Assurance PLC
NOTES TO THE FINANCIAL STATEMENTS
Deferred Tax Liability
In terms of Section 67 of the Inland Revenue Act No. 24
of 2017, the Company is of the view that there will not be
material temporary differences arising, which will result
in a Deferred Tax Liability including future taxes that could
be incurred on disposal of business assets (free hold land
and building).
Deferred tax is an estimate computed based on the
assessment of available information as at the reporting
date. Hence these estimates are subject to changes
based on future developments / changes to any
information, which the assumptions are based on, at the
time of estimation. Such changes to the estimates will be
adjusted during the period in which changes occur.
Deferred tax assets and liabilities are offset only if certain
criteria are met.
Use of Judgements and Estimates
Deferred Tax Assets
Deferred tax assets are recognised in respect of tax
losses to the extent that it is probable that future taxable
profits will be available against which such tax losses
can be utilised. Judgement is required to determine the
amount of deferred tax assets that can be recognised
based upon the likely timing and level of future taxable
profits, together with future tax planning strategies.
The company’s risk management strategy involved
implementation of the business continuity plan as
a response to COVID-19 pandemic, which in turn is
expected to continue to earn future tax profits to utilize
the deferred tax asset.
As at 31 December 2020 2019
Rs. ‘000 Rs. ‘000
Deferred tax assets - (528,614)
Deferred tax liabilities - -
Net tax liabilities/ (assets) - (528,614)
30.1 Movement in Deferred Tax Balances
For the year ended
31 December
Rs. ‘000
2020
Net balance
as at
1 January
Unrecognised
tax
losses
Recognised
in profit or
loss
Recognised
in OCI
Net Deferred
tax
assets
Deferred
tax
liabilities
Deferred tax liabilities - - - - - - -
Deferred tax assets
Carry forward tax losses (528,614) - 528,614 - - - -
Unrecognised losses from
previous years - (5,611) 5,611 - - - -
(528,614) (5,611) 534,225 - - - -
Net tax liabilities/ (assets) (528,614) (5,611) 534,225 - - - -
For the year ended
31 December
Rs. ‘000
2019
Net balance
as at
1 January
Unrecognised
tax
losses
Recognised
in profit or
loss
Recognised
in OCI
Net Deferred
tax
assets
Deferred
tax
liabilities
As at 31 December
Deferred tax liabilities - - - - - - -
Deferred tax assets
Carry forward tax losses (1,079,046) - 550,432 - (528,614) (528,614) -
Unrecognised losses from
previous years - - - - - - -
(1,079,046) - 550,432 - (528,614) (528,614) -
Net tax liabilities/ (assets) (1,079,046) - 550,432 - (528,614) (528,614) -
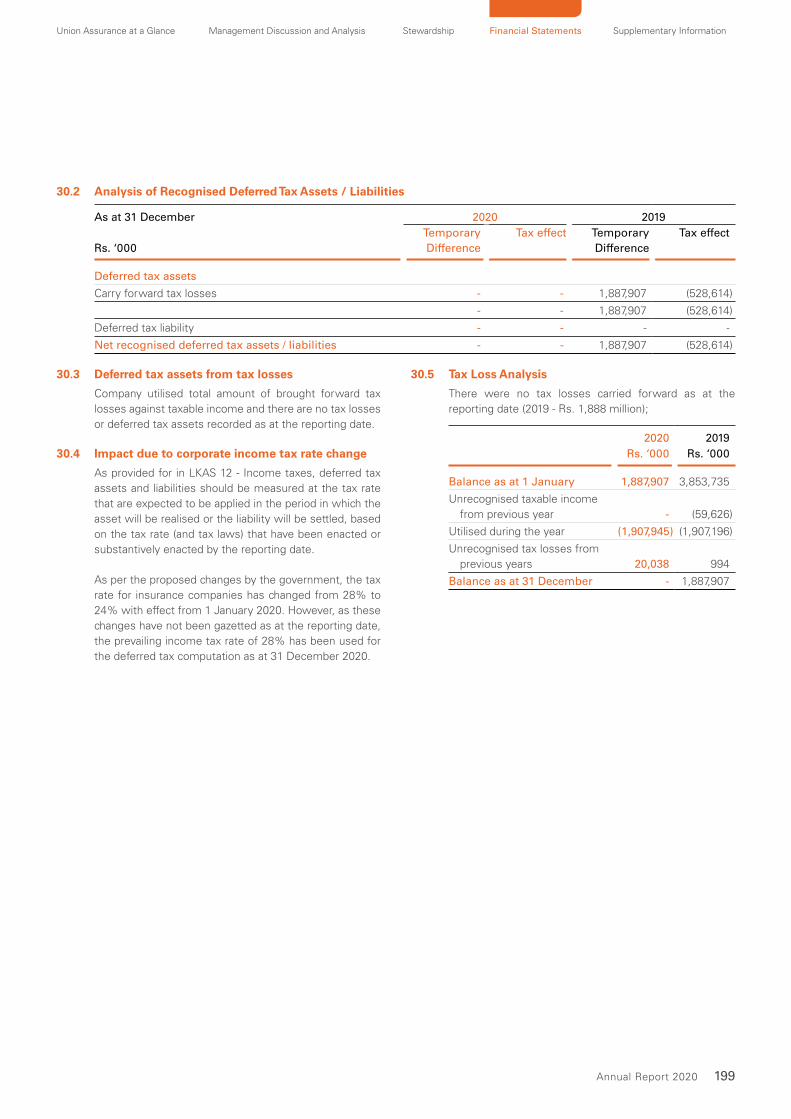
Union Assurance at a Glance Management Discussion and Analysis Stewardship Financial Statements Supplementary Information
199Annual Report 2020
30.2 Analysis of Recognised Deferred Tax Assets / Liabilities
As at 31 December 2020 2019
Rs. ‘000
Temporary
Difference
Tax effect Temporary
Difference
Tax effect
Deferred tax assets
Carry forward tax losses - - 1,887,907 (528,614)
- - 1,887,907 (528,614)
Deferred tax liability - - - -
Net recognised deferred tax assets / liabilities - - 1,887,907 (528,614)
30.3 Deferred tax assets from tax losses
Company utilised total amount of brought forward tax
losses against taxable income and there are no tax losses
or deferred tax assets recorded as at the reporting date.
30.4 Impact due to corporate income tax rate change
As provided for in LKAS 12 - Income taxes, deferred tax
assets and liabilities should be measured at the tax rate
that are expected to be applied in the period in which the
asset will be realised or the liability will be settled, based
on the tax rate (and tax laws) that have been enacted or
substantively enacted by the reporting date.
As per the proposed changes by the government, the tax
rate for insurance companies has changed from 28% to
24% with effect from 1 January 2020. However, as these
changes have not been gazetted as at the reporting date,
the prevailing income tax rate of 28% has been used for
the deferred tax computation as at 31 December 2020.
30.5 Tax Loss Analysis
There were no tax losses carried forward as at the
reporting date (2019 - Rs. 1,888 million);
2020 2019
Rs. ‘000 Rs. ‘000
Balance as at 1 January 1,887,907 3,853,735
Unrecognised taxable income
from previous year - (59,626)
Utilised during the year (1,907,945) (1,907,196)
Unrecognised tax losses from
previous years 20,038 994
Balance as at 31 December - 1,887,907
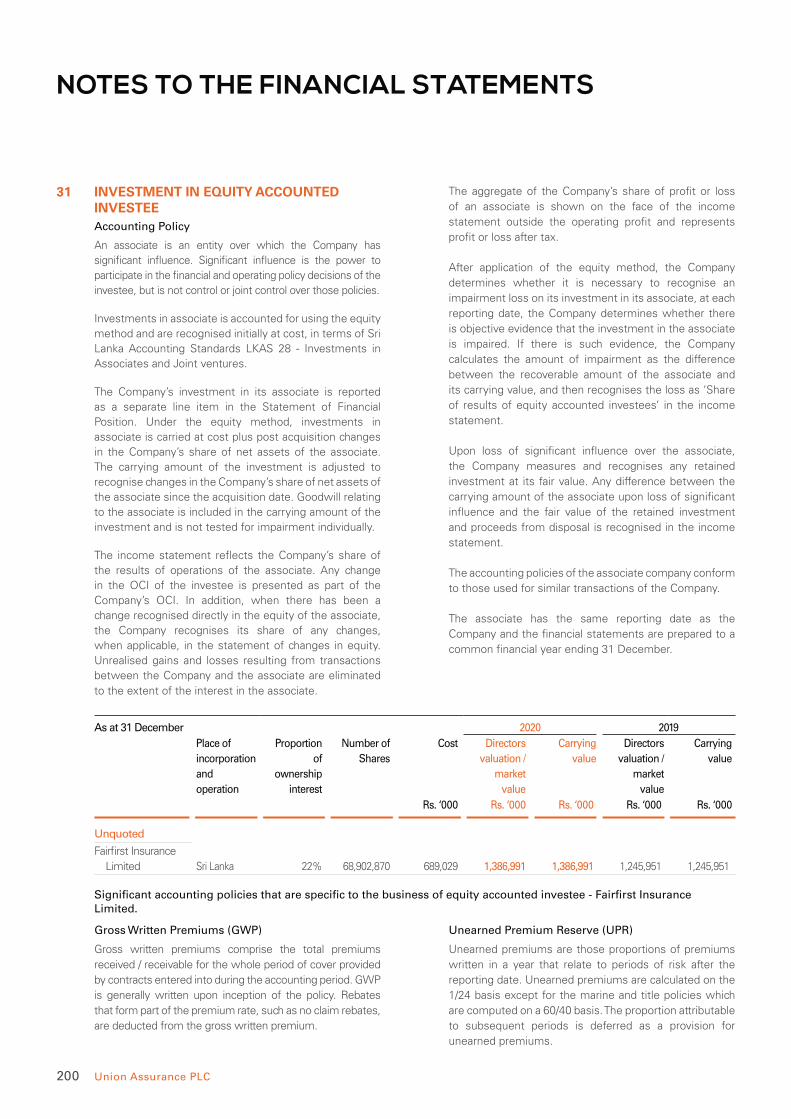
200 Union Assurance PLC
NOTES TO THE FINANCIAL STATEMENTS
31 INVESTMENT IN EQUITY ACCOUNTED INVESTEE
Accounting Policy
An associate is an entity over which the Company has significant influence. Significant influence is the power to participate in the financial and operating policy decisions of the investee, but is not control or joint control over those policies.
Investments in associate is accounted for using the equity method and are recognised initially at cost, in terms of Sri Lanka Accounting Standards LKAS 28 - Investments in Associates and Joint ventures.
The Company’s investment in its associate is reported as a separate line item in the Statement of Financial Position. Under the equity method, investments in associate is carried at cost plus post acquisition changes in the Company’s share of net assets of the associate. The carrying amount of the investment is adjusted to recognise changes in the Company’s share of net assets of the associate since the acquisition date. Goodwill relating to the associate is included in the carrying amount of the investment and is not tested for impairment individually.
The income statement reflects the Company’s share of the results of operations of the associate. Any change in the OCI of the investee is presented as part of the Company’s OCI. In addition, when there has been a change recognised directly in the equity of the associate, the Company recognises its share of any changes, when applicable, in the statement of changes in equity. Unrealised gains and losses resulting from transactions between the Company and the associate are eliminated
to the extent of the interest in the associate.
The aggregate of the Company’s share of profit or loss
of an associate is shown on the face of the income
statement outside the operating profit and represents
profit or loss after tax.
After application of the equity method, the Company
determines whether it is necessary to recognise an
impairment loss on its investment in its associate, at each
reporting date, the Company determines whether there
is objective evidence that the investment in the associate
is impaired. If there is such evidence, the Company
calculates the amount of impairment as the difference
between the recoverable amount of the associate and
its carrying value, and then recognises the loss as ‘Share
of results of equity accounted investees’ in the income
statement.
Upon loss of significant influence over the associate,
the Company measures and recognises any retained
investment at its fair value. Any difference between the
carrying amount of the associate upon loss of significant
influence and the fair value of the retained investment
and proceeds from disposal is recognised in the income
statement.
The accounting policies of the associate company conform
to those used for similar transactions of the Company.
The associate has the same reporting date as the
Company and the financial statements are prepared to a
common financial year ending 31 December.
As at 31 December 2020 2019
Place of
incorporation
and
operation
Proportion
of
ownership
interest
Number of
Shares
Cost Directors
valuation /
market
value
Carrying
value
Directors
valuation /
market
value
Carrying
value
Rs. ‘000 Rs. ‘000 Rs. ‘000 Rs. ‘000 Rs. ‘000
Unquoted
Fairfirst Insurance
Limited Sri Lanka 22% 68,902,870 689,029 1,386,991 1,386,991 1,245,951 1,245,951
Significant accounting policies that are specific to the business of equity accounted investee - Fairfirst Insurance Limited.
Gross Written Premiums (GWP)
Gross written premiums comprise the total premiums
received / receivable for the whole period of cover provided
by contracts entered into during the accounting period. GWP
is generally written upon inception of the policy. Rebates
that form part of the premium rate, such as no claim rebates,
are deducted from the gross written premium.
Unearned Premium Reserve (UPR)
Unearned premiums are those proportions of premiums
written in a year that relate to periods of risk after the
reporting date. Unearned premiums are calculated on the
1/24 basis except for the marine and title policies which
are computed on a 60/40 basis. The proportion attributable
to subsequent periods is deferred as a provision for
unearned premiums.
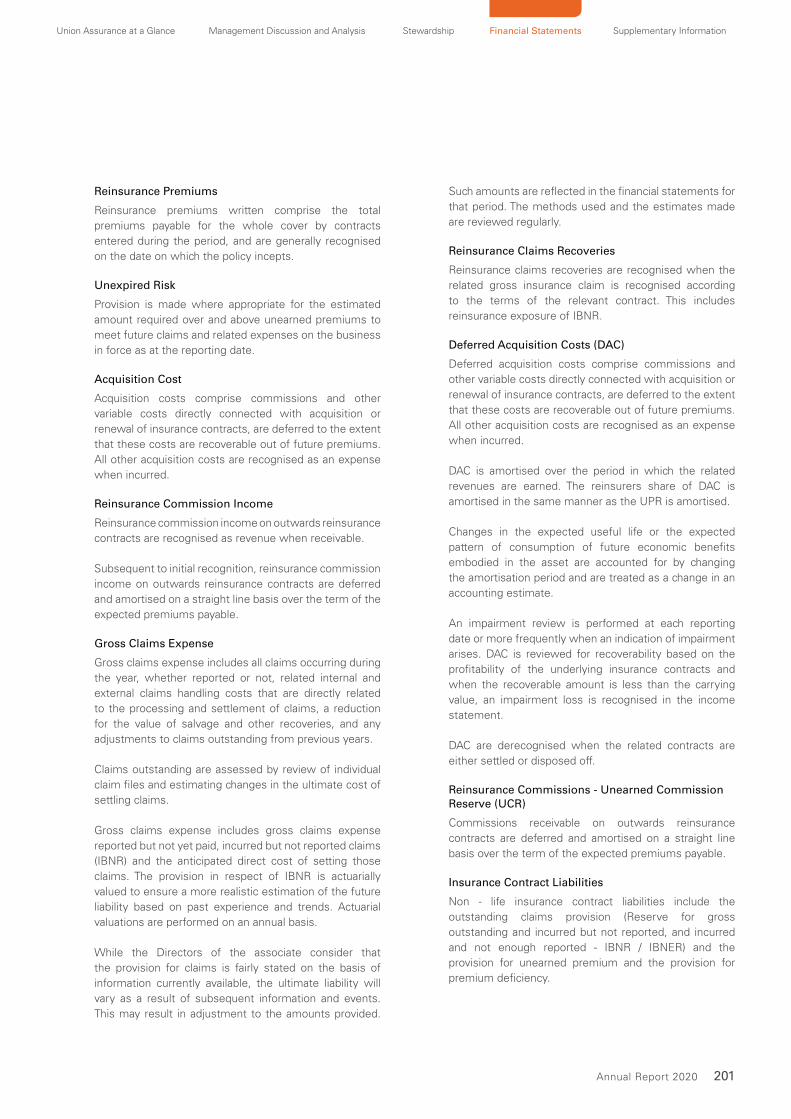
Union Assurance at a Glance Management Discussion and Analysis Stewardship Financial Statements Supplementary Information
201Annual Report 2020
Reinsurance Premiums
Reinsurance premiums written comprise the total
premiums payable for the whole cover by contracts
entered during the period, and are generally recognised
on the date on which the policy incepts.
Unexpired Risk
Provision is made where appropriate for the estimated
amount required over and above unearned premiums to
meet future claims and related expenses on the business
in force as at the reporting date.
Acquisition Cost
Acquisition costs comprise commissions and other
variable costs directly connected with acquisition or
renewal of insurance contracts, are deferred to the extent
that these costs are recoverable out of future premiums.
All other acquisition costs are recognised as an expense
when incurred.
Reinsurance Commission Income
Reinsurance commission income on outwards reinsurance
contracts are recognised as revenue when receivable.
Subsequent to initial recognition, reinsurance commission
income on outwards reinsurance contracts are deferred
and amortised on a straight line basis over the term of the
expected premiums payable.
Gross Claims Expense
Gross claims expense includes all claims occurring during
the year, whether reported or not, related internal and
external claims handling costs that are directly related
to the processing and settlement of claims, a reduction
for the value of salvage and other recoveries, and any
adjustments to claims outstanding from previous years.
Claims outstanding are assessed by review of individual
claim files and estimating changes in the ultimate cost of
settling claims.
Gross claims expense includes gross claims expense
reported but not yet paid, incurred but not reported claims
(IBNR) and the anticipated direct cost of setting those
claims. The provision in respect of IBNR is actuarially
valued to ensure a more realistic estimation of the future
liability based on past experience and trends. Actuarial
valuations are performed on an annual basis.
While the Directors of the associate consider that
the provision for claims is fairly stated on the basis of
information currently available, the ultimate liability will
vary as a result of subsequent information and events.
This may result in adjustment to the amounts provided.
Such amounts are reflected in the financial statements for
that period. The methods used and the estimates made
are reviewed regularly.
Reinsurance Claims Recoveries
Reinsurance claims recoveries are recognised when the
related gross insurance claim is recognised according
to the terms of the relevant contract. This includes
reinsurance exposure of IBNR.
Deferred Acquisition Costs (DAC)
Deferred acquisition costs comprise commissions and
other variable costs directly connected with acquisition or
renewal of insurance contracts, are deferred to the extent
that these costs are recoverable out of future premiums.
All other acquisition costs are recognised as an expense
when incurred.
DAC is amortised over the period in which the related
revenues are earned. The reinsurers share of DAC is
amortised in the same manner as the UPR is amortised.
Changes in the expected useful life or the expected
pattern of consumption of future economic benefits
embodied in the asset are accounted for by changing
the amortisation period and are treated as a change in an
accounting estimate.
An impairment review is performed at each reporting
date or more frequently when an indication of impairment
arises. DAC is reviewed for recoverability based on the
profitability of the underlying insurance contracts and
when the recoverable amount is less than the carrying
value, an impairment loss is recognised in the income
statement.
DAC are derecognised when the related contracts are
either settled or disposed off.
Reinsurance Commissions - Unearned Commission Reserve (UCR)
Commissions receivable on outwards reinsurance
contracts are deferred and amortised on a straight line
basis over the term of the expected premiums payable.
Insurance Contract Liabilities
Non - life insurance contract liabilities include the
outstanding claims provision (Reserve for gross
outstanding and incurred but not reported, and incurred
and not enough reported - IBNR / IBNER) and the
provision for unearned premium and the provision for
premium deficiency.
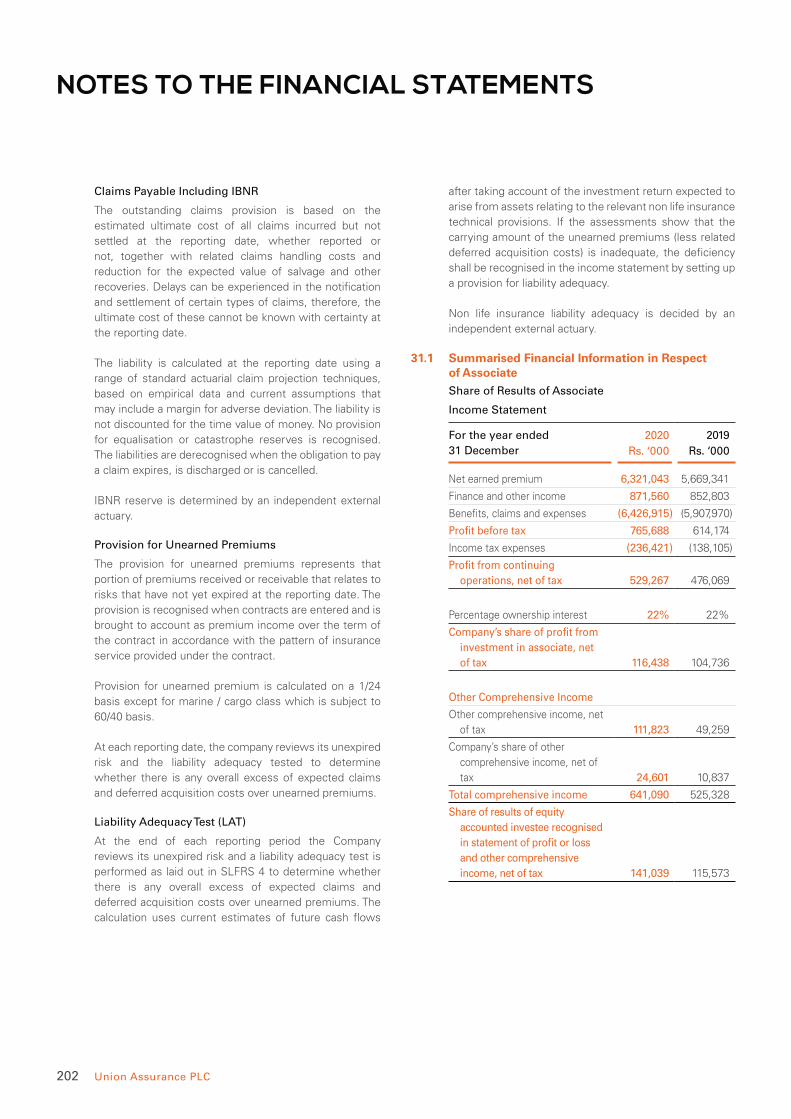
202 Union Assurance PLC
NOTES TO THE FINANCIAL STATEMENTS
Claims Payable Including IBNR
The outstanding claims provision is based on the
estimated ultimate cost of all claims incurred but not
settled at the reporting date, whether reported or
not, together with related claims handling costs and
reduction for the expected value of salvage and other
recoveries. Delays can be experienced in the notification
and settlement of certain types of claims, therefore, the
ultimate cost of these cannot be known with certainty at
the reporting date.
The liability is calculated at the reporting date using a
range of standard actuarial claim projection techniques,
based on empirical data and current assumptions that
may include a margin for adverse deviation. The liability is
not discounted for the time value of money. No provision
for equalisation or catastrophe reserves is recognised.
The liabilities are derecognised when the obligation to pay
a claim expires, is discharged or is cancelled.
IBNR reserve is determined by an independent external
actuary.
Provision for Unearned Premiums
The provision for unearned premiums represents that
portion of premiums received or receivable that relates to
risks that have not yet expired at the reporting date. The
provision is recognised when contracts are entered and is
brought to account as premium income over the term of
the contract in accordance with the pattern of insurance
service provided under the contract.
Provision for unearned premium is calculated on a 1/24
basis except for marine / cargo class which is subject to
60/40 basis.
At each reporting date, the company reviews its unexpired
risk and the liability adequacy tested to determine
whether there is any overall excess of expected claims
and deferred acquisition costs over unearned premiums.
Liability Adequacy Test (LAT)
At the end of each reporting period the Company
reviews its unexpired risk and a liability adequacy test is
performed as laid out in SLFRS 4 to determine whether
there is any overall excess of expected claims and
deferred acquisition costs over unearned premiums. The
calculation uses current estimates of future cash flows
after taking account of the investment return expected to
arise from assets relating to the relevant non life insurance
technical provisions. If the assessments show that the
carrying amount of the unearned premiums (less related
deferred acquisition costs) is inadequate, the deficiency
shall be recognised in the income statement by setting up
a provision for liability adequacy.
Non life insurance liability adequacy is decided by an
independent external actuary.
31.1 Summarised Financial Information in Respect of Associate
Share of Results of Associate
Income Statement
For the year ended
31 December
2020 2019
Rs. ‘000 Rs. ‘000
Net earned premium 6,321,043 5,669,341
Finance and other income 871,560 852,803
Benefits, claims and expenses (6,426,915) (5,907,970)
Profit before tax 765,688 614,174
Income tax expenses (236,421) (138,105)
Profit from continuing
operations, net of tax 529,267 476,069
Percentage ownership interest 22% 22%
Company’s share of profit from
investment in associate, net
of tax 116,438 104,736
Other Comprehensive Income
Other comprehensive income, net
of tax 111,823 49,259
Company’s share of other
comprehensive income, net of
tax 24,601 10,837
Total comprehensive income 641,090 525,328
Share of results of equity
accounted investee recognised
in statement of profit or loss
and other comprehensive
income, net of tax 141,039 115,573

Union Assurance at a Glance Management Discussion and Analysis Stewardship Financial Statements Supplementary Information
203Annual Report 2020
Current non current analysis of assets / Liabilities in
respect of associate
As at 31 December 2020 2019
Total assets 18,190,337 16,437,410
Total liabilities 11,885,830 10,773,991
Net assets (100%) 6,304,507 5,663,419
Company's share of net assets
(22%) 1,386,991 1,245,951
31.1(a) Company’s Share of Other Comprehensive Income, net of Tax
For the year ended
31 December
2020 2019
Note Rs. ‘000 Rs. ‘000
Share of gains on AFS
reserve 39 26,915 13,234
Share of actuarial losses
on defined benefit
plans 42.2 (2,314) (2,397)
24,601 10,837
31.2 Reconciliation of Summarised Financial Information
Reconciliation of the above summarised financial information to the carrying amount of the interest in associate recognised in the
financial statements is as follows.
For the year ended 31 December 2020 2019
Rs. ‘000 Rs. ‘000
Value of investment in equity accounted investee as at 1 January 1,245,951 1,130,379
Add
Net profit for the period recognised in income statement 116,438 104,736
Other comprehensive income 24,601 10,837
Dividend received - -
Company share of (net of tax) equity accounted investee for the year ended 31 December 141,039 115,573
Value of investment in equity accounted investee as at 31 December 1,386,991 1,245,951
Contingent liabilities of equity accounted investee Nil Nil
Capital and other commitments of equity accounted investee Nil Nil
31.3 There are no restrictions on the ability of the associate
to transfer funds to the investor in the form of cash
dividends, or repayment of loans or advances.
31.4 The Company has neither contingent liabilities nor capital
and other commitments towards its associate company.
32 FINANCIAL INVESTMENTSThe risk management practices adopted by the
Company in relation to the investment portfolio and risk
management disclosures are outlined in Note 8 to the
financial statements.
32.1 Financial Investments Pledged as Security
None of the financial investments have been pledged as
security as at the reporting date.
32.2 The Company’s Financial Instruments are Summarised as Follows:
As at 31 December 2020 2019
Rs.’000
Note Carrying
value
Fair Value Carrying
value
Fair Value
Held to maturity financial assets (HTM) 32.3 22,160,419 27,055,999 20,376,303 21,577,858
Loans and receivables (L&R) 32.4 17,084,128 18,188,900 13,199,658 13,479,038
Available for sale financial assets (AFS) 32.5 7,954,413 7,954,413 7,848,043 7,848,043
Financial assets at fair value through profit or loss
(FVTPL) 32.6 5,157,248 5,157,248 3,457,191 3,457,191
Total financial investments 52,356,208 58,356,560 44,881,195 46,362,130

204 Union Assurance PLC
NOTES TO THE FINANCIAL STATEMENTS
32.2(a) Investments Supporting Restricted Regulatory Reserve
Based on the direction issued by the IRCSL dated 20
March 2018 on one - off surplus transfer, following
investments have been marked to support the Restricted
Regulatory Reserve of the Company.
As at 31 December 2020 2019
Rs. ‘000 Rs. ‘000
Treasury bonds
Held to maturity financial
investments 1,277,299 1,449,744
Available for sale financial
investments 2,352,868 2,116,302
3,630,167 3,566,046
32.3 Held to Maturity Financial Assets (HTM)
As at 31 December 2020 2019
Note Rs. ‘000 Rs. ‘000
Amortised cost
Quoted debentures 32.3 (a) 216,450 216,505
Treasury bonds 21,943,969 20,159,798
Total HTM financial
investments 22,160,419 20,376,303
32.3(a) Quoted Debentures - Banks and Finance
As at 31 December 2020
Issuer Credit Rating Maturity date No. of
debentures
Carrying
value
Market value Interest
Rs. ‘000 Rs. ‘000 Rs. ‘000 %
Hatton National Bank PLC AA- 31/07/2022 2,000,000 216,450 245,328 16.75
216,450 245,328
As at 31 December 2019
Issuer Credit Rating Maturity date No. of
debentures
Carrying
value
Market value Interest
Rs. ‘000 Rs. ‘000 Rs. ‘000 %
Hatton National Bank PLC A+ 31/07/2022 2,000,000 216,505 243,644 16.75
216,505 243,644
32.3(b) Impairment of Held to Maturity Financial Investments
At the reporting date, there were no HTM financial investments that were overdue and impaired.
(Rs. Mn)
Investments - Reporting Category Wise
0
5,000
10,000
15,000
20,000
25,000
20
,37
6
22
,16
0
13
,20
0 17
,08
4
7,8
48
7,9
54
3,4
57
5,1
57
(HTM) (L&R) (AFS) (FVTPL)
2019 2020
(%)
33
15
10
42
2019 2020
(HTM)
Composition of Investments
(L&R) (AFS)
4517
8
29
(FVTPL)
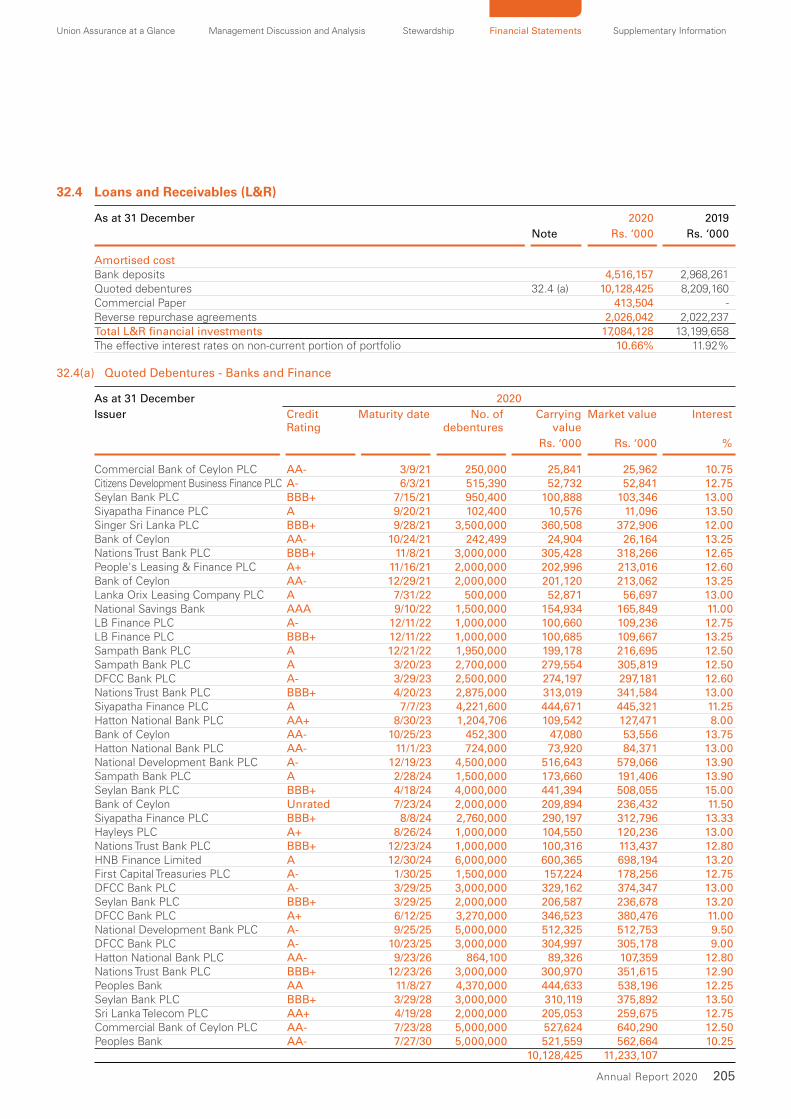
Union Assurance at a Glance Management Discussion and Analysis Stewardship Financial Statements Supplementary Information
205Annual Report 2020
32.4 Loans and Receivables (L&R)
As at 31 December 2020 2019
Note Rs. ‘000 Rs. ‘000
Amortised costBank deposits 4,516,157 2,968,261 Quoted debentures 32.4 (a) 10,128,425 8,209,160 Commercial Paper 413,504 - Reverse repurchase agreements 2,026,042 2,022,237 Total L&R financial investments 17,084,128 13,199,658 The effective interest rates on non-current portion of portfolio 10.66% 11.92%
32.4(a) Quoted Debentures - Banks and Finance
As at 31 December 2020
Issuer Credit Rating
Maturity date No. ofdebentures
Carryingvalue
Market value Interest
Rs. ‘000 Rs. ‘000 %
Commercial Bank of Ceylon PLC AA- 3/9/21 250,000 25,841 25,962 10.75Citizens Development Business Finance PLC A- 6/3/21 515,390 52,732 52,841 12.75Seylan Bank PLC BBB+ 7/15/21 950,400 100,888 103,346 13.00Siyapatha Finance PLC A 9/20/21 102,400 10,576 11,096 13.50Singer Sri Lanka PLC BBB+ 9/28/21 3,500,000 360,508 372,906 12.00Bank of Ceylon AA- 10/24/21 242,499 24,904 26,164 13.25Nations Trust Bank PLC BBB+ 11/8/21 3,000,000 305,428 318,266 12.65People's Leasing & Finance PLC A+ 11/16/21 2,000,000 202,996 213,016 12.60Bank of Ceylon AA- 12/29/21 2,000,000 201,120 213,062 13.25Lanka Orix Leasing Company PLC A 7/31/22 500,000 52,871 56,697 13.00National Savings Bank AAA 9/10/22 1,500,000 154,934 165,849 11.00LB Finance PLC A- 12/11/22 1,000,000 100,660 109,236 12.75LB Finance PLC BBB+ 12/11/22 1,000,000 100,685 109,667 13.25Sampath Bank PLC A 12/21/22 1,950,000 199,178 216,695 12.50Sampath Bank PLC A 3/20/23 2,700,000 279,554 305,819 12.50DFCC Bank PLC A- 3/29/23 2,500,000 274,197 297,181 12.60Nations Trust Bank PLC BBB+ 4/20/23 2,875,000 313,019 341,584 13.00Siyapatha Finance PLC A 7/7/23 4,221,600 444,671 445,321 11.25Hatton National Bank PLC AA+ 8/30/23 1,204,706 109,542 127,471 8.00Bank of Ceylon AA- 10/25/23 452,300 47,080 53,556 13.75Hatton National Bank PLC AA- 11/1/23 724,000 73,920 84,371 13.00National Development Bank PLC A- 12/19/23 4,500,000 516,643 579,066 13.90Sampath Bank PLC A 2/28/24 1,500,000 173,660 191,406 13.90Seylan Bank PLC BBB+ 4/18/24 4,000,000 441,394 508,055 15.00Bank of Ceylon Unrated 7/23/24 2,000,000 209,894 236,432 11.50Siyapatha Finance PLC BBB+ 8/8/24 2,760,000 290,197 312,796 13.33Hayleys PLC A+ 8/26/24 1,000,000 104,550 120,236 13.00Nations Trust Bank PLC BBB+ 12/23/24 1,000,000 100,316 113,437 12.80HNB Finance Limited A 12/30/24 6,000,000 600,365 698,194 13.20First Capital Treasuries PLC A- 1/30/25 1,500,000 157,224 178,256 12.75DFCC Bank PLC A- 3/29/25 3,000,000 329,162 374,347 13.00Seylan Bank PLC BBB+ 3/29/25 2,000,000 206,587 236,678 13.20DFCC Bank PLC A+ 6/12/25 3,270,000 346,523 380,476 11.00National Development Bank PLC A- 9/25/25 5,000,000 512,325 512,753 9.50DFCC Bank PLC A- 10/23/25 3,000,000 304,997 305,178 9.00Hatton National Bank PLC AA- 9/23/26 864,100 89,326 107,359 12.80Nations Trust Bank PLC BBB+ 12/23/26 3,000,000 300,970 351,615 12.90Peoples Bank AA 11/8/27 4,370,000 444,633 538,196 12.25Seylan Bank PLC BBB+ 3/29/28 3,000,000 310,119 375,892 13.50Sri Lanka Telecom PLC AA+ 4/19/28 2,000,000 205,053 259,675 12.75Commercial Bank of Ceylon PLC AA- 7/23/28 5,000,000 527,624 640,290 12.50Peoples Bank AA- 7/27/30 5,000,000 521,559 562,664 10.25
10,128,425 11,233,107
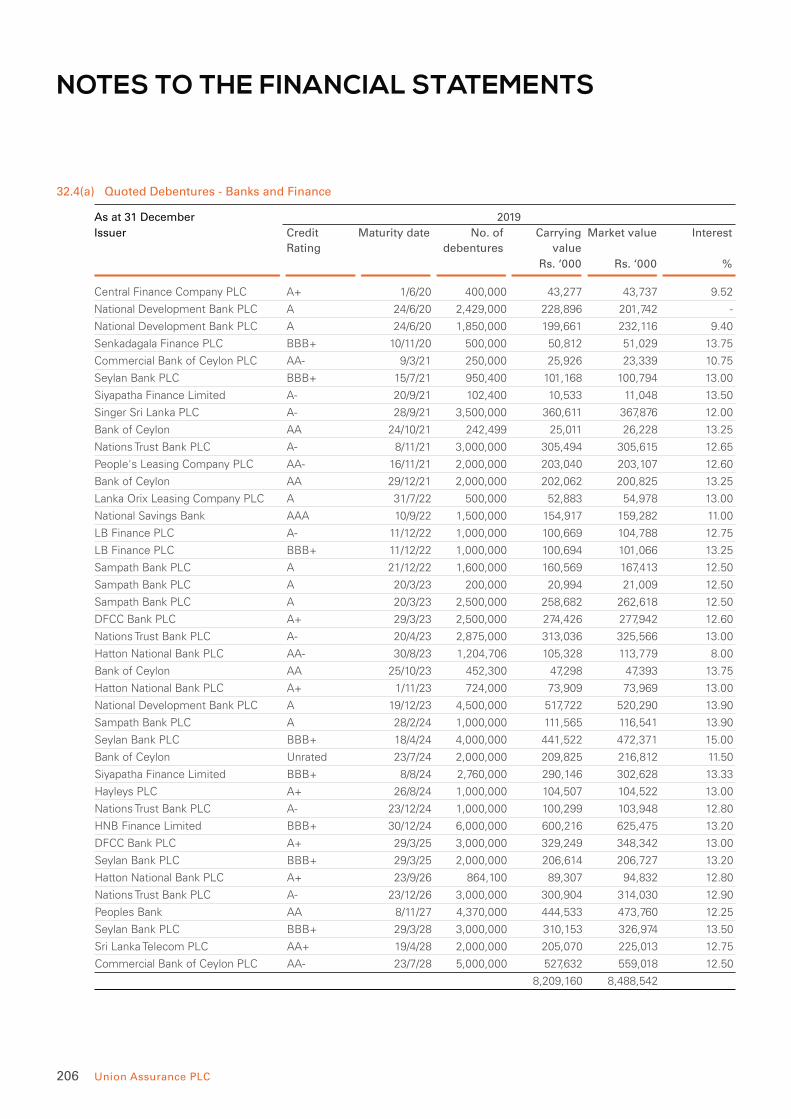
206 Union Assurance PLC
NOTES TO THE FINANCIAL STATEMENTS
32.4(a) Quoted Debentures - Banks and Finance
As at 31 December 2019
Issuer Credit
Rating
Maturity date No. of
debentures
Carrying
value
Market value Interest
Rs. ‘000 Rs. ‘000 %
Central Finance Company PLC A+ 1/6/20 400,000 43,277 43,737 9.52
National Development Bank PLC A 24/6/20 2,429,000 228,896 201,742 -
National Development Bank PLC A 24/6/20 1,850,000 199,661 232,116 9.40
Senkadagala Finance PLC BBB+ 10/11/20 500,000 50,812 51,029 13.75
Commercial Bank of Ceylon PLC AA- 9/3/21 250,000 25,926 23,339 10.75
Seylan Bank PLC BBB+ 15/7/21 950,400 101,168 100,794 13.00
Siyapatha Finance Limited A- 20/9/21 102,400 10,533 11,048 13.50
Singer Sri Lanka PLC A- 28/9/21 3,500,000 360,611 367,876 12.00
Bank of Ceylon AA 24/10/21 242,499 25,011 26,228 13.25
Nations Trust Bank PLC A- 8/11/21 3,000,000 305,494 305,615 12.65
People's Leasing Company PLC AA- 16/11/21 2,000,000 203,040 203,107 12.60
Bank of Ceylon AA 29/12/21 2,000,000 202,062 200,825 13.25
Lanka Orix Leasing Company PLC A 31/7/22 500,000 52,883 54,978 13.00
National Savings Bank AAA 10/9/22 1,500,000 154,917 159,282 11.00
LB Finance PLC A- 11/12/22 1,000,000 100,669 104,788 12.75
LB Finance PLC BBB+ 11/12/22 1,000,000 100,694 101,066 13.25
Sampath Bank PLC A 21/12/22 1,600,000 160,569 167,413 12.50
Sampath Bank PLC A 20/3/23 200,000 20,994 21,009 12.50
Sampath Bank PLC A 20/3/23 2,500,000 258,682 262,618 12.50
DFCC Bank PLC A+ 29/3/23 2,500,000 274,426 277,942 12.60
Nations Trust Bank PLC A- 20/4/23 2,875,000 313,036 325,566 13.00
Hatton National Bank PLC AA- 30/8/23 1,204,706 105,328 113,779 8.00
Bank of Ceylon AA 25/10/23 452,300 47,298 47,393 13.75
Hatton National Bank PLC A+ 1/11/23 724,000 73,909 73,969 13.00
National Development Bank PLC A 19/12/23 4,500,000 517,722 520,290 13.90
Sampath Bank PLC A 28/2/24 1,000,000 111,565 116,541 13.90
Seylan Bank PLC BBB+ 18/4/24 4,000,000 441,522 472,371 15.00
Bank of Ceylon Unrated 23/7/24 2,000,000 209,825 216,812 11.50
Siyapatha Finance Limited BBB+ 8/8/24 2,760,000 290,146 302,628 13.33
Hayleys PLC A+ 26/8/24 1,000,000 104,507 104,522 13.00
Nations Trust Bank PLC A- 23/12/24 1,000,000 100,299 103,948 12.80
HNB Finance Limited BBB+ 30/12/24 6,000,000 600,216 625,475 13.20
DFCC Bank PLC A+ 29/3/25 3,000,000 329,249 348,342 13.00
Seylan Bank PLC BBB+ 29/3/25 2,000,000 206,614 206,727 13.20
Hatton National Bank PLC A+ 23/9/26 864,100 89,307 94,832 12.80
Nations Trust Bank PLC A- 23/12/26 3,000,000 300,904 314,030 12.90
Peoples Bank AA 8/11/27 4,370,000 444,533 473,760 12.25
Seylan Bank PLC BBB+ 29/3/28 3,000,000 310,153 326,974 13.50
Sri Lanka Telecom PLC AA+ 19/4/28 2,000,000 205,070 225,013 12.75
Commercial Bank of Ceylon PLC AA- 23/7/28 5,000,000 527,632 559,018 12.50
8,209,160 8,488,542

Union Assurance at a Glance Management Discussion and Analysis Stewardship Financial Statements Supplementary Information
207Annual Report 2020
32.4(b) Impairment of Loans and Receivables Financial Investments
At the reporting date, there were no loans and receivables
financial investments that were overdue and impaired.
32.5 Available for Sale Financial Assets (AFS)
As at 31 December 2020 2019
Rs. ‘000 Rs. ‘000
Fair value
Treasury bonds 7,954,413 7,848,043
Total Available for Sale
Financial investments 7,954,413 7,848,043
32.5(a) Impairment of Available for Sale Financial Investments
At the reporting date, there were no AFS financial
investments that were overdue and impaired.
32.6 Financial Assets at Fair Value Through Profit or Loss (FVTPL)
As at 31 December 2020 2019
Note Rs. ‘000 Rs. ‘000
Fair value
Quoted equities 32.6 (a) 2,884,723 2,059,968
Unit Trusts 1,219,168 152,338
4,103,891 2,212,306
Investments in unit
linked funds
Quoted equities 32.6 (b) 783,223 949,024
Reverse repurchase
agreements 82,998 112,386
Treasury bills - 26,649
Bank deposits 28,444 16,292
Commercial Papers 10,259 -
Quoted debentures 148,433 140,534
1,053,357 1,244,885
Total Fair Value Through
Profit or Loss
financial investments 5,157,248 3,457,191
32.6(a) Quoted Equities - Other than Unit Linked Investments
As at 31 December 2020 2019
No of
shares
Cost Carrying /
Fair Value
No of
shares
Cost Carrying /
Fair Value
Rs. ‘000 Rs. ‘000 Rs. ‘000 Rs. ‘000
Banks
Commercial Bank PLC (non voting) - - - 673,634 48,086 55,912
Commercial Bank of Ceylon PLC 5,932,262 516,264 479,920 863,208 93,883 82,005
Hatton National Bank PLC 3,927,647 587,733 496,847 1,642,838 341,564 282,897
Hatton National Bank PLC (non voting) - - - 1,545,068 198,479 209,357
Sampath Bank PLC 1,070,088 224,238 145,104 2,512,761 601,607 408,072
DFCC Bank PLC - - - 391,520 65,589 35,980
National Development Bank PLC - - - 1,291,100 203,716 129,110
Seylan Bank PLC (Non Voting) - - - 683,973 34,854 23,118
Seylan Bank PLC - - - 483,178 38,918 25,367
1,328,235 1,121,871 1,626,696 1,251,818
Diversified Financials
Central Finance Company PLC - - - 437,028 40,235 45,451
People's Leasing & Finance PLC - - - 3,937,398 68,951 70,479
- - 109,186 115,930
Capital Goods
Access Engineering PLC - - - 2,965,739 74,852 64,653
Hemas Holdings PLC 1,649,795 110,843 164,815 556,323 20,297 44,506
John Keells Holdings PLC 3,553,161 427,662 531,553 - - -
538,505 696,368 95,149 109,159
Consumer Durables & Apparel
Hayleys Fabric PLC 1,599,464 36,873 44,465 - - -
Teejay Lanka PLC 5,508,793 149,934 209,334 2,782,495 74,831 113,526
186,807 253,799 74,831 113,526
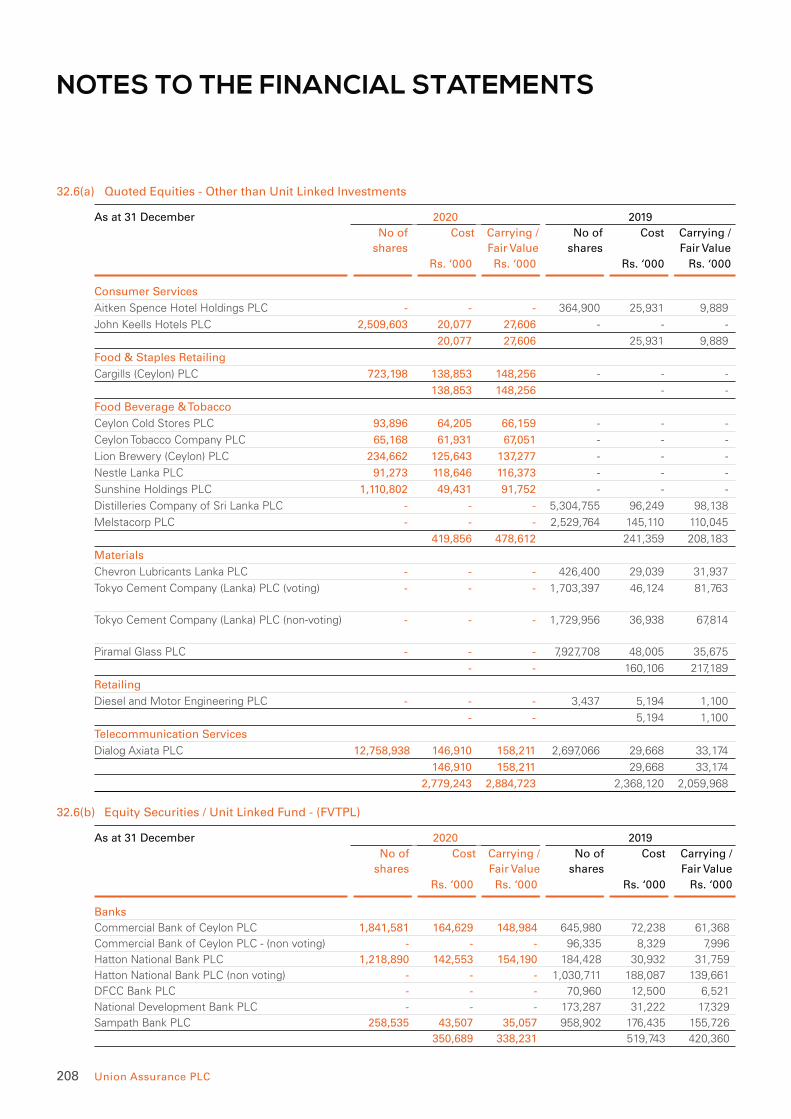
208 Union Assurance PLC
NOTES TO THE FINANCIAL STATEMENTS
32.6(a) Quoted Equities - Other than Unit Linked Investments
As at 31 December 2020 2019
No of
shares
Cost Carrying /
Fair Value
No of
shares
Cost Carrying /
Fair Value
Rs. ‘000 Rs. ‘000 Rs. ‘000 Rs. ‘000
Consumer Services
Aitken Spence Hotel Holdings PLC - - - 364,900 25,931 9,889
John Keells Hotels PLC 2,509,603 20,077 27,606 - - -
20,077 27,606 25,931 9,889
Food & Staples Retailing
Cargills (Ceylon) PLC 723,198 138,853 148,256 - - -
138,853 148,256 - -
Food Beverage & Tobacco
Ceylon Cold Stores PLC 93,896 64,205 66,159 - - -
Ceylon Tobacco Company PLC 65,168 61,931 67,051 - - -
Lion Brewery (Ceylon) PLC 234,662 125,643 137,277 - - -
Nestle Lanka PLC 91,273 118,646 116,373 - - -
Sunshine Holdings PLC 1,110,802 49,431 91,752 - - -
Distilleries Company of Sri Lanka PLC - - - 5,304,755 96,249 98,138
Melstacorp PLC - - - 2,529,764 145,110 110,045
419,856 478,612 241,359 208,183
Materials
Chevron Lubricants Lanka PLC - - - 426,400 29,039 31,937
Tokyo Cement Company (Lanka) PLC (voting) - - - 1,703,397 46,124 81,763
Tokyo Cement Company (Lanka) PLC (non-voting) - - - 1,729,956 36,938 67,814
Piramal Glass PLC - - - 7,927,708 48,005 35,675
- - 160,106 217,189
Retailing
Diesel and Motor Engineering PLC - - - 3,437 5,194 1,100
- - 5,194 1,100
Telecommunication Services
Dialog Axiata PLC 12,758,938 146,910 158,211 2,697,066 29,668 33,174
146,910 158,211 29,668 33,174
2,779,243 2,884,723 2,368,120 2,059,968
32.6(b) Equity Securities / Unit Linked Fund - (FVTPL)
As at 31 December 2020 2019
No of
shares
Cost Carrying /
Fair Value
No of
shares
Cost Carrying /
Fair Value
Rs. ‘000 Rs. ‘000 Rs. ‘000 Rs. ‘000
Banks
Commercial Bank of Ceylon PLC 1,841,581 164,629 148,984 645,980 72,238 61,368
Commercial Bank of Ceylon PLC - (non voting) - - - 96,335 8,329 7,996
Hatton National Bank PLC 1,218,890 142,553 154,190 184,428 30,932 31,759
Hatton National Bank PLC (non voting) - - - 1,030,711 188,087 139,661
DFCC Bank PLC - - - 70,960 12,500 6,521
National Development Bank PLC - - - 173,287 31,222 17,329
Sampath Bank PLC 258,535 43,507 35,057 958,902 176,435 155,726
350,689 338,231 519,743 420,360

Union Assurance at a Glance Management Discussion and Analysis Stewardship Financial Statements Supplementary Information
209Annual Report 2020
As at 31 December 2020 2019
No of
shares
Cost Carrying /
Fair Value
No of
shares
Cost Carrying /
Fair Value
Rs. ‘000 Rs. ‘000 Rs. ‘000 Rs. ‘000
Diversified Financials
Central Finance Company PLC - - - 164,450 15,191 17,103
People's Leasing & Finance PLC - - - 715,472 12,096 12,807
- - 27,287 29,910
Capital Goods
Hemas Holdings PLC 359,291 24,477 35,893 1,572,569 155,360 125,806
John Keells Holdings PLC 994,220 127,480 148,735 396,725 58,206 66,491
151,957 184,628 213,566 192,297
Consumer Durables & Apparel
Hayleys Fabric PLC 408,842 9,532 11,366 - - -
Teejay Lanka PLC 1,604,590 52,168 60,974 2,701,518 99,637 110,222
61,700 72,340 99,637 110,222
Consumer Services
Aitken Spence Hotel Holdings PLC - - - 125,493 9,003 3,401
- - 9,003 3,401
Food & Staples Retailing
Cargills (Ceylon) PLC 136,588 26,181 28,001 - - -
26,181 28,001 - -
Food Beverage & Tobacco
Ceylon Cold Stores PLC 9,288 6,786 6,544 - - -
Ceylon Tobacco Company PLC 18,812 17,777 19,356 - - -
Distilleries Company of Sri Lanka PLC - - - 257,644 4,215 4,766
Lion Brewery (Ceylon) PLC 5,752 2,999 3,364 - - -
Melstacorp PLC - - - 173,690 8,976 7,556
Nestle Lanka PLC 61,399 99,596 78,284 82,311 136,636 106,988
Sunshine Holdings PLC 487,092 21,676 40,234 - - -
148,834 147,782 149,827 119,310
Telecommunication Services
Dialog Axiata PLC 987,158 11,822 12,241 - - -
11,822 12,241 - -
Materials
Tokyo Cement Company (Lanka) PLC (voting) - - - 349,177 6,898 13,687
Tokyo Cement Company (Lanka) PLC (non-voting) - - - 1,070,125 30,640 51,366
Piramal Glass PLC - - - 1,882,584 11,065 8,471
- - 48,603 73,524
751,183 783,223 1,067,666 949,024
(%)
24
9
4
2
19
43
BanksDiversified FinancialsCapital GoodsConsumer Durables & ApparelConsumer ServicesFood & Staples RetailingFood Beverage & TobaccoTelecommunication ServicesMaterials
Equity Securities / Unit Linked Fund - (FVTPL)
12
13
8
44
320
2020 2019

210 Union Assurance PLC
NOTES TO THE FINANCIAL STATEMENTS
32.6 (c) Impairment of Fair Value Through Profit or Loss Financial Investments
At the reporting date, there were no fair value through profit or loss financial investments that were overdue and impaired.
32.7 Movement of Financial Investments
Rs.’000 Held to
maturity
Loans and
receivables
Available
for sale
Fair value
through
profit or loss
Total
As at 1 January 2019 19,261,339 7,644,568 8,603,633 3,628,533 39,138,073
Purchases 3,152,661 5,853,549 292,134 3,110,132 12,408,476
Maturities (2,198,549) (307,996) (1,062,335) (2,193,913) (5,762,793)
Disposals - - (526,672) (854,048) (1,380,720)
Scrip Dividend - - - 62,705 62,705
Fair value losses recorded in statement
of income (excluding net realised gains)
classified as held for trading - - - (302,436) (302,436)
Fair value gains recorded in OCI - - 559,563 - 559,563
Amortisation 104,949 61,991 31,592 5,856 204,388
Net change in accrued Interest 55,903 (52,454) (49,872) 362 (46,061)
As at 31 December 2019 20,376,303 13,199,658 7,848,043 3,457,191 44,881,195
As at 1 January 2020 20,376,303 13,199,658 7,848,043 3,457,191 44,881,195
Purchases 3,891,616 6,611,471 864,719 4,554,464 15,922,270
Maturities (1,050,000) (3,003,890) (975,000) (101,198) (5,130,088)
Disposals (1,190,345) - (454,341) (3,067,531) (4,712,217)
Scrip Dividend - - - 34,162 34,162
Fair value losses recorded in statement
of income (excluding net realised gains)
classified as held for trading - - - 277,179 277,179
Fair value gains recorded in OCI - - 658,274 - 658,274
Amortisation 60,167 12,361 15,640 334 88,502
Net change in accrued Interest 72,678 264,528 (2,922) 2,647 336,931
As at 31 December 2020 22,160,419 17,084,128 7,954,413 5,157,248 52,356,208
33 LOANS TO LIFE POLICYHOLDERSSee accounting policy in Note 26.
Policyholder loans are granted up to 90% of the surrender
value of a life insurance policy at a rate equivalent to
market rate. Policyholder loans are initially measured at
fair value and subsequently measured at the amortised
cost. If the policyholder dies before the full repayment
of the loan, the loan balance is deducted from the death
benefit.
2020 2019
Rs. ‘000 Rs. ‘000
Balance as at 1 January 1,249,822 956,638
Loans granted during the year 607,323 630,532
Repayments during the year (443,679) (337,348)
Provision for Period - -
1,413,466 1,249,822
Interest receivables on loans to
life policyholders 380,004 305,937
Balance as at 31 December 1,793,470 1,555,759

Union Assurance at a Glance Management Discussion and Analysis Stewardship Financial Statements Supplementary Information
211Annual Report 2020
33.1 Collateral Details
As at 31 December 2020 surrender value of policyholder
loans amounted to Rs.2,888 million (2019 - Rs.2,544
million).
If the total receivable of the loan, including interest due
and accrued exceeds the cash surrender value, the policy
terminates and becomes void.
The Company has a first lien on all policies which are
subject to policy loans. This mitigates the Company’s
credit exposure on policy loans.
33.2 Fair Value of Loans to Life Policyholders
The fair value of the policyholder loans are equal to its
carrying value as those are given at competitive market
rates.
33.3 Concentration Risk of Loans to Life Policyholders
There is lower concentration of credit risk with respect
to policyholders, as the Company has a large number of
dispersed receivables.
33.4 Impairment of Loans to Life Policyholders
Policyholder loans are reviewed for impairment at each
reporting date. As of 31 December 2020, there were no
impaired loss recorded on policyholder loans (2019 - Nil).
33.5 Number of Policy Loans
Number of policy loans due as at 31 December 2020 was
16,789 (2019 - 20,085).
34 REINSURANCE RECEIVABLE Accounting Policy
See accounting policy in Note 26.
The Company cedes insurance risk in the normal course
of business for all of its Insurance Contracts. Reinsurance
assets represent balances due from reinsurance
companies. Amounts recoverable from reinsurers are
estimated in a manner consistent with the outstanding
claims provision or settled claims associated with the
reinsurer’s policies and are in accordance with the related
reinsurance contract. Reinsurance is recorded gross in
the statement of financial position unless a right to offset
exists.
Reinsurance assets are reviewed for impairment at each
reporting date or more frequently when an indication of
impairment arises during the reporting year. Impairment
occurs when there is objective evidence as a result of
an event that occurred after initial recognition of the
reinsurance asset that the Company may not receive
all outstanding amounts due under the terms of the
contract, and the event has a reliably measurable impact
on the amounts that the Company will receive from the
reinsurer. The impairment loss is recorded in the income
statement.
Reinsurance assets are derecognised when the
contractual rights are extinguished or expired.
As at 31 December 2020 2019
Rs. ‘000 Rs. ‘000
Reinsurance receivable on
outstanding claims
107,845 132,847
Reinsurance receivable on
settled claims
384,166 370,128
Total reinsurance receivable 492,011 502,975
34.1 Impairment of Reinsurance Receivable
The Board of Directors has assessed potential impairment
loss of reinsurance receivable as at 31 December 2020.
Based on the assessment, there was no impairment loss
on reinsurance receivable.
34.2 Fair Value of Reinsurance Receivable
The carrying values disclosed above approximate the fair
value at the reporting date.
34.3 The Ageing of Reinsurance Receivable on Paid Claims
As at 31 December 2020 2019
Rs. ‘000 Rs. ‘000
Less than 60 days 37,153 54,092
More than 60 days 347,013 316,036
384,166 370,128
34.4 Reinsurance Receivable Past Due but Not Impaired (On Paid Claims)
As at 31 December 2020, reinsurance receivable of
Rs. 347 million (2018 - Rs. 316 million) were past due but
not impaired. These relate to parties where there were no
recent history of default.
34.5 Collateral Details
The Company does not hold any collateral as security
against potential default by reinsurance counter parties.
34.6 Reinsurance Receivable on Outstanding Claims
This includes reinsurance reserves on claims that has not
been paid and the reinsurance receivable has not been
received.
34.7 Risk Management
Refer Note 8.1(c) to the financial statements for risk
management initiatives relating to reinsurance.

212 Union Assurance PLC
NOTES TO THE FINANCIAL STATEMENTS
35 PREMIUMS RECEIVABLE Accounting Policy
See accounting policy in Note 26.
Premiums receivable are recognised when due and
measured on initial recognition at the fair value of the
consideration received or receivable. The carrying value
of premiums receivable is reviewed for impairment
whenever events or circumstances indicate that the
carrying amount may not be recoverable.
Impairment losses on premiums receivable are the
difference between the carrying amount and the
recoverable amount. The impairment losses are
recognised in the income statement.
The life insurance premiums for policies within the 30 day
grace period are considered as due premium, subject to
a provision for premium default. Premium default ratio is
computed by analysing the default history. Commission
and reinsurance premium relating to that accrued income
are also recorded in the same manner.
As at 31 December 2020 2019
Rs. ‘000 Rs. ‘000
Premiums receivable from;
Policyholders 242,170 214,855
Intermediaries (Including
collections in transit) 134,553 129,930
Total premiums receivable 376,723 344,785
35.1 Fair Value of Premiums Receivable
The carrying amount disclosed above approximates the
fair value at the reporting date.
35.2 Impairment of Premiums Receivable
The Management has assessed potential impairment loss
of premiums receivable as at 31 December 2020. Based
on the assessment, there was no impairment loss on
premiums receivable (2019 - Nil).
35.3 Collateral Details
The Company does not hold any collateral as security
against potential default by policyholders or intermediaries.
35.4 Risk Management Initiatives Relating to Premiums Receivable
Refer Note 8.2(c) to the financial statements for
risk management initiatives relating to premiums
receivable.
36 RECEIVABLES AND OTHER ASSETS Accounting Policy
See accounting policy in Note 26.
Staff / Agent Loans
Loans are granted as a benefit to Staff and Advisors
subject to defined eligibility criteria. These are measured
at amortised cost based on the prevailing interest rates at
the loan grant date. Impairment test of loans are carried
out when the indicators of impairment exist.
Inventories
Inventories are measured at the lower of cost or net
realisable value. Cost is generally determined by reference
to weighted average cost. Net realisable value is the
estimated market price in the ordinary course of business
less any estimated expense to sell.
As at 31 December 2020 2019
Note Rs. ‘000 Rs. ‘000
Financial Assets
Staff loans* 36.1 323,493 306,914
Agent loans 36.2 158,015 196,944
Refundable deposits 25,040 22,748
Amounts due from
Related parties
Parent Company - John
Keells Holdings PLC - -
Other related parties - -
Other receivables 130,685 36,770
637,233 563,376
Non Financial Assets
Taxes recoverable 36.5 271,547 630,098
Prepayments 120,008 151,300
Inventories 14,231 34,316
Advance payments 253,137 69,406
Other receivables 4,389 4,389
663,312 889,509
Total receivables and
other assets 1,300,545 1,452,885

Union Assurance at a Glance Management Discussion and Analysis Stewardship Financial Statements Supplementary Information
213Annual Report 2020
36.1 Staff Loans
As at 31 December 2020 2019
Note Rs. ‘000 Rs. ‘000
Balance as at
1 January 311,159 284,546
Loans provided during
the year 150,950 159,744
Payments / settlements
during the year (121,292) (108,262)
Fair value adjustment
during the year (3,049) (24,869)
337,768 311,159
Provision for impairment 36.1(a) (14,275) (4,245)
Balance as at
31 December 323,493 306,914
36.1(a) Provision for Impairment
2020 2019
Rs. ‘000 Rs. ‘000
Balance as at 1 January 4,245 358
Charge for the year 10,030 3,887
Balance as at 31 December 14,275 4,245
36.2 Agent Loans
As at 31 December 2020 2019
Note Rs. ‘000 Rs. ‘000
Balance as at
1 January 236,836 221,141
Loans provided
during the year 70,343 95,705
Payments /
settlements during
the year (110,976) (80,010)
196,203 236,836
Provision for
impairment 36.2(a) (38,188) (39,892)
Balance as at
31 December 158,015 196,944
36.2(a) Provision for Impairment
As at 31 December 2020 2019
Rs. ‘000 Rs. ‘000
Balance as at 1 January 39,892 8,157
Charge for the year (1,704) 31,735
Balance as at 31 December 38,188 39,892
36.3 Impairment of Staff and Agent Loans
The Management has assessed potential impairment loss
of staff and agent loans as at 31 December 2020. Based
on the assessment, no additional impairment provision is
required to be made in the financial statements as at the
reporting date in respect of staff and agent loans, other
than the amounts provided in Note 36.1(a) and 36.2(a).
36.4 Loans Granted to Directors
*No loans have been granted to Directors of the Company.
36.5 Taxes Recoverable
As at 31 December 2020 2019
Note Rs. ‘000 Rs. ‘000
ACT recoverable 92,296 92,296
WHT recoverable 171,109 170,551
Notional tax receivable 36.5(a) - 341,304
ESC receivable 8,142 25,947
271,547 630,098
36.5(a) Notional Taxes Recoverable
As at 31 December 2020 2019
Rs. ‘000 Rs. ‘000
Balance as at 1 January 341,304 541,304
Impairment during the year (267,573) (200,000)
Notional tax utilised during the
year (73,731) -
Balance as at 31 December - 341,304
36.6 Fair Value
The fair value of staff loans are based on discounted cash
flows. Discount rate is equal to AWPLR plus appropriate
risk margin. The fair values of agent / advisor loans are
equal to the carrying amount as they are granted at
competitive market rates.
36.7 Risk Management Policies / Initiatives
Refer Note 8.2(c) to the financial statements for risk
management policies / initiatives relating to other financial
assets.
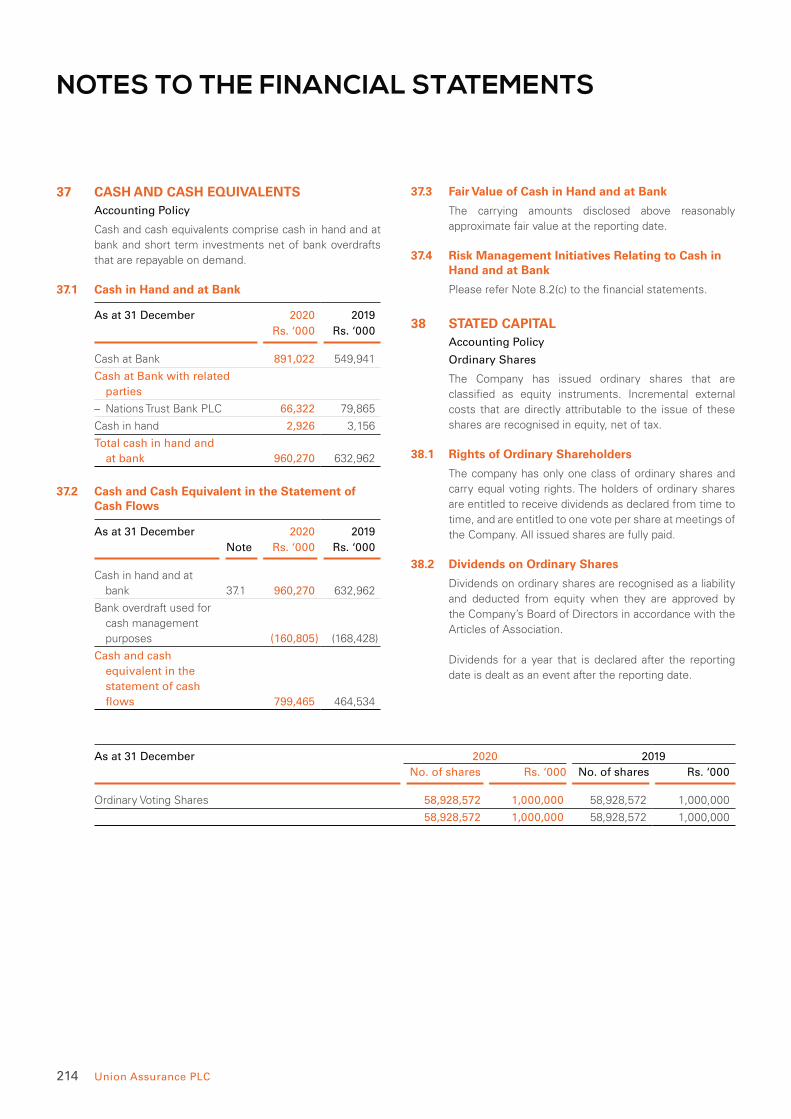
214 Union Assurance PLC
NOTES TO THE FINANCIAL STATEMENTS
37 CASH AND CASH EQUIVALENTS Accounting Policy
Cash and cash equivalents comprise cash in hand and at
bank and short term investments net of bank overdrafts
that are repayable on demand.
37.1 Cash in Hand and at Bank
As at 31 December 2020 2019
Rs. ‘000 Rs. ‘000
Cash at Bank 891,022 549,941
Cash at Bank with related
parties
– Nations Trust Bank PLC 66,322 79,865
Cash in hand 2,926 3,156
Total cash in hand and
at bank 960,270 632,962
37.2 Cash and Cash Equivalent in the Statement of Cash Flows
As at 31 December 2020 2019
Note Rs. ‘000 Rs. ‘000
Cash in hand and at
bank 37.1 960,270 632,962
Bank overdraft used for
cash management
purposes (160,805) (168,428)
Cash and cash
equivalent in the
statement of cash
flows 799,465 464,534
37.3 Fair Value of Cash in Hand and at Bank
The carrying amounts disclosed above reasonably
approximate fair value at the reporting date.
37.4 Risk Management Initiatives Relating to Cash in Hand and at Bank
Please refer Note 8.2(c) to the financial statements.
38 STATED CAPITAL Accounting Policy
Ordinary Shares
The Company has issued ordinary shares that are
classified as equity instruments. Incremental external
costs that are directly attributable to the issue of these
shares are recognised in equity, net of tax.
38.1 Rights of Ordinary Shareholders
The company has only one class of ordinary shares and
carry equal voting rights. The holders of ordinary shares
are entitled to receive dividends as declared from time to
time, and are entitled to one vote per share at meetings of
the Company. All issued shares are fully paid.
38.2 Dividends on Ordinary Shares
Dividends on ordinary shares are recognised as a liability
and deducted from equity when they are approved by
the Company’s Board of Directors in accordance with the
Articles of Association.
Dividends for a year that is declared after the reporting
date is dealt as an event after the reporting date.
As at 31 December 2020 2019
No. of shares Rs. ‘000 No. of shares Rs. ‘000
Ordinary Voting Shares 58,928,572 1,000,000 58,928,572 1,000,000
58,928,572 1,000,000 58,928,572 1,000,000

Union Assurance at a Glance Management Discussion and Analysis Stewardship Financial Statements Supplementary Information
215Annual Report 2020
39 AVAILABLE FOR SALE RESERVE Nature and purpose of reserve
The Available for Sale reserves comprises the cumulative
net change in the fair value of Available for Sale financial
assets until the assets are derecognised or impaired.
As at 31 December 2020 2019
Note Rs. ‘000 Rs. ‘000
Balance as at 1 January 529,468 (85,386)
Net change in fair value
of AFS financial assets 372,629 290,225
Net change in fair value
of AFS financial assets
transferred to the
income statement 39.1 - (6,207)
372,629 284,018
Net change in liabilities
of insurance contracts
arising from fair
value changes in AFS
financial assets 314,921 275,545
Net change in liabilities
of insurance contracts
arising from fair
value changes in
AFS financial assets
transferred to the
income statement 39.1 (24,081) 42,057
290,840 317,602
Share of gains/ (losses)
on AFS assets of
equity accounted
investee 26,915 13,234
Related tax - -
Balance as at
31 December 1,219,852 529,468
39.1 Net change in fair value transferred to the income statement
As at 31 December 2020 2019
Rs. ‘000 Rs. ‘000
Net change in fair value of AFS
financial assets - (6,207)
Net change in liabilities of
insurance contracts arising
from fair value changes in
AFS financial assets (24,081) 42,057
Balance as at 31 December (24,081) 35,850
40 REVALUATION RESERVE Nature and purpose of reserve
On revaluation of an asset, any increase in the carrying
amount is recognised in revaluation reserve in equity
through OCI or used to reverse a previous loss on
revaluation of the same asset, which was charged to the
Income Statement. In this circumstance, the increase is
recognised as income only to the extent of the previous
write down in value. Any decrease in the carrying amount
is recognised as an expense in the Income Statement
or charged to revaluation reserve in equity through OCI,
only to the extent of any credit balance existing in the
revaluation reserve in respect of that asset. Any balance
remaining in the revaluation reserve in respect of an asset,
is transferred directly to retained earnings on retirement
or disposal of the asset.
Life Policy Holders’ Revaluation Reserve
2020 2019
Note Rs. ‘000 Rs. ‘000
Balance as at 1 January 1,613,544 1,214,876
Revaluation surplus
during the year 28.9 - 403,283
Adjustment for deferred
tax - -
Net gain on revaluation
of land and buildings 1,613,544 1,618,159
Depreciation transfer
during the year (3,716) (4,615)
1,609,828 1,613,544
Unrealised gain reserve 40.1 475,860 475,860
Balance as at
31 December 2,085,688 2,089,404
The revaluation relates to land and building as indicated
in Note 28.
40.1 Unrealised Gain Reserve
Unrealised gain reserve comprises of the gain from
transferring the investment of Cornhill (Private) Limited
to life policyholders in 2007, and the gain on transferring
the land and building at Kurunegala in 2011. These gains
will be realised to shareholders when the properties are
disposed and upon declaration of surplus.

216 Union Assurance PLC
NOTES TO THE FINANCIAL STATEMENTS
41 RESTRICTED REGULATORY RESERVEBased on the direction issued by the IRCSL dated 20
March 2018, the Company has transferred Rs. 3,382
million attributable to non - participating and non unit fund
of unit linked business from life policyholder fund to life
shareholder fund (SHF). The distribution of one - off surplus
to shareholders, held as part of the Restricted Regulatory
Reserve, is subject to meeting governance requirements
stipulated by the IRCSL and can only be released upon
receiving approval from the IRCSL. The one - off surplus in
the SHF is represented by government debt securities as
per the direction of the IRCSL [Note 32.2(a)].
As at 31 December 2020 2019
Rs. ‘000 Rs. ‘000
Transfer of one - off surplus
from non participating fund 3,393,900 3,393,900
Transfer from shareholder
fund for the one - off deficit
created in the non unit fund
of unit linked life insurance
contracts (11,966) (11,966)
3,381,934 3,381,934
42 OTHER RESERVES
As at 31 December 2020 2019
Note Rs. ‘000 Rs. ‘000
Reserve on merger
with Cornhill (Private)
Limited 42.1 16,752 16,752
Reserves on retirement
benefit obligation 42.2 (17,717) (23,133)
Employee share based
option 42.3 66,371 58,609
Total other reserves 65,406 52,228
42.1 Reserve on Merger with Cornhill (Private) Limited
The unrealised gain reflects the net result of the merger
of the Company and Cornhill (Private) Limited. The
investment in Cornhill (Private) Limited was absorbed by
merging all assets and liabilities into the life policyholders’
statement of financial position.
42.2 Reserves on Retirement Benefit Obligation
Refer Note 47 for Accounting Policies.
2020 2019
Rs. ‘000 Rs. ‘000
Balance as at 1 January (23,133) (4,767)
Actuarial gains / (losses) on
defined benefit plan 7,730 (15,969)
Share of actuarial losses on
defined benefit plan of equity
accounted investee (2,314) (2,397)
Related tax - -
Balance as at 31 December (17,717) (23,133)
42.3 Employee Share Based Option Accounting Policy
Employees receive remuneration in the form of share
based payment transactions, whereby employees render
services as consideration for equity instruments (equity
settled transactions). The cost of the employee services
received in respect of the shares or share options granted
is recognised in the income statement over the period
that employees provide services, from the time when the
award is granted up to the vesting date of the options. The
overall cost of the award is calculated using the number
of share options expected to vest and the fair value of the
options at the date of grant.
Equity Settled Transactions
The cost of equity settled transactions is recognised,
together with a corresponding increase in other
capital reserves in equity, over the period in which
the performance and service conditions are fulfilled.
The cumulative expense recognised for equity settled
transactions at each reporting date until the vesting
date reflects the extent to which the vesting period
has expired and the best estimate of the number of
equity instruments that will ultimately vest. The income
statement expense or credit for a period represents the
movement in cumulative expense recognised as at the
beginning and end of that period and is recognised in
employee benefits expense.
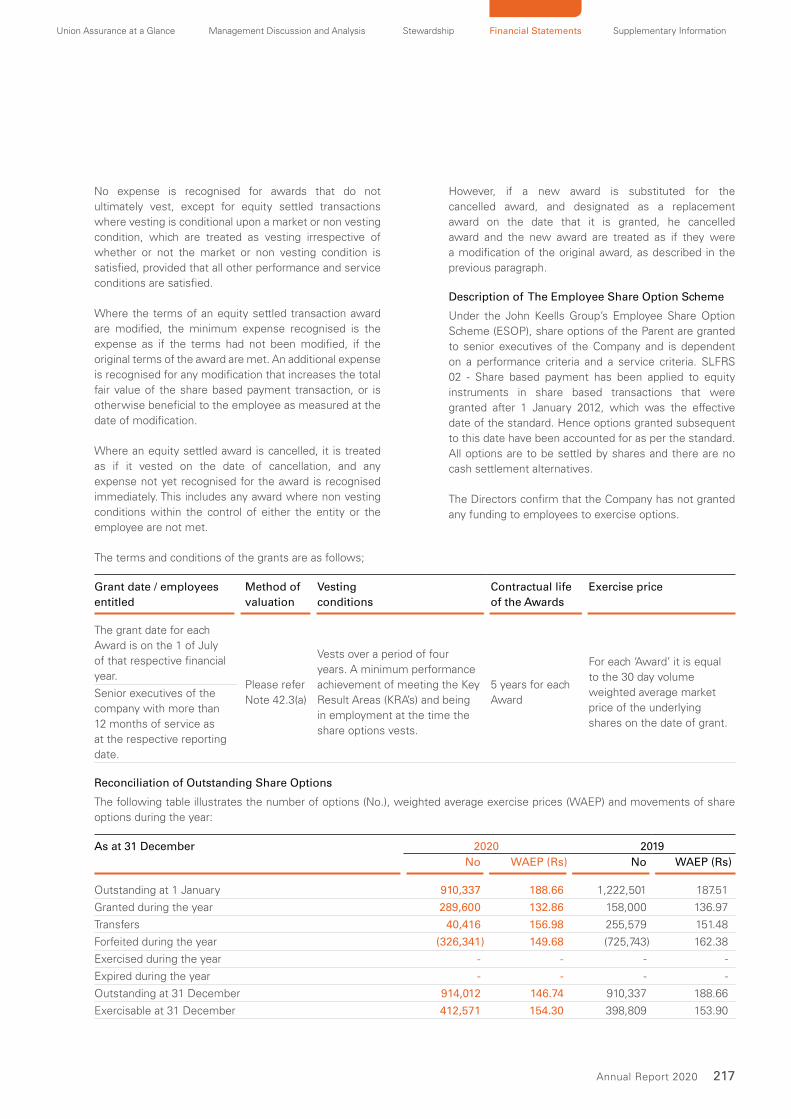
Union Assurance at a Glance Management Discussion and Analysis Stewardship Financial Statements Supplementary Information
217Annual Report 2020
No expense is recognised for awards that do not
ultimately vest, except for equity settled transactions
where vesting is conditional upon a market or non vesting
condition, which are treated as vesting irrespective of
whether or not the market or non vesting condition is
satisfied, provided that all other performance and service
conditions are satisfied.
Where the terms of an equity settled transaction award
are modified, the minimum expense recognised is the
expense as if the terms had not been modified, if the
original terms of the award are met. An additional expense
is recognised for any modification that increases the total
fair value of the share based payment transaction, or is
otherwise beneficial to the employee as measured at the
date of modification.
Where an equity settled award is cancelled, it is treated
as if it vested on the date of cancellation, and any
expense not yet recognised for the award is recognised
immediately. This includes any award where non vesting
conditions within the control of either the entity or the
employee are not met.
However, if a new award is substituted for the
cancelled award, and designated as a replacement
award on the date that it is granted, he cancelled
award and the new award are treated as if they were
a modification of the original award, as described in the
previous paragraph.
Description of The Employee Share Option Scheme
Under the John Keells Group’s Employee Share Option
Scheme (ESOP), share options of the Parent are granted
to senior executives of the Company and is dependent
on a performance criteria and a service criteria. SLFRS
02 - Share based payment has been applied to equity
instruments in share based transactions that were
granted after 1 January 2012, which was the effective
date of the standard. Hence options granted subsequent
to this date have been accounted for as per the standard.
All options are to be settled by shares and there are no
cash settlement alternatives.
The Directors confirm that the Company has not granted
any funding to employees to exercise options.
The terms and conditions of the grants are as follows;
Grant date / employees
entitled
Method of
valuation
Vesting
conditions
Contractual life
of the Awards
Exercise price
The grant date for each
Award is on the 1 of July
of that respective financial
year.Please refer
Note 42.3(a)
Vests over a period of four
years. A minimum performance
achievement of meeting the Key
Result Areas (KRA’s) and being
in employment at the time the
share options vests.
5 years for each
Award
For each ‘Award’ it is equal
to the 30 day volume
weighted average market
price of the underlying
shares on the date of grant.
Senior executives of the
company with more than
12 months of service as
at the respective reporting
date.
Reconciliation of Outstanding Share Options
The following table illustrates the number of options (No.), weighted average exercise prices (WAEP) and movements of share
options during the year:
As at 31 December 2020 2019
No WAEP (Rs) No WAEP (Rs)
Outstanding at 1 January 910,337 188.66 1,222,501 187.51
Granted during the year 289,600 132.86 158,000 136.97
Transfers 40,416 156.98 255,579 151.48
Forfeited during the year (326,341) 149.68 (725,743) 162.38
Exercised during the year - - - -
Expired during the year - - - -
Outstanding at 31 December 914,012 146.74 910,337 188.66
Exercisable at 31 December 412,571 154.30 398,809 153.90

218 Union Assurance PLC
NOTES TO THE FINANCIAL STATEMENTS
42.3(a) Employee Expenses for Share Based Payment Transactions
The expense recognised for employee services received
during the year is as follows;
2020 2019
Rs. ‘000 Rs. ‘000
Balance as at 1 January 58,609 46,625
Expense arising from equity
settled share-based payment
transactions 7,762 11,984
Balance as at 31 December 66,371 58,609
The expense recognised for employee services is based
on the Parent company’s best estimate of the number of
options that will ultimately vest. No expense is recognised
for Awards that do not ultimately vest.
42.3(b) Fair Value of the Share Options and Assumptions
The fair value of the share options is estimated at the
grant date using a binomial option pricing model, taking
into account the terms and conditions upon which the
share options were granted.
43 RETAINED EARNINGS
2020 2019
Note Rs. ‘000 Rs. ‘000
Balance as at
1 January 7,609,868 7,625,794
Profit for the year 920,596 1,158,030
Transfer from revaluation
reserve to retained
earnings, net of tax 40 3,716 4,615
First and final dividends
2019 / 2018 25.1 (1,178,571) (1,178,571)
Balance as at
31 December 7,355,609 7,609,868
44 INSURANCE CONTRACT LIABILITIES Accounting Policy
44.1 Recognition and Measurement
Life insurance contract liabilities are recognised when
contracts are entered into and premiums are charged.
These liabilities are measured by using the gross
premium valuation method as prescribed by the
Regulation of Insurance Industry Act No. 43 of 2000.
The liability is determined as the discounted value
of the expected contractual cash outflows less the
discounted value of the expected premiums. Valuation
assumptions are derived based on the best estimate
experience with a prescribed risk margin to allow for
adverse deviations. Non participating liabilities are
discounted using the risk free yields.
The value of participating policy liabilities is the higher of
the value of the guaranteed benefits liability and the total
benefits liability, derived at the participating insurance
fund level. In calculating the guaranteed benefits liability,
only the guaranteed benefits are considered and the
cashflows are discounted using the risk free interest
rate yield curve. Total benefits liability includes all the
guaranteed and non guaranteed benefits, and discounted
cash flows using the fund based yield of the participating
insurance fund.
44.2 Use of Judgements and Estimates
44.2(a) Product Classification
SLFRS 4 requires contracts written by insurers to be
classified as either insurance contracts or investment
contracts depending on the level of insurance risk
transferred.
Insurance contracts are contracts under which one party
(the Insurer) accepts significant insurance risk from
another party (the policyholder) by agreeing to compensate
the policyholder if a specified uncertain future event
(the insured event) adversely affects the policyholder.
Significant insurance risk exists if an insured event could
cause an insurer to pay significant additional benefits in
any scenario, excluding scenarios that lack commercial
substance (i.e. have no discernible effect on the economics
of the transaction). The classification of contracts identifies
both the insurance contracts that the Company issues and
reinsurance contracts that the Company holds.
Contracts where the Company does not assume a
significant insurance risk is classified as investment
contracts.
Investment contracts are those contracts that transfer
significant financial risks and no significant insurance risks.
Financial risk is the risk of a possible future change in one
or more of a specified interest rates, financial instrument
prices, commodity prices, foreign exchange rates, index
of price or rates, credit ratings or credit index or other
variables, provided in the case of a non financial variable
that the variable is not specific to a party to the contract.
Once a contract has been classified as an insurance
contract, it remains an insurance contract for the remainder
of its lifetime, even if the insurance risk reduces significantly
during this period, unless all rights and obligations are
extinguished or expired. Investment contracts can,
however, be reclassified as insurance contracts after
inception if insurance risk becomes significant.
Union Assurance at a Glance Management Discussion and Analysis Stewardship Financial Statements Supplementary Information
219Annual Report 2020
Insurance and investment contracts are further classified
as being either with or without discretionary participating
features.
Discretionary Participating Features (DPF)
DPF is a contractual right to receive, as a supplement to
guaranteed benefits, additional benefits that;
• are likely to be a significant portion of the total
contractual benefits;
• the amount or timing of which is contractually at the
discretion of the issuer; and contractually based on:
• The performance of a specified pool of contracts or a
specified type of contract,
• Realised and or unrealised investment returns on a
specified pool of assets held by the issuer, and
• The profit or loss of the company, fund or other entity
that issues the contract.
Derivatives embedded in an insurance contract or an
investment contract with DPF are separated and fair valued
through the income statement unless the embedded
derivative itself is an insurance contract or investment
contract with DPF. The derivative is also not separated if
the host insurance contract and / or investment contract
with DPF is measured at fair value through the profit and
loss.
IRCSL regulations and the terms and conditions of these
contracts set out the bases for the determination of the
amounts on which the additional discretionary benefits
are based (the DPF eligible surplus) and within which the
Company may exercise its discretion as to the quantum
and timing of their payment to contract holders. At least
90% of the eligible surplus must be attributed to contract
holders as a group (which can include future contract
holders) and the amount and timing of the distribution
to individual contract holders is at the discretion of the
Company, subject to the advice of the appointed actuary.
All DPF liabilities including unallocated surpluses, both
guaranteed and discretionary, at the end of the reporting
period are held within insurance contract liabilities, as
appropriate.
44.2(b) Valuation of Life Insurance Contract Liabilities
Long duration contract liabilities included in the
life insurance fund, result primarily from traditional
participating, non participating life and universal life
insurance products. Short duration contract liabilities are
primarily group term. The actuarial reserves have been
established based on the following;
• Non participating liabilities are discounted using
risk free yield curve provided by the IRCSL and the
participating liabilities are based on the fund yield of
the life fund.
• Mortality rates based on published mortality tables
adjusted for actual experience as required by
regulations issued by the IRCSL.
• Surrender rates based on actual experience.
The amount of policyholder dividend to be paid is
determined annually by the Company. The dividend
includes life policyholders share of net income that is
required to be allocated by the insurance contract.
The main assumptions used relate to mortality, morbidity,
longevity, investment returns, expenses, lapses,
surrender rates and discount rates as further detailed in
notes to the financial statements. For those contracts that
insure risk related to longevity, prudent allowance is made
for expected future mortality improvements, as well as
wide ranging changes to the life style, which could result
in significant changes to the expected future mortality
exposure.
Estimates are also made for future investment income
arising from the assets backing Life Insurance contracts.
These estimates are based on current market returns, as
well as expectations about future economic and financial
developments.
Assumptions on future expenses are based on current
expense levels, adjusted for expected expense inflation,
if appropriate. Lapse and surrender rates are based
on the company’s historical experience of lapses and
surrenders.
There is no material impact on the assumptions used
for the valuation of insurance contract liabilities due
to COVID-19 outbreak as at 31 December 2020 since
insurance contract liability valuations use long term
assumptions except for risk free interest rate which
has dropped drastically during the year was used for
discounting non participating insurance contract liabilities.
However there is no significant impact given the
Company’s liability composition.
44.3 De-recognition
The liability is de-recognised when the contract expires, is
discharged or is cancelled.
At each reporting date, an assessment is made of whether
the recognised life insurance liabilities are adequate, by
using a liability adequacy test.
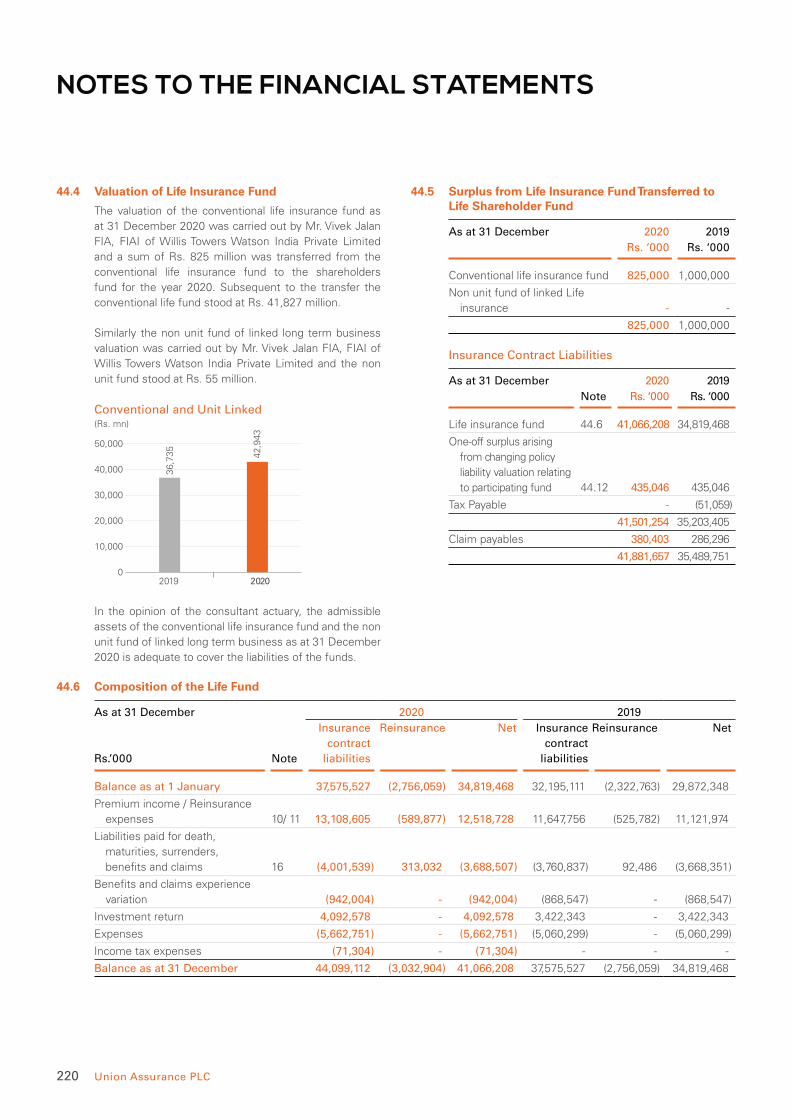
220 Union Assurance PLC
NOTES TO THE FINANCIAL STATEMENTS
44.4 Valuation of Life Insurance Fund
The valuation of the conventional life insurance fund as
at 31 December 2020 was carried out by Mr. Vivek Jalan
FIA, FIAI of Willis Towers Watson India Private Limited
and a sum of Rs. 825 million was transferred from the
conventional life insurance fund to the shareholders
fund for the year 2020. Subsequent to the transfer the
conventional life fund stood at Rs. 41,827 million.
Similarly the non unit fund of linked long term business
valuation was carried out by Mr. Vivek Jalan FIA, FIAI of
Willis Towers Watson India Private Limited and the non
unit fund stood at Rs. 55 million.
(Rs. mn)
2019 2020
Conventional and Unit Linked
0
10,000
20,000
30,000
40,000
50,000
36,7
35
42,9
43
In the opinion of the consultant actuary, the admissible
assets of the conventional life insurance fund and the non
unit fund of linked long term business as at 31 December
2020 is adequate to cover the liabilities of the funds.
44.5 Surplus from Life Insurance Fund Transferred to Life Shareholder Fund
As at 31 December 2020 2019
Rs. ‘000 Rs. ‘000
Conventional life insurance fund 825,000 1,000,000
Non unit fund of linked Life
insurance - -
825,000 1,000,000
Insurance Contract Liabilities
As at 31 December 2020 2019
Note Rs. ‘000 Rs. ‘000
Life insurance fund 44.6 41,066,208 34,819,468
One-off surplus arising
from changing policy
liability valuation relating
to participating fund 44.12 435,046 435,046
Tax Payable - (51,059)
41,501,254 35,203,405
Claim payables 380,403 286,296
41,881,657 35,489,751
44.6 Composition of the Life Fund
As at 31 December 2020 2019
Rs.’000 Note
Insurance
contract
liabilities
Reinsurance Net Insurance
contract
liabilities
Reinsurance Net
Balance as at 1 January 37,575,527 (2,756,059) 34,819,468 32,195,111 (2,322,763) 29,872,348
Premium income / Reinsurance
expenses 10/ 11 13,108,605 (589,877) 12,518,728 11,647,756 (525,782) 11,121,974
Liabilities paid for death,
maturities, surrenders,
benefits and claims 16 (4,001,539) 313,032 (3,688,507) (3,760,837) 92,486 (3,668,351)
Benefits and claims experience
variation (942,004) - (942,004) (868,547) - (868,547)
Investment return 4,092,578 - 4,092,578 3,422,343 - 3,422,343
Expenses (5,662,751) - (5,662,751) (5,060,299) - (5,060,299)
Income tax expenses (71,304) - (71,304) - - -
Balance as at 31 December 44,099,112 (3,032,904) 41,066,208 37,575,527 (2,756,059) 34,819,468
Union Assurance at a Glance Management Discussion and Analysis Stewardship Financial Statements Supplementary Information
221Annual Report 2020
44.7 Movement in Life Fund
2020 2019
Rs. ‘000 Rs. ‘000
Conventional life insurance fund
Balance as at 1 January 35,448,033 30,557,320
Increase in life insurance fund before surplus transfer to shareholders 7,061,324 5,940,278
Transfer to shareholders (825,000) (1,000,000)
Effect of Taxation on Surplus / Bonus transferred to - Policyholders 51,059 (24,631)
Net change in unclaimed benefits 91,531 (24,934)
Balance as at 31 December - Conventional Life insurance 41,826,947 35,448,033
Non Unit Fund of Linked Life Insurance Contracts
Balance as at 1 January 41,718 42,561
Increase in non unit fund of linked life insurance before surplus transfer to shareholders 10,416 6,841
Transfer to shareholders - -
Net change in unclaimed benefits 2,576 (7,684)
Balance as at 31 December - Non unit fund of linked Life insurance 54,710 41,718
41,881,657 35,489,751
44.8 Key Assumptions used in Determination of Best Estimate Liability
Asset Class Basis
Economic Assumptions
Risk free rate Risk free rate curve as of 31 December 2020 issued by IRCSL
Fund yield Expected fund yields based on the Company's long term strategic asset allocation plan
and the expected yield on the long term bonds with a risk premium adjustment for other
asset classes.
Operating Experience Assumptions
Mortality rate Adjusted A67/70 mortality table rates based on company’s experience study as of
31 December 2019.
Morbidity rate Percentage of reinsurance rates, where the percentages are determined based on the
morbidity studies performed as of 31 December 2019.
Expense rate and Expense inflation Fixed & variable, acquisition and maintenance cost assumptions based on the 2019
experience study, with an inflation adjustment made to reconcile with the actual
expenses in 2020.
Lapse rates, paid-up rates and
surrender rates
Rates are based on company’s persistency study as of 31 December 2019.
44.9 Sensitivity Analysis
Sensitivity analysis of life insurance fund liability is provided in Note 8.1(a).
44.10 Expected Maturity Profile for Reserves for Insurance Contracts, Net of Reinsurance (Undiscounted cash flows)
As at 31 December 2020 2019
Rs. ‘000 Rs. ‘000
< 1 year 2,635 2,332
1 to 5 years 11,740 10,570
5 to 10 years 23,490 22,197
10 to 20 years 32,906 35,885
> 20 years 9,924 8,581
80,695 79,565

222 Union Assurance PLC
NOTES TO THE FINANCIAL STATEMENTS
44.11 Solvency Margin
In the opinion of the appointed actuary, Mr. Vivek Jalan
FIA, FIAI of Willis Towers Watson India Private Limited,
the Company maintains a Capital Adequacy ratio (CAR) of
341% and Total Available Capital (TAC) of Rs. 21,796 million
as at 31 December 2020, which exceeded the minimum
requirement of 120% and Rs. 500 million respectively as
per the Solvency Margin (Risk Based Capital) Rules.
44.12 One - off Surplus Arising from Changing Policy Liability Valuation
The one off surplus comprises of Rs. 432.5 million
attributable to participating business and Rs. 2.5 million
attributable to unit linked fund and Rs. 3,382 million
attributable to non participating and non unit fund of unit
linked business.
Based on the directions issued by the IRCSL dated 20
March 2018 and subsequent approval, the Company
has transferred Rs. 3,382 million attributable to non -
participating and non unit fund of unit linked business
from life policyholder fund through Income Statement to
life shareholder fund and held as part of the Restricted
Regulatory Reserve under equity in the statement of
financial position.
One - off Surplus was determined as the difference
between the NPV solvency basis liability and the GPV
distribution basis liability as of 31 December 2015. This
is calculated for Participating and other than participating
funds, separately. Above basis is in line with the ‘Minimum
One - off Surplus’ calculation basis provided in the IRCSL
guideline.
Applicable disclosures required in the Financial
Statements as per Identification and Treatment of One
- Off Surplus: Direction #16 - 20.03.2016 issued, under
Section 96A of the Regulation of Insurance Industry Act
No 43 of 2000 are given below;
Disclosure in Financial Statements Compliance
with the
Requirement
Page
reference
i Equity and statement of changes in equity to include a new line item called 'Restricted
Regulatory Reserve' with value equal to one - off surplus for other than participating business.
Adequate disclosure to be made with regards to 'Restricted Regulatory Reserve'.
Complied
[Note 41] 216
ii Disclosure stating 'distribution of one - off surplus to shareholders', held as 'Restricted
Regulatory Reserve', is subject to meeting governance requirements stipulated by the IRCSL
and can only be released upon approval from the IRCSL.
Complied
[Note 41] 216
iii The basis of computation of one - off surplus. Any deviation from the direction in respect of
determining the 'minimum one - off surplus'.
Complied
[Note 44.8] 221
iv One-off surplus relating to participating and other than participating should be disclosed
separately.
Complied
[Note 44.12] 222
v Disclosure on composition of investments supporting the Restricted Regulatory Reserve. Complied
[Note 32.2(a)] 204
44.12(a) Distribution of One-off Surplus
The distribution of One-off surplus to Shareholders
as dividends shall remain restricted until a Company
develops appropriate policies and procedures for effective
management of its business, as listed below. These
policies should be approved by the Board of Directors
of the Company and must also comply with any relevant
guidance issued by IRCSL from time to time. Further
regulator will reconsider the distribution of One-off
Surplus when the RBC rules are revised.
• Expense allocation policy setting out basis of allocation
of expenses between the Shareholder Fund and the
Policyholder Fund as well as between different lines
of business within the Policyholder Fund, particularly
participating and non-participating.
• Dividend declaration policy for universal life business.
• Bonus policy for the participating business, which
should include treatment of One-off Surplus for the
purpose of bonus declaration.
• Asset-liability management policy.
• Policy on internal target Capital Adequacy Ratio
• Considerations for transfer of funds from Policyholder
Fund to Shareholder Fund
The IRCSL will permit distribution of One-off Surplus
subject to yearly distribution caps on a case-by-case basis.
Union Assurance at a Glance Management Discussion and Analysis Stewardship Financial Statements Supplementary Information
223Annual Report 2020
44.13 Liability Adequacy Test (LAT) - Life Insurance Contract Liabilities
Accounting Policy
At each reporting date, an assessment is made of
whether the recognised life insurance liabilities are
adequate by using an existing liability adequacy test as
laid out under SLFRS 4 “Insurance Contracts”. The liability
value is adjusted to the extent that it is sufficient to meet
future benefits and expenses.
In performing the adequacy test, current best estimates
of future contractual cash flows, including related cash
flows such as claims handling and policy administration
expenses, policyholder options and guarantees, as well
as investment income from assets backing such liabilities,
are used. A number of valuation methods are applied,
including discounted cash flows to the extent that the
test involves discounting of cash flows, the interest rate
applied based on management’s prudent expectation of
current market interest rates.
Any deficiency shall be recognised in the Income
Statement by setting up a provision for liability adequacy.
Valuation
SLFRS 4 requires an insurer to assess whether its
recognized insurance liabilities are adequate at the end
of each reporting period. Observed impact of Covid -
19 pandemic was considered for the Liability Adequacy
Test performed as at 31 December 2020 and the same
was conducted to reflect most probable estimates
of assumptions (with some degree of prudence) and
using professional judgement liaising with company’s
Appointed Actuaries (Willis Towers Watson India Private
Limited). As at the reporting date, liability adequacy test
was performed by the Appointed Actuary Mr. Vivek Jalan
FIA, FIAI of Willis Towers Watson India Private Limited and
concluded that, the liability value has been determined
on a “going concern” basis and assumes a continuation
of current economic, regulatory and legal environment
prevailing in Sri Lanka; and are considered sufficient to
meet future benefits and expenses under what is believed
to be a view of the “most probable” future experience.
No provision was required to be made for any premium
deficiency.
Details of LAT reports are provided in page 131 to
this report.
45 INSURANCE CONTRACT LIABILITIES - UNIT LINKED
Accounting Policy
Unit linked contracts are those that do not meet the
definition of insurance contract or investment contract
with discretionary participating features. For these Unit
linked contracts, the liabilities are valued at current unit
value, i.e. on the basis of the fair value of the financial
investment, backing those contracts at the reporting date
together with rights to future management fees.
As at 31 December 2020 2019
Note Rs. ‘000 Rs. ‘000
Liability of Fund
investment 858,866 991,822
Liability of Fund income 45.1 202,835 254,253
Total insurance
contract liabilities 1,061,701 1,246,075
45.1 Movement in Liability of Fund Income
As at 31 December 2020 2019
Rs. ‘000 Rs. ‘000
Balance as at 1 January 254,253 251,114
Net investment income 35,933 67,310
Net realised gains (139,709) 16,950
Net fair value gains / (losses) 62,456 (63,752)
Management fee expense (10,098) (17,369)
Balance as at 31 December 202,835 254,253
Fair Value of the Financial Investments Backing Unit
Linked Contracts are as Follows.
Fair Value of the Financial Investments Backing Unit Linked Contracts are as Follows.
As at 31 December 2020 2019
Rs. ‘000 Rs. ‘000
Government securities 82,998 139,035
Equity instruments 783,223 949,024
Corporate debt instruments 148,433 140,534
Fixed deposits 28,444 16,292
Commercial Papers 10,259 -
1,053,357 1,244,885
Other financial investments and
assets 12,189 10,928
Other unit linked liabilities (3,845) (9,738)
Insurance contract liabilities -
Unit Linked 1,061,701 1,246,075

224 Union Assurance PLC
NOTES TO THE FINANCIAL STATEMENTS
46 LEASE LIABILITY
2020 2019
Rs. ‘000 Rs. ‘000
Balance as at 1 January 289,176 323,866
New lease agreements
recognized during the period 50,294 41,419
Interest expenses for the year (9,824) 33,999
Payment of lease liabilities (97,189) (110,108)
Change in fair value (198) -
Balance as at 31 December 232,259 289,176
47 EMPLOYEE BENEFITS LIABILITIES Accounting Policy
47.1 Defined Contribution Plans
A defined contribution plan is a post employment benefit
plan under which an entity pays fixed contributions into a
separate entity and has no legal or constructive obligation
to pay further amounts. Obligations for contributions to
defined contribution plans are recognised as an employee
benefit expense in the income statement in the periods
during which related services are rendered by employees.
Employees’ Provident Fund
All employees of the Company are members of the
Employees’ Provident Fund (EPF). The Company and
employees contribute 12% and 8% respectively of
the salary, monthly to the Employees Provident Fund
managed by the Central Bank of Sri Lanka.
Employees’ Trust Fund
All employees of the Company are members of the
Employees’ Trust Fund (ETF). The Company contributes
each month at the rate of 3% of the salaries of each
employee, to the Employees’ Trust Fund administrated by
the Employees’ Trust Fund Board.
Defined Contribution Plans
Following contributions have been made to the employee
provident fund and employee trust fund during the year.
For the year ended
31 December
2020 2019
Rs. ‘000 Rs. ‘000
Employees’ Provident Fund
(EPF)
Employer’s contribution (12%) 74,886 68,403
Employee’s contribution (8%) 49,924 45,602
Employees’ Trust Fund (ETF)
Employer’s contribution (3%) 18,721 17,101
47.2 Defined Benefit Plans - Gratuity
A defined benefit plan is a post employment benefit plan
other than a defined contribution plan. The Company’s net
obligation in respect of defined benefit plans is calculated
by estimating the amount of future benefit that employees
have earned in return for their service in the current and prior
periods and discounting that amount to determine its present
value. The calculation is performed annually by a qualified
independent actuary using the projected unit credit method.
As per LKAS 19 - Employee Benefits, the re-measurements
of the net defined benefit liability, which comprise
actuarial gains and losses, are recognised immediately in
the statement of profit or loss and other comprehensive
income.
Under the Payment of Gratuity Act No. 12 of 1983, the
liability to an employee arises only on completion of 5
years of continued service.
The obligation is not externally funded.
47.3 Other long term employee benefits
A new Long-Term Incentive Plan (LTI) has been launched
for senior management; upon achievement of strategic
targets. The liability recognised in the statement of
financial position is the present value of the estimated
future cash outflows of long term incentive plan as at the
reporting date.
47.4 Employee benefit liabilities
As at 31 December 2020 2019
Note Rs. ‘000 Rs. ‘000
Employee defined
benefit plan - gratuity 47.4(a) 126,773 126,618
Other long term
employee benefits 47.4(b) 67,980 36,339
Balance as at
31 December 194,753 162,957
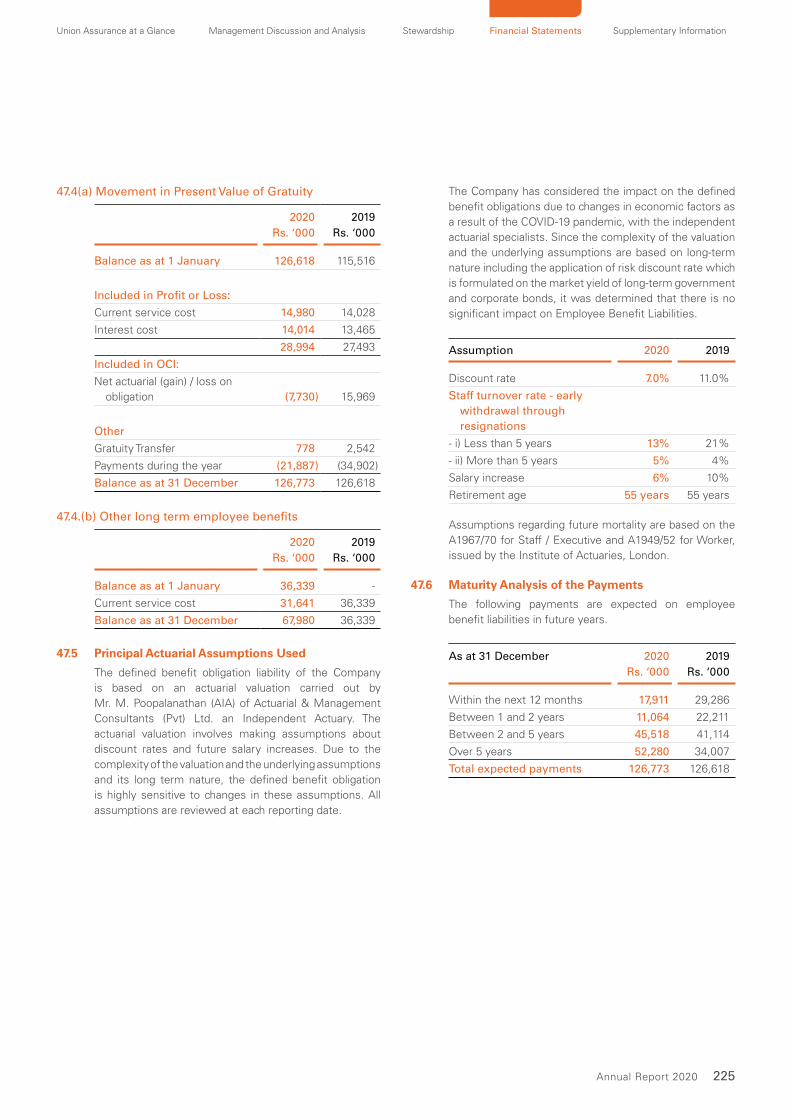
Union Assurance at a Glance Management Discussion and Analysis Stewardship Financial Statements Supplementary Information
225Annual Report 2020
47.4(a) Movement in Present Value of Gratuity
2020 2019
Rs. ‘000 Rs. ‘000
Balance as at 1 January 126,618 115,516
Included in Profit or Loss:
Current service cost 14,980 14,028
Interest cost 14,014 13,465
28,994 27,493
Included in OCI:
Net actuarial (gain) / loss on
obligation (7,730) 15,969
Other
Gratuity Transfer 778 2,542
Payments during the year (21,887) (34,902)
Balance as at 31 December 126,773 126,618
47.4.(b) Other long term employee benefits
2020 2019
Rs. ‘000 Rs. ‘000
Balance as at 1 January 36,339 -
Current service cost 31,641 36,339
Balance as at 31 December 67,980 36,339
47.5 Principal Actuarial Assumptions Used
The defined benefit obligation liability of the Company
is based on an actuarial valuation carried out by
Mr. M. Poopalanathan (AIA) of Actuarial & Management
Consultants (Pvt) Ltd. an Independent Actuary. The
actuarial valuation involves making assumptions about
discount rates and future salary increases. Due to the
complexity of the valuation and the underlying assumptions
and its long term nature, the defined benefit obligation
is highly sensitive to changes in these assumptions. All
assumptions are reviewed at each reporting date.
The Company has considered the impact on the defined
benefit obligations due to changes in economic factors as
a result of the COVID-19 pandemic, with the independent
actuarial specialists. Since the complexity of the valuation
and the underlying assumptions are based on long-term
nature including the application of risk discount rate which
is formulated on the market yield of long-term government
and corporate bonds, it was determined that there is no
significant impact on Employee Benefit Liabilities.
Assumption 2020 2019
Discount rate 7.0% 11.0%
Staff turnover rate - early
withdrawal through
resignations
- i) Less than 5 years 13% 21%
- ii) More than 5 years 5% 4%
Salary increase 6% 10%
Retirement age 55 years 55 years
Assumptions regarding future mortality are based on the
A1967/70 for Staff / Executive and A1949/52 for Worker,
issued by the Institute of Actuaries, London.
47.6 Maturity Analysis of the Payments
The following payments are expected on employee
benefit liabilities in future years.
As at 31 December 2020 2019
Rs. ‘000 Rs. ‘000
Within the next 12 months 17,911 29,286
Between 1 and 2 years 11,064 22,211
Between 2 and 5 years 45,518 41,114
Over 5 years 52,280 34,007
Total expected payments 126,773 126,618

226 Union Assurance PLC
NOTES TO THE FINANCIAL STATEMENTS
47.7 Sensitivity Analysis
Reasonably possible variation in one of the relevant actuarial assumptions, holding other assumptions constant, would have
affected the defined benefit obligation by the amounts shown below:
Increase / (Decrease)
in discount rate
Increase / (Decrease)
in Salary Increment
Change in employee
defined benefit liability
Estimated employee
defined benefit liability
Rs’000 Rs’000
1% - (6,027) 120,746
-1% - 6,618 133,391
- 1% 6,889 133,662
- -1% (6,382) 120,391
Methods and assumptions used in preparing the sensitivity analysis
The sensitivity analyses above have been determined
based on a method that extrapolates the impact on
the defined benefit obligation as a result of reasonable
changes in key assumptions occurring at the end of
the reporting period. The sensitivity analysis are based
on a change in a significant assumption, keeping all
other assumptions constant. The sensitivity analysis
may not be representative of an actual change in the
defined benefit obligation as it is unlikely that changes in
assumptions would occur in isolation of one another and
such methodology has not been changed compared to
previous year.
48 REINSURANCE PAYABLES Accounting Policy
See accounting policy in Note 26.
Reinsurance payables represent balances due to
reinsurance companies. Amounts payable are recognised
when due and measured on initial recognition at the
fair value less directly attributable transaction costs in a
manner consistent with the related reinsurance contract.
Reinsurance liabilities are derecognised when the
contractual rights are extinguished or expire, or when the
contract is transferred to another party.
As at 31 December 2020 2019
Rs. ‘000 Rs. ‘000
Balance as at 1 January 812,930 669,314
Arising during the year 499,392 525,604
Utilised during the year (779,299) (381,988)
Balance as at 31 December 533,023 812,930
49 OTHER LIABILITIES Financial Liabilities
See accounting policy in Note 26.
The Company initially recognises financial liabilities on
the trade date at which the Company becomes a party
to the contractual provisions of the instrument. Financial
liabilities are recognised initially at fair value plus any
directly attributable transaction costs. Subsequent to
initial recognition these financial liabilities are measured
at amortised cost using the effective interest method.
Other Liabilities
Other Liabilities include accruals and advances and these
liabilities are recorded at the amounts that are expected
to be paid.
As at 31 December 2020 2019
Note Rs. ‘000 Rs. ‘000
Other Financial
Liabilities
Agency commission
payable 431,352 262,634
Other staff related
provisions 318,794 139,368
Premiums in suspense 760,244 698,513
Government levies 8,352 20,628
1,518,742 1,121,143
Other Non Financial
Liabilities
Government levies - 51,059
Other liabilities and
accruals 1,902,515 1,221,802
Premium received In
advance 6,464 22,929
1,908,979 1,295,790
Total other liabilities 3,427,721 2,416,933
Maturity schedule of other financial liabilities as of
31 December 2020 and 2019 are shown in Note 8.2(b) to
the financial statements.
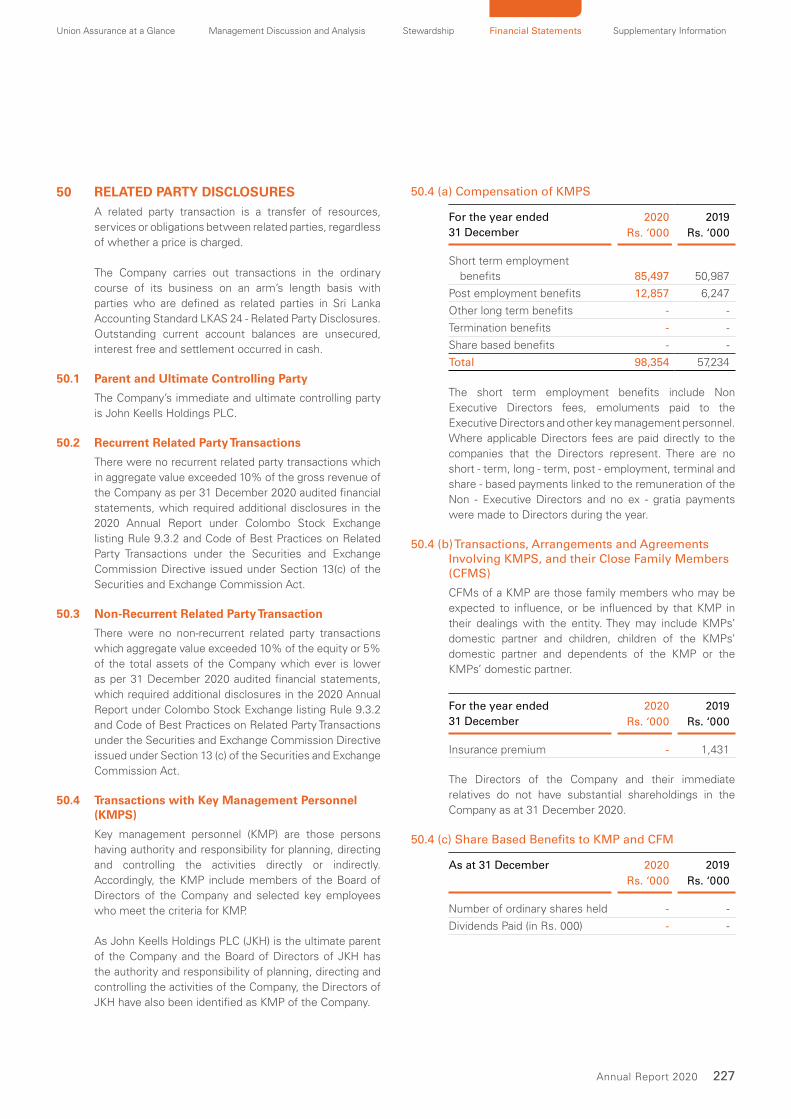
Union Assurance at a Glance Management Discussion and Analysis Stewardship Financial Statements Supplementary Information
227Annual Report 2020
50 RELATED PARTY DISCLOSURES A related party transaction is a transfer of resources,
services or obligations between related parties, regardless
of whether a price is charged.
The Company carries out transactions in the ordinary
course of its business on an arm’s length basis with
parties who are defined as related parties in Sri Lanka
Accounting Standard LKAS 24 - Related Party Disclosures.
Outstanding current account balances are unsecured,
interest free and settlement occurred in cash.
50.1 Parent and Ultimate Controlling Party
The Company’s immediate and ultimate controlling party
is John Keells Holdings PLC.
50.2 Recurrent Related Party Transactions
There were no recurrent related party transactions which
in aggregate value exceeded 10% of the gross revenue of
the Company as per 31 December 2020 audited financial
statements, which required additional disclosures in the
2020 Annual Report under Colombo Stock Exchange
listing Rule 9.3.2 and Code of Best Practices on Related
Party Transactions under the Securities and Exchange
Commission Directive issued under Section 13(c) of the
Securities and Exchange Commission Act.
50.3 Non-Recurrent Related Party Transaction
There were no non-recurrent related party transactions
which aggregate value exceeded 10% of the equity or 5%
of the total assets of the Company which ever is lower
as per 31 December 2020 audited financial statements,
which required additional disclosures in the 2020 Annual
Report under Colombo Stock Exchange listing Rule 9.3.2
and Code of Best Practices on Related Party Transactions
under the Securities and Exchange Commission Directive
issued under Section 13 (c) of the Securities and Exchange
Commission Act.
50.4 Transactions with Key Management Personnel (KMPS)
Key management personnel (KMP) are those persons
having authority and responsibility for planning, directing
and controlling the activities directly or indirectly.
Accordingly, the KMP include members of the Board of
Directors of the Company and selected key employees
who meet the criteria for KMP.
As John Keells Holdings PLC (JKH) is the ultimate parent
of the Company and the Board of Directors of JKH has
the authority and responsibility of planning, directing and
controlling the activities of the Company, the Directors of
JKH have also been identified as KMP of the Company.
50.4 (a) Compensation of KMPS
For the year ended
31 December
2020 2019
Rs. ‘000 Rs. ‘000
Short term employment
benefits 85,497 50,987
Post employment benefits 12,857 6,247
Other long term benefits - -
Termination benefits - -
Share based benefits - -
Total 98,354 57,234
The short term employment benefits include Non
Executive Directors fees, emoluments paid to the
Executive Directors and other key management personnel.
Where applicable Directors fees are paid directly to the
companies that the Directors represent. There are no
short - term, long - term, post - employment, terminal and
share - based payments linked to the remuneration of the
Non - Executive Directors and no ex - gratia payments
were made to Directors during the year.
50.4 (b) Transactions, Arrangements and Agreements Involving KMPS, and their Close Family Members (CFMS)
CFMs of a KMP are those family members who may be
expected to influence, or be influenced by that KMP in
their dealings with the entity. They may include KMPs’
domestic partner and children, children of the KMPs’
domestic partner and dependents of the KMP or the
KMPs’ domestic partner.
For the year ended
31 December
2020 2019
Rs. ‘000 Rs. ‘000
Insurance premium - 1,431
The Directors of the Company and their immediate
relatives do not have substantial shareholdings in the
Company as at 31 December 2020.
50.4 (c) Share Based Benefits to KMP and CFM
As at 31 December 2020 2019
Rs. ‘000 Rs. ‘000
Number of ordinary shares held - -
Dividends Paid (in Rs. 000) - -
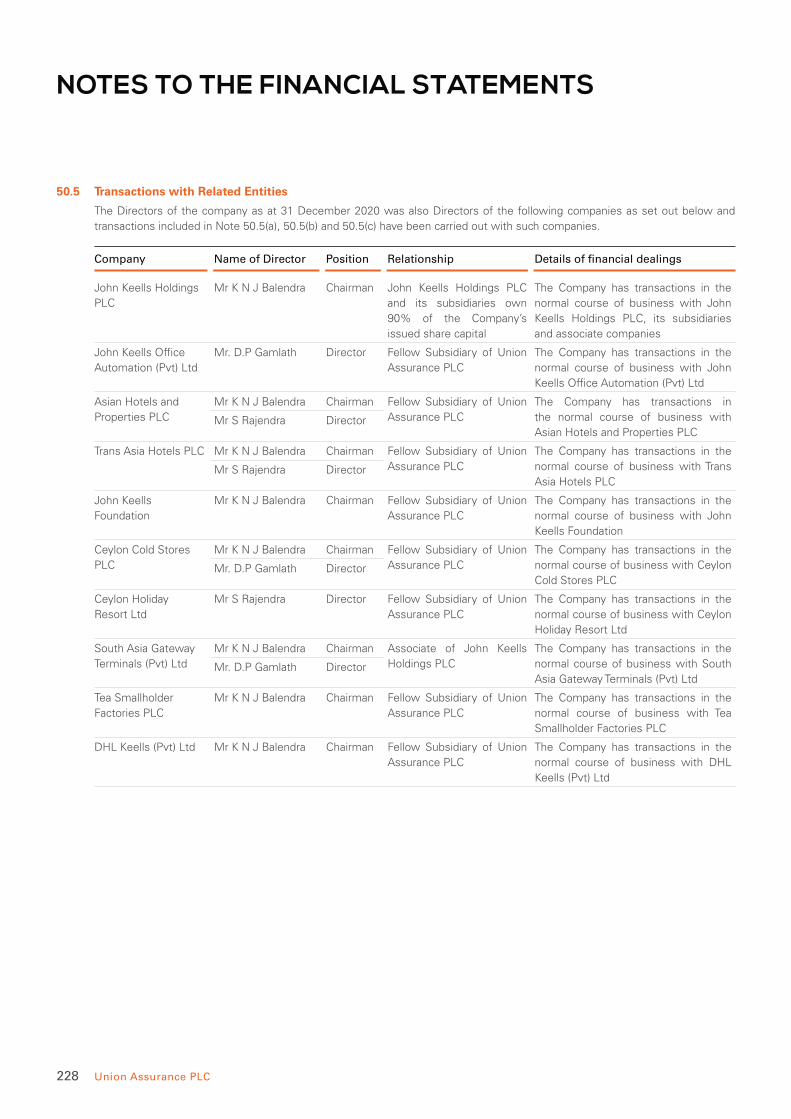
228 Union Assurance PLC
NOTES TO THE FINANCIAL STATEMENTS
50.5 Transactions with Related Entities
The Directors of the company as at 31 December 2020 was also Directors of the following companies as set out below and
transactions included in Note 50.5(a), 50.5(b) and 50.5(c) have been carried out with such companies.
Company Name of Director Position Relationship Details of financial dealings
John Keells Holdings
PLC
Mr K N J Balendra Chairman John Keells Holdings PLC
and its subsidiaries own
90% of the Company’s
issued share capital
The Company has transactions in the
normal course of business with John
Keells Holdings PLC, its subsidiaries
and associate companies
John Keells Office
Automation (Pvt) Ltd
Mr. D.P Gamlath Director Fellow Subsidiary of Union
Assurance PLC
The Company has transactions in the
normal course of business with John
Keells Office Automation (Pvt) Ltd
Asian Hotels and
Properties PLC
Mr K N J Balendra Chairman Fellow Subsidiary of Union
Assurance PLC
The Company has transactions in
the normal course of business with
Asian Hotels and Properties PLCMr S Rajendra Director
Trans Asia Hotels PLC Mr K N J Balendra Chairman Fellow Subsidiary of Union
Assurance PLC
The Company has transactions in the
normal course of business with Trans
Asia Hotels PLCMr S Rajendra Director
John Keells
Foundation
Mr K N J Balendra Chairman Fellow Subsidiary of Union
Assurance PLC
The Company has transactions in the
normal course of business with John
Keells Foundation
Ceylon Cold Stores
PLC
Mr K N J Balendra Chairman Fellow Subsidiary of Union
Assurance PLC
The Company has transactions in the
normal course of business with Ceylon
Cold Stores PLCMr. D.P Gamlath Director
Ceylon Holiday
Resort Ltd
Mr S Rajendra Director Fellow Subsidiary of Union
Assurance PLC
The Company has transactions in the
normal course of business with Ceylon
Holiday Resort Ltd
South Asia Gateway
Terminals (Pvt) Ltd
Mr K N J Balendra Chairman Associate of John Keells
Holdings PLC
The Company has transactions in the
normal course of business with South
Asia Gateway Terminals (Pvt) LtdMr. D.P Gamlath Director
Tea Smallholder
Factories PLC
Mr K N J Balendra Chairman Fellow Subsidiary of Union
Assurance PLC
The Company has transactions in the
normal course of business with Tea
Smallholder Factories PLC
DHL Keells (Pvt) Ltd Mr K N J Balendra Chairman Fellow Subsidiary of Union
Assurance PLC
The Company has transactions in the
normal course of business with DHL
Keells (Pvt) Ltd

Union Assurance at a Glance Management Discussion and Analysis Stewardship Financial Statements Supplementary Information
229Annual Report 2020
50.5 (a) Transactions with the Parent and Ultimate Controlling Party
As at 31 December 2020 2019
Rs. ‘000 Rs. ‘000
Statement of financial
position
Assets
Rent Receivable 27 -
Financial instruments 707,894 66,491
707,921 66,491
Liabilities
Other liabilities (210,723) (22,398)
(210,723) (22,398)
Transacted amounts for the year ended 31 December
As at 31 December 2020 2019
Rs. ‘000 Rs. ‘000
Gross written premium 1,720 1,398
Net benefits and claims (900) (500)
Other operating and
administrative expenses (302,071) (117,072)
Rent Income 59 -
Dividend Income received 4,947 -
Dividend Paid (1,060,714) (1,060,714)
50.5 (b) Transactions with / Between Subsidiary Companies and Associates of the Parent Company and Other Related Entities
As at 31 December
Company
Rs. ‘000
Relationship with John
Keells Holdings PLC
Investment /
Nature of transaction
2020 2019
Statement of financial position
Assets
Property, plant and equipment
John Keells Office Automation (Pvt) Ltd Subsidiary Acquisition of property plant,
and equipment and Intangibles
5,831 15,007
John Keells Computer Services (Pvt) Ltd Subsidiary - 2,112
5,831 17,119
Financial investments
Nations Trust Bank PLC Associate Debenture investments 1,045,291 1,044,966
Nations Trust Bank PLC Associate Cash at Bank 66,322 79,865
John Keells Hotels PLC Subsidiary Shares 27,606 -
Ceylon Cold Stores PLC Subsidiary Shares 72,703 -
1,211,922 1,124,831
Employee benefit liabilities
John Keells Logistics Limited SubsidiaryGratuity transfer
- 2,542
Cinnamon Hotel Management Limited Subsidiary 778 -
778 2,542
Other liabilities
Other subsidiaries and associates Payment for shared services (3,941) (15,169)
(3,941) (15,169)

230 Union Assurance PLC
NOTES TO THE FINANCIAL STATEMENTS
As at 31 December
Company
Rs. ‘000
Relationship
with John Keells
Holdings PLC
Investment / Nature of
transaction
Transaction amount during
the year
2020 2019
Income Statement
Gross written premium
Other subsidiaries and associates 3,271 2,936
3,271 2,936
Net benefits and claims
Other subsidiaries and associates (750) 1,060
(750) 1,060
Investment income
Nations Trust Bank PLC Associate Debenture interest income 130,012 75,089
Ceylon Cold Stores PLC Subsidiary Dividend 193 -
130,205 75,089
Other operating and administrative
expenses
Other subsidiaries and associates (52,176) (169,488)
(52,176) (169,488)
50.5(c) Transactions with / between Associate of the Company - Fairfirst Insurance Ltd
Income Statement
For the year ended
31 December
2020 2019
Rs. ‘000 Rs. ‘000
Gross written premium 4,904 2,059
Net benefits and claims (500) (1,000)
Other operating and
administrative expenses (44,493) (47,901)
Statement of Financial Position
As at 31 December
Other receivables - -
Other liabilities - -
These balances are relating to current account transactions
and are payable / receivable on demand.
51 COMMITMENTS51.1 Capital Commitments
There were no significant capital commitments as at the
reporting date.
52 EVENTS AFTER THE REPORTING DATE Accounting Policy
Events after the reporting period are those events,
favourable and unfavourable, that occur between the
reporting date and the date when the financial statements
are authorised for issue.
All material events after the reporting date have been
considered and where appropriate, adjustments or
disclosures have been made in the respective notes to
the financial statements.
There have been no events subsequent to the reporting
date, which would have any material effect on the
Company.
53 PROVISIONS AND CONTINGENCIES Accounting Policy
A provision is recognised if, as a result of a past event, the
Company has a present legal or constructive obligation
that can be estimated reliably, and it is probable that an
outflow of economic benefits will be required to settle the
obligation. Provisions are determined by discounting the
expected future cash flows at a pre - tax rate that reflects
current market assessments of the time value of money
and the risks specific to the liability. The unwinding of the
discount is recognised in the profit or loss.
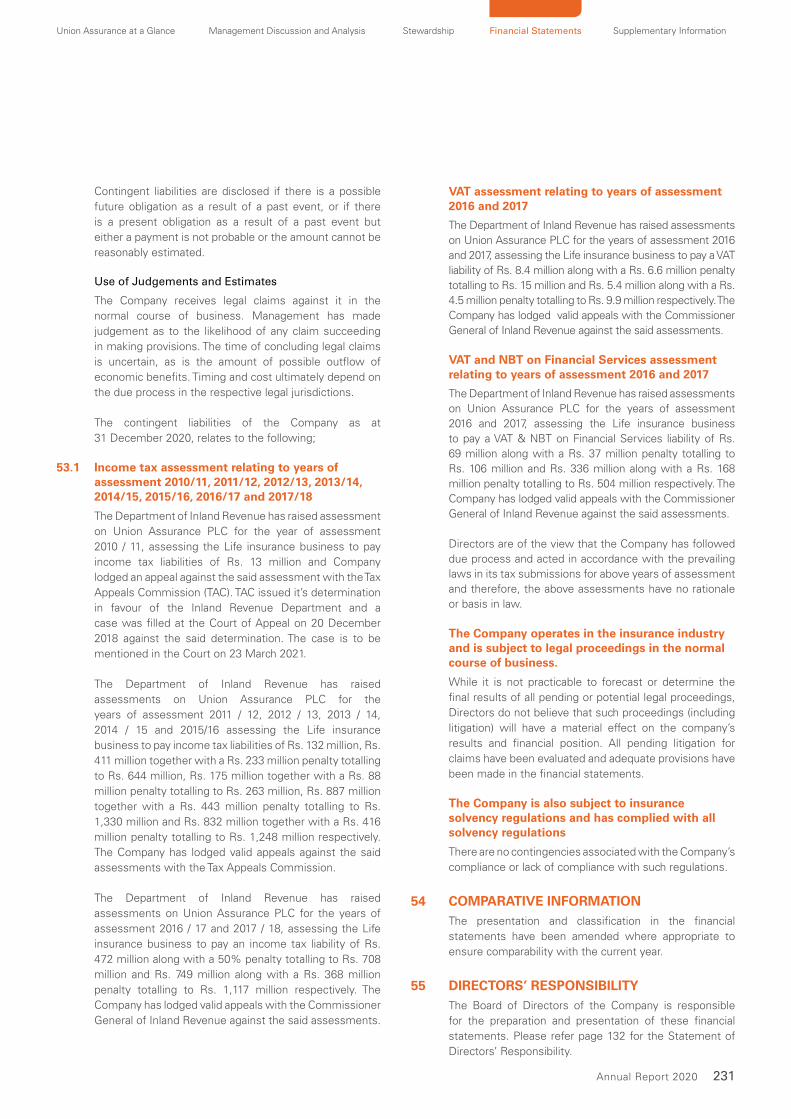
Union Assurance at a Glance Management Discussion and Analysis Stewardship Financial Statements Supplementary Information
231Annual Report 2020
Contingent liabilities are disclosed if there is a possible
future obligation as a result of a past event, or if there
is a present obligation as a result of a past event but
either a payment is not probable or the amount cannot be
reasonably estimated.
Use of Judgements and Estimates
The Company receives legal claims against it in the
normal course of business. Management has made
judgement as to the likelihood of any claim succeeding
in making provisions. The time of concluding legal claims
is uncertain, as is the amount of possible outflow of
economic benefits. Timing and cost ultimately depend on
the due process in the respective legal jurisdictions.
The contingent liabilities of the Company as at
31 December 2020, relates to the following;
53.1 Income tax assessment relating to years of assessment 2010/11, 2011/12, 2012/13, 2013/14, 2014/15, 2015/16, 2016/17 and 2017/18
The Department of Inland Revenue has raised assessment
on Union Assurance PLC for the year of assessment
2010 / 11, assessing the Life insurance business to pay
income tax liabilities of Rs. 13 million and Company
lodged an appeal against the said assessment with the Tax
Appeals Commission (TAC). TAC issued it’s determination
in favour of the Inland Revenue Department and a
case was filled at the Court of Appeal on 20 December
2018 against the said determination. The case is to be
mentioned in the Court on 23 March 2021.
The Department of Inland Revenue has raised
assessments on Union Assurance PLC for the
years of assessment 2011 / 12, 2012 / 13, 2013 / 14,
2014 / 15 and 2015/16 assessing the Life insurance
business to pay income tax liabilities of Rs. 132 million, Rs.
411 million together with a Rs. 233 million penalty totalling
to Rs. 644 million, Rs. 175 million together with a Rs. 88
million penalty totalling to Rs. 263 million, Rs. 887 million
together with a Rs. 443 million penalty totalling to Rs.
1,330 million and Rs. 832 million together with a Rs. 416
million penalty totalling to Rs. 1,248 million respectively.
The Company has lodged valid appeals against the said
assessments with the Tax Appeals Commission.
The Department of Inland Revenue has raised
assessments on Union Assurance PLC for the years of
assessment 2016 / 17 and 2017 / 18, assessing the Life
insurance business to pay an income tax liability of Rs.
472 million along with a 50% penalty totalling to Rs. 708
million and Rs. 749 million along with a Rs. 368 million
penalty totalling to Rs. 1,117 million respectively. The
Company has lodged valid appeals with the Commissioner
General of Inland Revenue against the said assessments.
VAT assessment relating to years of assessment 2016 and 2017
The Department of Inland Revenue has raised assessments on Union Assurance PLC for the years of assessment 2016 and 2017, assessing the Life insurance business to pay a VAT liability of Rs. 8.4 million along with a Rs. 6.6 million penalty totalling to Rs. 15 million and Rs. 5.4 million along with a Rs. 4.5 million penalty totalling to Rs. 9.9 million respectively. The Company has lodged valid appeals with the Commissioner General of Inland Revenue against the said assessments.
VAT and NBT on Financial Services assessment relating to years of assessment 2016 and 2017
The Department of Inland Revenue has raised assessments on Union Assurance PLC for the years of assessment 2016 and 2017, assessing the Life insurance business to pay a VAT & NBT on Financial Services liability of Rs. 69 million along with a Rs. 37 million penalty totalling to Rs. 106 million and Rs. 336 million along with a Rs. 168 million penalty totalling to Rs. 504 million respectively. The Company has lodged valid appeals with the Commissioner General of Inland Revenue against the said assessments.
Directors are of the view that the Company has followed due process and acted in accordance with the prevailing laws in its tax submissions for above years of assessment and therefore, the above assessments have no rationale or basis in law.
The Company operates in the insurance industry and is subject to legal proceedings in the normal course of business.
While it is not practicable to forecast or determine the
final results of all pending or potential legal proceedings,
Directors do not believe that such proceedings (including
litigation) will have a material effect on the company’s
results and financial position. All pending litigation for
claims have been evaluated and adequate provisions have
been made in the financial statements.
The Company is also subject to insurance solvency regulations and has complied with all solvency regulations
There are no contingencies associated with the Company’s
compliance or lack of compliance with such regulations.
54 COMPARATIVE INFORMATIONThe presentation and classification in the financial
statements have been amended where appropriate to
ensure comparability with the current year.
55 DIRECTORS’ RESPONSIBILITYThe Board of Directors of the Company is responsible
for the preparation and presentation of these financial
statements. Please refer page 132 for the Statement of
Directors’ Responsibility.

VALUING MOMENTS
SUPPLEMENTARY INFORMATION
234 Decade at a Glance236 Independent Assurance Report on
Non-Financial Reporting238 GRI Content Index244 Certificate of Carbon Footprint245 Glossary of Insurance Terms247 Quarterly Analysis248 Insurance Revenue Account249 Statement of Financial Position250 Statement of Cash Flows252 Notes to the Statement of Financial
Position256 Understanding our Financials257 Distribution Network259 Corporate Information260 Notice of Meeting261 Proxy Form

234 Union Assurance PLC
DECADE AT A GLANCEIn
sura
nce
Reven
ue A
cco
un
ts
Rs’
00
0
2020
201
92
018
201
72
016
201
52
014
201
32
012
201
1
Gro
ss w
ritt
en p
rem
ium
13,1
08,6
05
11
,64
7,7
56
1
1,2
43
,915
1
0,1
17,6
30
8
,27
0,7
51
6
,96
4,3
90
5
,94
5,4
99
5
,515
,06
3
5,1
06
,32
3
4,4
71
,62
8
Net
writt
en p
rem
ium
12,5
18,7
28
11,1
21
,974
1
0,5
27,
474
9
,62
0,0
18
7,8
46
,89
4
6,6
00
,20
8
5,6
17,4
35
5
,23
4,5
21
4
,85
6,7
28
4
,26
8,7
20
Inve
stm
ent
and o
ther
inco
me
4,0
41,1
60
3,4
42
,84
9
3,2
65
,56
6
3,8
22
,22
5
2,7
46
,30
6
2,1
67,
30
4
3,1
59
,95
7
2,0
17,5
44
1
,72
2,0
70
1
,215
,04
3
Net
benefits
and c
laim
s (
10,0
00,8
32)
(8
,48
7,15
7)
(6
,813
,03
0)
(5
,38
8,6
96
) (
5,8
33
,65
0)
(4
,87
3,6
07
) (
5,2
01,0
25
) (3
,976
,24
8)
(3
,57
2,7
69
) (2
,79
1,6
35
)
Ch
ange in
contr
act
liabili
ty d
ue t
o
tran
sfer
of
one o
ff s
urp
lus
-
-
-
3,3
81
,93
4
-
-
-
-
-
-
Underw
riting a
nd n
et
acquis
itio
n
cost
s (in
cludin
g r
ein
sura
nce
) (
2,1
45,1
30)
(1
,85
7,3
96
) (
2,0
55
,05
1)
(1
,84
1,1
51
) (
1,4
41
,617
) (
1,2
89
,43
7)
(1
,115
,83
4)
(9
68
,18
1)
(8
90
,53
6)
(8
19,0
76)
Oth
er
opera
ting a
nd a
dm
inis
trat
ive
expense
s (
3,5
17,
622)
(3,2
20
,27
0)
(3
,85
7,3
63
) (
2,5
70
,39
6)
(2
,15
7,2
54
) (
1,8
32
,74
3)
(1
,710
,53
3)
(1
,69
5,6
36
) (1
,59
0,4
93
) (1
,44
4,0
52
)
Inco
me t
ax (ex
pense
) /
reve
rsal
(71,3
04)
-
32
,40
4
-
(6
0,6
79
) 2
8,2
75
-
-
-
-
Su
rplu
s fr
om
lif
e in
sura
nce
fu
nd
825,0
00
1,0
00
,00
0
1,1
00
,00
0
7,0
23
,93
4
1,1
00
,00
0
80
0,0
00
7
50
,00
0
612
,00
0
52
5,0
00
4
29
,00
0
Inve
stm
ent
and o
ther
inco
me n
ot
attr
ibuta
ble
to p
olic
yhold
ers
939,0
21
92
6,4
19
1,0
29
,78
5
23
6,2
90
1
79
,43
2
1,5
30
,85
1
16
7,6
23
2
07,
074
2
3,1
61
-
Exp
ense
s not
attr
ibuta
ble
to
polic
yhold
ers
(157,
922)
(12
2,6
93
) (
114
,79
6)
(6
3,9
40
) (
27,
119
) (
42
,20
5)
(3
6,8
83
) (2
8,1
10)
(15
,34
2)
(12
,82
6)
Sh
are o
f net
resu
lt o
f equit
y
acco
unte
d in
vest
ee
116,4
38
10
4,7
36
1
49
,80
7
18
7,8
44
6
0,3
15
57,
99
0
-
-
-
-
Inco
me t
ax (ex
pense
) /
reve
rsal
(801
,941)
(7
50
,43
2)
1,0
79
,04
6
-
-
-
--
--
Pro
fit
for
the y
ear
920,5
96
1,1
58
,03
0
3,2
43
,84
2
7,3
84
,12
8
1,3
12,6
28
2
,34
6,6
36
8
80
,74
0
79
0,9
64
5
32
,819
4
16,1
74
* Incl
udes
the r
est
rict
ed o
ne-o
ff s
urp
lus
tran
sfer
of
Rs.
3.4
bill
ion
in 2
017.
Sta
tem
en
t o
f fi
nan
cial
po
siti
on
Rs’
00
0
2020
201
92
018
201
72
016
201
52
014
201
32
012
201
1
Ass
ets
Inta
ngib
le a
ssets
1,2
47,
057
1,3
06
,92
2
1,3
92
,19
1
212
,817
9
4,6
47
5
9,6
16
66
,76
6
117
,47
5
-
-
Pro
pert
y, p
lant
and e
quip
ment
2,4
68,8
21
2,5
00
,30
5
2,0
82
,99
0
2,0
00
,716
1
,49
3,0
40
1
,52
3,6
76
1,2
03
,93
4
1,3
37,
49
8
1,3
18,2
25
1
,29
8,3
80
Rig
ht
of
use
ass
ets
218,3
12
29
6,7
99
-
--
--
--
-
Defe
rred t
ax a
ssets
-
52
8,6
14
1,0
79
,04
6
-
-
-
-
-
-
-
Inve
stm
ent
in e
quit
y ac
counte
d
inve
stee
1,3
86,9
91
1,2
45
,95
1
1,1
30
,37
9
99
5,7
22
7
77,
34
6
73
6,2
16
-
-
-
-
Fin
anci
al in
vest
ments
52,3
56,2
08
44,8
81
,19
5
39
,13
8,0
73
3
6,7
92
,92
1
30
,84
7,2
56
2
6,5
40
,93
4
24
,03
8,9
78
2
4,2
97,
49
8
20
,80
2,3
09
1
6,5
79
,09
4
Loan
s to
life
polic
yhold
ers
1,7
93,4
70
1,5
55
,75
9
1,2
18,9
49
1
,001
,53
8
86
7,17
7
74
1,8
52
6
60
,74
4
515
,73
5
38
5,6
88
2
46
,674
Re
insu
rance
rece
ivab
le 4
92,0
11
50
2,9
75
3
71
,12
6
26
7,4
17
17
8,1
81
1
49
,77
2
67,
53
6
50
2,5
71
4
00
,62
7
54
5,7
74
Pre
miu
ms
rece
ivab
le 3
76,7
23
34
4,7
85
3
31
,53
9
26
8,5
11
24
6,8
00
2
03
,72
2
15
9,1
17
1,8
44
,83
1
1,4
59
,44
0
1,2
36
,29
9
Re
ceiv
able
s an
d o
ther
asse
ts 1
,30
0,5
45
1,4
52
,88
5
1,6
75
,601
9
47,
23
9
80
9,7
84
7
32
,017
8
16,7
18
1,0
87,
58
5
1,0
55
,00
6
1,7
95
,72
7
Defe
rred a
cquis
itio
n c
ost
-
-
-
-
-
-
-
14
9,1
45
1
46
,09
7
14
7,4
95
Cas
h in
han
d a
nd a
t ban
k 9
60,2
70
63
2,9
62
6
96
,83
5
58
0,1
26
3
79
,23
2
32
6,0
12
19
6,4
29
4
66
,40
2
315
,63
4
37
3,4
13
Ass
ets
held
for
sale
-
-
-
-
-
-
8,3
93
,314
-
-
-
Tota
l Ass
ets
62,6
00,4
08
55,2
49
,15
2
49
,116
,72
9
43
,06
7,0
07
3
5,6
93
,46
3
31
,013
,817
3
5,6
03
,53
6
30
,318
,74
0
25
,88
3,0
26
2
2,2
22
,85
6

Union Assurance at a Glance Management Discussion and Analysis Stewardship Financial Statements Supplementary Information
235Annual Report 2020
Sta
tem
en
t o
f fi
nan
cial
po
siti
on
Rs’
00
0
2020
201
92
018
201
72
016
201
52
014
201
32
012
201
1
Eq
uit
y
Sta
ted c
apit
al 1
,00
0,0
00
1,0
00
,00
0
1,0
00
,00
0
1,0
00
,00
0
1,0
00
,00
0
1,0
00
,00
0
1,1
38
,43
3
1,1
38
,43
3
1,1
33
,30
5
38
8,4
33
Re
strict
ed r
egula
tory
rese
rve
3,3
81,9
34
3,3
81
,93
4
3,3
81
,93
4
3,3
81
,93
4
-
-
-
-
-
-
Oth
er
rese
rves
3,3
70,9
46
2,6
71
,10
0
1,6
63
,96
0
2,1
44
,72
8
817
,00
3
1,2
32
,89
3
1,2
28
,72
2
82
9,0
94
7
20
,83
0
95
5,1
94
Re
tain
ed e
arnin
gs
7,3
55,6
09
7,6
09
,86
8
7,6
25
,79
4
5,4
38
,05
2
2,0
49
,18
9
1,2
32
,03
5
3,8
43
,70
4
3,1
49
,76
6
2,4
54
,92
3
1,9
03
,58
7
Tota
l E
qu
ity
15,1
08,4
89
14,6
62
,90
2
13
,67
1,6
88
1
1,9
64
,714
3
,86
6,1
92
3
,46
4,9
28
6
,210
,85
9
5,1
17,2
93
4
,30
9,0
58
3
,24
7,2
14
Lia
bilit
ies
Insu
rance
contr
act
liabili
ties
- Life
41,8
81,6
57
35,4
89
,75
1
30
,59
9,8
81
2
6,9
49
,613
2
7,8
89
,68
2
23
,73
1,2
38
2
0,4
35
,876
1
7,5
18,0
16
15
,35
6,3
40
1
3,4
40
,45
9
Insu
rance
contr
act
liabili
ties
-
Unit L
inke
d 1
,061,7
01
1,2
46
,07
5
1,5
01,2
71
2
,12
1,6
09
2
,37
7,7
07
2
,54
1,2
21
2
,618
,00
7
1,8
07,
137
1
,14
3,5
46
5
55
,54
1
Insu
rance
contr
act
liabili
ties
-
Non L
ife -
-
-
-
-
-
-
3,4
40
,24
9
3,2
00
,83
8
3,0
50
,976
Leas
e li
abili
ties
232,2
59
28
9,1
76
--
--
--
--
Em
plo
yee b
enefit
liabili
ties
194,7
53
16
2,9
57
1
15,5
16
12
2,5
88
1
07,
96
3
10
0,1
99
9
0,4
37
1
86
,07
8
16
3,5
72
8
9,4
67
Defe
rred r
evenue
-
-
-
-
-
-
-
10
9,4
02
9
6,9
04
1
54
,70
2
Re
insu
rance
pay
able
s 5
33,0
23
812
,93
0
66
9,3
14
34
5,1
46
2
08
,74
2
213
,85
5
15
0,7
84
7
64
,97
7
415
,39
4
44
1,5
67
Oth
er
liabili
ties
3,4
27,
721
2,4
16,9
33
2
,314
,88
4
1,3
68
,03
1
1,0
92
,87
1
84
3,4
24
7
70
,19
0
1,3
36
,86
4
1,1
72
,89
9
1,2
12,5
57
Ban
k ov
erd
raft
160,8
05
16
8,4
28
2
44
,17
5
19
5,3
06
1
50
,30
6
118
,95
2
66
,017
3
8,7
24
2
4,4
75
3
0,3
73
Lia
bili
ties
held
for
sale
-
-
-
-
-
-
5,2
61
,36
6
-
-
-
Tota
l Lia
bilit
ies
47,
491,9
19
40,5
86
,25
0
35
,44
5,0
41
3
1,1
02
,29
3
31
,82
7,2
71
2
7,5
48
,88
9
29
,39
2,6
77
2
5,2
01,4
47
2
1,5
73
,96
8
18
,97
5,6
42
Tota
l eq
uit
y a
nd
lia
bil
itie
s 6
2,6
00,4
08
55,2
49
,15
2
49
,116
,72
9
43
,06
7,0
07
3
5,6
93
,46
3
31
,013
,817
3
5,6
03
,53
6
30
,318
,74
0
25
,88
3,0
26
2
2,2
22
,85
6
Inv
est
or
Info
rmati
on
Re
turn
on N
et
Ass
ets
(%
)* 6
.18
8.1
7
25
.31
9
3.2
9
35
.81
4
8.5
1
15
.55
1
6.7
8
14
.10
1
2.9
7
Ear
nin
gs
Per
Shar
e (R
s.)*
15.6
2
19
.65
5
5.0
5
12
5.3
1
22
.27
3
1.2
0
14
.04
1
3.1
1
12
.28
9
.27
Div
idend P
er
Shar
e (R
s.)
-
20
.00
2
0.0
0
18
.00
1
0.5
0
8.5
0
6.5
0
6.0
0
5.0
0
5.0
0
Net
Ass
ets
Per
Shar
e (
Rs.
) 2
56.3
9
24
8.8
7
23
2.0
0
20
3.0
4
65
.61
5
8.8
0
72
.46
5
9.7
0
50
.27
4
3.3
0
Mar
ket
Price
Per
Shar
e (
Rs.
) 3
05.0
0
33
0.0
0
34
7.3
0
13
5.0
0
14
3.0
0
16
5.0
0
16
4.0
0
10
4.0
0
83
.00
1
08
.10
Mar
ket
Cap
ital
isat
ion (
Rs.
Mn.)
17,
973.2
1
19
,44
6.0
0
20
,46
5.8
9
7,9
55
.00
8
,42
6.7
9
9,7
23
.21
1
4,0
57.
10
8,9
14.2
6
7,1
14.2
9
8,1
07.
50
Price
Ear
nin
gs
Rat
io (
Tim
es)
19.5
2
16
.79
6
.31
1
.08
6
.42
5
.29
1
1.6
8
7.9
4
6.7
6
11.
66
Oth
er
Info
rmati
on
Num
ber
of
em
plo
yee
s795
764
614
5
29
4
74
45
0
44
5
1,1
57
1
,08
8
1,0
09
No o
f S
har
es
('0
00)
58,9
29
58
,92
9
58
,92
9
58
,92
9
58
,92
9
58
,92
9
85
,714
8
5,7
14
85
,714
7
5,0
00
* 2
010 t
o 2
014 fi
gure
s in
clude p
rofits
of
the n
on li
fe in
sura
nce
bu
sin
ess
.

236 Union Assurance PLC
INDEPENDENT ASSURANCE REPORT TO UNION ASSURANCE
We have been engaged by the directors of Union Assurance PLC (“the Company”) to
provide reasonable assurance and limited assurance in respect of the Sustainability
Indicators as identified below for the year ended 31 December 2020. The Sustainability
Indicators are included in Union Assurance PLC’s Integrated Annual Report for the year
ended 31 December 2020 (the “Report”).
The Reasonable Assurance Sustainability Indicators covered by our reasonable assurance
engagement are:
Assured Sustainability Indicators Integrated Annual
Report Page
Performance Highlights : Financial Highlights 15
The Limited Assurance Sustainability Indicators covered by our limited assurance
engagement are:
Limited Assurance Sustainability Indicators Integrated Annual
Report Page
Performance Highlights : Non-Financial Highlights 16 – 17
Information provided on following capitals
Financial Capital 36 – 45
Manufactured Capital 46 – 49
Natural Capital 50 – 53
Human Capital 54 – 59
Social and Relationship Capital 60 – 67
Intellectual Capital 68 – 71
Our ConclusionsOur conclusion has been formed on the
basis of, and is subject to, the matters
outlined in this report. We believe that the
evidence we have obtained is sufficient
and appropriate to provide a basis for our
conclusions.
Reasonable Assurance Sustainability Indicators
In our opinion, the Reasonable Assurance
Sustainability Indicators, as defined above,
for the year ended 31 December 2020
are, in all material respects, prepared
and presented in accordance with the
Consolidated Set of Global Reporting
Initiative Sustainability Reporting
Standards Guidelines.
Limited Assurance Sustainability Indicators
Based on the limited assurance procedures
performed and evidence obtained, as
described below, nothing has come to
our attention that causes us to believe
that the Limited Assurance Sustainability
Indicators, as defined above, for the year
ended 31 December 2020, have not
in all material respects, been prepared
and presented in accordance with the
Consolidated Set of Global Reporting
Initiative Sustainability Reporting
Standards Guidelines.
Management’s ResponsibilityManagement is responsible for the
preparation and presentation of the
Reasonable Assurance Sustainability
Indicators and the Limited Assurance
Sustainability Indicators in accordance
with the Consolidated Set of Global
Reporting Initiative Sustainability
Reporting Standards Guidelines.
These responsibilities includes establishing
such internal controls as management
determines are necessary to enable the
preparation of the Reasonable Assurance
Sustainability Indicators and the Limited
Assurance Sustainability Indicators that
are free from material misstatement
whether due to fraud or error.
Management is responsible for preventing
and detecting fraud and for identifying
and ensuring that the Company complies
with laws and regulations applicable to its
activities.
Management is also responsible for
ensuring that staff involved with the
preparation and presentation of the
description and Report are properly
trained, information systems are properly
updated and that any changes in reporting
encompass all significant business units.
102-56GRI
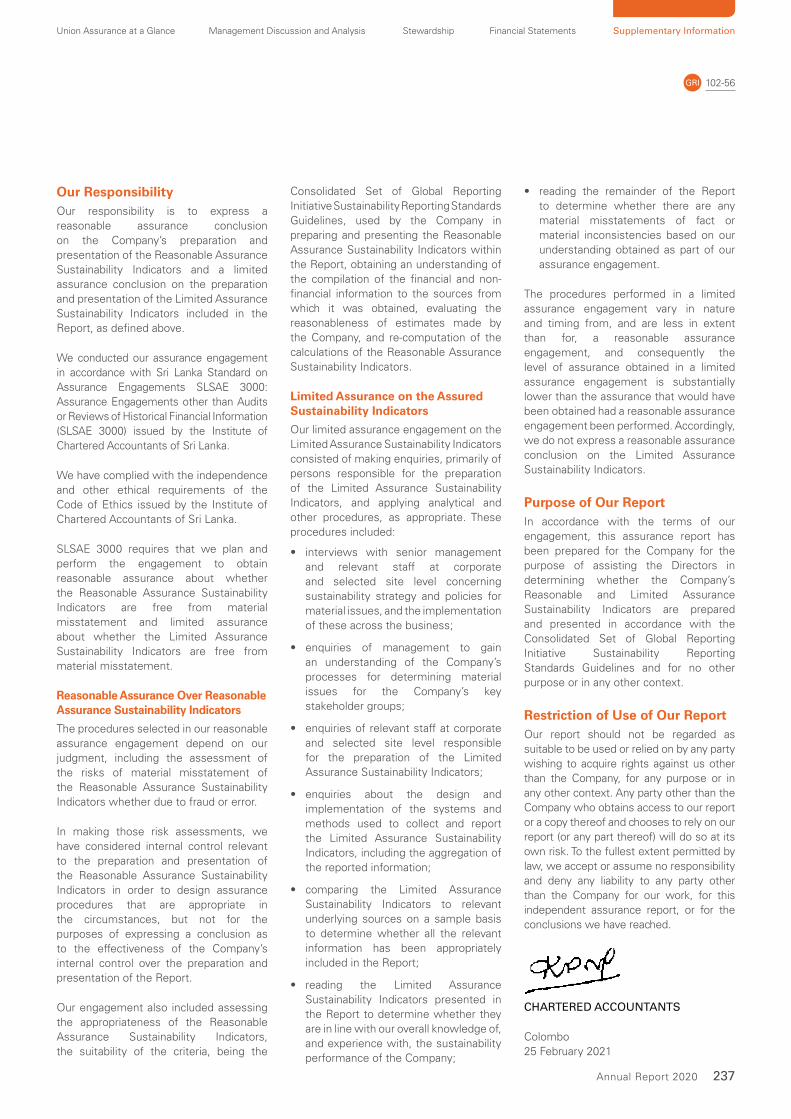
Union Assurance at a Glance Management Discussion and Analysis Stewardship Financial Statements Supplementary Information
237Annual Report 2020
Our ResponsibilityOur responsibility is to express a reasonable assurance conclusion on the Company’s preparation and presentation of the Reasonable Assurance Sustainability Indicators and a limited assurance conclusion on the preparation and presentation of the Limited Assurance Sustainability Indicators included in the Report, as defined above.
We conducted our assurance engagement in accordance with Sri Lanka Standard on Assurance Engagements SLSAE 3000: Assurance Engagements other than Audits or Reviews of Historical Financial Information (SLSAE 3000) issued by the Institute of Chartered Accountants of Sri Lanka.
We have complied with the independence and other ethical requirements of the Code of Ethics issued by the Institute of Chartered Accountants of Sri Lanka.
SLSAE 3000 requires that we plan and perform the engagement to obtain reasonable assurance about whether the Reasonable Assurance Sustainability Indicators are free from material misstatement and limited assurance about whether the Limited Assurance Sustainability Indicators are free from material misstatement.
Reasonable Assurance Over Reasonable Assurance Sustainability Indicators
The procedures selected in our reasonable assurance engagement depend on our judgment, including the assessment of the risks of material misstatement of the Reasonable Assurance Sustainability Indicators whether due to fraud or error.
In making those risk assessments, we have considered internal control relevant to the preparation and presentation of the Reasonable Assurance Sustainability Indicators in order to design assurance procedures that are appropriate in the circumstances, but not for the purposes of expressing a conclusion as to the effectiveness of the Company’s internal control over the preparation and presentation of the Report.
Our engagement also included assessing the appropriateness of the Reasonable Assurance Sustainability Indicators, the suitability of the criteria, being the
Consolidated Set of Global Reporting Initiative Sustainability Reporting Standards Guidelines, used by the Company in preparing and presenting the Reasonable Assurance Sustainability Indicators within the Report, obtaining an understanding of the compilation of the financial and non-financial information to the sources from which it was obtained, evaluating the reasonableness of estimates made by the Company, and re-computation of the calculations of the Reasonable Assurance Sustainability Indicators.
Limited Assurance on the Assured Sustainability Indicators
Our limited assurance engagement on the Limited Assurance Sustainability Indicators consisted of making enquiries, primarily of persons responsible for the preparation of the Limited Assurance Sustainability Indicators, and applying analytical and other procedures, as appropriate. These procedures included:
• interviews with senior management and relevant staff at corporate and selected site level concerning sustainability strategy and policies for material issues, and the implementation of these across the business;
• enquiries of management to gain an understanding of the Company’s processes for determining material issues for the Company’s key stakeholder groups;
• enquiries of relevant staff at corporate and selected site level responsible for the preparation of the Limited Assurance Sustainability Indicators;
• enquiries about the design and implementation of the systems and methods used to collect and report the Limited Assurance Sustainability Indicators, including the aggregation of the reported information;
• comparing the Limited Assurance Sustainability Indicators to relevant underlying sources on a sample basis to determine whether all the relevant information has been appropriately included in the Report;
• reading the Limited Assurance Sustainability Indicators presented in the Report to determine whether they are in line with our overall knowledge of, and experience with, the sustainability performance of the Company;
• reading the remainder of the Report to determine whether there are any material misstatements of fact or material inconsistencies based on our understanding obtained as part of our assurance engagement.
The procedures performed in a limited assurance engagement vary in nature and timing from, and are less in extent than for, a reasonable assurance engagement, and consequently the level of assurance obtained in a limited assurance engagement is substantially lower than the assurance that would have been obtained had a reasonable assurance engagement been performed. Accordingly, we do not express a reasonable assurance conclusion on the Limited Assurance Sustainability Indicators.
Purpose of Our ReportIn accordance with the terms of our engagement, this assurance report has been prepared for the Company for the purpose of assisting the Directors in determining whether the Company’s Reasonable and Limited Assurance Sustainability Indicators are prepared and presented in accordance with the Consolidated Set of Global Reporting Initiative Sustainability Reporting Standards Guidelines and for no other purpose or in any other context.
Restriction of Use of Our ReportOur report should not be regarded as suitable to be used or relied on by any party wishing to acquire rights against us other than the Company, for any purpose or in any other context. Any party other than the Company who obtains access to our report or a copy thereof and chooses to rely on our report (or any part thereof) will do so at its own risk. To the fullest extent permitted by law, we accept or assume no responsibility and deny any liability to any party other than the Company for our work, for this independent assurance report, or for the conclusions we have reached.
CHARTERED ACCOUNTANTS
Colombo25 February 2021
102-56GRI

238 Union Assurance PLC
GRI CONTENT INDEX 102-55GRI
GRI CONTENT INDEX This Report has been prepared “in accordance” with the Core of the GRI Standards and has underwent the GRI
Materiality Disclosures service in February 2021.
GRI Services reviewed that the GRI content index is clearly presented and the references for Disclosures 102-40 to 102-49 align with
appropriate sections in the body of the report.
GRI
Standard
Disclosure Page number(s), URL(s) and/ or
direct answer
Reason for
omission
GRI 101: Foundation 2016
GRI 102: General Disclosures 2016
Organizational profile
102-1 Name of the organization 259
102-2 Activities, brands, products, and services 8 and 65
https://unionassurance.com
102-3 Location of headquarters 259
102-4 Location of operations 48
102-5 Ownership and legal form 259
102-6 Markets served 8,12,63
102-7 Scale of the organization 15,16,17
102-8 Information on employees and other workers 56,57
102-9 Supply chain 66
102-10 Significant changes to the organization and its supply chain No significant changes in the supply chain
102-11 Precautionary Principle or approach 113 and 114
102-12 External initiatives 6
102-13 Membership of associations 67
Strategy
102-14 Statement from senior decision-maker 12
Ethics and integrity
102-16 Values, principles, standards, and norms of behaviour 26
Governance
102-18 Governance structure 82 and 83
Stakeholder engagement
102-40 List of stakeholder groups 21
102-41 Collective bargaining agreements No collective bargaining
102-42 Identifying and selecting stakeholders 20 to 21
102-43 Approach to stakeholder engagement 20 to 21
102-44 Key topics and concerns raised 22 to 24
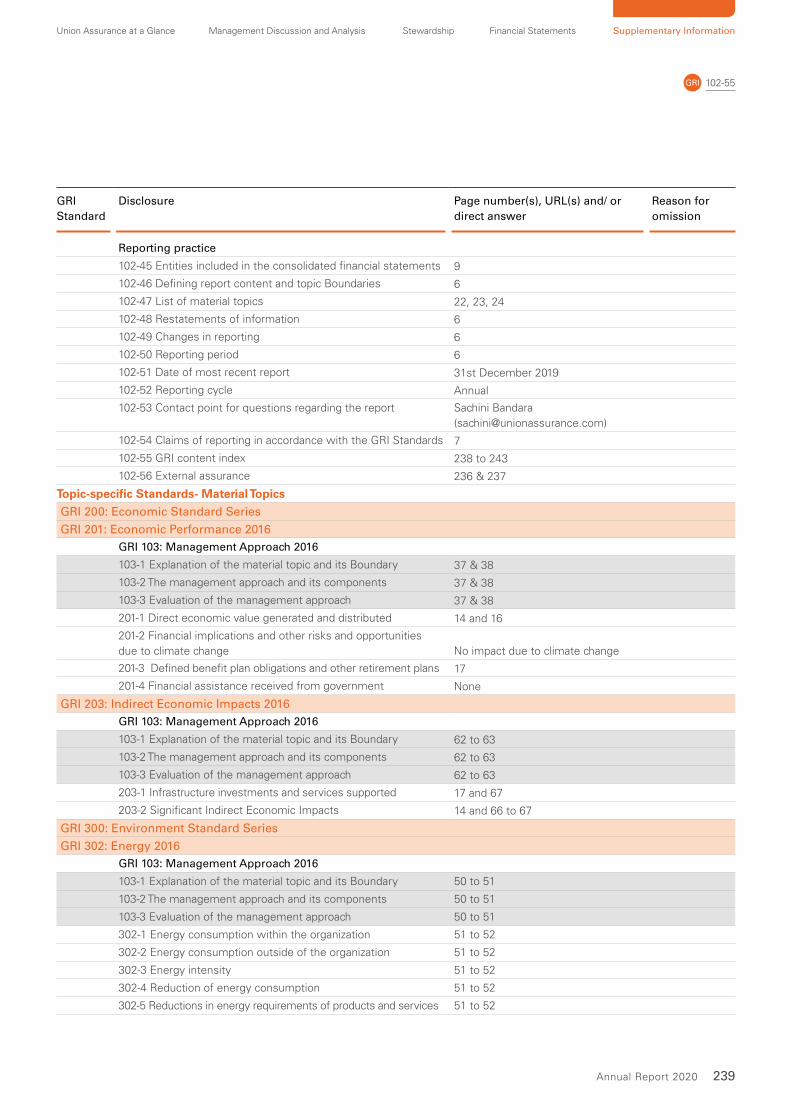
Union Assurance at a Glance Management Discussion and Analysis Stewardship Financial Statements Supplementary Information
239Annual Report 2020
102-55GRI
GRI
Standard
Disclosure Page number(s), URL(s) and/ or
direct answer
Reason for
omission
Reporting practice
102-45 Entities included in the consolidated financial statements 9
102-46 Defining report content and topic Boundaries 6
102-47 List of material topics 22, 23, 24
102-48 Restatements of information 6
102-49 Changes in reporting 6
102-50 Reporting period 6
102-51 Date of most recent report 31st December 2019
102-52 Reporting cycle Annual
102-53 Contact point for questions regarding the report Sachini Bandara
102-54 Claims of reporting in accordance with the GRI Standards 7
102-55 GRI content index 238 to 243
102-56 External assurance 236 & 237
Topic-specific Standards- Material TopicsGRI 200: Economic Standard Series
GRI 201: Economic Performance 2016
GRI 103: Management Approach 2016
103-1 Explanation of the material topic and its Boundary 37 & 38
103-2 The management approach and its components 37 & 38
103-3 Evaluation of the management approach 37 & 38
201-1 Direct economic value generated and distributed 14 and 16
201-2 Financial implications and other risks and opportunities
due to climate change No impact due to climate change
201-3 Defined benefit plan obligations and other retirement plans 17
201-4 Financial assistance received from government None
GRI 203: Indirect Economic Impacts 2016
GRI 103: Management Approach 2016
103-1 Explanation of the material topic and its Boundary 62 to 63
103-2 The management approach and its components 62 to 63
103-3 Evaluation of the management approach 62 to 63
203-1 Infrastructure investments and services supported 17 and 67
203-2 Significant Indirect Economic Impacts 14 and 66 to 67
GRI 300: Environment Standard Series
GRI 302: Energy 2016
GRI 103: Management Approach 2016
103-1 Explanation of the material topic and its Boundary 50 to 51
103-2 The management approach and its components 50 to 51
103-3 Evaluation of the management approach 50 to 51
302-1 Energy consumption within the organization 51 to 52
302-2 Energy consumption outside of the organization 51 to 52
302-3 Energy intensity 51 to 52
302-4 Reduction of energy consumption 51 to 52
302-5 Reductions in energy requirements of products and services 51 to 52
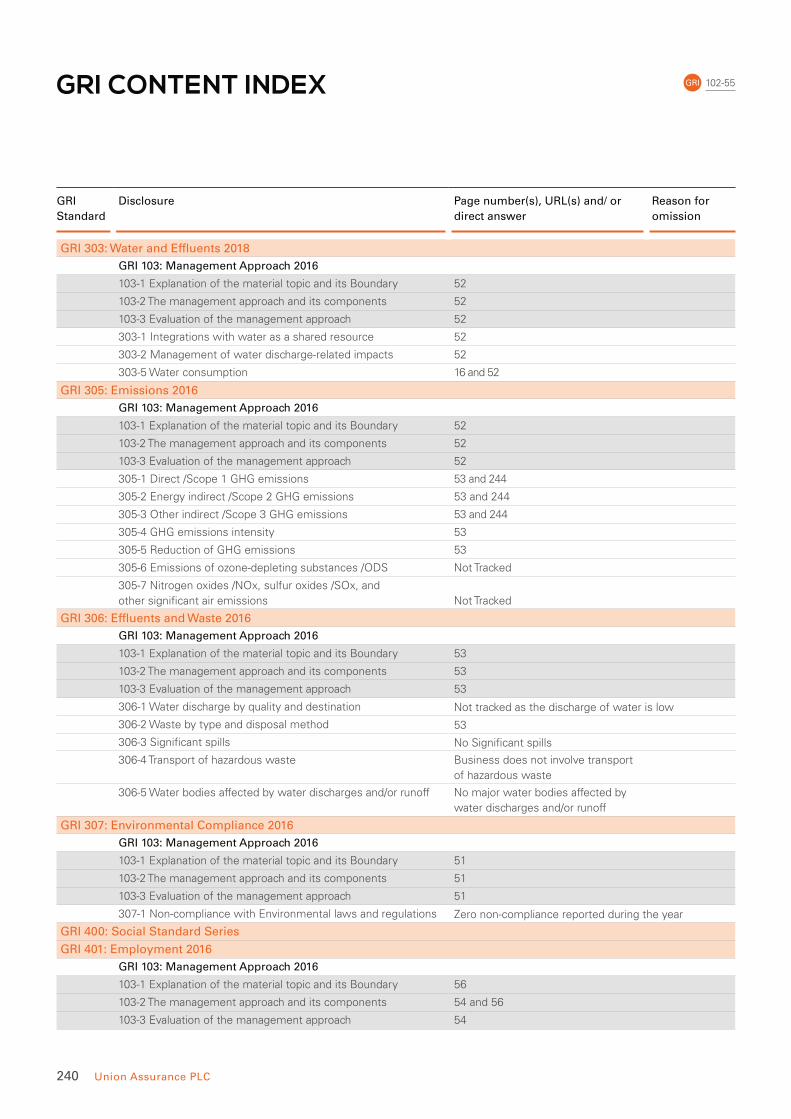
240 Union Assurance PLC
GRI CONTENT INDEX 102-55GRI
GRI
Standard
Disclosure Page number(s), URL(s) and/ or
direct answer
Reason for
omission
GRI 303: Water and Effluents 2018
GRI 103: Management Approach 2016
103-1 Explanation of the material topic and its Boundary 52
103-2 The management approach and its components 52
103-3 Evaluation of the management approach 52
303-1 Integrations with water as a shared resource 52
303-2 Management of water discharge-related impacts 52
303-5 Water consumption 16 and 52
GRI 305: Emissions 2016
GRI 103: Management Approach 2016
103-1 Explanation of the material topic and its Boundary 52
103-2 The management approach and its components 52
103-3 Evaluation of the management approach 52
305-1 Direct /Scope 1 GHG emissions 53 and 244
305-2 Energy indirect /Scope 2 GHG emissions 53 and 244
305-3 Other indirect /Scope 3 GHG emissions 53 and 244
305-4 GHG emissions intensity 53
305-5 Reduction of GHG emissions 53
305-6 Emissions of ozone-depleting substances /ODS Not Tracked
305-7 Nitrogen oxides /NOx, sulfur oxides /SOx, and
other significant air emissions Not Tracked
GRI 306: Effluents and Waste 2016
GRI 103: Management Approach 2016
103-1 Explanation of the material topic and its Boundary 53
103-2 The management approach and its components 53
103-3 Evaluation of the management approach 53
306-1 Water discharge by quality and destination Not tracked as the discharge of water is low
306-2 Waste by type and disposal method 53
306-3 Significant spills No Significant spills
306-4 Transport of hazardous waste Business does not involve transport
of hazardous waste
306-5 Water bodies affected by water discharges and/or runoff No major water bodies affected by
water discharges and/or runoff
GRI 307: Environmental Compliance 2016
GRI 103: Management Approach 2016
103-1 Explanation of the material topic and its Boundary 51
103-2 The management approach and its components 51
103-3 Evaluation of the management approach 51
307-1 Non-compliance with Environmental laws and regulations Zero non-compliance reported during the year
GRI 400: Social Standard Series
GRI 401: Employment 2016
GRI 103: Management Approach 2016
103-1 Explanation of the material topic and its Boundary 56
103-2 The management approach and its components 54 and 56
103-3 Evaluation of the management approach 54

Union Assurance at a Glance Management Discussion and Analysis Stewardship Financial Statements Supplementary Information
241Annual Report 2020
102-55GRI
GRI
Standard
Disclosure Page number(s), URL(s) and/ or
direct answer
Reason for
omission
401-1 New employee hires and employee turnover 56
401-2 Benefits provided to full-time employees that are not
provided to temporary or part-time employees
Benefit vary based on the terms on
the employment contract not based
on the location of operation
401-3 Parental leave 58
GRI 402: Labor/Management Relations 2016
GRI 103: Management Approach 2016
103-1 Explanation of the material topic and its Boundary 59
103-2 The management approach and its components 59
103-3 Evaluation of the management approach 59
402-1 Minimum notice periods regarding operational changes 59
401-2 Benefits provided to full-time employees that are not
provided to temporary or part-time employees
Benefit vary based on the terms on
the employment contract not based
on the location of operation
401-3 Parental leave 58
GRI 403: Occupational Health and Safety 2018
GRI 103: Management Approach 2016
103-1 Explanation of the material topic and its Boundary 59
103-2 The management approach and its components 59
103-3 Evaluation of the management approach 59
403-1 Occupational health and safety management system 59
403-2 Hazard identification, risk assessment, and incident
investigation 59
403-3 Occupational health services 59
403-4 Worker participation, consultation, and communication on
occupational health and safety 59
403-5 Worker training on occupational health and safety 59
403-6 Promotion of worker health 59
403-7 Prevention and mitigation of occupational health and
safety impacts directly linked by business relationships 59
408-8 Workers covered by an occupational health and safety
management system 59
GRI 404: Training and Education 2016
GRI 103: Management Approach 2016
103-1 Explanation of the material topic and its Boundary 57 & 58
103-2 The management approach and its components 57 & 58
103-3 Evaluation of the management approach 57 & 58
404-1 Average hours of training per year per employee 17
404-2 Programs for upgrading employee skills and transition
assistance programs 57 & 58
404-3 Percentage of employees receiving regular performance
and career development reviews 17
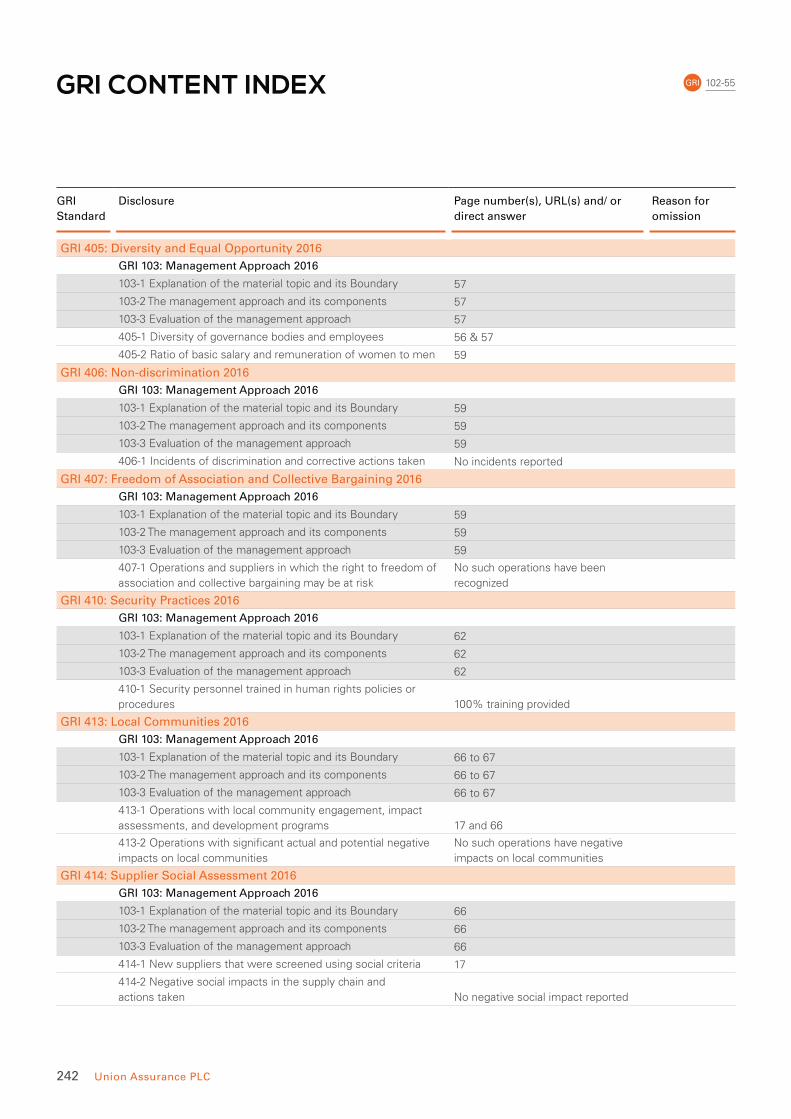
242 Union Assurance PLC
GRI CONTENT INDEX 102-55GRI
GRI
Standard
Disclosure Page number(s), URL(s) and/ or
direct answer
Reason for
omission
GRI 405: Diversity and Equal Opportunity 2016
GRI 103: Management Approach 2016
103-1 Explanation of the material topic and its Boundary 57
103-2 The management approach and its components 57
103-3 Evaluation of the management approach 57
405-1 Diversity of governance bodies and employees 56 & 57
405-2 Ratio of basic salary and remuneration of women to men 59
GRI 406: Non-discrimination 2016
GRI 103: Management Approach 2016
103-1 Explanation of the material topic and its Boundary 59
103-2 The management approach and its components 59
103-3 Evaluation of the management approach 59
406-1 Incidents of discrimination and corrective actions taken No incidents reported
GRI 407: Freedom of Association and Collective Bargaining 2016
GRI 103: Management Approach 2016
103-1 Explanation of the material topic and its Boundary 59
103-2 The management approach and its components 59
103-3 Evaluation of the management approach 59
407-1 Operations and suppliers in which the right to freedom of
association and collective bargaining may be at risk
No such operations have been
recognized
GRI 410: Security Practices 2016
GRI 103: Management Approach 2016
103-1 Explanation of the material topic and its Boundary 62
103-2 The management approach and its components 62
103-3 Evaluation of the management approach 62
410-1 Security personnel trained in human rights policies or
procedures 100% training provided
GRI 413: Local Communities 2016
GRI 103: Management Approach 2016
103-1 Explanation of the material topic and its Boundary 66 to 67
103-2 The management approach and its components 66 to 67
103-3 Evaluation of the management approach 66 to 67
413-1 Operations with local community engagement, impact
assessments, and development programs 17 and 66
413-2 Operations with significant actual and potential negative
impacts on local communities
No such operations have negative
impacts on local communities
GRI 414: Supplier Social Assessment 2016
GRI 103: Management Approach 2016
103-1 Explanation of the material topic and its Boundary 66
103-2 The management approach and its components 66
103-3 Evaluation of the management approach 66
414-1 New suppliers that were screened using social criteria 17
414-2 Negative social impacts in the supply chain and
actions taken No negative social impact reported
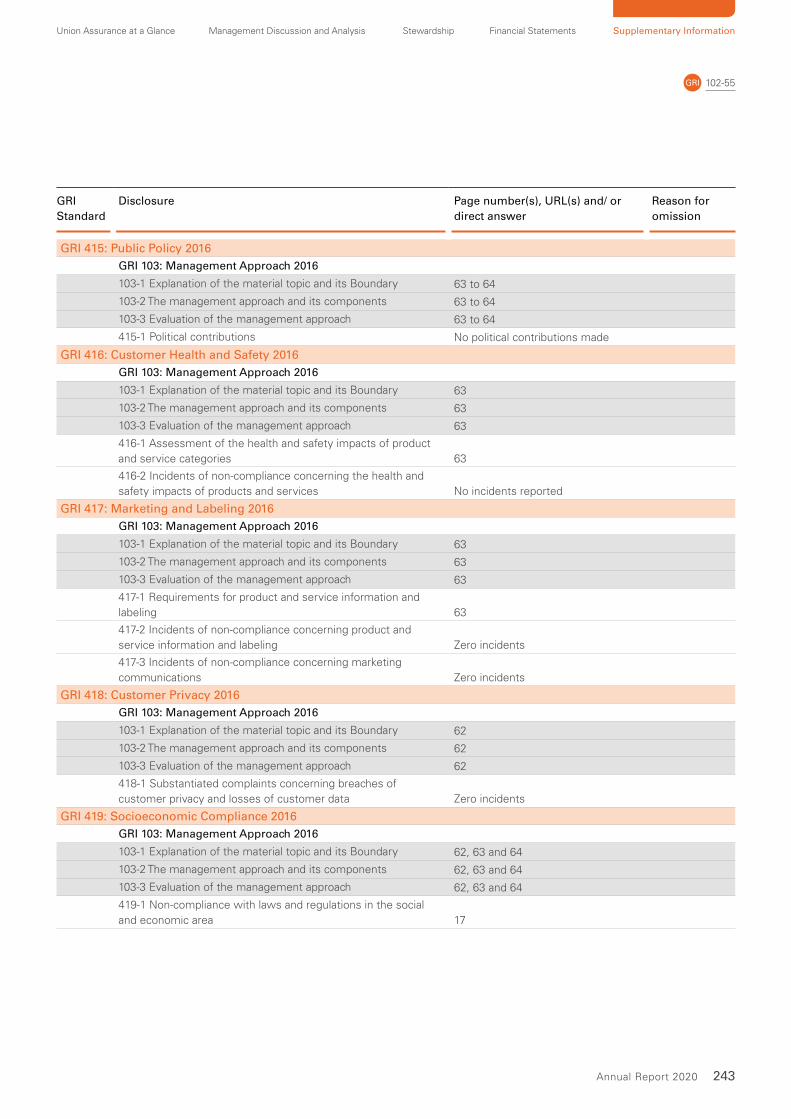
Union Assurance at a Glance Management Discussion and Analysis Stewardship Financial Statements Supplementary Information
243Annual Report 2020
102-55GRI
GRI
Standard
Disclosure Page number(s), URL(s) and/ or
direct answer
Reason for
omission
GRI 415: Public Policy 2016
GRI 103: Management Approach 2016
103-1 Explanation of the material topic and its Boundary 63 to 64
103-2 The management approach and its components 63 to 64
103-3 Evaluation of the management approach 63 to 64
415-1 Political contributions No political contributions made
GRI 416: Customer Health and Safety 2016
GRI 103: Management Approach 2016
103-1 Explanation of the material topic and its Boundary 63
103-2 The management approach and its components 63
103-3 Evaluation of the management approach 63
416-1 Assessment of the health and safety impacts of product
and service categories 63
416-2 Incidents of non-compliance concerning the health and
safety impacts of products and services No incidents reported
GRI 417: Marketing and Labeling 2016
GRI 103: Management Approach 2016
103-1 Explanation of the material topic and its Boundary 63
103-2 The management approach and its components 63
103-3 Evaluation of the management approach 63
417-1 Requirements for product and service information and
labeling 63
417-2 Incidents of non-compliance concerning product and
service information and labeling Zero incidents
417-3 Incidents of non-compliance concerning marketing
communications Zero incidents
GRI 418: Customer Privacy 2016
GRI 103: Management Approach 2016
103-1 Explanation of the material topic and its Boundary 62
103-2 The management approach and its components 62
103-3 Evaluation of the management approach 62
418-1 Substantiated complaints concerning breaches of
customer privacy and losses of customer data Zero incidents
GRI 419: Socioeconomic Compliance 2016
GRI 103: Management Approach 2016
103-1 Explanation of the material topic and its Boundary 62, 63 and 64
103-2 The management approach and its components 62, 63 and 64
103-3 Evaluation of the management approach 62, 63 and 64
419-1 Non-compliance with laws and regulations in the social
and economic area 17

244 Union Assurance PLC
CERTIFICATE OF CARBON FOOTPRINT
305-1, 305-2, 305-3GRI

Union Assurance at a Glance Management Discussion and Analysis Stewardship Financial Statements Supplementary Information
245Annual Report 2020
GLOSSARY OF INSURANCE TERMS
Accumulation - The situation where a
significant number of risks insured or
reinsured with the same company may be
affected simultaneously by a loss event.
Acquisition expenses - All expenses which
vary with, and are primarily related to, the
acquisition of new insurance contracts and
the renewal of existing insurance contracts
e.g. commissions.
Actuary - Qualified expert who analyses
problems from the area of insurance,
investments and pensions using methods of
probability theory and financial mathematics
and develops solutions with due regard to
legal and economic parameters.
Administrative expenses - Costs of
an administrative nature including those
arising from premium collection portfolio
administration, handling of bonuses and
rebates and inward and outward reinsurance,
including staff costs and depreciation provisions
in respect of property, plant and equipment.
Admissible assets - Assets that may be
included in determining an insurer’s statutory
solvency. Such assets are specified under
the rules made by the Insurance Board of
Sri Lanka under the Regulation of Insurance
Industry Act No. 43 of 2000.
Annuity - A series of regular payments.
Annuities include annuities certain, where
payments are made at definite times, and life
annuities, where payments depend on the
survival of an annuitant.
A life annuity is a contract that provides a
regular payment typically monthly during the
lifetime of the policyholder or a fixed period
if less. If the payments start at the outset of
the contract, it is an immediate annuity. If
they start at some point in the future, it is a
deferred annuity.
Bancassurance - An arrangement whereby
insurer sells insurance and investment
products to bank customers.
Beneficiary - A person named by the
policyholder as the recipient of the sum
insured and other benefits due in the event
of the policyholder’s death.
Benefits and claims experience variation - The difference between the expected and
the actual benefit payout
Cedent - Client of a reinsurance company
(also see primary insurers).
Claims - The amount payable under a contract
of insurance arising from the occurrence of
an insured event.
Claims incurred - A claim is incurred when
the event giving rise to the claim occurs.
Claims incurred include paid claims and
movements in outstanding claims.
Claims outstanding - The amount provided
to cover the estimated ultimate cost of settling
claims arising out of events which have been
notified by the reporting date being the sums
due to beneficiaries together with claims
handling expenses, less amounts already paid
in respect of those claims.
Commissions - A payment made to a broker
or a sales agent in return for selling and
servicing an insurer’s products.
Capital Adequacy Ratio (CAR) - Measures
adequacy of the Total Available Capital (TAC)
as against the Risk Capital Required (RCR)
under the Risk Based Capital Regime.
Discretionary participating features (DPF) - A contractual right given to a policyholder
to receive, as a supplement to guaranteed
benefits, additional benefits;
• That are likely to be a significant portion of
the total contractual benefits;
• Whose amount or timing is contractually
at the discretion of the issuer;
• That are contractually based on;
• The performance of a specified pool of
contracts or a specified type of contract;
• The realised and or unrealised investment
returns on a specified pool of assets held
by the issuer; and
• The profit or loss of the company, fund or
other entity that issues the contract.
Endowment - Life insurance payable to the
policyholder if living on the maturity date
stated in the policy or to a beneficiary if the
insured dies before that date.
Financial risk - The risk of a possible future
change in one or more of a specified interest
rate, financial instrument price, commodity
price, foreign exchange rate, index of
prices or rates, credit rating or credit index
or other variable, provided in the case of a
non financial variable that the variable is not
specific to a party to the contract.
Global Reporting initiative (GRI) - A leading
organisation in the sustainability field. GRI
promotes the use of sustainability reporting
as a way for organisations to become more
sustainable and contribute to sustainable
development. It allied with the UN Global
Compact.
Healthcare - An insurance contract which
provides medical coverage to a policyholder.
Insurance contract - A contract under which
one party (the insurer) accepts significant
insurance risk from another party (the
policyholder) by agreeing to compensate the
policyholder if a specified uncertain future
event (the insured event) adversely affects
the policyholder.
Insurance risk - Uncertainty over the
likelihood of an insured event occurring,
the quantum of the claim, or the time when
claims payments will fall due.
Insurance provision Life - The fund or funds
maintained by an insurer in respect of its life
insurance business in accordance with the
Regulation of Insurance Industry Act No. 43
of 2000.
Investment contract - A contract, which
contains significant financial risk and may
contain insignificant insurance risk, but does
not meet the definition of insurance.
Investment management services - The
management of an investment contract
on behalf of a policyholder, for which an
investment management service fee is
charged.
Lapsed Policy - A policy terminated at the
end of the grace period because of non
payment of premiums.
Liability adequacy test (LAT) - An
annual assessment of the sufficiency of
insurance and / or investment contract with
DPF liabilities, to cover future insurance
obligations.
Life surplus - The excess of the assets over
the liabilities as determined by the actuary
and after the distribution of dividends to
policyholders
Life insurance business - Insurance
(including reinsurance) business falling within
the classes of insurance specified as long term
insurance business under the Regulation of
Insurance Industry Act No. 43 of 2000.

246 Union Assurance PLC
GLOSSARY OF INSURANCE TERMS
Longevity - The insurer’s risk that an insured
person lives longer than expected or that life
expectancy within an insured portfolio rises
as a whole.
Loss ratio - Percentage ratio of claims
expenses to earned premiums.
Mortality - The ratio of deaths to the entire
population or to a particular age group. It is
globally expressed in numbers or rates and
set out in mortality tables.
Net asset value - The value of all tangible
and intangible assets of a company minus its
liabilities. It reflects a company’s fundamental
value.
Net expenses for claims and benefits - These include the expenses for claims
(claims payments and the change in the
provision for outstanding claims), expenses
for premium refunds and the change in the
remaining technical provisions (provision for
future policy benefits and other), in each case
after deduction of the ceded share.
Non-participating business - Life insurance
business where policyholders are not
entitled to share in the surplus of the relevant
life fund.
Non-proportional reinsurance - Under this
form of reinsurance, the reinsurer assumes
payment of the primary insurer’s loss above
a defined amount. The calculation of the
reinsurance premium is based on claims
experience with the type of business
concerned.
Outstanding claims provision - Comprises
claims incurred by the policyholder and
reported to the insurance company, and
IBNR claims.
Participating business - Life insurance
business where the policyholders are
contractually entitled to share in the surplus
of the relevant life fund.
Policyholders’ bonuses - In life and
health insurance, policyholders are entitled
contractually and by law to an appropriate
share of the surplus earned by their insurers.
The amount of this bonus is fixed each year.
As a rule, in life insurance these bonuses
increase the benefit payable on maturity of
the policy or on occurrence of the insured
event; in health insurance, they are paid by
way of premium refunds.
Policy loans - A loan from the insurer to a
policyholder on the security of the surrender
value of a life insurance policy. The loan
is normally limited to a percentage of the
current surrender value of the policy and
interest is charged on such loans.
Premiums - The instalments paid by the
customers.
Primary insurers - Insurance companies
that assume risks in return for an insurance
premium and have a direct contractual
relationship with the holder of the insurance
policy (private individual, firm or organisation).
Proportional reinsurance - Form of
reinsurance in which the sum insured
written by the primary insurer is divided
proportionally between the primary insurer
and the reinsurer, and the reinsurer is
allocated a corresponding share of the
premiums and claims.
Provision for outstanding claims - Provision
for claims that have already been incurred at
the reporting date but have either not yet
been reported or not yet been fully settled.
Reinsurance - An arrangement whereby one
party (the reinsurer), in consideration for a
premium, agrees to indemnify another party
(the cedent) against part or all of the liability
assumed by the cedent under a policy or
policies of insurance.
Reinsurance commission - Commission
received or receivable in respect of premiums
paid or payable to a reinsurer.
Reinsurance insurance risk - that is ceded
to another insurer to compensate for losses,
but the ultimate obligation to the policyholder
remains with the entity who issued the
original insurance contract.
Reinsurance inwards - The acceptance of
risks under a contract of reinsurance.
Reinsurance outwards - The placing of risks
under a contract of reinsurance.
Reinsurance profit commission - Commission received or receivable by the
cedent (reinsured) from the reinsurer based on
the net profit (as defined in the treaty) made by
the reinsurer on the reinsurance treaty.
Retention - The part of the risk assumed
which the insurer / reinsurer does not
reinsure / retrocede, i.e. retained net for own
account.
Retrocession - The reinsurance outwards
of risks previously accepted by an insurer as
reinsurance inwards. The recipient is known
as the retrocessionaire.
Risk Based Capital - A “Risk Based” approach
to assess the solvency and is based on the real
“cash flows” of the business.
Scenario analysis - Type of analysis used to
investigate how certain key figures (market
values or carrying amounts) change in the
event that predefined market developments
occur. Scenario analyses usually takes the
form of average if-then analyses.
Stress test - A special form of scenario
analysis. The aim is to make a quantitative
statement on the loss potential of portfolios
in the event of extreme market fluctuations,
tail dependencies. The result of risk drivers
interacting in exceptional situations.
Surrender value - The amount payable by an
insurer to a policyholder on termination of an
insurance policy before the expiry of its term
(more common in life insurance).
Technical provisions - Uncertain liabilities
directly connected with non-life insurance
business. These provisions are made to
ensure that obligations under insurance
contracts can always be met.
Underwriter - Member of an insurance
company that acts on behalf of his or her
employer to negotiate, accept or reject the
terms of an insurance contract. They are
responsible for ensuring the quality and
reliability of risk-transfer solutions. Their job
is to develop products that best reflect the
characteristics of the risks and clients’ needs.
Unit-linked life Insurance - A type of
life insurance with a savings component,
where the benefits payable depend on the
performance of the assets invested in a
fund. The investment risk is borne by the
policyholder.
Variable annuities - A special form of unit-
linked life insurance where the investment
risk is borne primarily by the policyholder but
the insurer guarantees a minimum payment
on occurrence of the insured event.
Written premium - Life insurance
business - Premiums to which the insurer
is contractually entitled and received in the
accounting period.
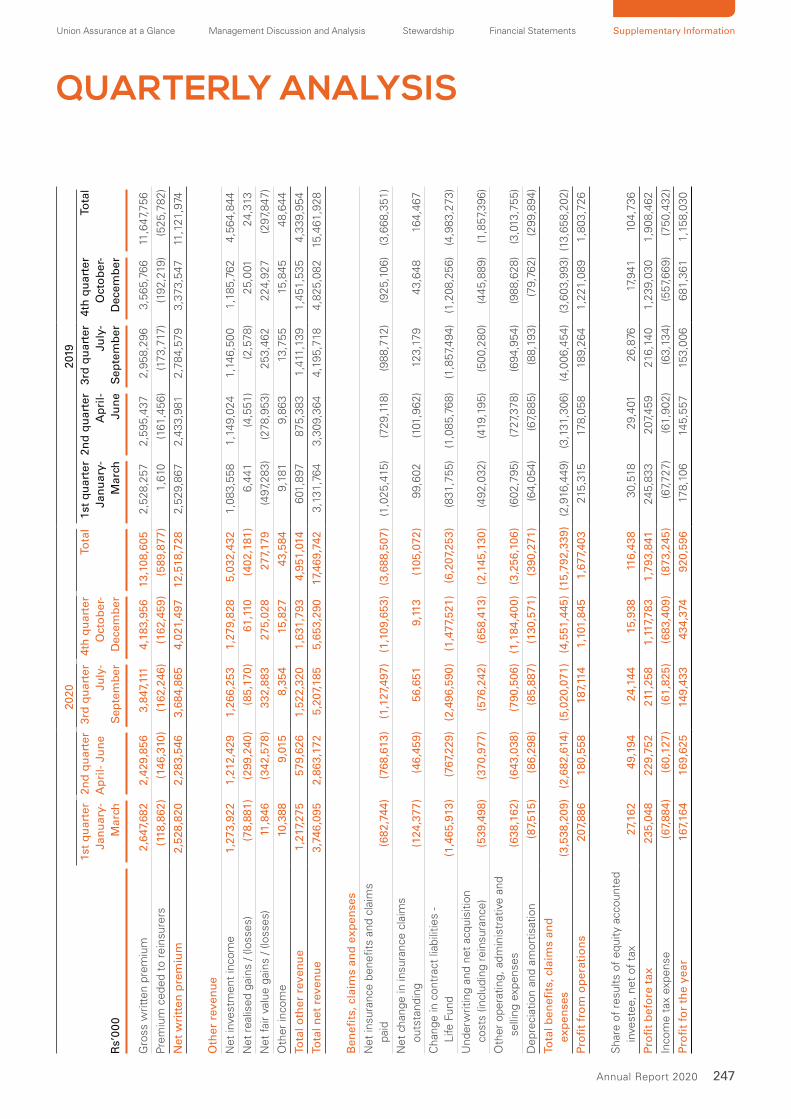
Union Assurance at a Glance Management Discussion and Analysis Stewardship Financial Statements Supplementary Information
247Annual Report 2020
QUARTERLY ANALYSIS2
02
02
019
Rs’
00
0
1st
qu
art
er
Jan
uary
-
Marc
h
2n
d q
ua
rte
r
Ap
ril-
Ju
ne
3rd
qu
art
er
July
-
Se
pte
mb
er
4th
qu
art
er
Oct
ob
er-
De
cem
be
r
Tota
l1
st q
ua
rte
r
Jan
ua
ry-
Ma
rch
2n
d q
ua
rte
r
Ap
ril-
Jun
e
3rd
qu
art
er
July
-
Se
pte
mb
er
4th
qu
art
er
Oct
ob
er-
De
cem
be
r
Tota
l
Gro
ss w
ritt
en p
rem
ium
2,6
47,
682
2,4
29
,85
6
3,8
47,
111
4
,18
3,9
56
1
3,1
08
,60
5
2,5
28
,25
7
2,5
95
,43
7
2,9
58
,29
6
3,5
65
,76
6
11
,64
7,7
56
Pre
miu
m c
eded t
o r
ein
sure
rs (
118,8
62)
(14
6,3
10)
(16
2,2
46
) (
16
2,4
59
) (
58
9,8
77
) 1
,610
(
161
,45
6)
(17
3,7
17)
(19
2,2
19)
(5
25
,78
2)
Net
wri
tten
pre
miu
m 2
,528,8
20
2,2
83
,54
6
3,6
84
,86
5
4,0
21
,49
7 1
2,5
18
,72
8
2,5
29
,86
7
2,4
33
,98
1
2,7
84
,57
9
3,3
73
,54
7
11
,12
1,9
74
Oth
er
reven
ue
Net
inve
stm
ent
inco
me
1,2
73,9
22
1,2
12
,42
9
1,2
66
,25
3
1,2
79
,82
8
5,0
32
,43
2
1,0
83
,55
8
1,1
49
,02
4
1,1
46
,50
0
1,1
85
,76
24
,56
4,8
44
Net
real
ised g
ains
/ (lo
sses)
(78,8
81)
(2
99
,24
0)
(8
5,1
70
) 6
1,1
10
(4
02
,18
1)
6,4
41
(4
,55
1)
(2
,57
8)
25
,001
2
4,3
13
Net
fair v
alue g
ains
/ (lo
sses)
11,8
46
(3
42
,57
8)
33
2,8
83
2
75
,02
8
27
7,17
9
(4
97,
28
3)
(2
78
,95
3)
25
3,4
62
2
24
,92
7
(2
97,
84
7)
Oth
er
inco
me
10,3
88
9,0
15
8
,35
4
15
,82
7
43
,58
4
9,1
81
9
,86
3
13
,75
5
15
,84
5
48
,64
4
Tota
l o
ther
reven
ue
1,2
17,
275
57
9,6
26
1
,52
2,3
20
1
,63
1,7
93
4,9
51
,014
6
01,8
97
8
75
,38
3
1,4
11,1
39
1
,45
1,5
35
4,3
39
,95
4
Tota
l n
et
reven
ue
3,7
46,0
95
2,8
63
,17
2
5,2
07,
18
5
5,6
53
,29
0 1
7,4
69
,74
2
3,1
31
,76
4
3,3
09
,36
4
4,1
95
,718
4
,82
5,0
82
15,4
61
,92
8
Be
ne
fits
, cl
aim
s an
d e
xp
en
ses
Net
insu
rance
benefits
and c
laim
s
pai
d (
682,7
44)
(76
8,6
13
) (
1,1
27,
49
7)
(1
,10
9,6
53
) (
3,6
88
,50
7)
(1
,02
5,4
15)
(7
29
,118
) (9
88
,712
) (9
25
,10
6)
(3
,66
8,3
51
)
Net
chan
ge in
insu
ran
ce c
laim
s
outs
tandin
g (
124,3
77)
(4
6,4
59
) 5
6,6
51
9
,113
(
105
,07
2)
99
,60
2
(10
1,9
62
) 1
23
,17
9
43
,64
8
16
4,4
67
Ch
ange in
contr
act
liabili
ties
-
Life
Fund
(1,4
65,9
13)
(76
7,2
29
) (
2,4
96
,59
0)
(1
,47
7,5
21
) (
6,2
07,
25
3)
(8
31
,75
5)
(1
,08
5,7
68
) (1
,85
7,4
94
) (1
,20
8,2
56
) (4
,98
3,2
73
)
Underw
riting a
nd n
et
acquis
itio
n
cost
s (in
cludin
g r
ein
sura
nce
) (
539,4
98)
(3
70
,97
7)
(5
76,2
42
) (
65
8,4
13
) (
2,1
45
,13
0)
(4
92
,03
2)
(4
19,1
95
) (5
00
,28
0)
(4
45
,88
9)
(1
,85
7,3
96
)
Oth
er
opera
ting
, ad
min
istr
ativ
e a
nd
se
lling e
xpense
s (
638,1
62)
(6
43
,03
8)
(7
90
,50
6)
(1
,18
4,4
00
) (
3,2
56
,10
6)
(6
02
,79
5)
(7
27,
37
8)
(6
94
,95
4)
(9
88
,62
8)
(3
,013
,75
5)
Depre
ciat
ion a
nd a
mo
rtis
atio
n (
87,
515)
(8
6,2
98
) (
85
,88
7)
(13
0,5
71
) (
39
0,2
71
) (
64
,05
4)
(6
7,8
85
) (8
8,1
93
) (7
9,7
62
) (2
99
,89
4)
Tota
l b
en
efi
ts, cl
aim
s an
d
exp
en
ses
(3,5
38,2
09)
(2,6
82
,614
) (
5,0
20
,07
1)
(4,5
51
,44
5)
(15
,79
2,3
39
) (
2,9
16,4
49
) (
3,1
31
,30
6)
(4
,00
6,4
54
) (3
,60
3,9
93
) (1
3,6
58
,20
2)
Pro
fit
fro
m o
pera
tio
ns
207,
886
18
0,5
58
1
87,
114
1
,101
,84
5 1
,67
7,4
03
2
15,3
15
17
8,0
58
1
89
,26
4
1,2
21
,08
91
,80
3,7
26
Sh
are o
f re
sults
of
eq
uit
y ac
counte
d
inve
stee, net
of
tax
27,
162
49
,19
4
24
,14
4
15
,93
8 1
16
,43
8
30
,518
2
9,4
01
26
,876
1
7,9
41
1
04
,73
6
Pro
fit
befo
re t
ax
235,0
48
22
9,7
52
2
11,2
58
1
,117,
78
3 1
,79
3,8
41
2
45
,83
3
20
7,4
59
2
16,1
40
1
,23
9,0
30
1,9
08
,46
2
Inco
me t
ax e
xpense
(67,
884)
(6
0,1
27
) (
61
,82
5)
(6
83
,40
9)
(8
73
,24
5)
(6
7,7
27
) (6
1,9
02
) (6
3,1
34
) (5
57,
66
9)
(7
50
,43
2)
Pro
fit
for
the y
ear
167,
164
16
9,6
25
1
49
,43
3
43
4,3
74 9
20
,59
6
17
8,1
06
1
45
,55
7
15
3,0
06
6
81
,36
1 1
,15
8,0
30

248 Union Assurance PLC
LIFE INSURANCE FUND INSURANCE REVENUE ACCOUNT
For the year ended 31 December 2020 2019
Rs. ‘000 Rs. ‘000
Gross written premium 13,108,605 11,647,756
Premium ceded to reinsurers (589,877) (525,782)
Net written premium 12,518,728 11,121,974
Net insurance benefits and claims paid (3,688,507) (3,668,351)
Net change in insurance claims outstanding (105,072) 164,467
Underwriting and net acquisition costs (net of reinsurance) (2,145,130) (1,857,396)
Other operating, selling and administrative expenses (3,209,994) (2,956,764)
Depreciation and amortisation (307,628) (263,506)
Underwriting surplus 3,062,397 2,540,424
Investment and other income 4,041,160 3,442,849
Change in contract liabilities - Life fund (6,207,253) (4,983,273)
Income tax expenses (71,304) -
Surplus from life insurance fund 825,000 1,000,000
Investment and other income not attributable to policyholders 939,021 926,419
Expenses not attributable to policyholders (157,922) (122,693)
Share of results of equity accounted investee, net of tax 116,438 104,736
Income tax expenses (801,941) (750,432)
Profit from shareholders’ fund 95,596 158,030
Profit for the year attributable to equity holders of the company 920,596 1,158,030

Union Assurance at a Glance Management Discussion and Analysis Stewardship Financial Statements Supplementary Information
249Annual Report 2020
LIFE INSURANCE FUND STATEMENT OF FINANCIAL POSITION
As at 31 December 2020 2019
Note Page Rs. ‘000 Rs. ‘000
Assets
Intangible assets 604,217 581,438
Property, plant and equipment 28 190 2,468,821 2,500,305
Right of use assets 29 195 218,312 296,799
Financial investments 1 252 42,354,151 36,142,412
Loans to life policyholders 33 210 1,793,470 1,555,759
Reinsurance receivable 34 211 492,011 502,975
Premiums receivable 35 212 376,723 344,785
Receivables and other assets 2 255 865,946 768,128
Cash in hand and at bank 3 255 951,139 624,552
Total assets 50,124,790 43,317,153
Reserves and liabilities
Reserves
Available for sale reserve 558,057 267,219
Revaluation reserve 4 255 1,609,828 1,613,544
Other reserves 5 255 1,318 (6,411)
Total reserves 2,169,203 1,874,352
Liabilities
Insurance contract liabilities 44 218 41,881,657 35,489,751
Insurance contract liabilities - Unit Linked 45 223 1,061,701 1,246,075
Lease liabilities 46 224 232,259 289,176
Employee benefit liabilities 47 224 194,753 162,957
Reinsurance payables 48 226 533,023 812,930
Other liabilities 7 255 3,891,389 3,273,484
Bank overdraft 37 214 160,805 168,428
Total liabilities 47,955,587 41,442,801
Total reserves and liabilities 50,124,790 43,317,153
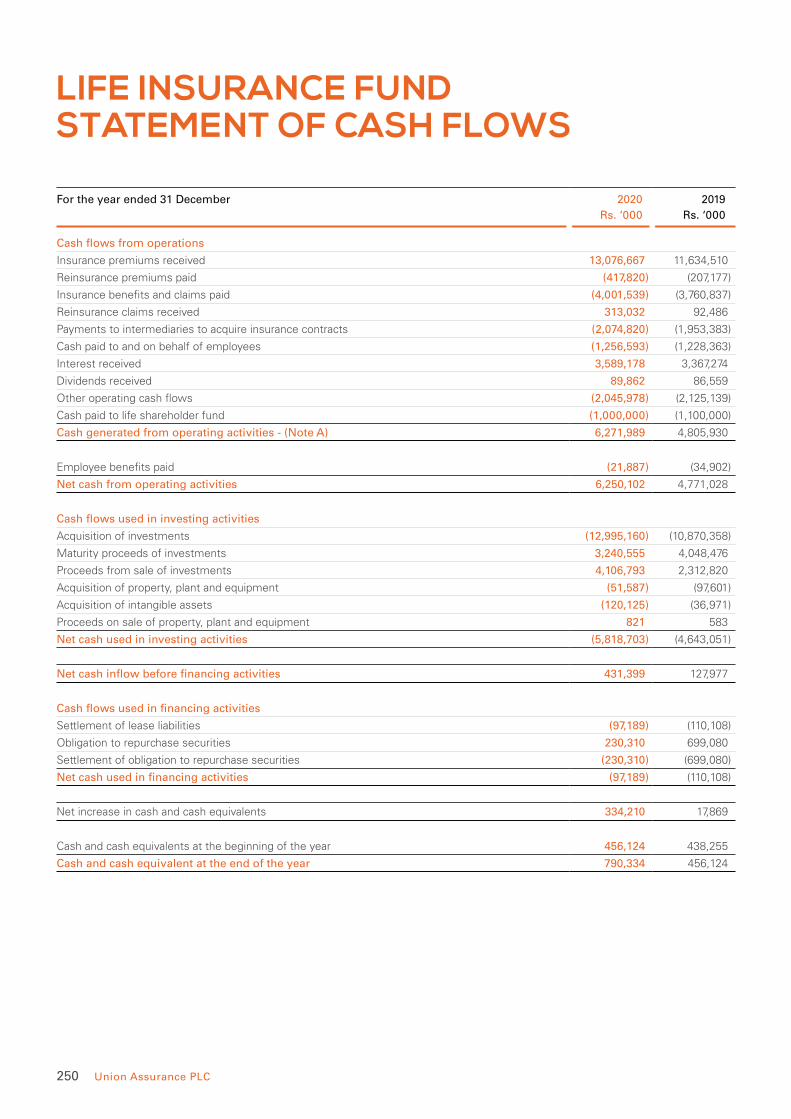
250 Union Assurance PLC
LIFE INSURANCE FUND STATEMENT OF CASH FLOWS
For the year ended 31 December 2020 2019
Rs. ‘000 Rs. ‘000
Cash flows from operations
Insurance premiums received 13,076,667 11,634,510
Reinsurance premiums paid (417,820) (207,177)
Insurance benefits and claims paid (4,001,539) (3,760,837)
Reinsurance claims received 313,032 92,486
Payments to intermediaries to acquire insurance contracts (2,074,820) (1,953,383)
Cash paid to and on behalf of employees (1,256,593) (1,228,363)
Interest received 3,589,178 3,367,274
Dividends received 89,862 86,559
Other operating cash flows (2,045,978) (2,125,139)
Cash paid to life shareholder fund (1,000,000) (1,100,000)
Cash generated from operating activities - (Note A) 6,271,989 4,805,930
Employee benefits paid (21,887) (34,902)
Net cash from operating activities 6,250,102 4,771,028
Cash flows used in investing activities
Acquisition of investments (12,995,160) (10,870,358)
Maturity proceeds of investments 3,240,555 4,048,476
Proceeds from sale of investments 4,106,793 2,312,820
Acquisition of property, plant and equipment (51,587) (97,601)
Acquisition of intangible assets (120,125) (36,971)
Proceeds on sale of property, plant and equipment 821 583
Net cash used in investing activities (5,818,703) (4,643,051)
Net cash inflow before financing activities 431,399 127,977
Cash flows used in financing activities
Settlement of lease liabilities (97,189) (110,108)
Obligation to repurchase securities 230,310 699,080
Settlement of obligation to repurchase securities (230,310) (699,080)
Net cash used in financing activities (97,189) (110,108)
Net increase in cash and cash equivalents 334,210 17,869
Cash and cash equivalents at the beginning of the year 456,124 438,255
Cash and cash equivalent at the end of the year 790,334 456,124
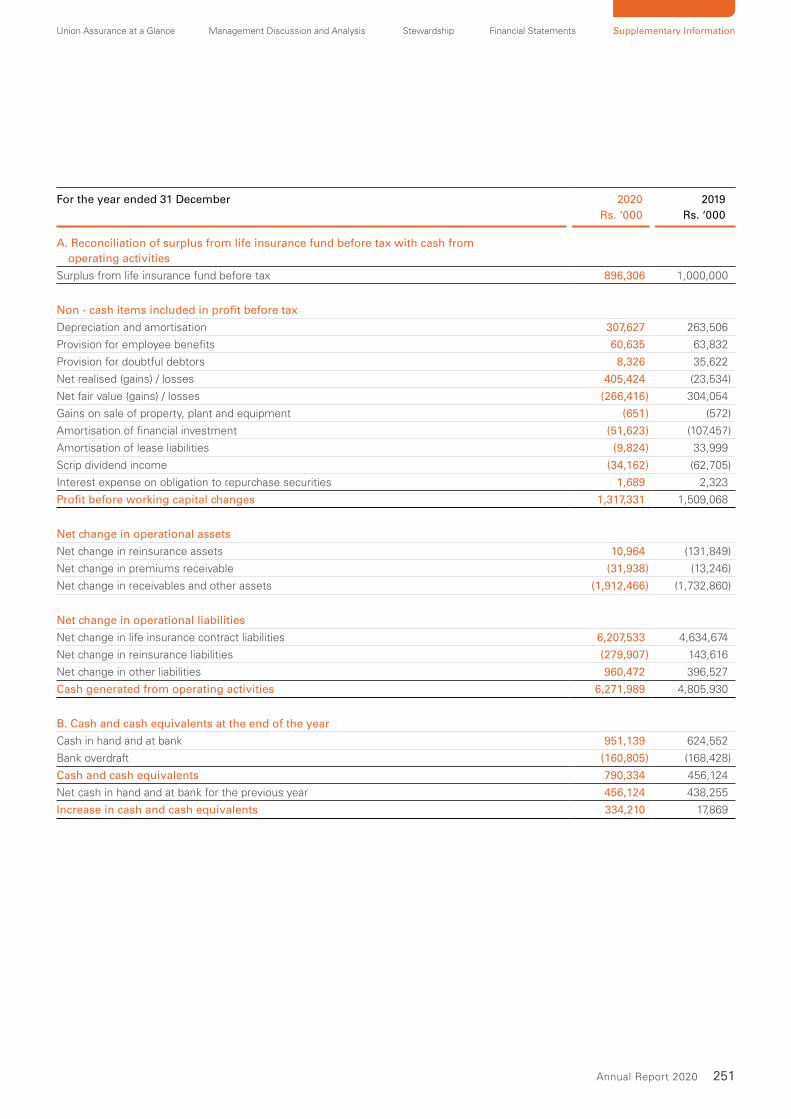
Union Assurance at a Glance Management Discussion and Analysis Stewardship Financial Statements Supplementary Information
251Annual Report 2020
For the year ended 31 December 2020 2019
Rs. ‘000 Rs. ‘000
A. Reconciliation of surplus from life insurance fund before tax with cash from
operating activities
Surplus from life insurance fund before tax 896,306 1,000,000
Non - cash items included in profit before tax
Depreciation and amortisation 307,627 263,506
Provision for employee benefits 60,635 63,832
Provision for doubtful debtors 8,326 35,622
Net realised (gains) / losses 405,424 (23,534)
Net fair value (gains) / losses (266,416) 304,054
Gains on sale of property, plant and equipment (651) (572)
Amortisation of financial investment (51,623) (107,457)
Amortisation of lease liabilities (9,824) 33,999
Scrip dividend income (34,162) (62,705)
Interest expense on obligation to repurchase securities 1,689 2,323
Profit before working capital changes 1,317,331 1,509,068
Net change in operational assets
Net change in reinsurance assets 10,964 (131,849)
Net change in premiums receivable (31,938) (13,246)
Net change in receivables and other assets (1,912,466) (1,732,860)
Net change in operational liabilities
Net change in life insurance contract liabilities 6,207,533 4,634,674
Net change in reinsurance liabilities (279,907) 143,616
Net change in other liabilities 960,472 396,527
Cash generated from operating activities 6,271,989 4,805,930
B. Cash and cash equivalents at the end of the year
Cash in hand and at bank 951,139 624,552
Bank overdraft (160,805) (168,428)
Cash and cash equivalents 790,334 456,124
Net cash in hand and at bank for the previous year 456,124 438,255
Increase in cash and cash equivalents 334,210 17,869

252 Union Assurance PLC
LIFE INSURANCE FUND NOTES TO THE STATEMENT OF FINANCIAL POSITION
1 FINANCIAL INVESTMENTSRefer Note 26 for the accounting policy
As at 31 December 2020 2019
Rs. ‘000 Note Carrying
Value
Fair Value Carrying
Value
Fair Value
Held to maturity financial assets (HTM) 1.1 18,710,892 23,087,756 17,402,472 18,568,401
Loans and receivables (L&R) 1.2 15,513,028 16,544,176 11,201,304 11,458,080
Available for sale financial assets (AFS) 1.3 3,524,525 3,524,525 4,132,224 4,132,224
Financial assets at fair value through profit or loss (FVTPL) 1.4 4,605,706 4,605,706 3,406,412 3,406,412
Total financial investments 42,354,151 47,762,163 36,142,412 37,565,117
1.1 Held to Maturity Financial Assets (HTM)
As at 31 December 2020 2019
Note Carrying
Value
Carrying
Value
Amortised cost
Quoted debentures 32.3(a) 216,450 216,505
Treasury bonds 18,494,442 17,185,967
Total HTM financial
investments 18,710,892 17,402,472
1.2 Loans and Receivables (L&R)
As at 31 December 2020 2019
Note Carrying
Value
Carrying
Value
Amortised cost
Bank deposits 3,897,877 1,660,991
Quoted debentures 1.2(a) 9,542,799 7,649,908
Commercial Papers 413,504 -
Reverse repurchase
agreements 1,658,848 1,890,405
Total L&R financial
investments 15,513,028 11,201,304
1.2 (a) Quoted Debentures - Banks and Finance
As at 31 December 2020
Issuer Credit
Rating
Maturity
date
No. of
debentures
Carrying
value
Market
value
Interest
Rs. ‘000 Rs. ‘000 %
Commercial Bank of Ceylon PLC AA- 3/9/21 250,000 25,841 25,962 10.75
Citizens Development Business Finance PLC A- 6/3/21 515,390 52,732 52,841 12.75
Seylan Bank PLC BBB+ 7/15/21 950,400 100,888 103,346 13.00
Siyapatha Finance PLC A 9/20/21 102,400 10,576 11,096 13.50
Singer Sri Lanka PLC BBB+ 9/28/21 3,500,000 360,508 372,906 12.00
Bank of Ceylon AA- 10/24/21 242,499 24,904 26,164 13.25
Nations Trust Bank PLC BBB+ 11/8/21 3,000,000 305,428 318,266 12.65
People's Leasing & Finance PLC A+ 11/16/21 2,000,000 202,996 213,015 12.60
Bank of Ceylon AA- 12/29/21 2,000,000 201,120 213,062 13.25
Lanka Orix Leasing Company PLC A 7/31/22 500,000 52,871 56,697 13.00
National Savings Bank AAA 9/10/22 1,500,000 154,934 165,849 11.00
LB Finance PLC A- 12/11/22 1,000,000 100,660 109,236 12.75
LB Finance PLC BBB+ 12/11/22 1,000,000 100,685 109,667 13.25
Sampath Bank PLC A 12/21/22 1,950,000 199,178 216,695 12.50
Sampath Bank PLC A 3/20/23 2,500,000 258,644 283,166 12.50
DFCC Bank PLC A- 3/29/23 2,000,000 218,890 237,744 12.60
Nations Trust Bank PLC BBB+ 4/20/23 2,875,000 313,019 341,584 13.00
Siyapatha Finance PLC A 7/7/23 3,969,600 418,128 418,738 11.25

Union Assurance at a Glance Management Discussion and Analysis Stewardship Financial Statements Supplementary Information
253Annual Report 2020
As at 31 December 2020
Issuer Credit
Rating
Maturity
date
No. of
debentures
Carrying
value
Market
value
Interest
Rs. ‘000 Rs. ‘000 %
Hatton National Bank PLC AA+ 8/30/23 1,204,706 109,542 127,471 8.00
Bank of Ceylon AA- 10/25/23 452,300 47,080 53,556 13.75
Hatton National Bank PLC AA- 11/1/23 724,000 73,920 84,371 13.00
National Development Bank PLC A- 12/19/23 4,500,000 516,643 579,066 13.90
Sampath Bank PLC A 2/28/24 1,500,000 173,660 191,406 13.90
Seylan Bank PLC BBB+ 4/18/24 2,000,000 220,697 254,028 15.00
Siyapatha Finance PLC BBB+ 8/8/24 2,760,000 290,197 312,796 13.33
Hayleys PLC A+ 8/26/24 500,000 52,275 60,118 13.00
Nations Trust Bank PLC BBB+ 12/23/24 1,000,000 100,316 113,437 12.80
HNB Finance Limited A 12/30/24 6,000,000 600,365 698,194 13.20
First Capital Treasuries PLC A- 1/30/25 1,500,000 157,224 178,256 12.75
DFCC Bank PLC A- 3/29/25 3,000,000 329,162 374,347 13.00
Seylan Bank PLC BBB+ 3/29/25 2,000,000 206,587 236,680 13.20
DFCC Bank PLC A+ 6/12/25 3,270,000 346,523 380,476 11.00
National Development Bank PLC A- 9/25/25 5,000,000 512,325 512,753 9.50
DFCC Bank PLC A- 10/23/25 3,000,000 304,997 305,178 9.00
Hatton National Bank PLC AA- 9/23/26 864,100 89,326 107,359 12.80
Nations Trust Bank PLC BBB+ 12/23/26 3,000,000 300,970 351,615 12.90
Peoples Bank AA 11/8/27 4,370,000 444,633 538,196 12.25
Seylan Bank PLC BBB+ 3/29/28 3,000,000 310,119 375,892 13.50
Sri Lanka Telecom PLC AA+ 4/19/28 2,000,000 205,053 259,675 12.75
Commercial Bank of Ceylon PLC AA- 7/23/28 5,000,000 527,624 640,290 12.50
Peoples Bank AA- 7/27/30 5,000,000 521,559 562,664 10.25
9,542,799 10,573,858
1.2 (a) Quoted Debentures - Banks and Finance
As at 31 December 2019
Issuer Credit
Rating
Maturity
date
No. of
debentures
Carrying
value
Market
value
Interest
Rs. ‘000 Rs. ‘000 %
Central Finance Company PLC A+ 1/6/20 400,000 43,277 43,737 9.52
National Development Bank PLC A 24/6/20 2,429,000 228,896 201,742 -
National Development Bank PLC A 24/6/20 1,850,000 199,661 232,116 9.40
Senkadagala Finance PLC BBB+ 10/11/20 500,000 50,812 51,029 13.75
Commercial Bank of Ceylon PLC AA- 9/3/21 250,000 25,926 23,339 10.75
Seylan Bank PLC BBB+ 15/7/21 950,400 101,168 100,794 13.00
Siyapatha Finance Limited A- 20/9/21 102,400 10,533 11,048 13.50
Singer Sri Lanka PLC A- 28/9/21 3,500,000 360,611 367,876 12.00
Bank of Ceylon AA 24/10/21 242,499 25,011 26,228 13.25
Nations Trust Bank PLC A- 8/11/21 3,000,000 305,494 305,615 12.65
People's Leasing Company PLC AA- 16/11/21 2,000,000 203,040 203,107 12.60
Bank of Ceylon AA 29/12/21 2,000,000 202,062 200,825 13.25
Lanka Orix Leasing Company PLC A 31/7/22 500,000 52,883 54,978 13.00
National Savings Bank AAA 10/9/22 1,500,000 154,917 159,282 11.00

254 Union Assurance PLC
LIFE INSURANCE FUND NOTES TO THE STATEMENT OF FINANCIAL POSITION
As at 31 December 2019
Issuer Credit
Rating
Maturity
date
No. of
debentures
Carrying
value
Market
value
Interest
Rs. ‘000 Rs. ‘000 %
LB Finance PLC A- 11/12/22 1,000,000 100,669 104,788 12.75
LB Finance PLC BBB+ 11/12/22 1,000,000 100,694 101,066 13.25
Sampath Bank PLC A 21/12/22 1,600,000 160,569 167,413 12.50
Sampath Bank PLC A 20/3/23 2,500,000 258,682 262,618 12.50
DFCC Bank PLC A+ 29/3/23 2,000,000 219,008 222,353 12.60
Nations Trust Bank PLC A- 20/4/23 2,875,000 313,036 325,566 13.00
Hatton National Bank PLC AA- 30/8/23 1,204,706 105,328 113,779 8.00
Bank of Ceylon AA 25/10/23 452,300 47,298 47,393 13.75
Hatton National Bank PLC A+ 1/11/23 724,000 73,909 73,969 13.00
National Development Bank PLC A 19/12/23 4,500,000 517,722 520,290 13.90
Sampath Bank PLC A 28/2/24 1,000,000 111,565 116,541 13.90
Seylan Bank PLC BBB+ 18/4/24 2,000,000 220,761 236,185 15.00
Siyapatha Finance Limited BBB+ 8/8/24 2,760,000 290,146 302,628 13.33
Hayleys PLC A+ 26/8/24 500,000 52,254 52,261 13.00
Nations Trust Bank PLC A- 23/12/24 1,000,000 100,299 103,948 12.80
HNB Finance Limited BBB+ 30/12/24 6,000,000 600,216 625,475 13.20
DFCC Bank PLC A+ 29/3/25 3,000,000 329,249 348,342 13.00
Seylan Bank PLC BBB+ 29/3/25 2,000,000 206,614 206,727 13.20
Hatton National Bank PLC A+ 23/9/26 864,100 89,307 94,832 12.80
Nations Trust Bank PLC A- 23/12/26 3,000,000 300,904 314,030 12.90
Peoples Bank AA 8/11/27 4,370,000 444,533 473,760 12.25
Seylan Bank PLC BBB+ 29/3/28 3,000,000 310,152 326,974 13.50
Sri Lanka Telecom PLC AA+ 19/4/28 2,000,000 205,070 225,013 12.75
Commercial Bank of Ceylon PLC AA- 23/7/28 5,000,000 527,632 559,018 12.50
7,649,908 7,906,685
1.3 Available for Sale Financial Assets (AFS)
As at 31 December 2020 2019
Rs. ‘000 Rs. ‘000
Fair value
Treasury bonds 3,524,525 4,132,224
Total AFS financial
investments 3,524,525 4,132,224
1.4 Financial Assets at Fair Value Through Profit or Loss (FVTPL)
As at 31 December 2020 2019
Note Carrying
Value
Carrying
Value
Fair value
Quoted equities 32.6(a) 2,884,723 2,059,968
Unit Trusts 667,626 101,558
3,552,349 2,161,526
Investments in unit
linked funds
Quoted equities 32.6(b) 783,223 949,024
Commercial Papers 10,259 -
Reverse repurchase
agreements 82,998 112,386
Treasury bills - 26,649
Bank deposits 28,444 16,292
Debentures 148,433 140,535
1,053,357 1,244,886
4,605,706 3,406,412
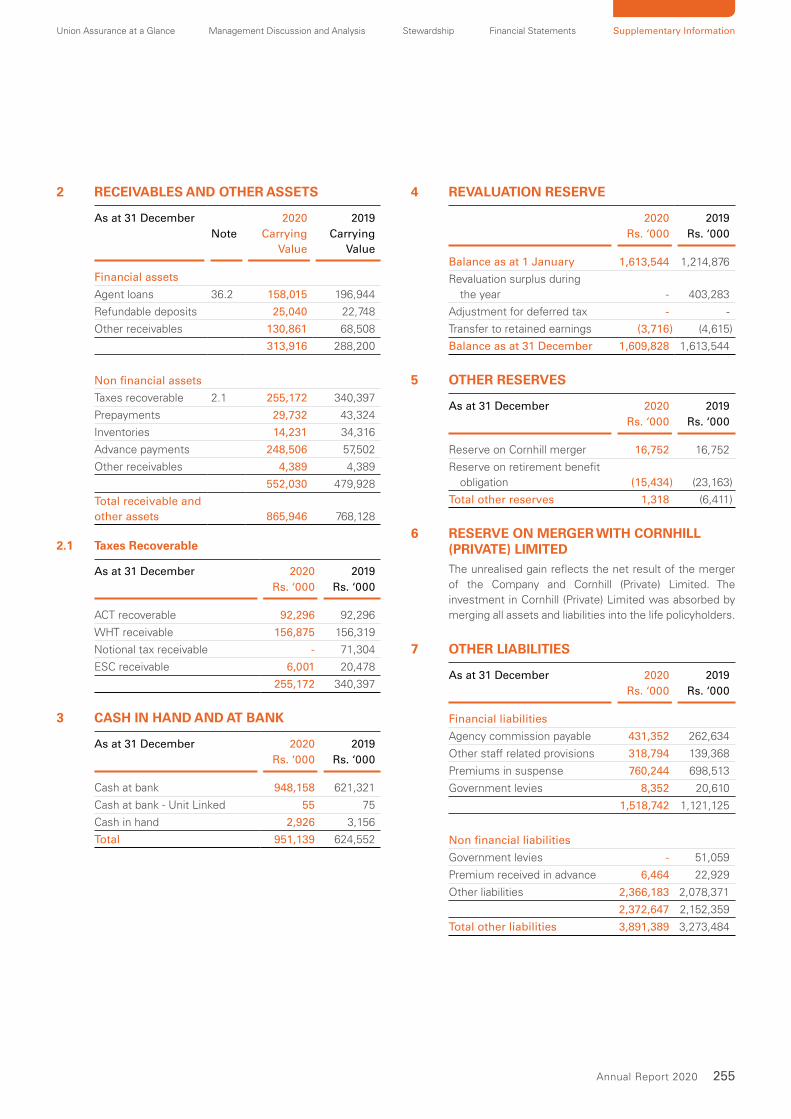
Union Assurance at a Glance Management Discussion and Analysis Stewardship Financial Statements Supplementary Information
255Annual Report 2020
2 RECEIVABLES AND OTHER ASSETS
As at 31 December 2020 2019
Note Carrying
Value
Carrying
Value
Financial assets
Agent loans 36.2 158,015 196,944
Refundable deposits 25,040 22,748
Other receivables 130,861 68,508
313,916 288,200
Non financial assets
Taxes recoverable 2.1 255,172 340,397
Prepayments 29,732 43,324
Inventories 14,231 34,316
Advance payments 248,506 57,502
Other receivables 4,389 4,389
552,030 479,928
Total receivable and
other assets 865,946 768,128
2.1 Taxes Recoverable
As at 31 December 2020 2019
Rs. ‘000 Rs. ‘000
ACT recoverable 92,296 92,296
WHT receivable 156,875 156,319
Notional tax receivable - 71,304
ESC receivable 6,001 20,478
255,172 340,397
3 CASH IN HAND AND AT BANK
As at 31 December 2020 2019
Rs. ‘000 Rs. ‘000
Cash at bank 948,158 621,321
Cash at bank - Unit Linked 55 75
Cash in hand 2,926 3,156
Total 951,139 624,552
4 REVALUATION RESERVE
2020 2019
Rs. ‘000 Rs. ‘000
Balance as at 1 January 1,613,544 1,214,876
Revaluation surplus during
the year - 403,283
Adjustment for deferred tax - -
Transfer to retained earnings (3,716) (4,615)
Balance as at 31 December 1,609,828 1,613,544
5 OTHER RESERVES
As at 31 December 2020 2019
Rs. ‘000 Rs. ‘000
Reserve on Cornhill merger 16,752 16,752
Reserve on retirement benefit
obligation (15,434) (23,163)
Total other reserves 1,318 (6,411)
6 RESERVE ON MERGER WITH CORNHILL (PRIVATE) LIMITEDThe unrealised gain reflects the net result of the merger
of the Company and Cornhill (Private) Limited. The
investment in Cornhill (Private) Limited was absorbed by
merging all assets and liabilities into the life policyholders.
7 OTHER LIABILITIES
As at 31 December 2020 2019
Rs. ‘000 Rs. ‘000
Financial liabilities
Agency commission payable 431,352 262,634
Other staff related provisions 318,794 139,368
Premiums in suspense 760,244 698,513
Government levies 8,352 20,610
1,518,742 1,121,125
Non financial liabilities
Government levies - 51,059
Premium received in advance 6,464 22,929
Other liabilities 2,366,183 2,078,371
2,372,647 2,152,359
Total other liabilities 3,891,389 3,273,484
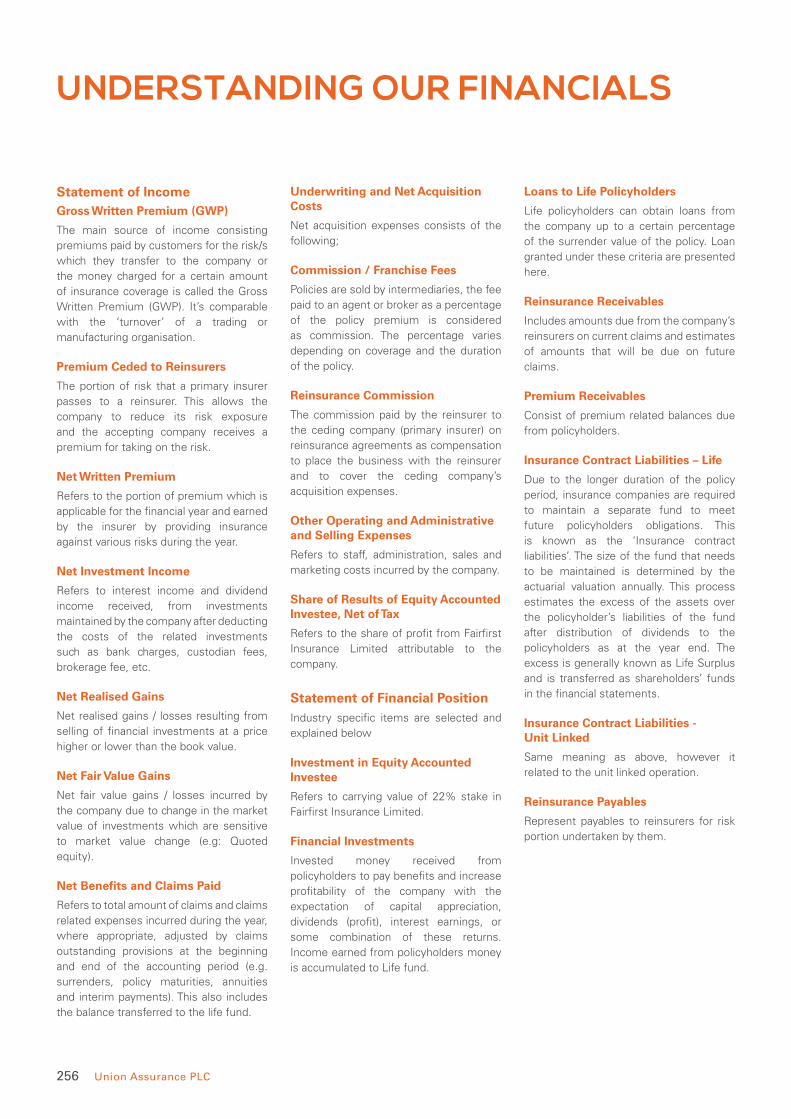
256 Union Assurance PLC
UNDERSTANDING OUR FINANCIALS
Statement of IncomeGross Written Premium (GWP)
The main source of income consisting
premiums paid by customers for the risk/s
which they transfer to the company or
the money charged for a certain amount
of insurance coverage is called the Gross
Written Premium (GWP). It’s comparable
with the ‘turnover’ of a trading or
manufacturing organisation.
Premium Ceded to Reinsurers
The portion of risk that a primary insurer
passes to a reinsurer. This allows the
company to reduce its risk exposure
and the accepting company receives a
premium for taking on the risk.
Net Written Premium
Refers to the portion of premium which is
applicable for the financial year and earned
by the insurer by providing insurance
against various risks during the year.
Net Investment Income
Refers to interest income and dividend
income received, from investments
maintained by the company after deducting
the costs of the related investments
such as bank charges, custodian fees,
brokerage fee, etc.
Net Realised Gains
Net realised gains / losses resulting from
selling of financial investments at a price
higher or lower than the book value.
Net Fair Value Gains
Net fair value gains / losses incurred by
the company due to change in the market
value of investments which are sensitive
to market value change (e.g: Quoted
equity).
Net Benefits and Claims Paid
Refers to total amount of claims and claims
related expenses incurred during the year,
where appropriate, adjusted by claims
outstanding provisions at the beginning
and end of the accounting period (e.g.
surrenders, policy maturities, annuities
and interim payments). This also includes
the balance transferred to the life fund.
Underwriting and Net Acquisition Costs
Net acquisition expenses consists of the
following;
Commission / Franchise Fees
Policies are sold by intermediaries, the fee
paid to an agent or broker as a percentage
of the policy premium is considered
as commission. The percentage varies
depending on coverage and the duration
of the policy.
Reinsurance Commission
The commission paid by the reinsurer to
the ceding company (primary insurer) on
reinsurance agreements as compensation
to place the business with the reinsurer
and to cover the ceding company’s
acquisition expenses.
Other Operating and Administrative and Selling Expenses
Refers to staff, administration, sales and
marketing costs incurred by the company.
Share of Results of Equity Accounted Investee, Net of Tax
Refers to the share of profit from Fairfirst
Insurance Limited attributable to the
company.
Statement of Financial PositionIndustry specific items are selected and
explained below
Investment in Equity Accounted Investee
Refers to carrying value of 22% stake in
Fairfirst Insurance Limited.
Financial Investments
Invested money received from
policyholders to pay benefits and increase
profitability of the company with the
expectation of capital appreciation,
dividends (profit), interest earnings, or
some combination of these returns.
Income earned from policyholders money
is accumulated to Life fund.
Loans to Life Policyholders
Life policyholders can obtain loans from
the company up to a certain percentage
of the surrender value of the policy. Loan
granted under these criteria are presented
here.
Reinsurance Receivables
Includes amounts due from the company’s
reinsurers on current claims and estimates
of amounts that will be due on future
claims.
Premium Receivables
Consist of premium related balances due
from policyholders.
Insurance Contract Liabilities – Life
Due to the longer duration of the policy
period, insurance companies are required
to maintain a separate fund to meet
future policyholders obligations. This
is known as the ‘Insurance contract
liabilities’. The size of the fund that needs
to be maintained is determined by the
actuarial valuation annually. This process
estimates the excess of the assets over
the policyholder’s liabilities of the fund
after distribution of dividends to the
policyholders as at the year end. The
excess is generally known as Life Surplus
and is transferred as shareholders’ funds
in the financial statements.
Insurance Contract Liabilities - Unit Linked
Same meaning as above, however it
related to the unit linked operation.
Reinsurance Payables
Represent payables to reinsurers for risk
portion undertaken by them.
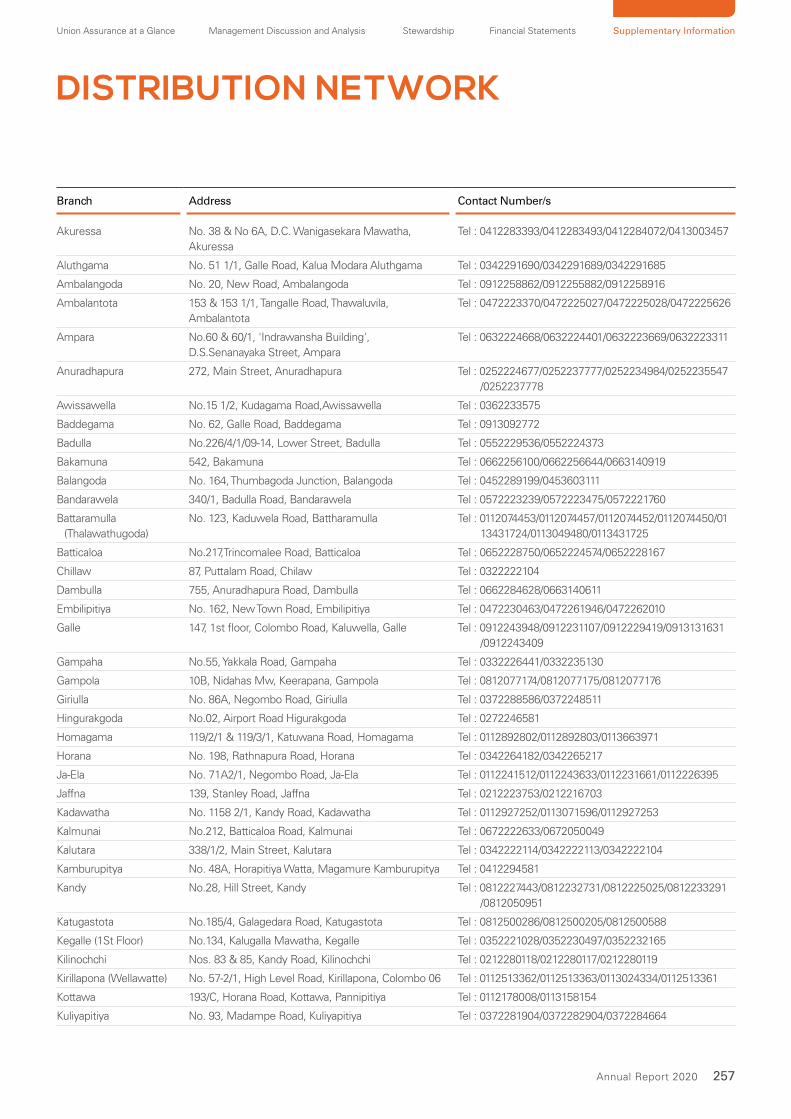
Union Assurance at a Glance Management Discussion and Analysis Stewardship Financial Statements Supplementary Information
257Annual Report 2020
DISTRIBUTION NETWORK
Branch Address Contact Number/s
Akuressa No. 38 & No 6A, D.C. Wanigasekara Mawatha,
Akuressa
Tel : 0412283393/0412283493/0412284072/0413003457
Aluthgama No. 51 1/1, Galle Road, Kalua Modara Aluthgama Tel : 0342291690/0342291689/0342291685
Ambalangoda No. 20, New Road, Ambalangoda Tel : 0912258862/0912255882/0912258916
Ambalantota 153 & 153 1/1, Tangalle Road, Thawaluvila,
Ambalantota
Tel : 0472223370/0472225027/0472225028/0472225626
Ampara No.60 & 60/1, 'Indrawansha Building',
D.S.Senanayaka Street, Ampara
Tel : 0632224668/0632224401/0632223669/0632223311
Anuradhapura 272, Main Street, Anuradhapura Tel : 0252224677/0252237777/0252234984/0252235547
/0252237778
Awissawella No.15 1/2, Kudagama Road,Awissawella Tel : 0362233575
Baddegama No. 62, Galle Road, Baddegama Tel : 0913092772
Badulla No.226/4/1/09-14, Lower Street, Badulla Tel : 0552229536/0552224373
Bakamuna 542, Bakamuna Tel : 0662256100/0662256644/0663140919
Balangoda No. 164, Thumbagoda Junction, Balangoda Tel : 0452289199/0453603111
Bandarawela 340/1, Badulla Road, Bandarawela Tel : 0572223239/0572223475/0572221760
Battaramulla
(Thalawathugoda)
No. 123, Kaduwela Road, Battharamulla Tel : 0112074453/0112074457/0112074452/0112074450/01
13431724/0113049480/0113431725
Batticaloa No.217,Trincomalee Road, Batticaloa Tel : 0652228750/0652224574/0652228167
Chillaw 87, Puttalam Road, Chilaw Tel : 0322222104
Dambulla 755, Anuradhapura Road, Dambulla Tel : 0662284628/0663140611
Embilipitiya No. 162, New Town Road, Embilipitiya Tel : 0472230463/0472261946/0472262010
Galle 147, 1st floor, Colombo Road, Kaluwella, Galle Tel : 0912243948/0912231107/0912229419/0913131631
/0912243409
Gampaha No.55, Yakkala Road, Gampaha Tel : 0332226441/0332235130
Gampola 10B, Nidahas Mw, Keerapana, Gampola Tel : 0812077174/0812077175/0812077176
Giriulla No. 86A, Negombo Road, Giriulla Tel : 0372288586/0372248511
Hingurakgoda No.02, Airport Road Higurakgoda Tel : 0272246581
Homagama 119/2/1 & 119/3/1, Katuwana Road, Homagama Tel : 0112892802/0112892803/0113663971
Horana No. 198, Rathnapura Road, Horana Tel : 0342264182/0342265217
Ja-Ela No. 71A2/1, Negombo Road, Ja-Ela Tel : 0112241512/0112243633/0112231661/0112226395
Jaffna 139, Stanley Road, Jaffna Tel : 0212223753/0212216703
Kadawatha No. 1158 2/1, Kandy Road, Kadawatha Tel : 0112927252/0113071596/0112927253
Kalmunai No.212, Batticaloa Road, Kalmunai Tel : 0672222633/0672050049
Kalutara 338/1/2, Main Street, Kalutara Tel : 0342222114/0342222113/0342222104
Kamburupitya No. 48A, Horapitiya Watta, Magamure Kamburupitya Tel : 0412294581
Kandy No.28, Hill Street, Kandy Tel : 0812227443/0812232731/0812225025/0812233291
/0812050951
Katugastota No.185/4, Galagedara Road, Katugastota Tel : 0812500286/0812500205/0812500588
Kegalle (1St Floor) No.134, Kalugalla Mawatha, Kegalle Tel : 0352221028/0352230497/0352232165
Kilinochchi Nos. 83 & 85, Kandy Road, Kilinochchi Tel : 0212280118/0212280117/0212280119
Kirillapona (Wellawatte) No. 57-2/1, High Level Road, Kirillapona, Colombo 06 Tel : 0112513362/0112513363/0113024334/0112513361
Kottawa 193/C, Horana Road, Kottawa, Pannipitiya Tel : 0112178008/0113158154
Kuliyapitiya No. 93, Madampe Road, Kuliyapitiya Tel : 0372281904/0372282904/0372284664
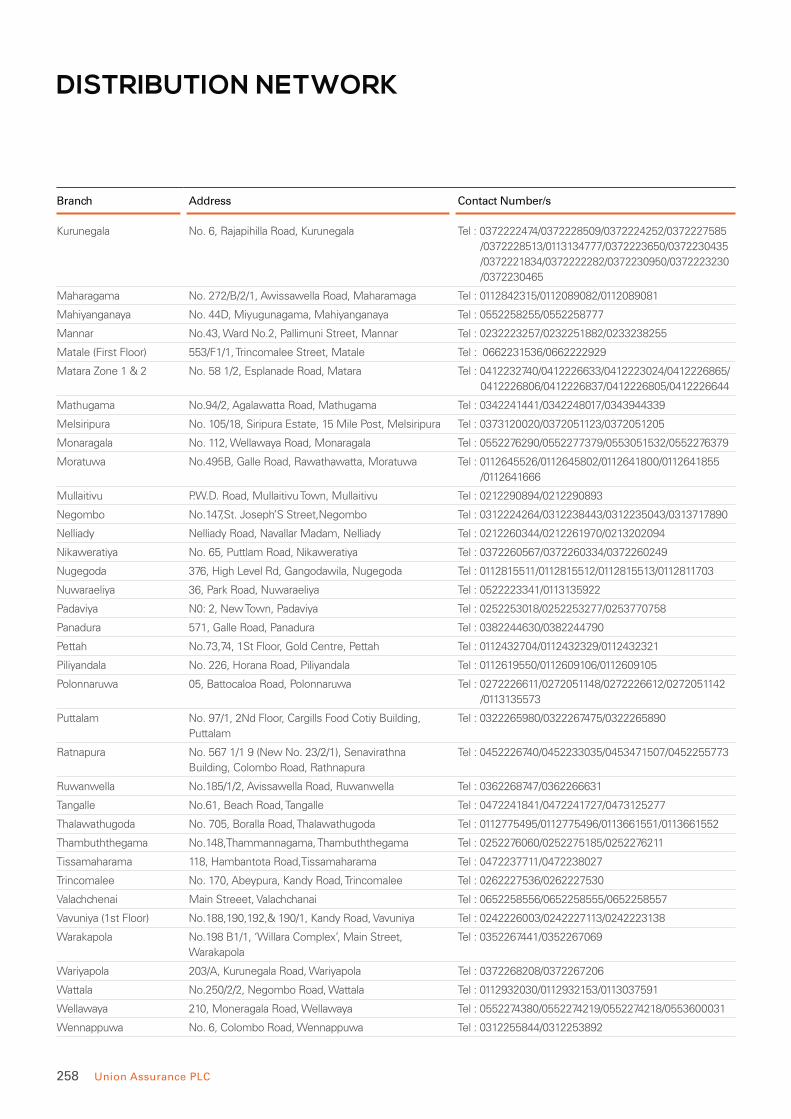
258 Union Assurance PLC
Branch Address Contact Number/s
Kurunegala No. 6, Rajapihilla Road, Kurunegala Tel : 0372222474/0372228509/0372224252/0372227585
/0372228513/0113134777/0372223650/0372230435
/0372221834/0372222282/0372230950/0372223230
/0372230465
Maharagama No. 272/B/2/1, Awissawella Road, Maharamaga Tel : 0112842315/0112089082/0112089081
Mahiyanganaya No. 44D, Miyugunagama, Mahiyanganaya Tel : 0552258255/0552258777
Mannar No.43, Ward No.2, Pallimuni Street, Mannar Tel : 0232223257/0232251882/0233238255
Matale (First Floor) 553/F1/1, Trincomalee Street, Matale Tel : 0662231536/0662222929
Matara Zone 1 & 2 No. 58 1/2, Esplanade Road, Matara Tel : 0412232740/0412226633/0412223024/0412226865/
0412226806/0412226837/0412226805/0412226644
Mathugama No.94/2, Agalawatta Road, Mathugama Tel : 0342241441/0342248017/0343944339
Melsiripura No. 105/18, Siripura Estate, 15 Mile Post, Melsiripura Tel : 0373120020/0372051123/0372051205
Monaragala No. 112, Wellawaya Road, Monaragala Tel : 0552276290/0552277379/0553051532/0552276379
Moratuwa No.495B, Galle Road, Rawathawatta, Moratuwa Tel : 0112645526/0112645802/0112641800/0112641855
/0112641666
Mullaitivu P.W.D. Road, Mullaitivu Town, Mullaitivu Tel : 0212290894/0212290893
Negombo No.147,St. Joseph’S Street,Negombo Tel : 0312224264/0312238443/0312235043/0313717890
Nelliady Nelliady Road, Navallar Madam, Nelliady Tel : 0212260344/0212261970/0213202094
Nikaweratiya No. 65, Puttlam Road, Nikaweratiya Tel : 0372260567/0372260334/0372260249
Nugegoda 376, High Level Rd, Gangodawila, Nugegoda Tel : 0112815511/0112815512/0112815513/0112811703
Nuwaraeliya 36, Park Road, Nuwaraeliya Tel : 0522223341/0113135922
Padaviya N0: 2, New Town, Padaviya Tel : 0252253018/0252253277/0253770758
Panadura 571, Galle Road, Panadura Tel : 0382244630/0382244790
Pettah No.73,74, 1St Floor, Gold Centre, Pettah Tel : 0112432704/0112432329/0112432321
Piliyandala No. 226, Horana Road, Piliyandala Tel : 0112619550/0112609106/0112609105
Polonnaruwa 05, Battocaloa Road, Polonnaruwa Tel : 0272226611/0272051148/0272226612/0272051142
/0113135573
Puttalam No. 97/1, 2Nd Floor, Cargills Food Cotiy Building,
Puttalam
Tel : 0322265980/0322267475/0322265890
Ratnapura No. 567 1/1 9 (New No. 23/2/1), Senavirathna
Building, Colombo Road, Rathnapura
Tel : 0452226740/0452233035/0453471507/0452255773
Ruwanwella No.185/1/2, Avissawella Road, Ruwanwella Tel : 0362268747/0362266631
Tangalle No.61, Beach Road, Tangalle Tel : 0472241841/0472241727/0473125277
Thalawathugoda No. 705, Boralla Road, Thalawathugoda Tel : 0112775495/0112775496/0113661551/0113661552
Thambuththegama No.148,Thammannagama, Thambuththegama Tel : 0252276060/0252275185/0252276211
Tissamaharama 118, Hambantota Road,Tissamaharama Tel : 0472237711/0472238027
Trincomalee No. 170, Abeypura, Kandy Road, Trincomalee Tel : 0262227536/0262227530
Valachchenai Main Streeet, Valachchanai Tel : 0652258556/0652258555/0652258557
Vavuniya (1st Floor) No.188,190,192,& 190/1, Kandy Road, Vavuniya Tel : 0242226003/0242227113/0242223138
Warakapola No.198 B1/1, ‘Willara Complex’, Main Street,
Warakapola
Tel : 0352267441/0352267069
Wariyapola 203/A, Kurunegala Road, Wariyapola Tel : 0372268208/0372267206
Wattala No.250/2/2, Negombo Road, Wattala Tel : 0112932030/0112932153/0113037591
Wellawaya 210, Moneragala Road, Wellawaya Tel : 0552274380/0552274219/0552274218/0553600031
Wennappuwa No. 6, Colombo Road, Wennappuwa Tel : 0312255844/0312253892
DISTRIBUTION NETWORK
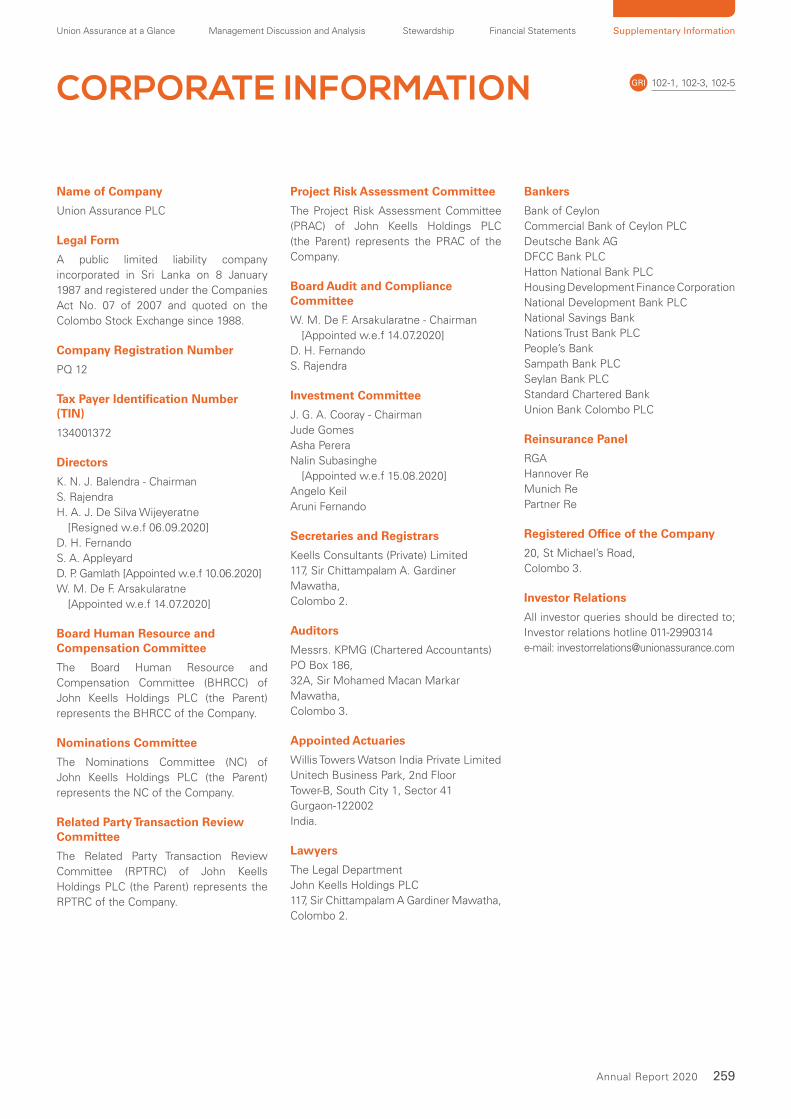
Union Assurance at a Glance Management Discussion and Analysis Stewardship Financial Statements Supplementary Information
259Annual Report 2020
CORPORATE INFORMATION
Name of Company
Union Assurance PLC
Legal Form
A public limited liability company
incorporated in Sri Lanka on 8 January
1987 and registered under the Companies
Act No. 07 of 2007 and quoted on the
Colombo Stock Exchange since 1988.
Company Registration Number
PQ 12
Tax Payer Identification Number (TIN)
134001372
Directors
K. N. J. Balendra - Chairman
S. Rajendra
H. A. J. De Silva Wijeyeratne
[Resigned w.e.f 06.09.2020]
D. H. Fernando
S. A. Appleyard
D. P. Gamlath [Appointed w.e.f 10.06.2020]
W. M. De F. Arsakularatne
[Appointed w.e.f 14.07.2020]
Board Human Resource and Compensation Committee
The Board Human Resource and
Compensation Committee (BHRCC) of
John Keells Holdings PLC (the Parent)
represents the BHRCC of the Company.
Nominations Committee
The Nominations Committee (NC) of
John Keells Holdings PLC (the Parent)
represents the NC of the Company.
Related Party Transaction Review Committee
The Related Party Transaction Review
Committee (RPTRC) of John Keells
Holdings PLC (the Parent) represents the
RPTRC of the Company.
Project Risk Assessment Committee
The Project Risk Assessment Committee
(PRAC) of John Keells Holdings PLC
(the Parent) represents the PRAC of the
Company.
Board Audit and Compliance Committee
W. M. De F. Arsakularatne - Chairman
[Appointed w.e.f 14.07.2020]
D. H. Fernando
S. Rajendra
Investment Committee
J. G. A. Cooray - Chairman
Jude Gomes
Asha Perera
Nalin Subasinghe
[Appointed w.e.f 15.08.2020]
Angelo Keil
Aruni Fernando
Secretaries and Registrars
Keells Consultants (Private) Limited
117, Sir Chittampalam A. Gardiner
Mawatha,
Colombo 2.
Auditors
Messrs. KPMG (Chartered Accountants)
PO Box 186,
32A, Sir Mohamed Macan Markar
Mawatha,
Colombo 3.
Appointed Actuaries
Willis Towers Watson India Private Limited
Unitech Business Park, 2nd Floor
Tower-B, South City 1, Sector 41
Gurgaon-122002
India.
Lawyers
The Legal Department
John Keells Holdings PLC
117, Sir Chittampalam A Gardiner Mawatha,
Colombo 2.
Bankers
Bank of Ceylon
Commercial Bank of Ceylon PLC
Deutsche Bank AG
DFCC Bank PLC
Hatton National Bank PLC
Housing Development Finance Corporation
National Development Bank PLC
National Savings Bank
Nations Trust Bank PLC
People’s Bank
Sampath Bank PLC
Seylan Bank PLC
Standard Chartered Bank
Union Bank Colombo PLC
Reinsurance Panel
RGA
Hannover Re
Munich Re
Partner Re
Registered Office of the Company
20, St Michael’s Road,
Colombo 3.
Investor Relations
All investor queries should be directed to;
Investor relations hotline 011-2990314
e-mail: [email protected]
102-1, 102-3, 102-5GRI
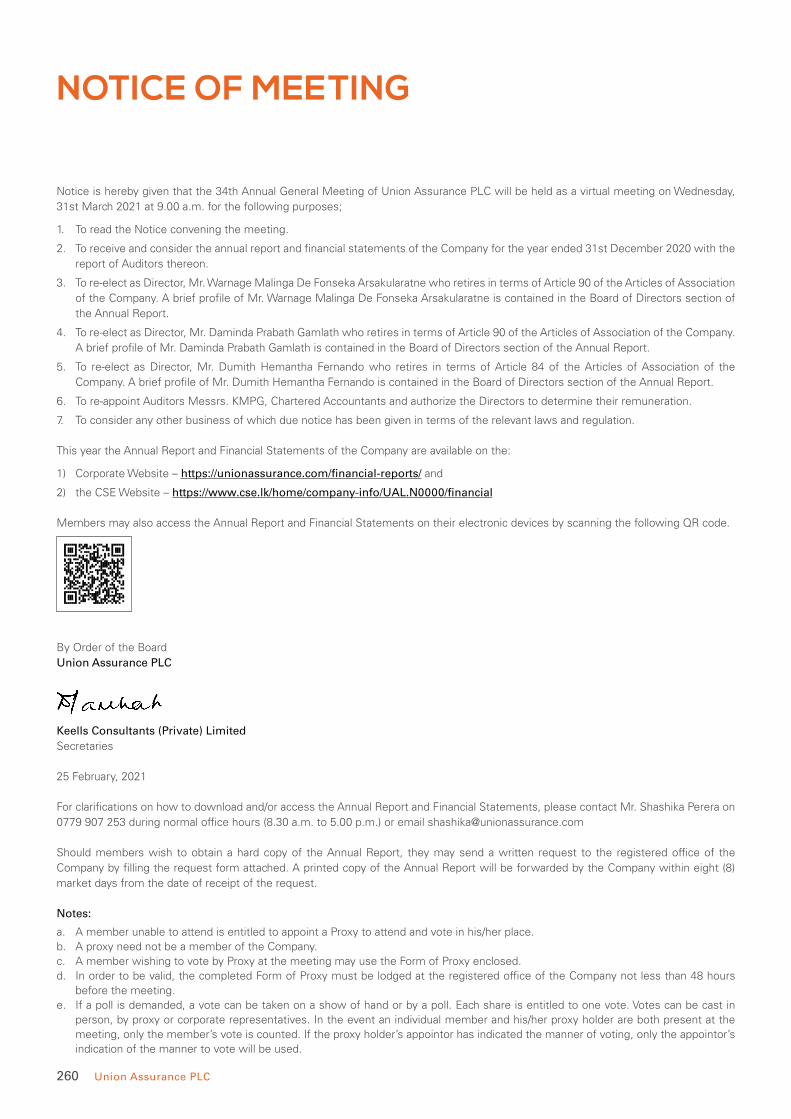
260 Union Assurance PLC
NOTICE OF MEETING
Notice is hereby given that the 34th Annual General Meeting of Union Assurance PLC will be held as a virtual meeting on Wednesday,
31st March 2021 at 9.00 a.m. for the following purposes;
1. To read the Notice convening the meeting.
2. To receive and consider the annual report and financial statements of the Company for the year ended 31st December 2020 with the
report of Auditors thereon.
3. To re-elect as Director, Mr. Warnage Malinga De Fonseka Arsakularatne who retires in terms of Article 90 of the Articles of Association
of the Company. A brief profile of Mr. Warnage Malinga De Fonseka Arsakularatne is contained in the Board of Directors section of
the Annual Report.
4. To re-elect as Director, Mr. Daminda Prabath Gamlath who retires in terms of Article 90 of the Articles of Association of the Company.
A brief profile of Mr. Daminda Prabath Gamlath is contained in the Board of Directors section of the Annual Report.
5. To re-elect as Director, Mr. Dumith Hemantha Fernando who retires in terms of Article 84 of the Articles of Association of the
Company. A brief profile of Mr. Dumith Hemantha Fernando is contained in the Board of Directors section of the Annual Report.
6. To re-appoint Auditors Messrs. KMPG, Chartered Accountants and authorize the Directors to determine their remuneration.
7. To consider any other business of which due notice has been given in terms of the relevant laws and regulation.
This year the Annual Report and Financial Statements of the Company are available on the:
1) Corporate Website – https://unionassurance.com/financial-reports/ and
2) the CSE Website – https://www.cse.lk/home/company-info/UAL.N0000/financial
Members may also access the Annual Report and Financial Statements on their electronic devices by scanning the following QR code.
By Order of the Board
Union Assurance PLC
Keells Consultants (Private) Limited
Secretaries
25 February, 2021
For clarifications on how to download and/or access the Annual Report and Financial Statements, please contact Mr. Shashika Perera on
0779 907 253 during normal office hours (8.30 a.m. to 5.00 p.m.) or email [email protected]
Should members wish to obtain a hard copy of the Annual Report, they may send a written request to the registered office of the
Company by filling the request form attached. A printed copy of the Annual Report will be forwarded by the Company within eight (8)
market days from the date of receipt of the request.
Notes:
a. A member unable to attend is entitled to appoint a Proxy to attend and vote in his/her place.b. A proxy need not be a member of the Company. c. A member wishing to vote by Proxy at the meeting may use the Form of Proxy enclosed. d. In order to be valid, the completed Form of Proxy must be lodged at the registered office of the Company not less than 48 hours
before the meeting.e. If a poll is demanded, a vote can be taken on a show of hand or by a poll. Each share is entitled to one vote. Votes can be cast in
person, by proxy or corporate representatives. In the event an individual member and his/her proxy holder are both present at the meeting, only the member’s vote is counted. If the proxy holder’s appointor has indicated the manner of voting, only the appointor’s indication of the manner to vote will be used.

Union Assurance at a Glance Management Discussion and Analysis Stewardship Financial Statements Supplementary Information
261Annual Report 2020
FORM OF PROXY
I/We……………………………………………......................………………..………………… of……………………………………………………
…………………………………………………………………………………………being a member/s of Union Assurance PLC hereby appoint
……………………………………………of……………………………..…………………………………….…………………..… or failing him/her
Mr. Krishan Niraj Jayasekara Balendra or failing him
Mr. Suresh Rajendra or failing him
Mr. Dumith Hemantha Fernando or failing him
Mr. Stephen Anthony Appleyard or failing him
Mr. Daminda Prabath Gamlath or failing him
Mr. Warnage Malinga De Fonseka Arsakularatne
as my/our proxy to represent me/us and vote on my/our behalf at the 34th Annual General Meeting of the Company to be held on 31st
March 2021 at 9.00 a.m. and at any adjournment thereof, and at every poll which may be taken in consequence thereof.
I/We, the undersigned, hereby direct my/our proxy to vote for me/us and on my/our behalf on the specified Resolution as indicated by
the letter “X” in the appropriate cage;
For Against
1. To re-elect as Director, Mr. Warnage Malinga De Fonseka Arsakularatne who retires in terms of Article 90 of
the Article of Association of the Company
2. To re-elect as Director, Mr. Daminda Prabath Gamlath who retires in terms of Article 90 of the Articles of
Association of the Company
3. To re-elect as Director, Mr. Dumith Hemantha Fernando who retires in terms of Article 84 of the Articles of
Association of the Company
4. To re-appoint Auditors Messrs. KPMG Chartered Accountants and to determine their remuneration
Signed on this ………………….day of …………………………. Two Thousand and Twenty One.
……………………………………
Signature /s of Shareholders/s
Note:
Instructions as to completion of the form of proxy are noted on the reverse.
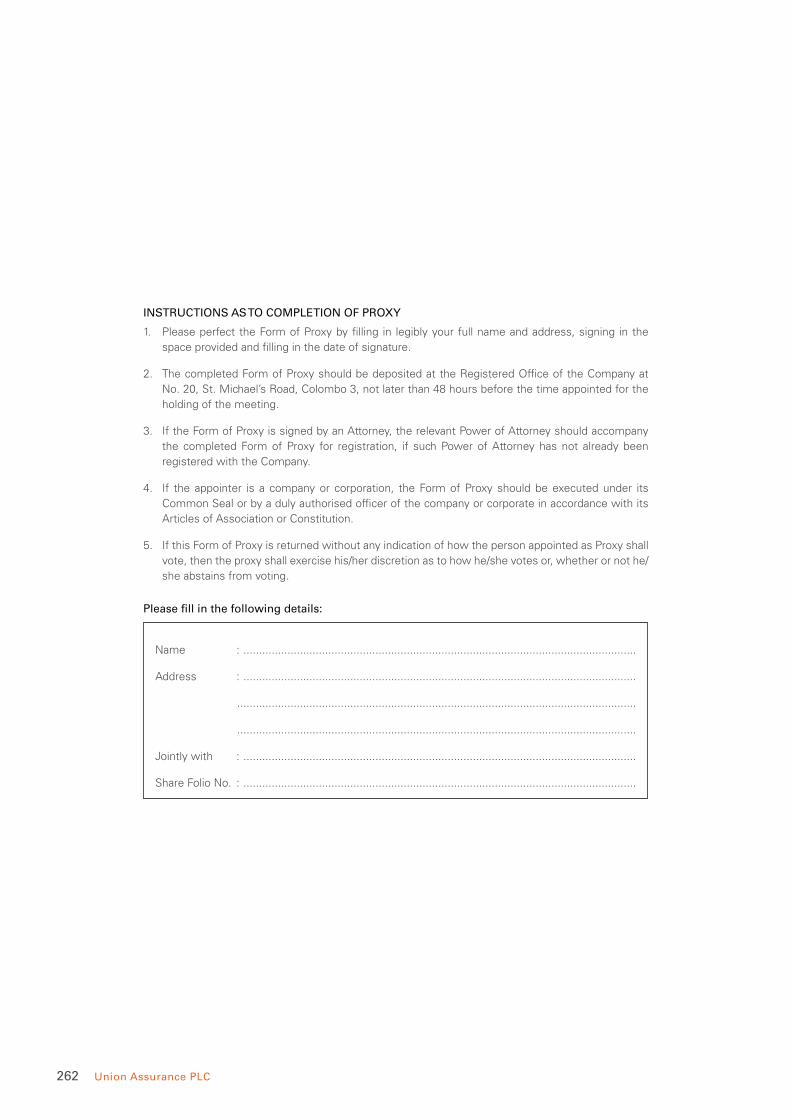
262 Union Assurance PLC
INSTRUCTIONS AS TO COMPLETION OF PROXY
1. Please perfect the Form of Proxy by filling in legibly your full name and address, signing in the
space provided and filling in the date of signature.
2. The completed Form of Proxy should be deposited at the Registered Office of the Company at
No. 20, St. Michael’s Road, Colombo 3, not later than 48 hours before the time appointed for the
holding of the meeting.
3. If the Form of Proxy is signed by an Attorney, the relevant Power of Attorney should accompany
the completed Form of Proxy for registration, if such Power of Attorney has not already been
registered with the Company.
4. If the appointer is a company or corporation, the Form of Proxy should be executed under its
Common Seal or by a duly authorised officer of the company or corporate in accordance with its
Articles of Association or Constitution.
5. If this Form of Proxy is returned without any indication of how the person appointed as Proxy shall
vote, then the proxy shall exercise his/her discretion as to how he/she votes or, whether or not he/
she abstains from voting.
Please fill in the following details:
Name : .............................................................................................................................
Address : .............................................................................................................................
...............................................................................................................................
...............................................................................................................................
Jointly with : .............................................................................................................................
Share Folio No. : .............................................................................................................................

Designed & produced by
Digital Plates & Printing by Aitken Spence Printing & Packaging (Pvt) Ltd

Union Assurance PLC20, St. Michael’s Road, Colombo 03, Sri Lanka.+94 11 2990990www.unionassurance.com