linkage assurance plc unaudited financial …€¦ · linkage assurance plc major statement of...
TRANSCRIPT
LINKAGE ASSURANCE PLC
UNAUDITED FINANCIAL STATEMENTS
AS AT 30TH SEPTEMBER 2017

LINKAGE ASSURANCE PLC
CONTENTS PAGE
Certification Pursuant to Section 60(2) of Investment and Securities 1
Result at a Glance 2
Accounting Polices 3 - 7
Statement of Finanacial position 8
Statement of profit or loss and other comprenhensive income 9
Statement of Changes in equity 10
Statement of Cash Flows 11
Segment reporting 12
Notes to the Accounts 13 - 20
Financial Summary 21 - 22
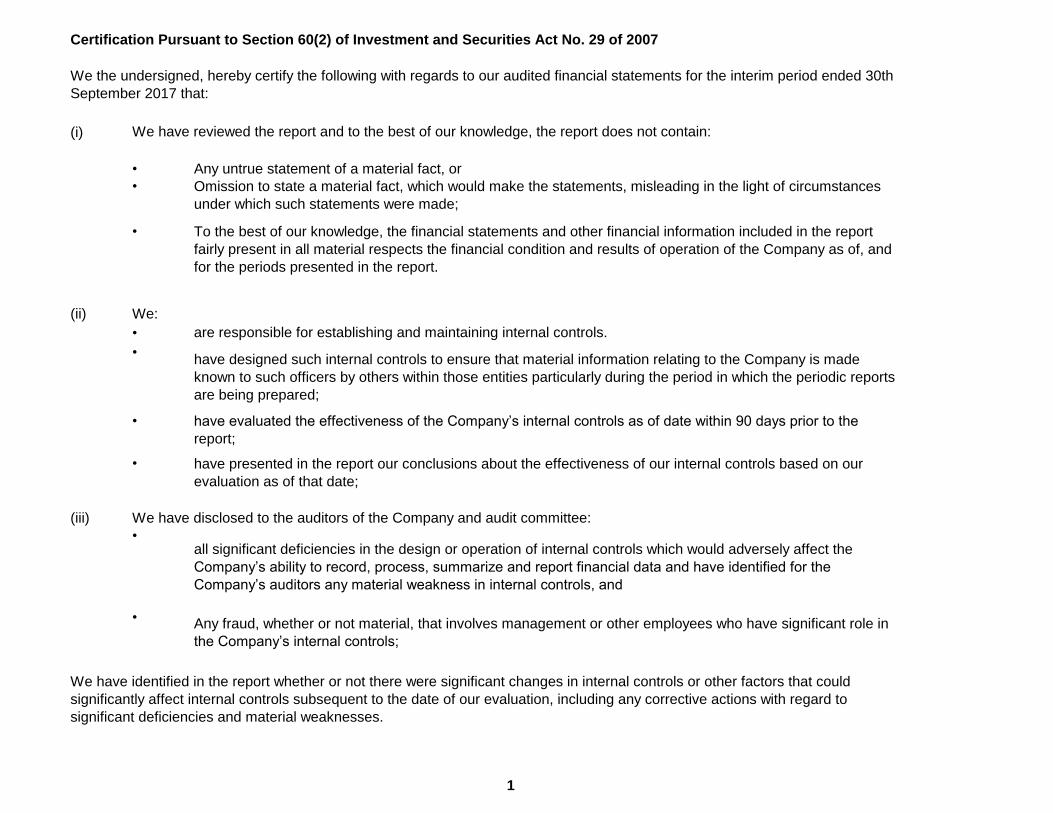
Certification Pursuant to Section 60(2) of Investment and Securities Act No. 29 of 2007
(i)
• Any untrue statement of a material fact, or
•
•
(ii) We:
•
•
•
•
(iii) We have disclosed to the auditors of the Company and audit committee:
•
•
1
have designed such internal controls to ensure that material information relating to the Company is made
known to such officers by others within those entities particularly during the period in which the periodic reports
are being prepared;
We the undersigned, hereby certify the following with regards to our audited financial statements for the interim period ended 30th
September 2017 that:
We have reviewed the report and to the best of our knowledge, the report does not contain:
Omission to state a material fact, which would make the statements, misleading in the light of circumstances
under which such statements were made;
To the best of our knowledge, the financial statements and other financial information included in the report
fairly present in all material respects the financial condition and results of operation of the Company as of, and
for the periods presented in the report.
are responsible for establishing and maintaining internal controls.
have evaluated the effectiveness of the Company’s internal controls as of date within 90 days prior to the
report;
have presented in the report our conclusions about the effectiveness of our internal controls based on our
evaluation as of that date;
all significant deficiencies in the design or operation of internal controls which would adversely affect the
Company’s ability to record, process, summarize and report financial data and have identified for the
Company’s auditors any material weakness in internal controls, and
Any fraud, whether or not material, that involves management or other employees who have significant role in
the Company’s internal controls;
We have identified in the report whether or not there were significant changes in internal controls or other factors that could
significantly affect internal controls subsequent to the date of our evaluation, including any corrective actions with regard to
significant deficiencies and material weaknesses.
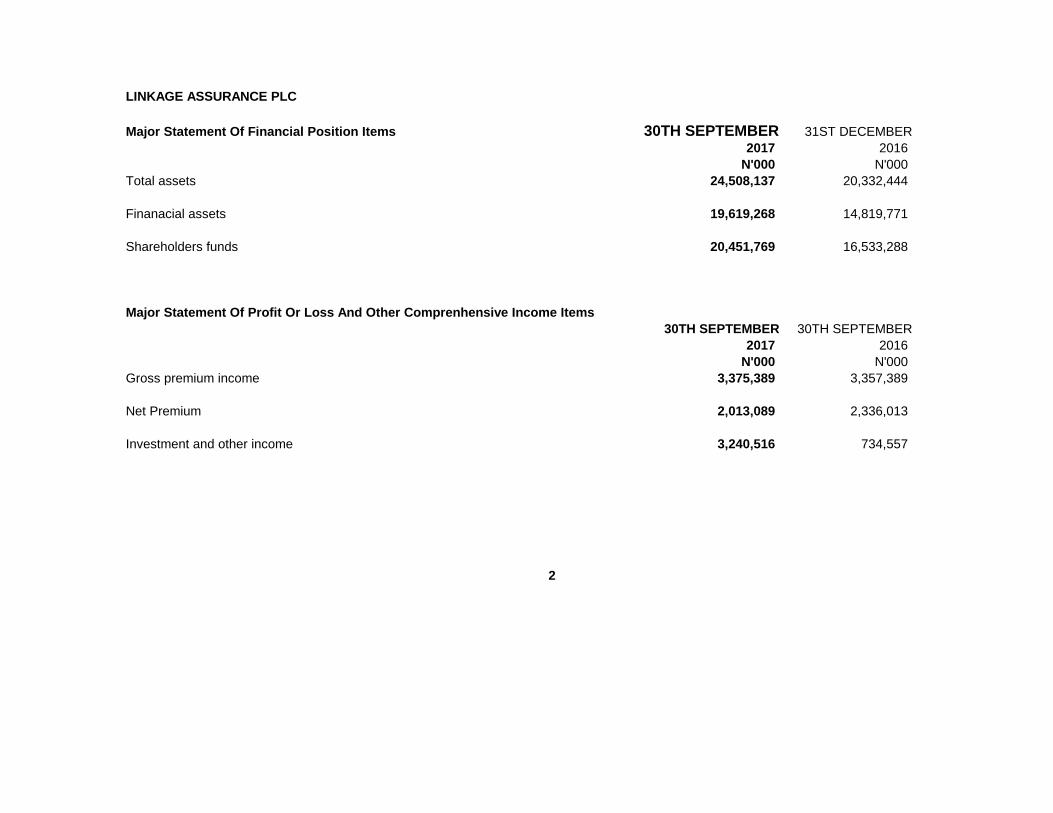
LINKAGE ASSURANCE PLC
Major Statement Of Financial Position Items 30TH SEPTEMBER 31ST DECEMBER
2017 2016
N'000 N'000
Total assets 24,508,137 20,332,444
Finanacial assets 19,619,268 14,819,771
Shareholders funds 20,451,769 16,533,288
Major Statement Of Profit Or Loss And Other Comprenhensive Income Items
30TH SEPTEMBER 30TH SEPTEMBER
2017 2016
N'000 N'000
Gross premium income 3,375,389 3,357,389
Net Premium 2,013,089 2,336,013
Investment and other income 3,240,516 734,557
2

Statement of Significant Accounting Policies
Basis of preparation
1 Going concern
2 Statement of compliance
3 Foreign Currency Translation
4 Cash and cash equivalents
5 A financial asset or liability is recognised when the Company becomes a party to the contractual provisions of the instrument.
5.1
6 Impairment of financial assets
3
Accounting policies are the specific principles, bases, conventions, rules and practices applied by an entity in preparing and presenting financial statements:
Loans and receivables
The accounting policies set out below have been consistently applied to all periods presented in these financial statements.
These financial statements have being prepared on the going concern basis. The company has no intension or need to reduce substantially its business operations.
The management believes that the going concern assumption is appropriate for the company due to sufficient capital adequacy ratio and projected liquidity, based
on historical experience that short –term obligations will be refinanced in the normal course of business. Liquidity ratio and continuous evaluation of current ratio of
the company is carried out by the company to ensure that there are no going concerns threats to the operation of the company.
The interim financial statements of Linkage Assurance PLC have been prepared in accordance with IAS 34 issued by the International Accounting Standards Board
(IASB).
Functional and Presentation Currency
Items included in the financial statements of the company are measured using the currency of the primary economic environment in which the company operates
(the functional currency).
The financial statements are presented in Nigerian naira (N), which is the presentation currency, and rounded to the nearest thousand (N000) unless otherwise
indicated
Transactions and Balances
Foreign currency transactions are translated into the functional currency using the exchange rates prevailing at the dates of the transactions. Foreign exchange gains
or losses resulting from the settlement of such transactions and from translation at year-end exchange rates of monetary assets and liabilities denominated in foreign
currencies are recognised in the Income Statements.
Foreign exchange gains and losses that relate to cash and cash equivalents are presented in the Income Statement within ‘investment income & other income’. All
other foreign exchange gains and losses are presented in the income statement within ‘investment and other income’ or ‘other operating and administrative
expenses’.
Cash and cash equivalents include cash in hand and bank, unrestricted balances held with Central Bank, call deposits and short term highly liquid financial assets
(including money market funds) with original maturities of three months or less from the acquisition date, which are subject to insignificant risk of changes in their
value and used by the Company in the management of its short-term commitments.
For the purpose of the statement of cash flow, cash and cash equivalents consist of cash and cash equivalents.
Financial instruments
Classification of financial assetsThe Company classifies its financial assets into the following categories: Financial assets at fair value through profit or loss Held-to-maturity investments
Available-for-sale financial assets
The Company assesses at the end of each reporting period whether there is objective evidence that a financial asset or a group of financial assets is impaired.
Objective evidence of impairment is established as a result of one or more events that occurred after initial recognition of the asset (a ‘loss event’) and that loss
event (or events) has an impact on the estimated future cash flows of the financial asset or group of financial assets that can be reliably estimated.
Objective evidence that a financial asset or group of assets is impaired includes observable data that comes to the attention of the Company about the following
events:
• significant financial difficulty of the issuer or debtor;
• a breach of contract, such as a default or delinquency in payments;
• it becoming probable that the issuer or debtor will enter bankruptcy or other financial re-organisation;
• the disappearance of an active market for that financial asset because of financial difficulties.
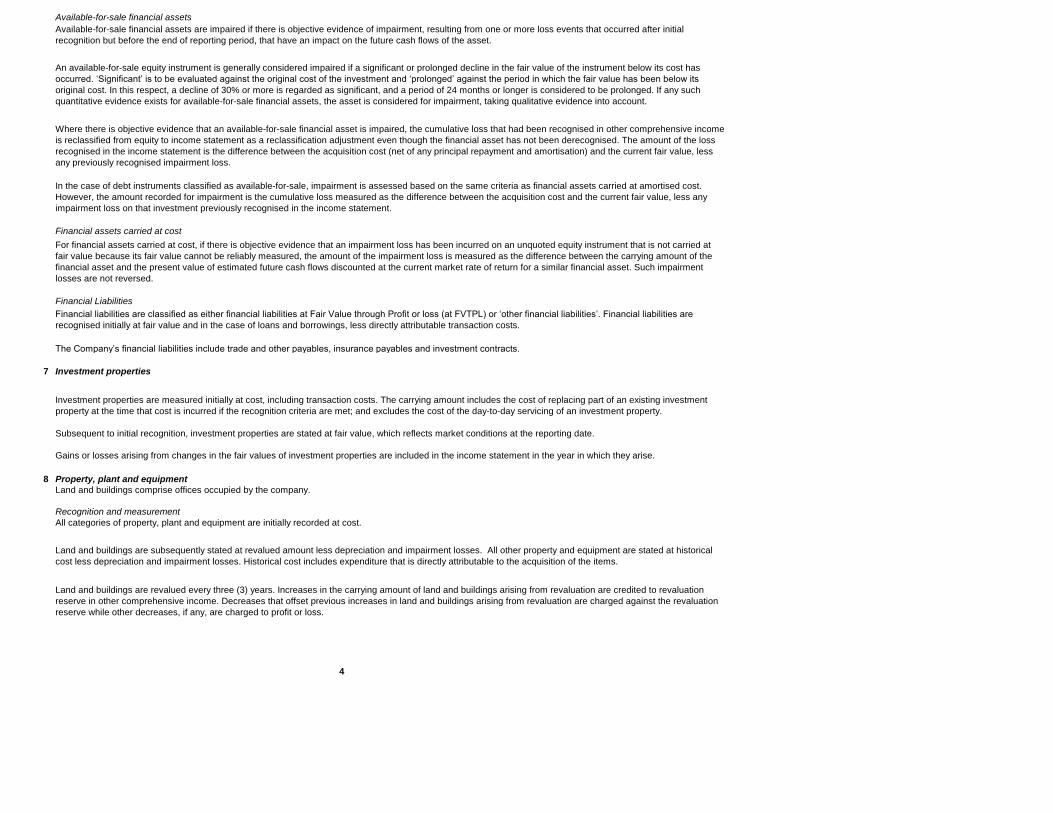
Financial assets carried at cost
Financial Liabilities
7 Investment properties
Subsequent to initial recognition, investment properties are stated at fair value, which reflects market conditions at the reporting date.
8 Property, plant and equipment
Recognition and measurement
4
In the case of debt instruments classified as available-for-sale, impairment is assessed based on the same criteria as financial assets carried at amortised cost.
However, the amount recorded for impairment is the cumulative loss measured as the difference between the acquisition cost and the current fair value, less any
impairment loss on that investment previously recognised in the income statement.
Available-for-sale financial assets
Available-for-sale financial assets are impaired if there is objective evidence of impairment, resulting from one or more loss events that occurred after initial
recognition but before the end of reporting period, that have an impact on the future cash flows of the asset.
An available-for-sale equity instrument is generally considered impaired if a significant or prolonged decline in the fair value of the instrument below its cost has
occurred. ‘Significant’ is to be evaluated against the original cost of the investment and ‘prolonged’ against the period in which the fair value has been below its
original cost. In this respect, a decline of 30% or more is regarded as significant, and a period of 24 months or longer is considered to be prolonged. If any such
quantitative evidence exists for available-for-sale financial assets, the asset is considered for impairment, taking qualitative evidence into account.
Where there is objective evidence that an available-for-sale financial asset is impaired, the cumulative loss that had been recognised in other comprehensive income
is reclassified from equity to income statement as a reclassification adjustment even though the financial asset has not been derecognised. The amount of the loss
recognised in the income statement is the difference between the acquisition cost (net of any principal repayment and amortisation) and the current fair value, less
any previously recognised impairment loss.
For financial assets carried at cost, if there is objective evidence that an impairment loss has been incurred on an unquoted equity instrument that is not carried at
fair value because its fair value cannot be reliably measured, the amount of the impairment loss is measured as the difference between the carrying amount of the
financial asset and the present value of estimated future cash flows discounted at the current market rate of return for a similar financial asset. Such impairment
losses are not reversed.
Financial liabilities are classified as either financial liabilities at Fair Value through Profit or loss (at FVTPL) or ‘other financial liabilities’. Financial liabilities are
recognised initially at fair value and in the case of loans and borrowings, less directly attributable transaction costs.
The Company’s financial liabilities include trade and other payables, insurance payables and investment contracts.
Investment properties are measured initially at cost, including transaction costs. The carrying amount includes the cost of replacing part of an existing investment
property at the time that cost is incurred if the recognition criteria are met; and excludes the cost of the day-to-day servicing of an investment property.
Gains or losses arising from changes in the fair values of investment properties are included in the income statement in the year in which they arise.
Land and buildings comprise offices occupied by the company.
All categories of property, plant and equipment are initially recorded at cost.
Land and buildings are subsequently stated at revalued amount less depreciation and impairment losses. All other property and equipment are stated at historical
cost less depreciation and impairment losses. Historical cost includes expenditure that is directly attributable to the acquisition of the items.
Land and buildings are revalued every three (3) years. Increases in the carrying amount of land and buildings arising from revaluation are credited to revaluation
reserve in other comprehensive income. Decreases that offset previous increases in land and buildings arising from revaluation are charged against the revaluation
reserve while other decreases, if any, are charged to profit or loss.

Depreciation
The estimated useful lives for the current and comparative periods are as follows:
Motor vehicles 4 years
Furniture and Fittings
Office equipment &
Computer hardware 4 years
Computer software 4 years
Leasehold buildings 50 years
9 Taxation
10 Insurance contracts
10.1 Classification
• Fire insurance business
• Marine insurance business;
10.2 Recognition and Measurement of Insurance Contracts
Premium income is recognised on assumption of risks.
Premiums
Gross premium earned
Gross premium earned includes estimates of premiums due but not yet received, less unearned premium.
5
Leasehold improvements over the unexpired lease period
Depreciation is provided on a straight line basis so as to allocate the cost/re-valued amounts less their residual values over the estimated useful lives of the following
classes of assets. Depreciation begins when an asset is available for use and ceases at the earlier of the date that the asset is derecognised or classified as held for
sale in accordance with IFRS 5 Non-current Assets Held for Sale and Discontinued Operations.
4 years
• Miscellaneous insurance business
Income tax expense comprises current and deferred tax. Income tax expense is recognised in the income statement except to the extent that it relates to items
recognised directly in equity, in which case it is recognised in equity.
Current tax is the expected tax payable on taxable income for the year, using tax rates enacted or substantively enacted at the reporting date, and any adjustment to
tax payable in respect of previous years.
IFRS 4 requires contracts written by insurers to be classified as either ‘insurance contracts’ or ‘investment contracts’ depending on the level of insurance risk
transferred.
The company only issues contracts that transfer insurance risks.
Insurance contracts are those contracts where a party (the policy holder) transfers significant insurance risk to another party (insurer) and the latter agrees to
compensate the policyholder or other beneficiary if a specified uncertain future event (the insured event) adversely affects the policyholder, or other beneficiary.
General Insurance Business means insurance business of any class or classes not being long term insurance business. Classes of General Insurance include:
• General accident insurance business;
• Motor vehicle insurance business;
• Engineering insurance business;
• Oil and gas insurance business;
• Bonds credit guarantee insurance business; and
For all these contracts, premiums are recognised as revenue proportionally over the period of coverage. The portion of premium received on in-force contracts that
relates to unexpired risk at the end of reporting date is reported as the unearned premium liability.
Premiums comprise gross written premiums on insurance contracts entered into during the year, irrespective of whether they relate in whole or in part to a later
accounting period. Premiums are shown before deductions of commissions and are gross of any taxes or duties levied on premiums.
Unearned premium provision
The provision for unearned premiums (unexpired risk) represents the proportion of premiums written in the periods up to the accounting date that relates to the
unexpired terms of policies in force at the end of reporting date. This is estimated to be earned in subsequent financial periods, computed separately for each
insurance contract using a time proportionate basis.
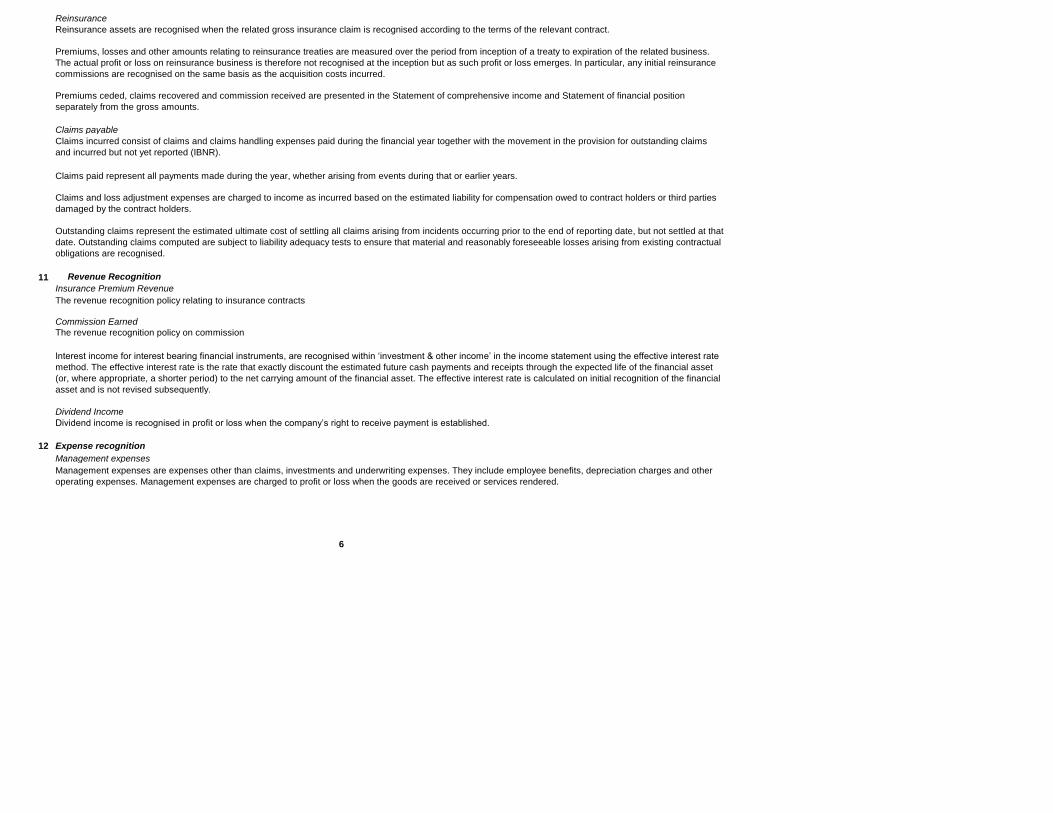
Reinsurance
Reinsurance assets are recognised when the related gross insurance claim is recognised according to the terms of the relevant contract.
Claims payable
Claims paid represent all payments made during the year, whether arising from events during that or earlier years.
11 Revenue Recognition
Insurance Premium Revenue
The revenue recognition policy relating to insurance contracts
Commission Earned
The revenue recognition policy on commission
Dividend Income
Dividend income is recognised in profit or loss when the company’s right to receive payment is established.
12 Expense recognition
Management expenses
6
Premiums, losses and other amounts relating to reinsurance treaties are measured over the period from inception of a treaty to expiration of the related business.
The actual profit or loss on reinsurance business is therefore not recognised at the inception but as such profit or loss emerges. In particular, any initial reinsurance
commissions are recognised on the same basis as the acquisition costs incurred.
Premiums ceded, claims recovered and commission received are presented in the Statement of comprehensive income and Statement of financial position
separately from the gross amounts.
Claims incurred consist of claims and claims handling expenses paid during the financial year together with the movement in the provision for outstanding claims
and incurred but not yet reported (IBNR).
Claims and loss adjustment expenses are charged to income as incurred based on the estimated liability for compensation owed to contract holders or third parties
damaged by the contract holders.
Outstanding claims represent the estimated ultimate cost of settling all claims arising from incidents occurring prior to the end of reporting date, but not settled at that
date. Outstanding claims computed are subject to liability adequacy tests to ensure that material and reasonably foreseeable losses arising from existing contractual
obligations are recognised.
Interest income for interest bearing financial instruments, are recognised within ‘investment & other income’ in the income statement using the effective interest rate
method. The effective interest rate is the rate that exactly discount the estimated future cash payments and receipts through the expected life of the financial asset
(or, where appropriate, a shorter period) to the net carrying amount of the financial asset. The effective interest rate is calculated on initial recognition of the financial
asset and is not revised subsequently.
Management expenses are expenses other than claims, investments and underwriting expenses. They include employee benefits, depreciation charges and other
operating expenses. Management expenses are charged to profit or loss when the goods are received or services rendered.
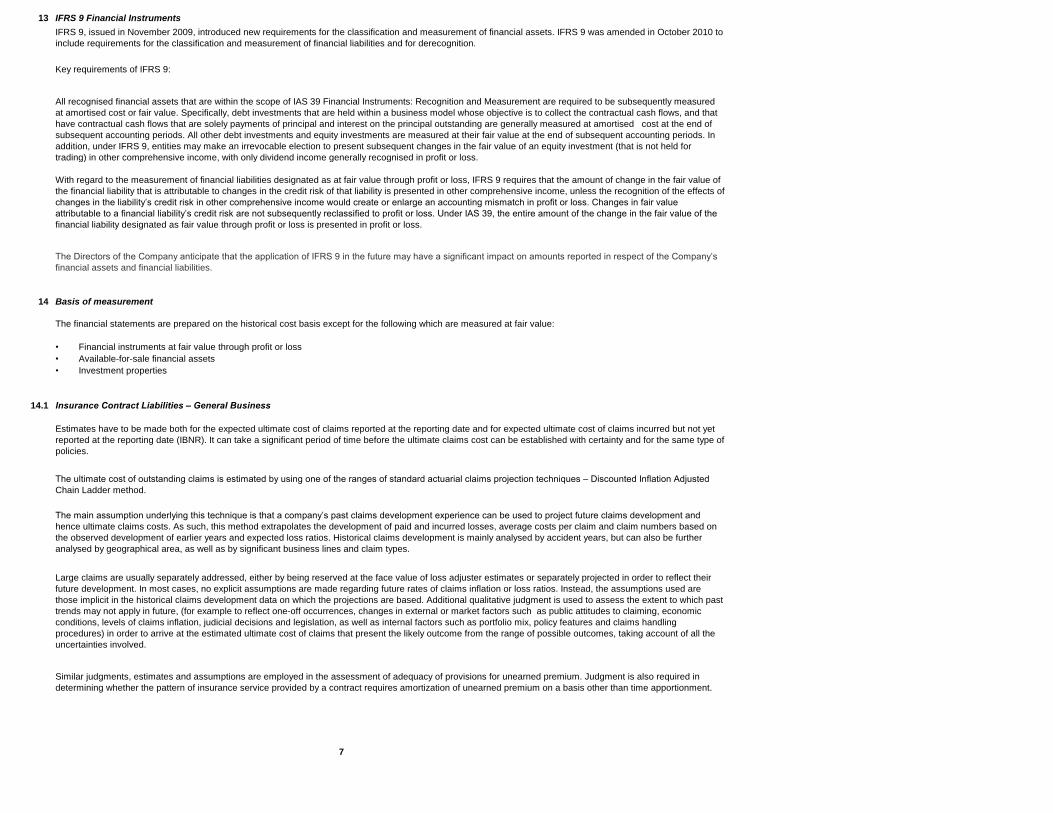
13 IFRS 9 Financial Instruments
Key requirements of IFRS 9:
14 Basis of measurement
14.1 Insurance Contract Liabilities – General Business
7
IFRS 9, issued in November 2009, introduced new requirements for the classification and measurement of financial assets. IFRS 9 was amended in October 2010 to
include requirements for the classification and measurement of financial liabilities and for derecognition.
Similar judgments, estimates and assumptions are employed in the assessment of adequacy of provisions for unearned premium. Judgment is also required in
determining whether the pattern of insurance service provided by a contract requires amortization of unearned premium on a basis other than time apportionment.
All recognised financial assets that are within the scope of IAS 39 Financial Instruments: Recognition and Measurement are required to be subsequently measured
at amortised cost or fair value. Specifically, debt investments that are held within a business model whose objective is to collect the contractual cash flows, and that
have contractual cash flows that are solely payments of principal and interest on the principal outstanding are generally measured at amortised cost at the end of
subsequent accounting periods. All other debt investments and equity investments are measured at their fair value at the end of subsequent accounting periods. In
addition, under IFRS 9, entities may make an irrevocable election to present subsequent changes in the fair value of an equity investment (that is not held for
trading) in other comprehensive income, with only dividend income generally recognised in profit or loss.
With regard to the measurement of financial liabilities designated as at fair value through profit or loss, IFRS 9 requires that the amount of change in the fair value of
the financial liability that is attributable to changes in the credit risk of that liability is presented in other comprehensive income, unless the recognition of the effects of
changes in the liability’s credit risk in other comprehensive income would create or enlarge an accounting mismatch in profit or loss. Changes in fair value
attributable to a financial liability’s credit risk are not subsequently reclassified to profit or loss. Under IAS 39, the entire amount of the change in the fair value of the
financial liability designated as fair value through profit or loss is presented in profit or loss.
The Directors of the Company anticipate that the application of IFRS 9 in the future may have a significant impact on amounts reported in respect of the Company’s
financial assets and financial liabilities.
The financial statements are prepared on the historical cost basis except for the following which are measured at fair value:
• Financial instruments at fair value through profit or loss
• Available-for-sale financial assets
• Investment properties
Estimates have to be made both for the expected ultimate cost of claims reported at the reporting date and for expected ultimate cost of claims incurred but not yet
reported at the reporting date (IBNR). It can take a significant period of time before the ultimate claims cost can be established with certainty and for the same type of
policies.
The ultimate cost of outstanding claims is estimated by using one of the ranges of standard actuarial claims projection techniques – Discounted Inflation Adjusted
Chain Ladder method.
The main assumption underlying this technique is that a company’s past claims development experience can be used to project future claims development and
hence ultimate claims costs. As such, this method extrapolates the development of paid and incurred losses, average costs per claim and claim numbers based on
the observed development of earlier years and expected loss ratios. Historical claims development is mainly analysed by accident years, but can also be further
analysed by geographical area, as well as by significant business lines and claim types.
Large claims are usually separately addressed, either by being reserved at the face value of loss adjuster estimates or separately projected in order to reflect their
future development. In most cases, no explicit assumptions are made regarding future rates of claims inflation or loss ratios. Instead, the assumptions used are
those implicit in the historical claims development data on which the projections are based. Additional qualitative judgment is used to assess the extent to which past
trends may not apply in future, (for example to reflect one-off occurrences, changes in external or market factors such as public attitudes to claiming, economic
conditions, levels of claims inflation, judicial decisions and legislation, as well as internal factors such as portfolio mix, policy features and claims handling
procedures) in order to arrive at the estimated ultimate cost of claims that present the likely outcome from the range of possible outcomes, taking account of all the
uncertainties involved.
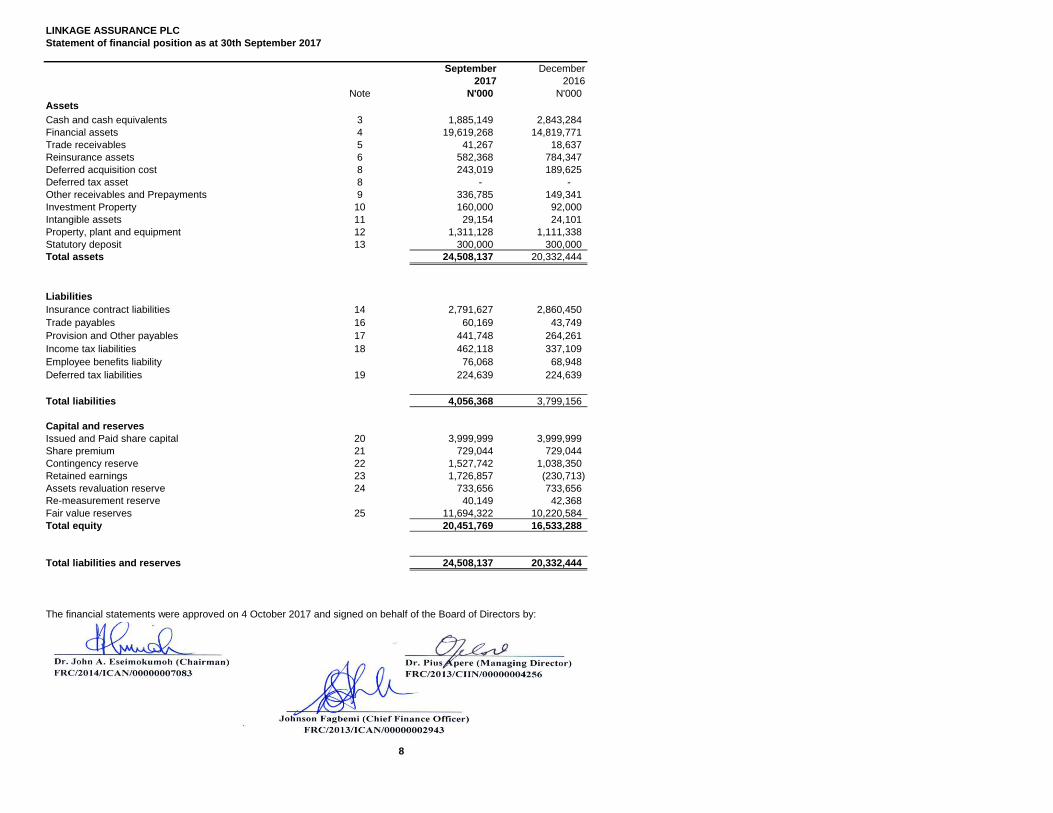
LINKAGE ASSURANCE PLC
Statement of financial position as at 30th September 2017
September December
2017 2016
Note N'000 N'000
Assets
Cash and cash equivalents 3 1,885,149 2,843,284
Financial assets 4 19,619,268 14,819,771
Trade receivables 5 41,267 18,637
Reinsurance assets 6 582,368 784,347
Deferred acquisition cost 8 243,019 189,625
Deferred tax asset 8 - -
Other receivables and Prepayments 9 336,785 149,341
Investment Property 10 160,000 92,000
Intangible assets 11 29,154 24,101
Property, plant and equipment 12 1,311,128 1,111,338
Statutory deposit 13 300,000 300,000
Total assets 24,508,137 20,332,444
Liabilities
Insurance contract liabilities 14 2,791,627 2,860,450
Trade payables 16 60,169 43,749
Provision and Other payables 17 441,748 264,261
Income tax liabilities 18 462,118 337,109
Employee benefits liability 76,068 68,948
Deferred tax liabilities 19 224,639 224,639
Total liabilities 4,056,368 3,799,156
Capital and reserves
Issued and Paid share capital 20 3,999,999 3,999,999
Share premium 21 729,044 729,044
Contingency reserve 22 1,527,742 1,038,350
Retained earnings 23 1,726,857 (230,713)
Assets revaluation reserve 24 733,656 733,656
Re-measurement reserve 40,149 42,368
Fair value reserves 25 11,694,322 10,220,584
Total equity 20,451,769 16,533,288
Total liabilities and reserves 24,508,137 20,332,444
The financial statements were approved on 4 October 2017 and signed on behalf of the Board of Directors by:
8

LINKAGE ASSURANCE PLC
Statement of Changes in equity for the period 30th September 2017
Share capital Share premium
Contingency
Reserve
Asset revaluation
reserve
Re-measurement
reserve Fair value reserve
Retained
earnings Total
N'000 N'000 N'000 N'000 N'000 N'000 N'000
At 1 January 2017 3,999,999 729,044 1,038,350 733,656 42,368 11,694,322 (230,713) 18,007,026
Profit for the year - - - - - - 2,446,962 2,446,962
Transfer to Contingency reserve - - 489,392 - - - (489,392) -
Revaluation reserve during the year - - - - - - - -
Net fair value changes on AFS
financial assets transferred from other
comprehensive income - - - - - - - -
- -
Transaction within Equity: - -
Share issue during the year - - - - - - - -
- -
-
At 30th Septebmer 2017 3,999,999 729,044 1,527,742 733,656 42,368 11,694,322 1,726,857 20,453,988
LINKAGE ASSURANCE PLC
Statement of Changes in equity for the period 30th September 2016
Share capital Share premium
Contingency
Reserve
Asset revaluation
reserve
Re-measurement
reserve Fair value reserve
Retained
earnings TotalN'000 N'000 N'000 N'000 N'000 N'000 N'000 N'000
At 1 January 2016 3,999,396 729,044 917,387 733,656 - 10,580,393 (650,482) 16,309,394
Profit for the year - - - - - - 616,098 616,098
Transfer to Contingency reserve - - 123,220 - - - (123,220) -
Revaluation reserve during the year - - - - - - - - Net fair value changes on AFS
financial assets transferred from other
comprehensive income - - - - - - - -
- -
Transaction within Equity: - -
Share issue during the year - - - - - - - -
-
-
At 30 September 2016 3,999,396 729,044 1,040,607 733,656 - 10,580,393 (157,604) 16,925,492
10

Statement of profit or loss and other comprenhensive income for the period eneded 30th September 2017
9 months ended
30 September
9 months ended
30 September
3 months ended 30
September 2017
3 months ended 30
September 2016
2017 2016 2017 2016
Note N'000 N'000 N'000 N'000
Gross premium written 3,375,389 3,357,389 676,518 791,781
Movement in unexpired risk reserve (221,536) (115,384) 216,368 272,762
Gross premium income 3,153,853 3,242,005 892,886 1,064,543
Reinsurance expenses (1,140,764) (905,992) (403,578) (293,864)
Net premium income 2,013,089 2,336,013 489,308 770,679
Fees and Commission income 148,184 161,922 45,785 36,114
Net underwriting income 2,161,273 2,497,935 535,094 806,792
Claims expenses (697,493) (733,001) (141,847) (901,200)
Underwriting expenses (1,398,734) (1,239,183) (434,128) (357,548)
Underwriting profit 65,045 525,751 (40,881) (451,956)
Investment income 1 2,990,272 344,675 (195,886) 228,423
3,055,317 870,426 (236,767) (223,533)
Net fair value gains/(loss) on financial assets at fair value through
profit or loss 715,698 304,562 232,414 179,683
Other Operating income 2 250,245 389,882 181,730 119,544
- - -
Management expenses (1,142,481) (794,747) (393,721) (245,351)
Profit before taxation 2,878,779 770,123 (216,344) (169,656)
Income taxes (431,817) (154,025) 187,208 33,931
Profit for the period 2,446,962 616,098 (29,136) (135,725)
- -
Other comprehensive income - -
Net balance of revaluation reserve during the year - - - -
Net fair value gain on available-for-sale financial assets - - - -
Total other comprehensive income - - - -
- - Items that will not be reclassified subsequently to profit or
loss - -
Remeasurement of defined benefit obligation - - - -
Gain on revaluation of property - - - -
Other comprehensive (loss)/income, net of taxes - - - -
Total other comprehensive income for the period 2,446,962 616,098 2,446,962 616,098
Basic earnings per share attributable to equity shareholders for the year
(kobo) 0.31 0.08
9
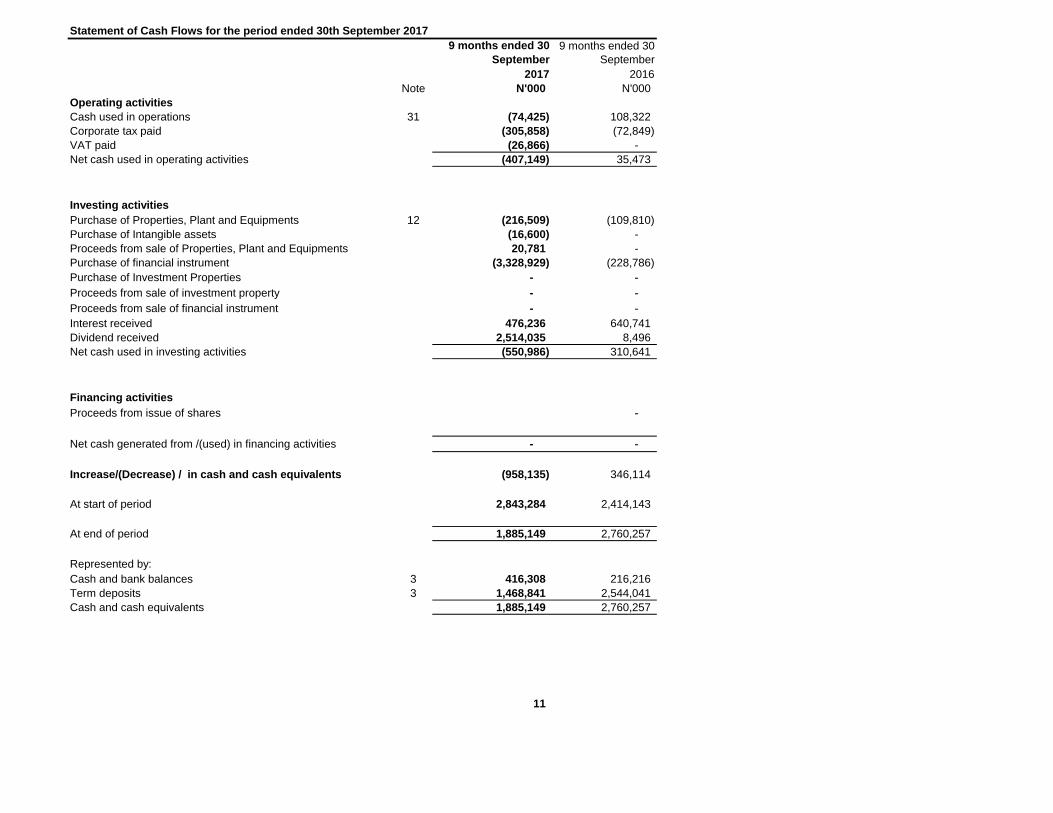
Statement of Cash Flows for the period ended 30th September 2017
9 months ended 30
September
9 months ended 30
September
2017 2016
Note N'000 N'000
Operating activities
Cash used in operations 31 (74,425) 108,322
Corporate tax paid (305,858) (72,849)
VAT paid (26,866) -
Net cash used in operating activities (407,149) 35,473
Investing activities
Purchase of Properties, Plant and Equipments 12 (216,509) (109,810)
Purchase of Intangible assets (16,600) -
Proceeds from sale of Properties, Plant and Equipments 20,781 -
Purchase of financial instrument (3,328,929) (228,786)
Purchase of Investment Properties - -
Proceeds from sale of investment property - -
Proceeds from sale of financial instrument - -
Interest received 476,236 640,741
Dividend received 2,514,035 8,496
Net cash used in investing activities (550,986) 310,641
Financing activities
Proceeds from issue of shares -
Net cash generated from /(used) in financing activities - -
Increase/(Decrease) / in cash and cash equivalents (958,135) 346,114
At start of period 2,843,284 2,414,143
At end of period 1,885,149 2,760,257
Represented by:
Cash and bank balances 3 416,308 216,216
Term deposits 3 1,468,841 2,544,041
Cash and cash equivalents 1,885,149 2,760,257
11
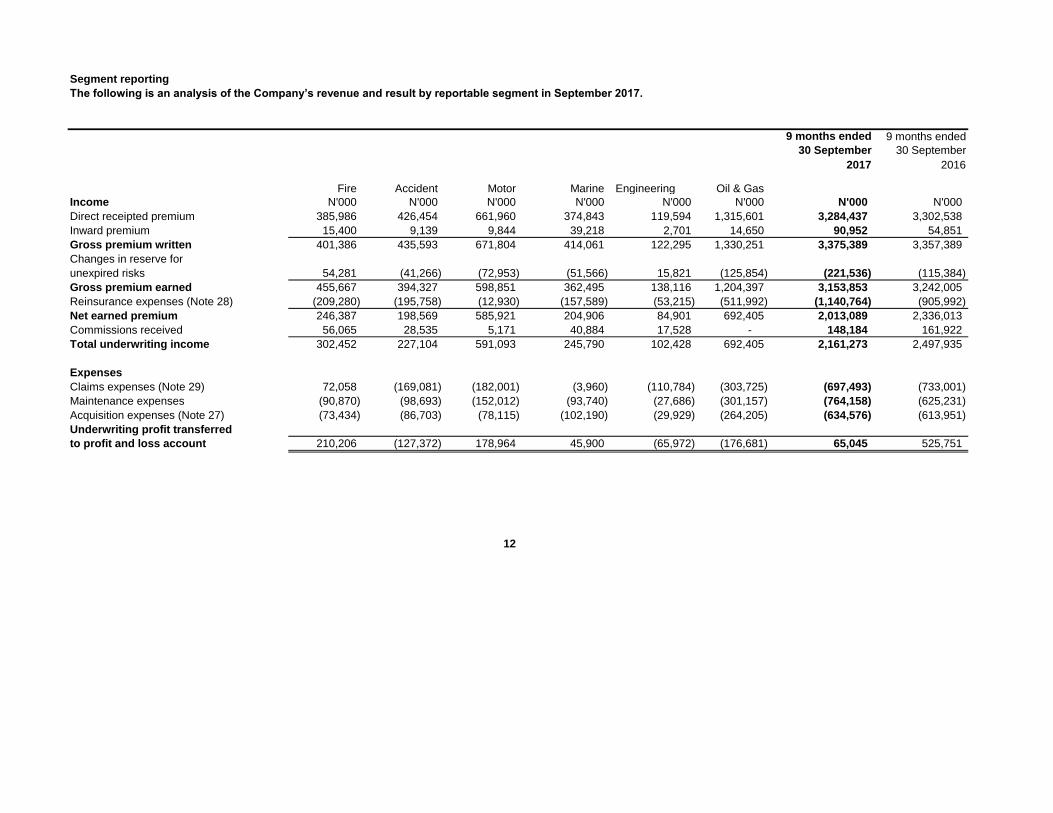
Segment reporting
The following is an analysis of the Company’s revenue and result by reportable segment in September 2017.
9 months ended
30 September
9 months ended
30 September
2017 2016
Fire Accident Motor Marine Engineering Oil & Gas
Income N'000 N'000 N'000 N'000 N'000 N'000 N'000 N'000
Direct receipted premium 385,986 426,454 661,960 374,843 119,594 1,315,601 3,284,437 3,302,538
Inward premium 15,400 9,139 9,844 39,218 2,701 14,650 90,952 54,851
Gross premium written 401,386 435,593 671,804 414,061 122,295 1,330,251 3,375,389 3,357,389
Changes in reserve for
unexpired risks 54,281 (41,266) (72,953) (51,566) 15,821 (125,854) (221,536) (115,384)
Gross premium earned 455,667 394,327 598,851 362,495 138,116 1,204,397 3,153,853 3,242,005
Reinsurance expenses (Note 28) (209,280) (195,758) (12,930) (157,589) (53,215) (511,992) (1,140,764) (905,992)
Net earned premium 246,387 198,569 585,921 204,906 84,901 692,405 2,013,089 2,336,013
Commissions received 56,065 28,535 5,171 40,884 17,528 - 148,184 161,922
Total underwriting income 302,452 227,104 591,093 245,790 102,428 692,405 2,161,273 2,497,935
Expenses
Claims expenses (Note 29) 72,058 (169,081) (182,001) (3,960) (110,784) (303,725) (697,493) (733,001)
Maintenance expenses (90,870) (98,693) (152,012) (93,740) (27,686) (301,157) (764,158) (625,231)
Acquisition expenses (Note 27) (73,434) (86,703) (78,115) (102,190) (29,929) (264,205) (634,576) (613,951)
Underwriting profit transferred
to profit and loss account 210,206 (127,372) 178,964 45,900 (65,972) (176,681) 65,045 525,751
12

NOTES TO THE ACCOUNT AS AT 30TH SEPTEMBER 2017
9 months ended 30
September
9 months ended 30
September
2017 2016
N'000 N'000
1 Investment income
Interest income 476,236 520,454
Loss on sales of properties - -
Profit on disposal unquoted securities - -
Loss on disposal quoted securities - -
Revaluation of investment properties - -
Rental income 2,500 -
Prov. no longer required 87,731 -
Dividend income 2,514,035 7,853
3,080,503 528,306
2 Income from other sources
Profit on sale of fixed asset (44) -
Sundry income 160,057 368,057
160,014 368,057
9 months ended 30
September
9 months ended 30
September December December
2017 2017 2016 2016
N'000 N'000 N'000 N'000
3 Cash and cash equivalents
Cash and Bank balances 416,308 240,092 240,092
Bank (Fixed) Deposit 1,596,262 2,655,515
Prov. For Doubful investments (127,421) 1,468,841 (52,323) 2,603,192
1,885,149 2,843,284
4 Financial assets
Loans and receivables 244,319 208,962
Allowance for impairment (74,369) 169,950 (74,369) 134,593
Fair value through profit or loss
Fair value through profit or loss assets comprises:
Quoted equity instruments 3,697,364 3,635,886
Fair value changes 269,463 3,966,826 403,609 4,039,496
Available for sale
Available for sale financial assets comprise:
Investment in Quoted equities - -
Investment in Quoted unit trust schemes 32,443 27,210
32,443 27,210
Fair value changes - 32,443 - 27,210
Fair value of Available for sale unquoted equities
Investment in Unquoted equities 1,586,152 117,647
Fair value changes 10,378,353 11,964,505 10,378,353 10,496,000
Un-quoted equities - at cost 251,818 251,818
Allowance for impairment (150,736) 101,082 (150,736) 101,082
Held To Maturity Assets 3,395,654 32,582
Allowance for impairment (11,192) 3,384,462 (11,192) 21,391
19,619,268 14,819,771
13
9 months ended 30
September
9 months ended
30 September December December
2017 2017 2016 2016
N'000 N'000
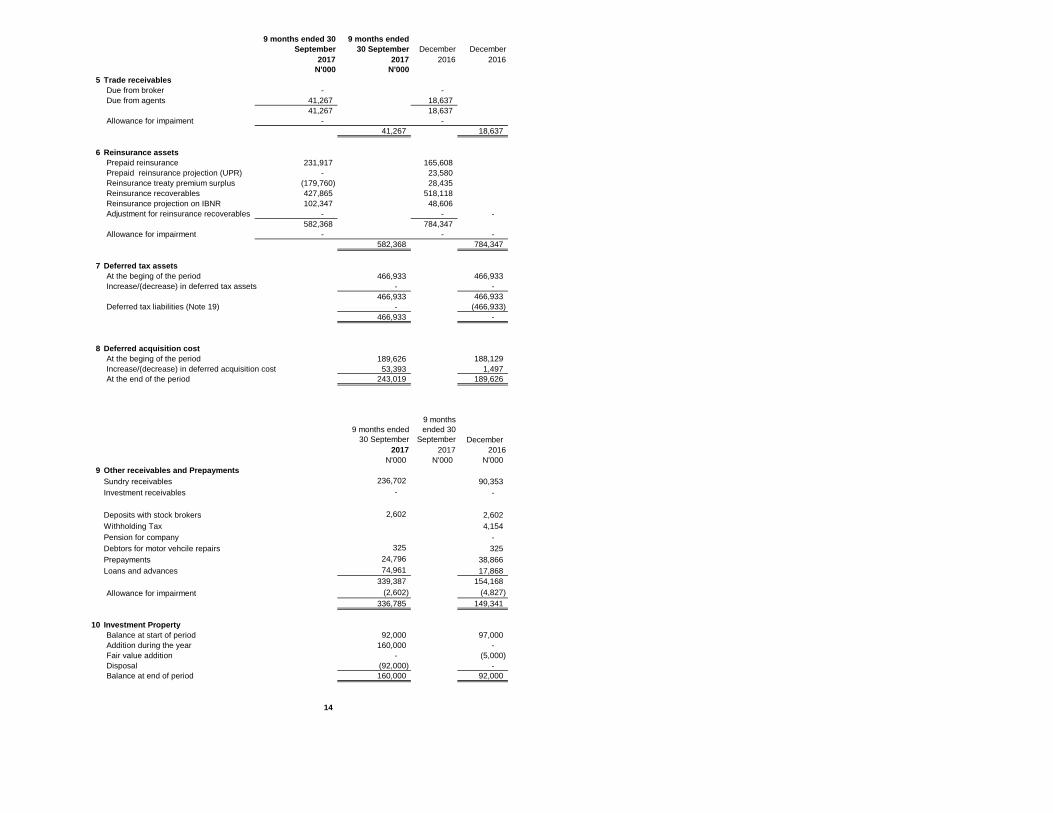
5 Trade receivables
Due from broker - -
Due from agents 41,267 18,637
41,267 18,637
Allowance for impaiment - -
41,267 18,637
6 Reinsurance assets
Prepaid reinsurance 231,917 165,608
Prepaid reinsurance projection (UPR) - 23,580
Reinsurance treaty premium surplus (179,760) 28,435
Reinsurance recoverables 427,865 518,118
Reinsurance projection on IBNR 102,347 48,606
Adjustment for reinsurance recoverables - - -
582,368 784,347
Allowance for impairment - - -
582,368 784,347
7 Deferred tax assets
At the beging of the period 466,933 466,933
Increase/(decrease) in deferred tax assets - -
466,933 466,933
Deferred tax liabilities (Note 19) - (466,933)
466,933 -
8 Deferred acquisition cost
At the beging of the period 189,626 188,129
Increase/(decrease) in deferred acquisition cost 53,393 1,497
At the end of the period 243,019 189,626
9 months ended
30 September
9 months
ended 30
September December
2017 2017 2016
N'000 N'000 N'000
9 Other receivables and Prepayments
Sundry receivables 236,702 90,353
Investment receivables - -
Deposits with stock brokers 2,602 2,602
Withholding Tax 4,154
Pension for company -
Debtors for motor vehcile repairs 325 325
Prepayments 24,796 38,866
Loans and advances 74,961 17,868
339,387 154,168
Allowance for impairment (2,602) (4,827)
336,785 149,341
10 Investment Property
Balance at start of period 92,000 97,000
Addition during the year 160,000 -
Fair value addition - (5,000)
Disposal (92,000) -
Balance at end of period 160,000 92,000
14
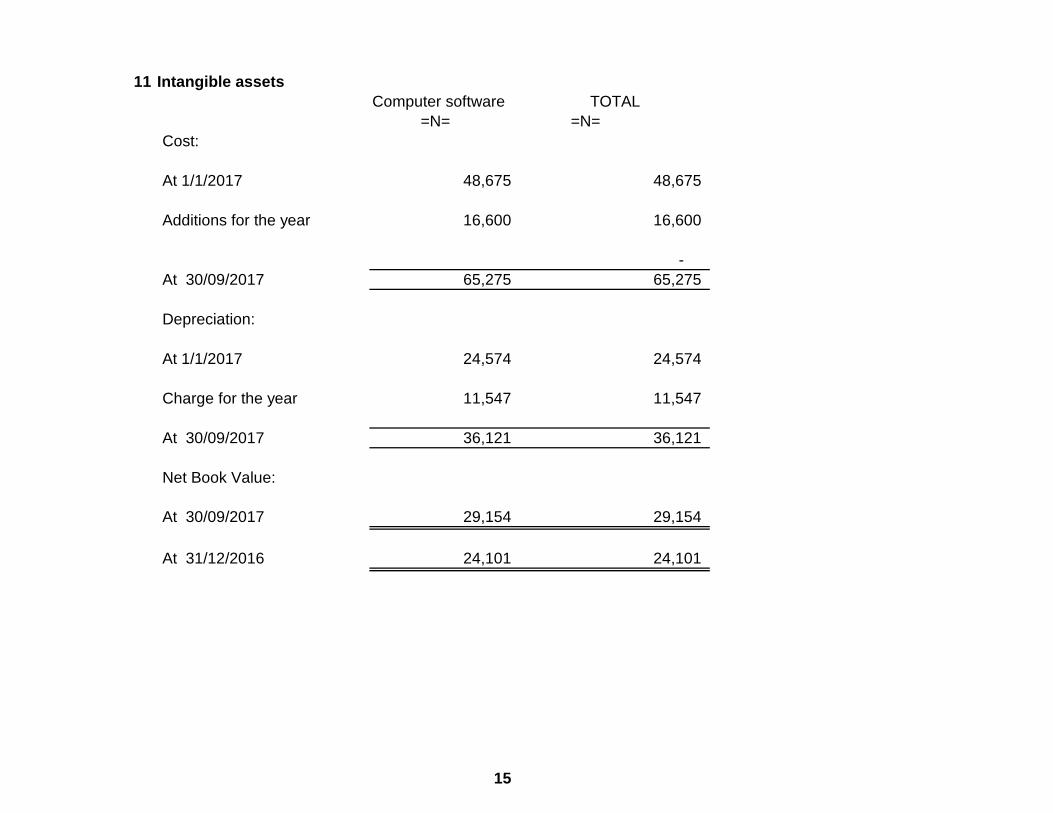
11 Intangible assets
Computer software TOTAL
=N= =N=
Cost:
At 1/1/2017 48,675 48,675
Additions for the year 16,600 16,600
-
At 30/09/2017 65,275 65,275
Depreciation:
At 1/1/2017 24,574 24,574
Charge for the year 11,547 11,547
At 30/09/2017 36,121 36,121
Net Book Value:
At 30/09/2017 29,154 29,154
At 31/12/2016 24,101 24,101
15

12 Property, plant and equipment
Motor Vehicles
Office Furniture
& Fittings
Office
Equipment LAND BUILDING B/W.I.P TOTAL
Cost: N'000 N'000 N'000 N'000 N'000 N'000 N'000
At 1/1/2017 433,088 123,914 257,424 462,336 299,002 237,353 1,813,117
Additions for half year 186,099 10,635 15,575 - - 4,200 216,509
Revaluation surplus/(deficit) - - - - - - -
Write back/ write off (70,245) - (10,608) 54,876 37,124 - 11,147
At 30/09/2017 548,942 134,549 262,391 517,212 336,126 241,553 2,040,773
Depreciation:
At 1/1/2017 332,960 107,233 208,145 - 53,441 - 701,779
-
Charge for the year 59,165 7,254 17,072 - 4,403 - 87,895
Disposal (52,311) - (7,717) - - - (60,028)
Write back/ write off - - - - - - -
At 30/09/2017 339,814 114,487 217,500 - 57,844 - 729,645
Net Book Value:
At 30/09/2017 209,128 20,062 44,892 517,212 278,282 241,553 1,311,128
At 31/12/2016 100,123 16,680 49,285 462,336 245,561 237,353 1,111,338
16

9 months
ended 30
September
9 months
ended 30
September December December
2017 2017 2016 2016
13 Statutory deposit N'000 N'000 N'000 N'000
Balance at start of period 300,000 300,000
Addition during the year - -
Balance at end of period 300,000 300,000
14 Insurance contract liabilities
Provision for unearned premium :
Reserve-Unexp.Risks 1,344,666 1,123,130
Reserve for Outstanding claims provision 1,046,961 1,267,284
Reserve for IBNR Outstanding claims provision (LAT) 400,000 470,036
1,446,961
Re-insurance IBNR - 1,446,961 - 1,737,320
2,791,627 2,860,450
15 Reserve-Unexp.Risks
At start of period 1,123,130 1,051,456
Additions 221,536 71,673
At end of period 1,344,666 1,123,130
16 Trade payables
Due to Reinsurance 59,303 40,286
Commission payable 866 3,463
60,169 43,749
17 Provision and Other payables
Provision for audit Fees 22,700 22,000
NSITF 239 239
NHF 1,024 1,025
PAYE - 18
Other Payable (see Note 26) 399,177 215,688
NAICOM LEVY 17,937 24,687
Pension for Staff & Company 68 -
Pension for life agents 603 603
441,748 264,261
18 Income tax liabilities
Balance Brought Forward 337,109 147,355
Payment during the year (305,858) (101,646)
Re-measurmnt tax (951) -
Current Provision 431,817 291,400
462,118 337,109
19 Deferred tax liabilities
Balance at start of period 691,572 691,572
Addition during the year - -
691,572 691,572
Deferred tax assets (Note 8a) (466,933) (466,933)
Balance at end of period 224,639 224,639
20 Issued and Paid share capital
Balance at start of period 3,999,999 3,999,396
Addition during the year - 604
Balance at end of period 3,999,999 4,000,000
17
9 months ended 30
September
9 months ended 30
September December December
2017 2017 2016 2016
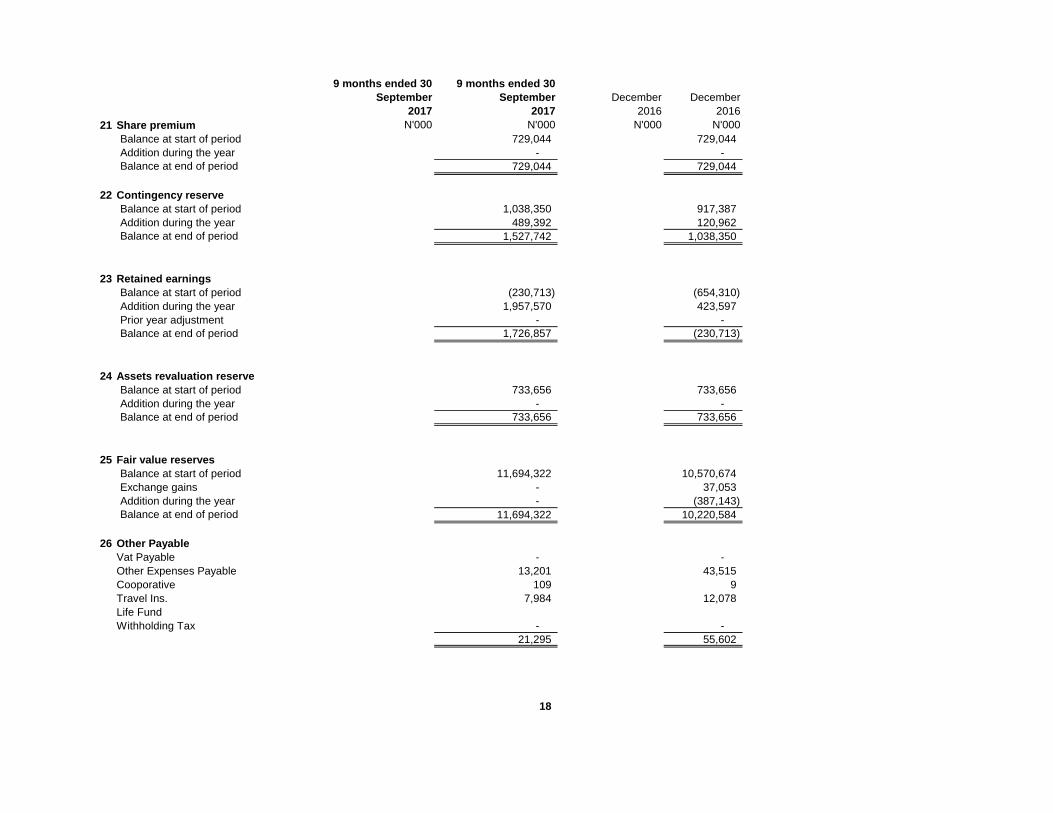
21 Share premium N'000 N'000 N'000 N'000
Balance at start of period 729,044 729,044
Addition during the year - -
Balance at end of period 729,044 729,044
22 Contingency reserve
Balance at start of period 1,038,350 917,387
Addition during the year 489,392 120,962
Balance at end of period 1,527,742 1,038,350
23 Retained earnings
Balance at start of period (230,713) (654,310)
Addition during the year 1,957,570 423,597
Prior year adjustment - -
Balance at end of period 1,726,857 (230,713)
24 Assets revaluation reserve
Balance at start of period 733,656 733,656
Addition during the year - -
Balance at end of period 733,656 733,656
25 Fair value reserves
Balance at start of period 11,694,322 10,570,674
Exchange gains - 37,053
Addition during the year - (387,143)
Balance at end of period 11,694,322 10,220,584
26 Other Payable
Vat Payable - -
Other Expenses Payable 13,201 43,515
Cooporative 109 9
Travel Ins. 7,984 12,078
Life Fund
Withholding Tax - -
21,295 55,602
18

9 months ended
30 September
9 months ended
30 September
27 Acquisition expenses 2017 2016
FIRE Accident MOTOR
Marine &
Aviation Engineering Oil & Gas Total Total
2017 2017 2017 2017 2017 2017 2017 2017
N'000 N'000 N'000 N'000 N'000 N'000 N'000 N'000
Commision Paid 72,090 90,289 85,935 86,558 25,151 279,482 639,505 675,599
Business Acquisition Cost - - - 18,854 - 9,660 28,514 11,953
Movement in Acqusition cost
deferred acquisition cost 1,376 (12,351) (10,353) (10,381) 3,184 (24,867) (53,393) (73,601)
73,466 77,938 75,582 95,030 28,335 264,275 614,626 613,951
28 Reinsurance expense Total Total
Fire Accident Motor
Marine &
Aviation Engineering Oil & Gas
N'000 N'000 N'000 N'000 N'000 N'000 N'000 N'000
Reinsurance premium paid 195,594 206,196 - 185,478 55,747 497,114 1,140,128 677,548
Facultative outwards 8,348 7,131 22,358 2,691 2,836 - 43,364 271,411
Less
Prepaid reinsurance premium 5,337 (17,569) (9,428) (30,579) (5,368) 14,878 (42,729) (42,966)
209,280 195,758 12,930 157,589 53,215 511,992 1,140,764 905,992
29 Claims expenses
Fire Accident Motor
Marine &
Aviation Engineering OIL & GAS Total Total
N'000 N'000 N'000 N'000 N'000 N'000 N'000 N'000
Gross claims paid 369,811 196,776 242,180 24,458 50,424 372,772 1,256,420 1,249,472
Salvage recovery - - (18,046) - - - (18,046) (20,034)
369,811 196,776 224,134 24,458 50,424 372,772 1,238,375 1,229,438
Changes in reserve for outstanding claims (309,071) 51,909 (36,094) (19,330) 91,274 (69,047) (290,359) 491,496
Gross Claims incurred 60,740 248,685 188,040 5,129 141,698 303,725 948,015 1,720,934
Reinsurance claims recovered/recoverable (132,798) (79,604) (6,039) (1,168) (30,913) - (250,522) (987,933)
(72,058) 169,081 182,001 3,960 110,784 303,725 697,493 733,001
9 months
ended 30
September
9 months
ended 30
September
2017 2016
30 Investment income N'000 N'000
Investment income attributable to Policyholders
funds 1,196,109 259,695
Investment income attributable to shareholders'
funds 1,794,163 389,542
2,990,272 649,237
19

9 months
ended 30
September
9 months ended 30
September
2017 2016
31 Cash flow from operating activities N'000 N'000
Profit before taxation 2,878,779 770,123
Adjustment for: -
Depreciation 99,442 94,985
Profi/loss on sales Properties, Plant and Equipments 44 -
(Loss)/profit on disposal of quoted shares - -
Adjustment for deferred acquisition cost (53,393) (73,601)
Written of of PPE (92,000) (3,521)
Revaluation of investment properties (68,000)
Fair value change on unquotes equities - -
Adjustment for impairment loss on unquotes equities - -
VAT paid 26,866 -
Interest received (476,236) (640,741)
Dividend received (2,514,035) (8,496)
Net cash flow before changes in working capital (198,534) 138,748
Increase/(Increase) in Loans and receivables - -
Decrease in trade and other receivables (210,073) (674,928)
Increase/(Decrease) in deferred acquisition cost
Increase/(Decrease) in re-insurance assets 201,978 (430,771)
Decrease in trade and other payables 201,026 468,393
Increase/(Decrease) in insurance contract (68,823) 606,880
Net cash used in from operating activities (74,425) 108,322
20

Financial Summary
Statement of financial position
9 months ended 30
September
9 months ended
30 September
2017 2016
N'000 N'000
Assets
Cash and cash equivalents 1,885,149 2,843,284
Financial assets 19,619,268 14,819,771
Trade receivables 41,267 18,637
Reinsurance assets 582,368 784,347
Deferred acquisition cost 243,019 189,625
Deferred tax asset - -
Other receivables and Prepayments 336,785 149,341
Investment Property 160,000 92,000
Goodwill and Other intangible assets 29,154 24,101
Property, plant and equipment 1,311,128 1,111,338
Statutory deposit 300,000 300,000
Total assets 24,508,137 20,332,444
Liabilities
Insurance contract liabilities 2,791,627 2,860,450
Trade payables 60,169 43,749
Provision and Other payables 441,748 264,261
Income tax liabilities 462,118 337,109
Employee benefits liability 76,068 68,948
Deferred tax liabilities 224,639 224,639
Total liabilities 4,056,368 3,799,156
Capital and reserves
Issued and Paid share capital 3,999,999 3,999,999
Share premium 729,044 729,044
Contingency reserve 1,527,742 1,038,350
Retained earnings 1,726,857 (230,713)
Assets revaluation reserve 733,656 733,656
Re-measurement reserve 40,149 -
Fair value reserves 11,694,322 10,220,584
Total equity 20,451,769 16,490,920
Total liabilities and reserves 24,508,137 20,290,076
21

9 months ended 30
September
9 months ended
30 September
2017 2016Statement of profit or loss and other comprenhensive
income N'000 N'000
Premium income less reinsurance 2,013,089 2,336,013
Underwriting results 65,045 525,751
Profit before taxation 2,878,779 770,123
Taxation (431,817) (154,025)
Profit for the period 2,446,962 616,098
Other comprehensive income
Net balance of revaluation reserve during the year - -
Net fair value gain on available-for-sale financial assets - -
Total other comprehensive income - -
Total other comprehensive income/ (loss) for the
period 2,446,962 616,098
Basic earnings per share attributable to equity
shareholders for the year (kobo) 0.31 0.08
22