unicef niger · 2018-03-08 · unicef niger . summary list of ... spanish committee for unicef...
TRANSCRIPT

© UNICEF/NIGA01828/ Pirozzi
RESPONSE TO CHILD MALNUTRITION 2006 ANNUAL REVIEW
UNICEF NIGER
SUMMARY List of abbreviations and acronyms............................................................ 3
Introduction ............................................................................................... 4
Status of resources mobilization and utilization......................................... 5
Status of inputs stock made available to partners...................................... 6
Admissions to nutritional recovery centres ................................................ 7
Effects and impacts of treatment on children ........................................... 10
Medium-term impact ................................................................................ 11
Other nutrition activities .......................................................................... 13
1) National Food and Nutrition Policy and National Nutrition Plan of Action......................................13 2) Blanket Feeding Operation.......................................................................................................................13 3) Integration of nutritional indicators into EWS follow-up ...................................................................14 4) KAP study on determinants of young children nutrition and feeding practises............................14 5) Support for the local production of Plumpy’nut© ...............................................................................15 6) Training ........................................................................................................................................................15 7) Review of the National Protocol for the management of acute malnutrition ................................15 8) Quality assurance in nutritional rehabilitation centres ......................................................................16
Conclusions and way forward for 2007 .................................................... 17
UNICEF’s strategy in response to child malnutrition for 2007 .................. 17
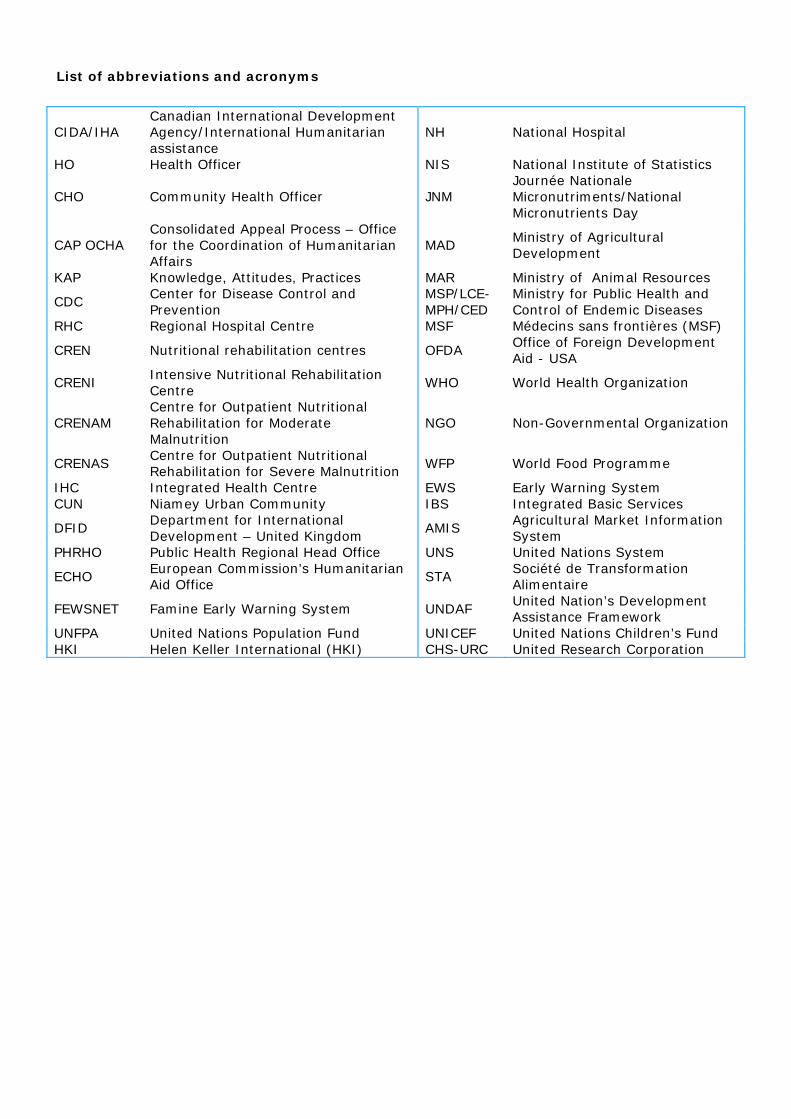
List of abbreviations and acronyms
CIDA/IHA Canadian International Development Agency/International Humanitarian assistance
NH National Hospital
HO Health Officer NIS National Institute of Statistics
CHO Community Health Officer JNM Journée Nationale Micronutriments/National Micronutrients Day
CAP OCHA Consolidated Appeal Process – Office for the Coordination of Humanitarian Affairs
MAD Ministry of Agricultural Development
KAP Knowledge, Attitudes, Practices MAR Ministry of Animal Resources
CDC Center for Disease Control and Prevention
MSP/LCE-MPH/CED
Ministry for Public Health and Control of Endemic Diseases
RHC Regional Hospital Centre MSF Médecins sans frontières (MSF)
CREN Nutritional rehabilitation centres OFDA Office of Foreign Development Aid - USA
CRENI Intensive Nutritional Rehabilitation Centre
WHO World Health Organization
CRENAM Centre for Outpatient Nutritional Rehabilitation for Moderate Malnutrition
NGO Non-Governmental Organization
CRENAS Centre for Outpatient Nutritional Rehabilitation for Severe Malnutrition
WFP World Food Programme
IHC Integrated Health Centre EWS Early Warning System CUN Niamey Urban Community IBS Integrated Basic Services
DFID Department for International Development – United Kingdom
AMIS Agricultural Market Information System
PHRHO Public Health Regional Head Office UNS United Nations System
ECHO European Commission’s Humanitarian Aid Office
STA Société de Transformation Alimentaire
FEWSNET Famine Early Warning System UNDAF United Nation’s Development Assistance Framework
UNFPA United Nations Population Fund UNICEF United Nations Children’s Fund HKI Helen Keller International (HKI) CHS-URC United Research Corporation
4
Introduction
The year 2006 was characterized in Niger by a strong mobilization of all humanitarian actors towards acute malnutrition treatment in children under five. Thanks to this large scale effort, 382,400 children suffering from acute malnutrition were treated and, through a blanket feeding operation, acute malnutrition was prevented in close to 355,000 children under three. As United Nations’ lead agency for emergency response to nutritional crises, UNICEF helped in mobilizing resources, equipping treatment facilities with materials and therapeutic foods, creating an extensive partnership network, coordinating and monitoring all nutrition activities, as well as building the capacities of treatment stakeholders. It is believed that this treatment effort was instrumental in reducing acute malnutrition prevalence, which dropped from 15.3% in October 2005 to 10.3% in October 2006. However, acute malnutrition prevalence level is still higher than the internationally recognized alarm point and requires a constant large-scale mobilization of the humanitarian community. Moreover, the level of chronic malnutrition in children under five is still high and calls for the adoption of specific strategies, to complement strategies to manage acute malnutrition. Some of the challenges faced by the Government and its partners include maintaining the level of mobilization towards acute malnutrition treatment in a bid to cope with the huge number of children suffering from acute malnutrition, mainstreaming and integrating malnutrition treatment into the health system in order to ensure its sustainability, involving the communities in the identification of acute malnutrition cases, and finally, the major challenge of adopting prevention strategies involving communities in acute and chronic malnutrition control. This annual review presents the achievements of UNICEF and its partners within the framework of the emergency response in the field of nutrition, in 2006. It presents the status of resources mobilization and utilization, the situation of inputs stock made available to partners, the situation of admissions in nutritional rehabilitation centres, the effects and impacts of treatment on children as well as a wrap-up of other activities carried out in the area of nutrition.

Status of resources mobilization and utilization As of 31 December 2006, as shown in table 1, UNICEF Niger had mobilized US$9,225,705.35 for the emergency programme in the area of nutrition. Out of this amount, US$5,885,711.36 was committed in 2006 and US$3,339,993.99 was programmed for the continuation of activities in 2007. The needs expressed within the CAP launched by OCHA in March 2006, i.e. US$8,946,794, were covered by more than 100%. The availability of emergency funds was instrumental in achieving the programme results recorded in 2006, especially in the area of procurement and other services.
Table 1: Situation of funds mobilized and used by UNICEF in 2006
for nutritional emergency response
Name Reference Programmable Amount
Amount committed in 2006
Amount programmed in
2007 Finnish Committee for UNICEF SC/2005/3112-01 2,083.11 1,870.66 212.45 Belgian Committee for UNICEF SC/2005/3121-01 63,291.47 47,566.84 15,724.63 Thematic funds for humanitarian assistance SM/2003/9906-71 950,793.42 726,978.76 223,814.66 Liechtenstein SM/2005/0381-01 16,589.55 16,589.55 - United Kingdom SM/2005/0439-01 17,036.44 16,124.69 911.75 CIDA/IHA SM/2005/0461-01 401,091.47 401,101.30 -9.83 France SM/2005/0577-01 248,689.92 159,119.79 89,570.13 Spanish Committee for UNICEF SM/2005/0735-01 175,972.99 108,357.43 67,615.56 German Committee for UNICEF SM/2005/3243-01 533,346.43 331,413.66 201,932.77 English Committee for UNICEF SM/2005/3326-01 108,383.36 104,514.51 3,868.85 Italian Committee for UNICEF SM/2005/3332-01 188,991.59 177,326.97 11,664.62 French Committee for UNICEF SM/2005/3339-01 895,767.25 441,150.00 454,617.25 English Committee for UNICEF SM/2005/3406-01 12,625.96 12,575.50 50.46 Spain SM/2006/0054-01 549,637.31 549,461.31 176.00 Belgian Committee for UNICEF SM/2006/0134-01 109,758.09 - 109,758.09 Denmark SM/2006/0197-01 314,679.82 229,525.78 85,154.04 ECHO SM/2006/0198-01 2,140,419.46 1,916,802.06 223,617.40 USAID/OFDA SM/2006/0213-01 118,226.90 - 118,226.90 CIDA/IHA SM/2006/0221-01 413,541.00 412,991.17 549.83 United Kingdom SM/2006/0309-01 636,704.07 6,000.00 630,704.07 Spain SM/2006/0404-01 614,868.67 0 614,868.67 Thematic funds for humanitarian assistance SM/2006/9906-05 713,207.07 226,241.38 486,965.69
Sub total 1 9,225,705.35 5,885,711.36 3,339,993.99
Out of the amount of resources mobilized in 2006, UNICEF Niger spent US$5,296,588.25, classified under four headings as illustrated in table 2. The bulk of this amount, that is 59.44%, was used to purchase therapeutic foods, pharmaceutical products, measuring equipment and others, including international transport. A significant part of the funds, that is 36%, was directly transferred to partners, notably as support to governments (training and surveys) and as operational support to NGOs participating to the blanket feeding operation (evaluations). Services and contracts represented 3.5% of total funds whereas a small percentage of 1.15% covered mission allowances and other travel expenses related to studies.
Figure 1 : Expenditures
3,53%
35,88%
1,15%
59,44%
CashServicesSupplyTravel
Table 2 : Expenditures Heading Amount %
Cash 1,900,330.82$ 35.88% Services 187,110.03$ 3.53% Supply 3,148,166.95 59.44% Travel 60,980.45 1.15% Total 5,296,588.25 100.00%
5
6
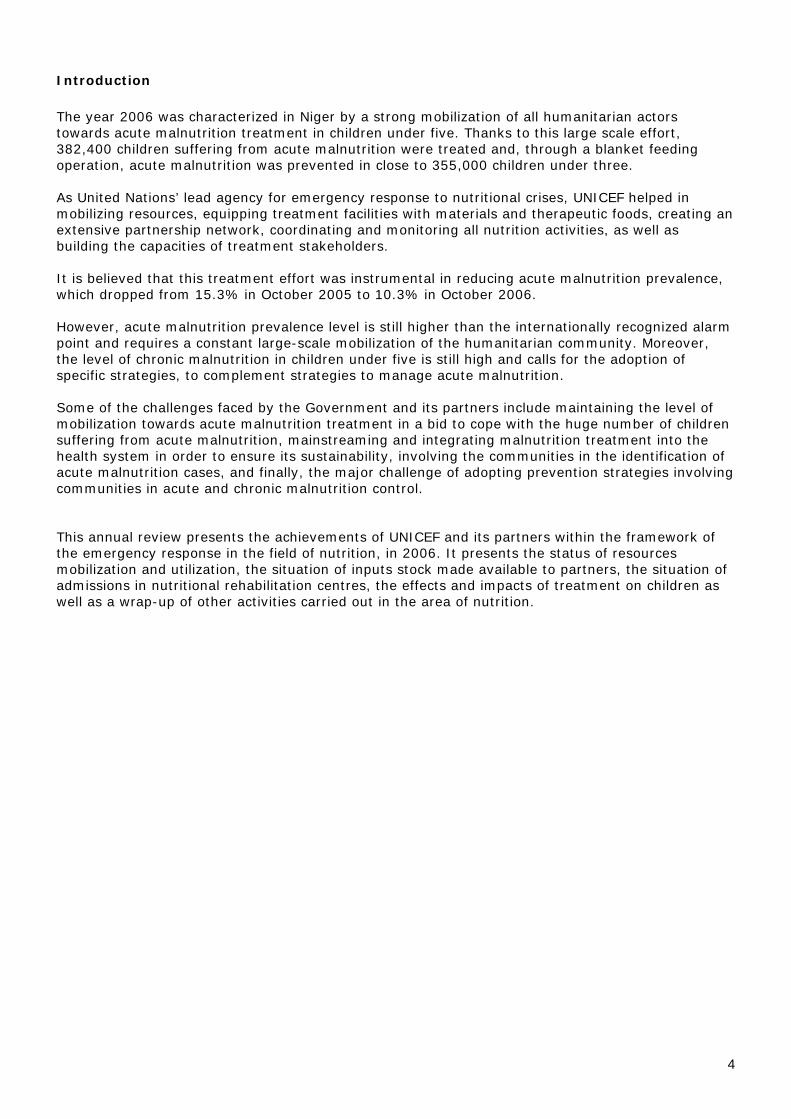
Status of inputs stock made available to partners From January to December 2006, UNICEF procurement plan recorded a relatively high implementation rate for all products distributed to partners. Over-run observed with respect to initial projections were mostly due to the scope of the malnutrition treatment programme, notably in terms of inputs volume injected into the blanket feeding operation for children under three, and the support provided to hospitals for the control of endemic diseases, notably the meningitis and cholera epidemics, as well as floods. Some of the over-run is equally accounted for by the increase in the needs of partners during the year, upon receipt of additional funds or in a bid to meet demand. Furthermore, some NGOs started their activities in the middle of the year, whereas their needs had not been taken into consideration in the initial budget. Most of the requirements of partners were met, as illustrated in table 3.
Table 3: Supply plan implementation follow-up ITEMS UNITS REQUIRED
QUANTITIES DISTRIBUTED
QUANTITIES THERAPEUTIC FOODS F100 Cartons of 30 sachets 2643 1345 F75 Cartons of 20 sachets 723 481 Vegetable oil Litres 179000 370712 Plumpy’nut© Cartons of 150 sachets 42051 33470 RESOMAL Cartons of 130 sachets 47 99 UNIMIX Tons 1796 3266,535 MEASURING EQUIPMENT AND OTHERS Salter SCALES Units 473 828 BREECHES set of 5 473 742 FAMILY KIT Kit for 10 families 500 385 Treated MOSQUITO NETS Units 60935 34205 SOAP Units 200954 91680 Imported measuring rods Units 101 160 local measuring rods Units 212 376 Dim wool blankets 150 cm x 200 cm Units 28218 25229 PHARMCEUTICAL PRODUCTS FOLIC ACID (5mgtabs/pac-1000 pac-1000 3698 323 ALBENDAZOLE 400 mg tabs/pac-100 pac-100 42 457 AMOXICILLIN 250 mg/caps/tabs/pac-1000 pac-1000 740 212 AMOXICILLIN sus 125 mg/5 ml/bot-100 ml Bot 292 4245 BENZYL BENZOATE LOTION 25% bot-1000ml Bot 370 59 IRON SALT+ FOLIC ACID pac-1000 pac-1000 395 1860 NYSTATIN oral sus 100.000IU/BOT-30ml Units 15500 5604 SYRINGE 10ml Units 12000 9500 TRETRACYCLIN eye ointment 1% tube-5g Tube 19834 8232
VITAMIN A 100 000 UI Container of 500 capsules 8 107
VITAMIN A 200 000 UI Container of 500 capsules 54 446
ZINC OXYDE 10% jar-500g jar-500 7053 1462

Admissions to nutritional recovery centres Overall, 382,400 children suffering from acute malnutrition, including 314,667 moderate malnutrition cases and 67,733 severe malnutrition cases, were admitted to CRENs in 2006. Trends of aggregate admissions to the nutritional rehabilitation centres for the entire programme are illustrated in figure 2a. The blue curve corresponds to the trend expected in 2006, based on a hypothetical scenario identical to that of 2005. The red curve represents actual admissions as from week 1 of 2006. These curves reveal that the number of children suffering from acute malnutrition and admitted to the rehabilitation centres was lower than expected for the year 2006, except for the months of June and July, where the two curves superpose. Several reasons account for this situation, notably: i) the projections were made based on a crisis year (drought, locust infestation, food insecurity, etc.) ; ii) the projections did not take into account the impact on the improvement of the situation resulting from treatment efforts since July 2005; iii) the 2005 farming season was considerably better than the previous ones. The increasing variance between the two curves as weeks go by illustrates the buffer effect and the impact of interventions in the treatment of acute malnutrition through a network of about 949 CRENs, in line with the response mechanism put in place in the second half of 2005.
Figure 2.a: Admissions trends compared with 2006 projections
0
100000
200000
300000
400000
500000
600000
S1 S2 S3 S4 S5 S6 S7 S8 S9 S10
S11
S12
S13
S14
S15
S16
S17
S18
S19
S20
S21
S22
S23
S24
S25
S26
S27
S28
S29
S30
S31
S32
S33
S34
S35
S36
S37
S38
S39
S40
S41
S42
S43
S44
S45
S46
S47
S48
S49
S50
S51
S52
Prévisions Réalisations
Figure 2.b : Comparative trends of new admissions per month for the period of September to
December 2005 and 2006
0
10000
20000
30000
4000050000
60000
70000
80000
90000
100000
Septembre Octobre Novembre Décembre
2005
2006
Figure 2.b shows the comparative trends of new monthly admissions for the months of September to December, respectively in blue and red for 2005 and 2006. It can be used to evaluate and compare the impact of admissions during both periods, bearing in mind that the logistical means are similar. During this 4-months period, the number of children admitted to nutritional rehabilitation centres is slightly lower in 2006 compared to 2005 except for December. The decline witnessed in December 2005 admissions is probably due to the incidental slowdown of activities in the field at this period as a result of the concomitant discussions on mainstreaming and integrating treatment of acute malnutrition into government facilities.
7
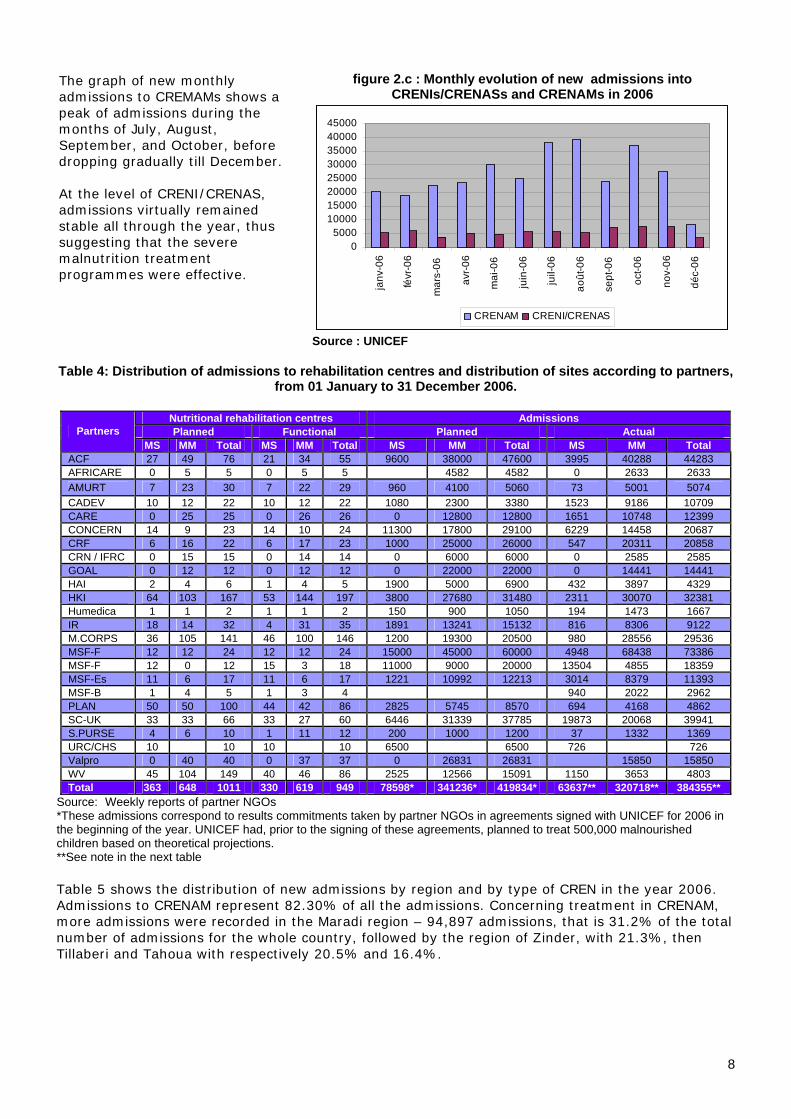
The graph of new monthly admissions to CREMAMs shows a peak of admissions during the months of July, August, September, and October, before dropping gradually till December. At the level of CRENI/CRENAS, admissions virtually remained stable all through the year, thus suggesting that the severe malnutrition treatment programmes were effective.
figure 2.c : Monthly evolution of new admissions into
CRENIs/CRENASs and CRENAMs in 2006
05000
1000015000200002500030000350004000045000
janv
-06
févr
-06
mar
s-06
avr-
06
mai
-06
juin
-06
juil-
06
août
-06
sept
-06
oct-0
6
nov-
06
déc-
06
CRENAM CRENI/CRENAS
Source : UNICEF Table 4: Distribution of admissions to rehabilitation centres and distribution of sites according to partners,
from 01 January to 31 December 2006.
Source: Weekly reports of partner NGOs
Nutritional rehabilitation centres Admissions Planned Functional Planned Actual Partners
MS MM Total MS MM Total MS MM Total MS MM Total ACF 27 49 76 21 34 55 9600 38000 47600 3995 40288 44283 AFRICARE 0 5 5 0 5 5 4582 4582 0 2633 2633 AMURT 7 23 30 7 22 29 960 4100 5060 73 5001 5074 CADEV 10 12 22 10 12 22 1080 2300 3380 1523 9186 10709 CARE 0 25 25 0 26 26 0 12800 12800 1651 10748 12399 CONCERN 14 9 23 14 10 24 11300 17800 29100 6229 14458 20687 CRF 6 16 22 6 17 23 1000 25000 26000 547 20311 20858 CRN / IFRC 0 15 15 0 14 14 0 6000 6000 0 2585 2585 GOAL 0 12 12 0 12 12 0 22000 22000 0 14441 14441 HAI 2 4 6 1 4 5 1900 5000 6900 432 3897 4329 HKI 64 103 167 53 144 197 3800 27680 31480 2311 30070 32381 Humedica 1 1 2 1 1 2 150 900 1050 194 1473 1667 IR 18 14 32 4 31 35 1891 13241 15132 816 8306 9122 M.CORPS 36 105 141 46 100 146 1200 19300 20500 980 28556 29536 MSF-F 12 12 24 12 12 24 15000 45000 60000 4948 68438 73386 MSF-F 12 0 12 15 3 18 11000 9000 20000 13504 4855 18359 MSF-Es 11 6 17 11 6 17 1221 10992 12213 3014 8379 11393 MSF-B 1 4 5 1 3 4 940 2022 2962 PLAN 50 50 100 44 42 86 2825 5745 8570 694 4168 4862 SC-UK 33 33 66 33 27 60 6446 31339 37785 19873 20068 39941 S.PURSE 4 6 10 1 11 12 200 1000 1200 37 1332 1369 URC/CHS 10 10 10 10 6500 6500 726 726 Valpro 0 40 40 0 37 37 0 26831 26831 15850 15850 WV 45 104 149 40 46 86 2525 12566 15091 1150 3653 4803 Total 363 648 1011 330 619 949 78598* 341236* 419834* 63637** 320718** 384355**
*These admissions correspond to results commitments taken by partner NGOs in agreements signed with UNICEF for 2006 in the beginning of the year. UNICEF had, prior to the signing of these agreements, planned to treat 500,000 malnourished children based on theoretical projections. **See note in the next table
Table 5 shows the distribution of new admissions by region and by type of CREN in the year 2006. Admissions to CRENAM represent 82.30% of all the admissions. Concerning treatment in CRENAM, more admissions were recorded in the Maradi region – 94,897 admissions, that is 31.2% of the total number of admissions for the whole country, followed by the region of Zinder, with 21.3%, then Tillaberi and Tahoua with respectively 20.5% and 16.4%.
8

9
Concerning CRENIs and CRENAS, the region of Zinder comes first with 43% (29,130) of new admissions, followed by Maradi with 32.3% and then the Tahoua region with 3.4%. The regions of Agadez and Diffa recorded the lowest admissions rate with 0.71% and 0.44% for CRENIs/CRENAS respectively. The fact that three regions of Niger (Maradi, Zinder and Tahoua) recorded the highest number of admissions to the centres is understandable given the high rates of malnutrition in these three regions, their population and the great number of partners operating there.
Table 5: Distribution of new admissions by administrative region, from January to December 2006
REGIONS J F M A M J J A S O N D Total CRENAM 20608 18971 22495 23662 30501 25286 38400 39852 24018 35983 26459 8432 314667** AGADEZ 279 184 149 179 120 317 181 553 346 474 189 167 3138 DIFFA 337 404 629 1262 1919 1640 1440 995 955 742 10323 DOSSO 775 940 1089 1263 1222 1078 210 1535 623 1216 479 210 10640 MARADI 4948 3650 1995 2130 3623 5196 13847 11694 12303 23766 8053 3692 94897 NIAMEY 241 1389 1346 1393 1295 1043 3250 128 706 967 584 52 12394 TAHOUA 3266 4385 5055 4402 3886 6158 5900 4546 3715 4640 4146 1419 51518 TILLABERI 8854 4324 6959 9051 13967 4497 8392 1039 2742 1848 2540 393 64606 ZINDER 1908 3695 5273 3982 4469 5357 5180 19362 2628 3072 9726 2499 67151 CRENI/CRENAS 5270 5918 3903 5008 4623 5774 5687 5475 7032 7379 8217 3447 67733** AGADEZ 28 32 20 10 11 62 32 42 49 89 71 36 482 DIFFA 37 42 70 24 40 45 3 26 9 296 DOSSO 103 122 145 179 218 228 201 72 52 51 955 32 2358 MARADI 1054 3243 1189 1386 1412 2513 1208 1689 1873 2514 2220 1570 21871 NIAMEY 158 236 237 220 398 124 350 76 203 324 129 138 2593 TAHOUA 993 469 125 415 301 1082 1271 576 918 786 1370 385 8691 TILLABERI 361 234 178 92 58 328 184 48 256 251 287 35 2312 ZINDER 2536 1540 1939 2682 2185 1392 2441 2969 3655 3364 3176 1251 29130 Total 25878 24889 26398 28670 35124 31060 44087 45327 31050 43362 34676 11879 382400**
Source: Monthly reports of partner NGOs ** The total cumulative number over 12 months, based on monthly reports, corresponds to the number of children treated. It is slightly different from the total number of admissions based on weekly reports (previous table), forwarded each week by partner NGOs, based on the number of food rations served. It should be noted that, in a weekly desegregation one child can be counted three times if he or she has been admitted in a CRENI, a CRENA and then to a CRENAM. Such duplication is corrected in the monthly count of children admitted to the centres.

Effects and impacts of treatment on children Table 6 and figure 3 show performance indicators by type of CREN. In CRENAM, out of 265,412 children discharged, 208,194 recovered, representing a recovery rate of 79%. The deceased and dropouts rates, which are respectively 0.8% and 8.3%, are below accepted standards. Non-respondent cases represented 9.5% of the total. With regard to children admitted to the CRENI/CRENAS programmes, out of 68,840 discharged, 50,378 children recovered, representing a recovery rate of 75.9%. Deceased and dropouts rates respectively of 4% and 7.8% are below the acceptable standards (10% and 15% respectively). Non respondent cases represented 3.5% of the total number of children suffering from severe malnutrition. It should be noted that the calculation method used for these indicators considers dropouts and transferred cases in the denominator, whereas these children did not complete the treatment required to get well (dropouts) or were transferred elsewhere to receive more appropriate treatment (transferred). These considerations imply that the rates of recovered and deceased cases calculated do not only encapsulate the efficiency of the therapeutic protocol, but also includes other aspects concerning the functioning of centres which justify the high rates of dropouts and transferred cases. Moreover, research efforts have been made this year to track children considered as “dropouts” cases. It showed that dropouts cases can be children considered by their mothers to have recovered or whose mothers did not have time to return to the centre or children who died in the course of the treatment but are not registered as such. As per non-respondent cases, we do not have any reference to assess the level of this indicator. However, it is considered very important and during the revision of the national Protocol, procedures have been adopted to improve this indicator.
Table 6 and figure 3: Evaluation of discharge indicators per type of centre
CRENI/CRENAS Reference CRENAM Reference Recovered 75.9% 75.0% Recovered 79.0% 70.0% Deceased 4.0% 10.0% Deceased 0.8% 3.0% Dropouts 7.8% 15.0% Dropouts 8.3% 15.0% Non respondent 3.5% Non respondent 9.5% Transferred 8.8% Transferred 2.4% 100% 100%
Indicateur d'impact CRENAM
79.0%
.8%8.3%
9.5% 2.4%
GuérisDécédésAbandonsNon répondantTransfert
Indicateur d'impact CRENI/CRENAS
75.9%
0%7.8%
3.5% 8.8%
GuérisDécédésAbandonsNon répondantTransfert
10

Medium-term impact
The evaluation of the impact of management of acute malnutrition interventions at the national level is complex due to the concurrence of other activities in other sectors also having an impact on malnutrition. However, the comparison of acute malnutrition prevalence at various times as indicated in various national surveys, conducted during similar periods of the year and based on identical methods (e.g. October 2005 UNICEF/CDC/Niger Government survey and the October 2006 UNICEF/WFP/ Niger Government survey), has helped in highlighting the plausibility of the impact of a large-scale intervention in response to acute malnutrition in Niger. Figure 4.a: Trends of global acute and severe acute malnutrition from 2005 to 2006 in children aged 6 to 59 months
0.0%
5.0%
10.0%
15.0%
20.0%
October 2005UNICEF/CDC/GoN
15.3% 1.8%
May 2006 MICSIII 10.3% 1.5%
October 2006UNICEF/INS/PAM
10.3% 1.4%
Global Acute Malnutrition Severe Acute Malnutrition
The results of various nutritional surveys (Figure 4.a) reveal that the rate of acute global malnutrition has significantly declined, dropping from 15.3% in October 2005 to 10.3% in May 2006 as well as in October 2006, which is still above the intervention threshold (> 10%). A similar observation was made for severe acute malnutrition, though to a lesser extent. This significant reduction of moderate acute malnutrition prevalence can be associated with the huge effort made
and the effectiveness of the response to malnutrition by all the partners supporting the government, including the United Nations, donor agencies and NGOs. The establishment of a network of more than 900 rehabilitation centres with the support of 24 NGOs, where, at the beginning of 2005, there was only one CRENI, has been instrumental in achieving these results.
The existence of this network, as well as the significant effort towards the management of acute malnutrition, largely account for the net improvement witnessed by the three regions (Tahoua, Maradi and Zinder) which recorded the highest rates of acute malnutrition in 2005. The rate in the regions of Maradi (6.8%) and Zinder (9.7%) are now below the threshold of 10% whereas one year ago, the malnutrition prevalence in these regions was above the critical level of 15%. With 12.5%, the regions of Agadez, Dosso and Tahoua now have the highest acute malnutrition rates in the country. According to the October 2006 national nutritional survey, the situation is still severe (> 10%) in 5 out of 8 regions.
However, one cannot overlook the concurrent effect of all actions which indirectly contribute to the improvement of the nutritional situation, as well as to the reduction of mortality rates in children under five, as revealed in the EDS/MICS3 survey (between 2000 and 2006, under five child mortality has fallen from 280‰ to 198‰).
Figure 4.a: Comparison of chronic malnutrition (stunting) from 2005 to 2006 in children aged 6-23 months
01020304050607080
Agadez
Dosso
Tahoua
ZinderTotal
Stunting prevalence in Niger6 - 23 months
20052006
11
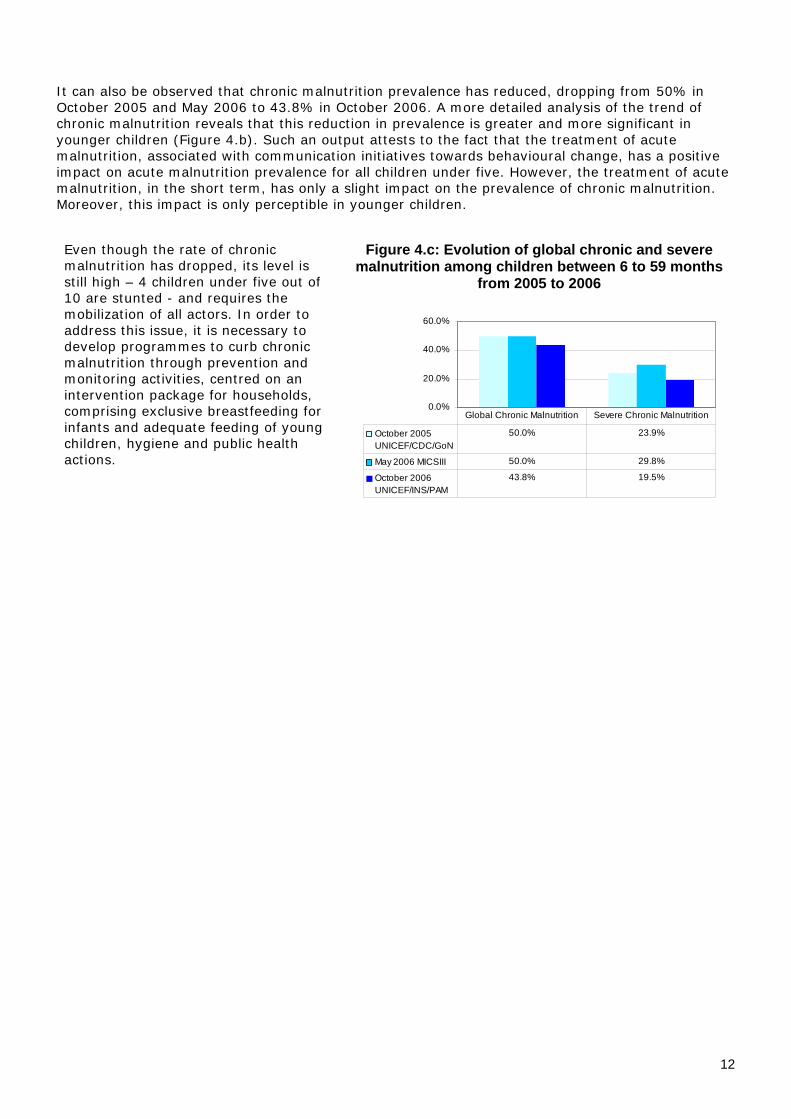
It can also be observed that chronic malnutrition prevalence has reduced, dropping from 50% in October 2005 and May 2006 to 43.8% in October 2006. A more detailed analysis of the trend of chronic malnutrition reveals that this reduction in prevalence is greater and more significant in younger children (Figure 4.b). Such an output attests to the fact that the treatment of acute malnutrition, associated with communication initiatives towards behavioural change, has a positive impact on acute malnutrition prevalence for all children under five. However, the treatment of acute malnutrition, in the short term, has only a slight impact on the prevalence of chronic malnutrition. Moreover, this impact is only perceptible in younger children.
Even though the rate of chronic malnutrition has dropped, its level is still high – 4 children under five out of 10 are stunted - and requires the mobilization of all actors. In order to address this issue, it is necessary to develop programmes to curb chronic malnutrition through prevention and monitoring activities, centred on an intervention package for households, comprising exclusive breastfeeding for infants and adequate feeding of young children, hygiene and public health actions.
Figure 4.c: Evolution of global chronic and severe malnutrition among children between 6 to 59 months
from 2005 to 2006
0.0%
20.0%
40.0%
60.0%
October 2005UNICEF/CDC/GoN
50.0% 23.9%
May 2006 MICSIII 50.0% 29.8%
October 2006UNICEF/INS/PAM
43.8% 19.5%
Global Chronic Malnutrition Severe Chronic Malnutrition
12

13
Other nutrition activities
1) National Food and Nutrition Policy and National Nutrition Plan of Action Following the 11 to 13 October 2006 workshop on the validation of the National Food and Nutrition Policy and of its implementation plan, the Ministry of Public Health and Endemic Diseases Control is in possession of the final validated versions to be submitted to the Government Secretariat for adoption. In summary, the National Food and Nutrition Policy acknowledges the importance of nutrition in the country’s social and economic development and promotes the following strategies:
- Prevention strategies, namely: fight against food and nutrition insecurity in households, promotion of the production of food rich in micronutrients, nutritional monitoring, nutrition of young children in schools, implementation of essential nutrition interventions, promotion of the development and use of adequate food supplements, fortified food ;
- Remedial strategies such as the improvement of access to dietetic and medical treatment, control of interaction between nutrition and HIV, treatment of emerging diseases linked to over-feeding, diabetes, obesity, hypertension and cardio vascular diseases;
- Cross-cutting strategies including the development of a holistic approach towards nutrition issues (under-nutrition and over-nutrition), development of an efficient nutritional communication, poverty reduction and women empowerment, the operational integration among MPH/CED nutrition sections, the MAD and MAR vulgarization facilities and the communication and education services, the coordination of nutrition and development activities, the reinforcement of human resources, the national capacity building for the management and prevention of malnutrition, and the involvement and participation of community structures.
The National Nutrition Plan of Action for the period 2007-2013 is an effective framework for the implementation of the national policy. It includes eight (8) major programmes directly oriented towards food security and malnutrition control. They include:
- Diversification of food production and enhancement of nutritional value; - Control of malnutrition and specific deficiencies; - Treatment of socio-economically underprivileged and nutritionally vulnerable persons; - Promotion of healthy diets and ways of life; - Promotion of good feeding practices for infants and young children; - Promotion of food quality and safety; - Evaluation, analysis and control of the food and nutrition situation, capacity building and
evaluation/monitoring; - Coordination, training and research
2) Blanket Feeding Operation
One of the lessons learnt from the management of the 2005 crisis is the necessity to pre-empt the malnutrition spiral by distributing food supplies right on the onset of the lean period. Thus, in 2006, a blanket feeding operation was conducted in the regions of Tahoua, Maradi and Zinder, thanks to the financial support from UNICEF, WFP and 5 NGOs (Amurt, CARE, CRS, Valpro and World Vision). It consisted in deploying a preventive food safety net as a complement to the emergency programme. Despite the initial delay suffered at the beginning, this programme made it possible to reduce the risk of malnutrition in more than 350,000 children under three. This target distribution of supplementary food (CSB or UNIMIX) focused on children under three living in areas situated more than 10km away from rehabilitation centres (outside of the CREN coverage area), in regions where acute malnutrition was rife (Maradi, Zinder and Tahoua). The areas were also selected based on the results of the Emergency Food Security Assessment (EFSA) conducted by the WFP. For three straight months, a monthly food package comprising 12.5 kg of CSB/UNIMIX, 1.25 kg of vegetable oil and 0.94 kg of sugar (for CSB packages only) was distributed to a total of 354,889 beneficiaries (93,959 under three children in Maradi, 125,747 children in Tahoua and 135,183 children in Zinder). In total, 14.1 tons of cereal flour was distributed. An initial assessment was conducted prior to the distributions to determine the nutritional status (through measuring of the mi-upper arm circumference) and the food security conditions of the

14
target populations. The distribution operation ended late December. Partner NGOs are presently taking final stock of the operation with a view to assessing the impact and getting feedback from the targeted families vis-à-vis the distribution. It should be noted that UNICEF regrets the fact that this operation started late and strongly recommends that it should start on the onset of the lean season, between May and August, if it is to be carried out in 2007.
3) Integration of nutritional indicators into EWS follow-up
The year 2006 witnessed the introduction of nutritional indicators in the monitoring of the EWS (SAP in French) vulnerable areas. As a reminder, up to the end of 2005, the monitoring of EWS vulnerable areas used to use only agro-ecological and economic indicators, based on a monthly data collection, in assessing changes in the vulnerability situation of the monitored areas.
Following the food and nutrition crisis of 2005, UNICEF provided financial, technical and logistic support to the introduction of nutritional indicators in the monitored areas of 12 departments covered by the UNICEF cooperation programme. The 2006 experiment answered a need for analysis and an expectation of different partners but it encountered some difficulties due to the poor quality of data collected. Given this situation, UNICEF requested that the project’s implementation procedures be reviewed.
In this regard, meetings held with the EWS coordination body enabled the following measures to be recommended:
- Recruitment and training of agents in each region to collect monthly data. Part-time employment of agents rather than making use of state agents.
- Close supervision by state agents in charge of monitoring EWS zones; - Advocacy to invite other partners to strengthen and scale up the system in areas outside
UNICEF’s main intervention area, particularly in regions characterized by severe food insecurity such as Tillabéri and Ouallam;
- Mobilization of technical assistance in nutrition within the EWS to be charged of preparing EWS technical tools and managing the results. This would greatly contribute to an in-depth improvement of this data-collection tool.
A report being prepared at the level of the EWS should help in formulating new strategies aiming at rapidly revamping the activity.
4) KAP study on determinants of young children nutrition and feeding practises
In August 2006, UNICEF conducted, in the region of Maradi, a quantitative and qualitative study on nutrition-related knowledge, attitudes and practices comprising the issues of access and resort to primary health care services for pregnant and nursing mothers, new-born babies and young children, access to drinkable water, hygiene and sanitation. The study established a comparison between the practices observed in the area of nutrition and those recommended. The characteristic features of these inefficient practices were examined and possible strategies ultimately defined in a bid to promote best practices and adequate behaviours. The priorities highlighted by this study were as follows:
- Exclusive breastfeeding in the first 6 months of life; - Food supplements for children after 6 months to complement breast milk; - Practices to be adopted for children aged 0 to 5 years; - Nutrition for girls aged between 10 to 15 years, pregnant and nursing mothers (mothers of
babies aged between 0 - 6 months).
Thanks to this study, UNICEF has detailed information on the behavioural determinants of targeted groups in their socio-cultural environment. Based on the findings, it is possible to provide adequate solutions to the needs of targeted groups and to design an integrated communication plan, in 2007. This plan will comprise communication strategies and tools for behavioural change adjusted to the local context.
The communication tools and techniques so developed will be implemented, in a pilot phase, in four departments (Tessaoua, Madarounfa, Mayahi, and Dakoro) of the Maradi region, one of the areas most hit by the food and nutritional crisis in 2005.
15
5) Support for the local production of Plumpy’nut©
In order to support the local production of therapeutic foods for severely malnourished children, UNICEF, with the financial support of ECHO, purchased, in 2006, close to 130 tons of Plumpy’nut©, manufactured by STA (Société de Transformation Alimentaire) in Niamey. It made possible to attend to 13,000 severely malnourished children treated in 2006. This collaboration with STA will continue in 2007 in order to promote the local production of this vital therapeutic food in the treatment of severe malnutrition. According to UNICEF, such experience should be significantly and constantly encouraged, especially as STA is the only company in the sub-region manufacturing this therapeutic food. Furthermore, under UNICEF’s strict quality control, Plumpy’nut© packaging will, in 2007, undergo some modification aimed at easing its use by under five children (sachets instead of cans).
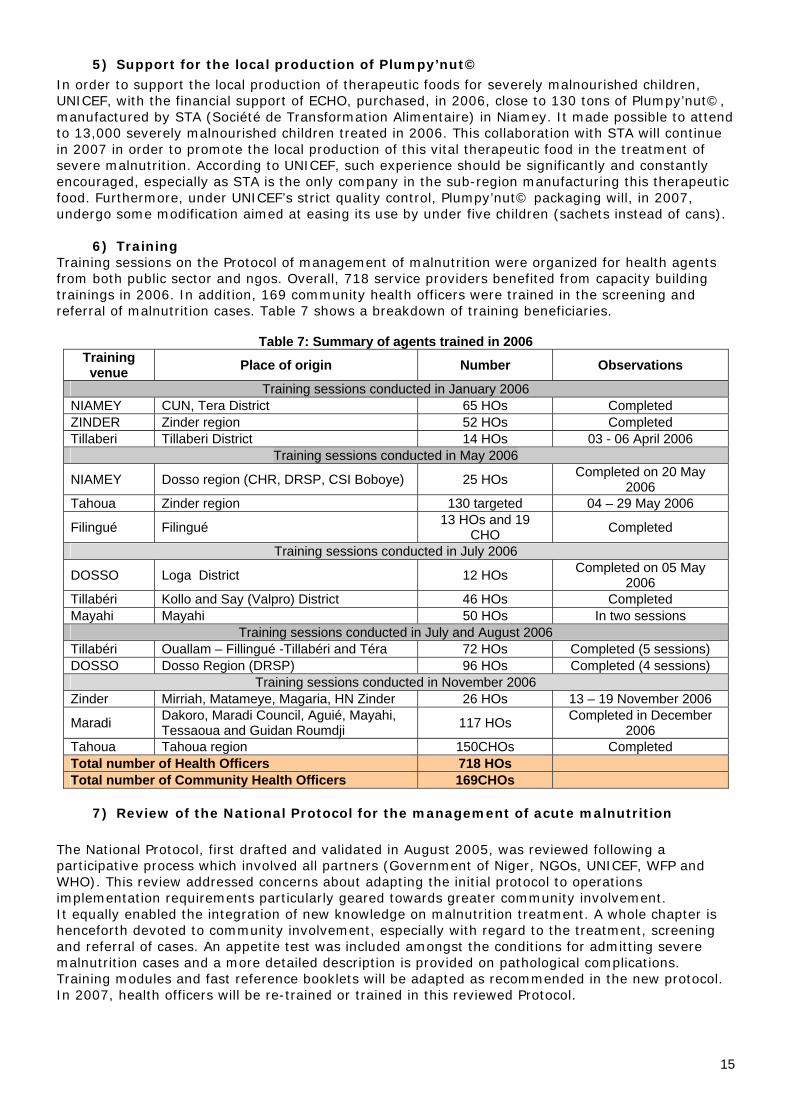
6) Training Training sessions on the Protocol of management of malnutrition were organized for health agents from both public sector and ngos. Overall, 718 service providers benefited from capacity building trainings in 2006. In addition, 169 community health officers were trained in the screening and referral of malnutrition cases. Table 7 shows a breakdown of training beneficiaries.
Table 7: Summary of agents trained in 2006 Training venue Place of origin Number Observations
Training sessions conducted in January 2006 NIAMEY CUN, Tera District 65 HOs Completed ZINDER Zinder region 52 HOs Completed Tillaberi Tillaberi District 14 HOs 03 - 06 April 2006
Training sessions conducted in May 2006
NIAMEY Dosso region (CHR, DRSP, CSI Boboye) 25 HOs Completed on 20 May 2006
Tahoua Zinder region 130 targeted 04 – 29 May 2006
Filingué Filingué 13 HOs and 19 CHO Completed
Training sessions conducted in July 2006
DOSSO Loga District 12 HOs Completed on 05 May 2006
Tillabéri Kollo and Say (Valpro) District 46 HOs Completed Mayahi Mayahi 50 HOs In two sessions
Training sessions conducted in July and August 2006 Tillabéri Ouallam – Fillingué -Tillabéri and Téra 72 HOs Completed (5 sessions) DOSSO Dosso Region (DRSP) 96 HOs Completed (4 sessions)
Training sessions conducted in November 2006 Zinder Mirriah, Matameye, Magaria, HN Zinder 26 HOs 13 – 19 November 2006
Maradi Dakoro, Maradi Council, Aguié, Mayahi, Tessaoua and Guidan Roumdji 117 HOs Completed in December
2006 Tahoua Tahoua region 150CHOs Completed Total number of Health Officers 718 HOs Total number of Community Health Officers 169CHOs
7) Review of the National Protocol for the management of acute malnutrition The National Protocol, first drafted and validated in August 2005, was reviewed following a participative process which involved all partners (Government of Niger, NGOs, UNICEF, WFP and WHO). This review addressed concerns about adapting the initial protocol to operations implementation requirements particularly geared towards greater community involvement. It equally enabled the integration of new knowledge on malnutrition treatment. A whole chapter is henceforth devoted to community involvement, especially with regard to the treatment, screening and referral of cases. An appetite test was included amongst the conditions for admitting severe malnutrition cases and a more detailed description is provided on pathological complications. Training modules and fast reference booklets will be adapted as recommended in the new protocol. In 2007, health officers will be re-trained or trained in this reviewed Protocol.

16
8) Quality assurance in nutritional rehabilitation centres
In line with UNICEF’s support for the integration of malnutrition management interventions in Government health centres, and considering CHS-URC quality assurance experience in the health facilities of Niger, this NGO was solicited in order to improve the quality of the treatment of severe acute malnutrition in some hospitals and the scaling up of such treatment to other health facilities. The project equally aims, in 2007, at testing the quality approach in integrated health centers for the outpatient treatment of moderate malnutrition.
17
Conclusions and way forward for 2007
The year 2006 witnessed, following the 2005 acute crisis, a high mobilization of national and international actors for the management of acute malnutrition in children in Niger. The State of Niger showed a committed and collaborative attitude which facilitated the support provided by partners. Significant results were recorded: 382,400 children were admitted to different nutritional rehabilitation centres, 355,000 children benefited from a blanket feeding operation, the coordination of a network of 24 NGOs and national health facilities was undertaken, capacity building through the training of over 700 health officers, and the monitoring of the nutritional situation, thanks to which, on two occasions, a snapshot of the national and regional situation was presented. In terms of impact, the reduction of acute malnutrition rate and its levelling at 10.3% throughout 2006 constitute a major achievement which can be associated with the large scale effort made by all partners. However, the rate of global acute malnutrition is still above the alarm threshold, thus requiring a consistent commitment of all stakeholders. The efforts made towards fostering the mainstreaming and integrating of acute malnutrition treatment into Government health facilities constitute a great challenge. Moreover, considering the large number of children suffering from moderate acute malnutrition and the high level of severe malnutrition, it is imperative to concurrently invest in preventive strategies at the community level. The high level of chronic malnutrition in under five children, particularly in younger children, should draw the attention of the humanitarian community, despite progress made. By and large, the following lessons and avenues for reflection can be drawn from the 2006 review:
The strong mobilization for the management of acute malnutrition has a significant impact on the prevalence of acute malnutrition, particularly in its moderate form;
The treatment of malnourished children is effective; The prevalence of acute malnutrition requires a consistent commitment; The treatment of acute malnutrition has only a limited impact on chronic malnutrition on
the short term; It is fundamental to integrate into future strategies a greater malnutrition prevention
dimension, associated with sustainable strategies for the management of acute malnutrition, both of which should be centred on community involvement;
Prevention should be included in an integrated package of activities aiming at improving family practices for child survival and development;
Activities contained in the family care package should be based on scientifically proven high impact, yet low cost activities;
The promotion of food diversification, component of the long-term solution, should constitute the focus of youth-centred initiatives;
Scaling up is crucial for the realisation of Millennium Development Goals. Within this context, UNICEF, on behalf of all the children of Niger, appeals to the Government, partners, donors and communities to strengthen the partnership in favour of the management of malnutrition, by focusing their actions even more towards the survival and development of under five children. UNICEF’s strategic lines of action for 2007 The objective of the response to child malnutrition in Niger in 2007 is to control malnutrition and associated mortality in children under five. To this end, it would be appropriate to simultaneously ensure the treatment of malnourished children in adequate facilities and develop malnutrition prevention activities at the community and household level. The target population comprises all children under five who suffer from malnutrition or are vulnerable to malnutrition, bearing in mind that children under three are the most vulnerable in this target group.

18
In this context, strategic objectives have been set as follows: • Ensure the dietetic and medical treatment of malnourished under five children in the existing
network of nutritional rehabilitation centres. • Increase the access of children under five to adequate foods (enriched flour, ready-for-use
therapeutic products,…) • Establish an effective nutritional monitoring system for children under five • Implement a communication plan on better exclusive breastfeeding and complementary food
practices for infants and toddlers • Prevent malnutrition in children under three; especially during the lean season, by distributing
complementary foods through a blanket feeding operation conducted immediately right on the onset of the lean though its end.
• Target pregnant and nursing mothers in nutritional activities. • Step up the monitoring and evaluation of the nutritional situation of under-fives • Strengthen the community approach • Enhance the mainstreaming of nutritional recovery activities into government structures; The intervention strategies are as follows: At the institutional level • High-level advocacy aimed at securing the approval and support of the authorities for nutrition
activities • Launch a national conference on the long-term treatment and prevention of malnutrition which
should come out with an action plan • Finalize and institutionalize the integration and operating procedures of partner NGOs • Specify communication methods of NGOs and UN agencies and promote planned and/or common
actions based on the results of surveys and other key events • Build Government’s coordination capacities. At programme level • Groups targeted by the activities:
-All malnourished under-fives for malnutrition treatment, with priority given to under-threes; -Children under five for prevention; -Pregnant and nursing mothers; -Malnourished women of child-bearing age
• Dietetic and medical treatment of malnutrition cases in nutritional rehabilitation centres • Free access to health care, including to therapeutic foods • Growth monitoring, treatment and prevention activities at the community level and by the
community • Increased access of infants and young children to adequate foods • Nutritional monitoring activities at national level.
Based on these defined lines of action, UNICEF’s strategy in response to child malnutrition aims at ensuring the achievement of the Millennium Development Goals 1 and 4, namely: halve the proportion of people who suffer from hunger and reduce by two-thirds the under-five mortality rate, between 1990 and 2015,. To this end, UNICEF has budgeted, for its 2007 nutrition programme, the amount of US$8,970,400, as summarized in table 8. Within this budget and against the CAP launched by OCHA in December 2006, UNICEF Niger is seeking to mobilize US$5,879,318 in order to treat 300,000 malnourished under-fives in 2007.

19
Table 8: Summary of UNICEF 2007 nutrition programme
SUB PROJECTS EXPECTED OUTPUTS BUDGET Output 1.1 Proportion of women who exclusively breast-feed their children (0 to 6 months) increased from 1% to 5% and Proportion of children between 6 to 24 months receiving adequate complementary feeding increased by 30%
$1,670,700
Output 1.2 Effective micronutrient supplementation for target groups (100% of children between 6 to 59 months, 60% of post partum women) and effective fortification of food (extensive use of iodized salt in households and identification of foods containing Vitamin A and iron) countrywide.
$1,269,500
Output 1.3 Good family practices concerning nutrition for women and adolescents promoted $508,000
Malnutrition prevention
Sub total 1 Malnutrition prevention $3,448,200 Output 2 Response to the treatment of 350,000 children (30,000 severe cases) and 65,000 pregnant and nursing women suffering from moderate and severe malnutrition effective in all districts and response to localized crisis
$4,221,000 Malnutrition treatment
Sub total 2 Malnutrition treatment $4,221,000 Output 3.1 Community-based nutritional monitoring system reinforced $527,500
Output 3.2 Institutional nutritional monitoring system reinforced $483,000
Output 3.3 Institutional support and advocacy ensured $290,700
Nutritional monitoring
Sub total 3 Nutritional monitoring $1,301,200 TOTAL $8,970,400

20
UNICEF heartily thanks donors and partner NGOs:
Donors Canadian Development Agency English Committee for UNICEF German Committee for UNICEF Belgian Committee for UNICEF Danish Committee for UNICEF Spanish Committee for UNICEF French Committee for UNICEF Finn Committee for UNICEF Italian Committee for UNICEF Danish Government Department of International Development - DFID Government of United Kingdom Humanitarian Aid office of the European Union (ECHO) Spanish Government Thematic funds for humanitarian response French Government Liechtenstein Government Government of the United Kingdom Office of Foreign Development Aid USAID/OFDA
Partner NGOs Action Contre la Faim Africare AMURT CADEV CARE CONCERN French Red Cross Society International Red Cross and Red Crescent Societies GOAL Human Appeal International (HAI) Helen Keller International (HKI) Humedica Islamic Relief Mercy Corps Médecins sans frontière (MSF) Belgium Médecins sans frontière (MSF) Spain Médecins sans frontière (MSF) France Médecins sans frontière (MSF) Switzerland Plan international Niger Samaritan Purse Save the children UK URC Valpro World Vision
For more information, contact: Gaëlle Bausson, Communication Officer, UNICEF Niger + 227 20 722 697 or +227 96 296 751