uneven coverage of natural disasters in wikipedia: the ... · uneven coverage of natural disasters...
TRANSCRIPT
Lorini et al. Uneven coverage of natural disasters in Wikipedia
Uneven Coverage of NaturalDisasters in Wikipedia:
the Case of Floods
Valerio LoriniEuropean Commission, Joint Research
Centre (JRC), Ispra, ItalyUniversitat Pompeu Fabra, Barcelona, Spain
Javier RandoUniversitat Pompeu Fabra, Barcelona, Spain
Diego Saez-TrumperWikimedia
Carlos CastilloUniversitat Pompeu Fabra, Barcelona, Spain
ABSTRACT
The usage of non-authoritative data for disaster management presents the opportunity of accessing timely informationthat might not be available through other means, as well as the challenge of dealing with several layers of biases.Wikipedia, a collaboratively-produced encyclopedia, includes in-depth information about many natural and human-made disasters, and its editors are particularly good at adding information in real-time as a crisis unfolds. Inthis study, we focus on the English version of Wikipedia, that is by far the most comprehensive version of thisencyclopedia. Wikipedia tends to have good coverage of disasters, particularly those having a large number offatalities. However, we also show that a tendency to cover events in wealthy countries and not cover events in poorerones permeates Wikipedia as a source for disaster-related information. By performing careful automatic contentanalysis at a large scale, we show how the coverage of floods in Wikipedia is skewed towards rich, English-speakingcountries, in particular the US and Canada. We also note how coverage of floods in countries with the lowestincome, as well as countries in South America, is substantially lower than the coverage of floods in middle-incomecountries. These results have implications for systems using Wikipedia or similar collaborative media platforms asan information source for detecting emergencies or for gathering valuable information for disaster response.
Keywords
social media, news values, Wikipedia, natural disasters, floods
INTRODUCTION
During the past decade, water-related disasters happened more frequently and their impacts have been moresevere, hindering sustainable development by causing socio-economic disruption in many countries. Altogether,water-related disasters, such as floods, droughts, storm surges, cyclones, convective storms and tsunamis, account for90% of all disasters in terms of the number of people affected and among them, 50% are flood events (Hiroki 2019).
Unaddressed vulnerabilities, rising population, intertwined natural events, continue to be the main critical factorsfor catastrophic loss of life, disrupting livelihoods and fueling new displacement. A previous analysis estimated thatpeople in the least developed countries are, on average, six times more likely to be injured, lose their home, bedisplaced or evacuated, or require emergency assistance, than those in high-income countries (UNDRR 2019).
Death tolls and economic losses from natural hazards are expected to rise in many parts of the world. Severalpossible future scenarios show that flood impacts will increase. The more rapid rise of fatalities will be in countrieswith high human vulnerability, which is a combination of high exposure, low flood protection, and high mortality
CoRe Paper – Social Media for Disaster Response and ResilienceProceedings of the 17th ISCRAM Conference – Blacksburg, VA, USA May 2020
Amanda Lee Hughes, Fiona McNeill and Christopher Zobel, eds.
arX
iv:2
001.
0881
0v1
[cs
.IR
] 2
3 Ja
n 20
20

Lorini et al. Uneven coverage of natural disasters in Wikipedia
rates. Countries with higher income levels show lower human vulnerability and the high number of people exposedtranslates into lower mortality compared to developing countries (Dottori et al. 2018). An analysis of vulnerabilityat a global scale, integrating population and economic dynamics with one of the most comprehensive naturaldisaster loss databases, show that there is still a considerable climate hazard vulnerability gap between poorer andwealthier countries (Formetta and Feyen 2019).
Wikipedia, founded in 2001, has come a long way, becoming over the years one of the primary sources ofencyclopedic information worldwide. In fact, during 2018 alone, the English Wikipedia had over 108 billions articleviews. It accounts for approximately 45% of all page views on Wikimedia projects in this period (237B)1.
One of Wikimedia’s goal is sharing knowledge, and an extensive international base of editors is a crucial elementin providing information in several languages. Even if a useful, ethical code for Wikipedians can guide editingtowards styles of practice that best support the Wikipedia mission2, when editors mix personal interests with thegoals of the Wikipedia community as a whole, they make choices that can affect the articles they create and edit(Hube 2017). Although collaborative editing fulfils the objective of sharing information, it can introduce biases thatare apparent when Wikipedia is used as a reference data set for a specific topic, such as natural science research.
In recent years, researchers have placed much effort into studying how to extract meaningful information for crisismanagement from social media and collaborative sources (Lorini et al. 2019; Imran et al. 2016; Olteanu et al. 2015),but biases in these sources are rarely evaluated.
In a seminal paper, Galtung and Ruge (1965) showed that pieces of news from “elite” nations were more likely to becovered in foreign news reports. We find evidence of the same for the coverage of floods in the English Wikipedia,noting that floods in the wealthiest countries, particularly floods in the US, are more likely to appear in Wikipediathan floods in the poorest countries.
We think that Wikipedia is a valuable source of free data, and it could be beneficial to researchers in the DisasterRisk Reduction field if biases are identified, measured, and mitigated. In this article, we estimate the coverage offloods in Wikipedia along many variables, including Gross Domestic Product (GDP), Gross National Income (GNI),geographic location, number of English speakers, fatalities, and various indices describing the level of vulnerabilityof a country.
Addressing flaws and exposing biases can help the research community to think about possible countermeasuresthat can lead to a set of best practices for Wikipedia or for publishing research leveraging Wikipedia data. Our maincontributions are:
• We establish a validated reference set of events tracked by several independent organizations, with supportfrom hydrologists. Some organizations collect data about floods for different purposes, from insurance tosustainable development goals set by the United Nations (UN). Their effort is to collect floods data on aglobal scale. We compare and collate the different data sources.
• We match verified events with Wikipedia entries. We analyze three methodologies for matching verifiedevents with Wikipedia’s text in terms of location and temporal references. In our work, a particular effort hasbeen made to geo-locate Wikipedia entry candidates since we wanted to identify news reporting informationabout an event and to exclude generic collections of unspecified events.
The remainder of this paper is organized as follows: the next section presents related work; then, the third sectiondescribes the methods for establishing verified ground truth information, for matching Wikipedia data with verifiedevents and how to geo-locate them Finally, we present experimental results, including a case study, followed by ourconclusions and future work.
RELATED WORK
Wikipedia has been used as a data source to study sustainable development and for Disaster Risk Reduction. Forinstance, it has been recently used as a source of data to estimate indicators at very high spatial resolution leveragingrecent advances in Natural Language Processing (NLP) by extracting information from free-text articles (Sheehanet al. 2019). In their work, the spatial distribution of the articles and meta-data extracted from its text, combinedwith other data such as night-light satellite images, are used to improve the prediction of socio-economic indicatorsof poverty, as measured by ground truth survey data collected by the World Bank.
1https://stats.wikimedia.org/v22https://en.wikipedia.org/wiki/Wikipedia:Ethical_Code_for_Wikipedians
CoRe Paper – Social Media for Disaster Response and ResilienceProceedings of the 17th ISCRAM Conference – Blacksburg, VA, USA May 2020
Amanda Lee Hughes, Fiona McNeill and Christopher Zobel, eds.

Lorini et al. Uneven coverage of natural disasters in Wikipedia
In previous work, researchers used Wikipedia for detecting and monitoring natural disasters (Steiner and Verborgh2015a) leveraging interlinks between versions of the same article in different languages and inbound/outboundredirects to other similar articles. The methodology proposed in their paper consists in creating and maintaining alist of articles related to natural disasters, scanning Wikipedia entries and subsequently checking if edits happen onan article in the list, assuming a new event reported would impact the monitoring-list.
Considering that Wikipedia is being used as a source for data analysis, our work aims at identifying potential biasesin Wikipedia coverage of natural events, specifically floods.
Wikipedia exhibits a substantial amount of self-focus, in the sense that editors in each language-specific Wikipediatend to write about topics that are of interest to their community and not others (Hecht and Gergle 2009). Acountry-based analysis of Wikipedia shows that geotagged articles (i.e., articles referring to specific locations)concentrate in only a few countries, and this concentration can be explained in no small extent with variables such aspopulation, number of broadband Internet connections, and number of edits emanating from each country (Grahamet al. 2014).
A comparison of Wikipedia with the Global Terrorism Database3 in 2015 shows that Wikipedia covered about78% of attacks and almost all of the terrorism-related deaths in Western countries, but only 28% of those in othercountries (Rossling 2019).
Also, Wikipedia suffers from a cultural gap that favours entries written in English and especially, those referring tothe United States of America (USA) which are the longest and best-referenced ones (Callahan and Herring 2011).Tobler’s law for geography claims that similarity decreases with distance (Tobler 1970). According to this law, thoseevents happening close to English speaking countries should be considered more familiar to Wikipedia editors andtherefore, better covered than those happening in distant places. There are also urban/rural biases, with Wikipediacoverage of rural areas being systematically inferior in quality (Johnson et al. 2016).
Becoming a source on current news events was not part of the original mission of Wikipedia, but currently, the mostvisited and edited articles are about current events (Keegan et al. 2012). Wikipedia has transitioned into a sourcethat incorporates significant news work (Keegan 2013).
When it comes to history, Wikipedia narratives are biased towards recent events and those happening in WesternEurope (Samoilenko et al. 2017b; Samoilenko et al. 2017a). Partially because of this, there is an explicit Wikipediapolicy against “recentism”4.
Regarding coverage of natural disasters, a study on the Tohoku catastrophes showed that activity on Wikipediaconcentrated on the day of the earthquake, but there was intense editing activity for several days (Keegan et al.2011). A similar pattern of intense activity close to the events was observed in the 2011 Arab spring (Ferron andMassa 2011). Most of these event-centric articles are written as the event unfolds (Moats 2019) and indeed, spikesin editing activity can be used for detecting new crisis events (Steiner and Verborgh 2015b).
Our work is focused on natural disasters at a global scale for events happening over more than three years. Therefore,our experiments widen the previous analysis of biases, including a set of socio-economic risk indicators concerningnatural hazards.
METHODS
Ground Truth Generation
This work aims to analyze the coverage of floods in Wikipedia. To carry out our experiments, we established aconsistent and reliable ground truth about flooding events globally. We developed methodologies for extractingcandidates from Wikipedia articles and defined metrics for evaluating matches between candidates and ground truthinformation.
Development and relief agencies have long recognized the crucial role played by data and information from previousevents in mitigating the impacts of disasters on vulnerable populations. Due to the complexity of collecting reliableinformation, there is still no international consensus regarding best practices for defining critical aspects of an eventsuch as starting date, duration or number of fatalities.
To carry out our experiments, we selected data source which included validated information from internationalrelief agencies or local governments worldwide to cover all the events that could have been detected on the socialnetworks so Precision and Recall could be computed against a complete validated dataset. That is why we consider
3https://www.start.umd.edu/data-tools/global-terrorism-database-gtd4https://en.wikipedia.org/wiki/Wikipedia:Recentism
CoRe Paper – Social Media for Disaster Response and ResilienceProceedings of the 17th ISCRAM Conference – Blacksburg, VA, USA May 2020
Amanda Lee Hughes, Fiona McNeill and Christopher Zobel, eds.

Lorini et al. Uneven coverage of natural disasters in Wikipedia
three of the most comprehensive databases documenting floods that are commonly used by the hydrology sciencefor reference(Wirtz et al. 2014):
• Floodlist5, funded by the EU Space program Copernicus 6 program, it reports on all the major flood eventsfrom around the world. Floodlist includes articles on flood-related issues such as warning systems, mitigationand control, flood recovery, flood damage repair and restoration, as well as flood insurance. The reports andarticles also include information about the extraordinary humanitarian, aid and relief efforts made in theaftermath of many flood disasters.
• The Emergency Events Database (EM-DAT)7 contains information from various sources, including UNagencies, non-governmental organizations, insurance companies, research institutes and press agencies. Datafrom UN agencies, governments, and the International Federation of Red Cross and Red Crescent Societieshave priority. This choice is not only a reflection of the quality or value of the data, but it also reflects thefact that most reporting sources do not cover all disasters or have political limitations that could affect thefigures. The entries are reviewed continuously for inconsistencies, redundancy, and incompleteness. CREDconsolidates and updates data daily.
• The Dartmouth Flood Observatory (DFO)8, based at the University of Colorado, maintains the Global ActiveArchive of Large Flood Events derived from news, governmental, instrumental, and remote sensing sources.The archive is “active” because current events are added immediately. Each entry in the archive and related“area affected” map outline represents a discrete flood event. The listing is comprehensive and global in scope.
We also looked at other reliable sources such as the Copernicus Emergency Manamagent Services (CEMS) basedon requests for satellite images acquisition for emergency response and risk and recovery maps. We found thatofficial requests were issued only when the national authorities could not cope with the disaster by their meaning,resulting in only one-tenth of events recorded by the other sources, most of which were redundant.
As shown in Table 1, none of the three selected databases is complete, and some events recorded in one database arenot in the others. Hence, we merge multiple databases into a single dataset. Our data begins on 2016-02-29 becausethis is the earliest date for which the three datasets contain information.
Year Total floods Floodlist EM-DAT DFO
2016 261 191 169 992017 322 220 215 1172018 394 306 191 1572019 125 96 74 42
Total 1102 813 415 649
Table 1. Number of events recorded per year in chosen data sources between 2016-02-29 and 2019-05-20
Criteria and Definitions of Events It is essential to assess criteria for event recording and limitations of the severaldata sources before homogeneously merging their data.
• Floodlist includes articles on flood-related issues such as warning systems, mitigation and control, floodrecovery, flood damage repair and restoration, as well as flood insurance. A small team of dedicated peoplerecord news and information on the latest flood events from around the world. We decided to leave out newsitems with “landslides” as the only tag, while we ingested all the other news items as we think they weremostly relevant to floods.
• In EM-DAT, for a disaster to be entered into the database at least one of the following criteria must befulfilled: (i) ten (10) or more people reported killed, (ii) one hundred (100) or more people reported affected,(iii) a declaration of a state of emergency, and/or (iv) a call for international assistance. EM-DAT providesgeographical, temporal, human and economic information on disasters at the country-aggregated level. Whenthe same disaster affects several countries, EM-DAT enters several country-level disasters into the database.Each of these country-level disasters will have the same identifier. From all the EM-DAT database, weconsider only events labelled with “flood” or “storm” as primary disaster type.
5https://floodlist.com/6https://www.copernicus.eu/en7https://www.emdat.be8https://http://floodobservatory.colorado.edu/
CoRe Paper – Social Media for Disaster Response and ResilienceProceedings of the 17th ISCRAM Conference – Blacksburg, VA, USA May 2020
Amanda Lee Hughes, Fiona McNeill and Christopher Zobel, eds.
Lorini et al. Uneven coverage of natural disasters in Wikipedia
• DFO derives from a wide variety of news and governmental sources. The quality and quantity of informationavailable about a particular flood are not always in proportion to its actual magnitude, and the intensity ofnews coverage varies from nation to nation. DFO creates a record for any flood that appears to be “large”,with, for example, significant damage to structures or agriculture, long (decades) reported intervals since thelast similar event, and/or fatalities. Deaths and damage estimates for tropical storms are totals from all causes,but tropical storms without significant river flooding are not included. No filter is applied to information aswe assumed all the news items were relevant to floods.
Since our ground truth information’s main purpose is to support the analysis of the coverage of events in Wikipedia,we opted for a rather inclusive definition of flood and included events associated to heavy rainfall, which is the firstdriver of an overflow of water in river channels but also in coastal and urban areas. The merged database containsinformation from different sources, trying to avoid duplicates. We aggregated events at the national level, and whenan event affected more than one country, we insert a record for each country with the same dates. For those eventsfor which a data source did not indicate the end date, we assumed it was three days after the starting date of theevent. We choose three because it is the median value of the duration of the floods in our dataset. An examplerecord contains the following information:
• start_date: year, month, day• end_date: year, month, day• country: name of the country• affected: string from the source about population affected• fatalities: number of deaths associated with the event• location_source1: location from location_source1• location_source2: location from location_source2• location_source3: location from location_source3• identifier: list of id from sources• disaster_type: i.e Storm, Flash Flood, Flood• in_emdat: True/False• in_dartmouth: True/False• in_floodlist: True/False
The resulting ground truth dataset contained 2295 floods. However, there were still many duplicate items needing tobe consolidated.
Event Consolidation
As shown in the previous section, the criteria for describing an event vary according to the source. Starting andending dates are difficult to establish and there is no agreed methodology for reporting about duration and impactsof floods, not even within the Disaster Risk Reduction community.
For instance, a flood in Angola on March 2016 was reported by Floodlist as spanning the period 2016-03-05 to2016-03-07, by EM-DAT as happening from 2016-03-01 to 2016-03-10, and by DFO as occurring from 2016-03-01to 2016-03-10.
To avoid duplicates, when two or more events from the data sources overlapped in time and country, the earlieststarting date was selected as starting date for the event and the latest ending date as the ending date. This choicealso means that two events happening at an overlapping time in two different locations of the same country will beconsidered as duplicates and merged. The aggregation was because the DFO dataset can locate an event only at thenational level. We normalized country names of each source to facilitate the merging process.
After the consolidation process, the dataset consisted of 1102 flood events. Figure 1 shows a Venn diagramillustrating the intersection between and among our three data sources. The intersecting areas are consistent andrepresent the majority of events, meaning that more than one source identified such floods.
CoRe Paper – Social Media for Disaster Response and ResilienceProceedings of the 17th ISCRAM Conference – Blacksburg, VA, USA May 2020
Amanda Lee Hughes, Fiona McNeill and Christopher Zobel, eds.

Lorini et al. Uneven coverage of natural disasters in Wikipedia
Figure 1. Venn diagram representing the intersection of floods coming from the data sources
We asked experts in the field of DRR to analyze a sample of twenty records that appeared only in one data source.They convened that:
• Unique records from Floodlist were mostly due to the inclusion of landslide associated with storms andepisodes of heavy rain which were excluded from the other two data sources because not defined by theircriteria as a flood.
• Unique records from EM-DAT were due to the inclusion of convective storms that lead to wind storms orsand storms which were excluded from the other two data sources because not associated with a flood.
• Unique records from DFO were mainly due to a country attribution different than the other sources in case oftransborder events.
In light of the analysis of the data sources, we decided to conduct the experiments using the 458 events located inthe intersecting areas, assuming that we can safely consider floods recorded by two or three data sources.
Figure 2 shows the geographical distribution of events recorded in each data source and the final merged result
(a) Floods per country - Floodlist (b) Floods per country - EM-DAT
(c) Floods per country - DFO (d) Floods per country - final merged ground truth
Figure 2. Floods per country (heat maps) of the three data sources for ground truth information and the finalmerged dataset
CoRe Paper – Social Media for Disaster Response and ResilienceProceedings of the 17th ISCRAM Conference – Blacksburg, VA, USA May 2020
Amanda Lee Hughes, Fiona McNeill and Christopher Zobel, eds.
Lorini et al. Uneven coverage of natural disasters in Wikipedia
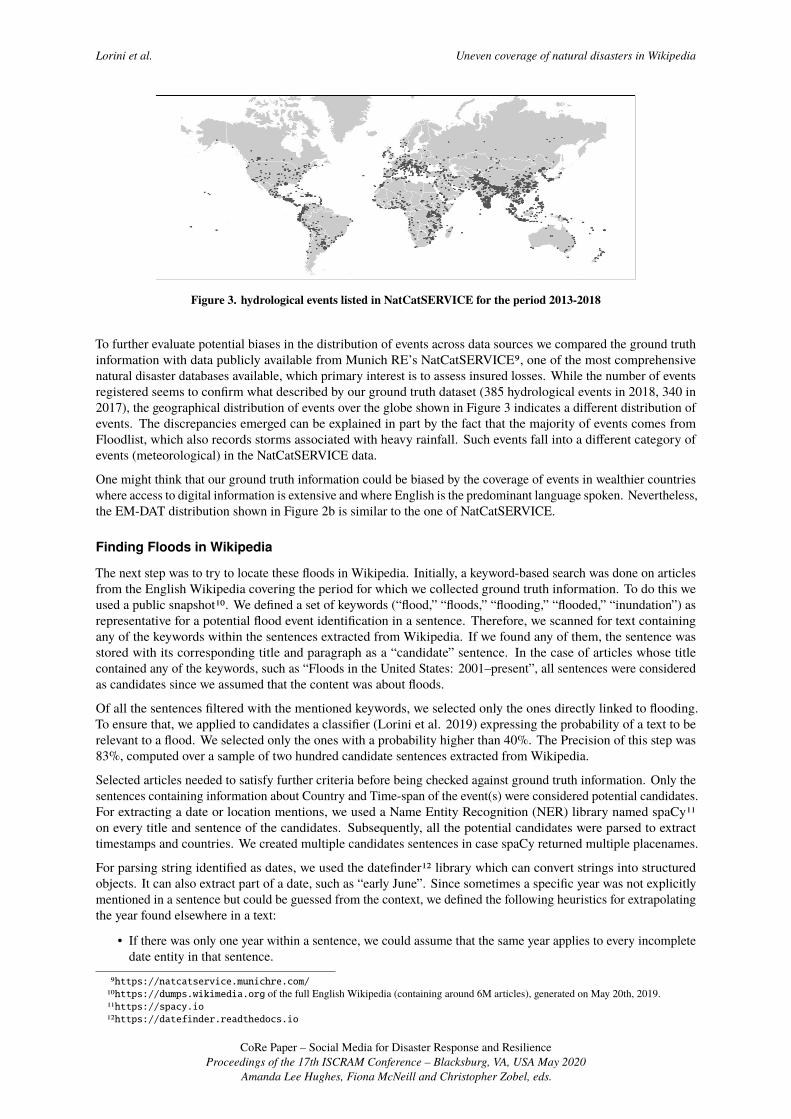
Figure 3. hydrological events listed in NatCatSERVICE for the period 2013-2018
To further evaluate potential biases in the distribution of events across data sources we compared the ground truthinformation with data publicly available from Munich RE’s NatCatSERVICE9, one of the most comprehensivenatural disaster databases available, which primary interest is to assess insured losses. While the number of eventsregistered seems to confirm what described by our ground truth dataset (385 hydrological events in 2018, 340 in2017), the geographical distribution of events over the globe shown in Figure 3 indicates a different distribution ofevents. The discrepancies emerged can be explained in part by the fact that the majority of events comes fromFloodlist, which also records storms associated with heavy rainfall. Such events fall into a different category ofevents (meteorological) in the NatCatSERVICE data.
One might think that our ground truth information could be biased by the coverage of events in wealthier countrieswhere access to digital information is extensive and where English is the predominant language spoken. Nevertheless,the EM-DAT distribution shown in Figure 2b is similar to the one of NatCatSERVICE.
Finding Floods in Wikipedia
The next step was to try to locate these floods in Wikipedia. Initially, a keyword-based search was done on articlesfrom the English Wikipedia covering the period for which we collected ground truth information. To do this weused a public snapshot10. We defined a set of keywords (“flood,” “floods,” “flooding,” “flooded,” “inundation”) asrepresentative for a potential flood event identification in a sentence. Therefore, we scanned for text containingany of the keywords within the sentences extracted from Wikipedia. If we found any of them, the sentence wasstored with its corresponding title and paragraph as a “candidate” sentence. In the case of articles whose titlecontained any of the keywords, such as “Floods in the United States: 2001–present”, all sentences were consideredas candidates since we assumed that the content was about floods.
Of all the sentences filtered with the mentioned keywords, we selected only the ones directly linked to flooding.To ensure that, we applied to candidates a classifier (Lorini et al. 2019) expressing the probability of a text to berelevant to a flood. We selected only the ones with a probability higher than 40%. The Precision of this step was83%, computed over a sample of two hundred candidate sentences extracted from Wikipedia.
Selected articles needed to satisfy further criteria before being checked against ground truth information. Only thesentences containing information about Country and Time-span of the event(s) were considered potential candidates.For extracting a date or location mentions, we used a Name Entity Recognition (NER) library named spaCy11on every title and sentence of the candidates. Subsequently, all the potential candidates were parsed to extracttimestamps and countries. We created multiple candidates sentences in case spaCy returned multiple placenames.
For parsing string identified as dates, we used the datefinder12 library which can convert strings into structuredobjects. It can also extract part of a date, such as “early June”. Since sometimes a specific year was not explicitlymentioned in a sentence but could be guessed from the context, we defined the following heuristics for extrapolatingthe year found elsewhere in a text:
• If there was only one year within a sentence, we could assume that the same year applies to every incompletedate entity in that sentence.
9https://natcatservice.munichre.com/10https://dumps.wikimedia.org of the full English Wikipedia (containing around 6M articles), generated on May 20th, 2019.11https://spacy.io12https://datefinder.readthedocs.io
CoRe Paper – Social Media for Disaster Response and ResilienceProceedings of the 17th ISCRAM Conference – Blacksburg, VA, USA May 2020
Amanda Lee Hughes, Fiona McNeill and Christopher Zobel, eds.
Lorini et al. Uneven coverage of natural disasters in Wikipedia
• If there was no year in the sentence and only one year in its whole paragraph, we could assume that the sameyear applies to that sentence.
• If there was no year in the sentence and only one year in the title of the article containing the sentence, itcould be assumed that the same year applies to that sentence.
The heuristics used for associating place names to their respective country was a cascade of the following heuristics:
1. Wikidata: we searched for the placename identified by spaCy in Wikidata. If the entity returned has acorresponding page in the English Wikipedia, the country returned by the query is associated with thecandidate sentence.
2. Nominatim: we searched on Nominatim13 the place names that were not associated to a country after the firststep. The query used the public Nominatim API and the country associated with the place name was the most“important”14 result returned.
3. Mordecai:15 the sentences and titles not associated with any country in the previous steps were then processedusing Mordecai for inferring a country from the text.
Tables 2 shows the results of the application of our methodology on a set of sentences. In some cases, the NERlibrary could not find any placename; sometimes, the placename did not lead to the identification of the relatedcountry and in other cases, we could extract a country name. Finally, we discarded candidate sentences for whichwe could not find a country and a time reference.
Sentence Location entities Countries
“The 2009 West Africa floods are a natural disaster that beganin June 2009 as a consequence of exceptionally heavy seasonalrainfall in large areas of West Africa”
West Africa None
“In the Tiquicheo Municipality, 10 houses flooded after a rivernear the city overflowed its banks”
the Tiquicheo Municipality None
“The town of Poldokhtar in Lorestan Province was engulfed byflood water.”
Poldokhtar, LorestanProvince
None
“2015 Southeast Africa floods” None None
“New Orleans Outfall Canals” None None
“Serious flooding was also reported in Greenwich, Woolwichand other locations further downriver, causing major propertydamage.”
Greenwich, Woolwich UnitedKingdom
“In July 2012, heavy torrential rains caused floods in Kyushu,Japan, leaving 32 people dead or missing.”
Kyushu, Japan Japan
“In Antu County, 70 homes in one village were destroyed byflooding, a mountain valley was submerged by floods 20 m deep,forcing 570 families to evacuate.”
Antu County China
Table 2. Examples of successful and unsuccessful attempts at location inference from text
Matching Wikipedia Candidates and Ground Truth Information
The last part of the matching process was determining if the selected Wikipedia sentences were identifying an entryin the ground truth database. We defined three methods for identifying matching records. Here they are listed fromthe most strict to the laxest:
• Country and Year-Month-Days matchingA Wikipedia candidate matches an event in the ground truth database if they link to the same country nameand the date in the title or sentence of the candidate is within the time range[start_date, end_date+5 days] ofthe ground truth entry.
13https://nominatim.openstreetmap.org/14The results have a value that represents the importance of the location according to the number of citations in Wikipedia.15https://github.com/openeventdata/mordecai
CoRe Paper – Social Media for Disaster Response and ResilienceProceedings of the 17th ISCRAM Conference – Blacksburg, VA, USA May 2020
Amanda Lee Hughes, Fiona McNeill and Christopher Zobel, eds.
Lorini et al. Uneven coverage of natural disasters in Wikipedia
For instance, the sentence “On April 13, reportedly 12 people counted were killed by Rainstorm and Flashflooding in KPK and Balochistan.” matches the flood happening in Pakistan between 2019-04-13 and2019-04-18.
• Country and Month-Year matchingA Wikipedia candidate matches an event in the ground truth database if they link to the same country nameand the month in the candidate sentence or title is overlapping with the time range[start_date, end_date] ofthe ground truth entry.For instance, the sentence “In August 2018, the region yet again experienced record-breaking flooding invalley towns such as Coon Valley, Wisconsin, La Farge, Wisconsin and Viola, Wisconsin.” matches the floodhappening between 2018-08-20 and 2019-08-22 in the USA.
After performing the matching for each of these pairing methods, we evaluated the hits manually for events coveringthree different months.
We define the Precision of our methodology as the fraction of matched candidates that are describing an eventenlisted in the ground truth dataset. We can think about Precision as the answer to the question How many Wikipediamatched candidates are a flood recorded in the ground truth dataset?
We define the Recall of our methodology as the fraction of ground truth events that are identified by the matchedcandidates. We can think about Recall as the answer to the question How many floods in the ground truth datasetare matched by Wikipedia candidates?
Results of Precision and Recall evaluated manually over a sample of three months from our consolidated dataset areshown in Tables 3 and 4.
Period Floods in ground truth Precision(%) Recall (%)
November 2016 18 66.67 16.67September 2017 20 66.67 15.00June 2018 26 88.89 34.62
Table 3. Metrics for country and year-month-days matching
Period Floods in ground truth Precision(%) Recall (%)
November 2016 18 66.67 16.67September 2017 20 50.00 20.00June 2018 26 53.33 57.68
Table 4. Metrics for country and year-month matching
For the identification of a correlation between socio-economic indicators and flood coverage in Wikipedia, we optedfor the matching method using Country and Year-Month-Days because a higher Precision implies that more matchesare relevant, thus better support our analysis.
RESULTS
We will use the term Hit Rate to refer to the percentage of matches between the English Wikipedia articles andevents registered in the ground truth database. A Hit Rate of 100 means that applying the methodology presented inthe previous section, all the floods representing a set of events in the ground truth database matched some Wikipediacandidates. A Hit Rate equal to 0 represents no coverage in the English Wikipedia for any flood of the set of eventsanalyzed.
Our research analyzed how articles in English Wikipedia covered the floods reported worldwide in our ground truthdatabase. We analyzed several socio-economic variables to see whether they correlate with floods coverage. Thesevariables are GDP per capita, GNI per capita, country, continent, date, fatalities, number of English speakers andvulnerability index.
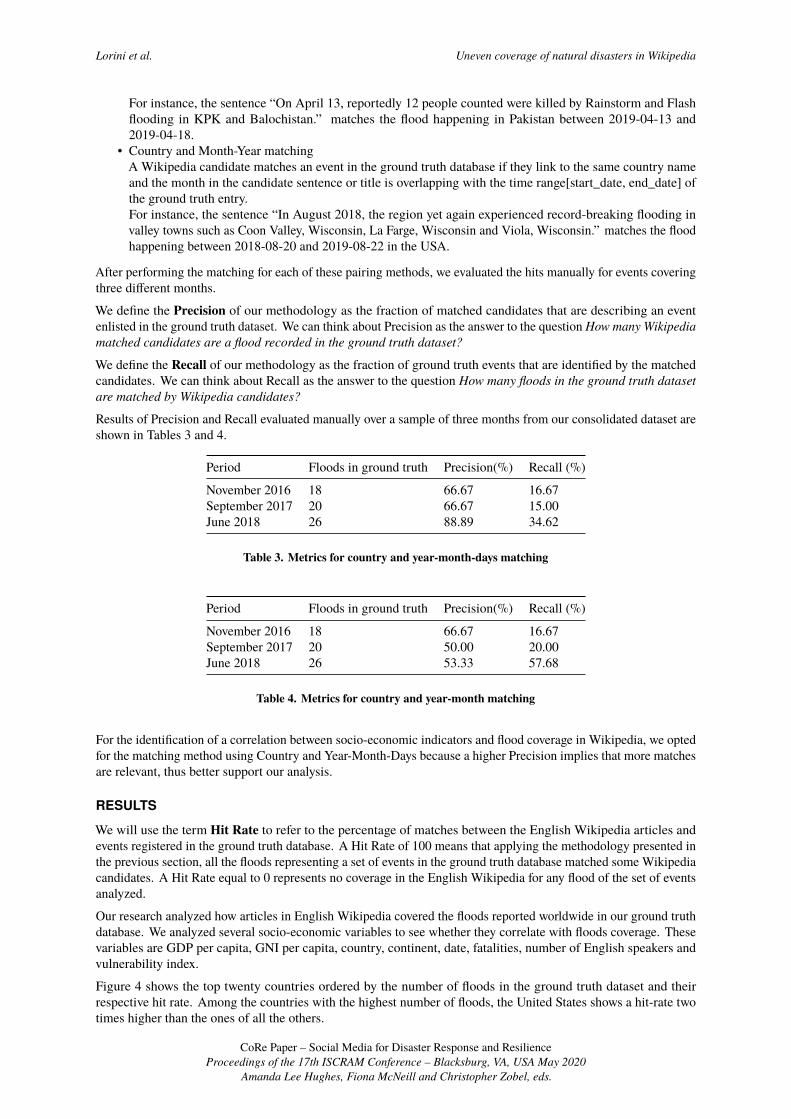
Figure 4 shows the top twenty countries ordered by the number of floods in the ground truth dataset and theirrespective hit rate. Among the countries with the highest number of floods, the United States shows a hit-rate twotimes higher than the ones of all the others.
CoRe Paper – Social Media for Disaster Response and ResilienceProceedings of the 17th ISCRAM Conference – Blacksburg, VA, USA May 2020
Amanda Lee Hughes, Fiona McNeill and Christopher Zobel, eds.
Lorini et al. Uneven coverage of natural disasters in Wikipedia
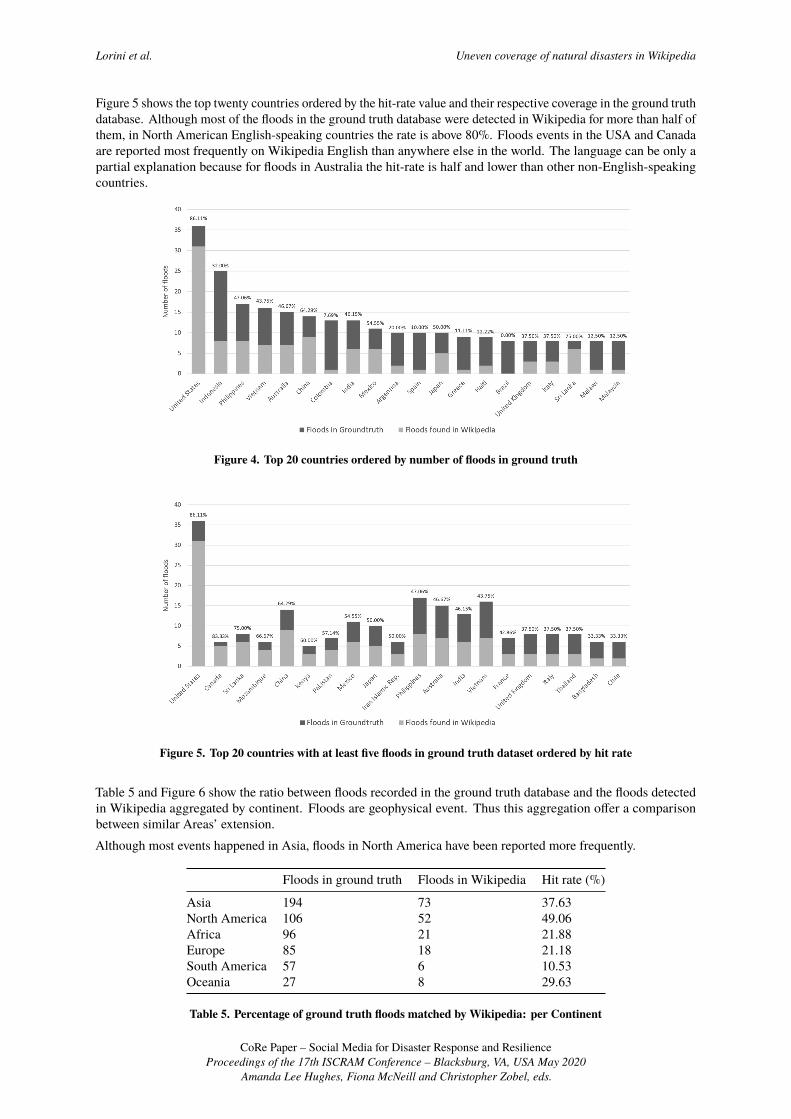
Figure 5 shows the top twenty countries ordered by the hit-rate value and their respective coverage in the ground truthdatabase. Although most of the floods in the ground truth database were detected in Wikipedia for more than half ofthem, in North American English-speaking countries the rate is above 80%. Floods events in the USA and Canadaare reported most frequently on Wikipedia English than anywhere else in the world. The language can be only apartial explanation because for floods in Australia the hit-rate is half and lower than other non-English-speakingcountries.
Figure 4. Top 20 countries ordered by number of floods in ground truth
Figure 5. Top 20 countries with at least five floods in ground truth dataset ordered by hit rate
Table 5 and Figure 6 show the ratio between floods recorded in the ground truth database and the floods detectedin Wikipedia aggregated by continent. Floods are geophysical event. Thus this aggregation offer a comparisonbetween similar Areas’ extension.Although most events happened in Asia, floods in North America have been reported more frequently.
Floods in ground truth Floods in Wikipedia Hit rate (%)
Asia 194 73 37.63North America 106 52 49.06Africa 96 21 21.88Europe 85 18 21.18South America 57 6 10.53Oceania 27 8 29.63
Table 5. Percentage of ground truth floods matched by Wikipedia: per Continent
CoRe Paper – Social Media for Disaster Response and ResilienceProceedings of the 17th ISCRAM Conference – Blacksburg, VA, USA May 2020
Amanda Lee Hughes, Fiona McNeill and Christopher Zobel, eds.
Lorini et al. Uneven coverage of natural disasters in Wikipedia
Figure 6. Floods for each continent and their corresponding hit rate ordered by number of floods in the groundtruth
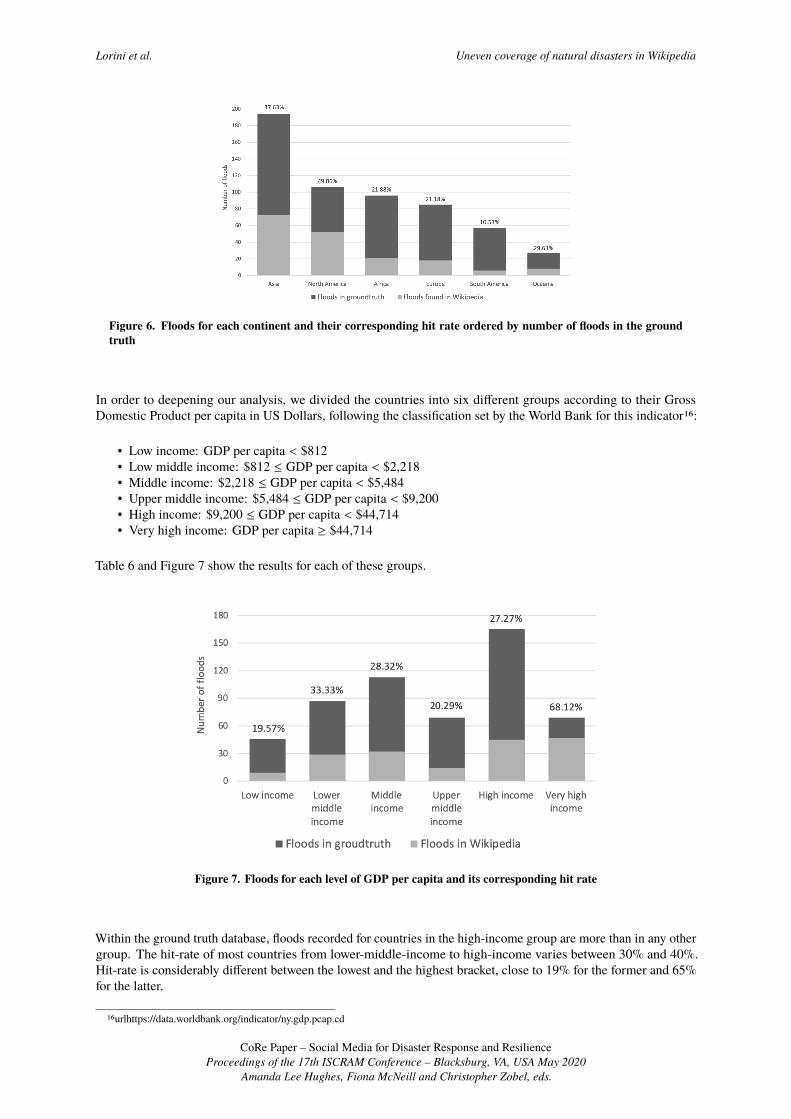
In order to deepening our analysis, we divided the countries into six different groups according to their GrossDomestic Product per capita in US Dollars, following the classification set by the World Bank for this indicator16:
• Low income: GDP per capita < $812• Low middle income: $812 ≤ GDP per capita < $2,218• Middle income: $2,218 ≤ GDP per capita < $5,484• Upper middle income: $5,484 ≤ GDP per capita < $9,200• High income: $9,200 ≤ GDP per capita < $44,714• Very high income: GDP per capita ≥ $44,714
Table 6 and Figure 7 show the results for each of these groups.
Figure 7. Floods for each level of GDP per capita and its corresponding hit rate
Within the ground truth database, floods recorded for countries in the high-income group are more than in any othergroup. The hit-rate of most countries from lower-middle-income to high-income varies between 30% and 40%.Hit-rate is considerably different between the lowest and the highest bracket, close to 19% for the former and 65%for the latter.
16urlhttps://data.worldbank.org/indicator/ny.gdp.pcap.cd
CoRe Paper – Social Media for Disaster Response and ResilienceProceedings of the 17th ISCRAM Conference – Blacksburg, VA, USA May 2020
Amanda Lee Hughes, Fiona McNeill and Christopher Zobel, eds.
Lorini et al. Uneven coverage of natural disasters in Wikipedia
Countries Floods in ground truth Floods in Wikipedia Hit rate (%)
Low income 21 46 9 19.57Lower middle income 37 87 29 33.33Middle income 39 113 32 28.32Upper middle income 27 69 14 20.29High income 67 165 45 27.27Very high income 28 69 47 68.12
Table 6. Number of floods matched per Country according to GDP per capita
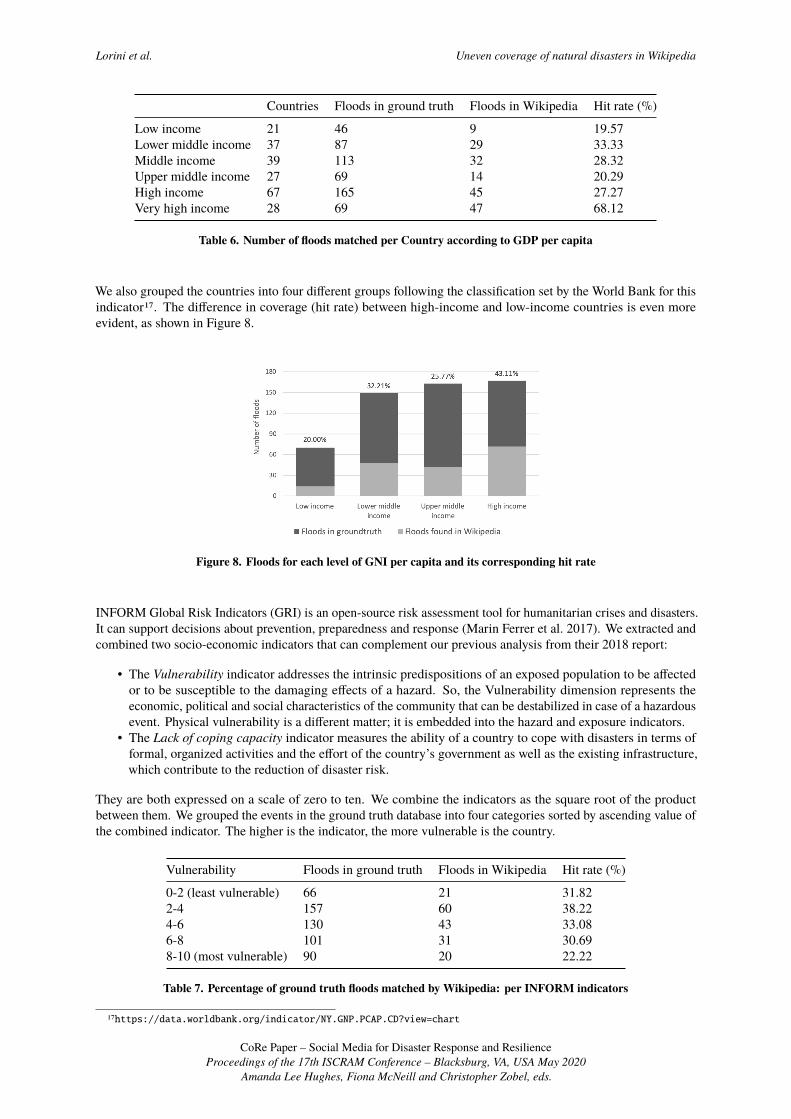
We also grouped the countries into four different groups following the classification set by the World Bank for thisindicator17. The difference in coverage (hit rate) between high-income and low-income countries is even moreevident, as shown in Figure 8.
Figure 8. Floods for each level of GNI per capita and its corresponding hit rate
INFORM Global Risk Indicators (GRI) is an open-source risk assessment tool for humanitarian crises and disasters.It can support decisions about prevention, preparedness and response (Marin Ferrer et al. 2017). We extracted andcombined two socio-economic indicators that can complement our previous analysis from their 2018 report:
• The Vulnerability indicator addresses the intrinsic predispositions of an exposed population to be affectedor to be susceptible to the damaging effects of a hazard. So, the Vulnerability dimension represents theeconomic, political and social characteristics of the community that can be destabilized in case of a hazardousevent. Physical vulnerability is a different matter; it is embedded into the hazard and exposure indicators.
• The Lack of coping capacity indicator measures the ability of a country to cope with disasters in terms offormal, organized activities and the effort of the country’s government as well as the existing infrastructure,which contribute to the reduction of disaster risk.
They are both expressed on a scale of zero to ten. We combine the indicators as the square root of the productbetween them. We grouped the events in the ground truth database into four categories sorted by ascending value ofthe combined indicator. The higher is the indicator, the more vulnerable is the country.
Vulnerability Floods in ground truth Floods in Wikipedia Hit rate (%)
0-2 (least vulnerable) 66 21 31.822-4 157 60 38.224-6 130 43 33.086-8 101 31 30.698-10 (most vulnerable) 90 20 22.22
Table 7. Percentage of ground truth floods matched by Wikipedia: per INFORM indicators
17https://data.worldbank.org/indicator/NY.GNP.PCAP.CD?view=chart
CoRe Paper – Social Media for Disaster Response and ResilienceProceedings of the 17th ISCRAM Conference – Blacksburg, VA, USA May 2020
Amanda Lee Hughes, Fiona McNeill and Christopher Zobel, eds.

Lorini et al. Uneven coverage of natural disasters in Wikipedia
We can see how the most vulnerable group (8-10) is also the one with the lowest hit rate by a substantial margin.Events where the capacity to cope with a disaster is the lowest, therefore where the impact could be the highest, areless likely to be described in Wikipedia.
Our analysis also considered the percentage of English speakers18 in a country. We assumed that Floods in countrieswith a large percentage of English speakers were more likely to be matched in the English Wikipedia because ofthe availability of news in English that Wikipedia editors can understand and use as sources for documenting thefloods. Indeed, in Table 8 and Figure 9, we see an increase in the coverage for countries with 60% or more Englishspeakers, and then another increase for countries with 80% or more English speakers.
English speakers (%) Floods in ground truth Floods in Wikipedia Hit rate (%)
<20 131 36 27.4820-40 67 19 28.3640-60 37 14 37.8460-80 24 9 37.5080+ 92 53 57.61
Table 8. Percentage of ground truth floods matched by Wikipedia: per percentage of English speakers
Figure 9. Probability of hit given the percentage of English speakers
The percentage of the English-speaking population is an indicator of the probability that an event would bedescribed in English Wikipedia. Nevertheless, the population of a country could be related to the event coverageby English-speaking editors. We sorted the countries by ascending population and divide them into four groupscontaining the same number of countries each.
• Group 1: population < 754,394• Group 2: 754,394 ≤ population < 6,465,513• Group 3: 6,465,513 ≤ population < 24,992,369• Group 4: 24,992,369 ≤ population
Country population Floods in ground truth Floods in Wikipedia Hit rate (%)
G1 (smallest) 14 2 14.29G2 60 8 13.33G3 133 29 21.80G4 (largest) 342 137 40.06
Table 9. Percentage of ground truth floods matched by Wikipedia: per population
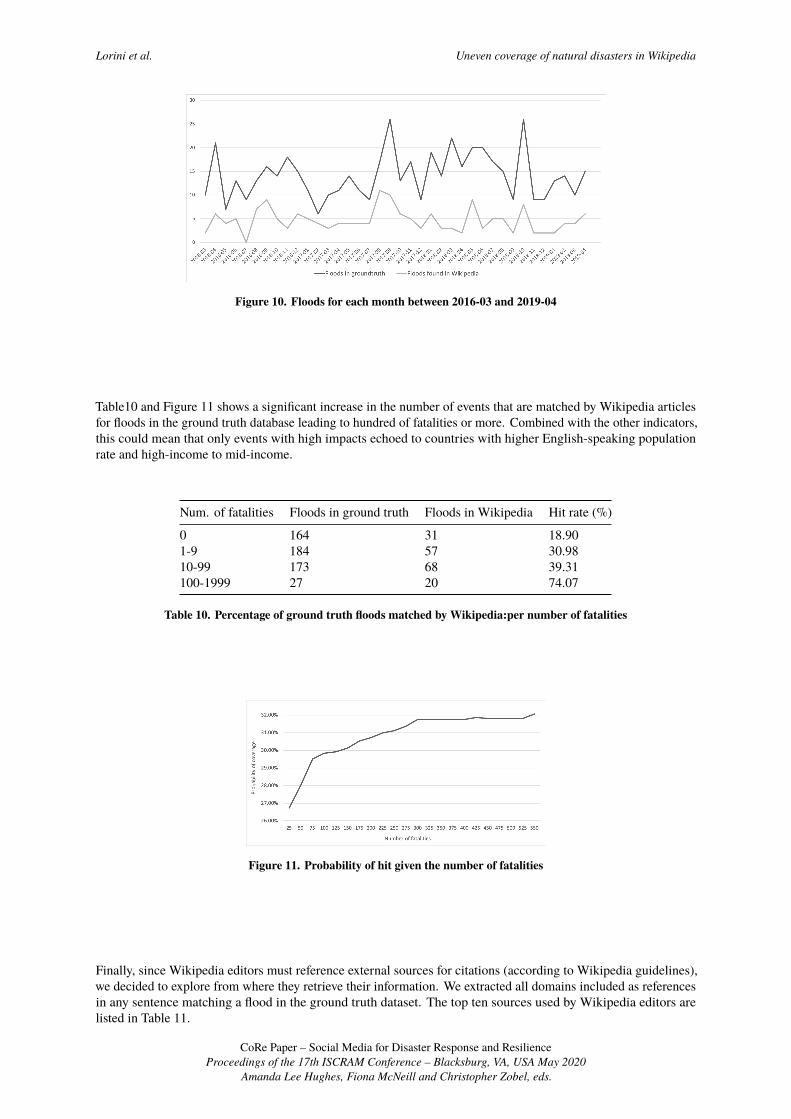
Indeed, as shown in Table 9, the hit rate is more significant for the most populated countries. In order to determineif the time of events affects the coverage of floods in Wikipedia, we analyzed the temporal distribution of the events.The method applied for evaluating hit rates showed that the relation between ground truth events and matches followsimilar proportions across time, as shown in Figure 10.
18https://en.wikipedia.org/wiki/List_of_countries_by_English-speaking_population
CoRe Paper – Social Media for Disaster Response and ResilienceProceedings of the 17th ISCRAM Conference – Blacksburg, VA, USA May 2020
Amanda Lee Hughes, Fiona McNeill and Christopher Zobel, eds.
Lorini et al. Uneven coverage of natural disasters in Wikipedia
Figure 10. Floods for each month between 2016-03 and 2019-04
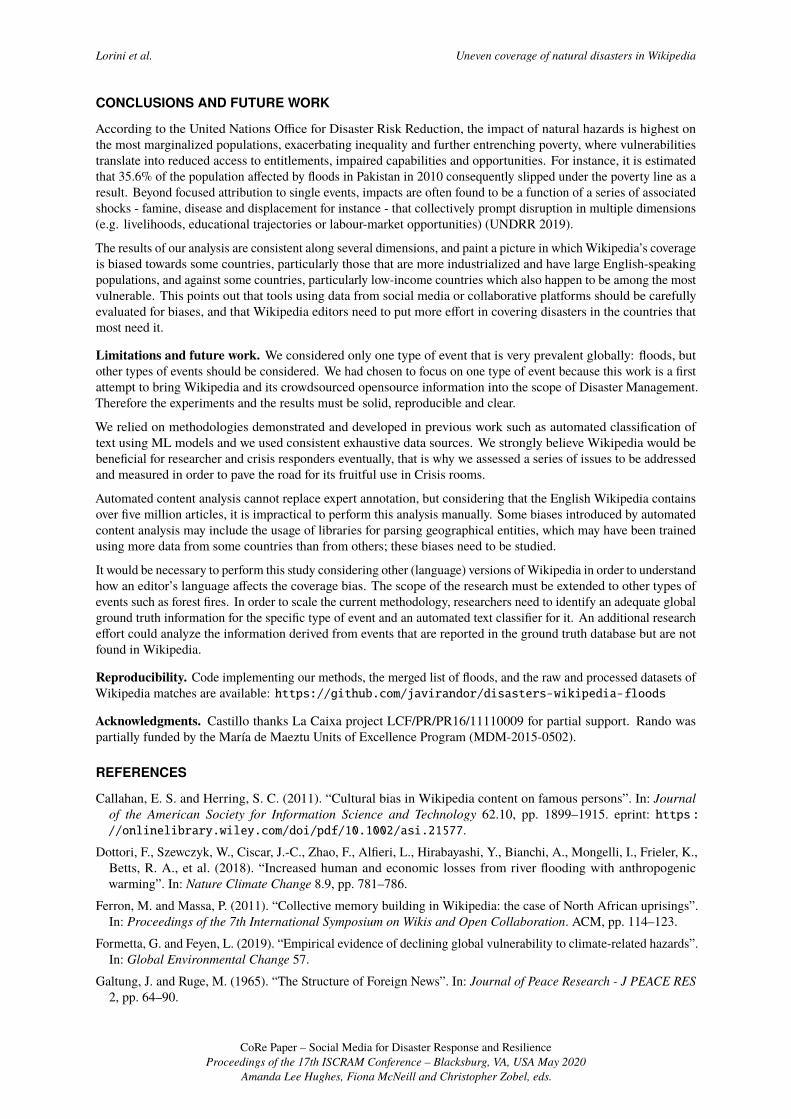
Table10 and Figure 11 shows a significant increase in the number of events that are matched by Wikipedia articlesfor floods in the ground truth database leading to hundred of fatalities or more. Combined with the other indicators,this could mean that only events with high impacts echoed to countries with higher English-speaking populationrate and high-income to mid-income.
Num. of fatalities Floods in ground truth Floods in Wikipedia Hit rate (%)
0 164 31 18.901-9 184 57 30.9810-99 173 68 39.31100-1999 27 20 74.07
Table 10. Percentage of ground truth floods matched by Wikipedia:per number of fatalities
Figure 11. Probability of hit given the number of fatalities
Finally, since Wikipedia editors must reference external sources for citations (according to Wikipedia guidelines),we decided to explore from where they retrieve their information. We extracted all domains included as referencesin any sentence matching a flood in the ground truth dataset. The top ten sources used by Wikipedia editors arelisted in Table 11.
CoRe Paper – Social Media for Disaster Response and ResilienceProceedings of the 17th ISCRAM Conference – Blacksburg, VA, USA May 2020
Amanda Lee Hughes, Fiona McNeill and Christopher Zobel, eds.

Lorini et al. Uneven coverage of natural disasters in Wikipedia
Domain References
indiatimes.com 20weather.com 19reliefweb.int 15abc.net.au 15theguardian.com 14reuters.com 14bbc.com 13hindustantimes.com 13cnn.com 12dailymirror.lk 12
Table 11. Top ten sources from which Wikipedians retrieve information about floods
It was surprising that the most mentioned sources from the ones we used, Floodlist, did not appear among thetop ten and was only referenced four times in our dataset. Besides reliefweb.int, we do not see in the top-10 listspecialized sources on disaster management. This can be explained by the fact that our sources record events onlywhen data are validated by an official source, which usually happens after the peak of the event has ended.
A TALE OF TWO FLOODS
North and Central America, September 2017. Hurricane Irma made landfall on northeast Caribbean islandsduring the early hours of 6 September, affecting Antigua and Barbuda, Anguilla, British Virgin Islands, StBarthélemy, St. Martin, the Virgin Islands and other islands in the eastern Caribbean Sea. After causing devastatingdamage across the Caribbean, Hurricane Irma made landfall in the Florida Keys on 10 September and worked itsway north, bringing with it strong winds, storm surge and flooding rain.
Although national news agencies covered only partially the event, we can say that Irma caused between fifty andone-hundred fatalities, affecting millions of people (evacuated or left without power). In our ground truth database,the Hurricane Irma event is linked to several countries, and it was one of the events that produced the highestnumber of matches (43 total, 40 only USA), meaning many sentences on Wikipedia reported about it. Find someexamples of sentences reporting Hurricane Irma in Table 12
Sentence Date Countries
“In September 2017, Hurricane Irma storm surge caused major floodingin the downtown area of Jacksonville.”
2017-09-12 United Statesof America
“Moyer, Crystal (September 8, 2017). Hyatt Regency in downtownJacksonville being evacuated.”
2017-09-08 United Statesof America
“People stand in a flooded street that usually serves as a farmers market,in Ouanaminthe, northeast Haiti, September 8, 2017.”
2017-09-08 Haiti
“Hurricane Irma: 10 dead in Cuba as record flooding hits northernFlorida [...] September 11, 2017.”
2017-09-11 Cuba
Table 12. Examples of sentences reporting Hurricane Irma
Sudan, August 2018. By August 2018 heavy rains in Sudan that had started in mid-July had caused severe flooding.As of 16 of August the floods and rain had left at least 23 people dead, over 60 injured and affected more than70,000 people. Although the event appears in all three data sources, we could not find any match while in Wikipediaapplying our methodology. Either the event was not the subject of any Wikipedia article, or it was not described asaccurately as other events.
Even if both events had a high number of fatalities and affected people, while the former event was widely identifiableon Wikipedia, the latter case was less (or poorly) described.
CoRe Paper – Social Media for Disaster Response and ResilienceProceedings of the 17th ISCRAM Conference – Blacksburg, VA, USA May 2020
Amanda Lee Hughes, Fiona McNeill and Christopher Zobel, eds.
Lorini et al. Uneven coverage of natural disasters in Wikipedia
CONCLUSIONS AND FUTURE WORK
According to the United Nations Office for Disaster Risk Reduction, the impact of natural hazards is highest onthe most marginalized populations, exacerbating inequality and further entrenching poverty, where vulnerabilitiestranslate into reduced access to entitlements, impaired capabilities and opportunities. For instance, it is estimatedthat 35.6% of the population affected by floods in Pakistan in 2010 consequently slipped under the poverty line as aresult. Beyond focused attribution to single events, impacts are often found to be a function of a series of associatedshocks - famine, disease and displacement for instance - that collectively prompt disruption in multiple dimensions(e.g. livelihoods, educational trajectories or labour-market opportunities) (UNDRR 2019).
The results of our analysis are consistent along several dimensions, and paint a picture in whichWikipedia’s coverageis biased towards some countries, particularly those that are more industrialized and have large English-speakingpopulations, and against some countries, particularly low-income countries which also happen to be among the mostvulnerable. This points out that tools using data from social media or collaborative platforms should be carefullyevaluated for biases, and that Wikipedia editors need to put more effort in covering disasters in the countries thatmost need it.
Limitations and future work. We considered only one type of event that is very prevalent globally: floods, butother types of events should be considered. We had chosen to focus on one type of event because this work is a firstattempt to bring Wikipedia and its crowdsourced opensource information into the scope of Disaster Management.Therefore the experiments and the results must be solid, reproducible and clear.
We relied on methodologies demonstrated and developed in previous work such as automated classification oftext using ML models and we used consistent exhaustive data sources. We strongly believe Wikipedia would bebeneficial for researcher and crisis responders eventually, that is why we assessed a series of issues to be addressedand measured in order to pave the road for its fruitful use in Crisis rooms.
Automated content analysis cannot replace expert annotation, but considering that the English Wikipedia containsover five million articles, it is impractical to perform this analysis manually. Some biases introduced by automatedcontent analysis may include the usage of libraries for parsing geographical entities, which may have been trainedusing more data from some countries than from others; these biases need to be studied.
It would be necessary to perform this study considering other (language) versions ofWikipedia in order to understandhow an editor’s language affects the coverage bias. The scope of the research must be extended to other types ofevents such as forest fires. In order to scale the current methodology, researchers need to identify an adequate globalground truth information for the specific type of event and an automated text classifier for it. An additional researcheffort could analyze the information derived from events that are reported in the ground truth database but are notfound in Wikipedia.
Reproducibility. Code implementing our methods, the merged list of floods, and the raw and processed datasets ofWikipedia matches are available: https://github.com/javirandor/disasters-wikipedia-floods
Acknowledgments. Castillo thanks La Caixa project LCF/PR/PR16/11110009 for partial support. Rando waspartially funded by the María de Maeztu Units of Excellence Program (MDM-2015-0502).
REFERENCES
Callahan, E. S. and Herring, S. C. (2011). “Cultural bias in Wikipedia content on famous persons”. In: Journalof the American Society for Information Science and Technology 62.10, pp. 1899–1915. eprint: https://onlinelibrary.wiley.com/doi/pdf/10.1002/asi.21577.
Dottori, F., Szewczyk, W., Ciscar, J.-C., Zhao, F., Alfieri, L., Hirabayashi, Y., Bianchi, A., Mongelli, I., Frieler, K.,Betts, R. A., et al. (2018). “Increased human and economic losses from river flooding with anthropogenicwarming”. In: Nature Climate Change 8.9, pp. 781–786.
Ferron, M. and Massa, P. (2011). “Collective memory building in Wikipedia: the case of North African uprisings”.In: Proceedings of the 7th International Symposium on Wikis and Open Collaboration. ACM, pp. 114–123.
Formetta, G. and Feyen, L. (2019). “Empirical evidence of declining global vulnerability to climate-related hazards”.In: Global Environmental Change 57.
Galtung, J. and Ruge, M. (1965). “The Structure of Foreign News”. In: Journal of Peace Research - J PEACE RES2, pp. 64–90.
CoRe Paper – Social Media for Disaster Response and ResilienceProceedings of the 17th ISCRAM Conference – Blacksburg, VA, USA May 2020
Amanda Lee Hughes, Fiona McNeill and Christopher Zobel, eds.

Lorini et al. Uneven coverage of natural disasters in Wikipedia
Graham, M., Hogan, B., Straumann, R. K., and Medhat, A. (2014). “Uneven geographies of user-generatedinformation: Patterns of increasing informational poverty”. In: Annals of the Association of American Geographers104.4, pp. 746–764.
Hecht, B. and Gergle, D. (2009). “Measuring self-focus bias in community-maintained knowledge repositories”. In:Proceedings of the fourth international conference on Communities and technologies. ACM, pp. 11–20.
Hiroki, K. (2019). 2019 HELP Global Report on Water and Disasters.Hube, C. (2017). “Bias in Wikipedia”. In: Proceedings of the 26th International Conference on World Wide WebCompanion. WWW ’17 Companion. Perth, Australia: International World Wide Web Conferences SteeringCommittee, pp. 717–721.
Imran, M., Mitra, P., and Castillo, C. (2016). Twitter as a Lifeline: Human-annotated Twitter Corpora for NLP ofCrisis-related Messages. arXiv: 1605.05894 [cs.CL].
Johnson, I. L., Lin, Y., Li, T. J.-J., Hall, A., Halfaker, A., Schöning, J., and Hecht, B. (2016). “Not at home on therange: Peer production and the urban/rural divide”. In: Proceedings of the 2016 CHI Conference on HumanFactors in Computing Systems. ACM, pp. 13–25.
Keegan, B. (2013). “A history of newswork on Wikipedia”. In: Proceedings of the 9th international symposium onopen collaboration. ACM, p. 7.
Keegan, B., Gergle, D., and Contractor, N. (2011). “Hot off the wiki: dynamics, practices, and structures inWikipedia’s coverage of the Tohoku catastrophes”. In: Proceedings of the 7th international symposium on Wikisand open collaboration. ACM, pp. 105–113.
Keegan, B., Gergle, D., and Contractor, N. (2012). “Staying in the loop: structure and dynamics of Wikipedia’sbreaking news collaborations”. In: Proceedings of the Eighth Annual International Symposium on Wikis andOpen Collaboration. ACM, p. 1.
Lorini, V., Castillo, C., Dottori, F., Kalas, M., Nappo, D., and Salamon, P. (2019). Integrating Social Media into aPan-European Flood Awareness System: A Multilingual Approach. arXiv: 1904.10876 [cs.IR].
Marin Ferrer, M., Vernaccini, L., and Poljansek, K. (2017). INFORM Index for Risk Management: Concept andMethodology, version 2017.
Moats, D. (2019). “Following the Fukushima Disaster on (and against) Wikipedia: A Methodological Note aboutSTS Research and Online Platforms”. In: Science, Technology, & Human Values 44.6, pp. 938–964.
Olteanu, A., Vieweg, S., and Castillo, C. (2015). “What to Expect When the Unexpected Happens: Social MediaCommunications Across Crises”. en. In: Proceedings of the 18th ACM Conference on Computer SupportedCooperative Work & Social Computing - CSCW ’15. Vancouver, BC, Canada: ACM Press, pp. 994–1009.
Rossling, H. (2019). Factfullness. Flammarion.Samoilenko, A., Lemmerich, F., Weller, K., Zens, M., and Strohmaier, M. (2017a). “Analysing Timelines of National
Histories across Wikipedia Editions: A Comparative Computational Approach”. In: Proceedings of the EleventhInternational AAAI Conference on Web an Social Media (ICWSM 2017). Montreal, Canada, pp. 210–219.
Samoilenko, A., Lemmerich, F., Weller, K., Zens, M., and Strohmaier, M. (2017b). “Analysing timelines of nationalhistories across Wikipedia editions: A comparative computational approach”. In: In Proc. of ICWSM.
Sheehan, E., Meng, C., Tan, M., Uzkent, B., Jean, N., Burke, M., Lobell, D., and Ermon, S. (2019). “PredictingEconomic Development Using Geolocated Wikipedia Articles”. In: Proceedings of the 25th ACM SIGKDDInternational Conference on Knowledge Discovery & Data Mining. KDD ’19. Anchorage, AK, USA: ACM,pp. 2698–2706.
Steiner, T. and Verborgh, R. (2015a). “Disaster Monitoring with Wikipedia and Online Social Networking Sites:Structured Data and Linked Data Fragments to the Rescue?” In: 2015 AAAI Spring Symposium Series.
Steiner, T. and Verborgh, R. (2015b). “Disaster monitoring with Wikipedia and online social networking sites:structured data and linked data fragments to the rescue?” In: 2015 AAAI Spring Symposium Series.
Tobler, W. R. (1970). “A computer movie simulating urban growth in the Detroit region”. In: Economic geography46.sup1, pp. 234–240.
UNDRR (2019). 2019 Global Assessment Report on Disaster Risk Reduction.Wirtz, A., Kron, W., Low, P., and Steuer, M. (2014). “The need for data: natural disasters and the challenges ofdatabase management”. In: Natural Hazards 70.1, pp. 135–157.
CoRe Paper – Social Media for Disaster Response and ResilienceProceedings of the 17th ISCRAM Conference – Blacksburg, VA, USA May 2020
Amanda Lee Hughes, Fiona McNeill and Christopher Zobel, eds.