understanding the weedy chenopodium complex in the north central states
TRANSCRIPT

UNDERSTANDING THE WEEDY CHENOPODIUM COMPLEX IN THE NORTH
CENTRAL STATES
BY
SUKHVINDER SINGH
DISSERTATION
Submitted in partial fulfillment of the requirements for the degree of Doctor of Philosophy in Crop Sciences
in the Graduate College of the University of Illinois at Urbana-Champaign, 2010
Urbana, Illinois
Doctoral Committee:
Professor Patrick J. Tranel, Chair
Associate Professor Aaron G. Hager
Associate Professor Geoffrey A. Levin
Assistant Professor Matthew E. Hudson

ii
ABSTRACT
The genus Chenopodium consists of several important weed species, including
Chenopodium album, C. berlandieri, C. strictum, and C. ficifolium. All of these species share
similar vegetative morphology and high phenotypic plasticity, which makes it difficult to
correctly identify these species. All of these weedy Chenopodium species have developed
resistance to one or more classes of herbicides. An experiment was conducted to determine if
there is variability in response of Chenopodium species present in the North Central states to
glyphosate. Our results indicate variable responses within and among the Chenopodium species.
Species such as C. berlandieri and C. ficifolium had higher levels of tolerance to glyphosate than
did various accessions of C. album. In another experiment, 33 populations of Chenopodium
sampled across six North Central states were screened with glyphosate. The results showed
variable responses to glyphosate within and among the Chenopodium populations. In general, the
Chenopodium populations from Iowa were more tolerant, but some biotypes from North Dakota,
Indiana and Kansas also had significantly high tolerance to glyphosate.
Given there are species other than C. album that have high tolerance to glyphosate, and
there are Chenopodium populations across the North Central states that showed tolerance to
glyphosate, one intriguing question was to whether the Chenopodium populations were either
biotypes of C. album were or are more closely related to other species such as C. berlandieri, C.
strictum or C. ficifolium, which would indicate that there has been a species shift.
To investigate which species are prevalent in North Central states, 12 Chenopodium
species were investigated using morphological DNA content values and sequence data. With the
exception of morphological characters such as pericarp covering the seeds, calyx shape (keeled
or not) and DNA content of the species, most of the morphological characters were not

iii
phylogenetically informative. The morphological characters were useful in distinguishing some
species from others, but with an increase in number of species under investigation, there was
overlap of morphological characters within closely related species, and hence one cannot use
morphological markers alone to differentiate the Chenopodium species.
Three DNA sequence based markers, ITS (nuclear), matK and trnD-trnT (chloroplast)
were explored. The sequence data were subjected to maximum parsimony and Bayesian
analyses. Irrespective of the method used for tree estimation, all three markers gave similar tree
topologies, but ITS markers gave the greatest number of polymorphic sites. The ITS based
phylogenetic tree was well resolved. Some closely related species such as C. strictum, C.
berlandieri and C. album shared high sequence similarity among homologous genes, but these
species were easily differentiated with the support of the genome size data. Samples of C.
strictum had a 2C value of 2.0 pg, which was different than C. album (3.6 pg/2C). Chenopodium
populations from North Central states were also tested with ITS markers, and DNA content
values were also obtained from a few samples. Based on the sequence data, results indicated that
all the field samples were closely related to C. album, and also the genome sizes of all the
populations were close to the genome size values of different accessions of C. album. In
conclusion, all the Chenopodium samples that were sampled for our experiment were closely
related to C. album, and the increase in reports of common lambsquarters populations developing
tolerance to glyphosate most likely is due to evolution within C. album and not because of a shift
in weed species.

iv
I dedicate this dissertation to all the agricultural scientists and farmers for their efforts
towards eradicating world hunger

v
ACKNOWLEDGEMENTS
First and foremost, I would like to thank my advisor Dr. Patrick Tranel for accepting me
as his graduate student and for his guidance, advice and patience throughout my academic career
at the University of Illinois. It is an honor to work with one of the nation‟s best weed scientists as
my mentor. I would also like to thank other members of my graduate committee, Drs. Aaron
Hager, Geoff Levin and Matthew Hudson for their suggestions about my research and for their
guidance and support. I want to thank Dr. Adam Davis for statistical assistance and Dr. A. Lane
Rayburn for guidance with DNA content analysis.
I extend my thanks to past and present lab members Drs Ryan Lee and Danman Zheng
for teaching me molecular techniques in the beginning of my research career. I would like to
specially thank Michael Bell, a true friend for his unconditional help and support throughout my
graduate program. Thank you Mike! Thank to Kate Thinglum for her help with the dissertation
and also making the Weed Science classes so memorable. Thanks Kate for your friendship! I am
also thankful to Stephanie Rousonelos and Dr. Jianyang Liu for their support in lab, valuable
advice and friendship.
I would also like to thank Dr. Chance Riggins and Sindhu Krishnankutty for helping me
with phylogenetics. Thanks to both of you. Many thanks to my friend Madhura Siddappaji who
always made me believe that anything is possible. I also want to thank all the undergraduate
students who helped me in the greenhouse with my Chenopodium experiments.
I want to thank all my teachers at the University of Illinois and Punjab Agricultural
University who trained me well to succeed in professional life. I want to thank my Masters
advisor, Dr D.S. Kler for showing me that hard work and perseverance never goes unnoticed.

vi
A special thanks to my father Mr. Rattan Singh, mother Mrs. Savinderjit Kaur, and my
brother Lakhwinder Singh for their prayers, blessings and sacrifices to shape my bright future. I
also want to thank my father-in-law, Mr. Ram Singh who always valued education and
unconditionally supported me in every possible way.
Finally, I owe everything to my wife, Gagan. It has been a long journey and I am so glad
that you were there to walk with me. Without your love, unconditional support, encouragement
and delicious food, this path would have been very tough.
vii
TABLE OF CONTENTS
List of Tables ................................................................................................................ ix
List of Figures .................................................................................................................x
CHAPTER 1: INTRODUCTION .................................................................................1
1.1 Introduction to the Genus Chenopodium ..................................................................2
1.2 Biology and Ecology of Chenopodium Species........................................................3
1.3 Morphology-Based Studies in Chenopodium Species ..............................................5
1.4 Molecular markers for Phylogenetic Studies ............................................................7
1.5 Pitfalls of Molecular Data .......................................................................................13
1.6 Molecular Analysis in Chenopodium......................................................................18
1.7 Herbicide Resistance in Common Lambsquarters… ..............................................19
1.8 Glyphosate Tolerance in Common Lambsquarters .................................................21
1.9 Research Objectives ................................................................................................23
1.10 Literature Cited ......................................................................................................24
CHAPTER 2: RESPONSES OF CHENOPODIUM SPECIES AND COMMON
LAMBSQUARTERS POPULATIONS FROM NORTH CENTRAL STATES
TO GLYPHOSATE .....................................................................................................41
2.1 Abstract ...................................................................................................................41
2.2 Introduction .............................................................................................................42
2.3 Materials and Methods ............................................................................................45
2.4 Results and Discussions ..........................................................................................51
2.5 Conclusions .............................................................................................................60
2.6 Sources of Materials ...............................................................................................61
2.7 Literature Cited .......................................................................................................61

viii
CHAPTER 3: MULTI-FACETED APPROACH TO UNDERSTAND THE
WEEDY CHENOPODIUM COMPLEX ...................................................................67
3.1 Abstract ...................................................................................................................67
3.2 Introduction .............................................................................................................68
3.3 Materials and Methods ............................................................................................70
3.4 Results and Discussion ...........................................................................................85
3.5 Conclusions ...........................................................................................................118
3.6 Sources of Materials .............................................................................................119
3.7 Literature Cited .....................................................................................................120
CHAPTER 4: SUMMARY .......................................................................................129
4.1 Conclusions and Future Directions ........................................................................129
4.2 Literature Cited ......................................................................................................132
ix
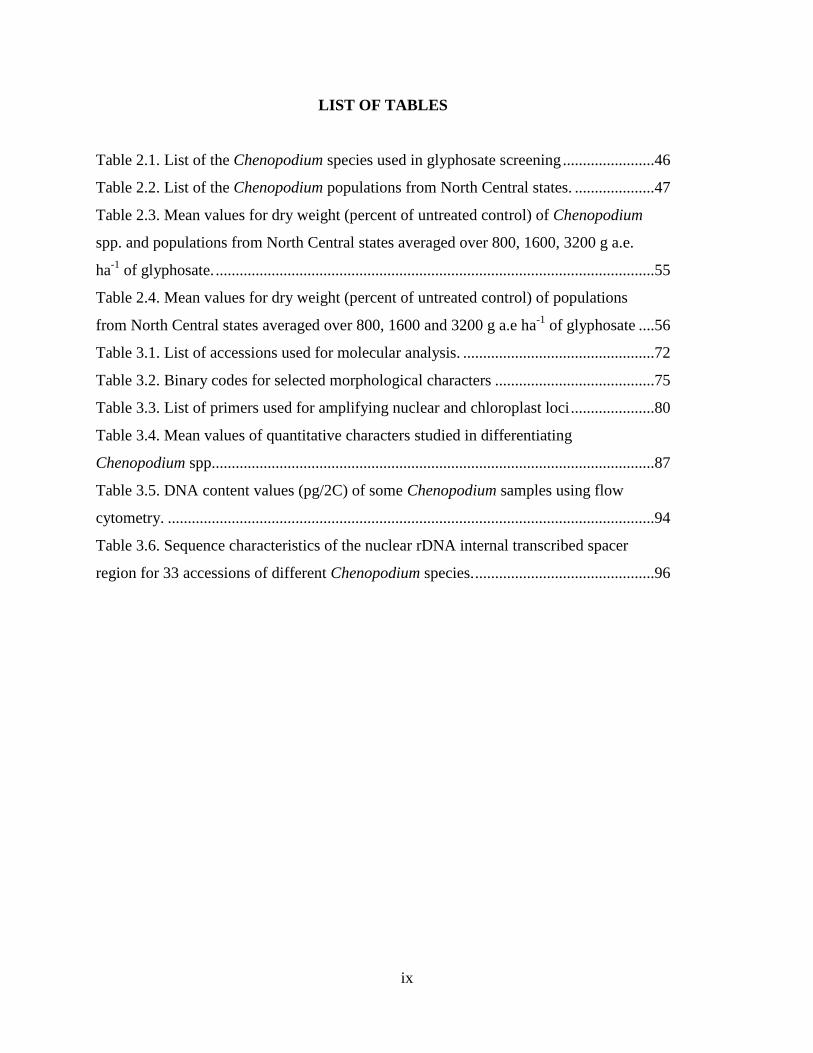
LIST OF TABLES
Table 2.1. List of the Chenopodium species used in glyphosate screening .......................46
Table 2.2. List of the Chenopodium populations from North Central states. ....................47
Table 2.3. Mean values for dry weight (percent of untreated control) of Chenopodium
spp. and populations from North Central states averaged over 800, 1600, 3200 g a.e.
ha-1
of glyphosate. ..............................................................................................................55
Table 2.4. Mean values for dry weight (percent of untreated control) of populations
from North Central states averaged over 800, 1600 and 3200 g a.e ha-1
of glyphosate ....56
Table 3.1. List of accessions used for molecular analysis. ................................................72
Table 3.2. Binary codes for selected morphological characters ........................................75
Table 3.3. List of primers used for amplifying nuclear and chloroplast loci .....................80
Table 3.4. Mean values of quantitative characters studied in differentiating
Chenopodium spp...............................................................................................................87
Table 3.5. DNA content values (pg/2C) of some Chenopodium samples using flow
cytometry. ..........................................................................................................................94
Table 3.6. Sequence characteristics of the nuclear rDNA internal transcribed spacer
region for 33 accessions of different Chenopodium species. .............................................96

x
LIST OF FIGURES
Figure 2.1. Mean dry weight of Chenopodium averaged across 800, 1600 and 3200 g
a.e. ha-1
of glyphosate... .....................................................................................................51
Figure 2.2. Glyphosate responses of different Chenopodium spp. from North Central
Regional Plant Introduction Station ...................................................................................52
Figure 2.3. Response of Chenopodium spp. averaged across 800 and 1600 g a.e. ha-1
of glyphosate ......................................................................................................................54
Figure 2.4. Dry weight (percent of untreated control) based on the average of mean
values for two doses (800 and 1600 g a.e. ha-1
) of glyphosate ..........................................59
Figure 3.1. Seed pericarp features of C. album and C. berlandieri using scanning
electron microscope. ..........................................................................................................89
Figure 3.2. Seed pericarp features of C. ficifolium, C. srtictum, C. berlandieri and
C. bushianum .....................................................................................................................90
Figure 3.3. Unrooted maximum parsimony tree based on the differences in
morphological characters of 17 accessions of Chenopodium ............................................92
Figure 3.4. Strict consensus tree of gaps from ITS region coded as binary characters
using maximum parsimony analysis ..................................................................................98
Figure 3.5. Maximum parsimony strict consensus tree of ITS region with gaps treated
as missing data .................................................................................................................100
Figure 3.6. Strict consensus tree derived from maximum parsimony analysis of 35
nuclear ITS sequences......................................................................................................101
Figure 3.7. Fifty percent Majority rule tree of 35 sequences of ITS region using
Bayesian analysis .............................................................................................................103
Figure 3.8. Phylogram derived with maximum parsimony analysis of entire ITS
region ...............................................................................................................................105
Figure 3.9. Strict consensus tree derived from maximum parsimony analysis of matK
gene for 22 Chenopodium species ...................................................................................107
Figure 3.10. Strict consensus tree derived from maximum parsimony analysis of
trnD- trnT region for 18 Chenopodium species ...............................................................109

xi
Figure 3.11. Strict consensus tree derived from maximum parsimony analysis of
combined chloroplast DNA sequences from 18 sequences. ............................................111
Figure 3.12. Strict consensus tree derived from maximum parsimony analysis of 35
sequences using combined DNA sequence data of ITS, matK, trnD-trnT ......................112
Figure 3.13. Neighbor joining tree of Chenopodium populations sampled across the
North Central states and selected species based on ITS sequences .................................117

1
CHAPTER 1
INTRODUCTION
Weeds pose a serious threat to agricultural and natural ecosystems, and managing them is
one of the biggest challenges for farmers. Weeds represent the most important pest complex
(Bridges, 1994) and are one of the main limiting factors in crop production (Avery, 1997).
Today, due to weeds, the annual estimated loss in the US is around $100 billion (Pimentel et al.
2005). There are several ways to manage weeds but one critical step for efficient weed
management is prevention, which includes proper weed identification. Correct identification is
important for weed control as different weed species respond differently to some weed
management strategies. In fact, weeds that look similar can actually be unrelated and can exhibit
different responses to the herbicides (Warwick and Black, 1981; Santelmann and Meade, 1961).
By identifying weed species correctly, herbicide rates can be adjusted, thereby limiting potential
adverse environmental impacts of herbicides. Another benefit of proper weed identification is
that we can select for better herbicides to control a particular weed. Identification is also critical
for determining which newly introduced weeds will pose possible threat to the crop
(Anonymous, 2009). Several researchers systematically investigated common weed species in
Amaranthus (Xu and Sun, 2001; Wetzel et al. 1999) Setaria (Dekker, 2003), and Echinochloa
(Danquah et al. 2002) complexes, and this approach was successful in controlling weeds in
economically important crops (Quakenbush and Anderson, 1985; Wang and Dekker, 1995).
The Chenopodium genus is not a well-understood complex and many species are highly
polymorphic in habit, height, branching and leaf size (Basset and Crompton, 1982). Cole (1961)
wrote that the confusion in Chenopodium identification mainly results from the abundance of
morphologically similar species, existence of polymorphisms within the limits of many

2
individual species and of parallel variation between different species, occurrence of marked
phenotypic plasticity complicating species identification, and presence of putative hybrids
further complicating the variation pattern. Rahiminejad and Gornall (2004) also reported
considerable genetic and morphological variation within the Chenopodium species thereby
supporting the fact that this is a complex group. Thus, not only does this group lack good
morphological characteristics to distinguish species, it also lacks informative sites that can be
used to differentiate species at the biotype level, and the existence of different intra-specific
chromosome numbers further complicates the classification (Maude, 1940).
In agricultural fields, most of the weedy Chenopodium species are referred to as common
lambsquarters (Chenopodium album L.). Recently, it was reported that common lambsquarters,
one of the worst weeds in the world (Holm et al. 1977), was difficult to control with the available
herbicides in corn and soybean fields in the North Central states (Fischer et al. 2004; Conley et
al. 2003). To more effectively manage the Chenopodium species in agronomic fields, it is
important to understand the taxonomy of the complex and to develop markers that can help in
proper species identification.
1.1 Introduction to the Genus Chenopodium
The genus Chenopodium consists of about 250 species (Giusti, 1970; Kadereit et al.
2005) and belongs to the Amaranthaceae, syn. Chenopodiaceae family (APG I 1998). With a few
exceptions, the majority of them are annual weeds (Cole, 1961). The genus includes herbaceous
and arborescent perennials, and is distributed throughout Asia, America and Europe (Ruas et al.
1999). ). The Chenopodium album classification has often functioned as a convenient taxonomic
receptacle, loosely circumscribed to include material not readily assigned to other species of this

3
difficult genus (Wilson, 1980). The taxonomy of the genus Chenopodium has been a major point
of controversy. Taxonomic problems mainly arise due to phenotypic plasticity (Kurashige and
Agarwal, 2005; Zhou et al. 2005), parallel evolution (Duke and Crawford, 1979) and
hybridization (Cole, 1961; Rahiminejad and Gornall, 2004). Bittrich (1993) included
Chenopodiaceae as one of the six families that lack clear delimitation or valid synapomorphies.
While studying the Chenopodium genus, Wahl (1954) wrote that „„no group of comparable size
and wide distribution known to the writer has suffered the lack of understanding of the taxa
involved as has the genus Chenopodium, especially those members of its Section Chenopodium
that are closely related to C. album and C. berlandieri.‟‟ In Illinois, there are about 20 species
(USDA, NRCS. 2008) and some of them (C. album, C. berlandieri, C. strictum, C. murale and
C. hybridum) are recognized as agricultural weeds. Some of these weeds are resistant to one or
more classes of herbicides (Heap, 2010).
1.2 Biology and Ecology of Chenopodium Species
According to the APG II system of 2003, the plants formerly treated as the family
Chenopodiaceae are now categorized under the family Amaranthaceae, making Amaranthaceae a
large family with 160 genera and 2,400 species. The Chenopodiaceae and Amaranthaceae
families were two closely related but separate families in the order Caryophyllales until 1998
when, based on the similarities of the morphological and molecular data, APG I (1998)
combined the two species. Traditionally, the two families were considered closely related based
on the core floral formula consisting of 5 sepals, 0 petals, 5 stamens, and 2-3 carpels
(Hershokovitz, 1989). Judd and Fergusen (1999) also gave similar facts with both families
having apomorphic flowers with a single whorl of stamens present opposite to the tepals and

4
multiporate pollen grains. Rodman (1990) also supported the inclusion of two families together
based on the autapomorphy of sieve-element plastids with peripheral ring-shaped bundles of
proteins but lacking central position inclusion, unique to these two families. Other characteristics
supporting the close relationship of the two families include anamolous secondary growth,
presence of isoflavones (Sanderson et al. 1988) and pantoporate pollen (Hershkovitz, 1989). So
based on their similarities, these two families were always taxonomically close to each other in
virtually all systems of classifications.
Molecular data, in addition to the existing morphological data, supported the combination
of the two families into Amaranthaceae (APG II 2003). Molecular-level support has been
provided by several researchers working on different gene regions. For instance, Rettig et al.
(1992) reported the phylogenetic relationship between the two species, and based on the
nucleotide subunit data of ribulose1, 5-bisphosphate carboxylase /oxygenase (rbcL), supported
the placement of Amaranthaceae and Chenopodiaceae as a monophyletic lineage. Similar results
were also reported by Downie et al. (1997) by studying the phylogeny based on the sequence of
partial chloroplast DNA ORF 2280 homolog. They concluded that phylogeny lacked the
separation between two families.
Some of the most important genera included in Chenopodiaceae are Chenopodium,
Atriplex, Beta and Salsola. A detailed description of the morphology of Chenopodium is given
by Clemants and Mosyakin (2004). To provide a brief description, family members are mainly
characterized as herbs, either annual or perennial, and farinaceous pubescent or glabrous. The
stems are mostly striped with their orientation varying from erect to prostate, and generally
branched. The leaves of Chenopodium are alternate, petiolate or sessile, not fleshy; the blade can
be linear, oblong, lanceolate, ovate, triangular, trullate, or rhombic, with the leaf base truncate,

5
cordate, hastate, or cuneate. The inflorescence is either spicate and terminal or axillary and
glomerulate. The genus is generally characterized by small perfect or rarely unisexual flowers
with the perianth five-parted (rarely three- or four-parted), and the segments rounded or keeled.
The flowers have five or fewer stamens and the style usually has two (rarely five) stigmas
(Standley, 1916; Clemants and Mosyakin, 2004; Judd and Fergusen, 1999). Fruits are utricles or
achenes, often associated with persistant tepals; the pericarp appears smooth to papillate. Seeds
of Chenopodium generally have flat margins but can also be rounded, flattened, or grooved with
their surfaces appearing shiny to dull and smooth to alveolated (Bassett and Crompton, 1982)
1.3 Morphology-Based Studies in Chenopodium Species
Species of Chenopodium are not easily defined because of lack of distinctive
macroscopic morphological characters in the genus (Bassett and Crompton, 1982). Many species
need more than vegetative material alone for identification. The first post-Linnean study on
Chenopodium was done by Moquin-Tandon (1840) in his monograph of the family. Murr (1904
1927) contributed extensively to the Chenopodium complex. Brenan (1964) wrote about the
taxonomy of Chenopodium for Flora Europaea. In the New World, the majority of the
contribution to Chenopodium was made by Aellen (1929). Apart from Aellen, other researchers
who contributed to Chenopodium studies include Watson (1874), Standley (1916), Aellen and
Just (1943), and Wahl (1954), although they mainly contributed to revision of existing treatments
of introduced and native American taxa (Bassett and Crompton, 1982).
The taxonomic classification of Chenopodium species has always proven to be very
difficult and most of the researchers have used one or more morphological characteristics in
combination to clear the confusion within the taxa. For instance, Aellen and Just (1943) and

6
Wahl (1954) made subsectional distinctions based on inflorescences and pericarps of the
Chenopodium species. Similarly, Cole (1961) subdivided Chenopodium into 4 subsections based
on seed coat markings. Iljin (1936) also differentiated Chenopodium taxa based on pericarp
structures and keeling of the calyx lobes. Apart from seed coat and inflorescence, some
researchers have also used leaf color as an additional characteristic (Moquin-Tandon, 1840).
Bassett and Crompton (1982) worked on clarification of taxonomic circumscriptions and
the nomenclature and distribution of taxa in Chenopodium across Canada, mainly based on
characteristics like seed testa and pericarp, along with the information related to the chromosome
count in the species. Crawford and Reynolds (1974) took a different approach by using phenetic
characters to understand the relationship among narrow-leaved Chenopodium species. They were
successful in elucidating the relationship and reported certain affinities that were contrary to the
literature present at that time. Such studies have also been successfully conducted in other plant
groups also to gain insight into the variation pattern within the species (Crovello 1968; Gilmartin
1969; Ornduff and Crevello 1968; Heiser et al. 1965). Another parameter that has been studied to
gain insight into the Chenopodium taxa is the pollen grain structure along with cytological and
seed characteristics (Dvorak, 1983).
Chenopodium album, one of the worst weeds and widespread synanthropic plants, is also
among the most polymorphic plant species (Clemants and Mosyakin, 2004). It is a loosely
arranged aggregate with races still being insufficiently understood. Some authors have
recognized numerous segregate intergrading species, while others have developed elaborate
infraspecific hierarchies with numerous subspecies, varieties, forms, and even numerous
subforms, or have combined both approaches. Neither approach has brought satisfactory and
uncontroversial results (Clemants and Mosyakin, 2004). This lack of solid knowledge about the

7
Chenopodium species has led to the need for a set of molecular markers in order to gain
additional information about the species.
1.4 Molecular Markers for Phylogenetic Studies
In the last three decades, molecular sequence data have revolutionized the field of
systematics by providing additional approaches and giving more confidence to published
morphology-based systematics or taxonomy. The potential of DNA data to reveal phylogenetic
relationships was first discussed in 1965 by Zuckerkandl and Pauling. Earlier systematics studies
focused on DNA-DNA hybridization (Bendich and Bolton, 1967). The potential of restriction
fragment length polymorphisms (RFLP), as a marker was shown in the Compositae family
(Jansen and Palmer, 1988). It was only after the advent of the PCR technique (Saiki et al. 1988)
that DNA analysis came to be used very frequently.
Most molecular taxonomy data are generated by PCR amplification and sequencing of
nuclear DNA markers (internal transcribed spacers, external transcribed spacer, transposable
elements, simple sequence repeats, promoter sequences and single copy nuclear intron
sequences), chloroplast DNA markers and mitochondrial regions. Soltis and Soltis (1998) have
discussed the importance of different regions for studying angiosperms at different taxonomic
levels.
Since the advent of the research done by Soltis and Soltis (1998), many new markers
have been discovered, but the information provided still holds true for species and population
level studies. The nuclear and chloroplast regions are more promising than mitochondrial region
due to lack of mitochondrial markers that can be used at lower level taxonomy (Palmer, 1992).

8
The use of molecular data has proved to be a powerful approach for achieving well-
delimited taxa in groups like the Ericeae (Kron et al. 2002) and Asteraceae (Kim and Jansen,
1995). The independent information from DNA-based topologies can help in resolving
relationships among morphologically intractable groups (Fior et al. 2006) and, along with
morphological studies, can help in understanding the taxonomic complexities (Schönenberger
and Conti, 2003). One main advantage of DNA markers is that, unlike morphological and
biochemical markers, the DNA markers are practically unlimited in number and are not affected
by plant developmental stage or growth environment (Winter and Kahl, 1995).
Molecular markers are developed from the organellar genomes (mitochondria,
chloroplast) or regions of the nuclear genome and the utilities of these marker types is discussed
in further detail below.
Mitochondrial DNA (mtDNA)
Mitochondrial genomic regions are the less used organellar markers in phylogenetic
analyses in plants. The reasons for their limited use are discussed in detail by Palmer (1992).
Some of the limitations in using the mitochondrial DNA (mtDNA) are that it is very large and
highly variable in size; sometimes chloroplast DNA sequences are present in mitochondrial
genomes; large duplications are frequent; recombination can occur among repeats making the
genome complex; and the nucleotide substitution rate is 3-4 times less than chloroplast DNA
(cpDNA) and even less when compared to nuclear DNA (Wolfe et al. 1987, 1989; Palmer and
Herbon, 1988; Laroche et al. 1995)
The utility of mtDNA is more in higher taxonomic studies but less in interspecies or low
level taxonomic studies (Soltis and Soltis, 1998). An intron, nad1, which is present in NADH
dehydrogenase has been used to understand the relationship of Polemoniaceae with other

9
families (Porter and Johnson, 1998). Although there are few studies at family and population
levels (Davis et al. 1998; Luo and Boutry, 1995), mitochondrial regions from plants have not
been investigated as the substitution rates are low. They have not been explored in detail as has
been done in animals.
Chloroplast DNA (cpDNA)
The chloroplast genome is smaller than the nuclear genome and is found in large
numbers, making it easy to isolate. The chloroplast genome is divided into protein coding genes,
introns and intergenic spacers. Most phylogenetic studies investigating plant evolution utilized
chloroplast markers. The cpDNA is successful in such studies because it is structurally stable,
non-recombinant, and highly conserved in genetic content among closely related species
(Downie and Palmer, 1991). Chloroplast protein coding gene substitution rates are generally
slower than those of the nuclear genome, making them good markers for high level taxonomic
studies (Chase et al. 1993; Soltis and Soltis 1998), but noncoding introns and spacers are used
frequently at low taxonomic levels, though sometime noncoding cpDNA also fails to provide
significant phylogenetic information (Shaw et al. 2005, 2007; Small et al. 1998).
Among the coding genes, rbcL (Chase et al. 1993) was used in the earlier phylogenetic
studies, but soon it was followed by other coding genes like ndhF (Olmstead and Palmer 1994;
Clark et al. 1995; Kim and Jansen 1995), atpB (Hoot et al. 1995; Wolf 1997) and the more
commonly used matK alone (Johnson and Soltis 1994; Shaw et al. 2005), or matK along with
intron trnK-matK-trnK region (Johnson and Soltis 1994). Though the coding regions have been
used extensively in studies at the family or higher taxonomic levels, the noncoding regions are
used more at the lower taxonomic levels, making them more appropriate for species (Gielly and
Taberlet, 1994).

10
A limitation of cpDNA is its slow rate of evolution (Wolfe et al. 1987), which hinders it
in providing enough phylogenetic informative characters at lower taxonomic levels (Sang, 2002).
Another problem is uniparental inheritance, which means it reveals information from only a
single parent. So, if the samples consist of hybrids or polyploids, it will give false phylogeny
since it cannot reveal hybrid history (Sang 2002; Small et al. 2004). The assumption of
uniparental inheritance is also not without an exception. There are reports of biparental and
paternal inheritance in angiosperms (Birky 1995; Corriveau and Coleman, 1988). Another
assumption is that chloroplast genomes are non-recombinant; however, evidence from Pinus
contorta suggests that recombination may occur (Marshall et al. 2001).
Nuclear Sequences
Most of the studies using nuclear regions have relied on the nuclear ribosomal regions.
At higher taxonomic levels, the slowly evolving rRNA genes are used (Soltis and Soltis, 1998;
Kuzoff et al. 1998), while at lower taxonomic levels internal transcribed spacers (ITS) and
external transcribed spacers (ETS) are more commonly used (Alvarez and Wendel 2003). In
general, the eukaryotic ribosomal RNA genes are part of repeat units that are arranged in tandem
and located at chromosomal sites known as nucleolar organizing regions. Each unit consists of a
transcribed region having genes for 18S, 5.8S, 26S rRNA, internal transcribed spacer 1 and 2,
external transcribed spacers (ETS1 and ETS2) and a non-transcribed spacer (NTS) region.
The ITS has been widely used mainly as it is biparentally inherited, can be amplified
using universal primers, is present in thousands of rDNA repeats making it easy to amplify, has
low genomic variability due to concerted evolution but high intra-genomic variability due to
insertion and deletion mutations (indels) and it appears to largely evolve neutrally (Alvarez and
Wendel, 2003). These qualities make ITS a popular region for phylogenetic studies, however

11
there are several concerns related to its use (for review Alvarez and Wendel, 2003; Baldwin et al.
1995; Dubcovsky and Dvorák, 1995; Feliner and Rossello, 2007). Briefly discussing the
limitations, the first issue is with multiple rDNA repeats. The basic requirement for historical
inference based on nucleic acid sequence is that the genes compared are orthologous and not
paralogous. Orthologous sequences are preferred as their history reveals divergence events
among species. However, if there is a gene duplication event, it leads to the formation of
paralogous sequences between lineages. This paralogy in phylogenetic estimation will lead to
incongruence in phylogeny (Alvarez and Wendel, 2003).
Another problem pertains to concerted evolution, a phenomenon that tends to
homogenize the sequences in nrDNA arrays, however this process is not always completed.
When there is a hybridization or introgression, the speed and direction of homogenization cannot
be predicted. So analyzed at the species level, concerted evolution is probably responsible for
complex patterns following the merging of ITS repeats due to hybridization (Feliner and Rosello,
2007)
Due to the concerted evolution, the duplicated ribosomal loci may degenerate into
pseudogenes and this can lead to wrong inference. Moreover, if there are compensatory base
mutations in positions located on stem structures, it violates the assumptions of neutrality and
independence of characters (Liu and Schardl, 1994). Another common problem is with the
alignment of the sequences. It has been observed that aligning ITS leads to hypothesizing indels.
This can make the alignment of distantly species difficult and leads to incorrect homology
assessment. If misalignment is not corrected, then along with compensatory base change,
paralogy and lack of (complete) concerted evolution can increase homoplasy (Alvarez and

12
Wendel, 2003). To combat these limitations, single or low copy nuclear genes are often used in
the place of the aforementioned markers (Sang 2002; Small et al. 2004).
Low Copy Nuclear Genes (LCNG)
An alternate approach to ITS and cpDNA markers is to use single or low copy nuclear
genes for phylogenetic analyses Slow rates of sequence divergence in cpDNA or too much
divergence in ITS create a problem for using these markers. The uniparental inheritance of
cpDNA also cannot provide any information about hybrids, and in nrDNA the process of
homogenization by concerted evolution creates a similar problem in assessing hybrids. Some of
the main advantages of using single or low copy nuclear genes are biparental inheritance, and co-
occurrence of introns and exons within the same gene, yielding characters that evolve at different
rates thus can provide informative signals at different levels and relatively large number of
markers makes them potentially good alternates to ITS and cpDNA markers (Alvarez et al.
2008).
At higher taxonomic levels LCNGs (such as phytochrome) have proven to be useful
markers for understanding diversification in angiosperms (Matthews et al. 1995). There is a need
to explore more LCNGs as they can potentially allow selection of genes with extremely
conserved rates of evolution and consequently a robust reconstruction of deep branch
relationships of plants (Sang, 2002). The studies at the intergeneric level also have shown
promising results for LCNGs like the Adhc gene, which have proven to be better than cpDNA
(ndhF) for constructing phylogeny. Similarly, the 4CL gene sequence is congruent with the
chloroplast (matK) and mitochondrial (nad5) genes. Even at the interspecies level, AdhC proved
to be more useful when studying the relationship of closely related tetraploid species as

13
compared to cpDNA which produced a weakly and poorly resolved phylogeny (Small et al.
1998).
However, there are some concerns too with using LCNG, including problems due to
paralogy, lineage sorting, hybridization, requirement of large amount of high quality DNA, non
universality of the primers and the need to clone to amplify all the copies of the alleles (Sang,
2002).
1.5 Pitfalls of Molecular Data
The use of DNA as a taxonomic tool has been advocated by several researchers (Doyle,
1993; Hajibabaei et al. 2007; Tautz et al. 2003). However, there is a strong reaction against
relying on DNA-based taxonomy (Miller et al. 1997). Some of the reasons for being vigilant
when using DNA sequences as taxonomic tools are issues related to long branch attraction,
pseudogenes, homology assessment, polyploidy and hybridization, alignment in sequences with
indels, model selection to estimate nucleotide substitution rate and computation time for
phylogenetic analysis. These are discussed separately.
Long Branch Attraction (LBA)
This is a phenomenon when rapidly evolving lineages, when included with slowly
evolving lineages, are inferred to be closely related regardless of their actual evolutionary
relationship or in other words due to false synapomorphies. The maximum parsimony (MP)
method is more sensitive to LBA. When LBA is present, tree reconstruction methods are
inconsistent, and they converge towards an incorrect solution as more data are considered. This
artifact is serious as there were 112 hits on Web of Science that have discussed this problem. The
LBA problem has been reviewed in detail by Bergsten (2005). He describes LBA as a
phenomenon in which an amino acid in two species at a certain position looks identical but had

14
been independently acquired and will appear as synapomorphies. The simulation studies and
Felsentein four taxon case-study also showed that inference is difficult in the Felsenstein zone
where the two long branched non sister taxa grouped together rather than with their true shorter
branched sisters (Huelsenbeck, 1995).
Pseudogenes
This is a problem when we are using nuclear genes or rDNA sequence data for
phylogenetic analysis. The paralogues of ribosomal DNA can become pseudogenes when a
single rDNA copy is dispersed to other genomic regions. The first step is to discriminate between
paralogous rDNA, as paralogues may cause species to appear para- or polyphyletic if a gene tree
is interpreted as a species tree (Buckler et al. 1997). Pseudogenes are more dependent on the
molecular data used and less on analysis method. Good sequence alignment and rDNA
secondary structure can help to identify pseudogenes in the given dataset.
Assessing Homology
Hypothesis of homology is the basis of phylogenetic analysis (Phillips, 2006). The term
homology was first introduced by Owen (1843) to express similarities in basic structure found
between organs of animals that he considered to be more fundamentally similar than others.
Homologies can be difficult to identify; this may be attributed in part to the existence of a finite
number of character states and rates of change sufficient to yield independent expressions of the
same state. We assign putative homology to molecular data using sequence alignments. The best
alignment in context with phylogeny is the one that generates the most parsimonious tree when
analyzed in conjunction with all relevant data. We should therefore be very careful when we are
aligning the sequences and should check visually for shifts in sequences and manually edit them

15
if required. Another possibility is to give more weight to characters that change less frequently
which can further help to reduce the effects of homoplastic similarity among the sequences.
Polyploidy and Hybridization
One of the most significant finding of molecular data usage is that of polyploidy (genome
duplication) and hybridization. Several studies have revealed that multiple rounds of polyploidy
have occurred during angiosperm evolution. Polyploidy has long been recognized to be
associated with novel morphologies and adaptations, but how genome duplication ultimately
translates into novel evolutionary opportunity is not very clear. Interspecific hybridization
followed by polyploidy can restore fertility to sterile hybrid lineages. There are several studies
that indicate that there is doubling of chromosome numbers due to autopolyploidy or by
allopolyploidy via a hybridization event. To uncover past hybridization or introgression events,
comparison between phylogenies derived from nuclear and chloroplast genomes are important
because discordance in relationships between the data sets may indicate that hybridization have
occurred (Rieseberg, 1998; Doyle, 1992).
Multiple Sequence Alignment of Samples with Gaps
When we do multiple sequence alignment of DNA sequences, it is very common to
hypothesize gaps or indels in order to align orthologous sequences. If we use program such as
Gapcoder, we can convert the gaps into binary characters and then easily analyze them using
phylogenetic software like PAUP (Swafford, 1999). We should look at the sequences very
carefully and edit the sequences in order to use gaps as phylogenetic informative characters.

16
Model Selection
In the Maximum likelihood and in Bayesian analysis, model selection is really important.
In molecular phylogenetics, models are used to estimate the evolutionary change at a given
nucleotide site over the period. The primary aim of molecular phylogenetic inference is to
approximate the progression of lineage divergences that produced a group of observed
sequences. Most of our conclusions are based on phylogeny estimations, and without any prior
knowledge of the actual evolutionary relationships between organisms, confidence in the
performance of a model is necessarily a function of confidence in the suitability of the model and
the data used (Kelchner and Thomas, 2007). Models are based on assumptions and some of them
are: (i) mutations are independent and identically distributed; (ii) tree-like evolution: lineages
arise in a divergent manner without reticulation; (iii) stationarity: mutational processes are
consistent through time; (iv) reversibility: mutations can revert to a previous state; and (v)
Markov process: mutation events are not influenced by a previous mutation at that site (Kelchner
and Thomas, 2007). Such assumptions are often violated in reality; for example, prokaryote
groups frequently share genes among lineages via lateral gene transfer and do not evolve in a
tree-like fashion. Kelchner and Thomas (2007) have discussed key points that we should keep in
mind when we select models for analysis. If the model is a poor approximation of reality due to
absence of key parameters, the consequence can be systematic error that strongly influences the
analysis, resulting in inaccurate but sometimes well-supported phylogeny estimation. Under-
fitting a model can lead to problems like long-branch attraction (discussed earlier) when
sampling is inadequate and there is a faster substitution rate in one or more lineages. Model
selection is important for phylogenetic analysis and there are tools that can help to select a better
model (Sullivan and Joyce, 2005). In general, the model preferred is a parameter rich model. A

17
thorough review of importance and how to select a good model is also given by Sullivan and
Joyce (2005).
Computation Time
Another limitation in phylogenetic programs is of computation time. Distance based
methods like UPGMA (Mitchner and Sokral, 1957) and minimum evolution (Kidd and
Sgaramella, 1971) are fast but the information is lost in compressing sequences into distances.
Maximum parsimony (Edwards and Cavali-Sforza, 1963) is fastest in character based tree but it
can perform poorly depending upon the amount of homoplasy. Maximum likelihood (Edwards
and Cavalli-Sforza, 1964; Felsentein, 1981) is very good but on the other hand a very exhaustive
method and can be only done with heuristic search if there are more samples. Bayesian analysis
(Largert and Simon, 1999; Huelsenbeck and and Ronquist, 2001) can take days if the number of
samples is more, so it comes to the point where we have to decide what kind of information we
need from our data and accordingly we have to compromise with either time or accuracy.
Now, as we know that there are pros and cons of using DNA sequences in phylogenetic
analysis, the best approach is to integrate morphological characteristics and molecular data. By
incorporating unambiguous morphological characters and analyzing those along with molecular
data, the bias of homoplasy within any individual data partition will decrease (Farris, 1983;
Miller et al. 1997; Wahlberg et al. 2005). The utility of combined analysis has been well-
defended by phylogenetic inferences from Doyle and Endress (2000) and Conard (2008). This
type of combined analysis has proven to be helpful in distinguishing amongst the plant species.

18
1.6 Molecular Analysis in Chenopodium
Molecular studies have been done in Chenopodium using random amplified polymorphic
DNA (RAPD) (Anderson 1999; Gangopadhay et al. 2002), directed amplification of minisatellite
DNA (DAMDA) (Rana et al. 2010), microsatellite markers (Mason et al. 2005), ribosomal DNA
(Maughan et al. 2006) and plastid genes (Downie et al. 1997). Ruas et al. (1999) used RAPD
markers to distinguish C. album from C. berlandieri and found 90 percent similarity between the
two, which perhaps gives us a reason why these species are often misidentified. In Bolivia, Ruas
et al. (1999) found that there was a 75 percent similarity between two accessions of C.
ambrosoides, but these accessions could not be distinguished using morphological characters. In
another study involving highland and lowland C. quinoa, Maughan et al. (2006) used the IGS
region and revealed the presence of synapomorphic polymorphisms that separated the lowland
from highland C. quinoa.
A majority of the research related to genetic diversity and phylogenetic studies in
Chenopodium mainly emphasized domesticated species like C. quinoa and C. berlandieri. There
are very few studies (Rana et al. 2010) that include the important weed species like C. album, C.
berlandieri, C. ficifolium, C. glaucum, C. murale and C. strictum, and there is a clear lack of
understanding of these species using both morphological and molecular data. Given the recent
accounts of herbicide-tolerant common lambsquarters that have been reported, understanding
this complex now is more important than ever. The following two sections will discuss herbicide
tolerance in common lambsquarters.

19
1.7 Herbicide Resistance in Common Lambsquarters
Herbicide resistance in weed populations is an evolutionary process and refers to the
evolution of a mechanism to withstand a normally effective herbicide dose as a result of
selection pressure (Harper, 1956). In plants, resistance can occur naturally or can be induced by
techniques such as genetic engineering or selection of variants produced by tissue culture or
mutagenesis (Anonymous 1998). Resistance is different than tolerance in which the plants have
the inherent ability to survive and reproduce after herbicide treatment and there is no role of
selection or genetic manipulation of plants to be tolerant (Anonymous, 1998).
Resistance to herbicides is an ever-increasing problem and has become a threat to
conventional agricultural practices in agriculture (Jasieniuk et al. 1996). Several factors like gene
mutation, initial frequency of resistant alleles, inheritance, weed fitness in the presence and
absence of herbicide, type of mating, and gene flow influence the evolution of herbicide
resistance.
Since the observation in 1970 of triazine resistance in Senecio vulgaris L. (Ryan, 1970),
herbicide resistance has increased dramatically. According to the latest report of International
Survey of Herbicide Resistant Weeds, globally 195 species, of which 115 are dicots and 80 are
monocots, have developed resistance to one or more classes of herbicides (Heap, 2010). In the
US, there are 354 biotypes that are resistant to one or more classes of herbicides and Illinois
ranks third with 18 resistant biotypes to photosystem system II (PSII), acetolactate synthase
(ALS), protoporphrinogen oxidase (PPO) and glycine herbicides. It is estimated that 4,062,200
acres of Illinois (Anonymous, 2010) land is affected with these resistant biotypes, with
Amaranthus tuberculatus being the predominant species. This weed has evolved resistance to
four classes of herbicides (Heap, 2010).

20
The first report of a weed resistant to atrazine and simazine appeared in 1970 when
common groundsel (Senecio vulgaris) was reported resistant to simazine and atrazine (Ryan
1970). It was soon recognized that herbicide resistance in the weed species was passed down
maternally and attributed to a change in the properties of photosystem II. However, the
molecular basis of resistance, an amino acid change in the sequence of one of the reaction center
proteins of photosystem II, was first reported in Amaranthus hybridus L. in which resistant plants
had a serine to glycine substitution at position 264 on the D1 protein (Hirschberg and McIntosh,
1983). Another mutation at the amino acid position 219 has been identified which is also
responsible for resistance to PS-II inhibitor (Dumont and Tardiff, 2002; Mengistu et al. 2000).
Chenopodium is on the list of top ten resistant weeds and is reflected by the fact that there
are 42 resistant biotypes of Chenopodium in 17 countries (Heap, 2010). The majority of these
biotypes are resistant to photosystem II inhibitors, followed by ALS inhibitors, synthetic auxins,
ureas and amides. In the US, there are 21 biotypes that are resistant to photosystem II (19) and
ALS inhibitors (2) and tolerant to glyphosate (Westhoven et al. 2008a). In 2009, within Illinois,
there were 18 biotypes of resistant weeds and Chenopodium album was one of them.
The earliest case of herbicide resistance in the Chenopodium complex dates back to the
1970s in the Midwest when they evolved resistance to triazine herbicides (Bandeen and Mclaren,
1976). In fact, triazine resistance in Chenopodium is quite notable and there are more than 19
biotypes of Chenopodium that are resistant to triazines (Bandeen and McLaren, 1976).
Herbicides that target photosystem II (triazine and phenylurea) inhibit plant growth by
competing with the native plastoquinone, which is the binding site of the D1 protein in the
photosystem II, thereby disrupting the linear electron transport from the electron donor, QA, to
the mobile electron carrier, QB (Oettmeier, 1999). This results in a shortage of reduced NADP+

21
which is required for CO2 fixation and the formation of free radicals which cause photooxidation
of important molecules in the chloroplast, the latter being the major herbicidal action of these
herbicides (Devine and Shukla, 2000).
A biotype of Chenopodium album in New Zealand has also developed resistance to
synthetic auxins such as dicamba (James et al. 2005). A recent report from New Zealand
confirmed that a biotype of Chenopodium was tolerant to 2400 g ha-1
dicamba, which is
equivalent to eight times the recommended field rate (Rahman et al. 2008). This is another major
setback for weed control as dicamba mixed with other herbicides has proven to be very effective
in controlling triazine resistant Chenopodium album (Ritter and Menbere, 2001). Chenopodium
album has occasionally shown poor control with pre-emergence (PRE) herbicide treatments with
dinitroaniline herbicides such as pendimethalin (Hagwood, 1989), but the results are not very
consistent and the cases of tolerance to these herbicides are rare.
Within glyphosate-based cropping systems, weed scientists have confirmed that weed
shifts have occurred, with common lambsquarters becoming more problematic (Culpepper,
2006). Control of common lambsquarters with glyphosate has been variable and there is an
increase in the number of reports that show poor common lambsquarters control with glyphosate.
1.8 Glyphosate Tolerance in Common Lambsquarters
Glyphosate is the most commonly used broad-spectrum herbicide and is effective in
controlling many weeds. It acts by blocking the shikimate pathway through inhibition of 5-
enolpyruvylshikimate-3-phosphate synthase (EPSPs). Inhibition of EPSPS results in reduced
biosynthesis of aromatic amino acids tyrosine, phenylalanine, and tryptophan in sensitive plant
species (Amrhein et al. 1980; Kishore and Shah, 1988). Glyphosate competes with

22
phosphoenolpyruvate (PEP) for the binding site on the EPSPs enzyme (Sikorski and Gruys,
1997). Upon inhibition of EPSPS, shikimic acid and shikimate 3-phosphate levels increase in
plants and this increase is linked to a decline in carbon fixation intermediates and a reduction of
photosynthesis (Duke et al. 2003).
In the last decade, glyphosate resistant (GR) and tolerant populations have increased
(Powles, 2008). Currently, 16 weed species have evolved resistance to glyphosate and some of
the common weeds species are Ambrosia, Amaranthus, Conyza, Lolium, Conyza and Sorghum.
Apart from resistant weeds, farmers have reported tolerance to glyphosate in different
populations of common lambsquarters. Similar reports have been given by researchers across
Midwestern states confirming that common lambsquarters has some level of tolerance to
glyphosate (Westhoven 2008a). With over-reliance on glyphosate in GR cropping systems, there
are chances of these tolerant weeds developing resistance due to high selection pressure. Several
factors, such as rapid growth of common lambsquarters plants to maturity, ability to germinate
under different environmental conditions (Chu et al. 1978; Cummings 1963; Hilgenfield et al.
2004 ), indeterminate growth, environmental plasticity under field conditions (Kurashige and
Agarwal, 2005), high seed production (Conn and Deck, 1995; Holm et al. 1977), long seed
viability (Conn and Deck, 1995; Madsen, 1962), delayed germination, discontinuous dormancy
and germination under low temperature conditions ahead of the crop make it a problematic weed
(Chu et al. 1978; Wiese and Binning, 1987). Although resistance in agronomic fields is not yet a
problem, the threat is always there; so even if a single plant survives, its progeny can establish as
a resistant weed.
Within GR based cropping systems, weed scientists have confirmed that weed shifts have
occurred, with common lambsquarters becoming more problematic (Culpepper, 2006). The

23
incidence of lambsquarters has increased under no-tillage systems (Sosnoskie et al. in 2006).
Similar results were also reported in seed bank studies by Cardina et al. (2002). Field surveys
conducted in Indiana from 2003 to 2005 reported that common lambsquarters plants were
present in 11 percent of randomly sampled soybean fields (Westhoven et al. 2008b). Similar
results have also been reported by researchers across other Midwestern states (Curran, 2005;
Harder et al. 2007; Loux and Stachler, 2003; Kniss et al. 2006; Schuster et al. 2007). Season long
interference by common lambsquarters in soybean fields has decreased soybean yield by 20 to 61
percent (Crook and Renner, 1990; Conley et al. 2003). Common lambsquarters became one of
the dominant weed species in long-term experiments evaluating weed species shifts in
glyphosate-resistant cropping systems. Results from these experiments indicate the dominance of
common lambsquarters in soybean-corn rotation in the fields (Jeschke and Stoltenberg, 2006).
1.9 Research Objectives
The weedy Chenopodium complex is not well understood within the North Central states
and there are ongoing reports that the complex is becoming more difficult to control with
glyphosate. We conducted greenhouse and laboratory studies on this weedy Chenopodium
complex to determine the species present in the Midwest and the response of these populations to
glyphosate. We test the hypothesis that there is no difference in the response to glyphosate of
different Chenopodium spp. across the Midwest. Based on our testing hypothesis, we had three
main objectives:
1. Determine the responses to glyphosate of different Chenopodium species and populations
present in the North Central states.
2. Develop molecular markers to identify different species of Chenopodium spp.

24
3. Determine which species are present in North Central states using molecular markers.
1.10 Literature Cited
Aellen P (1929). Beitrag zur systematic der Chenopodium-Arten Amerikas, vrowiegend auf
Grund der Sammulung des United States national Museum in Washington.D.C.I. Feddes
Repert. Specierum Nov. Regni veg.26:31-64;119-160.
Aellen P and Just T (1943). Key and Synopsis of the American species of the genus
Chenopodium L. Am. Midl. Mat. 30:47-76.
Álvarez I and Wendel JF (2003). Ribosomal ITS sequences and plant phylogenetic inference.
Mol. Phyl. Evol. 29:417-434.
Alvarez I, Costa A and Feliner GN (2008). Selecting single copy nuclear genes for plantr
phylogentics: A preliminary analysis for the Senecioneae (Asteraceae). J. Mol. Evol.
66:276-291.
Amrhein N, Deus B, Gehrke P and Steinrucken HC (1980). The site of inhibition of the
shikimate pathway by glyphosate, II: interference of glyphosate with chorismate
formation in vivo and in vitro. Plant Physiol. 66:830-834.
Anderson W R (1999). Genetic relationships among 19 accessions of six species of
Chenopodium L. by random amplified polymorphic DNA fragments (RAPD). Euphytica
105:25-32.
Anonymous (1998). Technology notes. Weed Technol. 12(4):789.
Anonymous (2009). Insect and Weed Identification. Available at
http://www.agric.wa.gov.au/PC_90020.html?s=1001).

25
Anonymous (2010). Farms-Number and Acreage: 1990 to 2008. Available at
(http://www.census.gov/compendia/statab/2010/tables/10s0800.pdf)
APG I (1998). An ordinal classification for the families of flowering plants. Ann. Mo. Bot. Gard.
85:531-553.
APG II (2003). An update of the angiosperm phylogeny group classification for the orders and
families of flowering plants. APG II. Bot. J. Linnean Soc. 141:399-436.
Avery DT (1997). Saving the Planet with Pesticides, Biotechnology, and European Farm
Reform. Proc. Brighton Crop Prot. Conf. Weeds. 1:3-18.
Baldwin BG, Sanderson MJ, Porter MJ, Wojciechowski MF, UlrikeCampbell CS and Donoghue
MJ (1995). The ITS region of nuclear ribosomal DNA: a valuable source of evidence on
angiosperm phylogeny. Ann. Mo. Bot. Gard. 82:247-277.
Bandeen, JD and McLaren RD (1976). Resistance of Chenopodium album to triazine herbicides.
Can. J. Plant Sci. 56:411-412
Basset IJ and Crompton CW (1982). The genus Chenopodium in Canada. Canada J. Bot. 60:586-
610.
Bendich AJ and Bolton ET (1967). Relatedness among plants as measured by the DNA-agar
technique. Plant. Physiol. 42:282-297.
Bergsten J (2005). Review of long-branch attraction. Cladistics 21:63-193.
Birky CW (1995). Uniparental inheritance of mitochondrial and chloroplast genes: mechanism
and evolution. Proc. Natl. Acad. Sci., USA. 92:11331-11338.
Bittrich V (1993). Introduction to Centrospermae. In K. Kubitzki, J. G. Rohwer, and V. Bittrich
[eds.], The families and genera of vascular plants, vol. II, Magnoliid, hamamelid, and
caryophyllid families, 13-19. Springer Verlag, Berlin, Germany.

26
Brenan JPM (1964). Chenopodium L. In Flora Europaea, Vol 1. Edited by T.G. Tutin et al.
Cambridge , U.K.pp
Bridges DC (1994). Impact of Weeds on Human Endeavours. Weed Technol. 8:392-395.
Buckler-IV ES, Ippolito A and Holtsford TP (1997).The evolution of ribosomal DNA: Divergent
paralogues and phylogenetic implications. Genetics 145:821-832.
Cardina J, Herms CP, and Doohan DJ (2002). Crop rotation and tillage system effects on weed
seedbanks. Weed Sci. 50:448-460.
Chase MW. et al. (1993) Phylogenetics of seed plants: An analysis of nucleotide sequences from
the plastid gene rbcL. Ann. Mo. Bot. Gard. 80:528-580.
Chu C, Ludford PM, Ozbun JL and Sweet RD (1978). Effects of temperature and competition on
the establishment and growth of redroot pigweed and common lambsquarters. Crop Sci.
18:308-310.
Clark LG, Zhang W and Wendel JF (1995). A phylogeny of the grass family (Poaceae) based on
ndhF sequence data. Systematic Bot. 20:436-460.
Clemants SE and Mosyakin S (2004). Chenopodium (Chenopodiaceae). In. Flora of North
America Editorial Committee [eds.] Flora of North America. volume 4. 275-299. Oxford
Press. New York, NY.
Cole MJ (1961). Interspecific relationships and intraspecific variation of Chenopodium album L.
in Britain. Watsonia 5:47-58.
Conley SP, Stoltenberg DE, Boerboom CM, and Binning LK (2003). Predicting soybean yield
loss in giant foxtail (Setaria faberi) and common lambsquarters (Chenopodium album)
communities. Weed Sci. 51:402-407.

27
Conn J S and Deck RE (1995). Seed viability and dormancy of 17 weed species after 9.7 years of
burial in Alaska. Weed Sci. 43:583-585.
Conrad JL (2008). Phylogeny and systematics of Squamata (Reptilia) based on morphology.
Bull. Am. Mus. Nat. Hist. 310:1-182.
Corriveau JL and Coleman AW (1988). Rapid screening method to detect potential biparental
inheritance of plastid DNA and results for over 200 angiosperm species. Amer. J. of
Bot.75:1443-1458.
Crawford DJ and Reynold JF (1974). A numerical study of the common narrow-leaved taxa of
Chenopodium occurring in the Western United States. Brittonia 26(4): 398-410.
Crook TM and Renner KA (1990). Common lambsquarters (Chenopodium album) competition
and time of removal in soybeans (Glycine max). Weed Sci. 38:358-364.
Crovello TJ (1968). A numeric study of the genus Salix, section Sitechinsis. Univ Calif. Publ.
Bot. 44: 1-61.
Culpepper SA (2006). Glyphosate-induced weed shifts. Weed Technol. 20:277–281.
Cummings BH (1963). The dependence of germination on photoperiod, light quality and
temperature in Chenopodium spp. Can. J. Bot. 41:1211-1233.
Curran B (2005). Herbicide Resistance Weed Update. Availabe Online:
http://weeds.cas.psu.edu/New_2005/resistance05.html.
Danquah EY, Johnson DE, Riches C, Arnold GM and Karp A (2002). Genetic diversity in
Echinochloa spp. collected from different geographic origins and within rice fields in
Côte d'Ivoire. Weed Res. 42(5):394-405.

28
Davis JI, Simmons MP and Wendel JF (1988). Data decisiveness, data quality, and incongruence
in phylogenetic analysis: an example from the monocotyledons using mitochondrial atpA
sequences. Systematic Biol. 47:282-310.
Dekker J (2003). The foxtail (Setaria) species-group. Weed Sci. 51:641-656.
Devine MD, Shukla A (2000). Altered target sites as a mechanism of herbicide resistance
Crop Protec. 19: 881-889.
Downie SR and Palmer JD (1991). Use of chloroplast DNA rearrangements in reconstructing
plant phylogenies. In Molecular Systematics (Soltis DE and Doyle JJ eds). New York:
Chapman and Hall.
Downie SR, Katz-Downie DS and Cho KJ (1997). Relationship in the Caryophyllales as
suggested by phylogenetic analyses of partial chloroplast DNA ORF2280 homolog
sequences. Amer. J. of Bot. 84 (2):253-273.
Doyle JA, Endress PK (2000). Morphological phylogenetic analysis of basal angiosperms:
comparison and combination with molecular data. Int. J. Plant Sci. 161 (Suppl.), S121-
153.
Doyle JJ (1992) Gene trees and species trees: Molecular systematics as one character taxonomy.
Systematic Bot. 17:144-163.
Doyle JJ (1993). DNA, Phylogeny, and the Flowering of plant Systematics. BioScience 43
(6):380-389.
Dubcovsky J and Dvorák J (1995). Ribosomal RNA multigene loci: nomads of the Triticeae
genomes. Genetics. 140:1367-1377.

29
Duke JL and Crawford DJ (1979). Character compatibility and phyletic relationships in several
closely related Species of Chenopodium of the Western United States. Taxon. 28(4): 307-
314.
Duke SO, Baerson SR, Rimando AM (2003). Herbicides: Glyphosate. pp 708-869 in
Encyclopedia of Agrochemicals. Plimmer JR, Gammon DW and Ragsdale NN, ed. John
Wiley & Sons, New York, NY.
Dumont M and Tardiff FJ (2002) Resistance to linuron in a Powell amaranth population. Weed
Sci. Soc. Am. Abstr. 42:49-50.
Dvořák F (1983). A contribution to the study of Chenopodium album agg. Folia Geobotanica et
Phytotaxonomica, Praha.18:29-43.
Edwards AWF and Cavalli-Sforza LL (1963). "The reconstruction of evolution." Ann. Hum.
Gen. 27:105-106.
Edwards AWF and Cavalli-Sforza LL (1964) "Reconstruction of phylogenetic trees." in Phenetic
and Phylogenetic Classification. ed. Heywood, V. H. and McNeill. London: Systematics
Assoc. Pub No. 6.
Farris JS (1983). The logical basis of phylogenetic analysis. In: Platnick N.I, Funk V.A, editors.
Advances in Cladistics. 2:7-36. Columbia University Press; New York.
Feliner GN and Rossello JA (2007). Better the devil you know? Guidelines for insightful
utilization of nrDNA ITS in species-level evolutionary studies in plants. Mol. Phylo.
Evol. 44:911-919.
Felsenstein J (1981). "Evolutionary trees from DNA sequences: A maximum likelihood
approach. J. Mol. Evol. 17: 368-376.
30
Fior S, Karis PO, Casazza G, Minuto L, Sala F (2006). Molecular phylogeny of the
Caryophyllaceae (Caryophyllales) inferred from chloroplast matK and nuclear rDNA ITS
sequences. Amer. J. Bot. 93:399-411.
Fischer DW, Harvey RG, Bauman TT, Phillips S, Hart SE, Johnson GA, Kells JJ, Westra P
and Lindquist J (2004). Common lambsquarters (Chenopodium album) interference with
corn across the Northcentral United States. Weed Sci. 52 (6): 1034-1038.
Gangopadhyay G, Das S and Mukherjee KK (2002). Speciation in Chenopodium in West
Bengal, India. Genet. Res. Crop Evol. 49:503-510.
Gielly L and Taberlet P (1994). The use of chloroplast DNA to resolve plant phylogenies:
noncoding versus rbcL sequences. Mol. Biol. Evol. 11:769-777.
Gilmartin AJ (1969). The quantification of some plant-taxa circumscriptions. Amer. J. Bot.
56:654-663.
Giusti L (1970). El genero Chenopodium in Argentina I. Numero de cromosomos. Darwiniana
16:98-105.
Hagood, E. S., Jr. 1989. Control of triazine-resistant smooth pigweed (Amaranthus hybridus) and
common lambsquarters (Chenopodium album) in no-till corn (Zea mays). Weed Technol.
3:136–142.
Hajibabaei M, Singer GAC, Hebert PDN and Hickey DA (2007). DNA barcoding: how it
complements taxonomy, molecular phylogenetics and population genetics. TRENDS in
Gen. 23 (4):167-172.
Harder DB, Sprague CL, Difonzo CD, Renner KA, Ott EJ and Johnson WJ (2007). Influence of
stem-boring insects on common lambsquarters (Chenopodium album) control in soybean
with glyphosate. Weed Technol. 21:241–248.

31
Harper JL (1956). The evolution of weeds in relation to the resistance to herbicides. Proc. 3rd
BR.
Weed Control Conf. 1:179-188.
Heap I (2010). The International Survey of Herbicide Resistant Weeds. Online. Internet. May
2010. Available www.weedscience.com
Heiser CB, Soria J and Burton DL (1965). A numerical taxonomic study of Solanum species and
hybrids. Amer. Naturalist. 99:471-488.
Hershkovitz MA (1989). Phylogenetic Studies in Centrospermae: A Brief Appraisal. Taxon.
38(4):602-610.
Hilgenfield KL, Martin AR, Mortensen DA and Mason SC (2004). Weed management in
glyphosate resistant soybean system: Weed species shifts. Weed Technol. 18:284-291.
Hirschberg J and McIntosh L (1983) Molecular basis of herbicide resistance in Amaranthus
hybridus. Science. 222:1346–1349
Holm LG, Plucknett DL, Pancho JV and Herberger JP (1977). Chenopodium album L.
Chenopodiaceae, goosefoot family. Pages 84–91 In The World's Worst Weeds:
Distribution and Ecology. Honolulu, HI: University Press of Hawaii.
Hoot S, Culham BA and Crane PR (1995). The utility of atpB gene sequences in resolving
phylogenetic relationships: comparison with rbcL and 18S ribosomal DNA sequences in
the Lardizabalaceae. Ann. Mo. Bot. Gard. 82:194-208.
Huelsenbeck JP (1995). Performance of phylogenetic methods in simulation. Systematic Biol.
44:17-48.
Huelsenbeck JP and Ronquist F (2001). MrBayes: Bayesian inference in phylogenetic trees.
Bioinformatics.17: 754–755.

32
Iljin MM (1936). Chenopodiaceae. 2-354 in V.L. Komorov ed., Flora USSR . Akademiia Nauk,
Leningrad.
James TK, Rahman A and Mellsop JM (2005). Fathen (Chenopodium album): A biotype
resistant to Dicamba. New Zealand Plant Protection 58:152-156.
Jansen RK and Palmer JD (1988). Phylogenetic implication of chloroplast DNA restriction site
variation in Mutisieae (Astereceae). Amer. J. Bot. 75:753-766.
Jasieniuk M, Brûlé-Babel A and Morrison IN (1996). The evolution and genetics of herbicide
resistance in weeds. Weed Sci. 44(1):176-193.
Jeschke MR and Stoltenberg DE (2006). Weed community composition after eight years of
continuous glyphosate use in a corn–soybean annual rotation. Proc. N. Cent. Weed Sci.
Soc. 58:59.
Johnson LA and Soltis DE (1994). matK DNA sequence and phylogenetic reconstruction in
Saxifragaceae. Systematic Bot. 19: 143-156.
Judd W S and Ferguson IK (1999). The genera of Chenopodiaceae in the southeastern United
States. Harvard Pap. Bot. 4:365-416.
Kadereit G, Gotzek D, Jacobs S and Freitag H (2005). Origin and age of Australian
Chenopodiaceae. Organisms, Diversity and Evolution. 5:59-80.
Kelchner SA and Thomas MA (2007). Model use in phylogenetics: nine key questions. Trends in
Ecol. and Evol. 22:87-94.
Kidd KK and Sgaramella-Zonta LA(1971). Phylogenetic analysis: Concepts and methods. Amer.
J. Hum. Gen. 23:235-252.
Kim KJ and Jansen RK (1995). ndhF sequence evolution and the major clades in the sunflower
family. Proc. Natl. Acad. Sci., USA. 92: 10379-10383.

33
Kishore GM, Shah DM (1988) Amino acid biosynthesis inhibitors as herbicides. Annu. Rev.
Biochem. 57:627-663.
Kniss AR, Miller SD, Wilson RG and Westra PH (2006). Response of two common
lambsquarters biotypes to glyphosate. Proc. N. Cent. Weed Sci. Soc. 61:168.
Kron KA, Judd W S, Stevens P F, Crayn DM, Anderberg AA, Gadek PA, Quinn C J and
Luteyn JL(2002). Phylogenetic classification of Ericaceae: Molecular and morphological
evidence. Bot. Review. 68:335-423
Kurashinge NS and Agarwal AA (2005) Phenotypic plasticity to light competition and herbivory
in Chenopodium album (Chenopodiaceae). Amer. J. of Bot. 92(1):21–26.
Kuzoff RK, Sweete JA, Soltis DE, Soltis PS and Zimmer EZ (1998). The phylogenetic potential
of entire 26S rDNA sequence in plants. Mol. Biol. Evol. 15:251-263.
Larget B and Simon DL (1999). Markov chain Monte Carlo algorithms for the Bayesian analysis
of phylogenetic trees. Mol. Biol. Evol.16: 750-759.
Laroche J, Li P and Bousquet J (1995) Mitochondrial DNA and Monocotdicot divergence time.
Mol. Biol. Evol. 12:1151-1156.
Liu J-S and Schardl SL (1994). A conserved sequence in internal transcribed spacer 1 of plant
nuclear rRNA genes. Plant Mol. Biol. 26:775-778.
Loux M and Stachler J (2005). Lambsquarters control issues in roundup ready soybeans. Online
Internet. July 2009. Available http://corn.osu.edu/index.php?setissueID=66#B.
Luo H and Boutry M (1995) Phylogenetic relationships within Hevea brasiliensis as deduced
from a polymorphic mitochondrial DNA region. Theor. Appl. Genet. 91:876-884.
Madsen, S. B. 1962. Germination of buried and dried stored seeds. III. 1934-1960. Int. Seed
Test. Assoc. Proc. 27:920–928.

34
Marshall HD, Newton C and Ritland K (2001). Sequence-repeat polymorphisms exhibit the
signature of recombination in Lodgepole Pine chloroplast DNA. Mol. Biol Evol.
18:2136-2138.
Mason SL et al. (2005), Development and use of microsatellite markers for germplasm
characterization in quinoa (Chenopodium quinoa Willd.). Crop Sci. 45:1618-1630.
Mathew S, Lavin M and Sharrock RA (1995). Evolution of the Phytochrome Gene Family and
Its Utility for Phylogenetic Analyses of Angiosperms. Ann. Mo. Bot. Gard. Vol. 82
(2):296-321.
Maude PF (1940). Chromosome numbers in some British plants. New Phtol. 39:17.
Maughan PJ et al. (2006) Molecular and cytological characterization of ribosomal RNA genes
in Chenopodium quinoa and Chenopodium berlandieri. Genome. 49:825-839.
Mengistu LW, Mueller-Warrant GW, Liston A and Barker RE (2000). psbA mutation (valine
(219) to isoleucine) in Poa annua resistant to metribuzin and diuron. Pest Mgmt. Sci.
56:209-217.
Michener CD and Sokal RR (1957). A quantitative approach to a problem of classification.
Evolution.11:490-499.
Miller JS, Brower AVZ and DeSalle R (1997). Phylogeny of the neotropical moth tribe Josiini
(Notodontidae: Dioptinae): comparing and combining evidence from DNA sequences
and morphology. Biol. J. Linn. Soc. 60:297-316.
Moquin-Tandon A (1840). Chenopodearum Monographica Enumeratio Paris, France: Loss.
Murr J (1904). In Urban, I. and Grabner P, Festchrift fur P. Ascheron. Leipzig.
Murr J (1927). Nochmals uber gute und schelechte Arten und uber Bastarde. Alg Bot. Z. 33-245.

35
Oettmeier W (1999). Herbicide resistance and supersensitivity in photosystem II. Cell. Mol. Life
Sci. 55:1255-1277.
Olmstead RG and Palmer JD (1994). Chloroplast DNA systematic: A review of methods and
DNA analysis. Amer. J. Bot. 81: 1205-1224.
Ornduff R and Crovello TJ (1968). Numeric taxonomy of Limnanthaceae. Amer. J. Bot. 55: 173-
182.
Owen R (1843). Lectures on the comparative anatomy and physiology of the invertebrate
animals, delivered at the Royal College of Surgeons, in 1843, Longman, Brown, Green
and Longmans, London.
Page RDM and Holmes EC (2007). Molecular evolution: A phylogenetic approach. pp 191-193.
Blackwell Science Ltd. Oxford.
Palmer JD (1992). Mitochondrial DNA in plant systematic: Applications and limitations. In
Molecular Systematic of plants, eds. Soltis, P.S., Soltis, D.E. and Doyle, J.J. pp 36-49.
Chapman and Hall, New York.
Palmer JD and Herbon LA (1988). Plant mitochondrial DNA evolves rapidly in structure, but
slowly in sequence. J. Mol. Evol. 28:87-97.
Phillips AJ (2006). Homology assessment and molecular sequence alignment. Journal of
Biomedical Informatics. 39:18-33.
Pimentel D, Zuniga R and Morrison D (2005). Update on the environmental and economic costs
associated with alien-invasive species in the United States. Ecol. Econ 52:273-288.
Porter JM and Johnson LA (1998). Phylogenetic relationships of Polemoniaceae: inferences from
mitochondrial nad1b intron sequences. Aliso.17: 157-251.

36
Powles SB (2008) Evolved glyphosate-resistant weeds around the world: lessons to be learnt.
Pest Mgmt. Sci. 64(4):360-365.
Quakenbush LS and Anderson RJ (1985). Susceptibility of five species of the Solanum nigrum
complex to herbicides. Weed Sci. 33: 386-390.
Rahiminejad MR and Gornall RJ (2004). Flavenoid evidence for allopolyploidy in the
Chenopodium album aggregate (Amaranthaceae). Plant Syst. Evol. 246: 77-87.
Rahman A, James TK and Trolove MR (2008). Chemical control options for the Dicamba
resistant biotypes of Fathen (Chenopodium album). New Zealand Plant Protection 61:
287-291.
Rana TS, Narzary D and Ohri D (2010). Genetic diversity and relationships among some wild
and cultivated species of Chenopodium L. (Amaranthaceae) using RAPD and DAMD
methods. Current Sci. 98(6): 840-846.
Rettig JH, Wilson HD and Manhart JR (1992). Phylogeny of the Caryophyllales: Gene Sequence
data. Taxon 41:210-209.
Rieseberg LH (1998). Molecular ecology of hybridization. In Advances in Molecular Ecology
(Carvalho GR ed) Burke, Virginia, USA: IOS Press.
Ritter RL and Menbere H (2001). Preemergence and postemergence control of triazine-resistant
common lambsquarters (Chenopodium album) in no-till Corn (Zea mays). Weed Technol.
15 (4): 879-884.
Rodman JE (1990). Centrospermae revisited. Plant Taxon. 39:383-393.
Ruas PM, Bonifacio A, Ruas CF, Fairbanks DJ and Andersen WR (1999). Genetic relationship
among 19 accessions of six species of Chenopodium L., by random Amplified
Polymorphic DNA fragments (RAPD). Euphytica. 105: 25-32.

37
Ryan GF (1970) Resistance of common groundsel to simazine and atrazine. Weed Sci. 18: 614-
616.
Saiki RK, Gelfand DH, Stoffel S, Scharf S, Higuchi R, Horn GT, Mullis KB and Erlich HA
(1988). Primer-directed enzymatic amplification of DNA with thermostable DNA
polymerase. Science. 239:487- 491.
Sanderson SC, Ge-Ling C, McArthur ED and Stutz HC (1988). Evolutionary loss of flavonoids
and other chemical characters in the chenopodiaceae. Bioche. Syst. and Eco.1 (2):143-
149.
Sang T (2002) Utility of low copy nuclear gene sequences in plant phylogenetics. Critical
Reviews in Bioch. Mol. Biol. 37(3):121-147.
Santelmann PW and Meade JA (1961).Variation in morphological characteristics and dalapon
susceptibility within the species Setaria lutescens and S. faberii. Weeds. 9:406.
Schönenberger J and Conti H (2003). Molecular phylogeny and floral evolution of Penaeaceae,
Oliniaceae, Rhyncocalycaceae, and Alzateaceae (Myrtales). Amer. J. Bot. 90:293-309.
Schuster CL, Shoup DE and Al-Khatib K (2007). Response of common lambsquarters
(Chenopodium album) to glyphosate as affected by growth stage. Weed Sci. 55:147-151.
Shaw J, Lickey EB, Beck JT, Farmer SB, Liu W, Miller J, Siripun KC, Winder CT, Schilling EE
and Small RL (2005). The tortoise and the hare II: relative utility of 21 noncoding
chloroplast DNA sequences for phylogenetic analysis. Amer. J. Bot. 92:142-166.
Shaw J, Lickey EB, Schillling EE and Small RL (2007) Comparison of whole chloroplast
genome sequences to choose noncoding regions for phylogenetic studies in angiosperms:
the tortoise and the hare III. Amer. J. Bot. 94(3):275-288.

38
Shaw JE and Small RL (2005). Chloroplast DNA phylogeny and phylogeography of the North
American plums (Prunus subgenus Prunus section Prunocerasus, Rosaceae). Amer. J. of
Bot. 92:2011-2030.
Sikorski JA and Gruys KJ (1997). Understanding glyphosate's molecular mode of action with
EPSP synthase: Evidence favoring an allosteric inhibitor model. Acc. Chem. Res.30
(1):2-8
Small RL, Richard C, Wendel JF (2004). L. A. S. JOHNSON Review No. 2. Use of nuclear
genes for phylogeny reconstruction in plants. Aust. Syst. Bot. 17:145-170.
Small RL, Ryburn JA, Cronn RC, Seelanan T and Wendel JF (1998). The tortoise and hare:
choosing between noncoding plastome and nuclease Adh sequences for phylogeny
reconstruction in a recently diverged plant group. Amer. J. Bot. 85:1301-1315.
Soltis DE and Soltis PS (1998). Choosing an approach and an appropriate gene for phylogenetic
analysis. In Molecular systematic of plants II: DNA sequencing pp 1-42.
Sosnoskie LM, Herms CP and Cardina J (2006). Weed seedbank community composition in a
35-yr-old tillage and rotation experiment. Weed Sci. 54:263-273.
Standley PC (1916). Chenopodiales. Chenopodiaceae. North American Flora. 21(1):1-72.
Sullivan J and Swofford DL (1997). Are Guinea pigs rodents? The importance of adequate
models in molecular phylogenetics. J. Mamm. Evol. 4:77-86.
Sullivan J and Joyce P (2005) Model Selection in Phylogenetics. Annu. Rev. Ecol. Evol. Syst.
36:445-66.
Swafford K L (1999). PAUP 4.0: phylogenetic analysis with parsimony (and other methods),
version 4.0b2a. Sinauer Associates Inc., Sunderland, Mass.

39
Tautz D, Arctander P, Minelli A, Richard HT and Vogler AP (2003). A plea for DNA taxonomy.
TRENDS in Ecol. and Evol. 18(2):70-74.
USDA, NRCS. (2008). The PLANTS Database (http://plants.usda.gov, March, 2009). National
Plant Data Center, Baton Rouge, LA 70874-4490 USA.
Wahl HA (1954). A preliminary study of the genus Chenopodium in North America. Bartonia
27:1-46.
Wahlberg N, Braby MF, Brower AV, de Jong R, Lee MM, Nylin S, Pierce NE, Sperling FA,
Vila R, Warren AD (2005). Synergistic effects of combining morphological and
molecular data in resolving the phylogeny of butterflies and skippers. Proc. Biol. Sci.
272:1577-1586.
Wang RL and Dekker J (1995). Weedy adaptation in Setaria spp. III. Variation in herbicide
resistance in Setaria spp. Pestic. Bichem. and Physiol. 51:99-116.
Warwick SI and Black L (1981). The relative competitiveness of atrazine susceptible and
resistant populations of Chenopodium album and C. strictum. Can. J. Bot. 59:689-693.
Watson S (1874). A revision of the North American Chenopodiaceae . Proc Am. Acd. Arts Sci.
9:93-99.
Westhoven AM, Davis VM, Gibson KD, Weller SC and Johnson WG (2008b). Field presence of
glyphosate-resistant horseweed (Conyza canadensis), common lambsquarters
(Chenopodium album), and giant ragweed (Ambrosia trifida) biotypes with elevated
tolerance to glyphosate. Weed Technol. 22(3):544-548.
Westhoven AM, Kruger GR, Gerber CK, Stachler JM and Johnson WG (2008a).
Characterization of selected common lambsquarters (Chenopodium album) biotypes with
tolerance to glyphosate. Weed Sci.56:685-691.
40
Wetzel DK, Horak MJ, and Skinner DZ (1999). Use of PCR-based molecular markers to identify
weedy Amaranthus species. Weed Sci. 47: 518-523.
Wiese AM and Binning (1987). Calculating the threshold temperature of development for weeds.
Weed Sci. 35:177-179.
Wilson HD (1980). Artificial hybridization among species of Chenopodium sect. Chenopodium.
Systematic Bot. 5:253-263.
Winter P and Kahl G (1995). Molecular marker technologies for plant improvement. World J.
Microbiol. Biotechnol. 11:438-48.
Wolf PG (1997) Evaluation of atpB nucleotide sequences for phylogenetic studies of ferns and
other pteridophytes. Amer. J. Bot. 84: 1429-1440.
Wolfe KH, Li H and Sharp PM (1987). Rates of nucleotide substitution vary greatly among plant
mitochondrial, chloroplast, and nuclear DNAs. Proc. Natl. Acad. Sci. USA. 84: 9054-
9058.
Wolfe KH, Sharp PM, Li W-H (1989) Rates of synonymous substitution in plant nuclear genes. J
Mol. Evol. 29:208-211.
Xu F and Sun M (2001). Comparative analysis of phylogenetic relationships of grain Amaranths
and their wild relatives (Amaranthus; Amaranthaceae) using internal transcribed spacer,
amplified length polymorphism, and double-primer fluorescent intersimple sequence
repeat marker. Mol. Phylo. Evol. 21:372-387.
Zhou D, Wang T and Valentine I (2005). Phenotypic plasticity of life-history characters in
response to different germination timing in two annual weeds. Can. J. Bot. 83: 28-36.

41
CHAPTER 2
RESPONSES OF CHENOPODIUM SPECIES AND COMMON LAMBSQUARTERS
POPULATIONS FROM NORTH CENTRAL STATES TO GLYPHOSATE
2.1 Abstract
Experiments were conducted to determine the responses to glyphosate of 12 accessions
representing 7 Chenopodium species, and 33 populations of Chenopodium from agricultural
fields across the North Central states. Glyphosate responses of Chenopodium species were
variable within and among the different species. One interesting finding was that C. ficifolium, C.
berlandieri 2 and C. simplex were more tolerant to glyphosate than the four accessions of C.
album, which is presumed to be the most common weed species in this genus. Variability to
glyphosate was observed among the accessions of C. album and C. berlandieri. C. album 4 had
more tolerance than other C. album accessions, and C. berlandieri 2 had significantly higher
tolerance to glyphosate than C. berlandieri 3 and C. bushianum. When the 33 populations were
evaluated for response to glyphosate, we observed variability within and among the populations
from different North Central states. The populations from Iowa were more tolerant to glyphosate,
but high tolerance was also observed in a few populations (IN6, IL3, IL7, IL8 KS21 and ND7)
from Indiana, Illinois, Kansas and North Dakota. Our results indicate that if there are mixed
populations of different Chenopodium species or biotypes in a field, the control of these weeds
will be difficult due to the differential tolerance of the plants to glyphosate.

42
2.2 Introduction
The genus Chenopodium includes about 150 plant species and most of them are annual,
herbaceous flowering plants, commonly known as goosefoot. The genus is distributed
throughout Asia, America and Europe (Ruas et al. 1999). Although some species of the genus
have been domesticated and used for their seeds (C. quinoa, C. berlandieri subsp. nuttalliae,
chia and huautzontle) and vegetative parts (C. album and C. giganteum) in Asia and Europe
(Pratap et al. 1998), the genus is more commonly known for having some of the most
troublesome weed species (Cole, 1961).
Chenopodium album is among the most important weed species in this genus, and is
considered among the ten most important weeds in the world (Holm et al. 1977). Characters that
make C. album a successful weed include its ability to germinate under different environmental
conditions (Chu et al. 1978; Cummings 1963; Hilgenfield et al. 2004 and Schuster et al. 2007),
phenotypic plasticity under different environments, and prolific seed production (Holm et al.
1977). Chenopodium seeds can also remain dormant and viable in the soil for many years (Conn
and Deck 1995; Madsen 1962), which maximizes their fitness while reducing their losses due to
sib competition in the fields (Hyatt and Evans 1998).
There are about 20 species of Chenopodium that are present in Illinois (USDA, NRCS
2008), and some of the species (C. album, C. berlandieri, C. bushianum, C. strictum, C. murale,
C. ficifolium and C. hybridum) are recognized as agricultural weeds. Several variants of these
species also have been reported by Aellen (1929a, 1929b), who recognized 34 sub-species,
varieties and forms of common lambsquarters in North America.
Due to taxonomic difficulties in identifying Chenopodium species, most of the weedy
Chenopodium species in agricultural fields are generally referred to as common lambsquarters

43
(Chenopodium album L.). In the last decade, there have been increased reports of common
lambsquarters being a problem in corn and soybean fields across North Central states (Conley et
al. 2003; Fischer et al. 2004). The incidence of lambsquarters has increased under no-tillage
systems (Cardina et al. 2002; Sosnoskie et al. 2006). Common lambsquarters became one of the
dominant weed species in long-term experiments evaluating weed species shifts in glyphosate-
resistant cropping systems. Results from experiments with soybean-corn rotation indicate the
dominance of common lambsquarters in these fields (Jeschke and Stoltenberg, 2006). Field
surveys conducted in Indiana from 2003 to 2005 reported that common lambsquarters plants
were present in 11 percent of randomly sampled soybean fields (Westhoven et al. 2008a).
Season-long interference by common lambsquarters in soybean fields has decreased soybean
yield by 20 to 61 percent (Conley et al. 2003; Crook and Renner, 1990).
Within Chenopodium, there are 42 resistant biotypes in 17 countries (Heap, 2010) and the
majority of these biotypes are resistant to photosystem II inhibitors, followed by acetolactate
synthase (ALS) inhibitors, synthetic auxins, ureas and amides (Heap, 2010). In the US, there are
21 biotypes that are resistant to either Photosystem II (19) or ALS inhibitors (2) and there are
also reports of tolerance in some biotypes to glyphosate (Westhoven 2008a, b). A recent survey
conducted by weed extension specialists in 2007 reported that common lambsquarters is one of
the seven genera or species that represents 80 percent of the herbicide resistant biotypes (Scott et
al. 2009).
Inter- and intra-specific differences in response to herbicides are common in weeds as
well as in crops (Hayes, 1959; Smith and Illnicki, 1973; Wax et al. 1974). Within weed species,
there are several studies that have shown differential responses of weeds to herbicides. Some of
the commonly studied genera include Amaranthus (Coetzer et al. 2002; Xu and Sun, 2001),
44
Chenopodium (Warwick and Black, 1981), Echinochloa (Damalas et al. 2008), Setaria (Wang
and Dekker, 1995) and Trifolium (Smith, 1985). This difference in response to herbicides can be
attributed to differences in the physiology of weeds affecting herbicide absorption or
translocation (Baylis, 2000; Klingman, 1961), differences in plant morphology (Damalas et al.
2008), and the variability in the species to metabolize the herbicides to non-toxic products
(Smith, 1985).
The incidence of common lambsquarters resistant to triazine herbicides and ALS
inhibitors is reported to be more common than to glyphosate, but in recent years, there have been
several reports demonstrating less control of some Chenopodium populations by glyphosate
(Westhoven et al. 2008a). Similar reports of reduced sensitivity to common lambsquarters have
also been documented by weed scientists across the Midwestern states (Curran, 2005; Harder et
al. 2007; Kniss et al. 2006; Loux et al. 2004; Schuster et al. 2007).
Although there are several reports of herbicide tolerance in the Chenopodium genus, very
few studies have been conducted that look at the responses of different weedy Chenopodium
species and common lambsquarters populations to glyphosate under controlled environmental
conditions. Such a study would be important to test the hypothesis that there will be species
shifts in fields having species with different herbicide tolerances. Thus, the aim of the study was
to determine the responses to glyphosate of different Chenopodium spp. and populations present
in the North Central states.

45
2.3 Materials and Methods
Plant Materials
The plant materials selected for this study were obtained from the North Central Regional
Plant Introduction Station (NCRPIS), Ames, Iowa. Chenopodium species prevalent in North
Central states were selected based on the information provided in the Flora of North America
(Clemants and Mosyakin, 2004). In the present study, seeds were obtained for 12 accessions
representing eight Chenopodium species, and the information about the species and their
accession numbers is provided in Table 2.1.
For the study including common lambsquarters populations, seeds were provided by
colleagues from six North Central states (Illinois, Indiana, Iowa, Kansas, Missouri and North
Dakota). In a preliminary study, randomly pooled seeds from plants within a single field showed
very limited variability in their response to glyphosate; therefore, the seeds from 2 to 5 plants
from a single field were pooled and used for herbicide screening. This method was useful in
evaluating a large number of seed lots under limited space and resources. The information
regarding the common lambsquarters populations from fields across the North Central states is
presented in Table 2.2.

46
Table 2.1. List of the Chenopodium species used in glyphosate screening. The seeds were
obtained from North Central Regional Plant Introduction Station, Ames, Iowa.
S.No Genus
Accession No.
(NCRPIS) Origin Year collected
1 C. album 1 Ames 23855 Poland 1997
2 C. album 2 PI 605700 MI, USA 1994
3 C. album 3 PI 262168 France 1959
4 C. album 4 PI 605701 CO, USA 1983
5 C. ficifolium Ames 25246 Switzerland 1999
6 C. murale PI 614895 Portugal 1998
7 C. bushianum PI 608030 IL, USA 1995
8 C. berlandieri 2 PI 595316 IA, USA 1995
9 C. berlandieri 3 PI 612858 UT, USA 2000
10 C. simplex Ames 21981 MI, USA 1994
11 C. strictum1 Ames 23893 Germany 1997
12 C. rubrum1 Ames 23860 Poland 1997

47
Table 2.2. List of the Chenopodium populations from North Central states.
Population Location Crop
IA20 N. Harding Co., IA Soybean
IA21 S. Harding Co., IA Soybean
IA22 W. Story Co., IA Soybean
IA23 S. Story Co., IA Soybean
IA24 Adair Co., IA Soybean
KS20 S. Riley Co., KS Soybean
KS21 E. Doniphan Co., KS Soybean
KS22 C. Doniphan Co., KS Soybean
MO10 Platte Co., MO Corn
MO6 Boone Co., MO Pumpkin
ND14 Ransom Co., ND -
ND2 Steele Co., ND -
ND3 Trail Co., ND -
ND5 Grand Forks Co., ND -
ND 7 Griggs Co., ND -
ND9 Barnes Co., ND -
IL1 Champaign Co., IL Soybean
IL2 Clark Co., IL Soybean
IL3 Kankakee Co., IL Soybean
IL4 Piatt Co., IL Soybean
IL5 Putnam Co., IL Between field
IL6 Ogle Co., IL Corn
IL7 Iroquois Co., IL Soybean
IL8 LaSalle Co., IL Soybean
IL9 Lee Co., IL Corn
IL10 Livingston Co., IL Soybean
IN2 Benton Co., IN Soybean
IN3 Fountain Co., IN Soybean
IN4 Fountain Co., IN Soybean
IN5 Huntington Co., IN Soybean
IN6 Jackson Co., IN Soybean
IN9 Montgomery Co., IN Soybean
IN11 Ripley Co., IN Soybean
- Data not available for the crops

48
Common lambsquarters seeds have high dormancy (Williams 1962), so before using the
seeds for herbicide evaluation, the seeds were treated to break the dormancy. This procedure
involved treating the seeds with 1:1 bleach: distilled water and intermittently vortexing for 10
min. Then the seeds were rinsed twice with distilled water before suspending the seeds in
autoclaved 0.2 percent agar. The treated seeds were then stored at 4oC for at least a month before
sowing in the greenhouse.
Growth Conditions
Chenopodium seeds were first grown in flats using a medium that was a non sterilized
mixture of LC11 and soil:peat:sand in 1:1 ratio with osmocote, a 14:14:14 slow release fertilizer,
added to the soil. At the cotyledon stage, the plants were transferred into sectioned flats. The
seedlings were maintained in sectioned flats, one seedling in each section having approximately
10 g of the above-mentioned medium, until they were 4-5 cm tall. Plants were again transferred
into 20 cm round plastic pots containing the same non-sterile medium. It has been reported that
sensitivity of Chenopodium seedlings to glyphosate is greatly reduced when the plants were
grown in steamed soil (Schafer et al. 2009).
The greenhouse room was maintained at 28/22°C day/night, with supplemental light
(minimum of 800 μmol·m−2
·s−1
photon flux at the plant canopy) provided by mercury halide and
sodium vapor lamps programmed for a 16-hr photoperiod. Plants were watered daily.
Glyphosate Applications
To study the responses of different Chenopodium species and common lambsquarters
populations, 5 seedlings from each species or biotype from North Central states were treated at

49
10 to 14 cm height with the potassium salt of glyphosate (Roundup WEATHERMAX2) at 0, 800,
1600 or 3200 g a.e. ha-1
along with 2.5% ammonium sulfate (AMS). These rates correspond to
roughly 0X, 1X, 2X and 4X the recommended rate used in fields to control weeds. In a
preliminary study (data not shown), glyphosate at 800 g ha-1
controlled 95 percent of our
sensitive biotype (a population from North Dakota referred as ND5), which was also used as
sensitive control in the greenhouse experiments.
Herbicide treatments were applied with a compressed-air, moving-nozzle laboratory
sprayer equipped with an 80° flat fan TeeJet3 nozzle delivering 187 liters·ha
−1 of water at 207
kPa. The nozzle was maintained at 40-45 cm above the plant canopy to ensure proper coverage
with herbicide.
Two weeks after glyphosate applications, the treated plants were evaluated for herbicide
injury. The aboveground biomass of each common lambsquarters seedling was harvested to
determine the decrease in dry weight due to the herbicide injury. The harvested seedlings were
oven dried at 68ºC for 72 hrs and weighed.
Statistical Analysis
The experiment was conducted as a completely randomized design. To study the
responses to glyphosate of different Chenopodium species, the experiment was replicated twice.
Based on the homogeneity of variance test (Levene‟s test), which determines the interaction
between two replications, no significant effect of replications (p=0.05) was found, and the data
from the two replications were pooled. Using the Proc GLM procedure in SAS4, the mean
differences between the Chenopodium species and populations were calculated based on the LSD
values (α=0.05).

50
A separate study was conducted to determine if there is variability in Chenopodium
populations from the North Central states. For this study, 33 populations of Chenopodium were
selected from six states (Illinois, Indiana, Iowa, Kansas, Missouri and North Dakota) and they
were compared to a glyphosate susceptible population (ND5). The experiment was replicated
twice, however for the second run, due to the limitation of conducting an experiment involving a
large number of populations, we reduced the number of populations by selecting 19 populations
from the original 33 that spanned the range of responses observed in the first run. The data from
two replicates for populations across North Central states were pooled as the homogeneity of
variance test (p=0.05) was not significant for the two runs. The Spearman rank correlation
between the two replications was 0.84 which was significant at p<0.001, indicating similar
response of Chenopodium populations to glyphosate in both the replications.
To compare the responses of different plants to glyphosate, the more common procedure
is to analyze data using nonlinear logistic model. However, in this experiment we cannot use
data to fit a logistic model as there were too few low doses, which resulted in failure of the
model to converge. Low doses (between 0 and 800 gm a.e ha-1
) were not used as our objective
was to determine variable response in species and not to quantify levels of resistance by
calculating the ED50 values.
Results are presented as dry weight (percent of untreated control) for comparing the
effect of various doses of glyphosate (0, 800, 1600 and 3200 g a.e ha-1
) on different
Chenopodium species and populations across the North Central states.

51
2.4 Results and Discussions
Interspecific Variability Within Chenopodium Species to Glyphosate
Glyphosate injury to Chenopodium species increased with increasing glyphosate dose.
Injury symptoms included stunting and chlorosis of treated plants within 10 days after treatment
(DAT) and eventual plant death within 14-16 DAT in the susceptible plants; however the tolerant
plants slowly recovered from injury. These findings were similar to other studies on common
lambsquarters (Schuster et al. 2007). Figure 2.1 and Table 2.3 present the mean values of dry
weight, expressed as percent of untreated control averaged across 800, 1600 and 3200 g a.e ha-1
of glyphosate.
Figure 2.1. Mean dry weight of Chenopodium averaged across 800, 1600 and 3200 g a.e. ha-1
of
glyphosate. Bars followed by same letter are not different according to Fischer‟s LSD test
(p<0.05).
As shown in Figure 2.1, when we average the herbicide dose and look at the variability in
response to glyphosate, we found C. berlandieri 2 and C. ficifolium had significantly more
tolerance than other accessions, indicating variability to glyphosate within the species. The more
0
5
10
15
20
25
30
35
40
Dry
We
igh
t (p
erc
en
t o
f u
ntr
eat
ed
co
ntr
ol)
Chenopodium spp. from NCRPIS
EDE DE
CDECDE CDEBCD BCD
BCB
A
EDE DE
CDECDE CDEBCD BCD
BCB
AA
BC

52
detailed Figure 2.2 shows the responses of various Chenopodium species to individual doses of
glyphosate.
At the 1X dose of glyphosate (800 g a.e ha-1
), there was a difference in tolerance to
glyphosate within and among Chenopodium species. Differences were observed between C.
album biotypes (different accessions of C. album) and morphologically similar species such as
C. berlandieri, C. strictum and C. ficifolium. Compared to untreated control plants, at 800 gm a.e
ha-1
dose of glyphosate, the percent reduction in dry weight of C. album ranged from 70 to 90
percent of the untreated control. In contrast, dry weights of accessions of C. berlandieri ranged
from 37.13 to 39.57 percent of the untreated control.
Figure 2.2. Glyphosate responses of different Chenopodium spp. from North Central Regional
Plant Introduction Station.
When we compared accessions of C. album and C. berlandieri to C. ficifolium, which is
another weedy species in the Chenopodium complex, the reduction in dry weight in C. ficifolium
was only 50 percent as compared to untreated control, indicating that there is more tolerance to
glyphosate than other species with similar morphology (i.e. C. album, C. berlandieri).
0
10
20
30
40
50
60
Dry
Wei
gh
t (P
erce
nt
of
Co
ntr
ol)
Chenopodium species from NCRPIS
1X
2X
4X
53
Comparing other weedy species such as C. strictum, C. murale, C. rubrum and C. simplex to the
susceptible control, reduction in dry weight indicates there was not a significant difference in
tolerance to glyphosate among these species. When the plants of C. album 4, C. berlandieri 1, C.
ficifolium and C. simplex were treated with 4X dose (3200 g a.e/ha) of glyphosate, some of the
plants survived and were healthy enough to complete reproductive growth.
The data were also analyzed by excluding the highest dose (3200 g a.e ha-1
) and
averaging the results of 1X and 2X doses of glyphosate on various Chenopodium species (Fig
2.3). The highest dose was excluded because the dry weight expressed as percent control values
at 4X dose were close to 0. So, by including only 800 (1X) and 1600 g a.e ha-1
(2X), we obtained
a better representation of variability in plants when they were treated with glyphosate at rates
equivalent to field use rates. The results from Fig 2.3 indicated that C. ficifolium and C.
berlandieri 2 were significantly more tolerant to glyphosate that other Chenopodium species and
the susceptible biotype.
Variability in response to glyphosate was also observed among the species (Figure 2.2
and 2.3). Comparison between C. album 1, 2, 3 and 4 showed that C. album 4 was more tolerant
to glyphosate than other C. album accessions. Similarly, among different C. berlandieri
accessions, plants from C. berlandieri 2 showed more tolerance to glyphosate than C. berlandieri
3 or C. bushianum, which is often regarded as subspecies of C. berlandieri. This variability in
response among different species is important because under herbicide selection, the species
composition can change to more tolerant species in the ecosystem (McNeill, 1976).

54
Figure 2.3. Response of Chenopodium spp. averaged across 800 and 1600 g a.e. ha-1
of
glyphosate. Bars followed by same letter are not different according to Fischer‟s LSD test
(p<0.05).
05
1015202530354045
Dry
We
igh
t (P
erc
en
t o
f u
ntr
eat
ed
co
ntr
ol)
Chenopdium species
CDE
BCD
A
BC
DE DEE
BCD
B
A
DE DE
B

55
Table 2.3. Mean values for dry weight (percent of untreated control) of Chenopodium spp. and
populations from North Central states averaged over 800, 1600 and 3200 g a.e. ha-1
of
glyphosate.
Species Mean Dry Weight
(Percent of untreated
control)
Populations of
common
lambsquarters
Mean Dry Weight
(% of untreated
control)
C. album 1 (38) 9.52 BCD IA20 19.56 CD
C. album 2 (40) 11.89 BCD IA21 31.84 B
C. album 3 (40) 11.95 BCD IA22 25.21 BC
C. album 4 (39) 18.39 B IA23 29.02 B
C. berlandieri 2 (40) 30.85 A IA24 20.32 CD
C. berlandieri 3 (39) 15.19 BC IN11 14.97 DEFGHI
C. bushianum (40) 9.80 CDE IN2 15.39 DEFGH
C. ficifolium (40) 50.46 A IN3 7.77 JKL
C. murale (40) 6.40 DE IN4 11.7 EFGHIJK
C. rubrum1 (40) 6.55 DE IN5 7.48 JKL
C. simplex (40) 15.02 BC IN6 6.66 JKL
C. strictum1 (40) 9.25 CDE IN9 28.07 B
Control (39) 3.82 DE KS20 5.05 KL
KS21 32.0 B
KS22 9.12 GHIJKL
MO10 10.14 GHIJKL
MO6 10.44 FGHIJKL
ND14 9.47 GHIJKL
ND2 17.15 DEF
ND3 4.86 KL
ND7 4.51 L
ND9 52.52 A
IL1 4.464 L
IL2 9.52 GHIJKL
IL3 17.77 DE
IL4 8.49 IJKL
IL5 8.68 HIJKL
IL6 12.17 EFGHIJK
IL7 20.45 CD
IL8 15.74 DEFG
IL9 10.15 GHIJKL
IL10 6.5 JKL
Control 4.75 L
LSD (0.05) 7.38 6.88
IA- Iowa KS-Kansas ND-North Dakota
IN-Indiana MO- Missouri IL- Illinois a Number in parentheses refer to the number of plants screened with glyphosate
b Means followed by same letter are not different according to Fischer‟s LSD test (p<0.05)

56
Table 2.4. Mean values for dry weight (percent of untreated control) of populations from North
Central states averaged over 800, 1600 and 3200 g a.e. ha-1
of glyphosate.
State Dry Weight (% of untreated control)
Iowa 25.19 A
Kansas 19.54 B
North Dakota 18.38 BC
Indiana 14.86 CD
Illinois 11.49 DE
Missoiri 10.29 E
LSD ( 0.05) 4.34
a Means followed by same letter are not different according to Fischer‟s LSD test (p<0.05)
Our finding of variability in glyphosate response is not unique and several researchers
have documented such patterns in Amaranthus, Setaria and Chenopodium spp. Differential
response within species can be attributed to differences in plant height and herbicide rates
(Coetzer et al. 2002), differences in resistance mechanism (Wang and Deker, 1995), competitive
advantage as in the case of C. album when compared to C. strictum, phenotypic plasticity and
spatial heterogeneity resulting in variability in adaptive traits such as herbicide resistance
(Warwick and Black, 1981).
Variability Among Common Lambsquarters Populations from North Central States
Variability in populations of common lambsquarters from the North Central states was
studied and reflected in Table 2.3 and Fig 2.4. Without taxonomic study, we could not
definitively classify them as C. album, so we referred to all the populations as common
lambsquarters.
Thirty three populations were tested for glyphosate response using 4 doses (0, 800, 1600
and 3200 g a.e ha-1
) of glyphosate. The samples screened included 5, 6, 3, 2, 5 and 10
populations from Iowa, Indiana, Kansas, North Dakota and Illinois fields, respectively.

57
The independent runs of the experiment were pooled and the combined analysis was done
to evaluate the variability in responses of common lambsquarters populations to glyphosate
across the North Central states (Table 2.3). The results from Table 2.3 showed that there was
difference in responses within and among the Chenopodium populations across the North Central
states. There was substantial variability within populations from different states. The average dry
weight (percent of untreated control) ranged from 52.52 (ND9) to 4.46 (IL1). The populations
from Iowa were, in general, more tolerant to glyphosate than populations from other states,
however few populations from other states (Indiana, Illinois, North Dakota, Kansas) were also
tolerant to glyphosate (Table 2.4).
When the results of 1X and 2X doses were averaged across the Chenopodium
populations, the results showed that ND9 (Figure 2.4) had a significantly higher level of
tolerance with less than 50 percent reduction in dry weight compared to untreated control,
followed by IA23, IA21, IN9 and MO10, which also had considerably high tolerance levels.
Previous reports from North Central states have also shown increase in tolerance to glyphosate in
common lambsquarters populations (Westhoven et al. 2008a; Curran, 2005; Harder et al. 2007;
Loux and Stachler, 2003; Kniss et al. 2006; Schuster et al. 2007). Some populations were not so
different than the sensitive control, as indicated by the fact that there are populations where there
was more than 90 percent reduction in dry weight of plants from Indiana (IN3, IN5, IN6),
Kansas (KS20, KS22), North Dakota (ND3, ND7, ND14), and Illinois (IL1, IL2, IL4, IL5, IL6
and IL10).
Variability is also observed among populations within a state. For instance, most
populations from North Dakota were sensitive to glyphosate with the exception of ND9. Similar
results were also observed among populations from other states (Figure 2.4 and Table 2.2).

58
Previous research on populations of Avena barbata, Avena fatua, and Clarkia williamsonii also
showed significant genetic variation in herbicide responses (Price et al. 1985). Such variability is
not uncommon and has been reported previously in Chenopodium (Hite et al. 2008, Westhoven
2008b) as well as other important weed species (Werner and Putnam, 1980; Patzoldt et al. 2002).
One reason for this variability might be repeated exposure of weeds to certain persistent
herbicides over long periods of time (Westhoven et al. 2008b).

59
Figure 2.4. Dry weight (percent of untreated control) based on the average of mean values for
two doses (800 and 1600 g a.e ha-1
) of glyphosate. Bars followed by same letter are not different
according to Fischer‟s LSD test (p<0.05).
0 10 20 30 40 50 60
Control
IL10
IL9
IL8
IL7
IL6
IL5
IL4
IL3
IL2
IL1
ND14
ND9
ND7
ND3
ND2
MO10
MO6
KS22
KS21
KS20
IN11
IN9
IN6
IN5
IN4
IN3
IN2
IA24
IA23
IA22
IA21
IA20
Dry Weight (Percent of untreated control)
Chen
opodiu
mpopula
tions
from
Nort
h C
entr
al S
tate
s
CDEC
DEB
CDE
FGHJKL
FGHIIJKL
IJKLCDE
HFL
CD
JKLEF
CFGH
L
LA
JKLL
JKLFGH
KLKL
KLHIJK
GHIJ
FG
IJKLL

60
2.5 Conclusions
The major finding from this experiment is that there is considerable variation in tolerance
levels to glyphosate among and also within the different Chenopodium spp. This can be
attributed to the fact that different species respond differently to herbicides, which can be mainly
due to different levels of herbicide absorption, translocation or metabolism, and needs to be
further tested. Our results indicate that if there are mixed populations of these species in a field,
the control of these weeds will be difficult due to the differential tolerance of the species to
herbicide. As glyphosate is the most commonly used herbicide for controlling weeds, it is
possible that there can be a shift in weed species under selection pressure to more glyphosate
tolerant Chenopodium species. As some populations and species even survived 4 times the
recommended rate for glyphosate, our result raises the concern of tolerance in these
Chenopodium species and populations to glyphosate. It also suggests that there is high potential
for a decrease in glyphosate sensitivity within common lambsquarters populations to a point
where they would not be controlled by a normal field use rate of glyphosate.
Our next step is to use DNA sequence data and classify the common lambsquarters
populations from North Central states into different species and investigate if there are more than
one Chenopodium species present in agricultural fields. Inter- and intra-specific variation in
herbicide tolerance among weedy Chenopodium species can have important implications for the
spread of herbicide resistant biotypes and genetic structure, and can help us in understanding the
adaptations of weedy Chenopodium complex.

61
2.6 Sources of Materials
1LC1 Professional Growing Mix. Sun Gro Horticulture Canada Ltd.
2 WEATHERMAX Roundup, Monsanto Company, St. Louis, MO.
3 80° flat fan nozzle, TeeJet, Spraying Systems Co., P.O. Box 7900 Wheaton, IL 60187.
4[SAS] Statistical Analysis Systems Institute, Inc., Cary, NC 27512-8000.
2.7 Literature Cited
Aellen P (1929a). Beitrag zur Systematik der Chenopodium- Arten Americas. Fedde. Report.
Spec. 26:31-64.
Aellen P (1929b). Beitrag zur Systematik der Chenopodium –Arten Americas II. Fedde, Report.
Spec. 26:119-160.
Baylis AD (2000). Why glyphosate is a global herbicide: strengths, weakness and prospects. Pest
Mgmt. Sci. 56(4):299-308.
Cardina J, Herms CP and Doohan DJ (2002). Crop rotation and tillage system effects on weed
seedbanks. Weed Sci. 50:448-460.
Chu C, Ludford PM, Ozbun JL and Sweet RD (1978). Effects of temperature and competition on
the establishment and growth of redroot pigweed and common lambsquarters. Crop Sci.
18:308-310.
Clemants SE and Mosyakin S (2004). Chenopodium (Chenopodiaceae). In. Flora of North
America Editorial Committee [eds.] Flora of North America. volume 4. 275-299. Oxford
Press. New York, NY.
Coetzer E, Al-Khatib K and Peterson DE (2002). Glufosinate efficacy in Amaranthus species in
Glufosinate resistant soybean (Glycine max). Weed Technol. 16:326-331.
62
Cole MJ (1961). Interspecific relationships and intraspecific variation of Chenopodium album L.
in Britain. Watsonia 5:47-58.
Conley SP, Stoltenberg DE, Boerboom CM, and Binning LK (2003). Predicting soybean yield
loss in giant foxtail (Setaria faberi) and common lambsquarters (Chenopodium album)
communities. Weed Sci. 51:402-407.
Conn J S and Deck RE (1995). Seed viability and dormancy of 17 weed species after 9.7 years of
burial in Alaska. Weed Sci. 43:583-585.
Crook, T. M. and K. A. Renner. 1990. Common lambsquarters (Chenopodium album)
competition and time of removal in soybeans (Glycine max). Weed Sci. 38:358-364.
Cummings BH (1963). The dependence of germination on photoperiod, light quality and
temperature in Chenopodium spp. Can. J. Bot. 41:1211-1233.
Curran B (2005). Herbicide Resistance Weed Update. Available Online:
http://weeds.cas.psu.edu/New_2005/resistance05.html.
Damalas CA, Dhima KV, Eleftherohorinos IG(2008) Morphological and Physiological Variation
among Species of the Genus Echinochloa in Northern Greece. Weed Sci. 56(3): 416-423.
Fischer DW, Harvey RG, Bauman TT, Phillips S, Hart SE, Johnson GA, Kells JJ, Westra P
and Lindquist J (2004). Common lambsquarters (Chenopodium album) interference with
corn across theNorthcentral United States. Weed Sci. 52 (6):1034-1038.
Harder DB, Sprague CL, Difonzo CD, Renner KA, Ott EJ and Johnson WJ (2007). Influence of
stem-boring insects on common lambsquarters (Chenopodium album) control in soybean
with glyphosate. Weed Technol. 21:241–248.
Hayes JD (1959). Varietal resistance to spray damage in barley. Nature, London. 183:551-552.

63
Heap I (2010). The International Survey of Herbicide Resistant Weeds. Online. Internet. May
2010. Available www.weedscience.com
Hilgenfield KL, Martin AR, Mortensen DA and Mason SC (2004). Weed management in
glyphosate resistant soybean system: Weed species shifts. Weed Technol. 18:284-291.
Hite GA, King SR, Hagood ES, and Holtzman GI (2008). Differential response of a Virginia
common lambsquarters (Chenopodium album) collection to glyphosate. Weed Sci.
56:203–209.
Holm LG, Plucknett DL, Pancho JV and Herberger JP (1977). Chenopodium album L.
Chenopodiaceae, goosefoot family. Pages 84-91 In The World's Worst Weeds:
Distribution and Ecology. Honolulu, HI: University Press of Hawaii.
Hyatt LA and Evans AS (1998). “Is decreased germination fraction associated with risk of
sibling competition?” Oikos. 83:29-35.
Jeschke MR and Stoltenberg DE (2006). Weed community composition after eight years of
continuous glyphosate use in a corn–soybean annual rotation. Proc. N. Cent. Weed Sci.
Soc. 58:59.
Klingman GC (1961). Weed Control as a Science. Jolin Wiley and Sons Inc., New York.
Kniss AR, Miller SD, Wilson RG and Westra PH (2006). Response of two common
lambsquarters biotypes to glyphosate. Proc. N. Cent. Weed Sci. Soc. 61:168.
Loux MM, Stachler JM, Miller BA and Taylor JB (2005). Response of common lambsquarters to
glyphosate in the greenhouse and growth chamber. Proc. N. Cent. Weed Sci. Soc. 60:202.
Madsen SB (1962). Germination of buried and dried stored seeds. III. 1934-1960. Int. Seed Test.
Assoc. Proc. 27:920-928.
McNeill, J. 1976. The taxonomy and evolution of weeds. Weed Res. 16: 399-413.

64
Pratap T, Joshi BD and Galwey NW (1998). Chenopods. Chenopodium spp. Promoting the
conservation and use of underutilized and neglected crops. 22. Institute of Plant Genetics
and Crop Plant Research, Gatersleben. International Plant Genetic Resources Institute,
Rome, Italy.
Patzoldt WL, Tranel PJ and Hager AG (2002). Variable herbicide response among Illinois
waterhemp (Amaranthus rudis and Amaranthus tuberculatus) populations. Crop Protec.
21:707-712.
Price SC, Allard RW, Hills JE and Naylor J (1985). Association between discrete genetic loci
and genetic variability for herbicide reaction in plant populations. Weed Sci. 33:650-653.
Ruas PM, Bonifacio A, Ruas CF, Fairbanks DJ and Andersen WR (1999). Genetic relationship
among 19 accessions of six species of Chenopodium L., by random Amplified
Polymorphic DNA fragments (RAPD). Euphytica 105: 25-32.
Schafer JR, Westhoven AM, Kruger GR, Davis VM, Hallet SG and Johnson WG (2009).
Effect of growth media on common lambsquarters and giant ragweed biotypes to
glyphosate. Proc. N. Cent. Weed Sci. Soc. 64:102.
Schuster CL, Shoup DE and Al-Khatib K (2007). Response of common lambsquarters
(Chenopodium album) to glyphosate as affected by growth stage. Weed Sci. 55:147-151.
Scott BA, Vangessel MJ and White-Hansen S (2009). Herbicide-Resistant Weeds in the United
states and their impact on extension. Weed Technol. 23:599-603.
Smith AE (1985). Differential response of Trifolium species to 4-(2,4-dichlorophenoxy) butyric
acid treatments. Physiolgia Plantarum. 65:124-128.
Smith WF and Ilnicki RD (1973). Intraspecific selectivity to atrazine in Zoysia japonica. toxicity
studies. Proc. Northeast. Weed Sci. Soc. 27:145.

65
Sosnoskie LM, Herms CP and Cardina J (2006). Weed seedbank community composition in a
35-yr-old tillage and rotation experiment. Weed Sci. 54:263–273.
USDA, NRCS. (2008). The PLANTS Database (http://plants.usda.gov, March, 2009). National
Plant Data Center, Baton Rouge, LA 70874-4490 USA.
Wang RL and Dekker J (1995). Weedy adaptations in Setaria spp. III. Variation in herbicide
resistance in Setaria spp. Pestic. Biochem. Physiol. 51:99-116.
Warwick SI and Black L (1 981). The relative competitiveness of atrazine susceptible and
resistant populations of Chenopodium album and C. strictum. Can. J. Bot. 59: 689-693.
Wax LM, Bernard RL & Hayes RM (1974). Response of soybean cultivars to bentazon,
bromoxynil, chloroxuron, and 2,4-DB. Weed Sci. 22:35-41.
Werner GM and Putnam AR (1980). Differential tolerance within cucumber (Cucumis sativus).
Weed Sci. 28(2): 142-148.
Westhoven AM, Davis VM, Gibson KD, Weller SC and Johnson WG (2008a). Field presence of
glyphosate-resistant horseweed (Conyza canadensis), common lambsquarters
(Chenopodium album), and giant ragweed (Ambrosia trifida) biotypes with elevated
tolerance to glyphosate. Weed Technol. 22(3):544-548.
Westhoven AM, Kruger GR, Gerber CK, Stachler JM and Johnson WG (2008b. Characterization
of selected common lambsquarters (Chenopodium album) biotypes with tolerance to
glyphosate. Weed Sci.56:685-691.
Williams JT (1962). Dormancy in Chenopodium album L. Ann. Appl. Biol. 50:352.

66
Xu F and Sun M (2001). Comparative analysis of phylogenetic relationships of grain Amaranths
and their wild relatives (Amaranthus; Amaranthaceae) using internal transcribed spacer,
amplified length polymorphism, and double-primer fluorescent intersimple sequence
repeat marker. Mol. Phylogenetic Evol.21:372-387.
67
CHAPTER 3
MULTI-FACETED APPROACH TO UNDERSTAND THE WEEDY
CHENOPODIUM COMPLEX
3.1 Abstract
The Chenopodium genus is not a well-understood complex and taxonomy of the genus
has been a point of controversy. In agricultural fields, most of the weedy Chenopodium species
are referred to as common lambsquarters. Research was conducted to find informative markers
that can help in species identification. Both morphological and DNA sequence data were
explored. Among the morphological characters, the seed pericarp, calyx shape (keeled or not),
and DNA content of the species proved to be informative characters. DNA content (2C) values
proved to be informative in differentiating C. album (3.6 pg), C. berlandieri (2.7 pg), C. strictum
(2.0 pg) and C. ficifolium (1.9 pg). Sequence data from 3 loci, ITS (nuclear), matK and trnD-trnT
(chloroplast) were explored. DNA sequences from all three regions gave similar tree topologies,
but ITS sequences had more polymorphic sites. A well supported ITS phylogenetic tree resolved
the Chenopodium species into four main clusters. The C. album group was separated from the C.
berlandieri with good bootstrap support from parsimony analysis and high posterior probabilities
from Bayesian analysis. The chloroplast sequences also showed similar results. Closely related
species such as C. strictum, C. berlandieri and C. album share highly similar sequences among
homologous genes, but they can be differentiated based on genome size. ITS region of
Chenopodium samples from agricultural fields in the North Central states were amplified, and
the phylogenetic tree showed that all the field samples clustered with Chenopodium album. Our
68
conclusion is that only a multi-faceted approach using ITS sequence, cytogenetic, morphological
data can differentiate the Chenopodium species.
3.2 Introduction
The genus Chenopodium L. consists of about 250 species (Giusti, 1970; Kadereit et al.
2005) and belongs to family Amaranthaceae, syn. Chenopodiaceae (APG II, 2003). The genus
includes mostly annual and perennial herbs, and is distributed throughout Asia, America and
Europe (Ruas et al. 1999). With the exception of C. quinoa and C. berlandieri subsp. nuttalliae,
most of the Chenopodium spp. are considered annual weeds (Cole, 1961) that can compete with
economically important crops and thereby affect yield.
The designation Chenopodium album has often functioned as a convenient taxonomic
receptacle, loosely circumscribed to include material not readily assigned to other species of this
difficult genus (Wilson, 1980). Species of Chenopodium are not easily defined because of lack of
distinctive macroscopic morphological characters in the genus (Bassett and Crompton, 1982).
The taxonomy of the genus Chenopodium has been a major point of controversy arising mainly
due to phenotypic plasticity (Kurashige and Agarwal, 2005; Zhou et al. 2005), parallel evolution
(Duke and Crawford, 1979), hybridization (Cole 1961; Rahiminejad and Gornall, 2004) and
cytogenetic diversity as some species of Chenopodium can be found as diploid, tetraploid and
hexaploid (Allen 1929). While studying the Chenopodium genus Wahl (1954) wrote that „„No
group of comparable size and wide distribution known to the writer has suffered the lack of
understanding of the taxa involved as has the genus Chenopodium, especially those members of
its Section Chenopodium that are closely related to C. album and C. berlandieri.‟‟

69
The taxonomic classification of Chenopodium species has always proved to be very
difficult and many researchers have used one or more morphological characters in combination
to clear the confusion among the taxa. For instance, Allen and Just (1943) and Wahl (1954) made
subsectional distinctions based on inflorescence and pericarp characters. Similarly, Cole (1961)
subdivided Chenopodium into 4 subsections based on seed coat markings. Iljin (1936) also
differentiated taxa based on pericarp structures and keeling of the calyx lobes. Some researchers
have also used leaf color as an identifying character (Moquin-Tandon, 1840). Bassett and
Crompton (1982) worked on clarification of taxonomic circumscriptions, nomenclature and
distribution of taxa in Chenopodium across Canada; mainly based on the seed characteristics and
information related to the chromosome count. Crawford and Reynolds (1974) studied narrow
leaved Chenopodium species, including C. atrovirens Rybd., C. desiccatum A. Nelson var.
desiccatum, C.desiccatum A. Nelson var leptophylloides (Murr.) Wahl, C. leptophyllum Nutt. Ex
Moq., and C. subglabarum (S. Wats) A. Nelson, using numerical techniques in which several
seed, leaf, and inflorescence characters were studied. Crawford and Reynolds (1974) were
successful in elucidating the relationship of closely related Chenopodium species and found
certain affinities that were contrary to the literature of that time. Such studies have been
successfully conducted in other plant groups to gain insight into variation patterns within the
plant species (Crovello, 1968; Gilmartin, 1969; Ornduff and Crevello, 1968; Heiser et al. 1965).
The use of DNA sequence data has proved to be a powerful approach to investigate
relationships within morphologically complex groups like Ericaceae (Kron et al 2002) and
Asteraceae (Kim and Jansen, 1995). Such studies have also been done in Chenopodium using
random amplified polymorphic DNA (RAPD) (Anderson, 1999; Gangopadhay et al. 2002),
direct amplification of minisatellite DNA (DAMDA) (Rana et al. 2010), microsatellite markers

70
(Mason et al. 2005), ribosomal DNA (Maughan et al. 2006; Soliai et al. 2009) and plastid genes
(Downie et al. 1997; Soliai et al. 2009).
There are about 20 species of Chenopodium that are present in Illinois (USDA, NRCS.
2008), and some of them (C. album, C. berlandieri, C. strictum, C. murale and C. hybridum) are
recognized as agricultural weeds. Some of these weeds are resistant to one or more class of
herbicides (Heap, 2010). Much of the research on the genetic diversity and phylogeny within
Chenopodium mainly emphasized domesticated species like C. quinoa and C. berlandieri. There
are very few studies which include the important weed species like C. album, C. berlandieri, C.
strictum, C. ficifolium, C. murale and C. glacum, and there clearly is a lack of attempts at
understanding among these species using both morphological and molecular data.
The aim of this study was to: 1) study morphological characters in the Chenopodium
complex in order to identify those that can be used to differentiate the species; 2) develop
markers based on DNA sequences data which can aid in species identification, and can be used
as additional tools to morphological data in understanding the Chenopodium complex; and 3)
determine which Chenopodium species predominate across the North Central states using DNA
sequences.
This study was not done to revise the phylogeny of the Chenopodium genus, but to
increase the precision of classification in the Chenopodium genus with a multi-faceted approach.
3.3 Material and Methods
Plant Materials
The Chenopodium species for this study were selected based on the prevalence of the
species in North Central states. There are about 20 species of Chenopodium that are found

71
commonly in the North Central US, and depending on seed availability, 28 accessions
representing 12 species were selected (Table 3.1). Five additional ITS sequences of C. album
were downloaded from the National Center for Biotechnology Information (NCBI) for sequence
comparison. Most seed for different Chenopodium species were provided by North Central
Regional Plant Introduction Station (NCRPIS) and some by other researchers. All the
Chenopodium samples were sequenced for ITS region, but only a representative subset of
Chenopodium species were sequenced for chloroplast markers. Information related to the
accessions used and loci examined is provided in Table 3.1.
A subset of Chenopodium samples from North Central states that were earlier screened
with glyphosate (Chapter 2), were also sequenced to amplify the ITS region (details for choosing
this marker is discussed later in the chapter). As stated in the objectives, the aim of this
experiment was to use molecular marker(s) to determine if the samples collected from North
Central states were genetically more close to C. album or other weedy Chenopodium species.
Seeds from all the populations that were used were stratified and then sown in a
greenhouse. At maturity, seeds were harvested from single parents and again stratified and sown
in the greenhouse for morphological, cytogenetic and molecular data analyses.
Morphological Analysis
Based on the literature available, we selected all the characters that were used by
researchers to identify the Chenopodium species. The qualitative characters studied included
plant height, seed length and width, stem diameter and length to width ratio of primary,
secondary and tertiary leaves (description given by Utolia, 1978). The mean values were

72
calculated for each character and compared using the LSD values obtained by the PROC GLM
procedure in SAS 9.2 (Table 3.2).
Table 3.1. List of accessions used for molecular analysis. Loci examined indicate the species
that have been tested with corresponding marker.
S. No Genus PI Origin Loci examined
1 C. album 1 Ames 23855 Poland ITS matK trnD-trnT
2 C. album 2 PI 605700 MI, USA ITS matK trnD-trnT
3 C. album 3 PI 262168 France ITS matK trnD-trnT
4 C. album 4 PI 605701 CO, USA ITS - -
5 C. album 5 ? Germany ITS - -
6 C. album 6 FN561545 NCBI - -
7 C. album 7 FN561549 NCBI - -
8 C. album 8 FN561547 NCBI - -
9 C. album 9 FN561552 NCBI - -
10 C. album 10 FN561550 NCBI - -
11 C. bushianum PI 608030 IL, USA ITS matK trnD-trnT
12 C. berlandieri 1 PI 595315 IA, USA ITS matK trnD-trnT
13 C. berlandieri 2 PI 595316 IA, USA ITS matK trnD-trnT
14 C. berlandieri 3 PI 612858 UT, USA ITS matK trnD-trnT
15 C. berlandieri
var. zschackei 4 ? IN, USA ITS - -
16 C. berlandieri
macrocalycium 5 BYU-803 ME, USA ITS - -
17 C. berlandieri
sinuatum 6 BYU 865 AZ, USA ITS - -
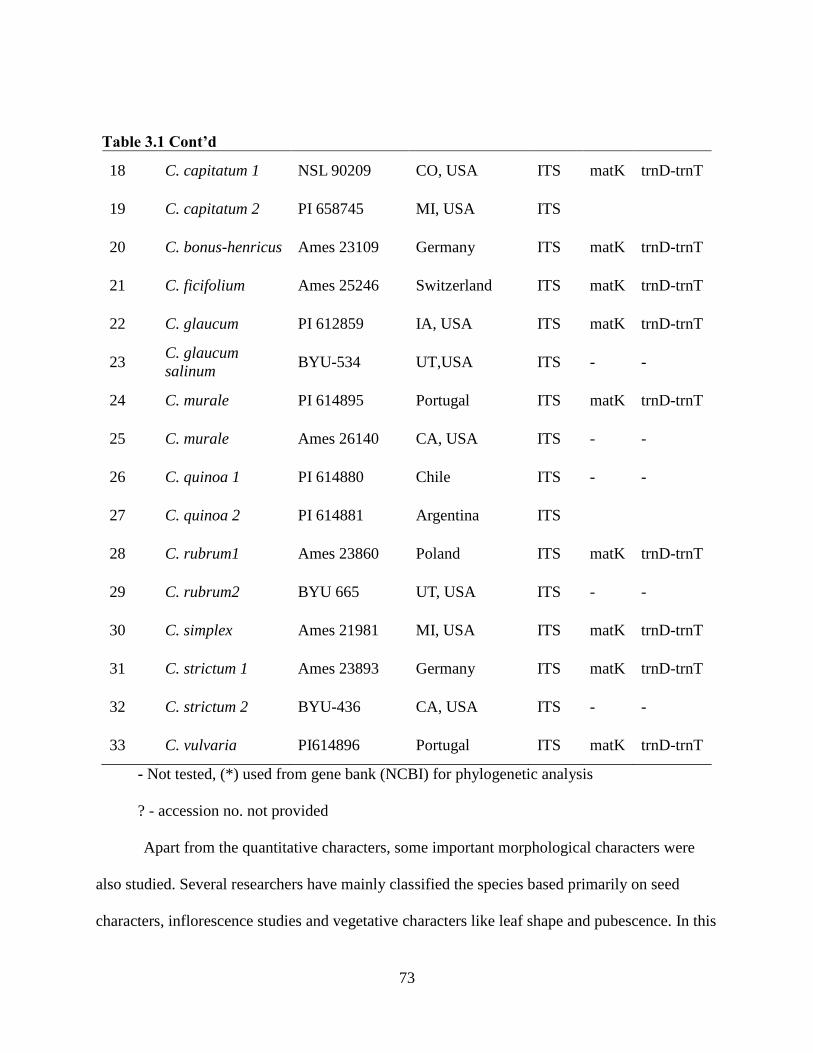
73
Table 3.1 Cont’d
18 C. capitatum 1 NSL 90209 CO, USA ITS matK trnD-trnT
19 C. capitatum 2 PI 658745 MI, USA ITS
20 C. bonus-henricus Ames 23109 Germany ITS matK trnD-trnT
21 C. ficifolium Ames 25246 Switzerland ITS matK trnD-trnT
22 C. glaucum PI 612859 IA, USA ITS matK trnD-trnT
23 C. glaucum
salinum BYU-534 UT,USA ITS - -
24 C. murale PI 614895 Portugal ITS matK trnD-trnT
25 C. murale Ames 26140 CA, USA ITS - -
26 C. quinoa 1 PI 614880 Chile ITS - -
27 C. quinoa 2 PI 614881 Argentina ITS
28 C. rubrum1 Ames 23860 Poland ITS matK trnD-trnT
29 C. rubrum2 BYU 665 UT, USA ITS - -
30 C. simplex Ames 21981 MI, USA ITS matK trnD-trnT
31 C. strictum 1 Ames 23893 Germany ITS matK trnD-trnT
32 C. strictum 2 BYU-436 CA, USA ITS - -
33 C. vulvaria PI614896 Portugal ITS matK trnD-trnT
- Not tested, (*) used from gene bank (NCBI) for phylogenetic analysis
? - accession no. not provided
Apart from the quantitative characters, some important morphological characters were
also studied. Several researchers have mainly classified the species based primarily on seed
characters, inflorescence studies and vegetative characters like leaf shape and pubescence. In this

74
study, we evaluated plants for growth habit of stem, branching pattern, base branching presence,
pubescence of the leaves, perianth structure, fruit covering at maturity, and seed pericarp.
Analysis of the morphological data was conducted using Mesquite v 2.72 (Madison and Madison
2009). Morphological data were converted into a similarity matrix and the nexus file generated
from Mesquite was used to derive maximum parsimony tree and presented as phylogram. The
characters used and their codes are provided below:
1) Growth habit of main stem:
1- erect; 2- prostrate; 3: ascending
2) Perianth Keeled or not
1-not keeled; 2- slightly keeled; 3-moderately keeled; 4-sharply keeled
3) Branching
0-Simple; 1-less branched; 2-medium branched; 3-highly branched
4) Fruits covering at maturity:
1-exposed; 2- slightly exposed; 3-completely covered
5) Branching at the base of plant
1-present; 2-absent
6) Seed Pericarp:
1-Smooth to reticulate; 2-honeycomb pitted
7) Farinose (adaxial surface of leaf)
1-medium to highly farinose; 2-low to medium; 3- slightly to glabrous
8) Farinose (abaxial surface of leaf)

75
Table 3.2. Binary codes for selected morphological characters.
Species Stem Branching
Base
branching Keeled
Fruit at
maturity Pericarp
Farinose
Adaxial
Farinose
Abaxial
C album 1 1 3 2 4 3 1 3 2
C album 2 1 0 2 3 1 1 3 1
C album 3 1 1 2 3 1 1 3 1
C album 4 1 3 2 4 3 1 3 2
C berlandieri 1 1 0 2 3 3 1 1 3
C berlandieri 2 1 0 2 3 1 2 3 2
C berlandieri 3 1 1 2 3 1 2 3 2
C berlandieri 5 1 2 2 2 1 2 2 1
C berlandieri 6 1 0 2 2 1 2 3 2
C bushianum 1 0 2 2 1 1 3 2
C ficifolium 1 0 2 2 3 2 3 2
C glaucum 2 2 3 1 1 3 1 3 1
C murale 1 1 2 2 1 3 1 3 3
C rubrum 1 1 3 2 1 3 1 3 3
C strictum 1 1 2 2 3 1 1 3 3
C strictum 2 1 2 2 3 1 1 3 2
C vulvaria 3 3 1 1 3 1 2 1

76
DNA Content Analysis
Chenopodium samples were prepared for flow cytometric analysis using the protocols of
Rayburn et al. (1989). Briefly, leaf tissues (~1 cm2 of each) from Chenopodium species and
maize inbred line W22 (Biridar and Rayburn, 1993), used as an internal control, were co-
chopped and placed in a small (15 mL) beaker containing 10 mL extraction buffer (13% (v/v)
hexylene glycol, 10 mmol Tris–HCl L-1
(pH 8.0), and 10 mmol MgCl2 L-1
) and 200 μL 25%
Triton®-X . The nuclear DNA content of maize used as internal control was 5.35 pg/2C. The
tissue was homogenized using a tissue grinder for 25-30 s at 4500 × g, and samples were filtered
through 250- and 53-μm nylon meshes into a labeled test tube kept on ice. The samples were
then centrifuged for 15 min at 11000 × g at 4°C. The supernatant was removed, and nuclei were
re-suspended in 300 μL of propidium iodide stain (Bashir et al.1995). The solution was then
transferred to a 1.5 mL microcentrifge tube and incubated for 20 min at 37°C. Following
incubation, 300 μL of propidium iodide salt was added to each sample. Samples were then
lightly vortexed and stored at 4 °C for 2 hours.
For each sample, 10000 nuclei were analysed using a laser Flow Cytometer-Cell Sorter
Epics XL-MCL (Coulter Electronics, Hialeah, Florida, US). Mean fluorescence of sample G1
peak was divided by the fluorescence reading of the internal control, multiplied by 5.35 pg/2C,
and expressed in pg/2C nucleus. For each genotype, 2 samples (1 leaf per replication) were
analyzed. Readings on nuclear DNA content were used for GLM analysis, and LSD tests were
conducted using SAS v 9.21.

77
Scanning Electron Microscope Analysis
Several researchers found that fruit and seed characters are useful in the identification
and classification of plant taxa, and in establishing phylogenetic and evolutionary relationships
among taxa. Mature seeds from Chenopodium plants were used for examining the pericarp using
Scanning electron microscopy (SEM). Briefly, the seeds were mounted onto a metal plate and
were then sputter coated in Denton Desk II TSC turbo-pump. The samples were then viewed
under Field-Emission Environmental Scanning Electron Microscope (ESEM-FEG) with Energy-
Dispersive Spectroscopy (EDS) at the Beckman Institute2 for Advanced Science and
Technology, University of Illinois. The pictures were taken at 120X and the exposure was
manually adjusted.
Molecular Analysis
DNA Extraction, Amplification and Sequencing
Total genomic DNA was extracted following the procedure of Doyle and Doyle (1987)
with slight modifications. Briefly, 100 mg of fresh tissue was placed individually in 1.5 ml sterile
microcentrifuge tubes. The tubes were then dipped in liquid nitrogen and samples were finely
grounded. Then 600 µL of CTAB extraction buffer was added and the tubes were incubated at
60oC for 30 min, during which the tubes were inverted several times to mix the contents. The
samples were then extracted with 500 µL of chloroform by vigorously inverting the tubes for 2
mins. The samples were centrifuged for 5 min at 10000 x g in a micro-centrifuge. The upper
phase was transferred to a fresh tube. DNA was precipitated with 400 µL of absolute ethanol and
the DNA was allowed to precipitate at -20oC for 30 min. The precipitated DNA was collected by
centrifugation at > 12000 x g for 10 min. The ethanol was decanted and DNA was washed with

78
250 µL of 70 % ethanol, followed by another wash with 250 µL 90 % ethanol and then samples
were centrifuged. The ethanol was decanted and DNA pellets were dried in a vacuum evaporator
centrifuge for 1 to 2 mins. Finally, the DNA pellet was dissolved in 50 µL of TE buffer for use in
polymerase chain reaction amplification.
Loci Examined
Nuclear Internal Transcribed Spacer (ITS) Region
The entire ITS region (ITS1, 5.8S, and ITS2) was amplified using the ITS 5 and ITS 4
primers (Table 3.5). These are universal primers and the ITS region was amplified following
protocol of Wetzel (1999) with slight modifications. The following were combined to a final
PCR volume of 25 µL: 1 µl of approximately 100 ng DNA, 2 units of Taq polymerase
(Promega3), 1X reaction buffer (Bioline), 2.5 mM MgCl2, 200 µM dNTPs, and 0.2 µM of
forward and reverse primer. Reactions were incubated for 2 min at 95o C, followed by 36 cycles
of 1 min at 95o C, 1 min at 50
oC, 2 min at 72
oC, followed by final extension at 72
oC for 5 min.
Five micro liters of each double-stranded DNA PCR product was resolved by
electrophoresis in a 1 % agarose gel using 1X TBE as the gel buffer. Agarose gels were stained
with 0.5 µg ml−1
ethidium bromide and visualized under ultraviolet light to observe the DNA
fragments. Subsets of amplified fragments were selected for DNA sequencing. Fragments were
isolated from the gel using QIAGEN4 gel purification kit following the manufacturer‟s
instructions. The purified DNA product was then sequenced using AB BigDye Terminator v3.1
Cycle Sequencing Kit5
and the sequence data were analyzed using Sequencher 4.7 software6.
Sequencing reactions consisted of 0.25 µL of primer, 4 µL of purified PCR product and 4 µL of
ddH2O. Cycle sequencing conditions were 96oC for 1 min of denaturing, followed by 30 cycles

79
of 15 sec at 95oC, 5 sec at 45
oC and 4 min at 60
oC. Sequencing was carried out at the W. M.
Keck Center7 for Comparative and Functional Genomics at the University of Illinois.
In C. album 3, polymorphic sequences were observed at single loci, which indicated the
possibility of heterogeneous ITS repeat, but as they were localized to one nucleotide position
with double peaks, this position was not included in sequence analysis.
Chloroplast DNA
The chloroplast genome is smaller than the nuclear genome and is found in large numbers
which makes it easy to isolate. Apart from the nuclear markers, chloroplast markers are also
among the most commonly used markers for phylogenetic studies in plants. The chloroplast
DNA is useful because it is structurally stable, non recombinant, mostly uniparentally inherited
and highly conserved in gene content in closely related species (Downie and Palmer 1991).
Nuclear substitution rates are slower than those of the nuclear genome, making it a good marker
for high level taxonomic studies.
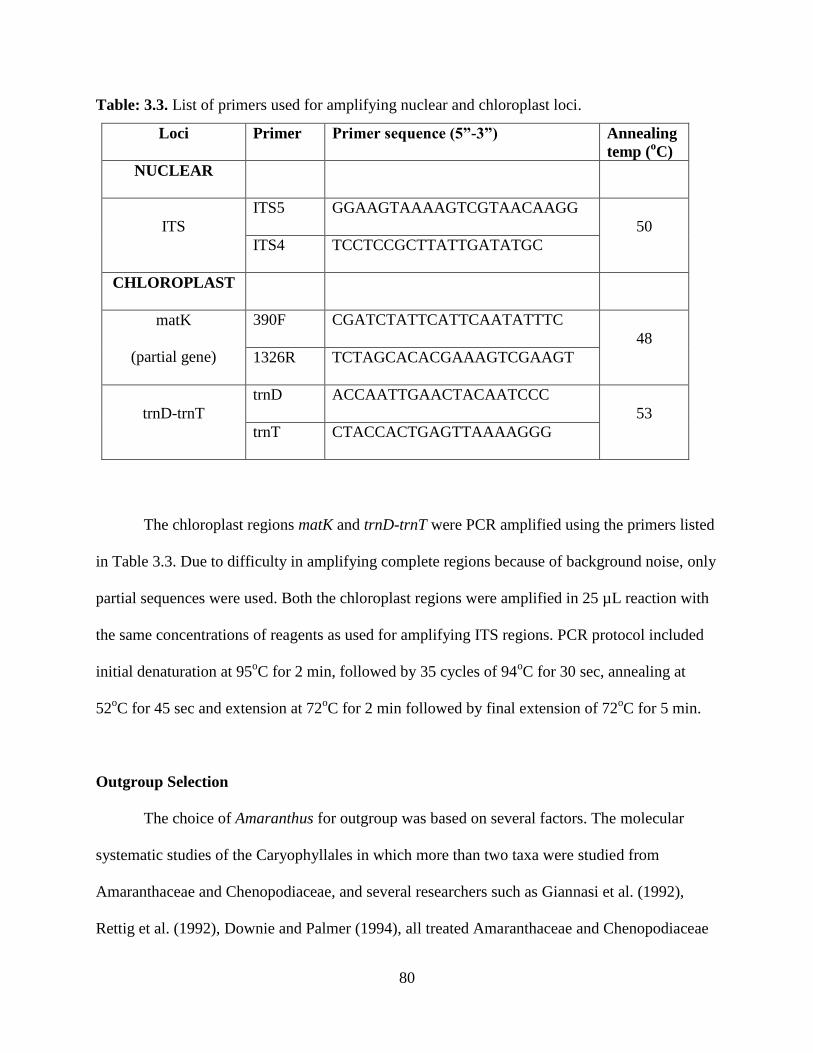
80
Table: 3.3. List of primers used for amplifying nuclear and chloroplast loci.
Loci Primer Primer sequence (5”-3”) Annealing
temp (oC)
NUCLEAR
ITS
ITS5 GGAAGTAAAAGTCGTAACAAGG
50
ITS4 TCCTCCGCTTATTGATATGC
CHLOROPLAST
matK
(partial gene)
390F CGATCTATTCATTCAATATTTC
48
1326R TCTAGCACACGAAAGTCGAAGT
trnD-trnT
trnD ACCAATTGAACTACAATCCC
53
trnT CTACCACTGAGTTAAAAGGG
The chloroplast regions matK and trnD-trnT were PCR amplified using the primers listed
in Table 3.3. Due to difficulty in amplifying complete regions because of background noise, only
partial sequences were used. Both the chloroplast regions were amplified in 25 µL reaction with
the same concentrations of reagents as used for amplifying ITS regions. PCR protocol included
initial denaturation at 95oC for 2 min, followed by 35 cycles of 94
oC for 30 sec, annealing at
52oC for 45 sec and extension at 72
oC for 2 min followed by final extension of 72
oC for 5 min.
Outgroup Selection
The choice of Amaranthus for outgroup was based on several factors. The molecular
systematic studies of the Caryophyllales in which more than two taxa were studied from
Amaranthaceae and Chenopodiaceae, and several researchers such as Giannasi et al. (1992),
Rettig et al. (1992), Downie and Palmer (1994), all treated Amaranthaceae and Chenopodiaceae

81
as sister families. In similar studies by Rodman (1990), he concluded that the two families are
sisters to each other. Based on such facts, Judd and Ferguson (1999) also suggested the inclusion
of Chenopodiaceae into Amaranthaceae in the APGII system of classification. In a recent study
on Chenopodium, Rana et al. (2010) have also used Amaranthus species as outgroup to the
Chenopodium species.
Assessing Homology
Hypothesis of homology is the basis of the phylogenetic analysis (Phillips, 2006). The
term homology was first introduced by Owen (1843) to express similarities in basic structure
found between organs of animals that he considered to be more fundamentally similar than
others. In other words, homology is the similarity that is the result of inheritance from a common
ancestor. Homology can be difficult to identify; this may be attributed in part to the presence of
large number of character states and rates of change sufficient to yield independent expressions
of the same state. We assigned the putative homology to molecular data using multiple sequence
alignments. The best alignment in context with phylogeny is the one that generates the most
parsimonious tree when analyzed in conjunction with all relevant data. We therefore were very
careful when aligning the sequences and checked visually for shifts in sequences and manually
edited the sequences if required.
Sequence Alignment
Sequence alignment is the first step in identification of homologous sites and
phylogenetic reconstruction. It is the starting point of any kind of analysis that involves the
comparison of molecular data (Mullan, 2002). When we align ITS sequences, it is very common

82
to have indels due to alignment. This makes aligning of unrelated species difficult and leads to
incorrect homology assessment.
The most common multiple sequence alignment is CLUSTAL W (Thompson et al.
1994). When sequences are aligned using CLUSTAL W, first the sequences are compared to
each other (pairwise alignment), then a dendogram is constructed which describes the
approximate groupings of the sequences by similarity and finally the multiple alignment is
carried out using the dendogram as a guide. When the numbers of sequences are small, then
CLUSTAL or any other method of sequence alignment like Multiple sequence comparison by
log-expectation (MUSLCE) (Edgar 2004), MAFFT (Katoh and Toh 2008) and T-COFFEE
(Notredame et al. 2000) all give similar results (Edgar and Batzoglou 2006). However, in some
cases, MUSCLE proved to be slightly better in assessing homology. MUSCLE (Edgar 2004)
proceeds in three stages - draft progressive using kmer counting, improved progressive using a
revised guide-tree from the previous iteration, and refinement by sequential deletion of each tree
and new multiple alignment is produced by realignment of the two profiles (Edgar and Batzoglou
2006).
For this study, the forward and reverse sequences were examined in Sequencher v4.7 and
assembled into contiguous sequences. The sequences from all the taxa were then aligned using
MUSCLE v 3.6 and Clustal W. The aligned sequences were opened in MEGA v3.1 (Tamura et
al. 2007). Alignment of contigs was done by inserting gaps if required to minimize nucleotide
mismatches. The taxa were aligned to already published sequences of Chenopodium (Rana et al.
2010) deposited in GenBank. The length of the ITS region was 643 bp and included gaps in ITS1
and ITS2, but the 5.8S region was well conserved. Chloroplast DNA regions were aligned in

83
ClustalW and the sequences were compared to Amaranthus sequences. A few ambiguously
aligned nucleotides in the 5‟ or at the 3‟ end were excluded from the analysis.
Treatment of the Gaps
Multiple sequence alignment converts the unequal length sequences to equal length
sequences by introduction of gaps that represent the insertion or deletion (indel) event. The
position of indels in molecular data can be useful phylogenetic information (Simmons and
Orchoterena, 2000; Egan and Crandall, 2008). The pitfall of using gap characters is that they are
the product of sequence alignment, and contrary to nucleotides, gaps are not actually present in
the organism and they do not have anything to compare with other sequences at the loci where
gap occurs (Simmons et al. 2001). Gaps can be treated in different ways. Simmons and
Orchoterena (2000) provided a detailed discussion of how to treat gaps. In general, there are
three common ways of treating gaps: 1) gap positions are excluded from the analysis altogether
and the advantage of excluding gaps is that the missing data are eliminated; 2) treat gaps as 5th
character base in the DNA based alignment (Eernisse and Kluge. 1993); 3) simple indel coding
in which gaps are coded as presence or absence of characters (Simmons and Orchoterena, 2000).
The advantages and the concerns of using the above three methods for treating gaps has been
reviewed by several researchers (Simmons and Orchoterena, 2000; Muller 2006; Ogden and
Rosenberg 2007; Dwivedi and Gadagkar, 2009). In our analysis, gaps were treated as absence or
presence of characters. The gaps were binary coded as 0 for absence and 1 for presence of
character with the help of Gapcoder (Young and Healy, 2003)

84
Phylogenetic Analysis
The multiple sequence alignments were subjected to phylogenetic analyses, including
maximum parsimony (MP) and model-based Bayesian Inference methods. For all the regions
investigated, Amaranthus species were used as the outgroup, and trees were rooted to them.
Review on the methods for phylogenetic analyses is provided by Swafford et al. (1996) and more
recently by Holder and Lewis (2003), who discussed the advantages and limitations of various
estimation methods.
Maximum Parsimony
MP analyses were conducted using PAUP v4.0b (Swofford 2003). Characters were
treated as unordered and equally weighted. Heuristic searches were carried out with MulTree
ON, tree-bisection-reconnection branch swapping, starting tree obtained via random stepwise
addition with 10 replications. Clade support was assessed using bootstrap estimation (Felsentein
1985). One thousand bootstrap replicates were analyzed in PAUP and only those values
compatible with the strict consensus tree were recorded.
Bayesian Analysis
Bayesian analysis has a computational advantage over maximum likelihood (ML)
approach. The Bayesian analysis was performed using MrBayes v 3.1.2 (Ronquist and
Huelsenbeck, 2003). Starting trees were chosen at random and 2 million generations were run
with sampling occurring every 100 generations. For ITS and trnD-trnT, the best model was
general time reversible with invariable gamma (GTR +I+J) model, and for matK and combined
analysis of DNA data, the model selected was TMI+I+J. The models were selected based on the

85
AIC criteria using the Modeltest v 3.7 (Pasoda and Crandal 1998). The “burn in” was determined
and those trees prior to stationarity (2000-2500) were discarded before a 50% majority-rule
consensus tree was calculated from the remaining trees along with the posterior probability
values.
3.4 Results and Discussion
Importance of Morphological Characters in Identifying the Chenopodium Species
For any study that deals with the identification or classification of plants, the first and
foremost step is to use morphological characters as a tool for classification. Key morphological
characters can be compared among plants to determine the differences or similarities in plant
taxa. These key characters can be either quantitative characters that can be counted or measured
or qualitative characters such as flower color, leaf shapes, pubescence or seed color.
In the present study, both quantitative and qualitative characters were measured. The key
characters were identified based on the previously published monographs of Chenopodium
species (Moyaskin and Clements, 1996). Quantitative characters studied are presented in Table
3.4. It shows the mean values of measurements from 10 plants for studied characters of each
Chenopodium accessions. The results indicate that there is variability within and among the
Chenopodium species. For instance, when we studied plant height, the plants ranged from 52.6
cm (C. album 1) to 141.4 cm (C. album 4). Similar trends were also observed in accessions of C.
berlandieri (94-119.6 cm). Chenopodium album and C. berlandieri species were significantly
taller than other Chenopodium species investigated. Stem diameter values overlapped within the
Chenopodium species and no grouping was observed in the species.

86
The leaf length/width approximates the shape of the leaves. Measurements were taken
from 10 plants and from each plant, three stems (near base, middle and terminal area of main
stem) were selected. From each stem, primary, secondary and tertiary leaves were measured for
length and width and we present the data as mean values for ratio of length to width of the
leaves. The primary leaf was the oldest leaf, secondary is the middle leaf, and the youngest leaf
was the tertiary leaf. This measuring scheme was used to capture the maximum variability in the
leaf size. The results indicated that for primary leaves, the species that have length/width ratios
greater than 2, such as C. ficifolium and C. glaucum, were different from the other Chenopodium
species. The differences were non-significant between the accessions of C. album and C.
berlandieri. For secondary and tertiary leaves, there was not a clear distinction and these cannot
be confidently used as important characters. Another character studied was the seed length and
width. The results indicated that length and width of seeds of C. berlandieri accessions were
significantly different than accessions of C. album, with an exception of C. berlandieri 1 and C.
bushianum.
The results indicated that although some characters are important in differentiating some
species from each other, due to overlap in values, the same character cannot be used to
differentiate the other species. Among the characters measured, seed characters were the most
important and they have been studied extensively in various phylogenetic studies (Bassett and
Crompton, 1982). One interesting finding from this experiment was that when we measured seed
length and width, the C. berlandieri 1 and C. bushianum seeds had values that were more similar
to the C. album group and were significantly different than other accessions of C. berlandieri.

87
Table 3.4. Mean values of quantitative characters studied in differentiating Chenopodium spp.
Species Plant
Height (cm) Stem
Diameter
(mm)
Leaf
(Length/
Width) 1º Leaf
Leaf
(length/
Width) 2 º Leaf
Leaf
(Length/
Width) 3º Leaf
Seed
Length
(mm)
Seed Width
(mm)
C. album 1 52.65 H 3.66 E 1.50 CD 1.68 DE 1.89 CDE 1.38 C 1.28 CD
C. album 2 116.51BC 4.66 AB 1.08 F 1.69 DE 1.67 E 1.28 D 1.17 E
C. album 3 141.47 A 4.46 AB 1.29 DEF 1.71 DE 2.42 BC 1.27 D 1.21 DE
C. album 4 60.79 G 3.69 E 1.47 CDE 1.87 CDE 2.34 BCD 1.40 C 1.27 CD
C berlandieri 1 95.59 E 4.28 CD 1.11 F 1.70 DE 1.99 CDE 1.18 E 1.08 F
C berlandieri 2 112.05CD 4.02 D 1.23 EF 1.75 DE 1.95 CDE 1.49 B 1.41 B
C berlandieri 5 94.46 E 4.06 D 1.61 C 1.84 CDE 2.55 AB 1.86 A 1.72 A
C berlandieri 6 119.61 B 4.47 BC 1.31 DEF 1.79 DE 2.34 BCD 1.50 B 1.41 B
C. bushianum 107.79 D 4.80 A 1.39 DEF 2.01 CD 2.57 AB 1.24 DE 1.19 E
C ficifolium 85.17 F 4.47 BC 2.20B 3.03 A 3.08 A 1.10 G 0.98 GH
C glacum salinum 31.32 J 3.70 E 2.75 A 2.77 AB 2.71 AB 0.74 H 0.68 I
C murale 1 31.66 J 2.87 F 1.11 F 1.37 E 1.72 E 1.39 C 1.32 C
C strictum 1 44.36 I 4.06 D 1.61 C 1.67 DE 1.85 DE 1.10 F 1.01 G
C strictum 2 64.83 G 4.06 D 1.30 DEF 1.53 DE 1.91 CDE 1.18 E 1.08 F
C vulvaria 32.71 J 2.30 G 1.28 DEF 1.55 DE 1.60 E 1.01 G 0.92 H
C. rubrum1 32.38J 4.23 CD 1.37 CDE 2.35 BC 2.37 BCD 0.68 H 0.65 I
LSD (α = 0.05) 7.27 0.27 0.24 0.52 0.54 0.068 0.062 a Means followed by same letter are not different according to Fischer‟s LSD test (p<0.05).

88
Along with the quantitative characters, a parallel study was also initiated to study
qualitative characters which include stem growth habit, branching, calyx keeled or not, whether
or not the fruit is covered with perianth at maturity, pubescence of leaves and surface features of
the pericarp. Most of these characters have been used as key characters in writing monographs
for these species (Aellen 1929, Mosyakin and Clemants, 1996; Clemants and Mosyakin 2004).
Morphological characters, including pericarp structure, calyx shape (keeled or not) and
DNA content values have proved to be the “key” characters in differentiating various
Chenopodium species (Bassett and Crompton 1982; Cole 1961; Aellen and Just 1943; Wahl
1954; Bhargava et al. 2006; Wang et al. 1993; Sederberg et al. 2009). For studying the pericarp
structure, seeds were selected from single plant and 2-3 seeds were examined under
Environmental scanning electron microscope (ESEM). The results of the surface pattern were
similar to the findings of Cole (1961), Uotila (1978) and Karcz (2005). Based on the pericarp
structure (Figure 3.1, 3.2), we can easily separate the accessions of Chenopodium berlandieri, C.
ficifolium and C. quinoa from C. album and other species of Chenopodium (Figure 3.1 and 3.2).
The C. berlandieri and C. ficifolium have a distinct honeycomb pitted pericarp that is very
different from the smooth to reticulated pericarp of C. album, C. strictum and C. glaucum.
Similar to our previous findings using quantitative characters, C. berlandieri 1 and C. bushianum
resembled C. album more than accessions of C. berlandieri (Figure 3.2). When we studied the
sepals for being keeled or not, the results were overlapping and similar results were shared with
many species.

89
Figure 3.1. Seed pericarp features of C. album and C. berlandieri using scanning electron
microscope.

90
Figure 3.2. Seed pericarp features of C. ficifolium, C. strictum, C. berlandieri 1 and C.
bushianum.

91
We were not very successful in identifying key morphological character(s) that can
distinguish the Chenopodium species. Our next approach was to combine the information from
all the morphological characters and develop a phylogenetic tree based on maximum parsimony
analysis. The tree (Figure 3.3) shows the clustering of the species based on eight morphological
characters (coded as binary codes). The CI value was 0.39 and the homoplasy index (HI) was
very high at 0.60. The phylogram shows that the tree was not resolved due to high homoplasy
between the morphological characters, which is evident from high homoplasy index values. The
reason for less reliability of the morphological characters is based on the fact that Chenopodium
genus is a complex group. Several species in this genus have more than one ploidy level and they
have remarkable phenotypic plasticity, which makes it difficult to use the morphological
characters alone for identifying Chenopodium species. Seed characters such as size and pericarp
are considered to be unmistakably distinct in C. berlandieri and C. album but they can also show
polymorphism as they are partly a function of the environment (Cole, 1961). One reason for
polymorphism is that pericarp surface patterns are influenced by temperature, and low
temperature near maturity results in more reticulated seeds than when grown under warm
conditions (Cole, 1961). So, although seed coat has a genetic basis, it is also influenced by
environment; it is not advised to use the seed coat pattern alone to indicate even incipient
speciation (Cole 1961).

92
Figure 3.3. Unrooted maximum parsimony tree based on the differences in morphological
characters of 17 accessions of Chenopodium.

93
From our study using the morphological characters, we conclude that the morphological
characters alone cannot be used for phylogenetic analysis as the characters overlap within
different species. The fact that there are no key characters that can be used across the genus to
identify the species explains the taxonomic difficulty of the genus Chenopodium. The
morphological data need additional support from molecular or cytological data to resolve the
phylogeny.
DNA Content Analysis of Chenopodium Species and Populations from North Central States
Relative nuclear DNA content of nuclei isolated from Chenopodium species and selected
populations of Chenopodium across North Central states along with the Zea mays (internal
standard) using flow cytometry is shown in Table 3.5. The reason for measuring the genome size
is that it is one character under strict genotypic control within defined limits (Benett et al. 2000).
Nuclear DNA analysis has proved to be very effective in delimiting infrageneric division in a
number of taxa (Ohri, 1998). Based on the range of 2C values (1.8 to 3.8 pg), Chenopodium
species can be grouped into three categories. These categories resemble the ploidy level, but as
we did not count the chromosomes, we used a general classification or grouping of
Chenopodium species. Different accessions of C. album had a genome size between the range of
3.6 to 3.8 pg/2C, which was well outside the range of the closely related C. strictum (2.0 to 2.1
pg/2C) and C. berlandieri (2.7 to 2.9 pg/2C). C. ficifolium, which is closely related to C.
berlandieri, had a smaller genome size of 1.85-1.9 pg/2C. The DNA content data were useful in
differentiating C. album from C. strictum and C. berlandieri from C. ficifolium. There is a
significant difference between the genome size of C. album and C. berlandieri. Although no
study of the ploidy level was done, based on the DNA content values, the best estimate is that C.

94
strictum and C. ficifolium are diploid; C. berlandieri is a tetraploid and C. album accessions are
hexaploid. The C. berlandieri 1 and C. bushianum also had 2C values that were close to that of
C. album. The results from our experiments are consistent with those of Sederberg et al. (2009)
who estimated ploidy levels for various Chenopodium species using fluorescent in situ
hybridization. In fact, some of the accessions used in our study were from the same seed source.
The ploidy levels they determined were very similar to our grouping based on the DNA content
values.
Table 3.5. DNA content values (pg/2C) of some Chenopodium samples using flow cytometry.
Accessions examined DNA content (pg/2C)
C. album1 3.6 ABCD
C. album 2 3.6 ABCD
C. album 3 3.7 ABCD
C. bushianum 3.7 ABCD
C. berlandieri 1 3.7 ABCD
C. berlandieri 2 2.7 E
C. berlandieri 3 2.7 E
C. berlandieri 5 2.8 E
C. ficifolium 1.8 G
C. strictum 1 2.0 FG
C. strictum 2 2.0 FG
IA 20 3.6 ABCD
IA 21 3.6 ABCD
IL 7 3.5 CD
IL 6 3.8 AB
IN5 3.7 ABC
KS22 3.5 D
KS8 3.7 ABC
KS 9 3.7 ABC
MO 6 3.5 BCD
ND 7 3.8 A
LSD (alpha=0.05) 0.30 a Means followed by same letter are not different according to Fischer‟s LSD test (p<0.05).

95
The DNA content analysis of Chenopodium populations sampled from the North Central
states were 3.5-3.9 pg/2C, and are not significantly different from the C. album samples, but are
significantly different from the other species sampled (Table 3.5). These populations therefore all
appear to be of C. album. The variability among the Chenopodium populations can be due to
deletions, duplications or genome responses to environmental stress (Price 1976).
Molecular Data Analysis
Towards the second research objective, DNA sequences from nuclear and chloroplast
regions were explored to find a locus that has enough polymorphic positions that can be used
either alone or in combination with morphological characters to resolve the Chenopodium
phylogeny. Three loci, ITS, matK and trnD-trnT were investigated. In the following sections I
will discuss the results from all three regions separately.
ITS Sequence Analysis
Sequences were obtained for two or more plants from 33 accessions (including 5 samples
of C. album from Genbank) representing 12 Chenopodium species. In addition to the
Chenopodium species, sequences for ITS region were also obtained for A. spinosus
(DQ005961.1) and A. retroflexus (AF210906.1) which were used as outgroup. The numbers of
accessions were increased in closely related species like C. album and C. berlandieri, however
due to limited number of accessions for other species, we could not increase the accessions of C.
strictum, C. bushianum and C. strictum. Increasing the populations within the species increases
the confidence in clustering and increases the reliability of our analyses.

96
To check if there is any difference in the alignment methods, the ITS sequences were
aligned with Clustal W and MUSCLE alignment software. Alignment results from both the
methods were almost identical (data not shown) and required manual editing by adding or
deleting gaps. The number of parsimony informative (PI) sites obtained using Clustal W were
201 as compared to 199 from MUSCLE. This small difference can either be due to different
algorithms used by the software, but more importantly, it can also be an artifact due to manual
editing of the alignments to increase the homology. We used the Clustal W alignment algorithms
for aligning all the genera used in this study.
The ITS region was 643 bp long and it included 249 bp of ITS-1 spacer and 232 bp of
ITS-2 spacer region (Table 3.6). One important character in phylogenetic studies is the number
of parsimony informative (PI) sites. These sites are different than the variable sites by the fact
that any variable site is parsimony informative only when there are at least two different kinds of
nucleotides at the site, each of which is represented in at least two or more sequences under
study. There were 201 parsimony informative sites, which represent 31.2% of the entire region.
Among ITS-1 and ITS-2, the PI sites were more in ITS1 (45.7%) than ITS2 (34%).
Table 3.6. Sequence characteristics of the nuclear rDNA internal transcribed spacer region for
33 accessions of different Chenopodium species.
ITS ITS-1 ITS-2 ITS-1 & ITS-2
No. of total characters 643 249 232 488
No. of conserved characters 413 123 137 260
No. of variable sites 229 125 95 130
No. of Parsimony Informative characters 201 114 79 193
G+C content (%) 57.1 58.1 55.4 56.7

97
Alignment of ITS sequences resulted in gaps across the ITS-1 and ITS-2 regions. The
gaps from the alignment were analyzed separately to check if the gaps are informative and if they
can increase the overall resolution of the tree. Using Gapcoder (Young and Healy, 2003), the
gaps were coded as presence or absence of character. Gapcoder program codes the gaps and puts
these values at the end of the sequence. For phylogenetic analysis, additional phylogenetic
information is obtained from the gaps.
The result from the analyzing the gaps is presented in Figure 3.4. Two measures used for
estimating the relative amount of homoplasy are consistency index (CI) and retention index (RI).
The CI is calculated as the number of steps expected given the number of character states in the
data, divided by the actual number of steps multiplied by 100. The RI measures the amount of
synapomorphy expected from a data set that is retained as synapomorphy on a cladogram. The
uncorrected consistency index (CI) was 0.89 and the corrected CI, which excluded uninformative
sites, was 0.880. The retention index (RI) was 0.95. The bootstrap values ranged from 55 to
100%. Using the gaps alone as characters, there was grouping among the Chenopodium species.
Different accessions of C. album were grouped together with 66% bootstrap support values. The
other major clade consisted of C. berlandieri along with other species in the subsect. Favosa.
Despite the fact that bootstrap values are not large, these results suggest that gaps are
phylogenetically informative, and it was decided to include the gaps as additional characters for
maximum parsimony analysis of ITS and trnD-trnT spacer regions.
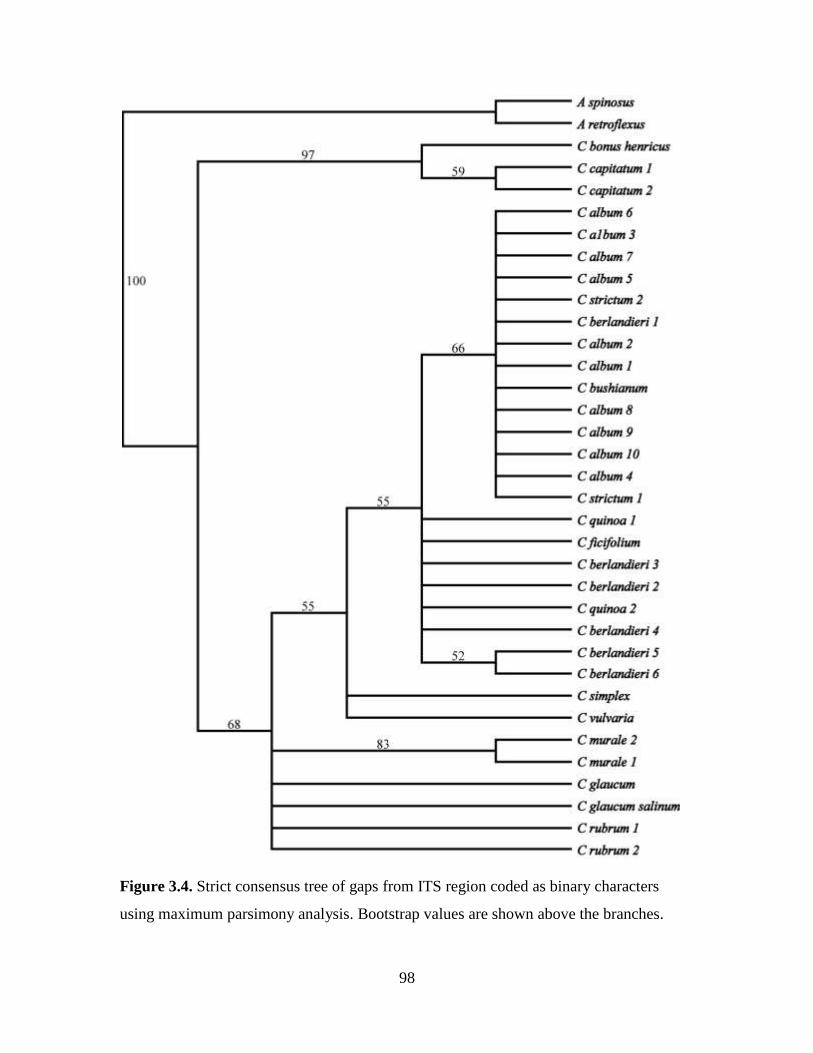
98
Figure 3.4. Strict consensus tree of gaps from ITS region coded as binary characters
using maximum parsimony analysis. Bootstrap values are shown above the branches.

99
Maximum Parsimony Analysis of Nuclear Regions
Maximum parsimony analysis of the ITS DNA matrix, with gaps treated as
missing data is presented in Figure 3.5. The topology with the minimum tree length is
known as the maximum parsimony tree. MP analysis of the entire ITS region resulted in
4 most parsimonious trees with 419 steps (steps refers to the tree length). The
uncorrected CI was 0.89 and the corrected CI, which excluded uninformative sites, was
0.88. The RI for the current tree was 0.95. Both the C. album and C. berlandieri group
were separated as separate clades with bootstrap of 100%. Some variability was visible
among the accessions of C. album but all of them shared the same clade. Two species, C.
vulvaria and C. simplex did not group with other Chenopodium species.
When we compared these results to the MP tree obtained by including gaps in the
analysis and scoring them as binary characters (Fig 3.6), there was an increase in the
bootstrap values. The length of the sequences increased from 643 to 671 bp after the
inclusion of the gaps to the sequences. Even with including gaps to the sequences, four
trees were retained with 237 steps. The uncorrected consistency index (CI) was 0.76 and
the corrected CI, which excluded uninformative sites, was 0.75. The retention index was
estimated to be 0.90. Irrespective of if the gaps are included or excluded, there were no
major changes in the tree topology, but the bootstrap values did increase with inclusion of
the gaps. A similar trend was also observed for bootstrap support for species within the
clade comprising the C. berlandieri species. Outside the C. album and C. berlandieri
groups, the bootstrap values decreased which may be due to homoplasy in gaps among
more distantly related groups. This is consistent with lower CI and RI values.

100
Figure 3.5. Maximum parsimony strict consensus tree of ITS region with gaps treated as
missing data. Bootstrap values are shown above the branches.

101
Figure 3.6. Strict consensus tree derived from maximum parsimony analysis of 35
nuclear ITS sequences. The values on top of the branch represent bootstrap values.

102
The ITS-1 and ITS-2 spacer regions were also individually tested (trees not
shown), but the results were not different than the topology from the entire ITS region.
The CI (0.73) and RI (0.90) were close to what we obtained by analyzing the entire ITS
region.
Our conclusion from estimating the phylogeny based on ITS region is that the
species studied can be mainly grouped into four main clades. All four clades are
supported with high bootstrap values and there is no conflict between trees using ITS-1,
ITS-1, ITS1-2 (excluding 5.8S), and ITS (with or without gaps as additional character).
Bayesian Analysis
Based on the AIC estimator, Modeltest (Pasoda and Crandall, 1998) selected the
GTR+I+G model as best fitting the ITS dataset. General time reversible (GTR) model is a
parameter rich model and it considers base frequencies and substitution rates as unequal
(GTR) with invariable sites (+I) and rate variation (+G) among sites. The base
frequencies were as follows: f(A) = 0.2443; f(C)=0.2931; f(G)= 0.2717; f(T)= 0.1908.
The estimates of rates of substitution were: A↔C=1.3244; A↔G=1.8458; A↔T=
1.4470; C↔G=0.3349; C↔T= 4.5867; G↔T=1.0000. The proportion of invariable sites
(I) = 0.3961.
The 50% majority rule consensus tree from the Bayesian analysis is shown in
Figure 3.7. The posterior probability values were higher than the parsimony bootstrap
values but the resulting consensus tree from Bayesian analysis was very similar to the
strict consensus tree obtained through MP analysis.

103
Figure 3.7. Fifty percent Majority rule tree of 35 sequences of ITS region using
Bayesian analysis. The values on top of branch are posterior probabilities.
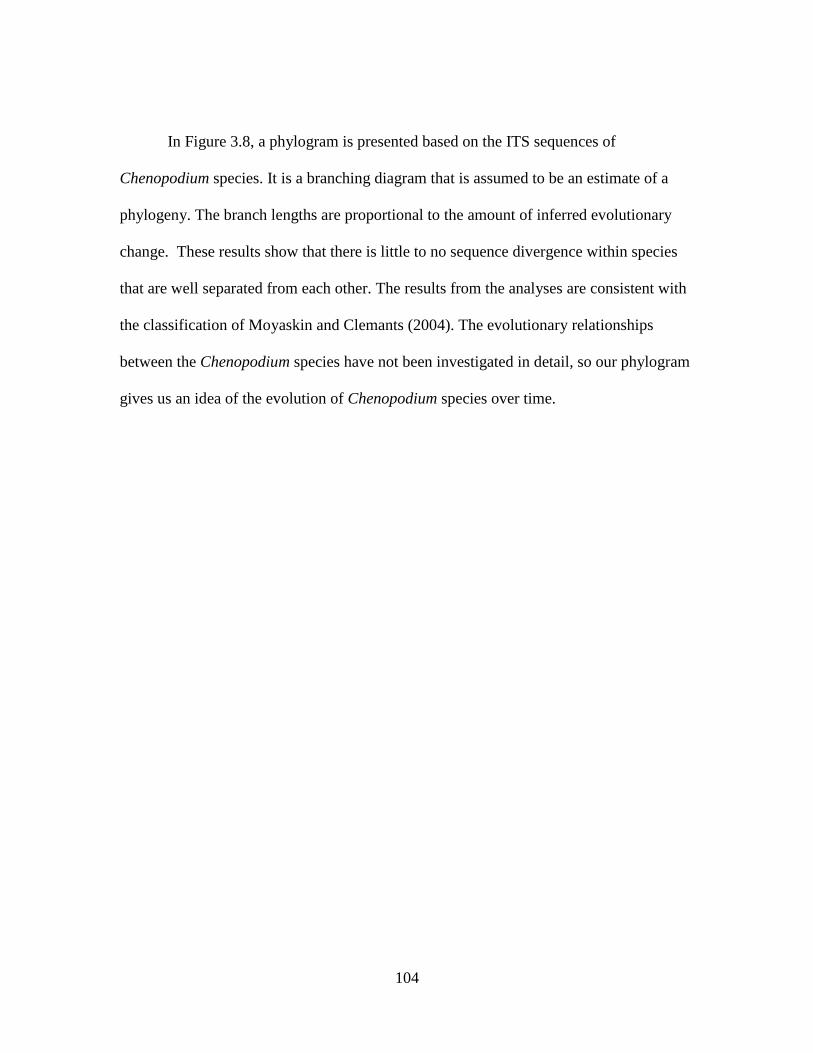
104
In Figure 3.8, a phylogram is presented based on the ITS sequences of
Chenopodium species. It is a branching diagram that is assumed to be an estimate of a
phylogeny. The branch lengths are proportional to the amount of inferred evolutionary
change. These results show that there is little to no sequence divergence within species
that are well separated from each other. The results from the analyses are consistent with
the classification of Moyaskin and Clemants (2004). The evolutionary relationships
between the Chenopodium species have not been investigated in detail, so our phylogram
gives us an idea of the evolution of Chenopodium species over time.

105
Figure 3.8. Phylogram derived with maximum parsimony analysis of entire ITS region.

106
Chloroplast Markers
Two chloroplast markers, matK (gene) and trnD-trnT (spacer) were also
investigated to check for robust markers that can aid in identifying the Chenopodium
species. Both chloroplast regions were analyzed using MP and Bayesian analysis. For the
MP analysis (Fig 3.10) of matK gene, 20 taxa were screened and aligned sequence length
had 823 characters. Two parsimonious trees were retained with 198 steps. The
uncorrected CI was 0.90 and the corrected CI, which excluded uninformative sites, was
0.82.The RI for the tree was estimated to be 0.92. Despite the fact that the bootstrap
values for MP analysis were high, the number of parsimony informative characters were
only 8.99 % (74 PI characters).
For the Bayesian analysis of the matK gene, the nucleotide substitution model
selected for matK using Modeltest was TIM+G. The base frequencies were as follows:
f(A) = 0.2852; f(C)=0.1762; f(G)= 0.1699; f(T)= 0.3687. The estimates of rates of
substitution were: A↔C=1.000; A↔G=0.9557; A↔T= 0.2128; C↔G=0.2128; C↔T=
1.6055; G↔T=1.0000. Four simultaneous analyses were run for 2 million generations,
each with four Markov Chain Monte Carlo (MCMC) chains, and sampling every 100
generations. The resulting 50% majority rule tree was very similar to the MP consensus
tree, and the posterior probability values were similar to bootstrap values (Figure 3.9).
The trees for matK resulting from both analytic methods were less resolved than the trees
based on the ITS data, particularly for the C. album and C. berlandieri groups. This
reflects smaller number of informative characters in matK compared to ITS.

107
Figure 3.9. Strict consensus tree derived from maximum parsimony analysis of matK
gene for 22 Chenopodium species. The values on top of branch are bootstrap values from
maximum parsimony analysis and values under the branch are posterior probability
values from Bayesian analysis.

108
The chloroplast spacer region (trnD-trnT) had an aligned length of 755 bp aand
included 102 parsimony informative characters (13.5% of total characters). When the
data containing 18 taxa were subjected to MP analysis, only one parsimonious tree was
retained with 233 steps. The uncorrected CI was 0.875 and the corrected CI, which
excluded uninformative sites, was 0.801.The RI for the tree was estimated to be 0.884.
The phylogenetic tree from MP analysis of Chenopodium species was well supported by
the bootstrap values, ranging from 72-100 % (Figure 3.10).
The Bayesian analysis of the trnD-trnT spacer was conducted with the nucleotide
substitution model, selected by Modeltest, GTR+I. The base frequencies were as follows:
f(A) = 0.3413; f(C)=0.1845; f(G)= 0.1615; f(T)= 0.3127. The estimates of rates of
substitution were: A↔C=0.6125; A↔G=1.0832; A↔T= 0.1701; C↔G=0.5993; C↔T=
0.6638; G↔T=1.0000 and the proportion of invariable site were 0.5605. Four
simultaneous analyses were run for 1 million generations, each with four Markov Chain
Monte Carlo (MCMC) chains, and sampling every 100 generations. The 50% majority
rule tree was very similar to the MP consensus tree (Figure 3.10). Bayesian posterior
probability values are shown in Figure 3.10. The topology of the trnD-trnT was similar to
ITS gene topology, however, with trnD-trnT spacer, C. ficifolium did not share the clade
with C. berlandieri, but instead was placed as sister to the C. album clade.

109
Figure 3.10. Strict consensus tree derived from maximum parsimony analysis of trnD-
trnT region for 18 Chenopodium species. The values on top of branch are bootstrap
values from maximum parsimony analysis and values under the branch are posterior
probability values from Bayesian analysis.

110
Combined Analysis of Molecular Markers
Maximum parsimony and Bayesian analyses for the combined chloroplast region
and combined nuclear and chloroplast regions were conducted to determine if they result
in more resolved trees than the individual regions alone. The MP and Bayesian trees were
almost identical and only the MP strict consensus tree is shown in Figure 3.11. The tree
topology from the strict consensus tree was not different than the topology from the
analysis of trnD-trnT. Compared to individual chloroplast markers, the bootstrap values
increased for the combined analysis. The only significant difference between the ITS
phylogeny and that from the chloroplast regions was that C. ficifolium grouped with C.
berlandieri group based on ITS but was sister to the C. album/C. strictum clade based on
the chloroplast regions.
Maximum parsimony analysis of the data set combining DNA sequences from the
ITS, matK, trnD-trnT is presented in Figure 3.12. The bootstrap values ranged from 54 to
100%. The combined result showed similar tree topology to ITS alone with similar
bootstrap values. The results indicated that C. bonus-henricus and C. capitatum are close
to C. glaucum. Accessions of C. murale and C. simplex are sister to the clade consisting
of the C. berlandieri and C. album group. Chenopodium album and C. berlandieri are
very close to each other C. strictum is within the C. album clade, C. ficifolium and C.
quinoa are nested in the C. berlandieri clade.

111
Figure 3.11. Strict consensus tree derived from maximum parsimony analysis of
combined chloroplast DNA sequences from 18 sequences. The values on top of branch
are bootstrap values from MP analysis and values under the branch are posterior
probability values from Bayesian analysis.

112
Figure 3.12. Strict consensus tree derived from maximum parsimony analysis of 35
sequences using combined DNA sequence data of ITS, matK, trnD-trnT. Bootstrap
values are shown above the branches.
113
Phylogenetic Information from the Phylogenetic Study
The ITS region is a good marker and the tree is well resolved. Compared to the
chloroplast markers, ITS markers generated more phylogenetic informative sites that had
a direct effect on tree topology and the clades. Little resolution was gained by adding the
chloroplast regions, although bootstrap support did increase in some cases. The few
morphological characters added little phylogenetic information. We can broadly classify
the sampled Chenopodium species into four clades or groups (Figure 3.6). The clade I
comprises C. capitatum and C. bonus-henricus and they are basal to the remaining
Chenopodium species. The position of these species is in accordance with the
morphological classification in the Flora of North America (Clemants and Mosaykin
2004) which separates two species as Chenopodium subg. Blitum sect. Agathophytum.
These species have the distinct characteristics of horizontal seeds (relative to the position
of the flower) with smooth pericarps and flowers not covering the seed at maturity.
Another sect. in the Subgenus Blitum is sect. Pseudoblitum, which contains C. rubrum
and Sect. Glauca which contains C. glaucum. This grouping of Chenopodium subg.
Blitum is also strongly supported by our results from molecular data analysis of nuclear
and chloroplast regions. Chenopodium simplex belongs to subg. Chenopodium sect.
Grossefoveata and is the only North American species classified under the section. The
leaves of C. simplex are large in size and they resemble maple (Acer spp.) shaped leaves.
Chenopodium murale, which belongs to subsect. Undata, forms a separate clade from C.
simplex based on ITS, but matK and trnD-trnT sequence data support it forming a clade
with C. simplex.

114
The phylogenetic tree was not well resolved for the subsect. Favosa (C.
berlandieri, C. ficifolium, C. quinoa) and subsect. Chenopodium (C. album, C. strictum).
Two accessions labeled as species within the subsect. Favosa, C. berlandieri 1 and C.
bushianum were found to be more closely related to C. album. The morphological and
molecular data supported the position of these two accessions in the C. album group. The
best explanation is that these accessions are misidentified as both these species did not
had the honeycomb pitted pericarp, and the DNA content values were also more close to
C. album as compared to C. berlandieri (Table 3.3). Rana et al 2010 also used the same
accession of C. bushianum and they also reported that C. bushianum is more related to C.
album than C. berlandieri species.
Within the subsect. Chenopodium, we were not successful in finding any
polymorphic sites between C. album and C. strictum. Phylogenetic analyses of ITS and
trnD-trnT revealed similar results, but sequences from matK did not improve the
resolution of phylogenetic tree. The morphological differentiating characters between C.
album and C. strictum were the size of the seeds (small as compared to C. album), and C.
strictum having a smaller 2C values than C. album. Although the chromosomes were not
counted for Chenopodium species, but based on the 2C values, we expect that C. strictum
to be a diploid and may be an ancestor to hexapolid C. album.
Chenopodium Diversity and Glyphosate-Based Species Shift in the North Central
States
The third objective of our research was to use the informative sequence data and
investigate if the samples from North Central states belong to C. album or if there is

115
diversity in Chenopodium species which might indicate a species shift. For the ease of
amplifying the ITS region with universal primers and having more parsimony
informative character (35%), ITS loci was sequences from Chenopodium populations.
The molecular data from the ITS region was in accordance with the morphological data
that is used by the taxonomist for classifying the Chenopodium genus (Clemants and
Moysakin, 1996).
In chapter 2, we found that when we screened different populations of
Chenopodium from the North Central states, there was variability in response to the
application of glyphosate herbicide. In this section, using the ITS markers, first we
investigated if there is any population structure across the North Central states and then
we investigated if there is any population structure between glyphosate resistant (R) and
sensitive (S) samples.
ITS region from 24 populations of Chenopodium populations across the North
Central states (7R, 5S and 12 Untreated), were sequenced. The consensus sequences were
then aligned with Clustal W and manually adjusted. Neighbor joining (NJ) method of tree
construction was used for these Chenopodium populations and selected accessions from
the C. album and C. berlandieri groups. Bootstrap values were calculated to estimate the
reliability of the tree (Figure 3.13). The NJ tree revealed two results. First, all the
Chenopodium populations from the North Central states grouped into the same cluster as
Chenopodium album, indicating that all sampled populations are more closely related to
C. album than to other weedy Chenopodium species. Furthermore, there was no
separation based on the geographic location. With additional support from DNA content
values and plant morphology (personal observations), we conclude that the samples

116
tested were different biotypes of C. album. The second result is that no apparent structure
was observed for R and S samples. Had the tree separated the Chenopodium plants based
on whether they were resistant or sensitive, it would have indicated that under glyphosate
selection pressure, there might be shift in population to more tolerant species. In
conclusion, the variability in responses to glyphosate among populations from different
states cannot be attributed to variable response among the Chenopodium species. Further,
the reported increase of glyphosate resistance in common lambsquarters are likely due to
evolution of C. album rather than a shift towards more tolerant Chenopodium species.

117
Figure 3.13. Neighbor joining tree of Chenopodium populations sampled across the
North Central states and selected species based on ITS sequences. Bootstrap values
greater than 50% are shown above the branches.

118
3.5 Conclusions
The Chenopodium species were investigated using morphological, cytogenetic
and molecular data. Some morphological characters such as surface pattern of pericarps
and presence or absence of keel on the perianth are informative characters. Many
quantitative characters were also used, but due to phenotypic plasticity and similar
growth habits, these characters overlapped within and among the species, hence did not
prove to be useful in identifying species. The DNA content analysis proved to be an
important technique and helped in separating C. album (hexaploid) from C. berlandieri
(tetraploid) and C. strictum (diploid). Using the DNA content values is a challenge if
used alone because of the presence of polyploidy C. album. This means that C. album
that is a tetraploid will be no different than C. berlandieri or C. quinoa as both of these
species are also tetraploid.
Sequence data from three loci (ITS, matK and trnD-trnT) all resulted in similar
tree topologies. However, the ITS region contained the most polymorphic sites and hence
was considered the best marker in the current study. The phylogeny based on ITS region
was well resolved and was in accordance with the taxonomic classification of
Chenopodium genus (Moyaskin and Clements 2004). The only limitation of the ITS
molecular markers was that they did not differentiate C. strictum from C. album. The best
explanation for the grouping of C. album and C. strictum can be deduced from the DNA
content values for these two species. Both are in the same subsect. Chenopodium and it is
possible that diploid C. strictum is a recent ancestor of hexaploid C. album. Accessions
labeled C. bushianum and C. berlandieri 1 were found to be more closely related to C.
album than C. berlandieri. The molecular data, DNA content values and morphological

119
characters all indicate that these accessions are actually biotypes of C. album and have
been misidentified. Another finding was that all the Chenopodium populations sampled
across the North Central states belong to C. album, so decreased sensitivity to glyphosate
is due to variation within that species rather than a shift in species.
3.6 Sources of Materials
1 SAS 9.2 software, SAS Institute Inc., Cary, NC 27513-2414, USA.
2 Beckman Institute for Advanced Science and Technology 405 North Mathews, Urbana,
IL 61801, USA.
3 Taq polymerase, Promega Corporation 2800 Woods Hollow Road Madison, WI 53711
4 QUIAquick PCR Purification Kit, 27220 Turnberry Lane Suite 200, Valencia,
California 91355, USA.
5 AB Big Dye Terminator v3.1 Cycle Sequencing Kit, Applied Biosystems Inc.,850
Lincoln Centre Drive,Foster City, CA 94404, USA.
6 Sequencher
TM 4.7 software, Gene Codes Corporation, 775 Technology DriveSuite
100A, Ann Arbor, MI 48108, USA.
7 W.M. Keck Center for Comparative and Functional Genomics, University of Illinois
Biotechnology Center, 340 Edward R. Madigan Laboratory, 1201 W. Gregory Drive,
Urbana, IL 61801, USA.

120
3.7 Literature Cited
Aellen P (1929). Beitrag zur systematic der Chenopodium-Arten Amerikas, vrowiegend
auf Grund der Sammulung des United States national Museum in
Washington.D.C.I. Feddes Repert. Specierum Nov. Regni Veg.26:31-64:119-160.
Aellen P and Just T (1943). Key and Synopsis of the American species of the genus
Chenopodium L. Amer. Midl. Mat. 30:47-76.
Anderson W R (1999). Genetic relationships among 19 accessions of six species of
Chenopodium L. by random amplified polymorphic DNA fragments (RAPD).
Euphytica 105:25-32.
APG II (2003). An update of the angiosperm phylogeny group classification for the
orders and families of flowering plants. APG II. Bot. J. Linn. Soc. 141:399-436.
Bashir A, Biradar DP and Rayburn AL (1995). Determining relative abundance of
specific DNA sequences in flow cytometrically sorted maize nuclei. J. Exp. Bot.
285: 451-457.
Basset IJ and Crompton CW (1982). The genus Chenopodium in Canada. Canada J. Bot.
60:586-610.
Bennett MD, Bhandol P, Leitch IJ (2000). Nuclear DNA amount in angiosperms and
their modern uses-807 new estimates. Annals of Bot. 86:859-909.
Bhargava A, Shukla S and Ohri D (2006). Karyotypic studies on some cultivated and
wild species of Chenopodium (Chenopodiaceae). Gen. Res. Crop Evol. 53:1309-
1320.

121
Biradar DP and Rayburn AL (1993). Heterosis and nuclear DNA content in maize.
Heredity. 71:300-304
Clemants SE and Mosyakin S (2004). Chenopodium (Chenopodiaceae). In. Flora of
North America Editorial Committee [eds.] Flora of North America. Vol.4. 275-
299. Oxford Press, New York, NY.
Cole MJ (1961). Interspecific relationships and intraspecific variation of Chenopodium
album L. in Britain. Watsonia 5:47-58.
Crawford DJ and Reynold JF (1974). A numerical study of the common narrow-leaved
taxa of Chenopodium occurring in the Western United States. Brittonia 26(4):
398-410.
Crovello TJ (1968). A numeric study of the genus Salix, section Sitechinsis. Univ Calif.
Publ. Bot. 44:1-61.
Downie SR and Palmer JD (1991). Use of chloroplast DNA rearrangements in
reconstructing plant phylogenies. In Molecular Systematics (Soltis DE and Doyle
JJ eds). New York: Chapman and Hall.
Downie SR, Katz-Downie DS and Cho KJ (1997). Relationship in the Caryophyllales as
suggested by phylogenetic analyses of partial chloroplast DNA ORF2280
homolog sequences. Am. J. of Bot. 84 (2):253-273.
Downie SR. and Palmer JD (1994). A chloroplast DNA phylogeny of the caryophyllales
based on structural and inverted repeat restriction site variation. Systematic Bot.
19:236-252.
Doyle JJ and Doyle JL (1987). A rapid DNA isolation procedure from small quantities of
fresh leaf tissues. Phytochem. Bull. 19:11-15.

122
Duke JL and Crawford DJ (1979). Character compatibility and phyletic relationships in
several closely related Species of Chenopodium of the Western United States.
Taxon 28(4): 307-314.
Dwivedi B and Gadagkar SR (2009). Phylogenetic inference under varying proportions
of indel-induced alignment gaps. BMC Evol. Biol. 9:211.
Edgar RC (2004). MUSCLE: multiple sequence alignment with high accuracy and high
throughput. Nucleic Acids Research. 32(5):1792-1797.
Edgar RC and Batzoglou S (2006). Multiple sequence alignment with high accuracy and
high throughput. Current Opinion in Structural Biol. 16:368-373.
Eernisse DJ, Kluge AG (1993). Taxonomic congruence versus total evidence, and
amniote phylogeny inferred from fossils, molecules, and morphology. Mol. Biol
Evol. 10:1170–1195.
Egan AN and Crandall KA (2008). Incorporating gaps as phylogenetic characters across
eight DNA regions: Ramifications for North American Psoraleeae
(Leguminosae). Mol. Phylo. Evol. 46 (2):532-46.
Felsenstein J (1985). Confidence limits on phylogenies: An approach using the bootstrap.
Evolution 39:783-791.
Gangopadhyay G, Das S and Mukherjee KK (2002). Speciation in Chenopodium in West
Bengal, India. Genet. Res. Crop Evol. 49:503-510.
Giannasi DE, Zurawski G, Learn G and Clegg MT (1992). Evolutionary relationships of
the Caryophyllidae based on comparative rbcL sequences. Systematic Bot. 17:1-
15.

123
Gilmartin AJ (1969). The quantification of some plant-taxa circumscriptions. Amer. J.
Bot. 56: 654-663.
Giusti L (1970). El genero Chenopodiumin Argentina I. Numero de cromosomos.
Darwiniana 16:98-105.
Heap I (2010). The International Survey of Herbicide Resistant Weeds. Online.
Internet. May 2010. Available www.weedscience.com
Heiser CB, Soria J and Burton DL. (1965). A numerical taxonomic study of Solanum
species and hybrids. Amer. Naturalist. 99:471-488.
Holder M and Lewis PO (2003). Phylogeny estimation: Traditional and Bayesian
approaches. Nature 4:275-284.
Iljin MM (1936). Chenopodiaceae. 2-354 in V.L.Komorov ed., Flora USSR . Akademiia
Nauk, Leningrad.
Judd W S and Ferguson IK (1999). The genera of Chenopodiaceae in the southeastern
United States. Harvard Pap. Bot. 4:365-416.
Kadereit G, Gotzek D, Jacobs S and Freitag H (2005). Origin and age of Australian
Chenopodiaceae. Organisms, Diversity and Evolution. 5:59-80.
Karcz J, Kolano B and Maluszynska J (2005). SEM studies on fruit and seedof some
Chenopodium L. species (Chenopodiaceae). XII International conference on plant
embryology, 5-7 Sept.2005, Cracow, Poland.
Katoh K and Toh H (2008). Recent developments in the MAFFT multiple sequence
alignment program. Briefings in Bioinformatics. 9(4):286-298.
Kim KJ and Jansen RK (1995). ndhF sequence evolution and the major clades in the
sunflower family. Proc. Natl. Acad. Sci., USA. 92:10379-10383.

124
Kron K A, Judd WS, Stevens PF, Crayn DM, Anderberg A, Gadek PA, Quinn CJ and
Luteyn JL (2002). Phylogenetic classification of Ericaceae: molecular and
morphological evidence. Bot. Review. 68:335-423.
Kurashinge NS and Agarwal AA (2005). Phenotypic plasticity to light competition and
herbivory in Chenopodium album (Chenopodiaceae). Am. J. of Bot. 92(1):21–26.
Maddison WP, Maddison DR (2009) Mesquite: a modular system for evolutionary
analysis. Version 2.72. http://mesquiteproject.org
Mason SL. et al. (2005), Development and use of microsatellite markers for germplasm
characterization in quinoa (Chenopodium quinoa Willd.). Crop Sci. 45:1618-
1630.
Maughan PJ et al. (2006) Molecular and cytological characterization of ribosomal RNA
genes in Chenopodium quinoa and Chenopodium berlandieri. Genome. 49:825-
839.
Moquin-Tandon A (1840). Chenopodearum Monographica Enumeratio Paris, France:
Loss.
Mosyakin SL and Clemants SE (1996) New infrageneric taxa and combinations in
Chenopodium L. (Chenopodiaceae). Novon, 6: 398-403.
Mullan LJ (2002). Multiple sequence alignment--the gateway to further analysis. Brief
Bioinform. 3:303-305.
Muller KF (2006). Incorporating information from length-mutational events into
phylogenetic analysis. Mol. Phylogenet. Evol. 38:667-676.
Notredame C, Higgins D and Heringa J (2000)"T-Coffee: A novel method for multiple
sequence alignments." J. Mol. Biol. 302: 205-217.

125
Ogden TH, Rosenberg MS (2007). How should gaps be treated in parsimony? A
comparison of approaches using simulation. Mol. Phylo. Evol. 42:817-826.
Ohri D (1998). Genome size variation and panst systematics. Annals of Bot. 82: 75-83.
Ornduff R and Crovello TJ (1968). Numeric taxonomy of Limnanthaceae. Amer. J. Bot.
55: 173-182.
Owen R (1843). Lectures on the comparative anatomy and physiology of the invertebrate
animals, delivered at the Royal College of Surgeons, in 1843, Longman, Brown,
Green and Longmans, London.
Phillips AJ (2006). Homology assessment and molecular sequence alignment. Journal of
Biomedical Informatics. 39:18-33.
Posada D and Buckley TR (2004). Model selection and model averaging in
phylogenetics; advantage of Akaike information criterion and Bayesian
approaches over likelihood ratio tests. Systematic Biol. 53:793-808.
Posada D and Crandall KA (1998). Modeltest: testing the model of DNA substitution.
Bioinformatics. 14:817-818.
Price HJ (1976). Evolution of DNA content in higher plants. The Bot. Review. 42 (1):
27-52.
Rahiminejad MR and Gornall RJ (2004). Flavenoid evidence for allopolyploidy in the
Chenopodium album aggregate (Amaranthaceae). Plant Syst. Evol. 246: 77-87.
Rana TS, Narzary D and Ohri D (2010). Genetic diversity and relationships among some
wild and cultivated species of Chenopodium L. (Amaranthaceae) using RAPD
and DAMD methods. Current Sci. 98(6): 840-846.

126
Rayburn AL, Auger JA, Benzinger EA, and Hepburn AG (1989). Detection of
intraspecific DNA content variation in Zeamays L. by flow cytometry. J. Exp.
Bot. 40: 1179–1183
Rettig JH, Wilson HD and Manhart JR (1992). Phylogeny of the Caryophyllales: Gene
Sequence data. Taxon 41:210-209.
Rodman JE (1990). Centrospermae revisited. Plant Taxon 39:383-393.
Ronquist F and Huelsenbeck JP (2003). MrBayes3: Bayesian phylogenetic inference
under mixed models. Bioinformatics. 19:1572-1574.
Ruas PM, Bonifacio A, Ruas CF, Fairbanks DJ and Andersen WR (1999). Genetic
relationship among 19 accessions of six species of Chenopodium L., by random
Amplified Polymorphic DNA fragments (RAPD). Euphytica 105:25-32.
Sederberg MC, Maughan PJ, Kolano BA, Meldrum B and Jellen EN (2009). Genome
relationships in New World Chenopodium species: I. Evidence from Fluorescent
in situ Hybridization. Proceedings Plant & Animal Genomes XVII Conference.
Simmons MP, Ochoterena H (2000) Gaps as characters in sequence-based phylogenetic
analyses. Systematic Biol. 49:369-381.
Simmons MP, Orchoterena H and Carr TG (2001). Incorporation, relative homoplasy,
and effects of gap characters in sequence-based phylogenetic analyses. Systematic
Biol. 50:454-462.

127
Soliai MM, Maughan PJ, Espinoza-Herrera PA
, Fuentes
F, King B, Petty BA, Raney J,
Adhikary D, Elzinga D , Leggett A, Coleman CE, Stevens
MR, Udall JA, and
Jellen EN (2009). Genome relationship in New World Chenopodium species:
Evidence from DNA sequencing. Abstract 32. Plant & Animal Genomes XVII
Conference.
Swofford D L, Olsen GJ, Waddell PJ and Hillis DM(1996). In Molecular Systematics
(eds Hillis DM, Moritz C and Mable BK.) 407-514 (Sinauer Associates,
Sunderland, Massachusetts, 1996).
Swofford, DL (2003). PAUP*. Phylogenetic Analysis Using Parsimony (*and Other
Methods). Version 4. Sinauer Associates, Sunderland, Massachusetts.
Tamura K, Dudley J, Nei M and Kumar S (2007). MEGA4: Molecular Evolutionary
Genetics Analysis (MEGA) software version 4.0. Mol. Biol. Evol. 24:1596-1599.
Thompson JD, Higgins DG and Gibson TJ (1994). CLUSTAL W: improving the
sensitivity of progressive multiple sequence alignment through sequence
weighting, position-specific gap penalties and weight matrix choice. Nucleic
Acids Res. 22:4673-4680.
USDA, NRCS. (2008). The PLANTS Database (http://plants.usda.gov, March, 2009).
National Plant Data Center, Baton Rouge, LA 70874-4490 USA.
Utolia P (1978). Variation, distribution and taxonomy of Chenopoium suecicum and C.
album in Europe. Acta Bot. Fennica. 108:1-35.
Wahl HA (1954). A preliminary study of the genus Chenopodium in North America.
Bartonia. 27:1-46.

128
Walters TW (1987). Electrophoretic evidence for the evolutionary relationship of the
tetraploid Chenopodium berlandieri to its putative diploid progenitors.
Selbyana.10:36-55.
Wang S, Tsuchiya T and Wilson HD (1993). Chromosome studies in several species of
Chenopodium from North and South America. J. Genet. Breeding. 47(2):163-170.
Wetzel DK, Horak MJ, and Skinner DZ (1999). Use of PCR-based molecular markers to
identify weedy Amaranthus species. Weed Sci. 47:518-523.
Wilson HD (1980). Artificial hybridization among species of Chenopodium sect.
Chenopodium. Systematic Bot. 5:253-263.
Young ND and Healy J (2003) GapCoder automates the use of indel characters in
phylogenetic analysis. BMC Bioinformatics. 4:6.
Zhou D, Wang T and Valentine I (2005). Phenotypic plasticity of life-history characters
in response to different germination timing in two annual weeds. Can. J. Bot. 83:
28-36.
129
CHAPTER 4
SUMMARY
4.1 Conclusions and Future Directions
Weed management is a significant challenge in agricultural systems. Every year,
new weed species are added to the list of resistant weeds (Heap, 2010). There are several
ways to manage weeds but the first step is to correctly identify them. In the past, several
researchers have systematically investigated complex weed species (Ogg et al. 1981;
Schilling 1981), but not much research has been done in understanding the weedy
Chenopodium complex. The weedy Chenopodium complex is not well understood within
the North Central states and there are ongoing reports that the complex is becoming more
difficult to control with glyphosate.
The overall purpose of this dissertation was to understand the Chenopodium
complex and to develop markers that can identify and differentiate various species of
Chenopodium. Prior to this research, several reports were published suggesting increase
in tolerance of common lambsquarters populations to glyphosate. Also, we know from
the taxonomic studies in Chenopodium that several of the weedy Chenopodium species
are so closely related that it is very difficult to differentiate the species in the field.
Towards our objectives, we first investigated the response of different
Chenopodium species to glyphosate, followed by screening populations from the North
Central to glyphosate. We observed inter- and intra-species variation in response to
glyphosate, and within the samples from the North Central states, we observed variability
within and among the populations from one state. Although C. album is considered as

130
the main weed present in agricultural fields, we did find other species (C. ficifolium and
C. berlandieri) that were more tolerant than most C. album populations.
The variability in response of Chenopodium species and populations led to an
interesting question. Are the samples that are less sensitive to glyphosate actually C.
album, or there is shift in species towards more tolerant Chenopodium species. To test
the hypothesis of shift in weed species, we developed sequence based markers that can be
used to differentiate the species. Results from morphological and molecular markers
showed that morphological characters are highly variable and of little taxonomic value.
Among the three loci examined, ITS sequence data proved to be most useful in
segregating Chenopodium species. Some species that shared homologous genes were not
resolved, however the DNA content analysis helped in discriminating these closely
related species that did not differ in ITS sequences.
Implications from this research are that variability in response to glyphosate
among populations from different states cannot be attributed to differences among the
Chenopodium species. Instead, the increased reports of glyphosate resistance in common
lambsquarters is due to evolution within C. album rather than a species shift. However,
some other weedy Chenopodium species outperform C. album under herbicide
treatments, so farmers should remain vigilant as species like C. ficifolium and C.
berlandieri also have the potential of developing high level of tolerance to glyphosate.
Based on the results from this research working with the Chenopodium complex,
we conclude that the best approach to study this genus includes:
1) Studying morphological characters such as seed pericarp structure (honeycomb
pitted or smooth), seed orientation on the fruit (vertical or horizontal) and perianth

131
structure (keeled or not). All these characters were useful in differentiating some
species from others. Most of the vegetative characters have high levels of
homoplasy and hence cannot be used successfully.
2) Using loci that have high number of polymorphic sites. We investigated ITS,
matK and trnD-trnT spacer, but we should look for loci that are more
polymorphic to better distinguish closely related species.
3) Using DNA content analysis to determine the genome size which proved to be of
great help in differentiating those species which have high similarity in the DNA
sequences. We were able to differentiate C. album from C. strictum mainly due to
the difference in their genome size.
A take home message from this research is that all the methods described above
for species identification can be successfully used to detect one or another species, but a
single marker cannot resolve the whole genus. In this research, we took a multi-faceted
approach and were successful in understanding the taxonomic makeup of this weedy
complex. Future work should incorporate more molecular, morphological and
cytogenetic approaches in understanding complex genomes.
Another important aspect of this genus is its reported potential to form hybrids.
In the present study, the hybridization potential was not explored, but based on the
congruence of results from nuclear and chloroplast markers, we found no evidence for
hybrids in our samples. It will also be interesting to include multiple samples of C. album
that are diploid, tetraploid and hexaploid and then examine whether there are differences
associated with ploidy level. It would also be valuable to explore how tetraploid C. album
differs from C. berlandieri, another tetraploid species in the genus.

132
This research was not aimed at taxonomic revision or providing a detailed
phylogenetic relationship among the species, but it again proved that Chenopodium is a
complex group and taxonomists should work more on this genus to develop easy
identification keys and should explore more informative markers to develop a robust
phylogeny. In this research, we showed that to investigate complex problems, weed
scientists can use molecular, cytogenetic and phylogenetic approaches, and the combined
data will yield more conclusive results.
4.2 Literature Cited
Heap I (2010). The International Survey of Herbicide Resistant Weeds. Online.
Internet. May 2010. Available www.weedscience.com
Ogg Jr AG, Rogers BS and Schilling EE (1981). Characterization of black nightshade
(Solanum nigrum) and related species in the United States. Weed Sci. 29:1 27-32.
Schilling EE (1981). Systematics of Solanum sect. Solanum (Solanaceae) in North
America. Systematic Bot. 6(2):172-185.