understanding risk factors in cardiac rehabilitation ... · understanding risk factors in cardiac...
TRANSCRIPT

Understanding Risk Factors in Cardiac Rehabilitation Patients
with Random Forests and Decision Trees
Alina Van1 Valerie C. Gay
1 Paul J. Kennedy
1 Edward Barin
2 Peter Leijdekkers
1
1Faculty of Engineering and Information Technology
University of Technology, Sydney
PO Box 123, Broadway 2007, New South Wales, Australia
2Department of Cardiology
Royal North Shore Hospital
Reserve Road, St Leonards 2065, New South Wales, Australia
[email protected], [email protected], [email protected],
[email protected], [email protected]
Abstract
Cardiac rehabilitation is a well-recognised non-pharmacological intervention recommended for the
prevention of cardiovascular disease. Numerous studies
have produced large amounts of data to examine the above
aspects in patient groups. In this paper, datasets collected
for over a 10 year period by one Australian hospital are
analysed using decision trees to derive prediction rules for
the outcome of phase II cardiac rehabilitation. Analysis
includes prediction of the outcome of the cardiac rehabilitation program in terms of three groups of
cardiovascular risk factors: physiological, psychosocial
and performance risk factors. Random forests are used for
feature selection to make the models compact and
interpretable. Balanced sampling is used to deal with
heavily imbalanced class distribution. Experimental
results show that the outcome of phase II cardiac
rehabilitation in terms of physiological, psychosocial and
performance risk factor can be predicted based on initial
readings of cholesterol level and hypertension, level
achieved in six minute walk test, and Hospital Anxiety and
Depression Score (HADS) anxiety score and HADS depression score respectively. This will allow for
identifying high risk patient groups and developing
personalised cardiac rehabilitation programs for those
patients to increase their chances of success and minimize
their risk of failure. .
Keywords: cardiac rehabilitation, decision trees, random forests, feature selection, balanced sampling.
1 Introduction
Cardiovascular disease is the leading cause of death in the majority of developing and developed countries.
Although the healthcare industry has greatly advanced in
detection and treatment of most heart diseases, heart
failure continues to produce a heavy burden of
Copyright © 2011, Australian Computer Society, Inc. This paper appeared at the 9th Australasian Data Mining Conference (AusDM 2011), Ballarat, Australia. Conferences in Research and Practice in Information Technology (CRPIT), Vol. 121. Peter
Vamplew, Andrew Stranieri, Kok-Leong Ong, Peter Christen and Paul Kennedy, Eds. Reproduction for academic, not-for profit purposes permitted provided this text is included.
cardiovascular morbidity and mortality in the majority of industrialised countries (Davies et al. 2010; Lavie, Milani
and Ventura 2009; Noy 1998; Rivett et al. 2009).
Cardiac rehabilitation, the care of patients with heart
diseases, was defined by the World Health Organisation as
„the sum of activities required to influence favourably the
underlying cause of the disease, as well as the best possible
physical, mental and social conditions, so that they may,
by their own efforts, preserve or resume when lost, as
normal a place as possible in the community‟ (Noy 1998).
It averts the recurrence of cardiovascular events, and
increases life expectancy. Particularly, the lowering of
cardiovascular morbidity and mortality risk, at least to a certain extent, is ascribed to an increase in exercise
capacity (Hansen et al. 2010). Thus, current guidelines
highlight the importance of physical activity in cardiac
rehabilitation, and ascertain exercise training as a
recognised non-pharmacological intervention
recommended for both the primary (avoidance of the
development of a disease) and secondary (early disease
detection) prevention of heart diseases (Guiraud et al.
2010). Importantly, education, counselling and
behavioural interventions to promote lifestyle change and
modify risk factors have become an increasingly significant part of cardiac rehabilitation programs (Goble
and Worcester 1999).
Cardiac rehabilitation conventionally consists of phase
I (inpatient cardiac rehabilitation), phase II (outpatient
cardiac rehabilitation), and phase III (maintenance). It
starts with an inpatient hospital-based program which is
delivered on an individual basis or to groups of patients.
Due to the short hospital stays and time-consuming
examinations, phase I programs are mostly limited to early
mobilisation and education and do not include an exercise
training component. Furthermore, it is recognised that inpatient cardiac rehabilitation may be ineffective because
of the psychological state of patients soon after the acute
event. Outpatient hospital-based programs last from two
to four months. The content of phase II cardiac
rehabilitation varies greatly from hospital to hospital. It
usually includes group exercises, education and
counselling. In the maintenance phase, exercise training
and heart disease risk control „are supported in minimally
supervised or unsupervised setting‟ (Goble and Worcester
1999). Maintenance programs are even more varied in
Proceedings of the 9-th Australasian Data Mining Conference (AusDM'11), Ballarat, Australia
11
content and structure than outpatient cardiac rehabilitation
programs. In the case of phase III cardiac rehabilitation,
patients may receive further education, psychosocial
support and exercise classes. Patients may also be
regularly reviewed by a physician.
This study focuses on phase II cardiac rehabilitation and investigates the importance of physiological,
psychosocial and performance risk factors of heart disease
in terms of the prognostic value for cardiac events.
Physiological factors include cholesterol level, body mass
index (BMI), waist circumference, hypertension, smoking
and diabetes. Psychosocial risk factors include anxiety
and depression measured using Hospital Anxiety and
Depression Scale (HADS) (Marques Marcolino 2007).
Performance risk factors include level and metres
achieved in six minute walk test. The primary objective of
this study is to build a classification model that can be used
to predict the outcome of the phase II cardiac rehabilitation program in terms of physiological, psychosocial and
performance risk factors. Note that only the best
prediction models for each group of risk factors were
included in this paper. Section 2 presents related work in
the application domain. Section 3 describes data
preparation procedures. Section 4 illustrates results of
initial data exploration followed by section 5 which
explains methodology used in this study. Section 6
presents results and discusses the experimental results,
medical interpretation of results and variable importance
results. Lastly, section 7 concludes the paper and gives recommendations for future work.
2 Related Work
Existing research affirms that physiological factors, such as cholesterol level, BMI, waist circumference,
hypertension, diabetes and smoking, have a considerable
effect on morbidity and mortality in cardiac patients.
Physiological benefits of exercise training include
improvements in blood lipid parameters, blood
haemodynamics, body anthropometrics, peak oxygen intake, exercise capacity and functional status. These
factors have a great prognosis value on progression of
cardiovascular disease and, therefore, have been examined
in many trials (Austin et al. 2005; Austin et al. 2008;
Brubaker et al. 2009; Delagardelle and Feiereisen 2005;
Kravari et al. 2010). The most important behavioural risk
factors of cardiovascular disease and cerebrovascular
disease are: unhealthy diet, physical inactivity and tobacco
use. These risk factors are responsible for about 80% of
coronary heart disease and cerebrovascular disease (World
Health Organisation 2011).
Psychosocial factors, such as quality of life, depression, somatisation, anxiety and hostility, have considerable
effect on morbidity and mortality in cardiac patients.
Cardiac patients can experience discomfort in their
everyday activities and health-related quality of life
because of their restricted heart capacity. Additionally,
this can reduce patients‟ ability to exercise, which can
further reduce physical fitness making their symptoms
even worse. Deteriorated quality of life, depression and
anxiety have harmful effects „not only on daily social,
domestic, work and leisure activities but also on
rehospitalisation and death rates‟ (Kulcu et al. 2007).
Importantly, a review by Davies et al., conducted in
2010, draws attention to the fact that the risk of death with
exercise in people with mild to moderate heart disease did
not change after the cardiac rehabilitation program.
However, there was a reduction in hospital re-admissions.
It has been also recognised that in both the short and long term, exercise training programs improve health-related
quality of life compared to usual care without exercise
(Almerud Osterberg et al. 2010; Chester 2006; Nilsson et
al. 2008; Noy 1998; Piperidou and Bliss 2008).
Recent studies have also reported decreased levels of
depression and anxiety in cardiac patients as a result of
exercise training (Austin et al. 2005; Davies et al. 2010;
Kulcu et al. 2007). A study by Lavie, Milani and Ventura,
conducted in 2009, asserts that even a slight improvement
in peak oxygen intake leads to improvements in depression
and anxiety scores and, therefore, reduces the risk of acute
events or hospital readmissions. This aligns with the results of another clinical trial that observed a significant
reduction in hospitalisations following improvements in
health-related quality of life in the exercise training group
compared to the control group (Davies et al. 2010).
Importantly, existing research suggests that cardiac
rehabilitation is particularly effective at improving
health-related quality of life in the long term (Austin et al.
2005).
While the physiological benefits help impede
progression of heart disease, exercise capacity and
functional status play an important role in patients‟ health-related quality of life and, thereby, the probability
of an acute event (Brubaker et al. 2009; Delagardelle and
Feiereisen 2005; Kravari et al. 2010). Numerous studies
indicate improvements in functional capacity and exercise
tolerance as a result of exercise training. Austin et al.
(2008) notes the long term benefit of cardiac rehabilitation
in terms of walking distance and perceived exertion.
Exercise training has also been shown to decelerate the
deterioration from baseline performance which contributes
to the main goal of cardiac rehabilitation - enhancement
and sustainability of functional performance. Another
study, conducted in 2010, observed significant improvements in symptomatology, such as: breathlessness
and fatigue; as well as the skeletal muscle metabolism;
peripheral inflammatory markers; and exercise capacity in
chronic heart failure patients (Kravari et al. 2010).
Importantly, it has been recognised that in chronic heart
failure patients, the lack of improvement in exercise
capacity after an exercise training program has strong
prognostic value for cardiac events independent of other
existing symptoms. A study by Tabet et al. (2008)
suggests that patients who do not significantly improve in
exercise capacity after the cardiac rehabilitation program should be carefully monitored.
The discussion above recognises that physiological,
psychosocial and performance risk factors have a great
prognosis value on progression of cardiovascular disease.
Consequently, they have been a subject of many trials and
studies. A data mining experiment by Kajabadi, Saraee
and Asgari (2009) attempted to predict low density
lipoprotein in a population of 1800 people by means of
decision trees, namely Classification and Regression Trees
(CART) and achieved 77.6% accuracy. The most
important variable found for classification was cholesterol
CRPIT Volume 121 - Data Mining and Analytics 2011
12
level. Other important variables for classification were
age, BMI, apolipoproteins, triglycerides level, and
smoking.
Another study used a combination of logistic
regression, C5.0 decision tree, CHAID decision tree,
CART, exhaustive CART and discriminant analysis to select the risk factors of hypertension and hyperlipidemia
and achieved a combined accuracy of 93.07% and
sensitivity of 98.76%. It found blood pressure,
triglycerides, BMI, gender, age, glutamate pyruvate
transaminase (GPT) and uric acid (UA) as risk factors
significant in predicting hypertension. Total cholesterol,
triglycerides and systolic blood pressure were listed as the
hyperlipidemia indicators (Chang, Wang and Jiang 2011).
Also, Smith et al. (2010) found that natriuretic peptides
improve prediction of incident heart failure and atrial
fibrillation in the general population in addition to
conventional risk factors by using regression analysis on a cohort of over 5000 patients.
Assessment of cardiac risk factors using decision trees
established that 'the most important risk factors, as
extracted from the classification rules analysis were: 1) for
myocardial infarction (MI), age, smoking, and history of
hypertension; 2) for percutaneous coronary intervention
(PCI), family history, history of hypertension, and history
of diabetes; and 3) for coronary artery bypass graft surgery
(CABG), age, history of hypertension, and smoking'
(Karaolis et al. 2010). The accuracies achieved were
66%, 75%, and 75% for the MI, PCI, and CABG models, respectively.
To summarise, several studies show that data mining
algorithms assist in the identification of high and low risk
patient groups.
3 Data Preparation
3.1 Data Collection
Patient data used for this study was acquired from the cardiac rehabilitation unit of an Australian hospital. It
contains information on 3931 patients collected as part of
phase II and phase III cardiac rehabilitation program for
the period between 10/01/2000 and 01/03/2011. During
that time content of the program has not changed.
3.2 Data Integration
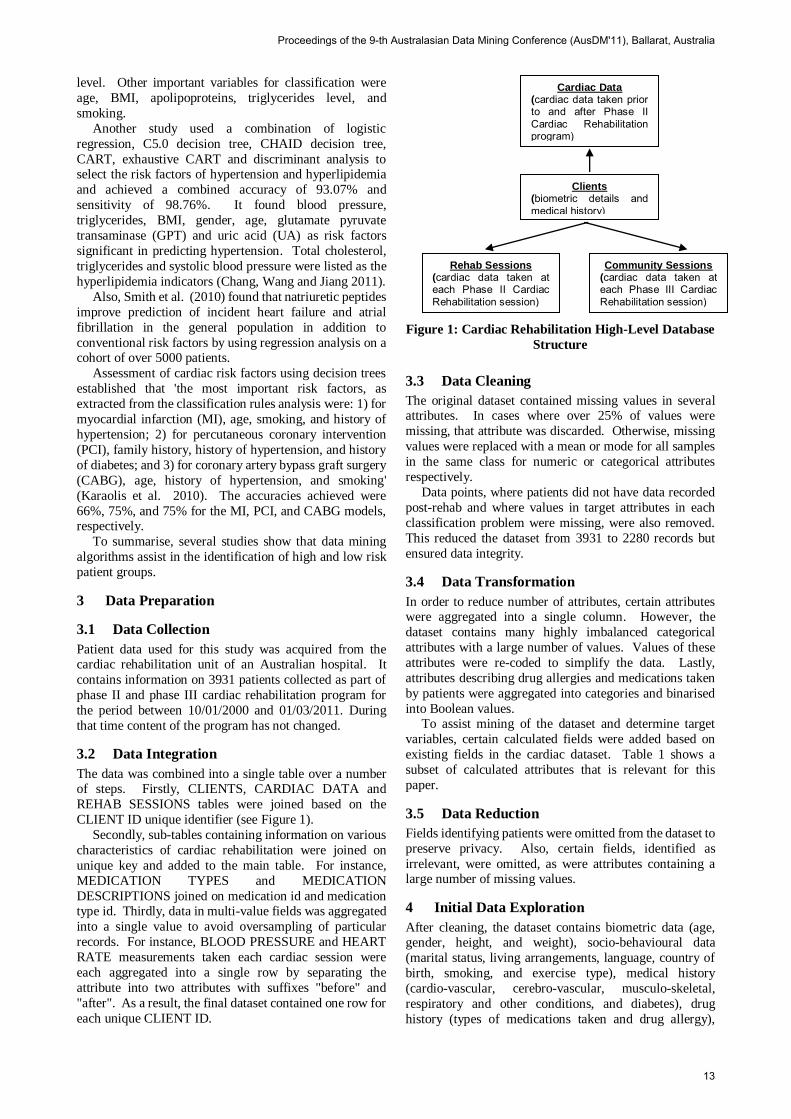
The data was combined into a single table over a number of steps. Firstly, CLIENTS, CARDIAC DATA and
REHAB SESSIONS tables were joined based on the
CLIENT ID unique identifier (see Figure 1).
Secondly, sub-tables containing information on various
characteristics of cardiac rehabilitation were joined on
unique key and added to the main table. For instance,
MEDICATION TYPES and MEDICATION
DESCRIPTIONS joined on medication id and medication type id. Thirdly, data in multi-value fields was aggregated
into a single value to avoid oversampling of particular
records. For instance, BLOOD PRESSURE and HEART
RATE measurements taken each cardiac session were
each aggregated into a single row by separating the
attribute into two attributes with suffixes "before" and
"after". As a result, the final dataset contained one row for
each unique CLIENT ID.
Figure 1: Cardiac Rehabilitation High-Level Database
Structure
3.3 Data Cleaning
The original dataset contained missing values in several attributes. In cases where over 25% of values were
missing, that attribute was discarded. Otherwise, missing
values were replaced with a mean or mode for all samples
in the same class for numeric or categorical attributes
respectively.
Data points, where patients did not have data recorded
post-rehab and where values in target attributes in each
classification problem were missing, were also removed.
This reduced the dataset from 3931 to 2280 records but
ensured data integrity.
3.4 Data Transformation
In order to reduce number of attributes, certain attributes were aggregated into a single column. However, the
dataset contains many highly imbalanced categorical
attributes with a large number of values. Values of these
attributes were re-coded to simplify the data. Lastly,
attributes describing drug allergies and medications taken
by patients were aggregated into categories and binarised
into Boolean values. To assist mining of the dataset and determine target
variables, certain calculated fields were added based on
existing fields in the cardiac dataset. Table 1 shows a
subset of calculated attributes that is relevant for this
paper.
3.5 Data Reduction
Fields identifying patients were omitted from the dataset to
preserve privacy. Also, certain fields, identified as
irrelevant, were omitted, as were attributes containing a large number of missing values.
4 Initial Data Exploration
After cleaning, the dataset contains biometric data (age, gender, height, and weight), socio-behavioural data
(marital status, living arrangements, language, country of
birth, smoking, and exercise type), medical history
(cardio-vascular, cerebro-vascular, musculo-skeletal,
respiratory and other conditions, and diabetes), drug
history (types of medications taken and drug allergy),
Cardiac Data (cardiac data taken prior to and after Phase II Cardiac Rehabilitation program)
Clients (biometric details and medical history)
Rehab Sessions (cardiac data taken at each Phase II Cardiac Rehabilitation session)
Community Sessions (cardiac data taken at each Phase III Cardiac Rehabilitation session)
Proceedings of the 9-th Australasian Data Mining Conference (AusDM'11), Ballarat, Australia
13
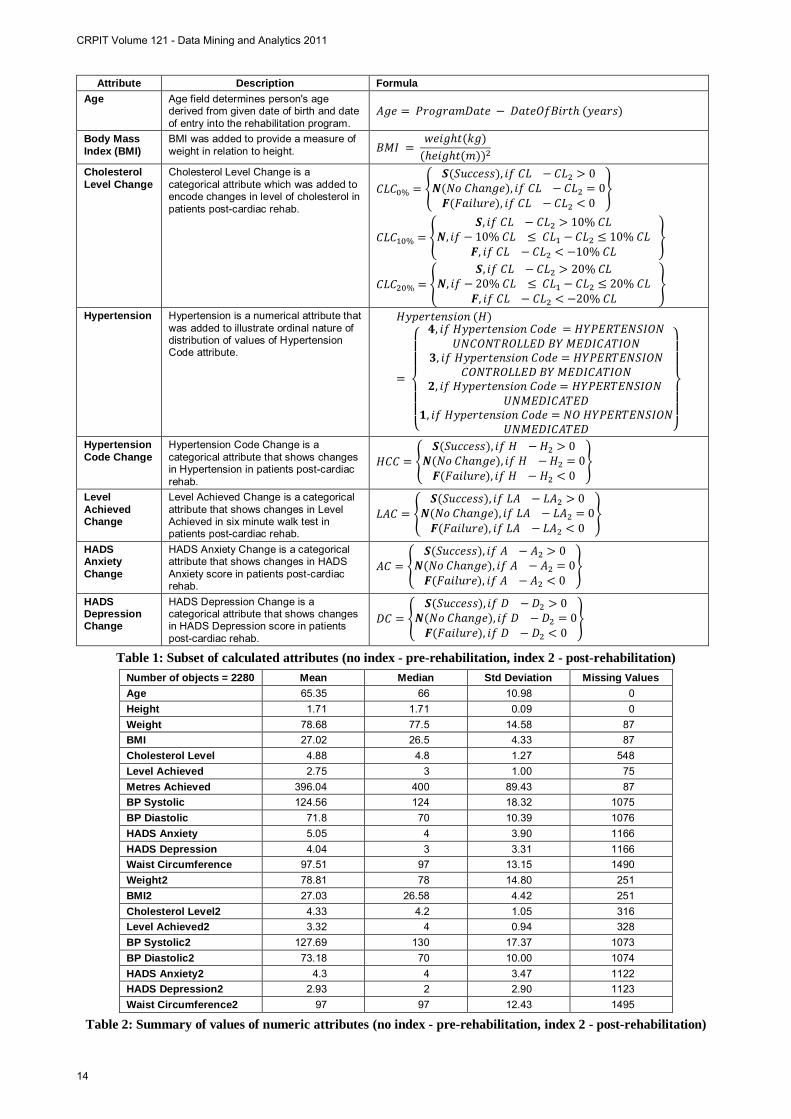
Attribute Description Formula Age Age field determines person's age
derived from given date of birth and date of entry into the rehabilitation program.
Body Mass Index (BMI)
BMI was added to provide a measure of weight in relation to height.
Cholesterol Level Change
Cholesterol Level Change is a categorical attribute which was added to encode changes in level of cholesterol in patients post-cardiac rehab.
Hypertension Hypertension is a numerical attribute that was added to illustrate ordinal nature of distribution of values of Hypertension Code attribute.
Hypertension Code Change
Hypertension Code Change is a categorical attribute that shows changes in Hypertension in patients post-cardiac rehab.
Level Achieved Change
Level Achieved Change is a categorical attribute that shows changes in Level Achieved in six minute walk test in patients post-cardiac rehab.
HADS Anxiety Change
HADS Anxiety Change is a categorical attribute that shows changes in HADS Anxiety score in patients post-cardiac rehab.
HADS Depression Change
HADS Depression Change is a categorical attribute that shows changes in HADS Depression score in patients post-cardiac rehab.
Table 1: Subset of calculated attributes (no index - pre-rehabilitation, index 2 - post-rehabilitation)
Number of objects = 2280 Mean Median Std Deviation Missing Values Age 65.35 66 10.98 0 Height 1.71 1.71 0.09 0 Weight 78.68 77.5 14.58 87 BMI 27.02 26.5 4.33 87 Cholesterol Level 4.88 4.8 1.27 548 Level Achieved 2.75 3 1.00 75 Metres Achieved 396.04 400 89.43 87 BP Systolic 124.56 124 18.32 1075 BP Diastolic 71.8 70 10.39 1076 HADS Anxiety 5.05 4 3.90 1166 HADS Depression 4.04 3 3.31 1166 Waist Circumference 97.51 97 13.15 1490 Weight2 78.81 78 14.80 251 BMI2 27.03 26.58 4.42 251 Cholesterol Level2 4.33 4.2 1.05 316 Level Achieved2 3.32 4 0.94 328 BP Systolic2 127.69 130 17.37 1073 BP Diastolic2 73.18 70 10.00 1074 HADS Anxiety2 4.3 4 3.47 1122 HADS Depression2 2.93 2 2.90 1123 Waist Circumference2 97 97 12.43 1495
Table 2: Summary of values of numeric attributes (no index - pre-rehabilitation, index 2 - post-rehabilitation)
CRPIT Volume 121 - Data Mining and Analytics 2011
14
cardiac data (blood pressure, heart rate, and blood lipid profile), psychosocial data (hospital anxiety and
depression (HADS) scores) and exercise capacity data
(level and metres achieved in six minute walk test). We
conducted an initial data exploration to better understand
the data and develop the most suitable framework for its
analysis.
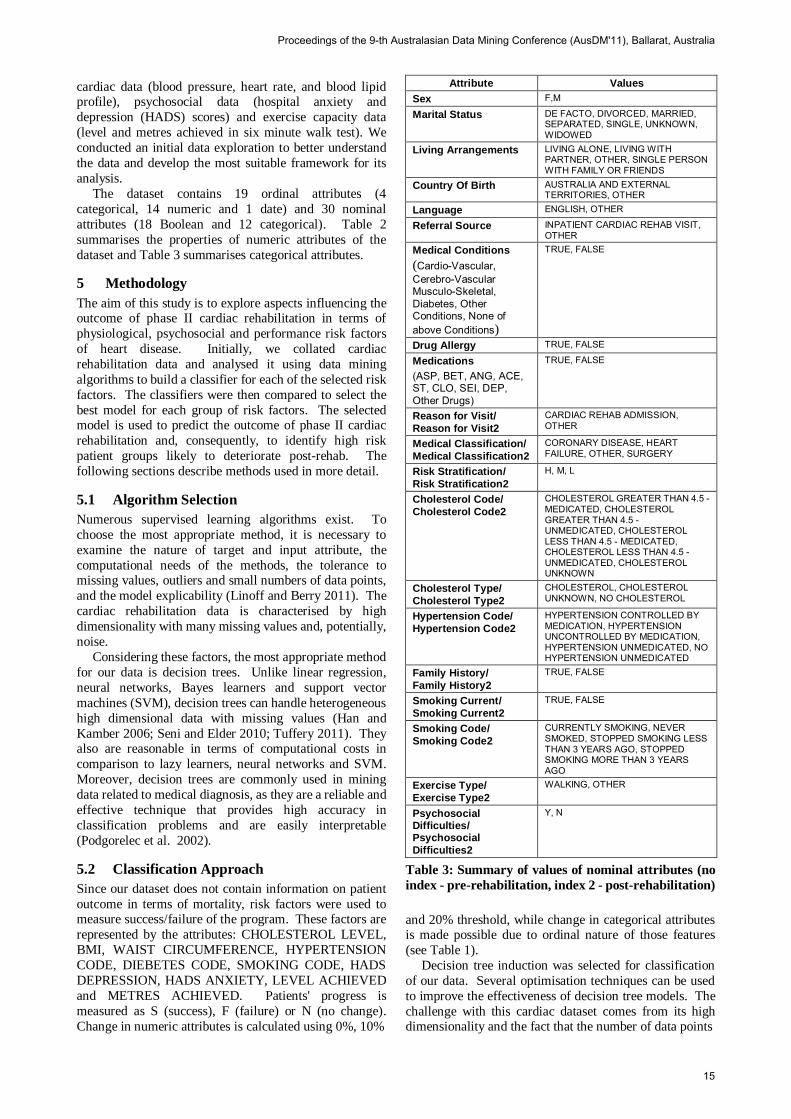
The dataset contains 19 ordinal attributes (4
categorical, 14 numeric and 1 date) and 30 nominal
attributes (18 Boolean and 12 categorical). Table 2
summarises the properties of numeric attributes of the
dataset and Table 3 summarises categorical attributes.
5 Methodology
The aim of this study is to explore aspects influencing the outcome of phase II cardiac rehabilitation in terms of
physiological, psychosocial and performance risk factors
of heart disease. Initially, we collated cardiac
rehabilitation data and analysed it using data mining
algorithms to build a classifier for each of the selected risk
factors. The classifiers were then compared to select the
best model for each group of risk factors. The selected model is used to predict the outcome of phase II cardiac
rehabilitation and, consequently, to identify high risk
patient groups likely to deteriorate post-rehab. The
following sections describe methods used in more detail.
5.1 Algorithm Selection
Numerous supervised learning algorithms exist. To
choose the most appropriate method, it is necessary to
examine the nature of target and input attribute, the
computational needs of the methods, the tolerance to missing values, outliers and small numbers of data points,
and the model explicability (Linoff and Berry 2011). The
cardiac rehabilitation data is characterised by high
dimensionality with many missing values and, potentially,
noise.
Considering these factors, the most appropriate method
for our data is decision trees. Unlike linear regression,
neural networks, Bayes learners and support vector
machines (SVM), decision trees can handle heterogeneous
high dimensional data with missing values (Han and
Kamber 2006; Seni and Elder 2010; Tuffery 2011). They also are reasonable in terms of computational costs in
comparison to lazy learners, neural networks and SVM.
Moreover, decision trees are commonly used in mining
data related to medical diagnosis, as they are a reliable and
effective technique that provides high accuracy in
classification problems and are easily interpretable
(Podgorelec et al. 2002).
5.2 Classification Approach
Since our dataset does not contain information on patient
outcome in terms of mortality, risk factors were used to measure success/failure of the program. These factors are
represented by the attributes: CHOLESTEROL LEVEL,
BMI, WAIST CIRCUMFERENCE, HYPERTENSION
CODE, DIEBETES CODE, SMOKING CODE, HADS
DEPRESSION, HADS ANXIETY, LEVEL ACHIEVED
and METRES ACHIEVED. Patients' progress is
measured as S (success), F (failure) or N (no change).
Change in numeric attributes is calculated using 0%, 10%
Attribute Values Sex F,M
Marital Status DE FACTO, DIVORCED, MARRIED, SEPARATED, SINGLE, UNKNOWN, WIDOWED
Living Arrangements LIVING ALONE, LIVING WITH PARTNER, OTHER, SINGLE PERSON WITH FAMILY OR FRIENDS
Country Of Birth AUSTRALIA AND EXTERNAL TERRITORIES, OTHER
Language ENGLISH, OTHER
Referral Source INPATIENT CARDIAC REHAB VISIT, OTHER
Medical Conditions (Cardio-Vascular, Cerebro-Vascular Musculo-Skeletal, Diabetes, Other Conditions, None of above Conditions)
TRUE, FALSE
Drug Allergy TRUE, FALSE
Medications (ASP, BET, ANG, ACE, ST, CLO, SEI, DEP, Other Drugs)
TRUE, FALSE
Reason for Visit/ Reason for Visit2
CARDIAC REHAB ADMISSION, OTHER
Medical Classification/ Medical Classification2
CORONARY DISEASE, HEART FAILURE, OTHER, SURGERY
Risk Stratification/ Risk Stratification2
H, M, L
Cholesterol Code/ Cholesterol Code2
CHOLESTEROL GREATER THAN 4.5 - MEDICATED, CHOLESTEROL GREATER THAN 4.5 - UNMEDICATED, CHOLESTEROL LESS THAN 4.5 - MEDICATED, CHOLESTEROL LESS THAN 4.5 - UNMEDICATED, CHOLESTEROL UNKNOWN
Cholesterol Type/ Cholesterol Type2
CHOLESTEROL, CHOLESTEROL UNKNOWN, NO CHOLESTEROL
Hypertension Code/ Hypertension Code2
HYPERTENSION CONTROLLED BY MEDICATION, HYPERTENSION UNCONTROLLED BY MEDICATION, HYPERTENSION UNMEDICATED, NO HYPERTENSION UNMEDICATED
Family History/ Family History2
TRUE, FALSE
Smoking Current/ Smoking Current2
TRUE, FALSE
Smoking Code/ Smoking Code2
CURRENTLY SMOKING, NEVER SMOKED, STOPPED SMOKING LESS THAN 3 YEARS AGO, STOPPED SMOKING MORE THAN 3 YEARS AGO
Exercise Type/ Exercise Type2
WALKING, OTHER
Psychosocial Difficulties/ Psychosocial Difficulties2
Y, N
Table 3: Summary of values of nominal attributes (no
index - pre-rehabilitation, index 2 - post-rehabilitation)
and 20% threshold, while change in categorical attributes is made possible due to ordinal nature of those features
(see Table 1).
Decision tree induction was selected for classification
of our data. Several optimisation techniques can be used
to improve the effectiveness of decision tree models. The
challenge with this cardiac dataset comes from its high dimensionality and the fact that the number of data points
Proceedings of the 9-th Australasian Data Mining Conference (AusDM'11), Ballarat, Australia
15
in the target classes is unbalanced. High dimensionality of the data may be addressed with
feature selection. Moreover, systematic analysis of the
importance of different variables provides deep insights
into the different contributions of those features towards
classification and is necessary for developing effective prediction models (Pan and Shen 2009).
Random forests are an appropriate method for both
feature selection and for understanding the importance of
various features. Their performance is generally superior
to single decision trees. Random forest consists of many
decision tree predictors with randomly selected variable
subsets (there is a different subset of training and
validation data for each individual model). After
generating many trees, the resulting class prediction is
based on votes from the single trees. Consequently, lower
ranked variables are eliminated based on empirical
performance heuristics (Han et al. 2006). Two measures of variable importance are used in
random forests: mean decrease accuracy and mean
decrease Gini. These measures can lead to different results
based on the size of dataset, heterogeneity of data points
and dispersion of class values. Mean decrease accuracy is
an internal estimation of the generalisation error generated
by computing the out-of-bag error rate for each bootstrap
sample (Le Cao and McLachlan 2009). Mean decrease
Gini measures the impurity of a split, the Gini index, over
all trees (Kuhn et al. 2008). However, as accuracy does
not take into account the imbalanced nature of the given dataset, we decided to use the mean decrease Gini as the
measure of variable importance for feature selection with
random forest.
During initial experiments we discovered that random-
forest feature selection considerably improves the
effectiveness of the classifier when at least 50% of the
features are removed from the original set; while no
improvement is evident when 25% of the features only are
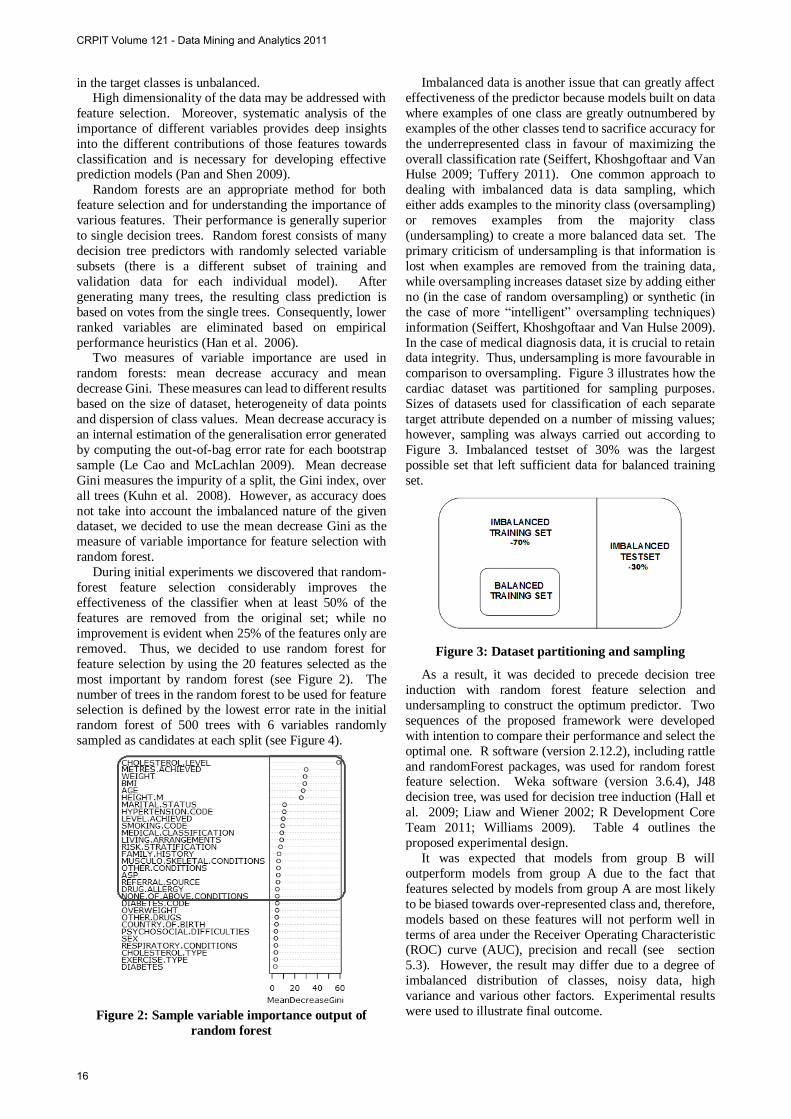
removed. Thus, we decided to use random forest for
feature selection by using the 20 features selected as the
most important by random forest (see Figure 2). The
number of trees in the random forest to be used for feature selection is defined by the lowest error rate in the initial
random forest of 500 trees with 6 variables randomly
sampled as candidates at each split (see Figure 4).
Figure 2: Sample variable importance output of
random forest
Imbalanced data is another issue that can greatly affect
effectiveness of the predictor because models built on data
where examples of one class are greatly outnumbered by
examples of the other classes tend to sacrifice accuracy for
the underrepresented class in favour of maximizing the
overall classification rate (Seiffert, Khoshgoftaar and Van Hulse 2009; Tuffery 2011). One common approach to
dealing with imbalanced data is data sampling, which
either adds examples to the minority class (oversampling)
or removes examples from the majority class
(undersampling) to create a more balanced data set. The
primary criticism of undersampling is that information is
lost when examples are removed from the training data,
while oversampling increases dataset size by adding either
no (in the case of random oversampling) or synthetic (in
the case of more “intelligent” oversampling techniques)
information (Seiffert, Khoshgoftaar and Van Hulse 2009).
In the case of medical diagnosis data, it is crucial to retain data integrity. Thus, undersampling is more favourable in
comparison to oversampling. Figure 3 illustrates how the
cardiac dataset was partitioned for sampling purposes.
Sizes of datasets used for classification of each separate
target attribute depended on a number of missing values;
however, sampling was always carried out according to
Figure 3. Imbalanced testset of 30% was the largest
possible set that left sufficient data for balanced training
set.
Figure 3: Dataset partitioning and sampling
As a result, it was decided to precede decision tree
induction with random forest feature selection and
undersampling to construct the optimum predictor. Two
sequences of the proposed framework were developed
with intention to compare their performance and select the
optimal one. R software (version 2.12.2), including rattle
and randomForest packages, was used for random forest feature selection. Weka software (version 3.6.4), J48
decision tree, was used for decision tree induction (Hall et
al. 2009; Liaw and Wiener 2002; R Development Core
Team 2011; Williams 2009). Table 4 outlines the
proposed experimental design.
It was expected that models from group B will
outperform models from group A due to the fact that
features selected by models from group A are most likely
to be biased towards over-represented class and, therefore,
models based on these features will not perform well in
terms of area under the Receiver Operating Characteristic (ROC) curve (AUC), precision and recall (see section
5.3). However, the result may differ due to a degree of
imbalanced distribution of classes, noisy data, high
variance and various other factors. Experimental results
were used to illustrate final outcome.
CRPIT Volume 121 - Data Mining and Analytics 2011
16
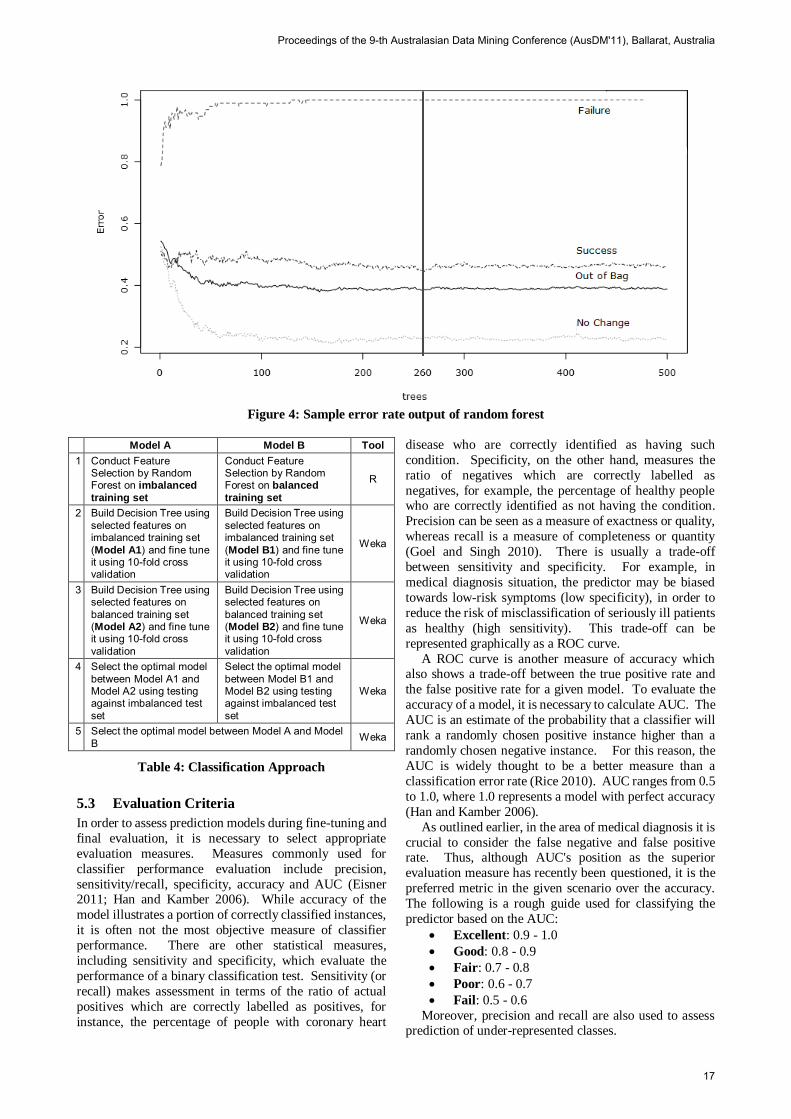
Figure 4: Sample error rate output of random forest
Model A Model B Tool 1 Conduct Feature
Selection by Random Forest on imbalanced training set
Conduct Feature Selection by Random Forest on balanced training set
R
2 Build Decision Tree using selected features on imbalanced training set (Model A1) and fine tune it using 10-fold cross validation
Build Decision Tree using selected features on imbalanced training set (Model B1) and fine tune it using 10-fold cross validation
Weka
3 Build Decision Tree using selected features on balanced training set (Model A2) and fine tune it using 10-fold cross validation
Build Decision Tree using selected features on balanced training set (Model B2) and fine tune it using 10-fold cross validation
Weka
4 Select the optimal model between Model A1 and Model A2 using testing against imbalanced test set
Select the optimal model between Model B1 and Model B2 using testing against imbalanced test set
Weka
5 Select the optimal model between Model A and Model B Weka
Table 4: Classification Approach
5.3 Evaluation Criteria
In order to assess prediction models during fine-tuning and
final evaluation, it is necessary to select appropriate
evaluation measures. Measures commonly used for
classifier performance evaluation include precision,
sensitivity/recall, specificity, accuracy and AUC (Eisner 2011; Han and Kamber 2006). While accuracy of the
model illustrates a portion of correctly classified instances,
it is often not the most objective measure of classifier
performance. There are other statistical measures,
including sensitivity and specificity, which evaluate the
performance of a binary classification test. Sensitivity (or
recall) makes assessment in terms of the ratio of actual
positives which are correctly labelled as positives, for
instance, the percentage of people with coronary heart
disease who are correctly identified as having such
condition. Specificity, on the other hand, measures the
ratio of negatives which are correctly labelled as
negatives, for example, the percentage of healthy people who are correctly identified as not having the condition.
Precision can be seen as a measure of exactness or quality,
whereas recall is a measure of completeness or quantity
(Goel and Singh 2010). There is usually a trade-off
between sensitivity and specificity. For example, in
medical diagnosis situation, the predictor may be biased
towards low-risk symptoms (low specificity), in order to
reduce the risk of misclassification of seriously ill patients
as healthy (high sensitivity). This trade-off can be
represented graphically as a ROC curve.
A ROC curve is another measure of accuracy which also shows a trade-off between the true positive rate and
the false positive rate for a given model. To evaluate the
accuracy of a model, it is necessary to calculate AUC. The
AUC is an estimate of the probability that a classifier will
rank a randomly chosen positive instance higher than a
randomly chosen negative instance. For this reason, the
AUC is widely thought to be a better measure than a
classification error rate (Rice 2010). AUC ranges from 0.5
to 1.0, where 1.0 represents a model with perfect accuracy
(Han and Kamber 2006).
As outlined earlier, in the area of medical diagnosis it is
crucial to consider the false negative and false positive rate. Thus, although AUC's position as the superior
evaluation measure has recently been questioned, it is the
preferred metric in the given scenario over the accuracy.
The following is a rough guide used for classifying the
predictor based on the AUC:
Excellent: 0.9 - 1.0
Good: 0.8 - 0.9
Fair: 0.7 - 0.8
Poor: 0.6 - 0.7
Fail: 0.5 - 0.6
Moreover, precision and recall are also used to assess prediction of under-represented classes.
Proceedings of the 9-th Australasian Data Mining Conference (AusDM'11), Ballarat, Australia
17

6 Results and Discussion
6.1 Experimental Results
Upon completion of the experiment outlined above classification models were compared using the AUC,
precision and recall as described in section 5.3. Table 5 to
7 illustrate performance of resultant models within each
group of risk factors: physiological, psychosocial and
performance risk factors respectively. Note that the best
models based on classification performance are shown in
bold.
Evidently, models with extremely poor performance,
including Cholesterol Level Change (20% threshold),
BMI Change (0%, 10% and 20% threshold), Waist Circumference Change (0%, 10% and 20% threshold),
Diabetes Change, Smoking Change and Metres Achieved
Change, were built on exceptionally imbalanced datasets
which indicates reasons for unfortunate outcomes .
It was found that although a number of techniques, such
as feature selection by means of random forest and
balanced sampling, resulted in an improvement in
accuracy of classification models; selected models provide
Fair or Poor performance only (see section 5.3). In an
attempt to further explore datasets used to build selected
models, a Principal Component Analysis (PCA) was conducted.
In order to conduct this analysis, categorical attributes
of the dataset were re-coded into numeric values.
Consequently, all attributes were adjusted to a mean of
zero (by subtracting the mean from each value). Also,
attributes with constant values were excluded from this
analysis. The outcome of the PCA, a plot, remaps the data
points from their original coordinates to coordinates of the
first two principal coordinates. For the purposes of this
study, PCA was carried out on the imbalanced training
dataset. Notably, all PCA plots revealed that there are no
clearly separable groups of data points which may indicate reasons for poor outcomes. Figure 5 illustrates one of the
resultant PCA plots.
Figure 5: Cholesterol Level Change (0% threshold)
PCA Plot (+ - S, - F, - N)
Evidently, most models cannot be used for prediction,
as they fail to predict under-represented classes. As a
result, only the following models are recommended to be
used and are described in detail: Cholesterol Level Change
(0% threshold), Hypertension Change, HADS Anxiety
Change, HADS Depression Change and Level Achieved Change. Table 8 to 12 show results of each individual
experiment. Note that selected models are shown in bold.
In the Cholesterol Level Change (0% threshold)
experiment model A2 and model B2 performed similarly
in terms of all evaluation measures. Thus, it is
recommended to use both models for prediction.
The Hypertension Change, Level Achieved Change and
HADS Depression Change experiments resulted in model
B2 being selected. Justifiably, it was expected that models
from group B will outperform models from group A due to
the fact that features selected by models from group A are
most likely to be biased towards over-represented class. Interestingly, in the HADS Anxiety Change experiment
model A2 was selected. This can be explained by the fact
that the HADS Anxiety Change dataset was least
imbalanced, where under-represented class occupied over
17% of the whole dataset. Thus, random forest feature
selection on balanced dataset did not incur a significant
improvement in classification performance.
6.2 Medical Interpretation of Results
Based on the experimental results, we conclude that the outcome of phase II cardiac rehabilitation in terms of
physiological, psychosocial and performance risk factor
can be predicted based on initial readings of cholesterol
level, hypertension, level achieved in six minute walk test,
HADS anxiety score and HADS depression score with fair
certainty.
Although selected models provide Fair classification
performance only, it is recommended to use these models
to identify high-risk groups of cardiac patients (i.e. Failure
and/or No Change) based on performance risk factors
and/or psychosocial risk factors of heart disease. Consequently, these patients can be provided with
personalised cardiac rehabilitation program. This may
include non-intrusive monitoring, advice on exercise
training, counselling sessions, education on risk factors of
heart disease, phone calls and regular checkups or nurse
visits.
6.3 Variable Importance Results
Variable importance was another output of this study.
Random forests used for feature selection in the experiment produce a variable importance ranking for
each class label based on mean decrease accuracy as
described in section 5.2. Note that only the output related
to selected models is presented. Evidently, different
attributes were defined as important for prediction of
different class labels. The first most important attribute
was always the attribute used for calculation of the
outcome (e.g. CHOLESTEROL LEVEL for Cholesterol
Level Change).
Notably, attributes defined as most important by
random forest based on mean decrease accuracy are
flagged as related to corresponding risk factors in numerous medical experiments:
CRPIT Volume 121 - Data Mining and Analytics 2011
18

Risk Factor Model Parameters Accuracy# AUC# Able to predict minor classes?^ Performance+
Cholesterol (0% Threshold) pruned, C = 0.25, M = 31 47.76% 0.652 Yes Poor Cholesterol (0% Threshold) unpruned, M = 13 48.50% 0.650 Yes Poor Cholesterol (10% Threshold) unpruned, M = 13 47.46% 0.620 Yes Poor Cholesterol (20% Threshold) unpruned, M = 15 68.06% 0.694 No Poor BMI (0% Threshold) pruned, C = 0.25, M = 9 61.12% 0.595 No Fail BMI (10% Threshold) unpruned, M = 12 93.93% 0.611 No Poor BMI (20% Threshold) unpruned, M = 4 98.91% 0.629 No Poor Waist Circumference (0% Threshold) unpruned, M = 26 52.51% 0.609 No Poor Waist Circumference (10% Threshold) unpruned, M = 21 91.32% 0.486 No Fail Waist Circumference (20% Threshold) N/A N/A N/A N/A N/A~ Hypertension pruned, C = 0.25,M = 13 49.41% 0.647 Yes Poor Diabetes unpruned, M = 4 98.26% 0.645 No Poor Smoking unpruned, M = 3 90.18% 0.635 No Poor
Table 5: Comparative Analysis of Prediction Models on Physiological Risk Factors of Heart Disease
Risk Factor Model Parameters Accuracy# AUC# Able to predict minor classes?^ Performance+
HADS Anxiety pruned, C = 0.25, M = 25 50.47% 0.691 Yes Poor HADS Depression pruned, C = 0.25,M = 14 49.26% 0.683 Yes Poor
Table 6: Comparative Analysis of Prediction Models on Psychosocial Risk Factors of Heart Disease
Risk Factor Model Parameters Accuracy# AUC# Able to predict minor classes?^ Performance+
Level Achieved pruned, C = 0.25, M = 10 52.92% 0.739 Yes Fair Metres Achieved (0% Threshold) unpruned, M = 30 85.60% 0.653 No Poor Metres Achieved (10% Threshold) unpruned, M = 15 66.28% 0.632 No Poor Metres Achieved (20% Threshold) pruned, C = 0.25, M = 23 65.30% 0.705 No Fair
Table 7: Comparative Analysis of Prediction Models on Performance Risk Factors of Heart Disease
Model Model Parameters AUC# Accuracy# Precision# Recall# Able to predict minor classes?^ A1 unpruned, M = 37 0.674 53.73% 0.516 0.537 No A2 unpruned, M = 17 0.652 47.76% 0.529 0.478 Yes B1 unpruned, M = 36 0.677 53.85% 0.513 0.536 No B2 unpruned, M = 13 0.650 48.50% 0.520 0.485 Yes
Table 8: Cholesterol Level Change (0% threshold) Classification Performance
Model Model Parameters AUC# Accuracy# Precision# Recall# Able to predict minor classes?^ A1 unpruned, M = 15 0.669 84.94% 0.839 0.849 No A2 unpruned, M = 15 0.620 31.57% 0.791 0.316 No B1 unpruned, M = 15 0.657 84.54% 0.774 0.845 No B2 pruned, C = 0.25, M = 13 0.647 49.41% 0.796 0.494 Yes
Table 9: Hypertension Change Classification Performance
Model Model Parameters AUC# Accuracy# Precision# Recall# Able to predict minor classes?^ A1 pruned, C = 0.25, M = 7 0.815 76.94% 0.734 0.769 No A2 pruned, C = 0.25, M = 7 0.723 55.61% 0.674 0.556 Yes B1 pruned, C = 0.25, M = 7 0.789 75.36% 0.719 0.754 No B2 pruned C = 0.25, M = 10 0.739 52.92% 0.668 0.529 Yes
Table 10: Level Achieved Change Classification Performance
Model Model Parameters AUC# Accuracy# Precision# Recall# Able to predict minor classes?^ A1 pruned, C = 0.25, M = 19 0.690 57.05% 0.576 0.571 No A2 pruned, C = 0.25, M = 25 0.691 50.47% 0.552 0.505 Yes B1 pruned, C = 0.25, M = 15 0.690 56.74% 0.559 0.567 No B2 pruned, C = 0.25, M = 26 0.673 52.66% 0.569 0.527 Yes
Table 11: HADS Anxiety Change Classification Performance
Proceedings of the 9-th Australasian Data Mining Conference (AusDM'11), Ballarat, Australia
19

Model Model Parameters AUC# Accuracy# Precision# Recall# Able to predict minor classes?^ A1 pruned, C = 0.25, M = 13 0.698 59.75% 0.547 0.597 No A2 pruned, C = 0.25, M = 13 0.676 46.86% 0.521 0.469 Yes B1 pruned, C = 0.25, M = 19 0.672 62.58% 0.563 0.626 No B2 pruned, C = 0.25, M = 14 0.683 49.26% 0.537 0.491 Yes
Table 12: HADS Depression Change Classification Performance
+ Based on proposed scale (see section 5.3). ^ Model is determined as being able to predict under-represented classes when recall and precision on under-represented
classes derived from testing on unseen data >=0.4 and >=0.2 respectively.
~ In Waist Circumference Change (20% threshold) almost all data points belong to N class and, therefore, it was of no
value to conduct any further analysis of this dataset.
#Overall statistics across all class labels calculated as weighted average based on testing on unseen data (see section 5.2).
M is the minimum number of instances per leaf; C is the confidence factor used for pruning.
In Cholesterol Level Change (0% threshold), No Change is partially determined by the statin
medication (ST) attribute. In reality, statins are
known for adverse side effects in terms of muscle
pain and damage (Tomlinson and Mangione
2005).
In the Hypertension Change experiment, the
angiotensin-converting enzyme antihypertensive
medication (ACE) and BMI appeared to be
important for the Success and No Change groups
respectively.
In case of Level Achieved Change, WEIGHT and AGE were determined important for prediction of
Success and No Change in Level Achieved
Change.
RESPIRATORY and MUSCULO-SKELETAL
CONDITIONS were important for prediction of
Failure in Level Achieved Change. Moreover,
the HYPERTENSION CODE (showing whether
a patient has a hypertension condition and is
treated by medications) was also found to be
important in prediction of the Failure points. In
fact, beta-blockers, one of the antihypertensive medications, can lead to a clear reduction in
exercise capacity (Bangalore and Messerli 2006;
Chang et al. 2010).
The antianginal medication (ANG) was found
important for prediction of Failure in HADS
Anxiety Change. Plausibly, angina pectoris,
severe chest pain due to a lack of oxygen supply
to the heart muscle, is a significant determinant of
patient anxiety (Lewin et al. 2002).
BP DIASTOLIC and BP SYSTOLIC were
interestingly found significant for prediction of
No Change and Failure in HADS Depression Change respectively. A study of older men found
that men with low diastolic blood pressure had
significantly higher depression scores.
Moreover, 'depression was more strongly
associated with low diastolic than low systolic
blood pressure, but low systolic pressure was
present in only 22 men who did not also have low
diastolic blood pressure' (Barrett-Connor and
Palinkas 1993).
The above discussion shows that results of our analysis
of variable importance for cardiac risk factors have strong correlations with medical observations.
7 Conclusions and Future Work
Recent research suggests that cardiovascular diseases remain the leading cause of premature death and disability
in the majority of industrialised countries (Piperidou &
Bliss 2008). In this study we used decision tree induction
with random forest feature selection and undersampling
for prediction of cardiovascular risk factors. We found
that models built on balanced datasets using features
selected on balanced datasets generally performed better
than other models. Although applied techniques led to an improved classification performance, resultant models
provided Poor to Fair performance. Moreover, PCA
confirmed that there are no clearly separable groups of
data points. This can be explained by a rather diverse
population used in this study, a large number of missing
values and noisy data. However, despite the low quality of
prediction models, variable importance results are
particularly accurate in terms of correlation with medical
theory and practice.
It is recommended to explore alternative strategies for
building data mining models, such as:
Performing clustering on the dataset followed by
classification on each cluster, as it could be likely
that under-represented classes occur within the
same cluster of patients;
Applying random forest feature selection using
mean decrease accuracy;
Deploying alternative classification algorithms
(such as support vector machines and association
rule mining);
Collecting more data and researching into
alternative methods for imbalanced data problem, in an attempt to improve classification
performance.
Moreover, since variable importance results were
proved to be rather significant, it is recommended to
attempt multivariate analysis in combination with random
forest feature selection for prediction of the outcome of
cardiac rehabilitation in future studies.
This research takes cardiac rehabilitation research to
another level where patients are treated based on their risk
factor profile. The results suggest a personalised approach
to developing the exercise training program as opposed to
generalised approach. It also provides maximum benefits to cardiac patients such as improved health-related quality
of life, reduced number of hospital readmissions and
CRPIT Volume 121 - Data Mining and Analytics 2011
20

decreased rate of mortality and morbidity. As a result, this
research will help to reduce the economic burden on the
health system caused by cardiovascular disease.
Acknowledgements
This work was supported by the Department of Cardiology of the Royal North Shore Hospital and by the Faculty of
Engineering and Information Technology of the
University of Technology, Sydney.
References
Almerud Osterberg, S., Baigi, A., Bering, C. and Fridlund,
B. (2010): Knowledge of heart disease risk in patients
declining rehabilitation. British Journal of Nursing
19(5):288-293.
Austin, J., Williams, R., Ross, L., Moseley, L. and
Hutchison, S. (2005): Randomised controlled trial of
cardiac rehabilitation in elderly patients with heart
failure. European Journal of Heart Failure
7(3):411-417.
Austin, J., Williams, W.R., Ross, L. and Hutchison, S. (2008): Five-year follow-up findings from a randomized
controlled trial of cardiac rehabilitation for heart failure.
European Journal of Cardiovascular Prevention and
Rehabilitation 15(2):162-167.
Bangalore, S. and Messerli, F.H (2006): Beta-blockers and exercise. Journal of the American College of
Cardiology 48(6):1283-1288.
Barrett-Connor, E. and Palinkas, L.A. (1994): Low blood pressure and depression in older men: a population
based study. British Medical Journal
308(6926):446-449.
Brubaker, P.H., Moore, J.B., Stewart, K.P., Wesley, D.J. and Kitzman, D.W. (2009): Endurance exercise training
in older patients with heart failure: results from a
randomized, controlled, single-blind trial. Journal of the
American Geriatrics Society 57(11):1982-1989.
Chang, C.D., Wang, C.C. and Jiang, B.C. (2011): Using data mining techniques for multi-diseases prediction
modeling of hypertension and hyperlipidemia by
common risk factors. Expert Systems with Applications
38(1):5507-5513.
Chang, C.L., Mills, G.D., McLachlan, J.D., Karalus, N.C. and Hancox, R.J. (2010): Cardio-selective and
non-selective beta-blockers in chronic obstructive
pulmonary disease: effects on bronchodilator response
and exercise. Internal Medicine Journal 40(3):193-200.
Chester, T. (2006): Cardiac rehabilitation for patients with
heart failure: a service development unit. British Journal of Cardiac Nursing 1(10):487-495.
Davies, E.J., Moxham, T., Rees, K., Singh, S., Coats, A.J.,
Ebrahim, S., Lough, F. and Taylor, R.S. (2010):
Exercise based rehabilitation for heart failure. The
Cochrane Library 4(1):1-57.
Delagardelle, C. and Feiereisen, P. (2005): Strength training for patients with chronic heart failure, Europa
Medicophysica 41(1):57-65.
Eisner, R.: Basic evaluation measures for classifier performance, University of Alberta.
http://webdocs.cs.ualberta.ca/~eisner/measures.html.
Accessed 1 June 2011.
Goble, A.J. and Worcester, M.U.C.:Best Practice Guidelines for Cardiac Rehabilitation and Secondary
Prevention, Department of Human Services Victoria.
http://www.health.vic.gov.au/nhpa/downloads/bestprac
ticecardiacrehab.pdf. Accessed 9 May 2010.
Guiraud, T., Juneau, M., Nigam, A., Gayda, M., Meyer, P., Mekary, S., Paillard, F. and Bosquet, L. (2010):
Optimization of high intensity interval exercise in
coronary heart disease. European Journal of Applied
Physiology 108(4):733-740.
Hall, M., Frank, E., Holmes, G., Pfahringer, B., Reutemann, P. and Witten, I.H. (2009): The weka data
mining software: an update. SIGKDD Explorations
11(1).
Han, J. and Kamber, M. (2006): Data mining: concepts
and techniques. San Francisco, Morgan Kaufmann.
Han, L., Embrechts, M.J., Szymanski, B., Sternickel, K.
and Ross, A. (2006): Random forests feature selection
with K-PLS: detecting ischemia from
magnetocardiograms. Proc. European Symposium on
Artificial Neural Networks, Bruges, Belgium, 14:221-226, ESANN.
Hansen, D., Dendale, P., Raskin, A., Schoonis, A., Berger,
J., Vlassak, I. and Meeusen, R. (2010): Long-term effect
of rehabilitation in coronary artery disease patients:
randomized clinical trial of the impact of exercise
volume. Clinical Rehabilitation. 24(4):319-327.
Kajabadi, A., Saraee, M.H. and Asgari, S. (2009): Data
mining cardiovascular risk factors. Proc. AICT
International Conference on Application of Information
and Communication Technologies, Baku, Azerbaijan,
3:1-5, AICT.
Karaolis, M., Moutiris, J.A., Hadjipanayi, D. and Pattichis, C.S. (2010): Assessment of the risk factors of coronary
heart events based on data mining with decision trees.
IEEE Transactions on Information Technology in
Biomedicine 14(3):559-566.
Kravari, M., Vasileiadis, I., Gerovasili, V., Karatzanos, E., Tasoulis, A., Kalligras, K., Drakos, S., Dimopoulos, S.,
Anastasiou-Nana, M. and Nanas, S. (2010): Effects of a
3-month rehabilitation program on muscle oxygenation
in congestive heart failure patients as assessed by NIRS.
International Journal of Industrial Ergonomics
40(2):212-217.
Kuhn., S., Egert, B., Neumann, S. and Steinbeck, C.
(2008): Building blocks for automated elucidation of
metabolites: machine learning methods for NMR
prediction. BMC Informatics 9(1):400-418.
Kulcu, D.G., Kurtais, Y., Tur, B.S., Gulec, S. and Seckin, B. (2007): The effect of cardiac rehabilitation on quality
of life, anxiety and depression in patients with
congestive heart failure. A randomized controlled trial,
short-term results. Europa Medicophysica
43(4):489-497.
Lavie, C.J., Milani, R.V. and Ventura, H.O. (2009): Exercise training and heart failure in older adults-dismal
failure or not enough exercise? Journal of the American
Geriatrics Society 57(11):2148-2150.
Proceedings of the 9-th Australasian Data Mining Conference (AusDM'11), Ballarat, Australia
21

Le Cao, K.A. and McLachlan, G.J. (2009): Statistical analysis of microarray data: selection of gene prognosis
signatures. In Computational biology: issues and
applications in oncology. 55-76. T. Pham (ed).
Springer-Verlag.
Lewin, R.J.P., Furze, G., Robinson, J., Griffith, K., Wiseman, S., Pye, M. and Boyle, R. (2002): A
randomised controlled trial of a self-management plan
for patients with newly diagnosed angina. British
Journal of General Practice 52(476):194-201.
Liaw, A. and Wiener, M. (2002): Classification and regression by randomForest. R News 2(3):18-22.
Linoff, G.S. and Berry, M.J. (2011): Data mining techniques: for marketing, sales, and customer
relationship management. Indianapolis, Wiley
Publishing.
Marques Marcolino, J.A., da Silva Telles Mathias, L.A.,
Piccinini Filho, L., Guaratini, A.A., Mikio Suzuki, F. & Cunha Alli, L.A. (2007): Hospital anxiety and
depression scale: a study on the validation of the criteria
and reliability on preoperative patients. Revista
Brasileira de Anestesiologia 57(1): 52-62.
Menze, B.H., Kelm, M., Masuch, R., Himmelreich, U., Bachert, P., Petrich, W. and Hamprecht, F.A. (2009): A
comparison of random forest and its Gini importance
with standard chemometric methods for the feature
selection and classification of spectral data. BMC
Bioinformatics 10(1):213-228.
Nilsson, B.B., Hellesnes, B., Westheim, A. and Risberg, M.A. (2008): Group-based aerobic interval training in
patients with chronic heart failure: Norwegian Ullevaal
Model. Physical Therapy 88(4):523-535.
Noy, K. (1998): Cardiac rehabilitation: structure,
effectiveness and the future. British Journal of Nursing
7(17):1033-1040.
Pan, X.Y. and Shen, H.B. (2009): Robust prediction of
B-factor profile from sequence using two-stage SVR
based on random forest feature selection. Protein and
peptide letters 16(1):1447-1454.
Piperidou, E. and Bliss, J. (2008): An exploration of exercise training effects in coronary heart disease.
British Journal of Community Nursing 13(6):271-277.
Podgorelec, V., Kokol, P., Stiglic, B. and Rozman, I. (2002): Decision trees: an overview and their use in
medicine. Journal of medical systems 26(5):445-463.
R Development Core Team (2011): A language and environment for statistical computing. Vienna, R
Foundation for Statistical Computing.
Rivett, M.J., Tsakirides, C., Pringle, A., Carroll, S., Ingle,
L. and Dudfield, M. (2009): Physical activity readiness
in patient withdrawals from cardiac rehabilitation.
British Journal of Nursing 18(3):188-191.
Seiffert, C., Khoshgoftaar, T.M. and Van Hulse, J. (2009):
Hybrid sampling for imbalanced data. Integrated
Computer-Aided Engineering 16(3):193-210.
Seni, G. and Elder, J. (2010): Ensemble methods in data mining: improving accuracy through combining
predictions. Chicago, Morgan and Claypool Publishers.
Smith, J.G., Newton-Cheh, C., Almgren, P., Struck, J., Morgenthaler, N.G., Bergman, A., Platonov, P.G.,
Hedblad, B., Engstrom, G., Wang, T.J. and Melander,
O. (2010): Assessment of conventional cardiovascular
risk factors and multiple biomarkers for the prediction
of incident heart failure and atrial fibrillation. Journal of the American College of Cardiology 56(21):1712-1719.
Tabet, J.Y., Meurin, P., Beauvais, F., Weber, H., Renaud,
N., Thabut, G., Cohen-Solal, A., Logeart, D. and Ben
Driss, A. (2008): Absence of exercise capacity
improvement after exercise training program: a strong
prognostic factor in patients with chronic heart failure, Circulation Heart Failure 1(4):220-226.
Tuffery, S. (2011): Data mining and statistics for decision
making. Chichester, John Wiley and Sons.
Williams, G.J (2009): Rattle: a data mining GUI for R. The R Journal 1(2):45-55.
CRPIT Volume 121 - Data Mining and Analytics 2011
22