understanding returns of leveraged and inverse …m.vixek.com/understanding returns of leveraged...
TRANSCRIPT
Printed and electronic copies are for personal use. Any unauthorized distribution by fax, email or any other means isprohibited and is in violation of copyright. If you are interested in redistribution, reprints or a subscription, please contact us [email protected] or 212.579.5833.
Journal Of Indexes
Understanding Returns Of Leveraged And Inverse Funds By Joanne Hill and George Foster
Leveraged and inverse exchange-traded funds (ETFs) are designed to achieve a multiple (positive
or negative, e.g., 2x or -2x) of index returns on a daily basis. From their launch in June 2006
through June 30, 2009, leveraged and inverse ETFs attracted more than $33 billion of assets in the
U.S.—about 6 percent of all U.S. ETF assets. As of mid-2009, there were 122 leveraged and
inverse ETFs, covering a broad range of equity, sector, international, fixed-income, commodity and
currency markets. The rapid growth of these types of ETFs has captured the attention of investors
and the media—and generated some controversy about where and how this new investment tool
best fits in the array of choices available to investors.
What is sometimes forgotten in discussions about these “new” ETFs is that the concept of leveraged and inverse funds is not
really new—it is merely the latest chapter in a long history of investment products developed to provide investors access to
various indexing strategies. Mutual funds that incorporate leverage or shorting of index exposure have been available in the U.S.
for 15 years. Today there are more than 100 mutual funds that provide short and leveraged exposure to indexes.
Leveraged and inverse mutual funds and ETFs both evolved from unleveraged index fund strategies. Few investors would
question the role of index funds in equity portfolio management now, but they too generated their share of controversy when
they were introduced in the mid-1970s.
Like other index strategies before them, leveraged and inverse ETFs have attracted investors seeking gains from absolute or
relative index moves or looking to manage risk.
What, then, is the source of the controversy? Since existing leveraged and inverse funds are designed to achieve a multiple of
index return only on a daily basis, for periods greater than one day, the fund returns can be greater or less than the one-day
target multiple times the index return. This is a result of the effects of compounding—gains or losses are compounded every day.
Much of the recent discussion of leveraged and inverse funds in the media has centered on how they perform over periods
longer than one day. Focusing on a few examples of volatile indexes in a volatile market environment, some have asserted that
over more than one day, investors’ returns cannot come close to the one-day target multiple times the index return, and will
always be worse. Some then concluded that leveraged and inverse ETFs are not appropriate for holding periods greater than
one day.
In this article, we take a broader view and provide empirical evidence based on leveraged and inverse S&P 500 returns for a long
history (as well as for other indexes) that challenges these assertions. We explain why the funds have a one-day target and show
that leveraged funds can be used successfully for longer periods than one day. Rather than focus on narrow examples, we
analyzed 2x and -2x (daily target) leveraged and inverse S&P 500 index returns for thousands of holding periods ranging from
two days to six months for the past 50 years (excluding fees, expenses, trading and financing costs). These were compared with
each period’s index return multiplied by the same target. We show that:
• On average, the impact of compounding on leveraged and inverse fund returns is virtually neutral for most broad indexes.
• There is a high probability of approximating the one-day target leverage for periods longer than one day; the shorter the period
and the lower the index volatility, the higher the probability.
• Rebalancing is an effective tool for investors whose goal is to approximate the daily leverage target over time. The process is
straightforward and involves monitoring index returns versus fund returns and establishing a trigger percentage of deviation as a
basis for the rebalancing strategy.
Before we present the details and results of our historical study and explain the basic rebalancing process and a case study, we
first provide background on daily investment objectives (versus longer periods) and highlight some typical investment strategies
in which leveraged and inverse ETFs and mutual funds are utilized.
Staying Aligned With The Daily Target
Most leveraged and inverse ETFs and mutual funds are designed to provide a target multiple (positive or negative) of index
returns for one day (before fees and expenses). The manager of the fund typically holds stocks, index futures, swaps or short
positions along with cash-equivalents to achieve this daily fund objective on an ongoing basis. To stay aligned with this one-day
target, the fund manager adjusts fund holdings each day based on the closing value of fund assets, reflecting index returns and
fund flows for that day.
Day-to-day consistency of index exposure is valuable to many investors with short-term or longer-term horizons. Although a
leveraged or inverse fund could be created with a longer-term objective such as a monthly target leverage ratio, the fund’s index
exposure would then vary within the month, as gains and losses in between monthly rebalancing change the fund’s market
exposure. An ETF with a daily leverage target—say, 2x the daily return of the index—has the objective of providing that same
leverage exposure at the end of each and every trading day, regardless of whether an investor bought, held or sold the ETF
position on a particular day. Another rationale for having a daily objective is that adjusting holdings every day to match a target
multiple reduces the risk of the fund experiencing a total loss. (The variation in leverage within the month for a monthly target
leverage ratio fund could be sizable in higher-volatility environments and may lead to a significantly higher degree of leverage
than the investor desires.)
Given their daily objective, it is important to note that leveraged and short ETFs have been extremely successful at delivering
returns in line with the one-day target. In comments on a study of three leveraged and inverse ETFs benchmarked to the Dow
Jones Industrial Average, Matt Hougan remarked in an IndexUniverse.com webinar that after examining “over 600 days of
trading history … [one-day tracking] was pretty much perfect.”
Uses Of Leveraged And Inverse ETFs For Short And Long Horizons
Leveraged and inverse index exposure in a liquid, transparent ETF can be utilized in a variety of ways, with both short- and
longer-term horizons. Since the trading volume for leveraged and inverse ETFs—whether measured in dollars or shares—is
several times the percentage of ETF assets, it is likely that leveraged and inverse ETFs are commonly being utilized as short-
term tactical trading tools. However, investors also regularly use leveraged and inverse ETFs as a key component of a longer-
term portfolio strategy; for example, to pursue returns and manage the risk of long equity and fixed-income positions. The list
below identifies a few of the most common applications, all of which can be employed for horizons beyond a day:
Pursue returns based on a tactical view (long or short) of an index based on an outlook for the economy or segments of
the market.
Overweight or underweight an index exposure such as a particular market-cap segment, sector or country, by utilizing
leverage and thereby avoiding the need to change other positions in the portfolio.
Hedge or reduce risk, either as a short-term tactical hedge or for longer-term risk management.
Execute an index-spread strategy designed to capture the relative returns of two indexes. For example, investors may
wish to express a view that financial stocks are likely to outperform energy stocks, or that emerging market equities may
outperform U.S. large-cap equities.
Isolate alpha from active strategies. The active risk component of an equity strategy (alpha) can be isolated by hedging the
index or beta risk with the benchmark for that strategy using an inverse or leveraged inverse index ETF.
A Review Of How Compounding Affects Returns For Periods Greater Than One Day
As previously discussed, leveraged and inverse funds are designed to achieve a multiple of index return only on a daily basis.
Over periods greater than one day, returns can be greater or less than the one-day target multiple times the index return. This is
a result of the effects of compounding as gains or losses compound daily. Compounding affects all investments over time. It is
reflected in index returns as well as the total returns of unleveraged mutual funds, stocks and bonds held over time. The
magnitude of the compounding effect is related to market conditions that occur during the investment holding period, whether
they are upward-trending, downward-trending or volatile.
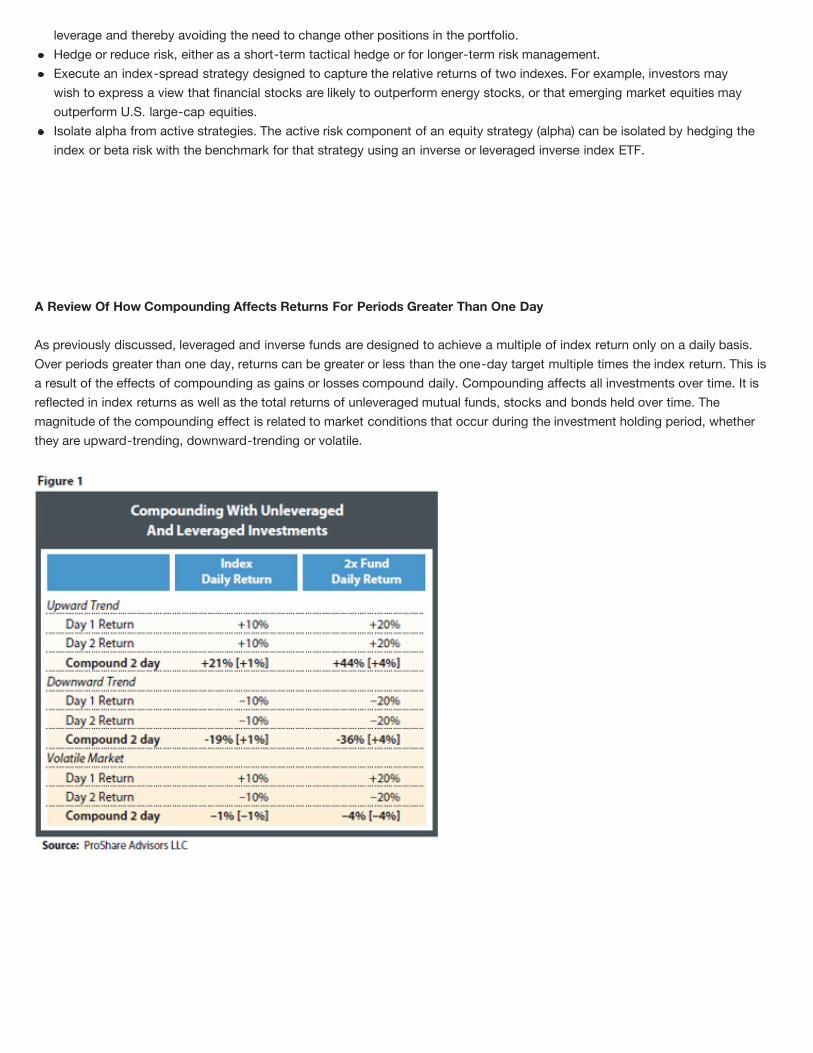
Compounding With Unleveraged Investments
In an upward-trending market, compounding can result in longer-term returns that are greater than the sum of the individual daily
returns. In Figure 1, the Index Daily Return column shows that an investment strategy that returns 10 percent a day for two
consecutive days generates a 21 percent gain over the two-day period. This is greater than the sum of the individual-day returns,
or 20 percent. Similarly, in a downward-trending market, compounding can also result in longer-term returns that are less
negative than the sum of the individual daily returns. An investment that declines 10 percent a day for two consecutive days
would have a -19 percent return, not -20 percent. But in a volatile market scenario, compounding can result in longer-term
returns that are less than the sum of the individual daily returns. An investment that rises 10 percent on one day and declines 10
percent the next would have a -1 percent return, which is less than the 0 percent sum of the individual-day returns.
Compounding With Leveraged (2x) Investments: “The Same But More”
Compounding in leveraged funds can result in gains or losses that occur much faster and to a greater degree, as shown in the 2x
Fund Daily Return column. In an upward-trending market, compounding can result in longer-term leveraged returns that are
greater than 2x the return of the unleveraged investment. A leveraged fund that grows 20 percent a day (2 x 10 percent index
gain) for two consecutive days would have a 44 percent gain, not two times the 21 percent compound gain of the index daily
return. In a downward-trending market, compounding results in 2x leveraged fund returns that are less negative than two times
the return of the unleveraged investment. A 2x leveraged fund that declines 20 percent a day (2 x 10 percent index decline) for
two consecutive days would have a -36 percent return. This is less negative than two times the 19 percent compound loss of the
unleveraged investment.
In a volatile market, compounding can result in leveraged longer-term returns that are less than two times the return of the
unleveraged investment. A 2x leveraged fund that rises 20 percent one day (2 x 10 percent index gain) and declines 20 percent
the next (2 x 10 percent index decline) generates a -4 percent return. This is a greater loss than the two times -1 percent
compound return of the unleveraged investment.
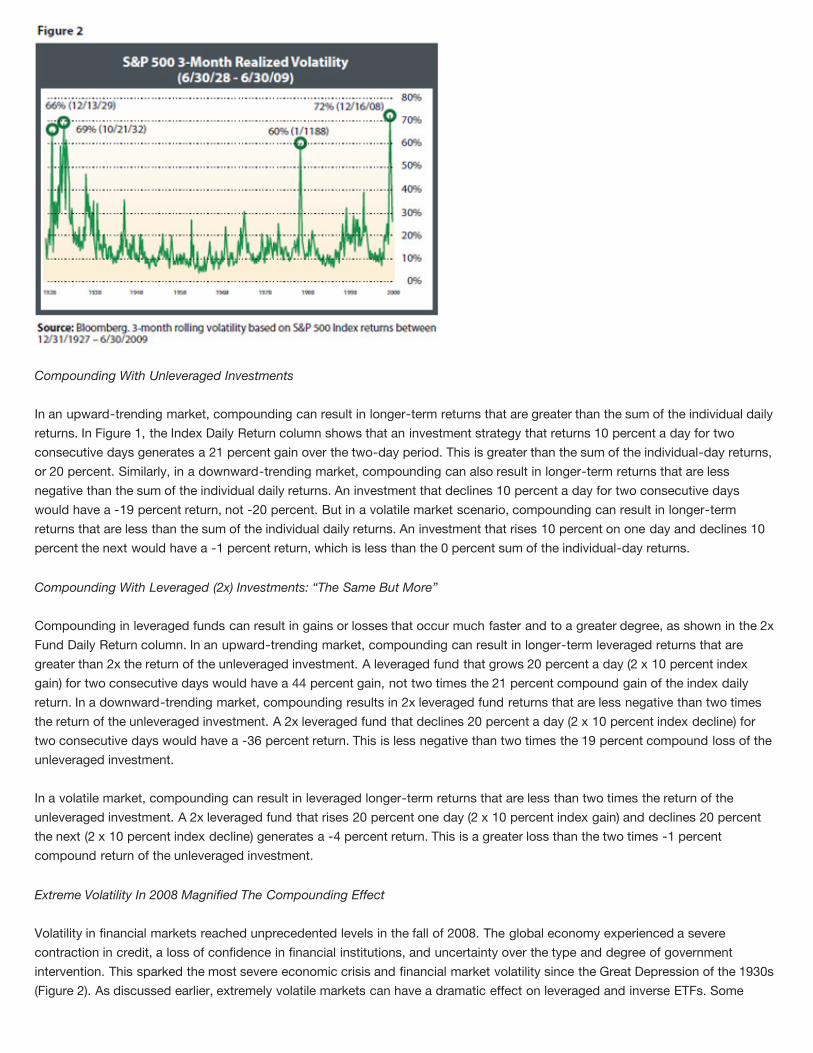
Extreme Volatility In 2008 Magnified The Compounding Effect
Volatility in financial markets reached unprecedented levels in the fall of 2008. The global economy experienced a severe
contraction in credit, a loss of confidence in financial institutions, and uncertainty over the type and degree of government
intervention. This sparked the most severe economic crisis and financial market volatility since the Great Depression of the 1930s
(Figure 2). As discussed earlier, extremely volatile markets can have a dramatic effect on leveraged and inverse ETFs. Some
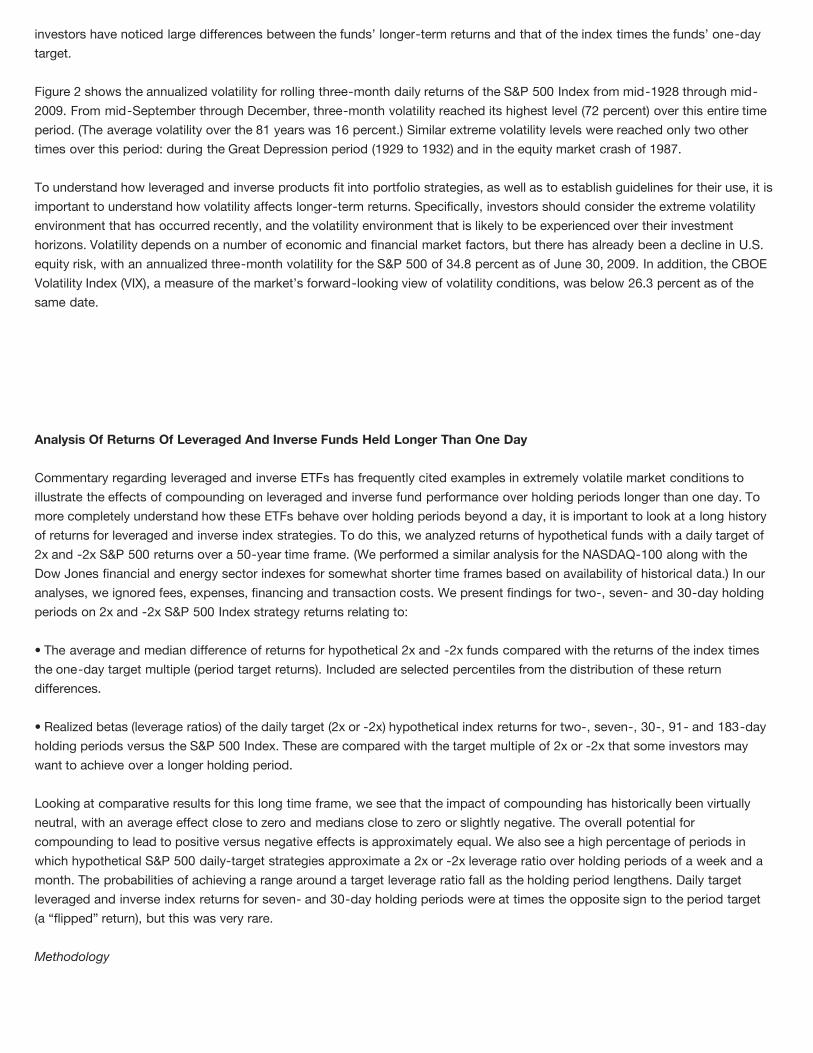
investors have noticed large differences between the funds’ longer-term returns and that of the index times the funds’ one-day
target.
Figure 2 shows the annualized volatility for rolling three-month daily returns of the S&P 500 Index from mid-1928 through mid-
2009. From mid-September through December, three-month volatility reached its highest level (72 percent) over this entire time
period. (The average volatility over the 81 years was 16 percent.) Similar extreme volatility levels were reached only two other
times over this period: during the Great Depression period (1929 to 1932) and in the equity market crash of 1987.
To understand how leveraged and inverse products fit into portfolio strategies, as well as to establish guidelines for their use, it is
important to understand how volatility affects longer-term returns. Specifically, investors should consider the extreme volatility
environment that has occurred recently, and the volatility environment that is likely to be experienced over their investment
horizons. Volatility depends on a number of economic and financial market factors, but there has already been a decline in U.S.
equity risk, with an annualized three-month volatility for the S&P 500 of 34.8 percent as of June 30, 2009. In addition, the CBOE
Volatility Index (VIX), a measure of the market’s forward-looking view of volatility conditions, was below 26.3 percent as of the
same date.
Analysis Of Returns Of Leveraged And Inverse Funds Held Longer Than One Day
Commentary regarding leveraged and inverse ETFs has frequently cited examples in extremely volatile market conditions to
illustrate the effects of compounding on leveraged and inverse fund performance over holding periods longer than one day. To
more completely understand how these ETFs behave over holding periods beyond a day, it is important to look at a long history
of returns for leveraged and inverse index strategies. To do this, we analyzed returns of hypothetical funds with a daily target of
2x and -2x S&P 500 returns over a 50-year time frame. (We performed a similar analysis for the NASDAQ-100 along with the
Dow Jones financial and energy sector indexes for somewhat shorter time frames based on availability of historical data.) In our
analyses, we ignored fees, expenses, financing and transaction costs. We present findings for two-, seven- and 30-day holding
periods on 2x and -2x S&P 500 Index strategy returns relating to:
• The average and median difference of returns for hypothetical 2x and -2x funds compared with the returns of the index times
the one-day target multiple (period target returns). Included are selected percentiles from the distribution of these return
differences.
• Realized betas (leverage ratios) of the daily target (2x or -2x) hypothetical index returns for two-, seven-, 30-, 91- and 183-day
holding periods versus the S&P 500 Index. These are compared with the target multiple of 2x or -2x that some investors may
want to achieve over a longer holding period.
Looking at comparative results for this long time frame, we see that the impact of compounding has historically been virtually
neutral, with an average effect close to zero and medians close to zero or slightly negative. The overall potential for
compounding to lead to positive versus negative effects is approximately equal. We also see a high percentage of periods in
which hypothetical S&P 500 daily-target strategies approximate a 2x or -2x leverage ratio over holding periods of a week and a
month. The probabilities of achieving a range around a target leverage ratio fall as the holding period lengthens. Daily target
leveraged and inverse index returns for seven- and 30-day holding periods were at times the opposite sign to the period target
(a “flipped” return), but this was very rare.
Methodology

Our study compares the returns of hypothetical S&P 500 Index funds having a 2x and -2x daily leverage target (daily target
return) with a period target return (defined as the period index return times this same daily leverage target) for holding periods of
two, seven, 30, 91 and 183 calendar days. Our sample contains all two-day, weekly, monthly, quarterly and semiannual holding
periods possible within the last 50 years (1959 through 2008) for the S&P 500 Index. This gives us a large sample to compare all
possible end-of-day entry and exit points, but it also leads to overlapping observations. The benefit of this approach is that it
removes any potential bias of starting a holding period on a particular day of the week or month.
To focus on the compounding effect, we note some additional assumptions used in this analysis:
• For the period target return, the leverage ratio/beta is set at the beginning of each period and not changed for the duration of
that period. For the hypothetical 2x and -2x funds, the leverage is reset daily to either 2x or -2x. Therefore, the hypothetical daily
target return leveraged or inverse funds achieve is exactly the daily multiple times the daily index return each and every day of
the holding periods.
• Index price return is the basis for the analysis.
• Hypothetical leverage and inverse fund return calculations for both the daily target and period target returns exclude fees,
financing, interest and expenses.
• Period target returns are not constrained by capital (i.e., losses can exceed -100 percent).
Analysis Of Differences Between 2x And -2x S&P 500 Funds And Period Target Leveraged/Index Returns
Figure 3 contains statistics from the distribution of differences in return between the daily target return and the period target
return (2x and -2x) for all possible two-, seven- and 30-day holding periods over the 50-year S&P 500 return history. The
averages of the percentage return differences are all essentially zero, and the median is at or just below zero, indicating that
leveraged and inverse strategies are about as likely to benefit as to be hurt by the compounding effect of periods up to 30 days
for the S&P 500.
The distribution of the return differences for the S&P 500 2x and -2x strategies is tight and balanced over this long history. For
example, half of the differences for the 2x fund for a 30-day holding period were between 0.1 percent and -0.1 percent. This
means that for a hypothetical 2x fund over a 30-day period where the S&P 500 return was 3 percent, the returns were in a range
of 5.9 percent to 6.1 percent (compared with 2 x 3 percent or 6 percent) approximately half the time. In addition, the percentage

of positive differences was 53 percent for two-day holding periods. As we move out to longer periods, the return differences are
positive about 40 percent of the time.
Volatility Drives The Differences Between Leveraged Daily Target Fund And Index Returns
What drives the size of differences between daily target leveraged and inverse returns and the period target return over a longer
holding period? As noted above, we would expect the largest driver of compounding effects to be the level of volatility in the
market over the investor’s holding period. This point is frequently mentioned in academic, analyst and media articles when
discussing the performance differences for leveraged and inverse funds held beyond one day. Our long-term study using
hypothetical 2x S&P 500 Index returns supports the view that volatility is the key factor driving the size of the differences.
To explore the connection between volatility and variability of returns over the 50-year S&P 500 return history, we first sort the
return differences between the 30-day 2x fund and the S&P 500 return times two. We then place these return differences into 10
deciles, or buckets, ranking them from the most positive to the most negative. For each of these deciles, we calculate the median
return difference and the median annualized 30-day S&P 500 volatility.
Figure 4 displays levels of volatility that are clearly related to the magnitude of the return difference. The holding periods with the
most positive and negative deciles of return differences were also ones that have higher volatility. The U shape of the median
volatilities across the return difference deciles reveals that the smallest return differences tend to occur when volatility is lowest. It
is notable that the recent episode of extreme volatility was the main factor in observing wider return spreads for longer holding
periods for the leveraged and inverse funds.
The Impact Of Volatility Is Relative To The Magnitude Of Index Returns
The degree of impact that volatility has on leveraged fund returns is relative to the magnitude of the index return for the period. In
periods when index return magnitudes are very large, the return differences tend to be large but positive. In contrast, the periods
of the most negative differences (0-10th decile) are those where there have been high S&P 500 volatility levels accompanied by
index returns close to zero (that is, flat or trendless markets). In Figure 5, data from our study of hypothetical 2x fund returns
show the medians for each decile of return differences, along with the median volatility and absolute value of index return for
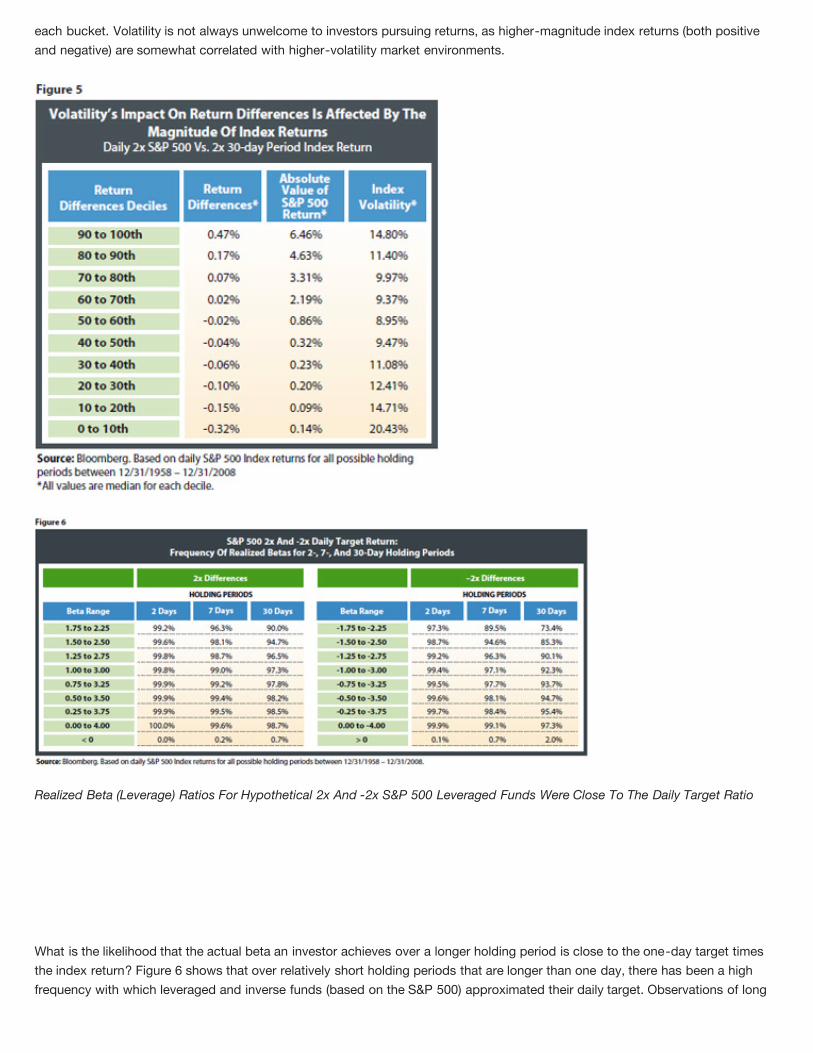
each bucket. Volatility is not always unwelcome to investors pursuing returns, as higher-magnitude index returns (both positive
and negative) are somewhat correlated with higher-volatility market environments.
Realized Beta (Leverage) Ratios For Hypothetical 2x And -2x S&P 500 Leveraged Funds Were Close To The Daily Target Ratio
What is the likelihood that the actual beta an investor achieves over a longer holding period is close to the one-day target times
the index return? Figure 6 shows that over relatively short holding periods that are longer than one day, there has been a high
frequency with which leveraged and inverse funds (based on the S&P 500) approximated their daily target. Observations of long
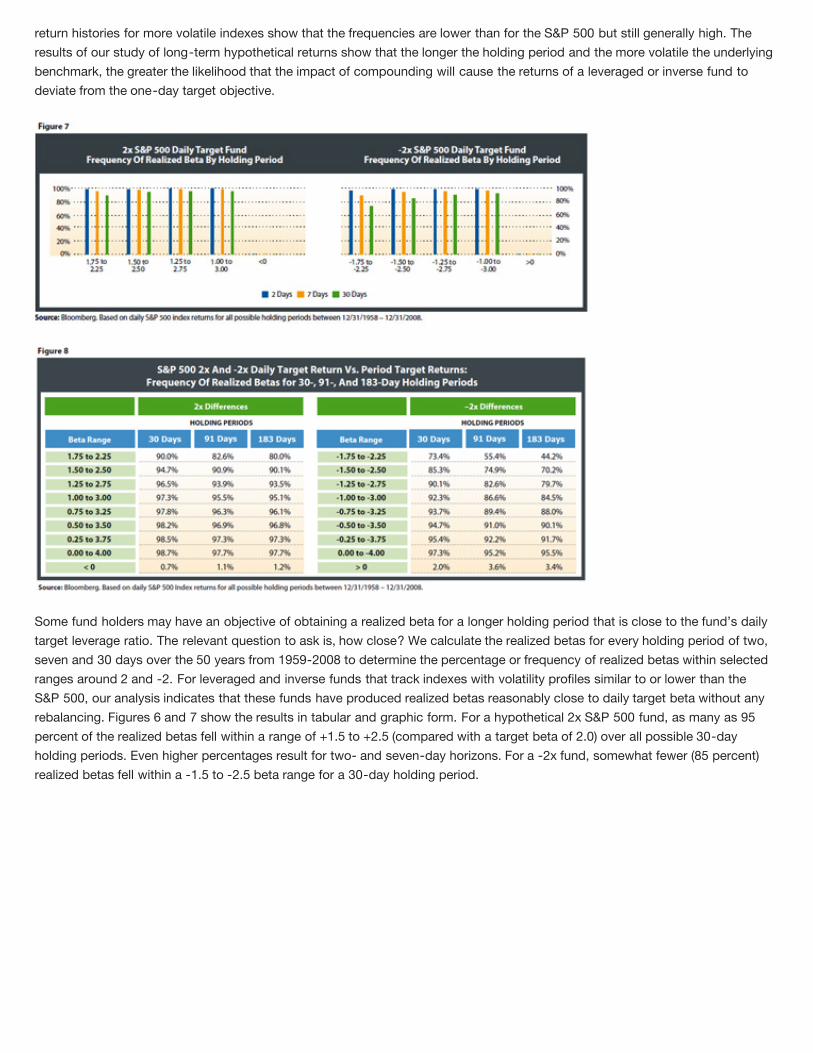
return histories for more volatile indexes show that the frequencies are lower than for the S&P 500 but still generally high. The
results of our study of long-term hypothetical returns show that the longer the holding period and the more volatile the underlying
benchmark, the greater the likelihood that the impact of compounding will cause the returns of a leveraged or inverse fund to
deviate from the one-day target objective.
Some fund holders may have an objective of obtaining a realized beta for a longer holding period that is close to the fund’s daily
target leverage ratio. The relevant question to ask is, how close? We calculate the realized betas for every holding period of two,
seven and 30 days over the 50 years from 1959-2008 to determine the percentage or frequency of realized betas within selected
ranges around 2 and -2. For leveraged and inverse funds that track indexes with volatility profiles similar to or lower than the
S&P 500, our analysis indicates that these funds have produced realized betas reasonably close to daily target beta without any
rebalancing. Figures 6 and 7 show the results in tabular and graphic form. For a hypothetical 2x S&P 500 fund, as many as 95
percent of the realized betas fell within a range of +1.5 to +2.5 (compared with a target beta of 2.0) over all possible 30-day
holding periods. Even higher percentages result for two- and seven-day horizons. For a -2x fund, somewhat fewer (85 percent)
realized betas fell within a -1.5 to -2.5 beta range for a 30-day holding period.
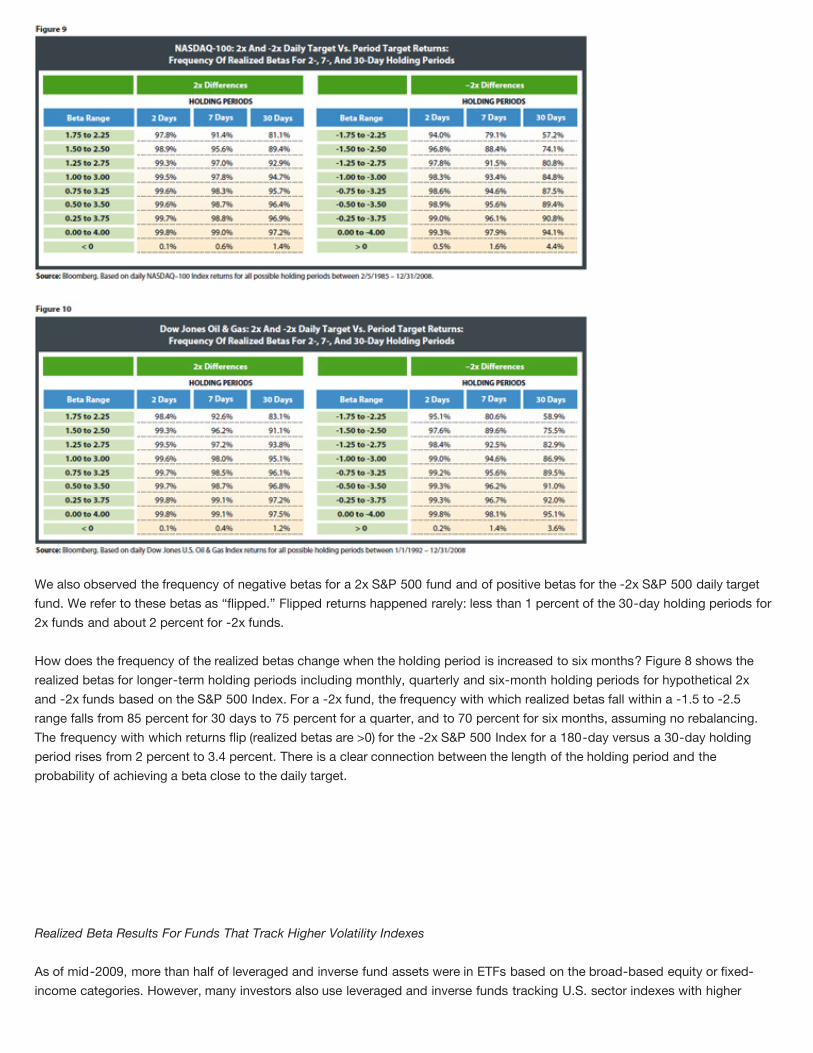
We also observed the frequency of negative betas for a 2x S&P 500 fund and of positive betas for the -2x S&P 500 daily target
fund. We refer to these betas as “flipped.” Flipped returns happened rarely: less than 1 percent of the 30-day holding periods for
2x funds and about 2 percent for -2x funds.
How does the frequency of the realized betas change when the holding period is increased to six months? Figure 8 shows the
realized betas for longer-term holding periods including monthly, quarterly and six-month holding periods for hypothetical 2x
and -2x funds based on the S&P 500 Index. For a -2x fund, the frequency with which realized betas fall within a -1.5 to -2.5
range falls from 85 percent for 30 days to 75 percent for a quarter, and to 70 percent for six months, assuming no rebalancing.
The frequency with which returns flip (realized betas are >0) for the -2x S&P 500 Index for a 180-day versus a 30-day holding
period rises from 2 percent to 3.4 percent. There is a clear connection between the length of the holding period and the
probability of achieving a beta close to the daily target.
Realized Beta Results For Funds That Track Higher Volatility Indexes
As of mid-2009, more than half of leveraged and inverse fund assets were in ETFs based on the broad-based equity or fixed-
income categories. However, many investors also use leveraged and inverse funds tracking U.S. sector indexes with higher

return volatility. To evaluate the realized betas for funds with greater historical risk-reward profiles, we calculate realized leverage
ratios over a long-term history for two-, seven- and 30-day holding periods for hypothetical funds with daily targets of 2x and -
2x three other indexes: the NASDAQ-100 Index, the Dow Jones U.S. Financials Index and the Dow Jones U.S. Oil & Gas Index.
Figures 9-11 show realized leverage ratios for hypothetical 2x and -2x funds based on these indexes. These returns do not
illustrate the performance of an actual investment.
The history of daily NASDAQ-100 Index returns begins in 1985, with the index having a return volatility of 28.6 percent over the
1985-2008 period. This is significantly higher than the return volatility of 18.3 percent for the S&P 500 over the same period. The
frequencies we observe of realized betas for a hypothetical 2x and -2x NASDAQ-100 fund held for 30 days across all beta
ranges are somewhat lower than the S&P 500 due to the higher volatility of the index, but still above 80 percent. (The only
exception is the -1.75 to -2.25 range for the -2x funds.) For example, for a hypothetical -2x NASDAQ-100 fund held 30 days, the
-1.50 to -2.50 realized beta range frequency was 74.1 percent, compared with 85.3 percent for the S&P 500 leveraged strategy.
The Dow Jones U.S. Financials and Dow Jones U.S. Oil & Gas Index data are available back to 1992, thus providing 17 years of
return experience. The annualized return volatilities based on daily data for each index were 24.85 percent and 24.80 percent,
respectively; a bit lower than that of the NASDAQ-100 Index, but higher than the S&P 500. The realized betas for these
hypothetical funds are also a bit higher than for the NASDAQ-100 Index, which is precisely as we’d expect given the slightly
lower return volatilities of the underlying indexes. Therefore, the analysis of higher volatility indexes further supports the
connection between volatility and holding period risk for holders of leveraged and inverse funds with daily target multiples.

To summarize these findings, there is a high probability of approximating the one-day target for investment horizons longer than
one day. The shorter the period and the lower the index volatility, the higher the probability. For longer time periods and more
volatile benchmarks, we observed lower probabilities.
For Longer-Term Holding Periods And More Volatile Funds, Rebalancing Helps Close The Gap
For investors whose goal is to approximate the one-day target over time, rebalancing can be an effective strategy. Investors
should routinely monitor the return of the index relative to the performance of the fund and rebalance holdings when they move
out of line. The process is analogous to that used by investors rebalancing asset-mix weights versus asset-class policy targets
in more conventional investment situations.
It bears repeating that the impact of rebalancing on returns of leveraged and inverse fund strategies is directly related to the
effect of compounding. While rebalancing may be helpful if investors seek to match their long-term returns to the one-day target
over time, the returns from such a rebalancing strategy can theoretically be lower than those of an un-rebalanced strategy in a
trending market or low volatility market environment. Rebalancing has the effect of removing both the negative and potential
positive effects of compounding.
Monitor And Rebalance The Fund Position: Mind The Gap
The rebalancing process for leveraged and inverse fund positions is straightforward: Watch the gap between the index return
and fund return, and rebalance holdings either when this gap moves beyond a specified trigger or at a fixed calendar-based
interval. Figure 12 shows the investor decreasing fund exposure if the index return is less than the fund return, and increasing
fund exposure if the index return is greater than the fund return.
The size of the rebalance trade for any period can be calculated as the starting fund value x (index return - fund return). Figure
13 demonstrates an extreme case of large daily index returns and the rebalancing trades that could be implemented by an
investor who wants to keep positions in line with the daily leverage target. Since inverse funds are designed to move in the
opposite direction of their underlying indexes, they typically will require a greater frequency and/or degree of rebalancing.
An investor applying the same rebalancing trigger percentage to low- and high-volatility index ETFs with leverage is likely to find
that larger-size rebalancing trades may be required, as the potential for larger performance gaps and less proximate realized
multiples is otherwise increased. Alternatively, an investor can set an appropriate trigger for rebalancing by taking into account
the volatility of the index and the target rebalancing frequency. For example, to rebalance weekly, the investor could base a
trigger on the weekly volatility of the index for the fund. In conclusion, compared with returns from an un-rebalanced fund,
rebalancing fund position(s) reduces the size of the gap such that the investor’s realized return from the fund position over
multiday periods is closer to the daily multiple of the index.
Case Study Of Rebalancing For A -2x Oil & Gas Index Daily Target Strategy
To demonstrate the potential impact of rebalancing, we looked for a recent historical period with a significantly large difference
between an inverse fund return and the daily target leverage ratio times the index for a longer holding period. The inverse -2x
ETF based on the Dow Jones U.S. Oil & Gas Index has been cited as having large performance gaps for longer periods. For our
rebalancing case study, we evaluated a hypothetical fund based on this index over the period December 2008 through April
2009, when volatility levels were exceptionally elevated and the index rose just 2.2 percent. (For this hypothetical fund, we used
index total returns, excluding expenses and trading costs. The fund, therefore, does not represent an actual investment or actual
ETF returns.)
A hypothetical fund with a one-day target of -2x based on this index without rebalancing would have returned -25.8 percent
over this period without fees, expenses and transaction costs. This is a difference of 21 percent in return from the -4.4 percent
for a -2x period return, given the 2.2 percent index return and excluding fund fees, expenses and transaction costs. How might
percentage-trigger rebalancing strategies have fared in narrowing this gap? We analyzed a broad range of percentage-trigger
strategies (from 0 percent to 25 percent) and found that any such strategy may have meaningfully reduced the gap in

performance. Figure 14 compares the performance for the unrebalanced fund with three such sample percentage-trigger
rebalancing strategies.
Given the high level of volatility during the case study period, we focused on the 10 percent gap trigger (that is, we rebalanced
when the cumulative difference between index return and fund return was greater than 10 percent), and assume all rebalancing is
done based on end-of-day index levels with no fees, expenses or transaction costs. Using this 10 percent rebalancing trigger,
the return for a daily target -2x rebalanced strategy based on the Dow Jones U.S. Oil & Gas Index would have been -6.0 percent,
just 1.6 percent below the -4.4 percent return that a -2x fund investor might set as a target for a five-month holding period.
There was an average of 3.8 days between rebalances. It is worth noting that in a lower-volatility period, the 10 percent trigger
likely would have prompted less frequent rebalancing.
Figure 15 shows the index cumulative return over the period for the Dow Jones U.S. Oil & Gas index (black line), during a very
choppy return environment. This result is consistent with the type of periods in which a gap develops for a -2x inverse fund. The
orange line shows a hypothetical daily target -2x strategy with no rebalancing, and the blue line shows a similar -2x strategy
rebalancing with a 10 percent trigger. This case study is just one hypothetical example with a specific rebalancing rule employed
on a particular index for a single time frame, but it illustrates how a perceived performance gap may be reduced significantly for
investors focused on achieving longer-term target leverage returns using daily target fund ETFs.
Conclusion
Leveraged and inverse funds have been and can be used successfully for periods longer than one day. Our study shows that the
impact of compounding on these funds over multiday periods for most broad indexes was virtually neutral. There is a high
probability of approximating the one-day target for periods longer than a day; the shorter the period and the lower the index
volatility, the higher the resulting probability of meeting the one-day target. Finally, rebalancing the size of fund positions, while
resulting in some additional trading costs, may be an effective mechanism for investors whose goal is to approximate the daily
leverage target over time. The process is straightforward and simply involves monitoring index returns versus fund returns and
establishing a trigger percentage of deviation as a basis for the rebalancing strategy.
Solomon Teller contributed to this article. The authors would also like to thank Howard Rubin and Cynthia Truong.
References
Marco Avellaneda, Stanley Zhang, “Path-Dependence of Leveraged ETF Returns,” Working Paper. Courant Institute of
Mathematical Sciences, New York University; Finance Concepts, 2009.
Richard Co, “Leveraged ETFs vs. Futures: Where Is the Missing Performance?” CME Group Research & Product Development,
February 9, 2009.
Matthew Hougan, “How Long Can You Hold Leveraged ETFs?” Journal of Indexes, March/April 2009.
Lei Lu, Jun Wang, Ge Zhang, “Long Term Performance of Leveraged ETFs,” Working Paper. Shanghai University of Finance and
Economics; 2009.
Jason Ruspini, “Making Leveraged ETFs Work,” Seeking Alpha, July 07, 2009.
Endnotes
1. Including exchange-traded notes, the total number of leveraged and inverse exchange-traded index products as of June 30,
2009, was 140, with total assets of $34.7 billion.
2. IndexUniverse.com, Matt Hougan, “Getting Leverage. Going Short.” webinar, May 14, 2009.
3. We use extreme examples +10 percent and -10 percent for daily returns for purposes of illustration. These levels of daily
returns are highly unlikely for most indexes.
4. Over this 50-year daily return history, the annualized volatility of the S&P 500 Index was 15.5 percent.
5. Over the 50 years of S&P 500 return history, there were more than 18,000 rolling periods in our sample for each holding period
out to six months. The analysis is based on the distribution of differences between the returns of a hypothetical daily target
leverage fund for each holding period and the returns of the index for the same period multiplied by the leverage ratio (2x or -2x).
Each holding period return has embedded (but different) compounding effects, allowing us to analyze the distribution of these
differences in terms of the arithmetic mean, median and percentiles.
6. Some investors in leveraged and inverse funds have strategies based more on a trading view of an index and are primarily
seeking to profit from this view. They may be looking to benefit from trending markets or lower levels of short-term volatility and
are less concerned about precision in achieving the daily leverage target over a longer horizon.
7. One weakness of a calendar-based approach is that it does not allow for reaction to large and quick moves that are event-
driven, such as was seen in October 1987 and on September 11, 2001, and the recent volatility associated with the global
financial crisis.
8. The Financial Industry Regulatory Authority (FINRA), “Non-Traditional ETFs,” Regulatory Notice 09-31, June 2009.
© Copyright IndexUniverse.com 2009, All rights reserved. Permalink