understanding p, k, ca, mg - soil science at uw-madison · (redrawn from pierzynski et al., 1994)...
TRANSCRIPT

Understanding
P, K, Ca, Mg
Carrie Laboski
Dept. of Soil Science
UW-Madison

Phosphorus
Environmental
Agronomic
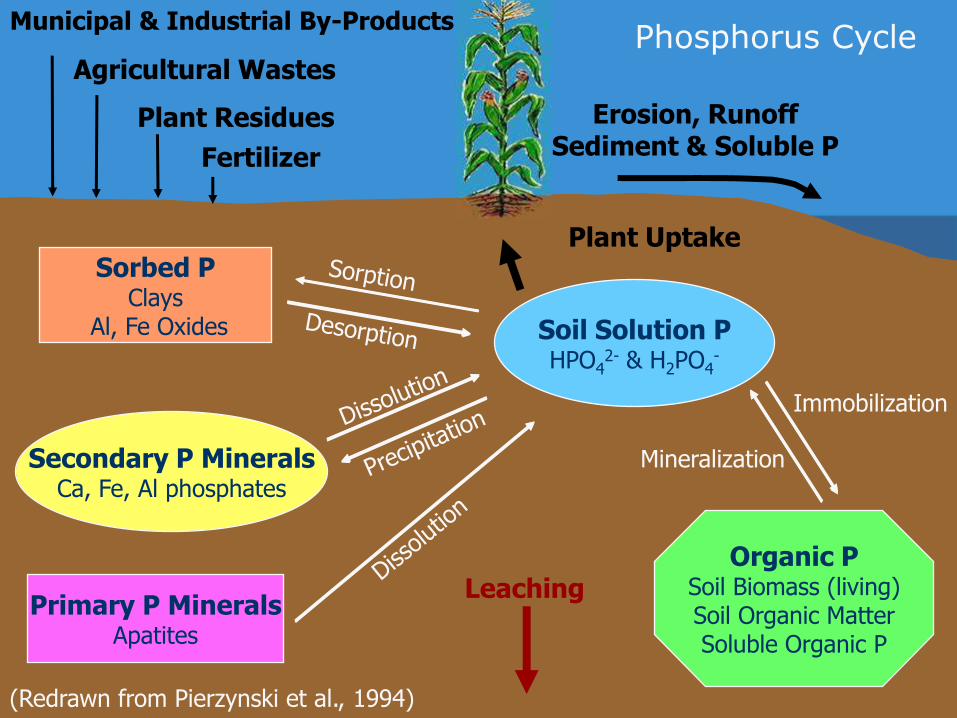
(Redrawn from Pierzynski et al., 1994)
Soil Solution PHPO4
2- & H2PO4-
Sorbed PClays
Al, Fe Oxides
Primary P MineralsApatites
Secondary P MineralsCa, Fe, Al phosphates
Organic PSoil Biomass (living)Soil Organic MatterSoluble Organic P
Immobilization
Mineralization
Leaching
Plant Uptake
Erosion, RunoffSediment & Soluble PFertilizer
Plant Residues
Agricultural Wastes
Municipal & Industrial By-ProductsPhosphorus Cycle
Environmental Concerns
Water quality
Eutrophication of surface water
– Increased algae & weeds &/or low oxygen causes problems for industry, fisheries, recreation, & drinking
Need to understand P losses to surface water
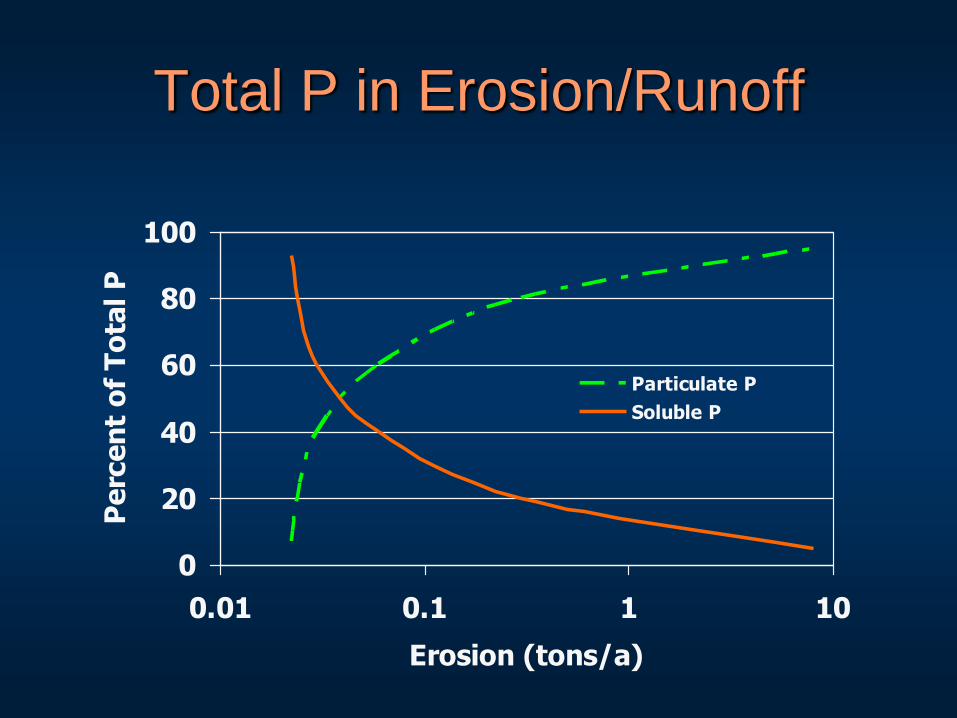
Total P in Erosion/Runoff
0
20
40
60
80
100
0.01 0.1 1 10
Erosion (tons/a)
Perc
en
t o
f T
ota
l P
Particulate P
Soluble P

Agronomic Considerations
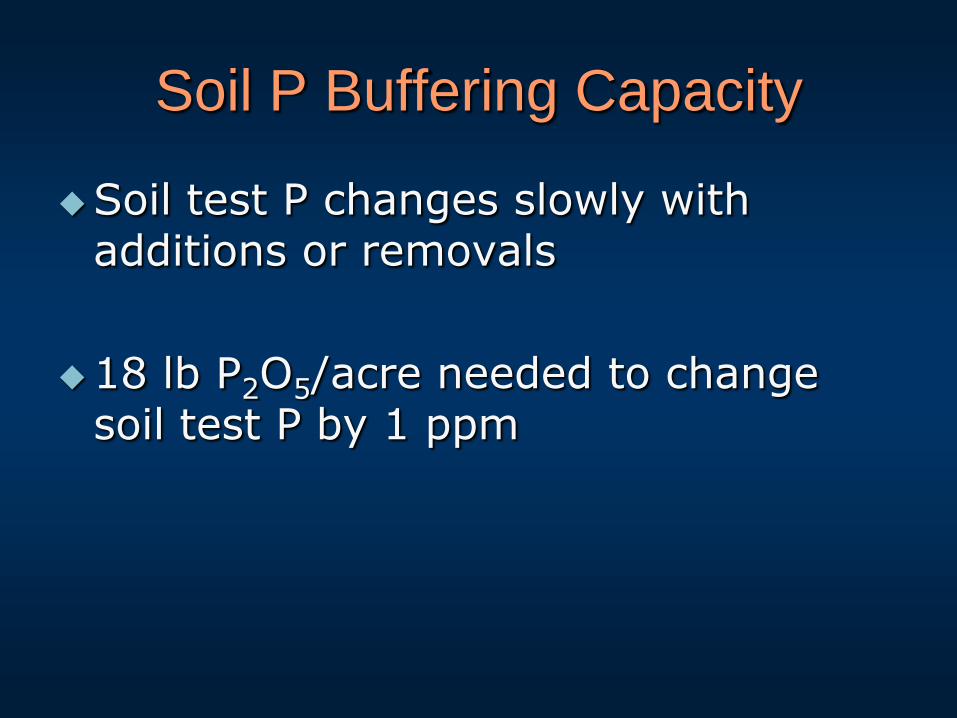
Soil P Buffering Capacity
Soil test P changes slowly with additions or removals
18 lb P2O5/acre needed to change soil test P by 1 ppm
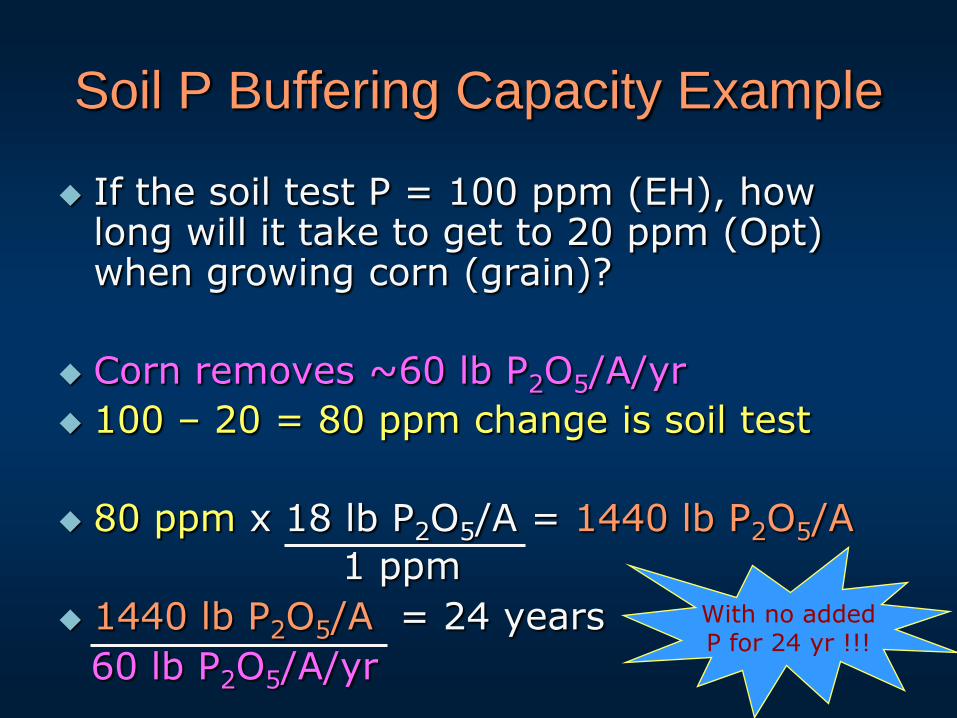
Soil P Buffering Capacity Example
If the soil test P = 100 ppm (EH), how long will it take to get to 20 ppm (Opt) when growing corn (grain)?
Corn removes ~60 lb P2O5/A/yr
100 – 20 = 80 ppm change is soil test
80 ppm x 18 lb P2O5/A = 1440 lb P2O5/A
1440 lb P2O5/A = 24 years
1 ppm
60 lb P2O5/A/yr
With no added P for 24 yr !!!

P availability affected by pH
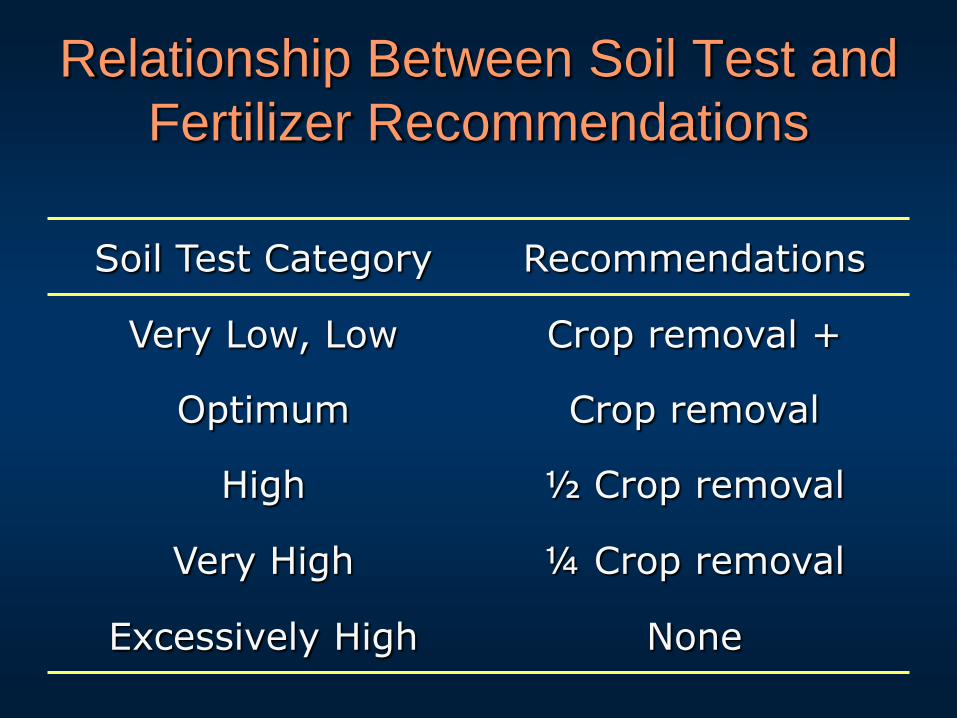
Relationship Between Soil Test and
Fertilizer Recommendations
Soil Test Category Recommendations
Very Low, Low Crop removal +
Optimum Crop removal
High ½ Crop removal
Very High ¼ Crop removal
Excessively High None

Interpreting soil test P results
Crop Bray P-1 Soil Test (ppm)
Optimum No response
Alfalfa 18 – 25 > 35
Corn 15 – 20 > 30
Soybean 10 – 15 > 20
For medium & fine textured soils

Factors Affecting Fertilizer
Management Placement & Mixing
– Band v. broadcast
Source– Analysis– Liquid v. dry– Ortho v. poly
Interaction with NH4+-N
– Stimulates P adsorption by root
Soil test P level

Potassium
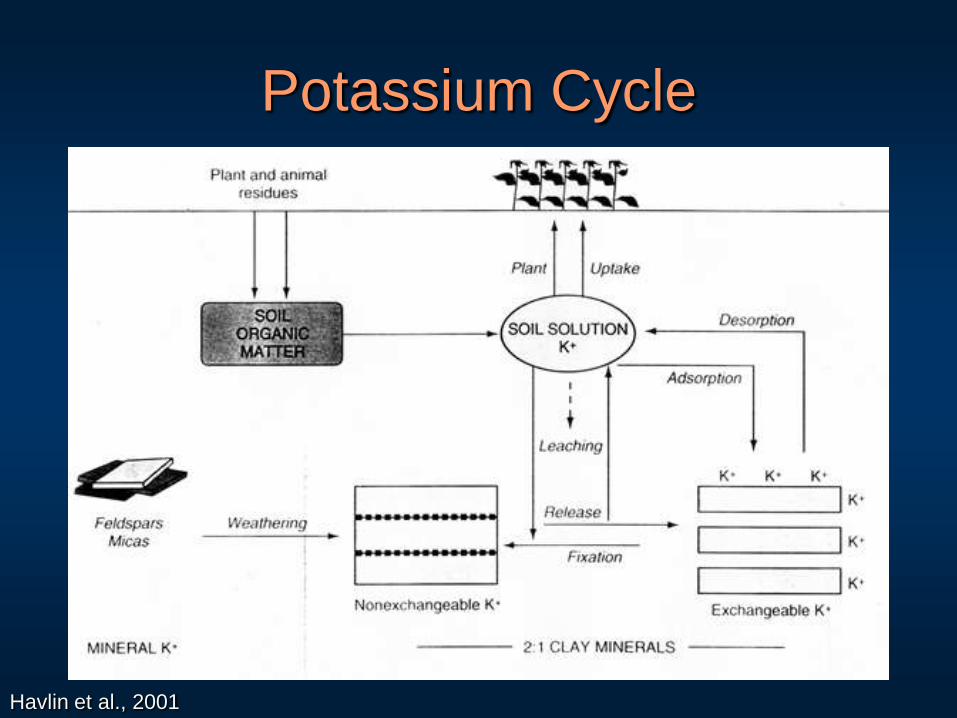
Havlin et al., 2001
Potassium Cycle

K release during mineral
weathering
Recolored from Fig. 6.9 in Havlin et al. (1999)
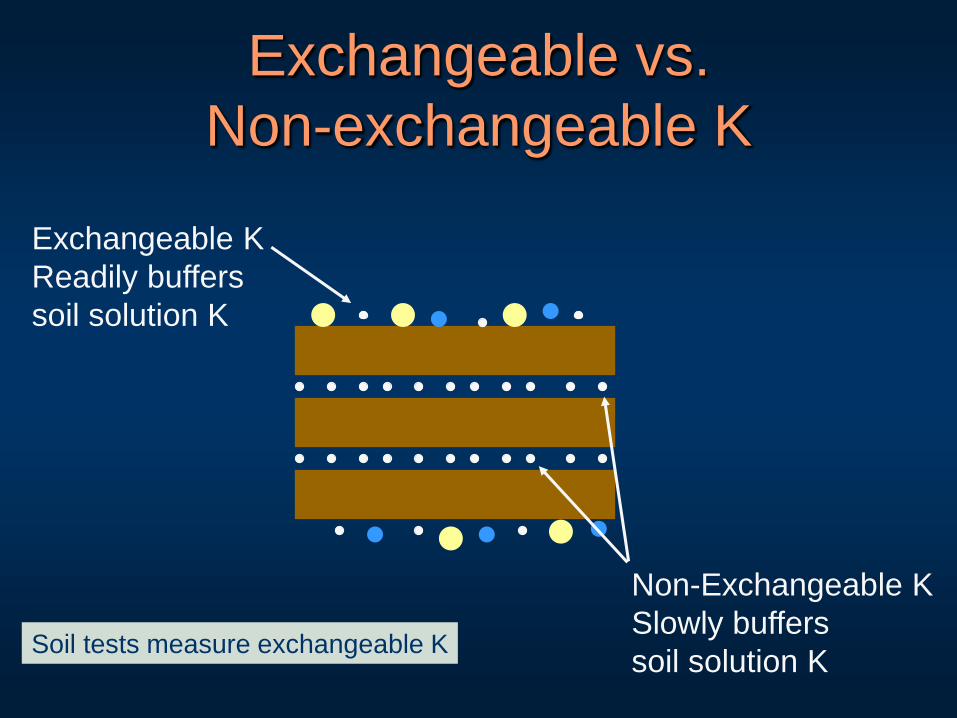
Exchangeable vs.
Non-exchangeable K
Exchangeable K
Readily buffers
soil solution K
Non-Exchangeable K
Slowly buffers
soil solution KSoil tests measure exchangeable K

Factors Influencing
Exchangeable K
Wetting/drying
Freeze/thaw
Oxidation state of Fe
Wetting/Drying
Exchangeable K can increase or decrease when soil is dried– Is dependent upon the clay minerals present
K fixation can occur – Soils with high exchangeable K or recent K
fertilizer applications are dried
– Fixation is a result of K becoming trapped within clay sheets as they dry and collapse
K release can occur– Soils low in exchangeable K are dried
– The clay sheets roll back and release K

Wetting/Drying
Net effect depends on whether fixation or release dominates
Time of soil sampling in relation to field wetting and drying cycles may influence soil test K levels
Freeze/Thaw
Fixed K released with freeze/thaw
– Soils with considerable amount of mica
K release/fixation not impacted by freeze/thaw
– Soils with smaller amounts of mica & greater amounts of exchangeable K
STK may be different in spring v. fall
– Depending on clay minerals present & winter weather conditions

Oxidation State of Fe
Fe structural component in clay minerals
Fe has different oxidation states– Fe3+ - oxidized
– Fe2+ - reduced
In smectites, as Fe3+ → Fe2+, K is fixed
In illite, as Fe3+ → Fe2+, K is released
In soils containing both illite & smectite, net effect of fixation/release depends on which clay mineral dominates
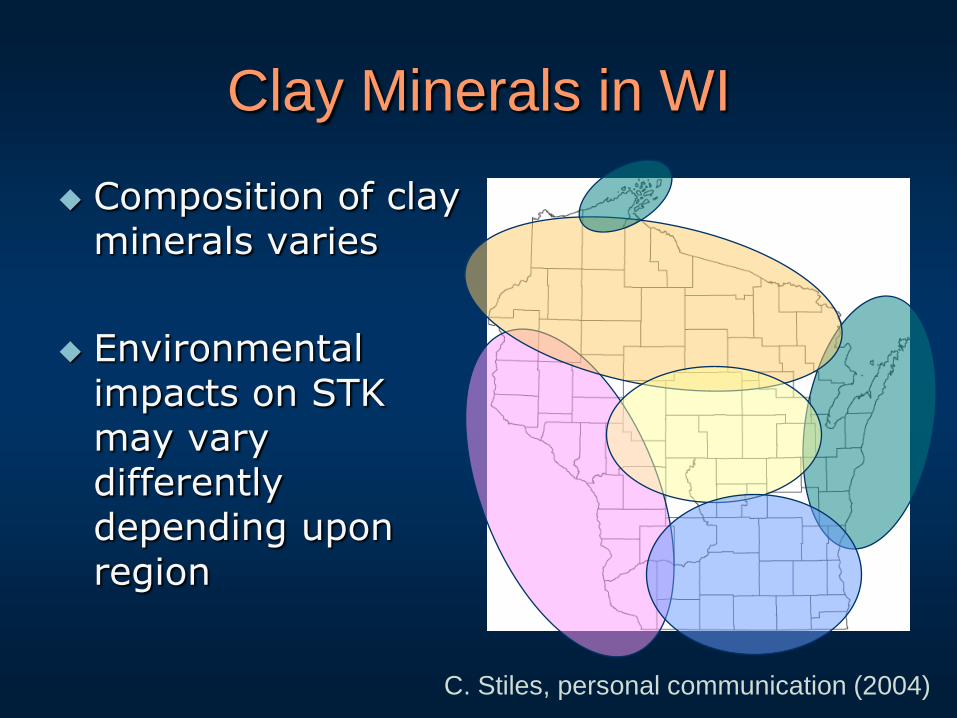
Clay Minerals in WI
Composition of clay minerals varies
Environmental impacts on STK may vary differently depending upon region
C. Stiles, personal communication (2004)
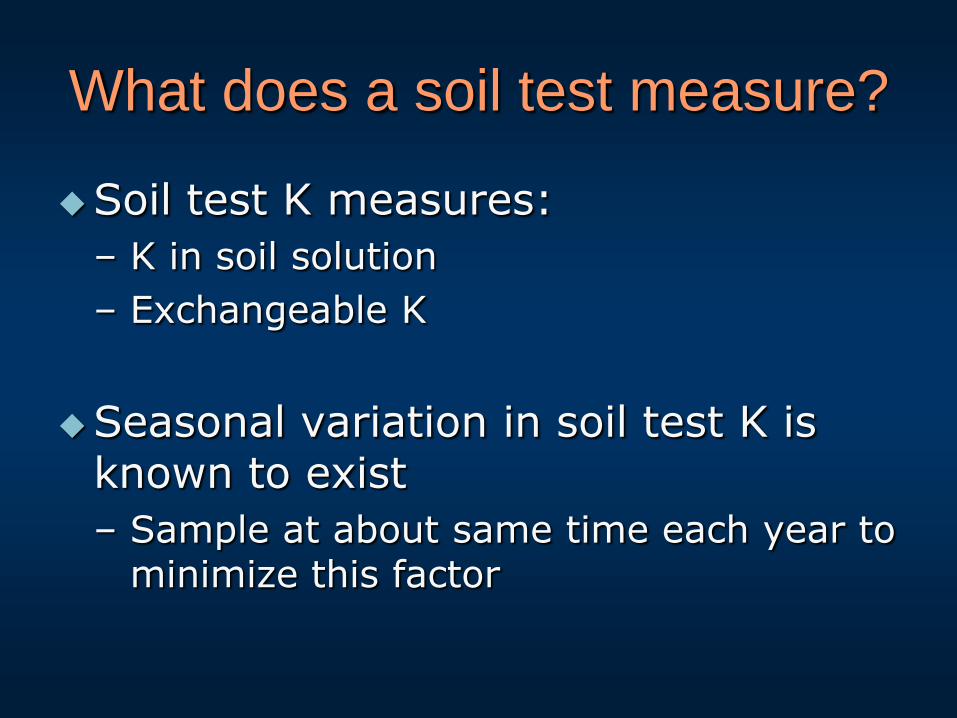
What does a soil test measure?
Soil test K measures:
– K in soil solution
– Exchangeable K
Seasonal variation in soil test K is known to exist
– Sample at about same time each year to minimize this factor

Interpreting soil test K results
Medium & fine soils Course textured soils†
Crop Optimum No response Optimum No response
---------------- Soil Test K (ppm) ---------------
Alfalfa 91 – 120 > 170 81 - 120 > 180
Corn 81 – 100 > 140 66 – 90 > 130
Soybean 81 – 100 > 140 60 – 80 > 120
† Not irrigated
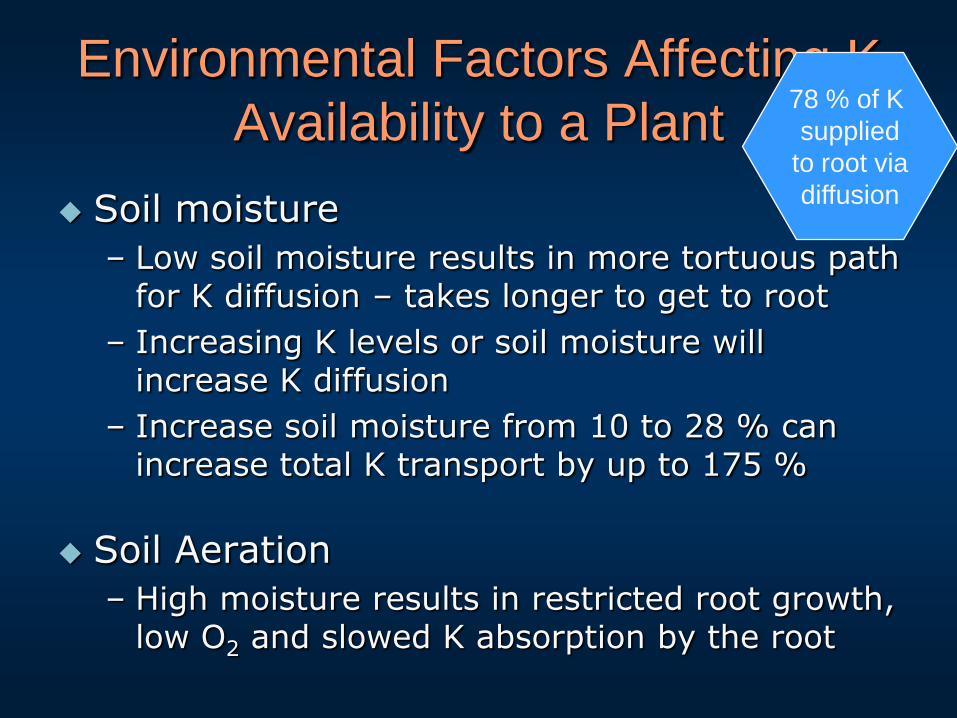
Environmental Factors Affecting K
Availability to a Plant
Soil moisture
– Low soil moisture results in more tortuous path for K diffusion – takes longer to get to root
– Increasing K levels or soil moisture will increase K diffusion
– Increase soil moisture from 10 to 28 % can increase total K transport by up to 175 %
Soil Aeration
– High moisture results in restricted root growth, low O2 and slowed K absorption by the root
78 % of K
supplied
to root via
diffusion

Environmental Factors Affecting K
Availability to a Plant
Soil temperature
– Low temperature restricts plant growth and rate of K uptake
– Providing high K levels will increase K uptake at low temperatures
Reason for positive response to banded starter
Soil pH
– At low pH, K has more competition for CEC sites
– As soils are limed, greater amount of K can be held on CEC and K leaching reduced.

Environmental Factors Affecting K
Availability to a Plant
Leaching
–K leaching can occur on course textured or muck soils particularly if irrigated
– Large fall K applications to sandy or muck soils discouraged
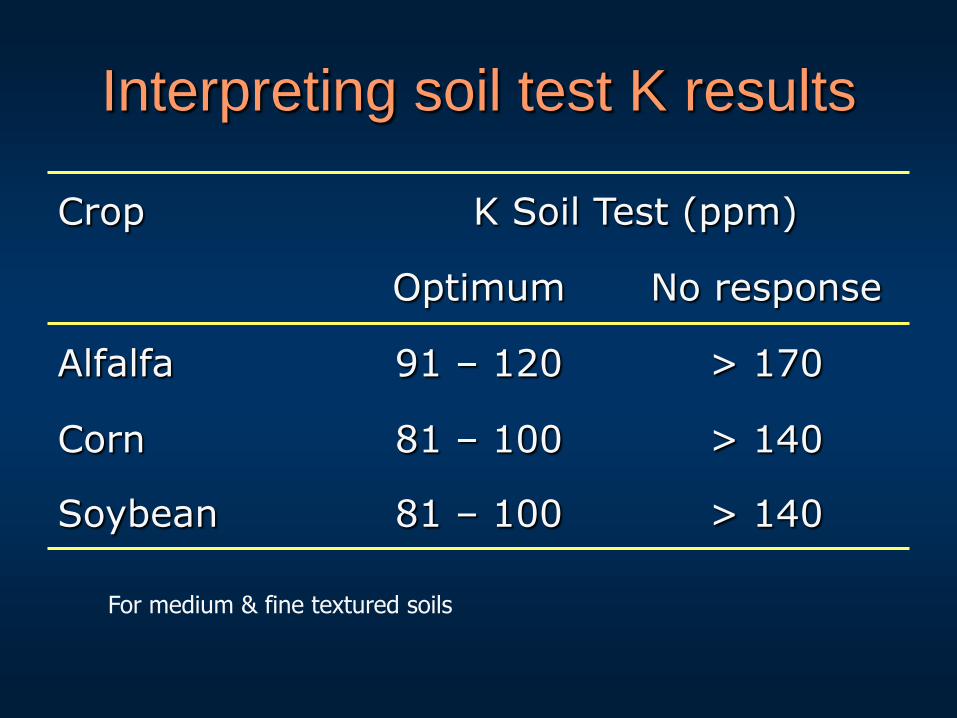
Interpreting soil test K results
Crop K Soil Test (ppm)
Optimum No response
Alfalfa 91 – 120 > 170
Corn 81 – 100 > 140
Soybean 81 – 100 > 140
For medium & fine textured soils

K Management in WI
Many soils deficient– Particularly alfalfa rotation
K important in reduced tillage
More liquid (low K) starter used
Topdress K used as insurance
Excessive K in some forages
Timing relatively unimportant

Calcium & Magnesium
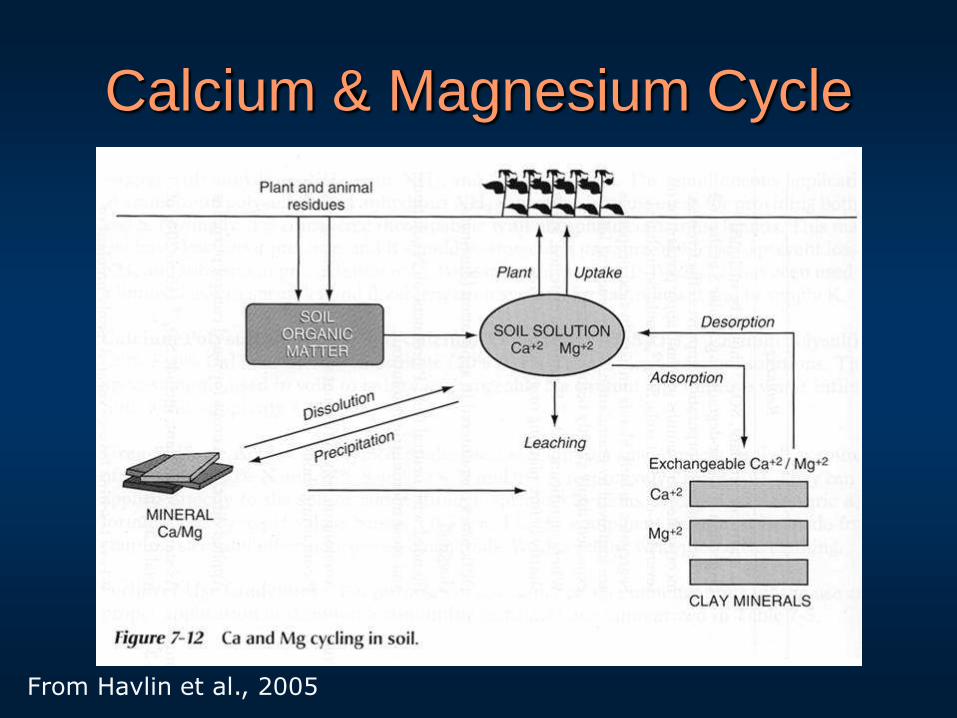
Calcium & Magnesium Cycle
From Havlin et al., 2005
Calcium Availability
15 ppm in soil solution is adequate for most crops
–Concentrations greater than this effect Ca uptake very little; Ca uptake is genetically controlled
Solution Ca is 10x > solution K
–But K uptake is greater because of how Ca taken up
Factors Affecting Ca Availability
Total Ca supply & % Ca saturation of CEC
– Low CEC soil with 1000 ppm Ca supply more Ca to plants than high CEC soil with 2000 ppm Ca
Soil pH
– Low soil pH impedes Ca uptake
Type of soil clay
– 2:1 clays require > Ca saturation of CEC compared to 1:1 clays to supply adequate Ca
Ratio of solution Ca2+ to other cations
– Uptake depressed by NH4+, K+, Mg+, Mn2+, Al2+
– Absorption increased by NO3-
Factors Affecting Mg Availability
Total Mg supply
CEC
pH
Excess K applications on sandy soil– Cause Mg leaching
– K interferes with Mg uptake
Continuous use of high Ca lime increases Ca:Mg ratio – May induce Mg deficiency in certain crops
NH4+ induced Mg deficiency
– High rates of NH4+ on soils with low exchangeable Mg