understanding microbe regulation of the …1259565/fulltext01.pdf · 3 abstract microbiota’s...
TRANSCRIPT

1
EXAMENSARBETE INOM TEKNIKOMRÅDET
BIOTEKNIK
OCH HUVUDOMRÅDET
MEDICINSK TEKNIK,
AVANCERAD NIVÅ, 30 HP
STOCKHOLM, SVERIGE 2018
UNDERSTANDING MICROBE
REGULATION OF THE
PARKINSON DISEASE
ASSOCIATED GENE LRRK2
STINA RASKOPP
KTH
SKOLAN FÖR KEMI, BIOTEKNOLOGI OCH HÄLSA

2
www.kth.se

3
ABSTRACT
Microbiota’s influence on human health and disease is a growing research field including
neurodegenerative diseases such as Parkinson’s disease (PD). The disease symptoms involve
movement disorder, manifesting tremor, rigidity, bradykinesia and instability. At the molecular
level, the disease exhibits; aggregated alfa-synuclein trapped inside neurons in the brain, in so
called Lewy bodies, and loss of dopaminergic neurons in substantia nigra.
The working hypothesis of this project is that human microbiome composition and interactions
mediate environment and lifestyle influences on disease expression of PD. To validate this
hypothesis, a mouse model (C57BL/J6 mice) was used. Two knock-in mouse lines were used;
one carrying the wild type, human Leucine-Rich-Repeat-Kinase 2 (LRRK2) and the second
carrying the most common Caucasian LRKK2/G2019S mutant. LRRK2 is a tyrosine kinase
known to interact with Nucleotide-binding oligomerization domain-containing protein 2
(NOD2), a cytosolic microbe peptide sensing receptor. To establish the tools and knowledge
required for the analyses, the initial part of the project was to analyze the expression levels of
LRRK2 and NOD2 in wild-type C57BL/J6 mice in specific pathogen free (SPF), and mice
devoid of exposure to living microbes, so called germ-free (GF) mice. Along with this analyse,
expression levels of the transgenic LRKK2 proteins in the genetically modified mice was
monitored. The focus was on the following tissues: striatum, midbrain, hippocampus, small
intestine and large intestine and applied immune-histochemistry (IHC) combined with Western
blot analysis.
Results; significantly higher expression levels of LRRK2 were observed in microbe exposed
mice versus GF mice with the exception of the large intestine which showed the opposite.
Moreover, NOD2 showed a trend of lower expression levels in all brain GF areas tested with
the exception to striatum. For the transgenic human knock-in LRKK2 proteins, increased
expression of hLRKK2 were observed in striatum and large intestine compared to G2019S.
Reduced hLRKK2 expression was observed in midbrain. The results suggest a strong
correlation between LRRK2 expression and the gut microbiota and a need for continued
research to better understand the role our indigenous microbiome may play in onset/progression
of PD.

4
SAMMANFATTNING
Mikroflorans betydelse för människors hälsa och sjukdomar är ett framväxande och
banbrytande forskningsfält. Forskning har inte bara visat på mikroflorans betydelse för friska
tillstånd utan också för utveckling av sjukdomar, så som Parkinsons sjukdom (PD). PD är en
neurodegenerativ sjukdom med symptom som innefattar rörelsestörningar; tremor, stelhet,
bradykinesi och instabilitet. På molekylär nivå ses aggregerat alfa-synuclein inuti neuroner i
hjärnan, i så kallade Lewy-kroppar samt förlust av dopaminerga neuroner i substantia nigra.
Hypotesen som utformats i detta projekt utgick ifrån att mikroflorans sammansättning och
interaktioner, medierar miljö- och livsstilsfaktorer vilket leder till utveckling av PD. För att
testa hypotesen användes musmodellen C57BL / J6 i vildtyp form samt i transgen form. De
transgena formerna bestod av två olika knock-in modeller; en som bär den vilda typen av
humant Leucin-Rich-Repeat-Kinase 2 (hLRRK2) och en som bär den vanligaste kaukasiska
mutationen av samma protein, G2019S. LRRK2 är ett tyrosin kinas som interagerar med
Nucleotide-binding-oligomerization-domain-containing-protein 2 (NOD2), en cytosolisk
mikrobpeptidreceptor. Analyser av LRRK2 och NOD2 utfördes på vildtypen av C57BL / J6-
möss i specifikt patogenfria (SPF) förhållanden samt på möss som saknar exponering för
levande mikrober, så kallade bakteriefria (GF). I de transgena mössen analyserades de genetiskt
modifierade LRKK2-proteinerna, hLRRK2 och G2019S, samt NOD2 i möss i SPF
förhållanden. Följande vävnader undersöktes; striatum, mellanhjärnan, hippocampus,
tunntarmen och tjocktarmen med immunhistokemi (IHC) i kombination med Western blot-
analys.
Resultaten visade på en betydligt högre uttrycksnivå av LRRK2 i mikrobexponerade möss
jämfört med GF möss med undantag för tjocktarmen där resultatet visade det motsatta.
Dessutom visade resultaten en trend på lägre uttrycksnivåer av NOD2 i alla analyserade
områden i hjärnan med undantag för striatum. För de transgena humana knock-in-LRKK2-
proteinerna observerades ökat uttryck av LRKK2 i striatum och tjocktarm jämfört med G2019S,
samt reducerat LRKK2 uttryck i mellanhjärnan. Resultaten visar på en stark korrelation mellan
LRRK2-uttryck och tarmens mikroflora och implicerar förbättrad förståelse av mikroflorans
roll i början och under progression av PD.
5
KEY WORDS
Parkinson’s disease; LRRK2; Gut microbiota; Germ free; Specific-pathogen free; Mice
model; NOD2
ACRONYMS /ABBREVIATIONS
Parkinson’s disease PD
Leucine-Rich-Repeat-Kinase 2 LRRK2
hLRRK2 Human knock-in LRRK2
G2019S Mutated human knock-in LRRK2, glycine
on place 2019 has been exchanged into
serine
WT LRRK2 Mouse LRRK2
NOD2 Nucleotide-binding oligomerization domain-
containing protein 2
SPF Specific-pathogen free, a colonized mouse
with bacteria
GF Germ-free, non-colonized
UCHL-1 Ubiquitin carboxy-terminal hydrolase L1
SNP Single-nucleotide polymorphism
PFA Paraformaldehyde
ON Over night
RT Room temperature
BSA Bovine Serum Albumin
TEMED Tetramethylethylenediamine
SDS Sodium dodecyl sulfate
APS Ammonium persulfate
BrdU 5-Bromo-2-deoxyuridine
PVDF Polyvinylidene difluoride
TBS/-T Tris buffered saline/-tween (1%)
PBS/-T Phosphate-buffered saline/-tween (1%)

6
INNEHÅLL
Abstract ................................................................................................................................................................... 3
Sammanfattning ...................................................................................................................................................... 4
Key words ................................................................................................................................................................ 5
Acronyms /abbreviations ........................................................................................................................................ 5
Introduction ............................................................................................................................................................ 8
Parkinson’s disease described in brief ................................................................................................................ 8
Leucine-rich repeat kinase LRRK2 ....................................................................................................................... 9
Parkinson’s disease and the possible connection to the gut microbiota ......................................................... 10
Inflammation in the intestine and the possible connection to Parkinson’s disease ........................................ 10
The hypothesis and setup of the project .......................................................................................................... 11
Materials and Methods ......................................................................................................................................... 14
Setting up the project ....................................................................................................................................... 14
Euthanization and Perfusion fixation ................................................................................................................ 15
Immune-histochemistry ................................................................................................................................... 16
Protocol Immune-histochemistry NR 1 ........................................................................................................ 16
Protocol Immune-histochemistry NR 2 ........................................................................................................ 16
Western blot ..................................................................................................................................................... 17
Protein extraction ......................................................................................................................................... 17
Bradford ....................................................................................................................................................... 17
SDS-PAGE ...................................................................................................................................................... 19
Transfer to membrane ................................................................................................................................. 19
Incubation with primary antibody ................................................................................................................ 20
Incubation with secondary antibody ............................................................................................................ 20
Development of membrane ......................................................................................................................... 20
Calculation of amount of protein on membrane ......................................................................................... 20
Results ................................................................................................................................................................... 22
WT mice in SPF and GF ..................................................................................................................................... 22
Weight .......................................................................................................................................................... 22
Immune-histochemistry of WT LRRK2 mice in SPF and GF conditions ......................................................... 22
Western Blot ................................................................................................................................................ 26
KI hLRRK2 and KI G2019S in SPF ....................................................................................................................... 29
Weight .......................................................................................................................................................... 29
Immune-histochemistry of hLRRK2 and G2019S in SPF condition ............................................................... 29
Western Blot ................................................................................................................................................ 30

7
Discussion .............................................................................................................................................................. 33
Future perspectives ............................................................................................................................................... 39
Acknowledgements ............................................................................................................................................... 42
References ............................................................................................................................................................ 43
Supplementary material ....................................................................................................................................... 46
Weight .............................................................................................................................................................. 46
Solutions used in immune-histochemistry ....................................................................................................... 47
Solutions used in Western blot ......................................................................................................................... 47
Absorbance values and calculations for Bradford essay .................................................................................. 49
WT LRRK2 mice in SPF and GF conditions .................................................................................................... 49
KI hLRRK2 and KI G2019S in SPF conditions ................................................................................................. 50
Values and calculations of relative protein values ........................................................................................... 52
WT LRRK2 mice in SPF and GF conditions .................................................................................................... 52
KI hLRRK2 and KI G2019S in SPF conditions ................................................................................................. 56

8
INTRODUCTION
With the increasing amount of indications linking certain disorders of the human body to a
disturbed microbiota, there is a growing interest to investigate any connection between
neurodegenerative disorders, such as Parkinson’s disease to the gut microbiome. Therefore, this
project aims to investigate the most common mutated gene in Parkinson’s disease, LRRK2, and
its relation to the gut microbiome in a mouse model system.
PARKINSON’S DISEASE DESCRIBED IN BRIEF
More than 10 million people worldwide live with Parkinson disease, PD, and it is the second
most common neurodegenerative disorder in the Western world. The disease is a progressive,
chronic movement disorder with symptoms including tremor, rigidity, bradykinesia and
instability. Beyond these motor symptoms, and often before their onset, PD patients display
numerous non-motor dysfunctions including loss of olfaction, constipation, swallowing
problems and mental changes; memory loss, mood disorders, and in a later stage of the disease;
dementia.
The pathological hallmarks of PD are the loss of dopaminergic neurons in the substantia nigra
pars compacta in the brain. Substantia nigra pars compacta projects to the striatum and initiates
movement, hence the motor symptoms subsequent degeneration. In the remaining neurons in
substantia nigra, intracytoplasmic inclusion consisting of fine filaments of densely packed alfa-
synucleins, other proteins and ubiquitin, in so called Lewy bodies, are found. Alfa-synuclein is
an abundant protein in the brain, involved in synaptic transmission and protection of the neuron,
but when found in the Lewy bodies it is abnormally aggregated and bound to ubiquitin, a tag
for degradation in the proteasome within the cell [1]. Another finding in the neurons of the brain
are the neurofibrillary tangles, not only correlating with PD but also with other
neurodegenerative disorders. Neurofibrillary tangles constitute intracellular aggregations of the
microtubule associated protein tau [2].
The pathogenesis for PD is in part unclear, however previous studies provide multiple clues.
These include; mutations in the alfa-synuclein gene; seen in both familiar and sporadic cases;
and mutations in the E3 ubiquitin ligase gene Parkin and UCHL-1. Parkin and UCHL-1 are
enzymes responsible for degradation of proteins, tagging the proteins with a ubiquitin, making
them susceptible for degeneration in the proteasome. Another gene that have gained
considerable interest is the Leucine-rich repeat kinase, LRRK2, gene (PARK8), on

9
chromosome 12p11.2-q13.1, which interacts with Parkin in a not fully understood process [4].
Mutated LRRK2 shows either Lewy bodies containing alfa-synuclein or tangles containing tau;
both pathologic for neurodegenerative disorders [1].
LEUCINE-RICH REPEAT KINASE LRRK2
LRRK2 is a protein largely present in the cytoplasm, the mitochondrial membrane and highly
expressed in dopaminergic neurons in the midbrain; cortex and hippocampus. With a variety of
functions, the leucine-rich section seems to play a role in interaction and activation of other
proteins, the kinase function transfers a phosphate group from ATP to amino acids in proteins.
The latter mentioned process is essential in both turning on and off cell functions. Another
function is the GTPase activity. The interaction between LRRK2 and Parkin is needed for
parkin to become active and sort and tag proteins for degradation [3]. Mutations or single-
nucleotide polymorphism (SNPs), in the LRRK2 gene represent the most frequent autosomal
dominant form of PD. At least 20 different LRRK2 mutations have been associated with PD,
of which the gain of function mutation, G2019S, is the most common genetic determinant of
PD identified to date [5]. The G2019S variant of LRRK2 leads to increased kinase activity,
enhanced autophosphorylation, neuronal cell death and decreased lysosomal function within
the cell [6]. LRRK2 G2019S mutation does not only show in familial PD but also in sporadic
PD [5]. The mutation or SNP G2019S is a substitution of glycine to serine at amino acid
sequence number 2019 in the LRRK2 gene. It is mentioned in literature both as mutation and
as a SNP. SNP is a common genetic variant of a gene, not necessarily leading to a disease or
dysfunction.
Most cases of PD are sporadic; both autosomal dominant and recessive forms of the disease
exist. According to a study established in North Africa on the frequency of the G2019S variant
of the LRRK2 gene among patients with PD. Homozygous carriers are rare, only 4 % of all
G2019S carriers, and mostly reported in areas where consanguineous marriages occur. Among
the heterozygous carriers, almost one third showed autosomal dominant form and less than 2
% showed recessive form. Most interesting in this study is the finding in the control group; 5
% of the population in the control group were heterozygous carriers of G2019S without
expressing PD symptoms. This suggests that something is either triggering or suppressing the
G2019S variant population to develop PD [7].

10
PARKINSON’S DISEASE AND THE POSSIBLE CONNECTION TO THE GUT MICROBIOTA
This project investigates WT mice LRRK2 expression level in specific-pathogen free and germ-
free conditions, the focus of this project also lies on investigating knock in hLRRK2 and knock
in G2019S levels in mice in specific-pathogen free conditions. The interest for investigating a
possible connection between the most common variant of LRRK2 associated with PD and the
gut microbiome originate from a wide range of studies and presented here is a selection of them.
An article from K.M. Shannon and her colleagues at Rush Medical College in Chicago, US,
presents relevant outcomes on the influence of microbiome on its host. The study showed that
alfa-synuclein aggregations were present in the colon from two to five years before the onset
of motor symptoms of PD [8]. Further supporting the theory of the connection between PD and
gut microbiome is the study from S.K. Mazmanian at California Institute of Technology,
showing that transplanted PD feces to GF mice lead to PD expression in the mice. These studies
propose that abnormalities in neurons of the enteric nervous system may be amongst the earliest
neuropathological changes in PD; expressed as constipation, circumstantially linking disease
expression more closely to the gut microbiome [9].
INFLAMMATION IN THE INTESTINE AND THE POSSIBLE CONNECTION TO PARKINSON’S DISEASE
In addition to the possible microbiome gut-brain axis of development of PD, is the connection
between PD and inflammation. LRRK2 is an interferon-ƴ target gene, a cytokine expressed
during both viral and bacterial infections. Interferon-ƴ activates both innate and adaptive
immune system and is also an inducer of gene-transcription of LRRK2. Levels of LRRK2 are
increased in all immune cells in patients with PD, Crohns disease and during inflammation in
otherwise healthy subjects. In macrophages the LRRK2 elevates after the macrophage has
encountered an antigen and LRRK2 co-regulates its autophagy [10]. LRRK2 has also been
showed to regulate inflammatory bowel disease via NF-κβ in activated T-cells. Hence, LRRK2
is identified as a major susceptibility gene for Crohns disease, an autoinflammatory disease of
the colon [11], [30]. LRRK2 is known to interact with Nucleotide-binding oligomerization
domain-containing protein 2, NOD2, a cytosolic pattern recognition receptor. NOD2 binds to
peptidoglycans or muramyl dipeptides, MDP, on bacteria and stimulates the immune system.
After encounter of MDPs, NOD2 forms a complex with LRRK2 and transmits the activation
[12]. NOD2 has two caspase recruitment domains, known to play a role in apoptosis and NF-
κβ activation. The interaction between bacteria, NOD2 and LRRK2 promotes mucosal

11
immunity in the intestines, where symbiotic bacteria recruits NOD2 which is needed for the
Paneth cells in the gut to sorting their lysozymes correctly. Paneth cells secrete antimicrobial
peptides, and subsequently plays a role in the host-microbe interactions. Both NOD2 and
LRRK2 are so called inflammatory bowel disease associated genes [13]. One SNP/mutated
variant of LRRK2 is N2081D. N2018D is a risk allele for Crohns disease and located in the
same kinase domain as G2019S responsible for PD [14]. Deficiency of LRRK2 has also shown
to enhance susceptibility to inflammatory bowel disease and especially Crohn’s disease which
has been demonstrated to be in part microbiome mediated [15].
Inflammation in the mucosa of the intestines can occur from many different reasons. One of
them being lack of adequate energy source, such as butyrate. Butyrate is a short chain fatty acid,
SCFA, and an important energy source for the cells lining the intestinal mucosa. SCFA are
produced by probiotic bacteria in the gut through fermentation of plant products. Butyrate has
also shown to limit intestinal inflammation by inducing formation of regulatory T-cells [16].
While butyrate protects the intestines mucosa, it has also shown to protect the brain from
dopaminergic degradation in substantia nigra and prevent decreased expression of tyrosine
hydroxylase, the enzyme converting tyrosine into L-DOPA, the precursor to dopamine [17]. In
addition to this, butyrate upregulates the NOD2 receptor through increasing histone acetylation
in the NOD2 promoter region [18].
THE HYPOTHESIS AND SETUP OF THE PROJECT
The hypothesis to be tested in this project was that the gut microbiome up or down regulates
the expression of PD. An unhealthy intestinal mucosa, due to harmful microbes in the intestine
or lack of protective once, increases the risk of developing PD. The null-hypothesis is
subsequently that gut microbes does not up or down regulate expression of PD. The focus in
this project is to investigate the most common gene mutated/variant associated with PD, the
LRRK2 and the peptidoglycan pattern recognition receptor NOD2 using Western blot and
immune-histochemistry (IHC). The project represents fundamental research on LRRK2 and
NOD2 and should provide directions for later research. The WT LRRK2 in Specific pathogen-
free (SPF) and Germ-free (GF) conditions, and KI hLRRK2 and KI G2019S in SPF conditions
are analyzed in a mouse model system with genetic background C57BL/J6. Specific pathogen-
free means a condition where the mouse is colonized with bacteria, but selected pathogens are
absent.

12
The project is divided into two parts. The first part is an investigation of C57BL/J6 mouse,
carrying the mouse wild type form of the LRRK2 gene in SPF conditions respectively in GF
conditions. The second part is an investigation of a homozygous knock-in mouse model
carrying the human LRRK2, hLRRK2 and a homozygous knock-in mouse carrying the G2019S
mutation of the hLRRK2. Both strains were homozygous for LRRK2, to avoid the possibility
of G2019S being a recessive mutation hence not expressing at all. Since G2019S is a gain of
function mutation, the expression levels may not increase but the activity does. Therefore,
analysis of the protein levels of hLRRK2 and G2019S shows where this protein is expressed in
its healthy form, hLRRK2, and in the disease-associated form, G2019S. The hLRRK2 is thus
used as a reference for G2019S. Both groups of hLRRK2 and G2019S mice will be derived in
SPF microbiota. Due to some delays of the project, the groups of mice used were 17±1 weeks
old when euthanized, and in the groups of hLRRK2 and G2019S both female and male mice
had to be used.
Since the first part of the project uses a group of GF derived mice, it is essential to know what
impacts a GF environment have on mice. GF mice do not have any type of microorganisms
living in or on them, being raised in a germ-free facility to avoid contamination. With no
microorganisms, neither mutualistic nor pathogenic, the mice have a reduced weight, thus the
microorganisms break down important compounds in the diet, making them accessible to the
intestinal absorptive cells. The adaptive immune system is also affected, and GF animals show
less developed gut-associated lymphoid tissues, GALT, compared to the SPF animals. They
also show a defected production of antibodies and reduced Peyer’s patches in small intestine,
mesenteric lymph nodes and undeveloped lymphoid follicles. The various morphological
changes include deformation of the microvilli and alterations in the epithelial cells lining the
mucosa. The epithelial cells normally express pattern-recognition receptors as Toll-like
receptor, but under GF conditions these receptors expression decrease. In addition, a lacking
expression of antimicrobial proteins, such as defensins, and an abnormal large caecum can be
seen [19].
The brain regions used for Western blot and IHC was striatum, hippocampus and midbrain, all
analyzed for LRRK2 and NOD2. The striatum is a nuclei in the brain, a cluster of neuron
nucleus, and a part of the basal ganglia. Striatum is involved in the nigrostriatal dopaminergic
pathway receiving signals from dopaminergic neurons from substantia nigra. Substantia nigra
is located in the midbrain, which is why the midbrain is analyzed in this project. To understand
why those parts are analyzed, the control of movements in the brain needs to be understood.
13
The basal ganglia is a collection of nuclei, a cluster of neuron nucleus, involved in making
movements and prevent unwanted movements. Thalamus, one nuclei in the basal ganglia,
projects to the motor cortex which transmits signals to muscles, so that movement can occur.
Thalamus is under inhibitory control of globus pallidus, another nuclei in the basal ganglia.
When a movement is initiated, the motor cortex sends excitatory signals with glutamate to
striatum. Striatum, in turn, sends an inhibitory signal with GABA to globus pallidus. Since
globus pallidus normally inhibits thalamus, an inhibition of globus pallidus releases the
inhibition of thalamus. Thalamus becomes active and send a signal to the motor cortex. The
motor cortex, which initiated the cascade of signals, can now send excite neurons to muscles
and a movement can be initiated. The inhibition of globus pallidus needs to be strong enough
to reach over a threshold. Therefore, the inhibition is boosted via substantia nigra. Substantia
nigra projects dopaminergic neurons to the striatum and synapses, via D1 receptors, with the
inhibitory GABA neurons reaching for the globus pallidus, increasing the inhibitory signal [20].
The basal ganglia, which among other nuclei, includes both striatum and substantia nigra,
projects with hippocampus, a part of the limbic system in the brain. The connection has been
shown to play a role in movement, memory of movement and spatial memory. Hippocampus is
also a site for adult neurogenesis where immune cells paly and important role in regulating the
neurogenesis [21]. In PD an atrophy of hippocampus can be seen and expressed as a decrease
in the verbal memory, cognitive impairments and loss of spatial memory [22], [23].
Other parts of mice being analyzed using Western blot and IHC are two parts of the intestine,
the small intestine; duodenum, jejunum and ileum, and the large intestine: colon. The small
intestine is usually sterile or contains a sparse portion of bacteria, generally contaminants from
the mouth and respiratory tract. In the distal ileum, 50 % of subjects are sterile, and 50 % has
bacteria of fecal type. The large intestine normally contains a large and varied bacterial flora in
symbiosis with the host, with mutualistic, commensalistic or parasitic properties [20], [24].

14
MATERIALS AND METHODS
SETTING UP THE PROJECT
The mice with homozygous knock-in human LRRK2 and mutated form G2019S were bred at
National Neuroscience Institute, NNI, and required transfer to LKC. After transfer of the
homozygous mice, the process was repeated for the heterozygous mice. The overall time for
transferring was eight weeks. In Table 1, the total number of mice transferred from NNI to LKC
are shown.
Table 1. Table showing transferred and available mice at LKC.
Homozygous Heterozygous
hLRRK2 2 Male + 2 Female 5 Male + 5 Female
G2019S hLRRK2 3 Male + 2 Female 2 Male + 2 Female
Heterozygous mice were directly used for breeding, while homozygous mice were used for
experiment; euthanization and perfusion; IHC and Western blot.
From breeding one pair of heterozygous KI hLRRK2 or KI G2019S the theoretical outcome is
25 % of homozygous pups, which can be further used for experiment. 50 % of the pups was
heterozygous and used for breeding, 25 % was WT LRRK2 and cannot be used in this project.
One pair of mice usually give birth to eight pups.
Figure 1. Breeding scheme for three pairs of heterozygous mice, both hLRRK2 and G2019S LRRK2. hLRRK2 is shown in yellow in the figure,
while G2019S is shown in light blue. Mice usually have eight pups, and theoretically two of them, 25 %, are homozygous and can be used
in experiment.

15
EUTHANIZATION AND PERFUSION FIXATION
Mice used in the experiments were euthanized in week 17 ± 1 week. A carbon dioxide chamber
was used to euthanize the mice. One and one, the mice were placed in the chamber for
approximately 2 minutes, or until they did not respond to any type of stimuli. The chest of the
mice was opened under the costal arch, using a surgical knife. Blood sample was taken directly
from the heart. A syringe with a 0.5 mm needle through the left ventricle allowed the blood
system to be filled with 1 % PBS solution via an infusion technique. A small cut in the right
atrium permitted blood to bleed out, while PBS was infused. After injection of 50 ml of PBS,
the mice were dissected. Brain was separated in a sagittal section, left half placed in
Paraformaldehyde in 4˚C. Right half was saved as fresh tissue; Striatum, Hippocampus and
Midbrain and quick frozen in liquid nitrogen and stored in -80˚C. Intestines were separated into
small intestine and large intestine and a sample from each section was quick frozen in liquid
nitrogen as fresh sample and stored in -80˚C. The rest of the intestine were stored in 5 % PFA
in 4 ˚C and later used in IHC.
Figure 2. A picture of the mouse brain illustrating the different parts used in different experiments. The left hemisphere was fixated with
PFA and from the right hemisphere striatum, hippocampus and midbrain were dissected separately and frozen at – 80 ˚C.
Fixated tissue in PFA was stored for minimum 48 h, in 4˚C. To avoid crystallizations of fixated
tissue when freezing at -80 ̊ C, the tissue was drained from any remaining water in 20 % sucrose
solution for approximately 48 h. When the tissue sank to the bottom of the tube of sucrose, it
was frozen in OCT compound at -80 ˚C.
The fresh tissue was stored at -80˚C, until Western blot was performed. Blood sample was
centrifuged at 4˚C, 3000 rpm for 10 minutes. The serum (supernatant) was separated from the
pellet and both tubes were stored at -80˚C.
IHC
Fix with PFA
Striatum
Hippocampus
Mid-brain
Western blot
Fresh frozen

16
IMMUNE-HISTOCHEMISTRY
After perfusion fixation and preparation of the fixated tissue in OCT compound, frozen tissue,
both intestine and brain, was sliced in 16 µm slices using a Cryostat, a slicing device from
Leica. The temperature was set to -25 ˚C, and four slices of tissue was put on one microscope
glass, in total 16 glass slides. The glass slides were left in room temperature for 2 h to allow the
tissue to dry. The slides were then stored in -80 ˚C until IHC was performed.
To establish the best protocol for IHC, different methods were used and optimized before the
most efficient one was developed.
PROTOCOL IMMUNE-HISTOCHEMISTRY NR 1
The glass slides were thawed in RT for 30 minutes, and a thin line of liquid blocker was drawn
around the slices of tissue to trap liquid inside the marked ring. After the slides were washed
for 5 minutes in PBS while shaking, 200 µl blocking buffer was added to each slide and
incubated for 30 minutes in RT.
Primary antibody was diluted in blocking buffer to a concentration of 1:500, and the slides were
incubated ON in 4 ˚C.
The slides were washed 3 times in PBS for 5 minutes per wash on a shaking table. Secondary
antibody was diluted in PBS to a concentration of 1:500 and nucleus dye DAPI/Hoescht to a
concentration of 1:1000 and the slides were incubated ON at 4 ˚C.
After gently removing the secondary antibody, 3 drops of mounting solution was added to the
glass slides. A cover glass was then carefully applied, avoiding any air bubbles to remain under
the cover slide. The cover glass was then sealed with nail polish and stored at 4 ˚C.
To visualize the staining, a confocal laser microscope was used.
PROTOCOL IMMUNE-HISTOCHEMISTRY NR 2
The glass slides were thawed in RT for 30 minutes, and then perform antigen retrieval. The
slides were boiled for 5 minutes in citric buffer in a stack. The slides were then placed on ice
for 10 minutes and washed for 5 minutes in PBS and then permeabilized in PBS-Triton X for 5
minutes.

17
A liquid blocker pen was used to circulate the tissues. Primary antibody was diluted in PBS-T
to 1:500 and 200 µl then added to each slide and slides were incubated in RT in a humid
chamber ON.
After incubation with primary antibody, the slides were washed in PBS-T 3x5 minutes. Slides
were carefully dried and incubated with 200 µl of secondary antibody diluted to 1:1000 in PBS-
T and nucleus dye Dapi/Hoesch RT in a humid chamber for 1 h. After incubation, the slides
were washed with PBS-T 3x5 minutes. 3 drops of mounting solution was added to the glass
slides. A cover glass was then carefully applied, avoiding any air bubbles to remain under the
cover slide. The cover glass was then sealed with nail polish and stored at 4 ˚C.
To visualize the staining, a confocal laser microscope was used, and pictures are presented
under Result.
Primary antibodies used in IHC were following:
Anti-LRRK2 (C-terminal region) produced in rabbit. L9918
Monoclonal purified, LRRK2, MC.028.83, SIG-39840 Mouse
Anti-NOD2 clone 2D9 (mouse monoclonal)
Anti-Alpha-synuclein (phospho S129) antibody [EP1536Y] (ab51253)
Anti-Tyrosine Hydroxylase antibody [TH-100] (ab129991)
WESTERN BLOT
PROTEIN EXTRACTION
Western blot was performed on fresh tissue from small intestine, large intestine and
hippocampus. A small amount of tissue was mixed with 50 – 200 µl of RIPA lysis buffer, and
grinded for 1x3 minutes. Samples was then centrifuged for 10 min, 15 000 rpm, at 4 ˚C. Pellet
was discarded and supernatant was used for further analysis or stored at - 80 ˚ C.
BRADFORD
To determine the protein concentration of the supernatant collected after protein extraction, a
Bradford protein assay was made. A standard curve was prepared in a Greiner 96 well plate flat
bottom. In each well 100 µl of Bradford regent was mixed with BSA [1 mg/ml] ranging from
0 µl to 5 µl into eight wells, and MilliQ water was added into each well in order to get a final
18
concentration of 105 µl. The absorbance was measured at 595 nm. After creating a standard
curve with a R2-value of over 0.98, 100 µl Bradford reagent was mixed with 2 µl of protein
sample and 3 µl of MilliQ. The absorbance was measured, and the right protein concentration
was extracted using the standard curve equation. The obtained value was used to calculate the
right amount onto the SDS-page. An example of Bradford standard curve and calculations of
protein concentration and amount to load on SDS-page are shown here, values for all samples
are shown under Supplementary material.
The Bradford standard curve was created using different concentrations of BSA, all volumes
are shown in Table 2.
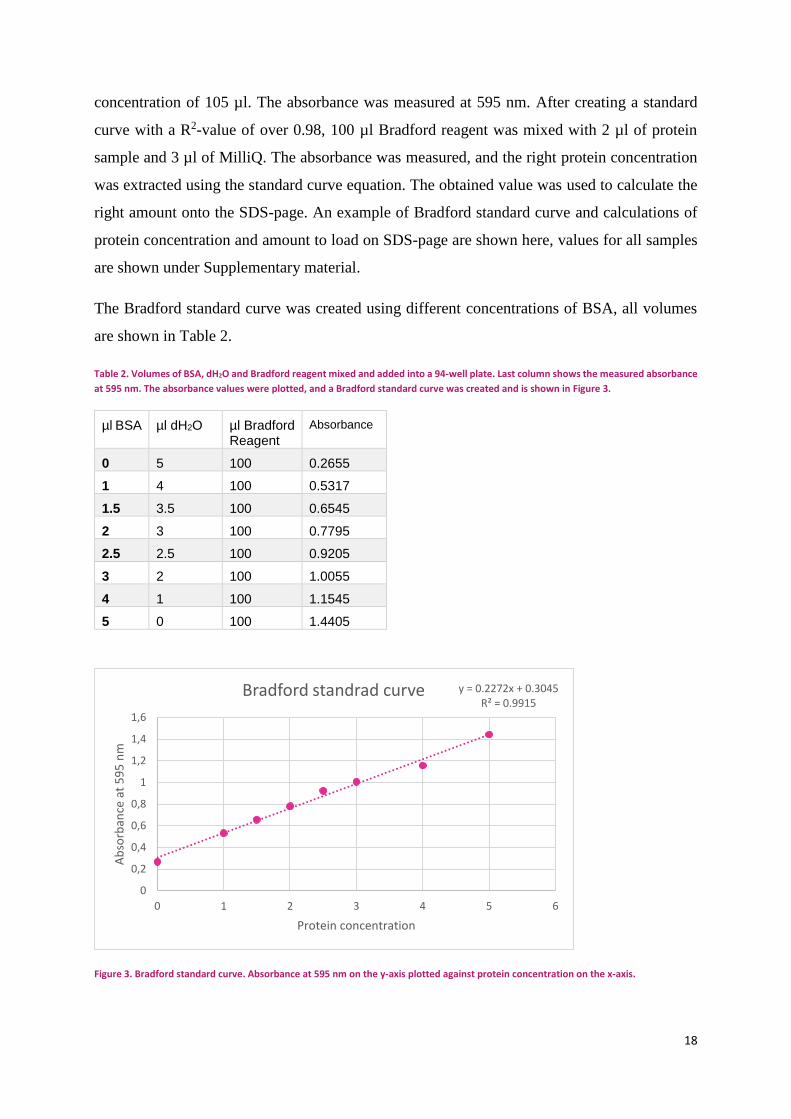
Table 2. Volumes of BSA, dH2O and Bradford reagent mixed and added into a 94-well plate. Last column shows the measured absorbance
at 595 nm. The absorbance values were plotted, and a Bradford standard curve was created and is shown in Figure 3.
µl BSA µl dH2O µl Bradford Reagent
Absorbance
0 5 100 0.2655
1 4 100 0.5317
1.5 3.5 100 0.6545
2 3 100 0.7795
2.5 2.5 100 0.9205
3 2 100 1.0055
4 1 100 1.1545
5 0 100 1.4405
Figure 3. Bradford standard curve. Absorbance at 595 nm on the y-axis plotted against protein concentration on the x-axis.
y = 0.2272x + 0.3045R² = 0.9915
0
0,2
0,4
0,6
0,8
1
1,2
1,4
1,6
0 1 2 3 4 5 6
Ab
sorb
ance
at
59
5 n
m
Protein concentration
Bradford standrad curve

19
A new Bradford standard curve was made prior to every new measurement of protein
concentration. Below is a calculation example for adding the right amount of sample onto the
SDS-page of SPF2 hippocampus sample, using the equation obtained in Figure 3.
Absorbance for the SPF2 Hippocampus was 1.6805, the concentration is then calculated from
the standard curve equation:
𝑦 = 0.2272𝑥 + 0.3045
Where the x-values represents the protein concentration and the y-values represents the
absorbance at 595 nm.
𝑥 =(𝑦 − 0.3045)
0.2272
The concentration of SPF2 Hippocampus is:
𝐶𝑜𝑛𝑐𝑒𝑛𝑡𝑟𝑎𝑡𝑖𝑜𝑛 𝑜𝑓 𝑠𝑎𝑚𝑝𝑙𝑒 = 𝑥 =(𝑦 − 0.3045)
0.2272= 6.0563 µ𝑔/µ𝑙
The amount of protein to be loaded onto the gel is:
𝑆𝑎𝑚𝑝𝑙𝑒 𝑣𝑜𝑙𝑢𝑚𝑒 = 50
6.0563= 8.2558 µ𝑙
The final volume to be loaded onto the gel is 20 µl, 8.26 µl sample, 6.74 µl and 5 µl of 4X dye.
SDS-PAGE
An SDS-page gel was prepared with 7 % acrylamide according to the recipe under
Supplementary material. Onto the gel 50 µg of sample was loaded, calculated from the Bradford
assay. The samples were first heated at 100 ˚ C for 5 minutes. The gel was run in running buffer
(recipe in appendices) at 120 V for 1.5 h in RT.
TRANSFER TO MEMBRANE
To transfer the protein from the gel to the membrane a PVDF membrane, 1 µm pore size, was
used. The PVDF membrane was soaked in methanol for 15 minutes, and then equilibrated in
transfer buffer together with sponges and filters. The transfer occurred for 2 h at 100 V in
transfer buffer. After the transfer, the membrane was carefully taken out and incubated ON at
4 ˚C with blocking buffer; 5 % BSA in TBS-T.

20
INCUBATION WITH PRIMARY ANTIBODY
After blocking the membrane, the membrane was incubated with primary antibody diluted to
1:3000 in blocking buffer for 3 hours at RT. To allow different types of proteins to be detected
the membrane was cut between ladder marker 140-100 kDa, 70-50 kDa to obtain three parts of
the membrane. Top part of the membrane, with proteins ranging from 140 kDa up to 300 kDa
was incubated with anti-LRRK2 rabbit antibody. The middle part of the membrane, with
proteins ranging from 50 kDa up to 140 kDa was incubated with anti-NOD2 rabbit antibody.
The lower part, with protein ranging from 30 kDa up to 50 kDa was incubated with an antibody
targeting a housekeeping gene/protein of interest, either Beta-actin (43 kDa), Beta-tubulin (55
kDa) or GAPDH (37 kDa) produced in rabbit.
INCUBATION WITH SECONDARY ANTIBODY
After incubation with primary antibody, the membrane wash washed for 5 min, 3 times in TBS-
T on a shaking table set to 50 rpm. Secondary antibody, polyclonal Goat Anti-rabbit/anti-mouse
immunoglobulin/HRP was then diluted to 1:5000 in blocking buffer, 1 h RT.
DEVELOPMENT OF MEMBRANE
After incubation with secondary antibody, the membrane was washed for 5 min x 3 times in
TBS-T on a shaking table set to 50 rpm. After washing, the membrane was developed using
Western Blot Luminol reagent A + B. The membrane was incubated 1 min before exposure.
CALCULATION OF AMOUNT OF PROTEIN ON MEMBRANE
To calculate the relative protein value on the membrane, the program ImageJ Fiji, was used.
The background and the band were measured for housekeeping protein and for the protein of
interest. Abstract the background from 255 and abstract the protein band from 255. These values
were then called the inverted background respectively the inverted protein. Inverted background
was then abstracted from the inverted protein and the value obtained is the net protein. The net
housekeeping protein was calculated with the same method. The values plotted in the graphs
under Results are the divided net protein over the net housekeeping and an example of
calculation are shown below. Values for all samples are shown under Supplementary material.
The values where plotted in Prism 7 software and the statistic test used are a unpaired, two-
tailed t-test.
The intensity value obtained from the membrane was converted into net protein according to
the following calculations. Example is the value from GF1 striatum.

21
Housekeeping gene GAPDH, value of GF 1: 70.66
255 − 70.66 = 184.34
Background value: 109.81
255 − 109.18 = 145.82
Net housekeeping protein:
184.34 − 145.82 = 38.52
After obtaining the net housekeeping value, the same calculations were followed through for
the protein of interest, here shows for LRRK2:
LRRK2 value of GF 1: 86.75
255 − 86.75 = 168.25
Background value: 111.76
255 − 111.76 = 143.24
Net LRRK2 protein:
168.25 − 143.24 = 25.01
The net LRRK2 is divided by net housekeeping and the relative protein value is obtained:
25.01
38.52= 0.649
The NOD2 values was obtained using the same method.

22
RESULTS
This project was a two-part study on the LRRK2 protein, therefore the results are shown in two
parts. The first part is the comparison between WT mice in SPF and GF conditions. The second
part is the comparison of KI hLRRK2 and KI G2019S mice in SPF conditions.
WT MICE IN SPF AND GF
The following results are from the first part of the project using WT C57BL/J6 mice in SPF and
in GF conditions.
WEIGHT
The weight was measured before euthanization and is shown below in Figure 4 below. There is
no significant difference, “ns”, in weight between the WT mice in SPF compared to GF, only a
trend of a higher weight of the SPF mice compared to the GF mice. The statistic test used are
an unpaired, two-tailed t-test and the data for the plots is found under Supplementary material.
Figure 4. Weight of male WT mice in SPF and GF conditions. Showing a trend of a higher weight for SPF mice compared to GF.
IMMUNE-HISTOCHEMISTRY OF WT LRRK2 MICE IN SPF AND GF CONDITIONS
HIPPOCAMPUS IN WT LRRK2 MICE IN SPF CONDITIONS
Below are the pictures taken of hippocampus in WT mice in SPF conditions. The first picture
shows the LRRK2 staining in green, the second middle picture shows NOD2 stained in red and
the last picture is a merge of the LRRK2, NOD2 and nucleus staining in blue.
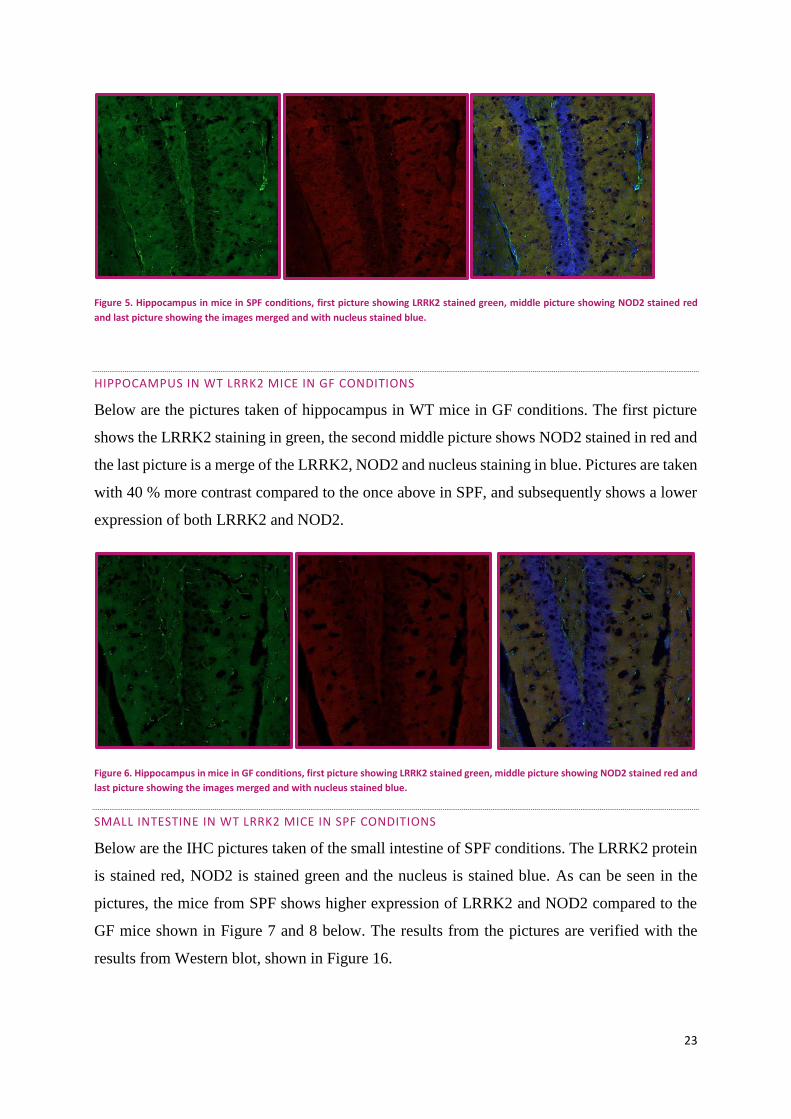
23
Figure 5. Hippocampus in mice in SPF conditions, first picture showing LRRK2 stained green, middle picture showing NOD2 stained red
and last picture showing the images merged and with nucleus stained blue.
HIPPOCAMPUS IN WT LRRK2 MICE IN GF CONDITIONS
Below are the pictures taken of hippocampus in WT mice in GF conditions. The first picture
shows the LRRK2 staining in green, the second middle picture shows NOD2 stained in red and
the last picture is a merge of the LRRK2, NOD2 and nucleus staining in blue. Pictures are taken
with 40 % more contrast compared to the once above in SPF, and subsequently shows a lower
expression of both LRRK2 and NOD2.
Figure 6. Hippocampus in mice in GF conditions, first picture showing LRRK2 stained green, middle picture showing NOD2 stained red and
last picture showing the images merged and with nucleus stained blue.
SMALL INTESTINE IN WT LRRK2 MICE IN SPF CONDITIONS
Below are the IHC pictures taken of the small intestine of SPF conditions. The LRRK2 protein
is stained red, NOD2 is stained green and the nucleus is stained blue. As can be seen in the
pictures, the mice from SPF shows higher expression of LRRK2 and NOD2 compared to the
GF mice shown in Figure 7 and 8 below. The results from the pictures are verified with the
results from Western blot, shown in Figure 16.

24
Figure 7. Small intestine in mice in SPF condition. LRRK2 is stainedred, NOD2 is stained green and nucleus is stained blue.
SMALL INTESTINE IN WT LRRK2 MICE IN GF CONDITIONS
Below are the IHC pictures, showing a significantly lower expression of both LRRK2 and NOD2 in GF
mice compared to SPF mice, seen in Figure 8 and 7 above.
Figure 8. Small intestine in mice in GF condition. LRRK2 is stained red, NOD2 is stained green and nucleus is stained blue.
LARGE INTESTINE IN WT LRRK2 MICE IN SPF CONDITIONS
Below is a picture of large intestine in WT mice in SPF conditions. The LRRK2 is stained
green, NOD2 is stained red and nucleus is stained blue.

25
Figure 9. Large intestine in WT mice in SPF conditions. LRRK2 is stained red, NOD2 is stained green and nucleus is stained blue.
LARGE INTESTINE IN WT LRRK2 MICE IN GF CONDITIONS
Below is a picture of large intestine in WT mice in GF conditions. The LRRK2 is stained green,
NOD2 is stained red and nucleus is stained blue.
Figure 10. Large intestine in WT mice in GF conditions. LRRK2 is stained red, NOD2 is stained green and nucleus is stained blue.
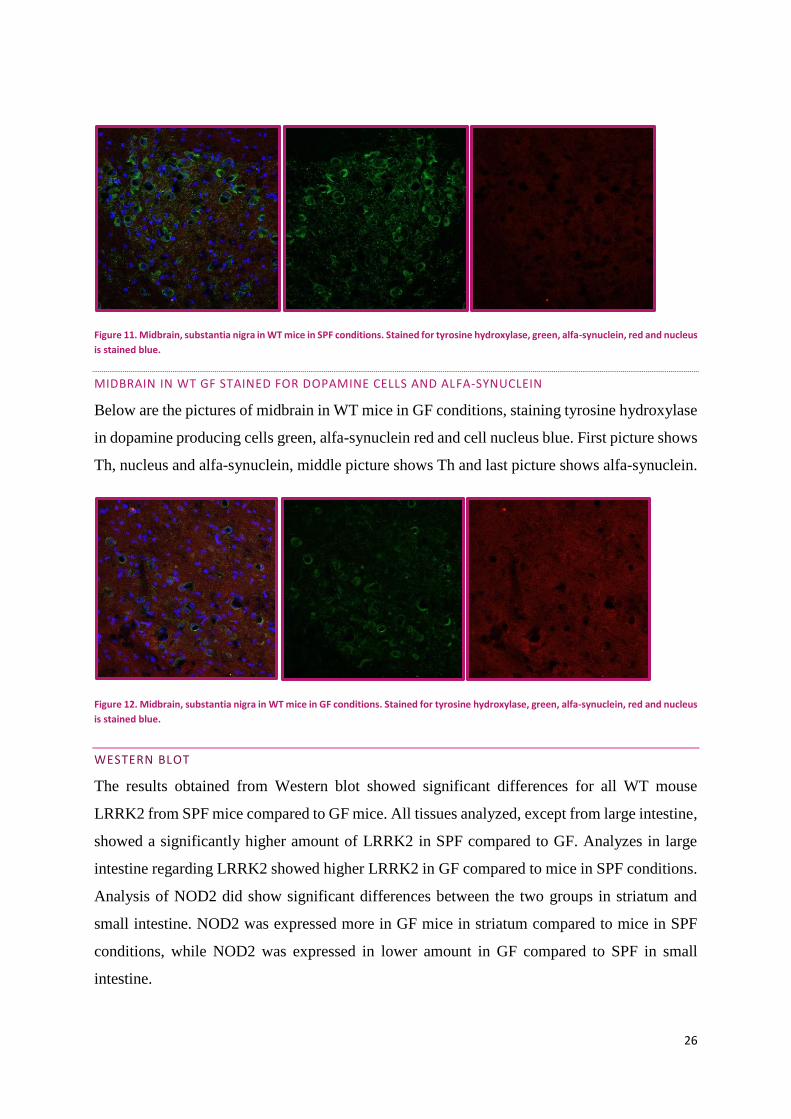
MIDBRAIN IN WT SPF STAINED FOR DOPAMINE CELLS AND ALFA-SYNUCLEIN
Below are the pictures of midbrain in WT mice in SPF conditions, staining tyrosine hydroxylase
in dopamine producing cells green, alfa-synuclein red and cell nucleus blue. First picture shows
Th, nucleus and alfa-synuclein, middle picture shows Th and last picture shows alfa-synuclein.
26
Figure 11. Midbrain, substantia nigra in WT mice in SPF conditions. Stained for tyrosine hydroxylase, green, alfa-synuclein, red and nucleus
is stained blue.
MIDBRAIN IN WT GF STAINED FOR DOPAMINE CELLS AND ALFA-SYNUCLEIN
Below are the pictures of midbrain in WT mice in GF conditions, staining tyrosine hydroxylase
in dopamine producing cells green, alfa-synuclein red and cell nucleus blue. First picture shows
Th, nucleus and alfa-synuclein, middle picture shows Th and last picture shows alfa-synuclein.
Figure 12. Midbrain, substantia nigra in WT mice in GF conditions. Stained for tyrosine hydroxylase, green, alfa-synuclein, red and nucleus
is stained blue.
WESTERN BLOT
The results obtained from Western blot showed significant differences for all WT mouse
LRRK2 from SPF mice compared to GF mice. All tissues analyzed, except from large intestine,
showed a significantly higher amount of LRRK2 in SPF compared to GF. Analyzes in large
intestine regarding LRRK2 showed higher LRRK2 in GF compared to mice in SPF conditions.
Analysis of NOD2 did show significant differences between the two groups in striatum and
small intestine. NOD2 was expressed more in GF mice in striatum compared to mice in SPF
conditions, while NOD2 was expressed in lower amount in GF compared to SPF in small
intestine.

27
Below are the plots for each tissue showing the relative protein values for LRRK2 and NOD2
from two groups consisting of three mice each; three GF and three SPF. The statistic test used
is unpaired, two-tailed t-test. The relative protein level is shown on the y-axis and the two
different groups are shown on the x-axis. One asterisk marks a P-value equal to or less than
0.05. Two asterisks mark a P-value equal to or less than 0.01. Three asterisks mark a P-value
equal to or less than 0.001. The notation “ns” in the graphs marks a P-value over 0.05, and
therefore only marks a trend and no significant difference.
Figure 13. Relative protein value of LRRK2 and NOD2 in striatum in WT mice in SPF conditions compared to GF conditions. One asterisk
shows a P-value ≤ 0.05.
Figure 14. Relative protein value of LRRK2 and NOD2 in hippocampus in WT mice in SPF conditions compared to GF conditions. One asterisk
shows a P-value ≤ 0.05. Notation “ns” shows a P-value > 0.05 and no significant difference.

28
Figure 15. Relative protein value of LRRK2 and NOD2 in midbrain in WT mice in SPF conditions compared to GF conditions. One asterisk
shows a P-value ≤ 0.05. Notation “ns” shows a P-value > 0.05 and no significant difference.
Figure 16. Relative protein value of LRRK2 and NOD2 in small intestine in WT mice in SPF conditions compared to GF conditions. Two
asterisks show a P-value ≤ 0.01. Three asterisks show a P-value ≤ 0.001.
Figure 17. Relative protein value of LRRK2 and NOD2 in large intestine in WT mice in SPF conditions compared to GF conditions. One
asterisk shows a P-value ≤ 0.05. Notation “ns” shows a P-value > 0.05 and no significant difference.

29
KI HLRRK2 AND KI G2019S IN SPF
The following results are from the second part of the project using C57BL/J6 mice with KI
hLRRK2 and KI G2019S in SPF conditions.
WEIGHT
The weight was measured before euthanization and are shown below in Figure 18. The Figure
shows two groups of KI hLRRK2, female and male, and two groups of G2019S, female and
male. There is a significant difference between the two groups of males, showing a higher
weight for the G2019S mice compared to the hLRRK2 mice. The weight of females shows no
significant difference, only a trend of a higher weight of the G2019S female. The statistic test
used is a two-tailed t-test and the data for the plots is found under Supplementary material.
Figure 18. Weight of male and female hLRRK2 and G2019S, showing a significant higher weight for G2019S male compared to hLRRK2
male, and a trend of higher weigh for G2019S female compared to hLRRK2 female.
IMMUNE-HISTOCHEMISTRY OF HLRRK2 AND G2019S IN SPF CONDITION
MIDBRAIN IN HLRRK2 STAINED FOR TH IN DOPAMINE CELLS AND ALFA-SYNUCLEIN
Below are the pictures of midbrain in hLRRK2 mice in SPF conditions, staining tyrosine
hydroxylase in dopamine producing cells green, alfa-synuclein red and cell nucleus blue. First
picture shows Th, nucleus and alfa-synuclein, middle picture shows Th and last picture shows
alfa-synuclein in 40 % more contrast than the other pictures.

30
Figure 19. Midbrain, substantia nigra in hLRRK2 mice in SPF conditions. Stained for tyrosine hydroxylase, green, alfa-synuclein, red and
nucleus is stained blue.
MIDBRAIN IN G2019S STAINED FOR TH IN DOPAMINE CELLS AND ALFA-SYNUCLEIN
Below are the pictures of midbrain in G2019S mice in SPF conditions, staining tyrosine
hydroxylase in dopamine producing cells green, alfa-synuclein red and cell nucleus blue. First
picture shows Th, nucleus and alfa-synuclein, middle picture shows Th and last picture shows
alfa-synuclein in 40% more contrast than the other images.
Figure 20. Midbrain, substantia nigra in G2019S mice in SPF conditions. Stained for tyrosine hydroxylase, green, alfa-synuclein, red and
nucleus is stained blue.
The results of Th and alfa-synuclein staining shows a similar expression of both Th and alfa-
synuclein in hLRRK2 and G2019S.
WESTERN BLOT
The results obtained from Western blot showed significant differences regarding LRRK2
expression in striatum, midbrain and large intestine from KI hLRRK2 mice compared to KI
G2019S mice. The expression of LRRK2 in striatum and large intestine are significantly higher
in hLRRK2 compared to G2019S, but lower in midbrain. Analysis of NOD2 did not show
significant differences between hLRRK2 and G2019S in any of the tissues analyzed.
31
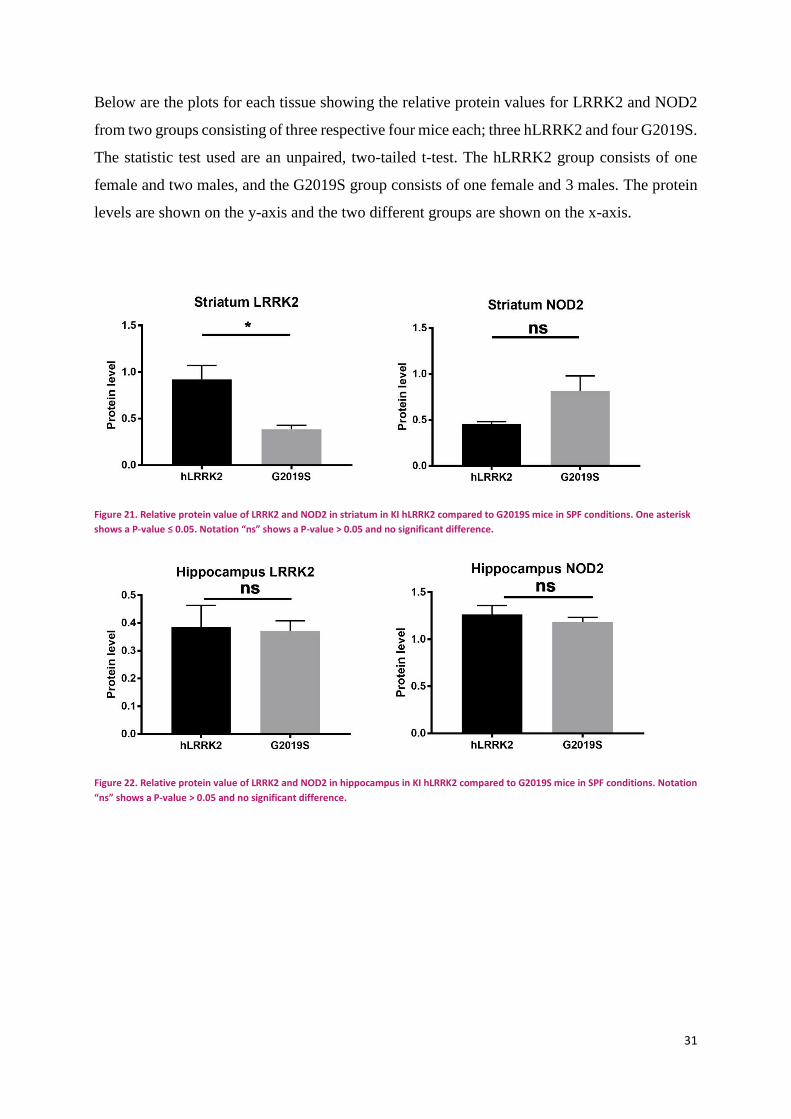
Below are the plots for each tissue showing the relative protein values for LRRK2 and NOD2
from two groups consisting of three respective four mice each; three hLRRK2 and four G2019S.
The statistic test used are an unpaired, two-tailed t-test. The hLRRK2 group consists of one
female and two males, and the G2019S group consists of one female and 3 males. The protein
levels are shown on the y-axis and the two different groups are shown on the x-axis.
Figure 21. Relative protein value of LRRK2 and NOD2 in striatum in KI hLRRK2 compared to G2019S mice in SPF conditions. One asterisk
shows a P-value ≤ 0.05. Notation “ns” shows a P-value > 0.05 and no significant difference.
Figure 22. Relative protein value of LRRK2 and NOD2 in hippocampus in KI hLRRK2 compared to G2019S mice in SPF conditions. Notation
“ns” shows a P-value > 0.05 and no significant difference.

32
Figure 23. Relative protein value of LRRK2 and NOD2 in midbrain in KI hLRRK2 compared to G2019S mice in SPF conditions. One asterisk
shows a P-value ≤ 0.05. Notation “ns” shows a P-value > 0.05 and no significant difference.
Figure 24. Relative protein value of LRRK2 and NOD2 in small intestine in KI hLRRK2 compared to G2019S mice in SPF conditions.
Notation “ns” shows a P-value > 0.05 and no significant difference.
Figure 25. Relative protein value of LRRK2 and NOD2 in large intestine in KI hLRRK2 compared to G2019S mice in SPF conditions. One
asterisk shows a P-value ≤ 0.05. Notation “ns” shows a P-value > 0.05 and no significant difference.

33
DISCUSSION
This chapter presents a summary and interpretation of the most important results and provides
a brief discussion on how the experimental setup could have been improved.
The aim was to set up a new project at LKC school of medicine in Singapore to examine out
the gut microbe regulation of the Parkinson associated gene LRRK2. Initially, the aim was to
investigate the regulation of the most common mutation/SNP associated with PD, the G2019S
of LRRK2, when PD patient gut microbiome is transplanted into mice. When it came clear that
20 weeks was not enough time for the transplantation to be approved by Singapore Ethics
Committee, the project took a new direction. The new direction was to investigate the difference
between WT LRRK2 expression in mice derived in GF conditions compared to SPF conditions
and then compare the results with KI hLRRK and KI G2019S in mice in SPF and GF. When it
later came clear that deriving the mice into GF conditions would take a minimum of six months,
the project once again took a new path. The final setup was therefore to firstly investigate
LRRK2 in C57BL/6J mice in GF and SPF, secondly investigate KI hLRRK2 and KI G2019S
in SPF, but not in GF conditions. Consequently, the project was delayed by approximately eight
weeks.
After starting the Western blot, several obstacles were encountered. The first of them being
problems with the LRRK2 antibody, from rabbit source. The bands on the membrane were
blurry and unspecific. To try to identify the source behind this issue, the secondary antibody
Polyclonal Goat Anti-rabbit Immunoglobin/HRP was changed. Since the problem remained, a
primary antibody from mouse was used. This solved the problem, and in all succeeding Western
blot’s the monoclonal purified, LRRK2, MC.028.83, SIG-39840 mouse antibody was used.
The next obstacle with Western blot was to find a control protein, a so-called housekeeping
protein, a protein expressed equally in all cell types. For this, GAPDH (37 kDa), Beta-actin (43
kDa) and Beta-tubulin (55 kDa) were tested. The Beta-tubulin was in theory the best one since
the protein of interest, LRRK2, is above 200 kDa and the separation time during SDS-page is
longer for bigger proteins. Beta-tubulin was used, but the bands showing on the membrane were
faint and blurry. Therefore Beta-actin, in theory the second best one and GAPDH was used
instead, showing clearer bands. GADPH showed the best results, but due to its size, it separates
fast trough the gel of 7 %, and was often lost after two hours of running time.
34
The slicing technique used in IHC showed good results regarding brain tissue. Using the same
technique for intestines proved to be harder due to the small area of tissue sticking to the glass-
slide. Washing in PBS had to be done by pipetting, gently adding and removing PBS to not
detach tissue. The technique of attaching tissue in OCT compound was standard at Sven
Pettersson’s lab for brain tissue, but intestines was usually sent to a company doing the
attachment. Due to time limit, that was not an option for this project.
The mouse model, C57BL/J6, is the most widely used inbred strain for laboratory use. The
inbred started 1921 and is provided by The Jackson Laboratory. The mouse is susceptive to a
lot of diseases, syndromes and conditions, including diabetes, obesity and hydrocephalus. The
susceptibility for many conditions could affect the outcome of the results. Using a GF mice is
a common method for different types of analysis, where bacteria can disturb the outcome of the
result. However GF in nature does not exist, since all living organism live in symbiosis with
other organism; mutualistic, commensalistic, or parasitic. The GF model is therefore a
hypothetical model taken to its extreme.
Due to time limit, the mice were harvested 17 ± 1 weeks, which according to The Jackson
Laboratory is a young adult. A mouse over 6 months is an adult, and a mouse over 18 months
is considered old. In theory, an older mouse would have been preferred to be used in this project
since Parkinson’s disease usually expresses in late adult or older individuals.
The WT LRRK2 mice groups consisted of three males each, which limits the differences in
results that can occur due to the female menstrual cycle. In the KI homozygous hLRRK2 group,
three males and two females were thought to be used in the experiment, but due to aggressive
behavior between the males, one got killed and another one got badly injured. The injured
mouse could still be used in the experiments, but this reduced the number of male mice to only
two. Used in the hLRRK2 group was therefore two males and one female. To equalize the two
groups; hLRRK2 and G2019S, the G2019S group was reduced to three males and one female.
This is one of the bigger sources of error.
The hypothesis presented in the introduction, and in Figure 26 below, states that the gut
microbiome influences the expression of PD. The proposed pathway is that NOD2 interacts
with peptidoglycans on bacteria and transmits the signal to LRRK2. LRRK2 in turn interacts
with Parkin. Parkin, the enzyme tagging proteins for degradation, tags alfa-synuclein but alfa-
synuclein is not degraded. According to the hypothesis the source of error would be the bacteria;
either the lack of protective bacteria or the presence of harmful bacteria, leading to a

35
downstream error in the PD pathway and accumulation of alfa-synuclein. The project design is
too weak to give results to either verify or reject the hypothesis. The results from the first part
of the project can only give a hint if the expression level of the most common gene mutated in
PD increases or decreases in presence of gut microbiome. The second part of the project can
only give results about the expression level of hLRRK2 compared to the expression level of the
same protein but carrying the most common mutation associated with PD, G2019S, which does
not bring clarity to the hypothesis.
However, the staining of tyrosine hydroxylase (Th) in dopamine producing cells and alfa-
synuclein shows a higher expression of Th in the WT mice in SPF condition compared to the
WT mice in GF condition. Th is the enzyme converting tyrosine to L-DOPA, the precursor to
dopamine. This could suggest a loss of dopaminergic neurons in substantia nigra, midbrain, in
GF mice, proposing that the bacteria are stimulating neurogenesis of dopaminergic neurons or
producing neuroprotective compounds.
Figure 26. A scheme over the hypothetical pathway from bacteria, via NOD2 activation and subsequent interaction with LRRK2. LRRK2
interact with Parkin. Parkin ubiquitinylates alfa-synuclein in an abnormal way and subsequently leads to aggregation of alfa-synuclein
and formation of Lewy bodies. Harmful or lack of protective bacteria together with mutation in LRRK2 would give the pathological Lewy
bodies seen in PD.
The results from the first part of the project shows that LRRK2 expression levels are higher in
SPF conditions compared to GF conditions, in all tissues except from large intestine. This may
indicate that the bacteria and perhaps the peptidoglycans on their surface activates NOD2,
which induce expression of LRRK2.

36
A colonized mouse can be considered a normal subject, and results are therefore considered as
non-pathological. The relative protein value in brain tissue range from 1.75, in midbrain and
striatum, up to 2.5 in hippocampus. The small intestine shows a LRRK2 value of 1.1 and large
intestine 0.35. The high expression in hippocampus can be due to the immune system regulating
adult neurogenesis, as mentioned in the introduction, while the small intestine can be
contaminated, and therefore expresses a moderate immune response. The NOD2 expression is
remarkably low for both WT mice in SPF and GF conditions in the large intestine with a value
of 0.035, implicating that NOD2 expression in large intestine is not dependent on bacteria. An
increased expression of NOD2 is not necessarily required for an increase expression level of
LRRK2.
One significant result is the higher level of LRRK2 in the large intestine in WT mice in GF
compared SPF conditions, while all other tissues analyzed showed the opposite. The colon,
large intestine, is the part of the intestine containing the highest proportion of bacteria in a
colonized subject.
The colonized mice’s colon is in theory the most exposed tissue to bacteria. Proinflammatory
signaling molecules, as IFN-ƴ, increases the expression of LRRK2 in especially macrophages,
T-cells and B-cells but also in other cell types. This means that in the large intestine, where
bacteria are present, there is no significant proinflammatory signaling at point of analysis in a
colonized mouse. The results are most likely due to a long exposure of symbiotic bacteria
stimulating the immune system development and mucosal immunity via NOD2, IFN-ƴ, LRRK2
and NF-κβ. The immunity development leads to less inflammatory activity in the large intestine,
but more immunological active than other tissues. Since the gut microbiome is known to be
involved in the development of a subject’s immunity, the findings are considered as a normal
distribution of LRRK2.
In the contrary, in the WT mice in GF conditions, the LRRK2 expression is low in all tissues,
ranging from 0.5 in the hippocampus to 0.75 in all other tissues examined. Hippocampus in the
WT mice in GF conditions shows much lower expression of LRRK2, compared to WT mice in
SPF condition, and could indicate that adult neurogenesis is impaired. The large intestine shows
a relative protein value of 0.6, compared to 0.35 in WT mice in SPF condition. Possibly, this
result indicates an ongoing inflammation cascade. As mentioned in the introduction, the germ-
free mice have an underdeveloped adaptive immune system; GALT, Peyer’s patches and lymph
follicles. The adaptive immune system develops during encounter of pathogens and non-

37
pathogens, it matures and becomes tolerant to ordinary exposed antigens. Without antigens,
such as the gut microbiome, the development stalls and later exposure can provoke severe
inflammation as a response from the innate immune system. As can be seen in the GF mice
group, the large intestine is lacking normal colonization, and the immune system is running
amok since everything encountered is considered a pathogen because of the deregulated
immunity. The LRRK2 is therefore expressed to a much higher extent compared to the SPF,
but lower in other parts of the subject.
In a germ-free mouse, the cecum and appendix are enlarged and filled with feces, shown in
Figure 27 below. The appendix plays an important role in the immune system, containing
numerous inflammatory cells. Why the cecum and appendix are enlarged is unknown, but it
could be due to the decreased intestinal motility and defective development of immune cells in
the appendix.
Figure 27. Intestine of WT mice in GF condition, showing a enlarged cecum and appendix.
From the second part of the project, analyzing the expression level of LRRK2 and NOD2 in
colonized hLRRK2 and G2019S mice, results are showing higher expression of LRRK2 in
striatum and large intestine in hLRRK2 compared to G2019S mice. In the midbrain the level of
LRRK2 is higher in G2019S than in hLRRK2 mice. No significant differences in expression
level of NOD2 can be detected between the hLRRK2 group and the G2019S group. If it is due
to insufficient NOD2 antibodies or that the expression level is not significantly higher or lower
in one tissue compared to another, is hard to distinguish. NOD2 is a pattern recognition receptor
binding to peptidoglycans on bacterial surface, and an increased expression is not necessarily
required for an increase expression level of LRRK2.
The hLRRK2 was analyzed to compare the healthy variant LRRK2 to the disease-associated
G2019S, to understand where it is normally expressed and in what amounts, and results of
hLRRK2 are used as a reference to G2019S. According to the hypothesis presented, the

38
hypothesis stated above and in Figure 26, the mutated G2019S variant of the gene would lead
to a hyperactive LRRK2 and in combination with a harmful microbiota or the lack of a
protective one, the downstream errors would lead to accumulation of alfa-synuclein. The mice
group tested with the G2019S variant was in a SPF environment, which would in theory lead
to similar results as hLRRK2, due to gut microbiota suppressing the expression of PD.
The outcome for hLRRK2 was expected to be similar to WT SPF mice, but the results show a
much lower level of hLRRK2 compared to the SPF group in all tissue, except from intestines.
It could be due to transgenic errors occurring during inserting of the gene into the mice genome.
The values are ranging from 0.4 in the hippocampus of the brain to 0.75-0.8 for midbrain and
striatum. The low expression in hippocampus could, as mentioned before, be the lack of adult
neurogenesis signaling from immune cells. Perhaps is the human LRRK2 not compatible with
other signaling molecules. The intestines for hLRRK2 mice show protein values of 1.25 in both
large and small intestine, much higher than the WT mice in SPF condition. This could indicate
an ongoing inflammatory response, or some sort of feed-back loop for LRRK2 that is not
working correctly in the mice due to the human LRRK2.
The G2019S variant of LRRK2 is a gain of function mutation, meaning that the kinase, the
GTPase and leucine-rich region are more active, activating downstream proteins in a higher
rate. The activity of the function of hLRRK2 and G2019S was not measured in this project, and
the downstream molecules, as parkin, activated by LRRK2, was not analyzed either. Since
G2019S is a gain of function mutation the expression level of G2019S was not thought to be
increased compared to hLRRK2, but it may be increased in certain tissues linking the disease-
associated variant to the area of disease.
The expression of LRRK2 in the G2019S mice are ranging from 0.4 in striatum and
hippocampus, to 1.5 in the midbrain. The expression in small intestine shows similar result as
hLRRK2 mice, with a mean value of 1.35. In the large intestine the protein value is 0.8,
significantly lower compared to the hLRRK2 mice. Significant difference between the two
groups are the lower expression of LRRK2 in G2019S mice in striatum and large intestine, and
the higher expressed in midbrain. Midbrain is the part of the brain where substantia nigra is
located. Not to jump to any conclusions, but since PD is characterized by loss of dopaminergic
neurons in substantia nigra, it could be that G2019S has a certain expression preference in
substantia nigra and activation of proteins there leading to downstream effects.

39
The possible connection between G2019S and the gut microbiome is still unclear. The results
from IHC shows a similar expression of alfa-synuclein and Th in both hLRRK2 and G2019S
in SPF condition. This could suggest that the gut microbiome is suppressing the expression of
PD by suppressing G2019S, or that the mice is still too young to have expressed alfa-synuclein
in a pathological amount. Analyses of parkin and alfa-synuclein with Western blot was included
in the setup of the project from start, but was later removed, due to time limit. No conclusions
can be drawn without analyses of hLRRK2 and G2019S mice in GF conditions, and without
analyses of parkin and alfa-synuclein in both SPF and GF conditions.
Pictures from IHC from this part of the study is not included in the results due to time limit but
will hopefully be placed in Supplementary material later.
FUTURE PERSPECTIVES
The results presented in this report illustrate some differential expression of LRRK2 expression
in germ-free mice compared to mice exposed to living microbes. This suggests that there is a
connection between the expression level of the tyrosine kinase, LRKK2 and the gut microbiota.
Further studies include additional IHC staining and Western blot analysis of NOD2 to better
define expression level and distribution. In the pipeline is also to derive a cohort of transgenic
LRKK2 mice into GF conditions. Which is a necessity to understand the LRRK2 expression
especially in the G2019S and to analyze the expression of alfa-synuclein. The observation of a
significant difference between hLRRK2 and G2019S suggests a connection between the gut
microbiome and LRKK2/G2019S. Future studies ongoing in the lab, include human feces
transplantation from PD patients into mice to further investigate the role of the microbiome and
onset progression of PD.
Perhaps the most interesting result presented here is the lower expression level of LRKK2 in
colon from GF-mice. Since LRRK2 is a major susceptibility gene for Crohn’s disease, this
imply an even stronger suggested connection between LRRK2, PD, and inflammation in the
colon. This support the working model of an existing gut-brain axis in development of PD,
involving inflammation in the intestines.
Furthermore, analyses using IHC and Western blot of parkin and alfa-synuclein in both GF and
SPF conditions are required in the second part of the project. Without this, it is difficult to draw
any conclusions about the level of PD development. Though the results from the second part of
the project showed that expression of LRRK2 in striatum and large intestine are significantly

40
higher in hLRRK2 compared to G2019S, but lower in midbrain, it is hard to draw any
conclusions. Substantia nigra in the midbrain synapses in striatum, boosting the signal to initiate
a movement. The mutated form G2019S is higher in in midbrain, where substantia nigra is, but
lower in striatum and large intestine.
The future studies of human feces transplantation from PD patients to investigate the role of the
microbiome and onset progression of PD, evokes an idea of investigating the molecules that
can be linked to inflammation in the intestines such as butyrate or other SCFA, tryptophan,
indoles and the aryl hydrocarbon receptor.
The gut microbiome produces molecules both harmful and helpful for the intestinal mucosa,
e.g. the importance of butyrate, which is described in the introduction of this project. In addition
to butyrate as an inhibitor of inflammation in the intestines, is tryptophan, an essential amino
acid, provided in the diet. Tryptophan has shown to take different pathways depending on the
type of gut microbiome metabolizing it. Lactobacilli spp produces the metabolite Indole-3-
aldehyde, I3A, which maintains the reactivity of the mucosa. Clostridium sporogenes
metabolizes tryptophan into indole-3-propionate, IPA, which shows to have neuroprotective
function on the brain. While tryptophanase-expressing bacteria produces indole which can
either activate AhR but also be metabolized in the liver into indoxyl sulfate, associated with
vascular disease and oxidative stress [25]
The loss of dopaminergic neurons in substantia nigra could be due to a neurotoxic compound
in the brain. In the brain, 90 % of the tryptophan is metabolized in the kynurenine pathway,
where metabolites such as quinolinic acid and 3-hydroxy kynurenine, are neurotoxic. Variations
in the kynurenine pathway have been verified to be linked with PD and intervention in the
kynurenine pathway results in neuroprotection and protection against L-dopa induced
dyskinesia [26]. Preventing PD by interfering in kynurenine pathway is hypothesized as either
using kynurenic acid analogues, or by inhibiting specific enzymes in the pathway. Such an
enzyme is the TDO-2, which is involved in the first and rate limiting step of the kynurenine
pathway. Inhibitors of this enzyme have shown great potential. Not only may TDO-2 inhibitors
be useful in the treatment of cancer, but also neurological and brain disorders, such as PD [27].
The Aryl hydrocarbon receptor, AhR, is an important receptor for maintaining an adequate
immune response, especially in the development of regulatory T-cells. Activation of AhR
maintains the epithelial barrier and promoting immune tolerance to promote microbial
commensalism while protecting against pathogenic infections. It has been shown to be involved
41
in several pathways. For example, the kynurenine pathway, but also known to regulate
xenobiotic metabolism, metabolites not naturally occurring in the organism of interest, such as
metabolites produced by bacteria in the intestines [28]. Ligands, such as indole-3-aldehyde
binds to AhR and increases interleukin-22 production, a cytokine important in immune response
[29].
While all above mentioned pathways and molecules are of interest in future research in gut-
brain axis developed PD, this project alone gives the opportunity to better understand the role
our indigenous microbiome may play in onset/progression of PD.
42
ACKNOWLEDGEMENTS
I gratefully acknowledge the support and generosity of Professor Sven Pettersson and his
research group at Lee Kong Chian School of Medicine: Nanyang Technological University –
Imperial College London, Singapore. Without which the research project could not have been
accomplished. I gratefully acknowledge Dr George Zhang for all the help and I thank him for
bringing clarity in troublesome moments, giving support and knowledge. I thank PhD Katie
Martin, Dr Maisha Reza and Dr Ruchi Agrawal for making my work possible, for support and
help. I thank Dr Leon Ung for being my mentor in immune-histochemistry. I also want to thank
National Neuroscience Institute for producing knock-in mice, breeding and delivery of the
hLRRK2 and G2019S mice to LKC. The animal facility team at NTU for handling all mice. I
thank my examiner Dr Peter Savolainen for support, advice and encouraging spirit. Last but not
least I want to thank my external supervisor Dr Anders Andersson for accepting me as a student,
giving support and guidance through the work.

43
REFERENCES
[1] Kumar, V., Abbas, A. K., & Aster, J. C. (2017). Robbins Basic Pathology. Chapter 22.
Elsevier Health Sciences.
[2] Lei, P., Ayton, S., Finkelstein, D. I., Adlard, P. A., Masters, C. L., & Bush, A. I. (2010).
Tau protein: relevance to Parkinson's disease. The international journal of biochemistry & cell
biology, 42(11), 1775-1778.
[3] Smith, W. W., Pei, Z., Jiang, H., Moore, D. J., Liang, Y., West, A. B., ... & Ross, C. A.
(2005). Leucine-rich repeat kinase 2 (LRRK2) interacts with parkin, and mutant LRRK2
induces neuronal degeneration. Proceedings of the National Academy of Sciences of the United
States of America, 102(51), 18676-18681.
[4] Smith, W. W., Pei, Z., Jiang, H., Moore, D. J., Liang, Y., West, A. B., ... & Ross, C. A.
(2005). Leucine-rich repeat kinase 2 (LRRK2) interacts with parkin, and mutant LRRK2
induces neuronal degeneration. Proceedings of the National Academy of Sciences, 102(51),
18676-18681.
[5] Luzón-Toro, B., de la Torre, E. R., Delgado, A., Pérez-Tur, J., & Hilfiker, S. (2007).
Mechanistic insight into the dominant mode of the Parkinson's disease-associated G2019S
LRRK2 mutation. Human molecular genetics, 16(17), 2031-2039.
[6] Bae, E. J., Kim, D. K., Kim, C., Mante, M., Adame, A., Rockenstein, E., ... & Lee, C. (2018).
LRRK2 kinase regulates α-synuclein propagation via RAB35 phosphorylation. Nature
communications, 9(1), 3465.
[7] Bouhouche, A., Tibar, H., Ben El Haj, R., El Bayad, K., Razine, R., Tazrout, S., ... &
Yahyaoui, M. (2017). LRRK2 G2019S mutation: prevalence and clinical features in Moroccans
with Parkinson’s disease. Parkinson’s Disease, 2017.
[8] Shannon, K. M., Keshavarzian, A., Dodiya, H. B., Jakate, S., & Kordower, J. H. (2012)
[9] Sampson, T. R., Debelius, J. W., Thron, T., Janssen, S., Shastri, G. G., Ilhan, Z. E., ... &
Chesselet, M. F. (2016). Gut microbiota regulate motor deficits and neuroinflammation in a
model of Parkinson’s disease. Cell, 167(6), 1469-1480.

44
[10] Cook, D. A., Kannarkat, G. T., Cintron, A. F., Butkovich, L. M., Fraser, K. B., Chang, J.,
... & Tansey, M. G. (2017). LRRK2 levels in immune cells are increased in Parkinson’s disease.
NPJ Parkinson's disease, 3(1), 11.
[11] Liu, Z., Lee, J., Krummey, S., Lu, W., Cai, H., & Lenardo, M. J. (2011). Leucine-rich
repeat kinase 2 (LRRK2) regulates inflammatory bowel disease through the Nuclear Factor of
Activated T cells (NFAT). Nature immunology, 12(11), 1063
[12] Yan, R., & Liu, Z. (2017). LRRK2 enhances Nod1/2-mediated inflammatory cytokine
production by promoting Rip2 phosphorylation. Protein & cell, 8(1), 55-66.
[13] Zhang, Q., Pan, Y., Yan, R., Zeng, B., Wang, H., Zhang, X., ... & Liu, Z. (2015).
Commensal bacteria direct selective cargo sorting to promote symbiosis. Nature immunology,
16(9), 918.
[14] Hui, K. Y., Fernandez-Hernandez, H., Hu, J., Schaffner, A., Pankratz, N., Hsu, N. Y., ...
& Rivas, M. (2018). Functional variants in the LRRK2 gene confer shared effects on risk for
Crohn’s disease and Parkinson’s disease. Science translational medicine, 10(423), eaai7795.
[15] Liu, Z., Lee, J., Krummey, S., Lu, W., Cai, H., & Lenardo, M. J. (2011). The kinase LRRK2
is a regulator of the transcription factor NFAT that modulates the severity of inflammatory
bowel disease. Nature immunology, 12(11), 1063-1070.
[16] Cushing, K., Alvarado, D. M., & Ciorba, M. A. (2015). Butyrate and mucosal
inflammation: new scientific evidence supports clinical observation. Clinical and translational
gastroenterology, 6(8), e108.
[17] Laurent, R. S., O’Brien, L. M., & Ahmad, S. T. (2013). Sodium butyrate improves
locomotor impairment and early mortality in a rotenone-induced Drosophila model of
Parkinson’s disease. Neuroscience, 246, 382-390.
[18] Leung, C. H., Lam, W., Ma, D. L., Gullen, E. A., & Cheng, Y. C. (2009). Butyrate mediates
nucleotide‐binding and oligomerization domain (NOD) 2‐dependent mucosal immune
responses against peptidoglycan. European journal of immunology, 39(12), 3529-3537
[19] Round, J. L., & Mazmanian, S. K. (2009). The gut microbiome shapes intestinal immune
responses during health and disease. Nature Reviews Immunology, 9(5), 313.]

45
[20] Hall, J. E. (2015). Guyton and Hall textbook of medical physiology e-Book. Chapter 46
Elsevier Health Sciences.
[21] Marin, I., & Kipnis, J. (2013). Learning and memory… and the immune system. Learning
& memory, 20(10), 601-606.
[22] Brück, A., Kurki, T., Kaasinen, V., Vahlberg, T., & Rinne, J. O. (2004). Hippocampal and
prefrontal atrophy in patients with early non-demented Parkinson’s disease is related to
cognitive impairment. Journal of Neurology, Neurosurgery & Psychiatry, 75(10), 1467-1469.
[23] Kafkas, A., & Montaldi, D. (2015). Striatal and midbrain connectivity with the
hippocampus selectively boosts memory for contextual novelty. Hippocampus, 25(11), 1262-
1273.
[24] Bornside, G. H., Welsh, J. S., & Cohn, I. (1966). Bacterial flora of the human small
intestine. JAMA, 196(13), 1125-1127.
[25] Zhang, L. S., & Davies, S. S. (2016). Microbial metabolism of dietary components to
bioactive metabolites: opportunities for new therapeutic interventions. Genome medicine, 8(1),
46.
[26] Szabó, N., Kincses, Z. T., Toldi, J., & Vécsei, L. (2011). Altered tryptophan metabolism
in Parkinson's disease: a possible novel therapeutic approach. Journal of the neurological
sciences, 310(1), 256-260.
[27] Abdel-Magid, A. F. (2016). Targeting the inhibition of tryptophan 2, 3-dioxygenase (TDO-
2) for cancer treatment
[28] Nguyen, N. T., Nakahama, T., Le, D. H., Van Son, L., Chu, H. H., & Kishimoto, T. (2014).
Aryl hydrocarbon receptor and kynurenine: recent advances in autoimmune disease research.
Frontiers in immunology, 5, 551
[29] Zhang, L. S., & Davies, S. S. (2016). Microbial metabolism of dietary components to
bioactive metabolites: opportunities for new therapeutic interventions. Genome medicine, 8(1),
46.
[30] Liu, Z., & Lenardo, M. J. (2012). The role of LRRK2 in inflammatory bowel disease. Cell
research, 22(7), 1092.

46
SUPPLEMENTARY MATERIAL
WEIGHT
SPF group, harvested on 6th of June 2018:
SPF mice 1: 25.73 g (M)
SPF mice 2: 31.62 g (M)
SPF mice 3: 28.14 g (M)
Mean weight (M): 28.50 g
GF group, harvested on 22th of June 2018:
GF mice 1: 24.49 g (M)
GF mice 2: 26.22 g (M)
GF mice 3: 22.25 g (M)
Mean weight (M): 24.32 g
hLRRK2 group, harvested on 6th of July 2018:
hLRRK2 mice 1: Injured 23.22 g (M)
hLRRK2 mice 2: 26.46 g (M)
hLRRK2 mice 3: 21.13 g (F)
hLRRK2 mice 4: 21.43 g (F)
Mean weight (M): 24.84 g
Mean weight (F): 21.28 g
G2019S group, harvested on 6th of July 2018:
G2019S mice 1: 30.81 (M)
G2019S mouse 2: 29.99 g (M)
G2019S mouse 3: 31.10 g (M)

47
G2019S mouse 4: 25.70 g (F)
G2019S mouse 5: 21.45 g (F)
Mean weight (M): 30.63 g
Mean weight (F): 23.58 g
SOLUTIONS USED IN IMMUNE-HISTOCHEMISTRY
Blocking Buffer in 1 % PBS
1% BSA
0.1% Triton X
Stock: 0.1 M citric acid
Citric acid: F.W. = 192.12 g/mol → 19.212 g/l fill up to 0.5 liter with MilliQ
Stock: 0.1 M sodium citrate
Citric acid: F.W. = 294.10 g/mol → 29.410 g/l fill up to 0.5 liter with MilliQ
Citric buffer
18 ml 0.1 M citric acid and 82 ml of 0.1 M sodium citrate diluted to 1 liter in MilliQ
SOLUTIONS USED IN WESTERN BLOT
SDS-page gel was prepared with 7 % acrylamide, end volume 10 ml
1.75 ml acrylamide
5.55 ml dH2O
2.5 ml Tris buffer pH 8.8
100 µl SDS 10%
100 µl APS 10%
10 µl TEMED
SDS-page stack gel was prepared with 4 % acrylamide, end volume 5 ml
500 µl acrylamide
3.15 ml dH2O

48
1.25 ml Tris buffer pH 6.8
50 µl SDS 10%
50 µl APS 10%
5 µl TEMED
Running buffer
10X running buffer:
144 g glycine
30 g Tris base
10 g SDS
Diluted 10 times in MilliQ water and used as running buffer for SDS-page.
Transfer buffer
10X Tris-glycine buffer:
144.1 g glycine
30.3 g Tris base
2 g SDS
Diluted 10 times in MilliQ water and 200 ml methanol and used as transfer buffer.

49
ABSORBANCE VALUES AND CALCULATIONS FOR BRADFORD ESSAY
WT LRRK2 MICE IN SPF AND GF CONDITIONS
From duplicate measurements of absorbance for each sample, mean absorbance was calculated.
The mean absorbance was then converted into concentration using the standard Bradford curve
equation shown under methods in Figure 3. Loading onto the SDS-page was 50 µg of sample,
adding up with dH2O and 5 µl of 4x dye to a total volume of 20 µl.
Striatum Abs 1 Abs 2 Mean
Abs
Concentration
(mg/ml)
µl sample µl dH2O
SPF1 1.25 1.263 1.2565 4.282301 11.67597 3.324034
SPF2 1.365 1.316 1.3405 5.025664 9.948935 5.051065
SPF3 1.671 1.534 1.6025 7.344248 6.808049 8.191951
GF1 1.629 1.605 1.617 7.472566 6.691142 8.308858
GF2 1.853 1.783 1.818 9.251327 5.40463 9.59537
GF3 1.859 2.006 1.9325 10.2646 4.87111 10.12889
Hippocampus Abs
1
Abs
2
Mean
Abs
Concentration
(mg/ml)
µl sample µl dH2O
SPF1 1.77 1.726 1.748 6.353433 7.869761 7.130239
SPF2 1.671 1.69 1.6805 6.056338 8.255814 6.744186
SPF3 1.896 1.883 1.8895 6.976232 7.167192 7.832808
GF1 1.777 1.823 1.8 6.582306 7.596122 7.403878
GF2 1.787 1.867 1.827 6.701144 7.461412 7.538588
GF3 1.755 1.619 1.687 6.084947 8.216998 6.783002
Midbrain Abs
1
Abs
2
Mean
Abs
Concentration
(mg/ml)
µl sample µl dH2O
SPF1 1.913 1.93 1.9215 10.16726 4.917747 10.08225
SPF2 1.847 1.83 1.8385 9.432743 5.300685 9.699315
SPF3 2.074 2.053 2.0635 11.42389 4.376791 10.62321
GF1 1.952 1.81 1.881 9.80885 5.097438 9.902562
GF2 1.932 1.799 1.8655 9.671681 5.169732 9.830268
GF3 1.852 1.884 1.868 9.693805 5.157933 9.842067

50
Small
intestine
Abs 1 Abs 2 Mean
Abs
Concentration
(mg/ml)
µl
sample
µl dH2O
SPF1 1.547 1.981 1.764 8.773451 5.699011 9.300989
SPF2 1.98 1.93 1.955 10.46372 4.778417 10.22158
SPF3 1.879 1.876 1.8775 9.777876 5.113585 9.886415
GF1 1.858 1.838 1.848 9.516814 5.253859 9.746141
GF2 1.764 1.658 1.711 8.304425 6.020887 8.979113
GF3 1.978 1.913 1.9455 10.37965 4.81712 10.18288
Large
intestine
Abs
1
Abs
2
Mean
Abs
Concentration
(mg/ml)
µl sample µl dH2O
SPF1 1.957 1.88 1.9185 10.14070796 4.930622218 10.06937778
SPF2 1.834 1.736 1.785 8.959292035 5.580798104 9.419201896
SPF3 2.062 2.051 2.0565 11.3619469 4.400654257 10.59934574
GF1 2.076 1.82 1.948 10.40176991 4.806874256 10.19312574
GF2 1.754 1.7 1.727 8.446017699 5.919949707 9.080050293
GF3 2.045 1.976 2.0105 10.95486726 4.564181275 10.43581873
KI HLRRK2 AND KI G2019S IN SPF CONDITIONS
From duplicate measurements of absorbance for each sample, mean absorbance was calculated.
The mean absorbance was then converted into concentration using the standard Bradford curve
equation shown in Figure 28 below. Loading onto the SDS-page was 50 µg of sample, adding
up with dH2O and 5 µl of 4x dye to a total volume of 20 µl.
Figure 18. Bradford standard curve used for the KI hLRRK2 and KI G2019S mice in SPF.
y = 0.113x + 0.7726R² = 0.9912
0
0,2
0,4
0,6
0,8
1
1,2
1,4
1,6
0 1 2 3 4 5 6
Ab
sorb
ance
at
59
5 n
m
Protein concentration
Bradford standard curve

51
Striatum Abs 1 Abs 2 Mean
Abs
Concent
ration
(mg/ml)
µl sample µl dH2O
hLRRK2 1 0.848 0.84 0.844 2.72 18.38235 1.117647
hLRRK2 2 0.814 0.806 0.81 2.55 19.60784 0
hLRRK2 3 0.819 0.819 0.819 2.595 19.26782 0.232177
G2019S 1 0.814 0.817 0.8155 2.5775 19.39864 0.101358
G2019S 2 0.81 0.806 0.808 2.54 19.68504 0
G2019S 3 0.857 0.842 0.8495 2.7475 18.19836 1.301638
G2019S 4 0.822 0.825 0.8235 2.6175 19.1022 0.397803
Hippocampus Abs
1
Abs
2
Mean
Abs
Concentration
(mg/ml)
µl sample µl dH2O
hLRRK2 1 2.049 2.005 2.027 11.10088 4.504145 10.49585
hLRRK2 2 2.11 2.065 2.0875 11.63628 4.296905 10.7031
hLRRK2 3 2.099 2.072 2.0855 11.61858 4.30345 10.69655
G2019S 1 2.077 2.068 2.0725 11.50354 4.346488 10.65351
G2019S 2 2.072 2.063 2.0675 11.45929 4.363271 10.63673
G2019S 3 2.134 2.093 2.1135 11.86637 4.213588 10.78641
G2019S 4 1.993 2.003 1.998 10.84425 4.610739 10.38926
Midbrain Abs
1
Abs
2
Mean
Abs
Concentration
(mg/ml)
µl sample µl dH2O
hLRRK2 1 2.087 2.057 2.072 11.49912 4.348161 10.65184
hLRRK2 2 2.199 2.158 2.1785 12.44159 4.018778 10.98122
hLRRK2 3 2.096 2.064 2.08 11.56991 4.321554 10.67845
G2019S 1 2.096 2.086 2.091 11.66726 4.285498 10.7145
G2019S 2 2.096 2.075 2.0855 11.61858 4.30345 10.69655
G2019S 3 2.05 2.025 2.0375 11.19381 4.466756 10.53324
G2019S 4 2.09 2.061 2.0755 11.53009 4.33648 10.66352

52
Small
intestine
Abs
1
Abs
2
Mean
Abs
Concentration
(mg/ml)
µl sample µl dH2O
hLRRK2 1 1.96 1.926 1.943 10.35752 4.827409 10.17259
hLRRK2 2 1.915 1.89 1.9025 9.999115 5.000443 9.999557
hLRRK2 3 1.912 1.867 1.8895 9.884071 5.058644 9.941356
G2019S 1 1.936 1.914 1.925 10.19823 4.902812 10.09719
G2019S 2 2.065 2.03 2.0475 11.2823 4.43172 10.56828
G2019S 3 1.983 1.969 1.976 10.64956 4.695031 10.30497
G2019S 4 1.908 1.898 1.903 10.00354 4.998231 10.00177
Large
intestine
Abs
1
Abs
2
Mean
Abs
Concentration
(mg/ml)
µl sample µl dH2O
hLRRK2 1 2.099 1.969 2.034 11.16283 4.47915 10.52085
hLRRK2 2 2.061 2.039 2.05 11.30442 4.423047 10.57695
hLRRK2 3 2.062 2.025 2.0435 11.2469 4.445668 10.55433
G2019S 1 2.138 2.084 2.111 11.84425 4.221458 10.77854
G2019S 2 2.164 2.111 2.1375 12.07876 4.139497 10.8605
G2019S 3 2.132 2.105 2.1185 11.91062 4.197934 10.80207
G2019S 4 2.128 2.121 2.1245 11.96372 4.179303 10.8207
VALUES AND CALCULATIONS OF RELATIVE PROTEIN VALUES
WT LRRK2 MICE IN SPF AND GF CONDITIONS
Shown here are all the values obtained after intensity measurements of protein on Western
blot membrane. Three tables are shown for each tissue. The first table shows calculation for
housekeeping/reference protein. The second shows LRRK2 and the third shows NOD2. An
example of calculation is shown under Material and methods.
Striatum Housek.
GAPDH
255-
housek.
Background 255-
background
Net housekeeping
GF 1 70.657 184.343 109.184 145.816 38.527
GF 2 67.263 187.737 97.42 157.58 30.157
GF 3 83.251 171.749 100.353 154.647 17.102
SPF 1 80.685 174.315 93.879 161.121 13.194
SPF 2 76.536 178.464 99.02 155.98 22.484
SPF 3 81.877 173.123 99.39 155.61 17.513

53
Striatum LRRK2 255-
LRRK2
Background 255-
background
Net
LRRK2
Net
LRRK2/net
housekeeping
GF 1 86.754 168.246 111.759 143.241 25.005 0.649025
GF 2 87.812 167.188 108.167 146.833 20.355 0.674968
GF 3 79.688 175.312 96.932 158.068 17.244 1.008303
SPF 1 46.7 208.3 79.111 175.889 32.411 2.456495
SPF 2 45.335 209.665 82.83 172.17 37.495 1.66763
SPF 3 47.954 207.046 73.011 181.989 25.057 1.430766
Striatum NOD2 255-
NOD2
Background 255-
background
Net
NOD2
Net NOD2/net
housekeeping
GF 1 142.365 112.635 152.528 102.472 10.163 0.263789
GF 2 131.147 123.853 139.691 115.309 8.544 0.283317
GF 3 144.792 110.208 149.332 105.668 4.54 0.265466
SPF 1 147.513 107.487 150.762 104.238 3.249 0.246248
SPF 2 130.23 124.77 135.504 119.496 5.274 0.234567
SPF 3 131.715 123.285 135.883 119.117 4.168 0.237995
Midbrain Housek.
GAPDH
255-
housek.
Background 255-
background
Net housekeeping
GF 1 86.45 168.55 109.262 145.738 22.812
GF 2 88.622 166.378 107.211 147.789 18.589
GF 3 78.565 176.435 106.236 148.764 27.671
SPF 1 86.524 168.476 106.97 148.03 20.446
SPF 2 75.08 179.92 104.129 150.871 29.049
SPF 3 68.187 186.813 99.567 155.433 31.38
Midbrain LRRK2 255-
LRRK2
Background 255-
background
Net
LRRK2
Net
LRRK2/net
housekeeping
GF 1 51.769 203.231 73.739 181.261 21.97 0.96309
GF 2 74.479 180.521 83.153 171.847 8.674 0.46662
GF 3 58.155 196.845 78.226 176.774 20.071 0.725344
SPF 1 40.913 214.087 86.567 168.433 45.654 2.232906
SPF 2 37.931 217.069 82.516 172.484 44.585 1.53482
SPF 3 39.221 215.779 86.492 168.508 47.271 1.506405

54
Midbrain NOD2 255-
NOD2
Background 255-
background
Net
NOD2
Net NOD2/net
housekeeping
GF 1 130.692 124.308 137.37 117.63 6.678 0.292741
GF 2 131.618 123.382 134.717 120.283 3.099 0.166711
GF 3 126.968 128.032 134.334 120.666 7.366 0.266199
SPF 1 136.359 118.641 146.571 108.429 10.212 0.499462
SPF 2 140.461 114.539 151.953 103.047 11.492 0.395607
SPF 3 156.022 98.978 164.062 90.938 8.04 0.256214
Hippocampus Housek.
Beta-
tubulin
255-
housek.
Background 255-background Net
housekeeping
SPF 1 45.588 209.412 76.469 178.531 30.881
SPF 2 57.716 197.284 78.508 176.492 20.792
SPF 3 57.691 197.309 84.009 170.991 26.318
GF 1 58.634 196.366 85.218 169.782 26.584
GF 2 62.965 192.035 82.829 172.171 19.864
GF 3 67.376 187.624 107.564 147.436 40.188
Hippocampus LRRK2 255-
LRRK2
Background 255-
background
Net
LRRK2
Net
LRRK2/net
housek.
SPF 1 104.391 150.609 172.816 82.184 68.425 2.215764
SPF 2 102.215 152.785 175.601 79.399 73.386 3.529531
SPF 3 94.408 160.592 156.209 98.791 61.801 2.348241
GF 1 142.327 112.673 164.323 90.677 21.996 0.827415
GF 2 149.638 105.362 170.906 84.094 21.268 1.070681
GF 3 160.908 94.092 174.868 80.132 13.96 0.347367
Hippocampus NOD2 255-
NOD2
Background 255-
background
Net
NOD2
Net
NOD2/net
housek.
SPF 1 58.66 196.34 108.078 146.922 49.418 0.892908
SPF 2 66.947 188.053 100.335 154.665 33.388 0.685191
SPF 3 59.549 195.451 93.982 161.018 34.433 0.576777
GF 1 77.68 177.32 99.721 155.279 22.041 0.398723
GF 2 77.998 177.002 108.733 146.267 30.735 0.637074
GF 3 86.386 168.614 114.89 140.11 28.504 0.528625

55
Small
intestine
Housek.
GAPDH
255-
housek.
Background 255-
background
Net housekeeping
SPF 1 94.966 160.034 195.918 59.082 100.952
SPF 2 92.167 162.833 203.19 51.81 111.023
SPF 3 92.068 162.932 203.32 51.68 111.252
GF 1 91.869 163.131 204.321 50.679 112.452
GF 2 92.044 162.956 203.922 51.078 111.878
GF 3 92.071 162.929 205.323 49.677 113.252
Small
intestine
LRRK2 255-
LRRK2
Background 255-
background
Net
LRRK2
Net
LRRK2/net
housekeeping
SPF 1 116.16 138.84 212.949 42.051 96.789 0.958763
SPF 2 79.079 175.921 214.927 40.073 135.848 1.223602
SPF 3 64.693 190.307 215.248 39.752 150.555 1.353279
GF 1 161.614 93.386 219.834 35.166 58.22 0.517732
GF 2 170.848 84.152 218.91 36.09 48.062 0.429593
GF 3 174.558 80.442 221.222 33.778 46.664 0.412037
Small
intestine
NOD2 255-
NOD2
Background 255-
background
Net
NOD2
Net NOD2/net
housekeeping
SPF 1 61.957 193.043 91.01 163.99 29.053 0.28779
SPF 2 52.358 202.642 86.527 168.473 34.169 0.307765
SPF 3 62.649 192.351 95.162 159.838 32.513 0.292246
GF 1 86.207 168.793 90.966 164.034 4.759 0.04232
GF 2 85.569 169.431 93.418 161.582 7.849 0.070157
GF 3 82.153 172.847 94.568 160.432 12.415 0.109623
Large
intestine
Housek.
GAPDH
255-
housek.
Background 255-
background
Net housekeeping
SPF 1 91.882 163.118 203.124 51.876 111.242
SPF 2 90.973 164.027 203.325 51.675 112.352
SPF 3 92.874 162.126 205.989 49.011 113.115
GF 1 92.875 162.125 203.627 51.373 110.752
GF 2 92.876 162.124 200.128 54.872 107.252
GF 3 92.877 162.123 188.899 66.101 96.022

56
Large
intestine
LRRK2 255-
LRRK2
Background 255-
background
Net
LRRK2
Net
LRRK2/net
housekeeping
SPF 1 182.309 72.691 219.876 35.124 37.567 0.337705
SPF 2 186.018 68.982 220.942 34.058 34.924 0.310844
SPF 3 179.968 75.032 225.411 29.589 45.443 0.401742
GF 1 147.731 107.269 221.898 33.102 74.167 0.669667
GF 2 154.036 100.964 217.841 37.159 63.805 0.594907
GF 3 160.395 94.605 216.523 38.477 56.128 0.584533
Large
intestine
NOD2 255-
NOD2
Background 255-
background
Net
NOD2
Net NOD2/net
housekeeping
SPF 1 98.843 156.157 101.599 153.401 2.756 0.024775
SPF 2 100.691 154.309 105.39 149.61 4.699 0.041824
SPF 3 100.212 154.788 105.436 149.564 5.224 0.046183
GF 1 100.798 154.202 103.842 151.158 3.044 0.027485
GF 2 100.612 154.388 104.084 150.916 3.472 0.032372
GF 3 97.54 157.46 103.64 151.36 6.1 0.063527
KI HLRRK2 AND KI G2019S IN SPF CONDITIONS
Shown here are all the values obtained after intensity measurements of protein on Western blot
membrane. Three tables are shown for each tissue. The first table shows calculation for
housekeeping/reference protein. The second shows LRRK2 and the third shows NOD2. An
example of calculation is shown under Material and methods. The females are highlighted in
light blue.
Midbrain Housek.
B-actin
255-
housek.
Background 255-
background
Net housekeeping
G2019S 1 167.086 87.914 214.881 40.119 47.795
G2019S 2 151.683 103.317 187.713 67.287 36.03
G2019S 3 128.984 126.016 169.531 85.469 40.547
G2019S 4 135.308 119.692 164.622 90.378 29.314
hLRRK2 1 138.299 116.701 171.906 83.094 33.607
hLRRK2 2 142.336 112.664 175.849 79.151 33.513
hLRRK2 3 155.736 99.264 214.808 40.192 59.072
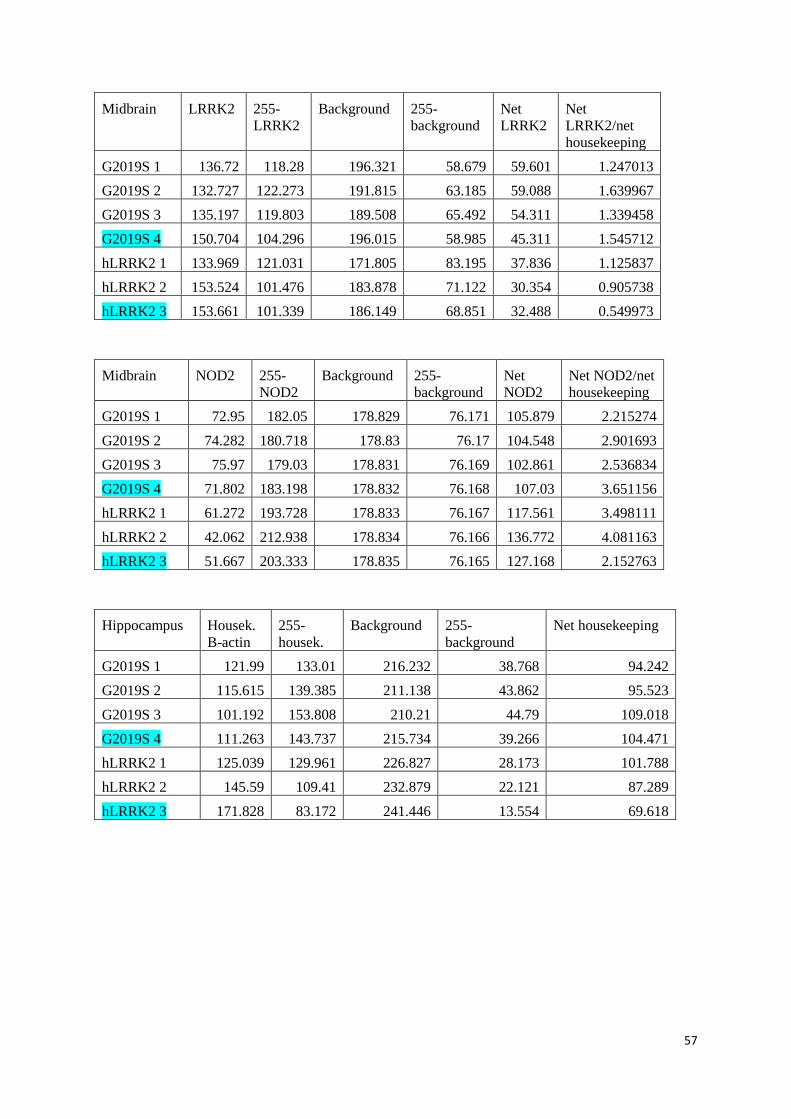
57
Midbrain LRRK2 255-
LRRK2
Background 255-
background
Net
LRRK2
Net
LRRK2/net
housekeeping
G2019S 1 136.72 118.28 196.321 58.679 59.601 1.247013
G2019S 2 132.727 122.273 191.815 63.185 59.088 1.639967
G2019S 3 135.197 119.803 189.508 65.492 54.311 1.339458
G2019S 4 150.704 104.296 196.015 58.985 45.311 1.545712
hLRRK2 1 133.969 121.031 171.805 83.195 37.836 1.125837
hLRRK2 2 153.524 101.476 183.878 71.122 30.354 0.905738
hLRRK2 3 153.661 101.339 186.149 68.851 32.488 0.549973
Midbrain NOD2 255-
NOD2
Background 255-
background
Net
NOD2
Net NOD2/net
housekeeping
G2019S 1 72.95 182.05 178.829 76.171 105.879 2.215274
G2019S 2 74.282 180.718 178.83 76.17 104.548 2.901693
G2019S 3 75.97 179.03 178.831 76.169 102.861 2.536834
G2019S 4 71.802 183.198 178.832 76.168 107.03 3.651156
hLRRK2 1 61.272 193.728 178.833 76.167 117.561 3.498111
hLRRK2 2 42.062 212.938 178.834 76.166 136.772 4.081163
hLRRK2 3 51.667 203.333 178.835 76.165 127.168 2.152763
Hippocampus Housek.
B-actin
255-
housek.
Background 255-
background
Net housekeeping
G2019S 1 121.99 133.01 216.232 38.768 94.242
G2019S 2 115.615 139.385 211.138 43.862 95.523
G2019S 3 101.192 153.808 210.21 44.79 109.018
G2019S 4 111.263 143.737 215.734 39.266 104.471
hLRRK2 1 125.039 129.961 226.827 28.173 101.788
hLRRK2 2 145.59 109.41 232.879 22.121 87.289
hLRRK2 3 171.828 83.172 241.446 13.554 69.618

58
Hippocampus LRRK2 255-
LRRK2
Background 255-
background
Net
LRRK2
Net
LRRK2/net
housekeeping
G2019S 1 140.665 114.335 183.974 71.026 43.309 0.459551
G2019S 2 147.601 107.399 185.785 69.215 38.184 0.399736
G2019S 3 146.548 108.452 183.057 71.943 36.509 0.33489
G2019S 4 153.08 101.92 183.621 71.379 30.541 0.29234
hLRRK2 1 127.658 127.342 181.975 73.025 54.317 0.533629
hLRRK2 2 159.734 95.266 183.479 71.521 23.745 0.272027
hLRRK2 3 159.244 95.756 183.808 71.192 24.564 0.35284
Hippocampus NOD2 255-
NOD2
Background 255-
background
Net
NOD2
Net NOD2/net
housekeeping
G2019S 1 56.753 198.247 178.836 76.164 122.083 1.29542
G2019S 2 61.685 193.315 178.837 76.163 117.152 1.226427
G2019S 3 64.189 190.811 178.838 76.162 114.649 1.051652
G2019S 4 58.066 196.934 178.839 76.161 120.773 1.156043
hLRRK2 1 50.428 204.572 178.84 76.16 128.412 1.261563
hLRRK2 2 54.015 200.985 178.841 76.159 124.826 1.430031
hLRRK2 3 102.209 152.791 178.842 76.158 76.633 1.100764
Striatum Housek.
B-actin
255-
housek.
Background 255-
background
Net housekeeping
hLRRK2 1 118.933 136.067 183.112 71.888 64.179
hLRRK2 2 109.14 145.86 192.769 62.231 83.629
hLRRK2 3 98.929 156.071 197.299 57.701 98.37
G2019S 1 93.064 161.936 193.359 61.641 100.295
G2019S 2 89.78 165.22 178.691 76.309 88.911
G2019S 3 90.197 164.803 160.549 94.451 70.352
G2019S 4 87.121 167.879 156.076 98.924 68.955

59
Striatum LRRK2 255-
LRRK2
Background 255-
background
Net
LRRK2
Net
LRRK2/net
housekeeping
hLRRK2 1 114.978 140.022 179.263 75.737 64.285 1.001652
hLRRK2 2 133.986 121.014 228.688 26.312 94.702 1.132406
hLRRK2 3 102.344 152.656 164.749 90.251 62.405 0.634391
G2019S 1 149.654 105.346 183.893 71.107 34.239 0.341383
G2019S 2 147.199 107.801 176.882 78.118 29.683 0.333851
G2019S 3 149.05 105.95 173.407 81.593 24.357 0.346216
G2019S 4 144.252 110.748 179.728 75.272 35.476 0.51448
Striatum NOD2 255-
NOD2
Background 255-
background
Net
NOD2
Net NOD2/net
housekeeping
hLRRK2 1 85.361 169.639 117.677 137.323 32.316 0.503529
hLRRK2 2 81.686 173.314 115.883 139.117 34.197 0.408913
hLRRK2 3 62.939 192.061 106.76 148.24 43.821 0.445471
G2019S 1 75.378 179.622 128.107 126.893 52.729 0.525739
G2019S 2 65.954 189.046 114.193 140.807 48.239 0.542554
G2019S 3 51.691 203.309 123.819 131.181 72.128 1.025244
G2019S 4 25.014 229.986 105.377 149.623 80.363 1.165441
Small intestine Housek.
B-actin
255-
housek.
Background 255-
background
Net housekeeping
hLRRK2 1 146.012 108.988 213.482 41.518 67.47
hLRRK2 2 191.937 63.063 217.999 37.001 26.062
hLRRK2 3 177.536 77.464 208.845 46.155 31.309
G2019S 1 146.154 108.846 204.953 50.047 58.799
G2019S 2 172.097 82.903 211.711 43.289 39.614
G2019S 3 164.41 90.59 204.281 50.719 39.871
G2019S 4 148.041 106.959 195.069 59.931 47.028
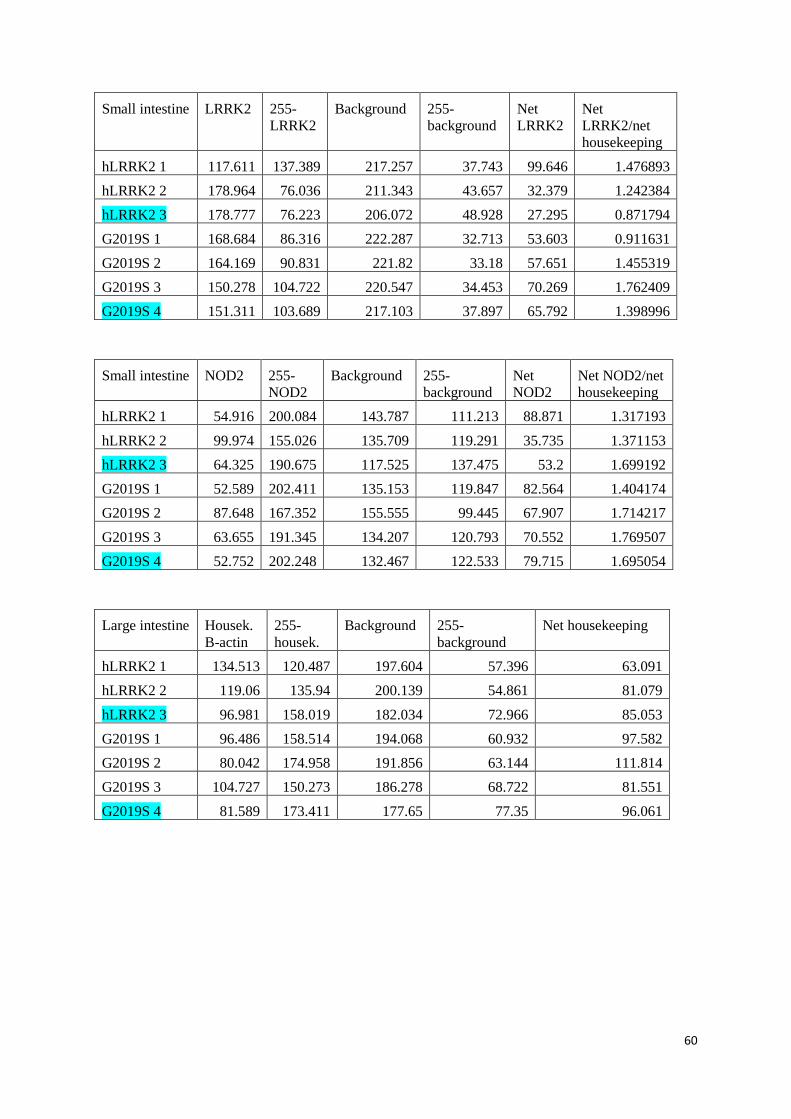
60
Small intestine LRRK2 255-
LRRK2
Background 255-
background
Net
LRRK2
Net
LRRK2/net
housekeeping
hLRRK2 1 117.611 137.389 217.257 37.743 99.646 1.476893
hLRRK2 2 178.964 76.036 211.343 43.657 32.379 1.242384
hLRRK2 3 178.777 76.223 206.072 48.928 27.295 0.871794
G2019S 1 168.684 86.316 222.287 32.713 53.603 0.911631
G2019S 2 164.169 90.831 221.82 33.18 57.651 1.455319
G2019S 3 150.278 104.722 220.547 34.453 70.269 1.762409
G2019S 4 151.311 103.689 217.103 37.897 65.792 1.398996
Small intestine NOD2 255-
NOD2
Background 255-
background
Net
NOD2
Net NOD2/net
housekeeping
hLRRK2 1 54.916 200.084 143.787 111.213 88.871 1.317193
hLRRK2 2 99.974 155.026 135.709 119.291 35.735 1.371153
hLRRK2 3 64.325 190.675 117.525 137.475 53.2 1.699192
G2019S 1 52.589 202.411 135.153 119.847 82.564 1.404174
G2019S 2 87.648 167.352 155.555 99.445 67.907 1.714217
G2019S 3 63.655 191.345 134.207 120.793 70.552 1.769507
G2019S 4 52.752 202.248 132.467 122.533 79.715 1.695054
Large intestine Housek.
B-actin
255-
housek.
Background 255-
background
Net housekeeping
hLRRK2 1 134.513 120.487 197.604 57.396 63.091
hLRRK2 2 119.06 135.94 200.139 54.861 81.079
hLRRK2 3 96.981 158.019 182.034 72.966 85.053
G2019S 1 96.486 158.514 194.068 60.932 97.582
G2019S 2 80.042 174.958 191.856 63.144 111.814
G2019S 3 104.727 150.273 186.278 68.722 81.551
G2019S 4 81.589 173.411 177.65 77.35 96.061
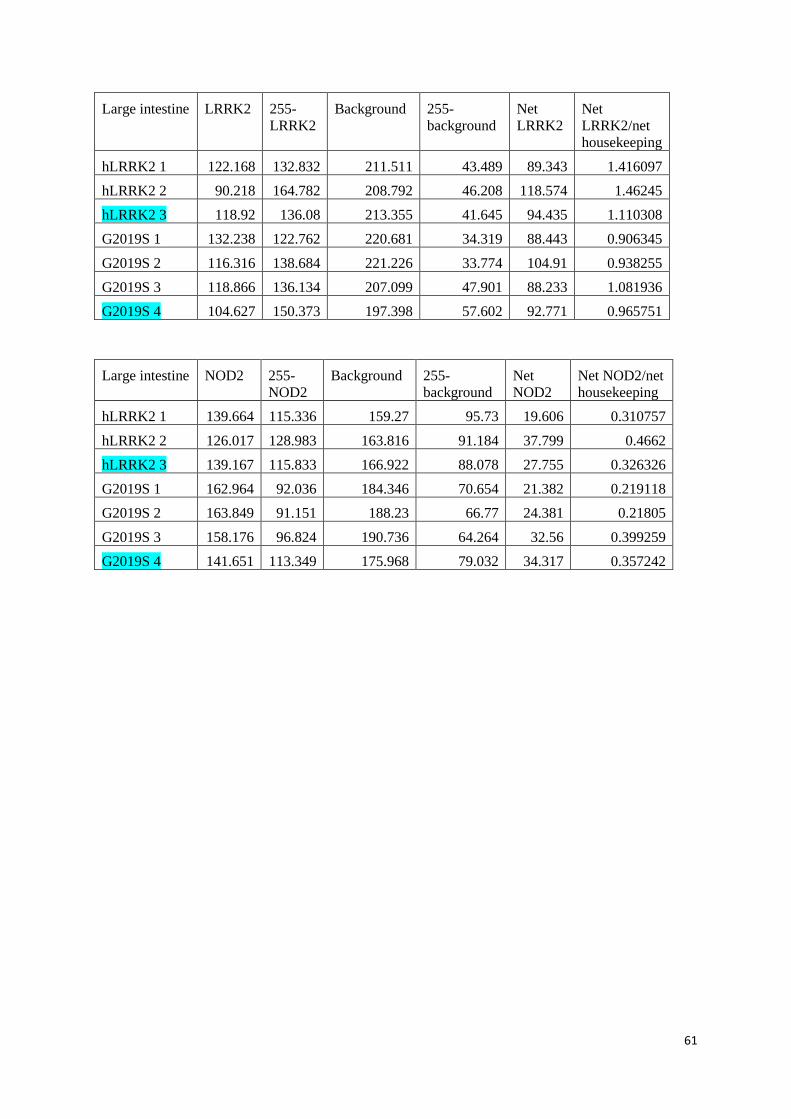
61
Large intestine LRRK2 255-
LRRK2
Background 255-
background
Net
LRRK2
Net
LRRK2/net
housekeeping
hLRRK2 1 122.168 132.832 211.511 43.489 89.343 1.416097
hLRRK2 2 90.218 164.782 208.792 46.208 118.574 1.46245
hLRRK2 3 118.92 136.08 213.355 41.645 94.435 1.110308
G2019S 1 132.238 122.762 220.681 34.319 88.443 0.906345
G2019S 2 116.316 138.684 221.226 33.774 104.91 0.938255
G2019S 3 118.866 136.134 207.099 47.901 88.233 1.081936
G2019S 4 104.627 150.373 197.398 57.602 92.771 0.965751
Large intestine NOD2 255-
NOD2
Background 255-
background
Net
NOD2
Net NOD2/net
housekeeping
hLRRK2 1 139.664 115.336 159.27 95.73 19.606 0.310757
hLRRK2 2 126.017 128.983 163.816 91.184 37.799 0.4662
hLRRK2 3 139.167 115.833 166.922 88.078 27.755 0.326326
G2019S 1 162.964 92.036 184.346 70.654 21.382 0.219118
G2019S 2 163.849 91.151 188.23 66.77 24.381 0.21805
G2019S 3 158.176 96.824 190.736 64.264 32.56 0.399259
G2019S 4 141.651 113.349 175.968 79.032 34.317 0.357242