understanding coastal vulnerability kutner and pollack
TRANSCRIPT

COASTAL VULNERABILITY
UNDERSTANDING Infrastructure Week 2015
http://infrastructureweek.org
@RebuildRenew
#RebuildRenew

Part 1: National Disaster Recovery Framework and the Local Recovery Planning Manager Program
Part 2: Risk Assessments ■ Purpose ■ Methodology
Part 3: Risk Assessment Results
Part 4: Tackling Risk – Who’s Driving?
Topics

WHO WE ARE

Nonprofit NGO promoting responsible land-use policies to:
■ Revitalize cities;
■ Preserve open space;
■ Keep housing affordable;
■ Encourage transportation choices
Mission
www.njfuture.org

Environmental Resources Mgmt/Restoration ■ Aquatic Ecologists, Lake Managers, Fish and Benthic
Ecologists;
■ Wetland and Natural Resource Ecologists;
■ Civil Engineers – Water resources, Hydrology;
■ Geotechnical Engineers – Soil Science, Geologists;
■ GIS Specialists
Services
www.princetonhydro.com
NDRF/LRPM PROGRAM
PART 1:
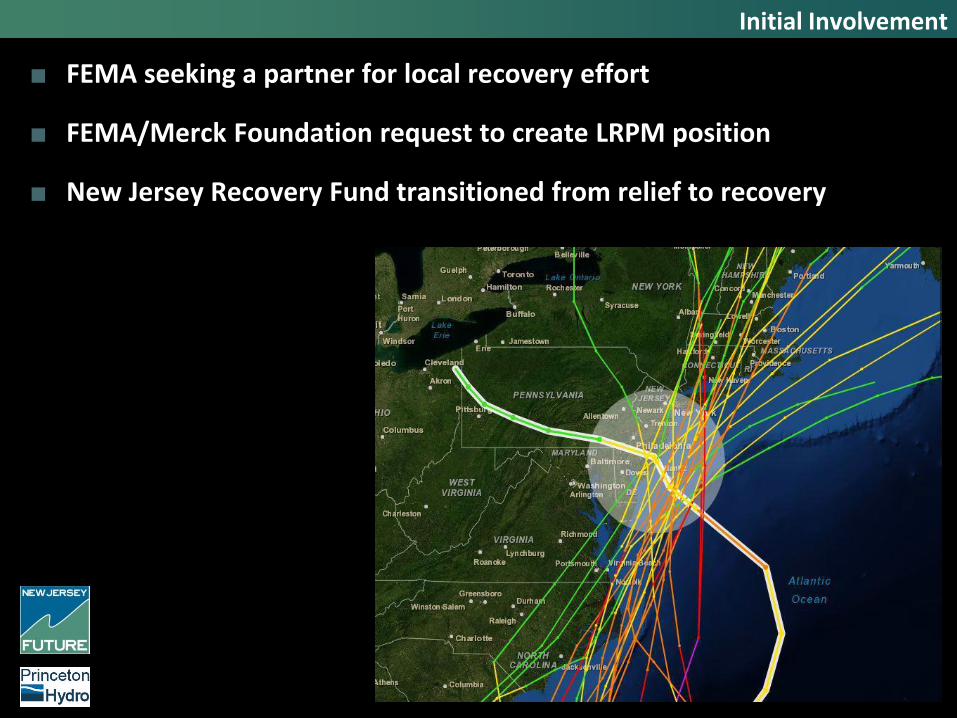
Initial Involvement
■ FEMA seeking a partner for local recovery effort
■ FEMA/Merck Foundation request to create LRPM position
■ New Jersey Recovery Fund transitioned from relief to recovery

FEMA’s National Disaster Recovery Framework
“ … strongly recommends that State Governors as well as local government ... prepare as part of their disaster recovery plans to appoint Local Disaster Recovery Managers to lead disaster recovery for the jurisdiction.”

The Program
Screening Criteria 1. Considerable storm damage
2. Limited or no in-house planning capabilities
3. Primarily full-time residents

Who We Work With

RISK ASSESSMENT
PART 2:
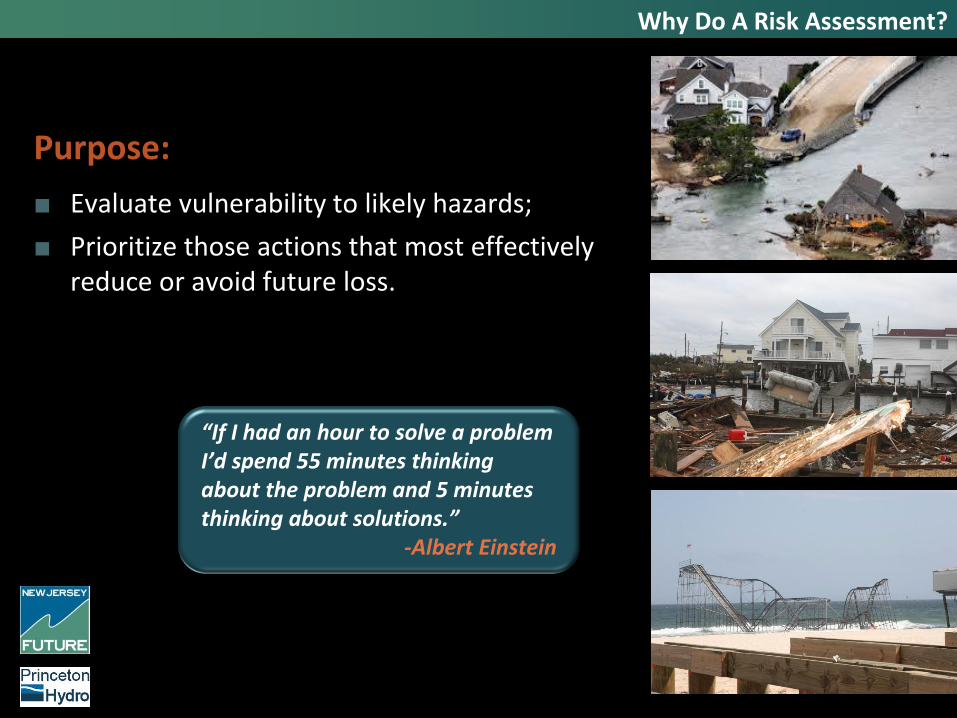
Why Do A Risk Assessment?
Purpose:
■ Evaluate vulnerability to likely hazards;
■ Prioritize those actions that most effectively reduce or avoid future loss.
“If I had an hour to solve a problem I’d spend 55 minutes thinking about the problem and 5 minutes thinking about solutions.”
-Albert Einstein

METHODOLOGY
Sea Level Rise
2050 Sea Level Rise Projections
■ 1.48 FT (Miller, et. al.)
■ Coastal Plain
■ Central Scenario
Two Scenarios
■ Sunny Day - Mean Higher High Water
■ FEMA Special Flood Hazard Areas

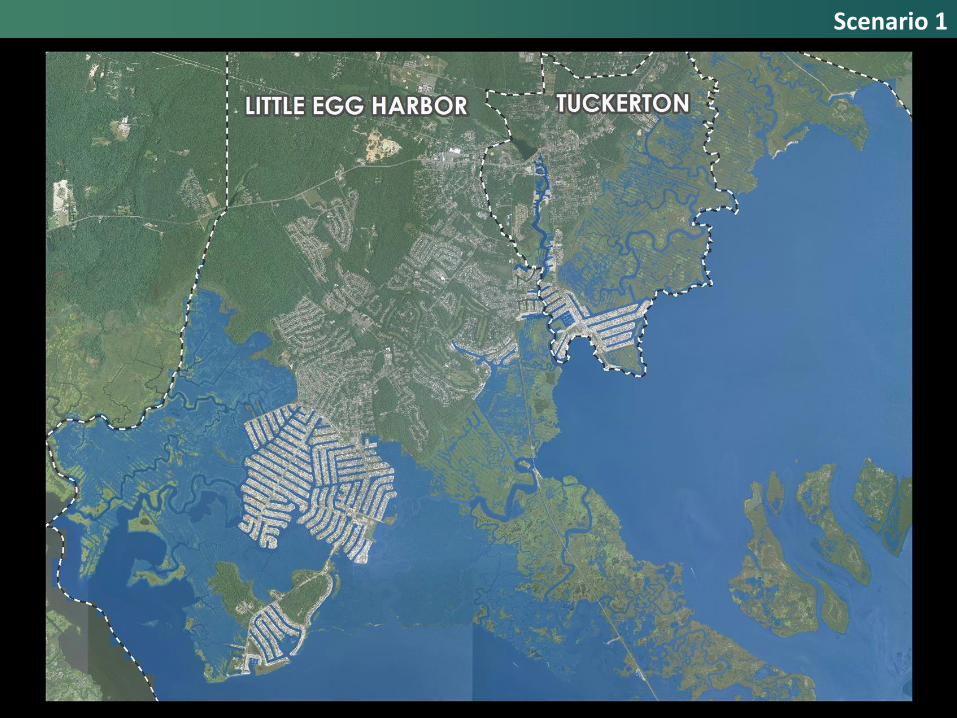
Scenario 1
Sunny Day - Mean Higher High Water
■ The average of the higher high water height of each tidal day observed over the National Tidal Datum Epoch
■ Used local NOAA Tide Stations or NOAA Vertical Datum (Vdatum) Tool
Scenario 1
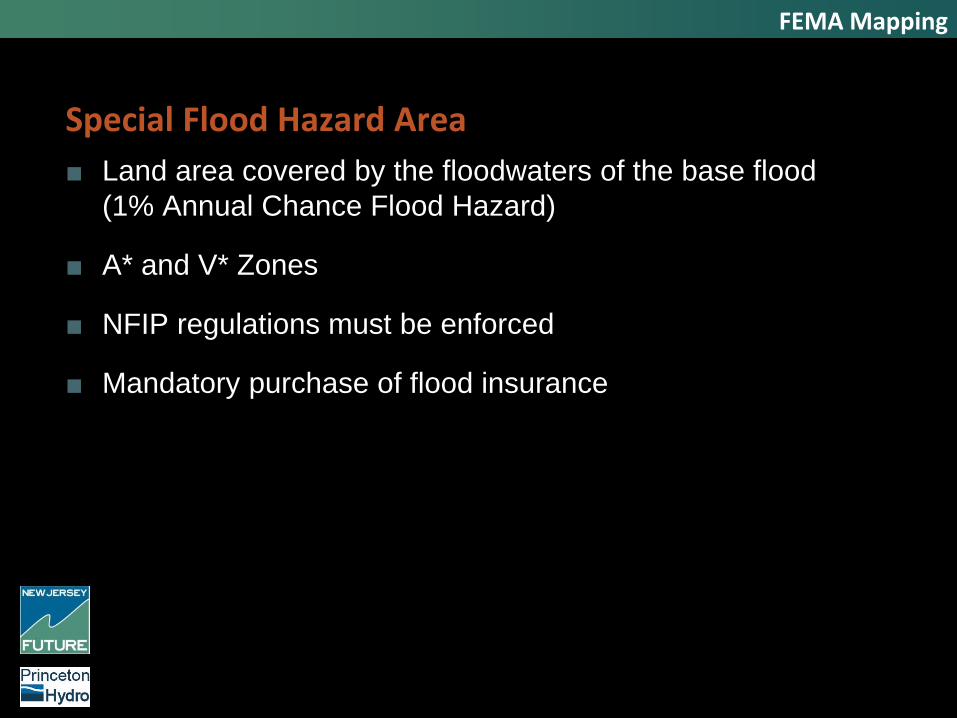
■ Land area covered by the floodwaters of the base flood
(1% Annual Chance Flood Hazard)
■ A* and V* Zones
■ NFIP regulations must be enforced
■ Mandatory purchase of flood insurance
FEMA Mapping
Special Flood Hazard Area
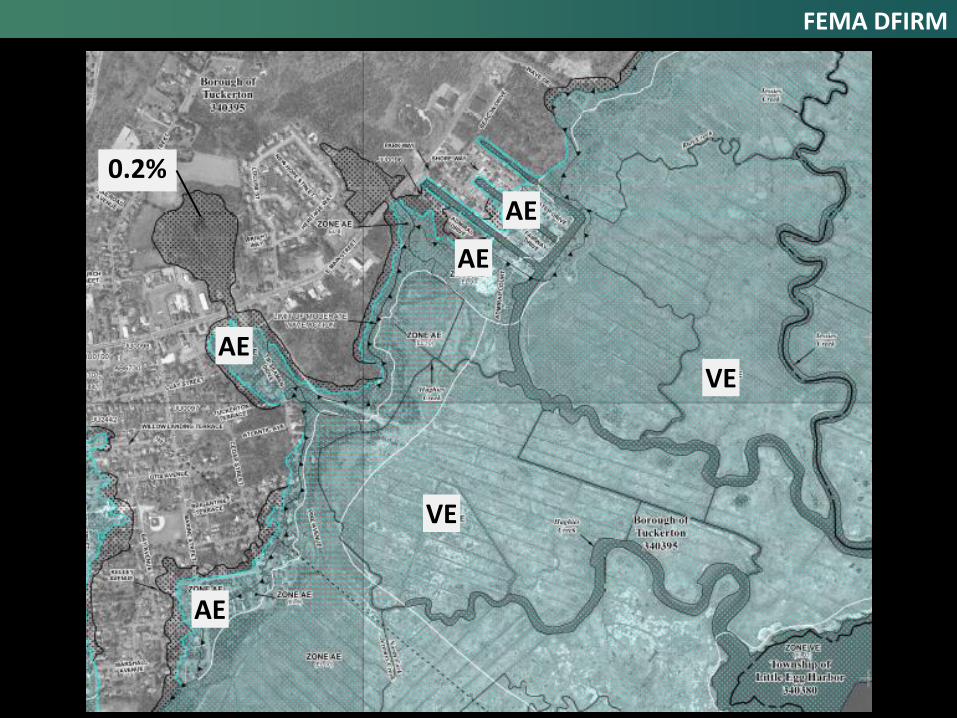
FEMA DFIRM
VE
VE
AE
AE
AE
AE
0.2%

FEMA Special Flood Hazard Area
Focus of Analysis
■ AE and VE Zones (1% Annual Chance Flood Hazard)
■ Detailed Studies with Base Flood Elevations (BFE)
■ Predominate Flood Hazard Zones in Study Areas
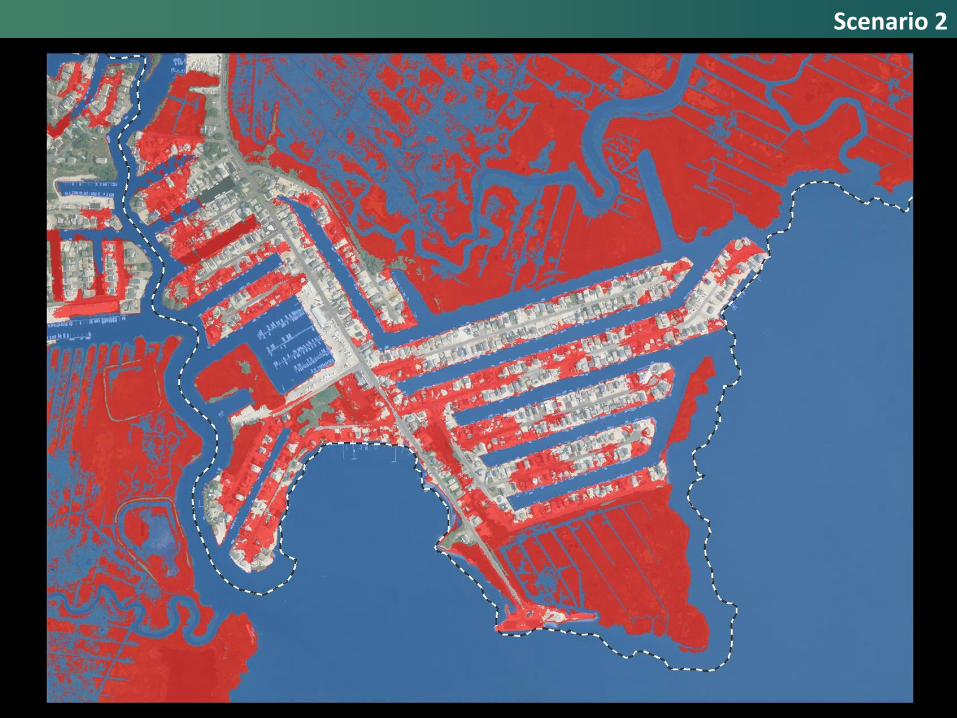
Scenario 2

Two Routes of Increased Exposure
■ Inundation Extent
■ Water Depth
Evaluation
Note: Assumed a Linear Relationship
■ For Example, if MHHW = 1 FT in current day conditions, then projected MHHW = 2.48 FT in 2050
■ Creates Limitations for Scenario 2

Inundation Extent
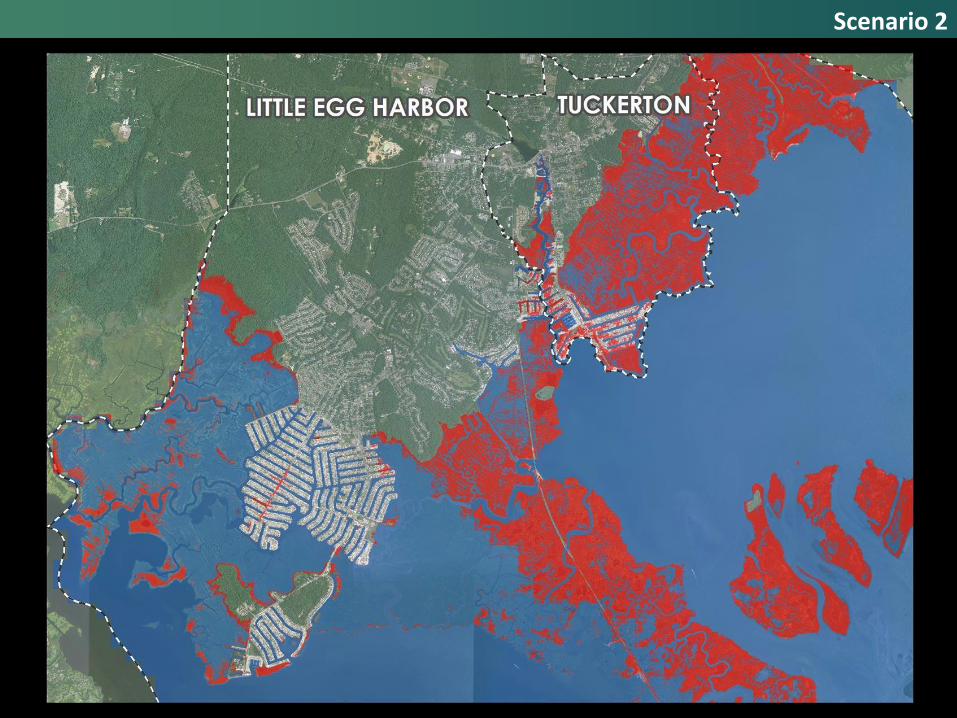
Scenario 2
Scenario 2
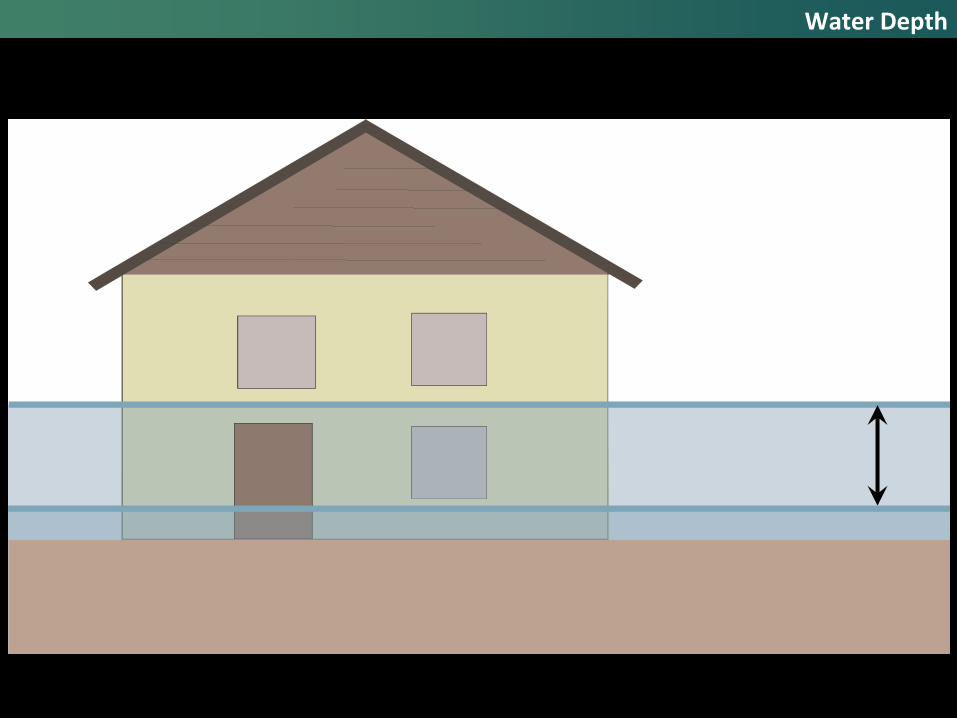
Water Depth

■ Percent of Land Inundated
■ Number of Parcels Impacted
■ Water Depth on each Property
■ Structure Damage
■ Depth Damage Curves
■ Residential vs. Commercial
■ One Story vs. Two Story
■ Basement vs. No Basement
For Each Scenario
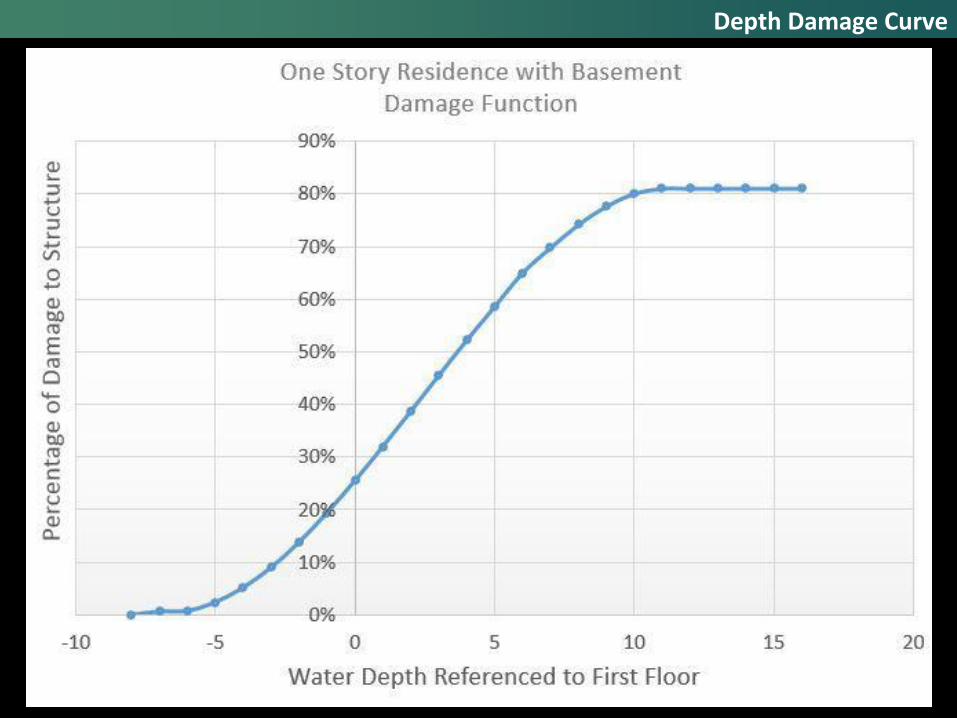
Depth Damage Curve

At approximately 4 FT of Water Depth, 50% of the Structure is Damaged!
Depth Damage Curve

Refinements
■ First Floor Elevation at Grade
■ Exception – Parcels with Elevation Certificates since Sandy
■ Elevation > Base Condition + SLR
■ One-Story Residential and No Basement
■ Omitted Parcels
■ Less than 10% Inundation
■ Structure not Inundated

■ Link Inundation Extents / Impacted Parcels with Parcel Tax Assessors Data
■ Land Value
■ Improvement Value / Structure Value
■ Calculated Average Water Depth Across each Parcel
■ Derive Exposure Value for Each Scenario
Financial Exposure

Scenario 1
■ Percent of Land Inundated
■ Number of Parcels Impacted
■ Complete loss of the property, both structural and land value
■ “New Normal”
■ Elevated structures
Financial Exposure

Scenario 2: 1% Flood Event
■ Percent of Land Inundated
■ Number of Parcels Impacted
■ Water Depth
■ Temporary loss in structural assessment value
■ Elevated Structures
■ Loss of Land Value?
■ Frequency of this 1% flood event in 2050?
Financial Exposure

■ Correlate loss of land and structural value to tax revenue
■ Correlate loss with land cover class
■ What implications does this have?
Financial Exposure

RESULTS
PART 3:
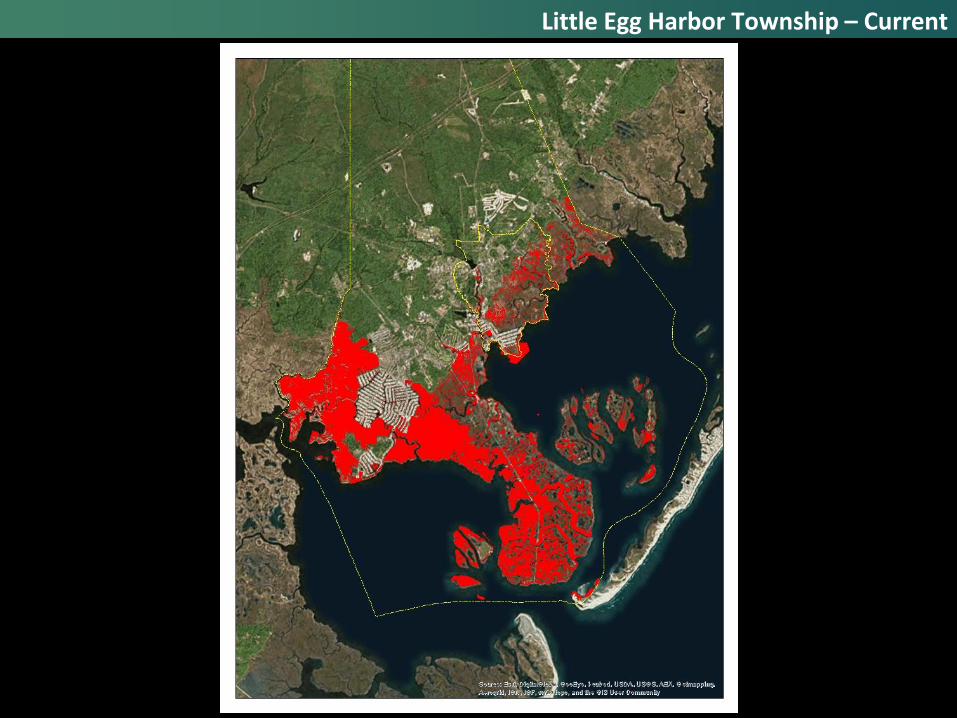
Little Egg Harbor Township – Current

Little Egg Harbor Township – 2050 SLR
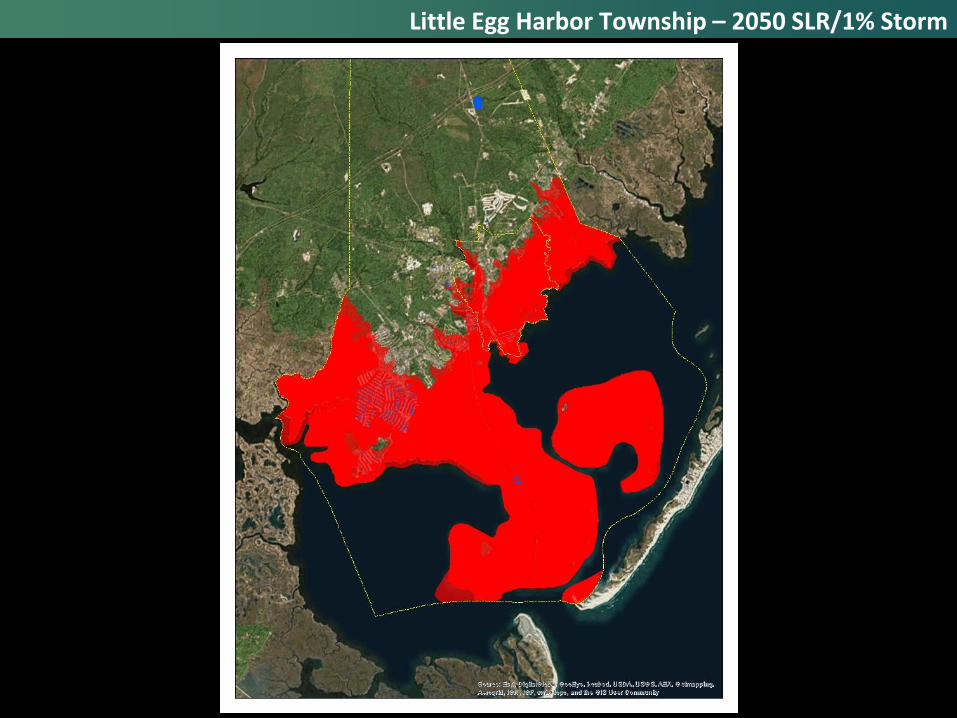
Little Egg Harbor Township – 2050 SLR/1% Storm

■ 2050 SLR % of acres: 31% ■ 2050 /1% storm % of acres: 34%
The Bottom Line
Little Egg Harbor Township – Parcels
# of Lots
Exposed
# of Acres
Exposed
# of Lots
Exposed
# of Acres
Exposed
Vacant (1) 176 232 366 348
Residential (2) 711 130 4,083 686
Farm (3A) 1 6 1 6
Farm (3B) 0 0 0 0
Commercial (4A) 13 34 54 62
Industrial (4B) 0 0 0 0
Apartment (4C) 0 0 0 0
Public School Property (15A) 0 0 0 0
Public Property (15C) 128 8,679 180 8,795
Church/Charitable (15D) 0 0 5 4
Other Exempt (15F) 3 5 22 7
Total 1,032 9,085 4,711 9,909
2050 SLR 2050 SLR/1% Flood
Property Class (Class Code)

Little Egg Harbor Township – Value
The Bottom Line ■ 2050 % of total value: 8% ■ 2050/1% storm % of total value: 32%
Total Exposed Value % of Total Total Exposed Value % of Total
Vacant (1) $14,063,025 11% $35,336,605 28%
Residential (2) $205,212,850 8% $822,161,915 32%
Farm (3A) $35,800 13% $35,800 13%
Farm (3B) $0 0% $0 0%
Commercial (4A) $18,198,200 13% $27,200,103 19%
Industrial (4B) $0 0% $0 0%
Apartment (4C) $0 0% $0 0%
Public School Property (15A) $0 0% $0 0%
Public Property (15C) $20,977,100 19% $30,158,550 28%
Church/Charitable (15D) $0 0% $1,408,502 9%
Other Exempt (15F) $1,480,300 4% $4,750,100 14%
Total $259,967,275 9% $921,051,575 31%
Net Taxable $237,509,875 8% $884,734,423 32%
2050 SLR 2050 SLR/1% @ 100% LVProperty Class

Sea Bright Borough - Current

Sea Bright Borough - 2050 SLR

Sea Bright Borough - 2050/1% Storm

# of Exposed
Lots
Exposed
Acres
# of Exposed
Lots
Exposed
Acres
Vacant (1) 38 20 215 61
Residential (2) 176 25 885 86
Commercial (4A) 21 29 61 58
Apartment (4C) 1 1 4 2
Public Property (15C) 3 1 13 10
Church/Charitable (15D) 0 0 3 1
Other Exempt (15F) 1 0 2 1
Total 240 76 1,183 218
Property Class
(Class Code)
2050 SLR 2050 SLR/1% Flood
Sea Bright Borough - Parcels
The Bottom Line ■ 2050 SLR % of acres: 30% ■ 2050 /1% storm % of acres: 87%

Total Exposed
Value
% of Total
Value
Total Exposed
Value
% of Total
Value
Vacant (1) $4,873 7% $11,706,029 79%
Residential (2) $2,627,606 8% $224,602,347 61%
Commercial (4A) $1,077,896 36% $43,360,337 84%
Apartment (4C) $208,402 29% $2,269,751 70%
Public Property (15C) $11,225 3% $12,484,382 93%
Church/Charitable (15D) $0 0% $1,537,657 56%
Other Exempt (15F) $205,953 41% $1,026,553 70%
Total $4,135,955 11% $296,987,056 65%
Net Taxable Value $3,918,777 11% $281,938,464 65%
2050 SLRProperty Class
(Class Code)
2050/1% Flood
Sea Bright Borough - Value
The Bottom Line ■ 2050 % of total value: 11% ■ 2050/1% storm % of total value: 65%

ADDITIONAL EXAMPLES…

Tuckerton Borough - Current

Tuckerton Borough – 2050 SLR

Tuckerton Borough – 2050 SLR/1% Storm
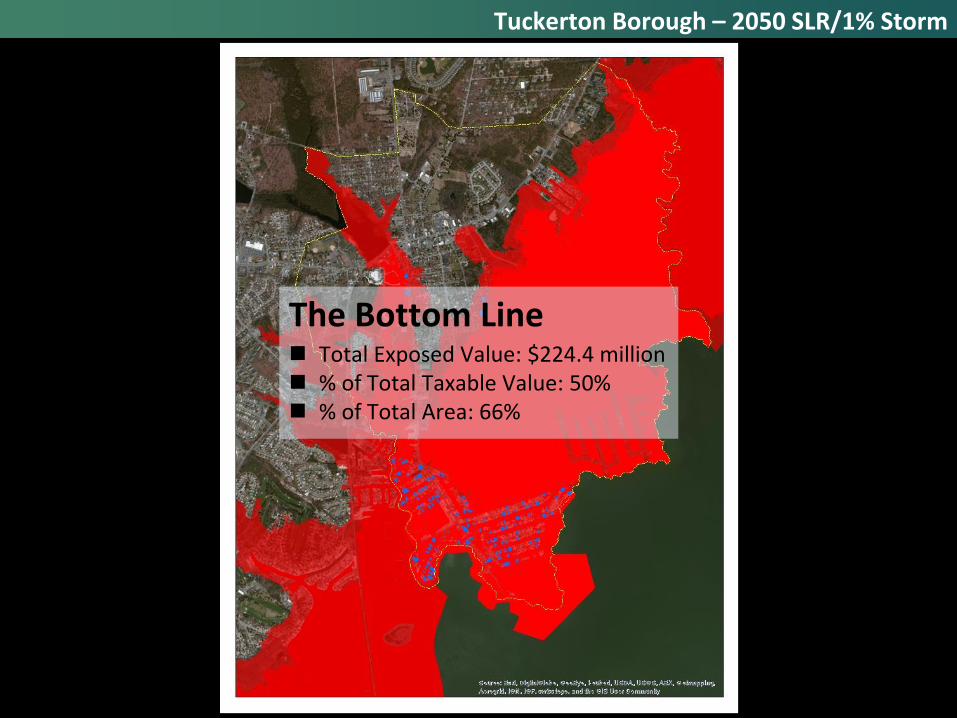
Total Exposed Value: $224.4 million % of Total Taxable Value: 50% % of Total Area: 66%
The Bottom Line
Tuckerton Borough – 2050 SLR/1% Storm
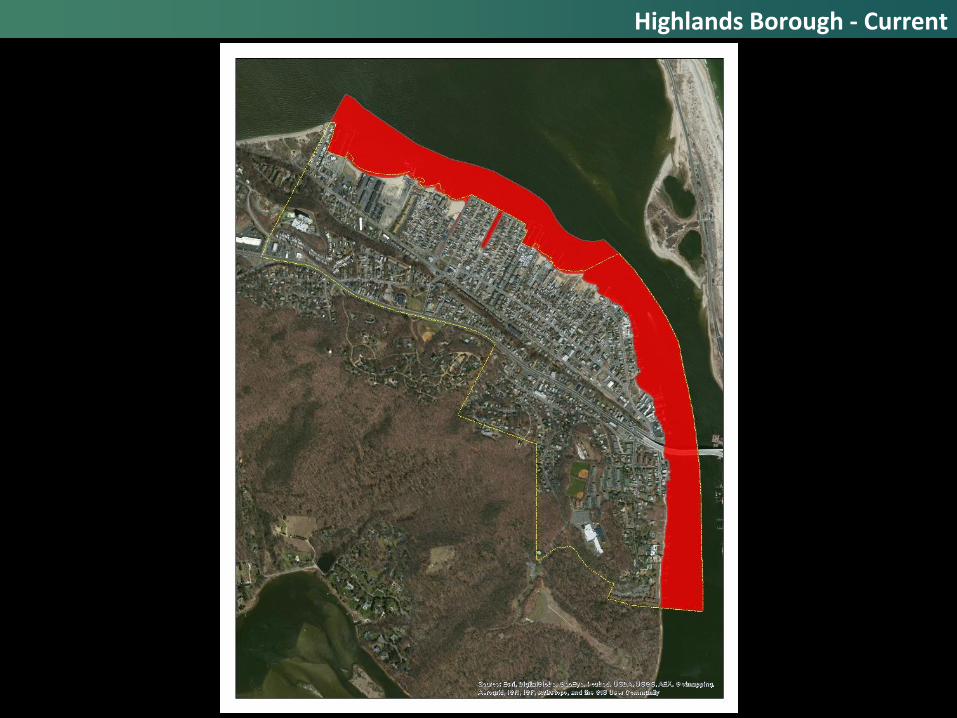
Highlands Borough - Current
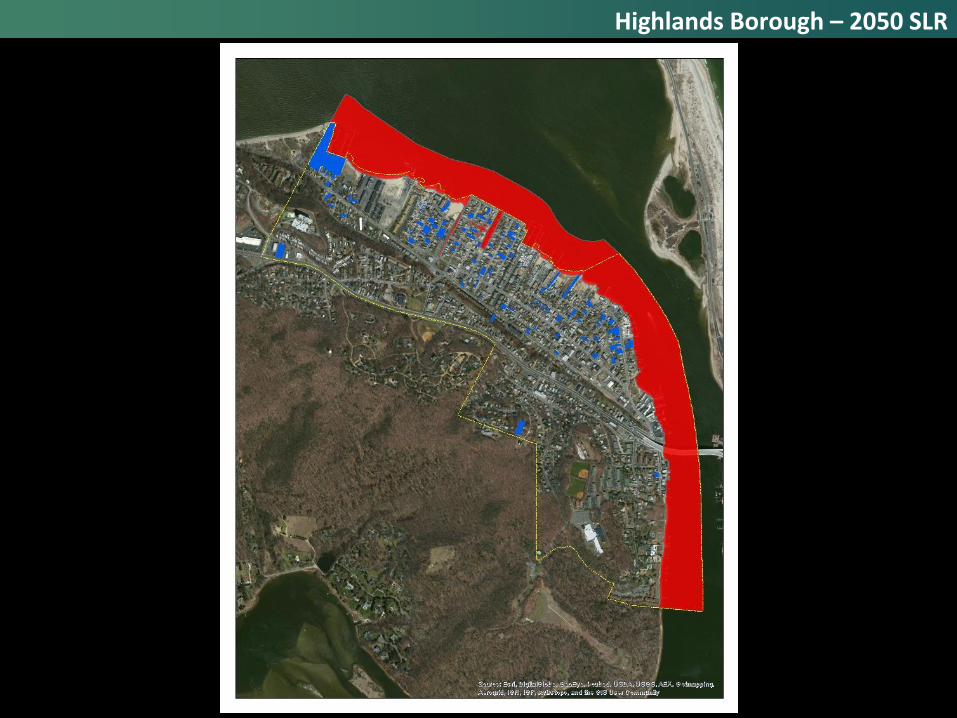
Highlands Borough – 2050 SLR

Highlands Borough – 2050 SLR/1% Storm

Total Exposed Value: $195 million % of Total Taxable Value: 34% % of Total Area: 41%
The Bottom Line
Highlands Borough – 2050 SLR/1% Storm

Maurice River Township - Current
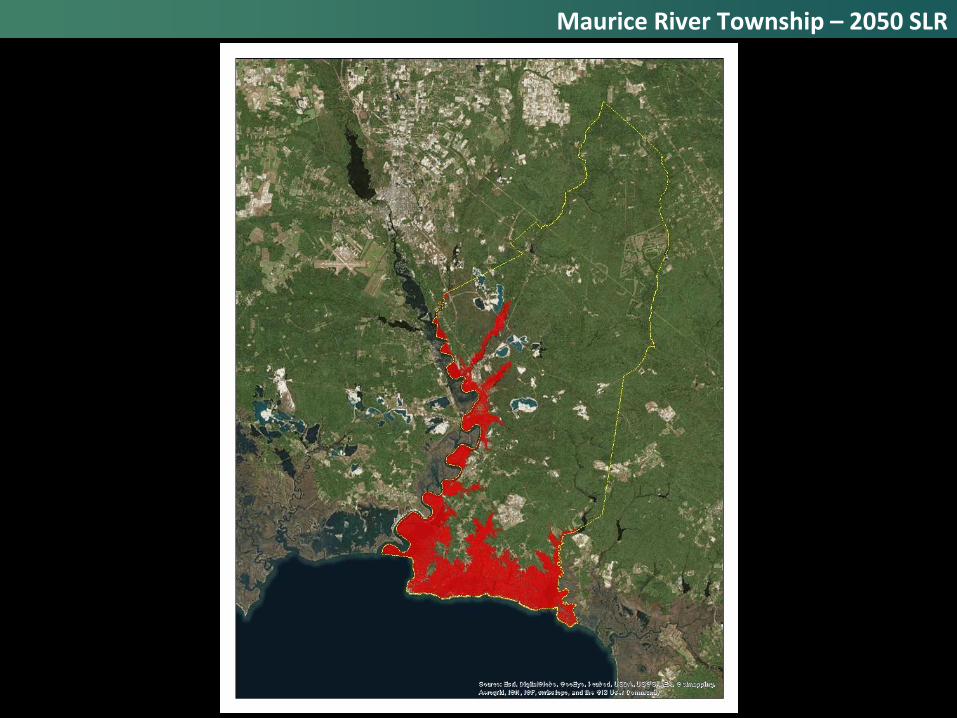
Maurice River Township – 2050 SLR

Maurice River Township – 2050 SLR/1% Storm

Total Exposed Value: $115 million % of Total Taxable Value: 39% % of Total Area: 21%
The Bottom Line
Maurice River Township – 2050 SLR/1% Storm

Commercial Township - Current

Commercial Township – 2050 SLR

Commercial Township – 2050 SLR/1% Storm
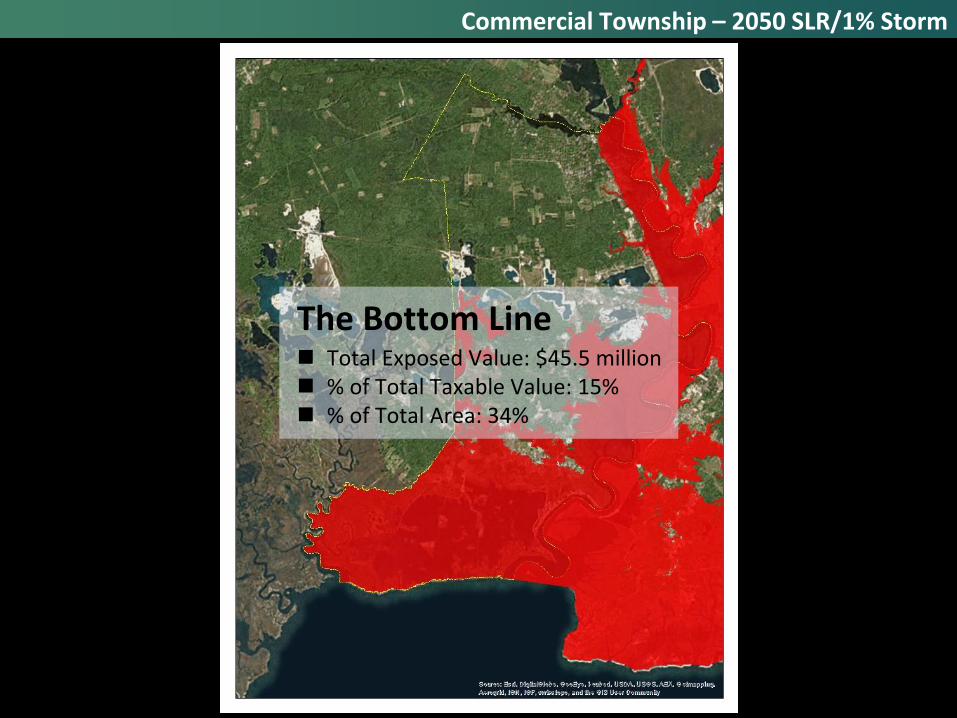
Total Exposed Value: $45.5 million % of Total Taxable Value: 15% % of Total Area: 34%
The Bottom Line
Commercial Township – 2050 SLR/1% Storm
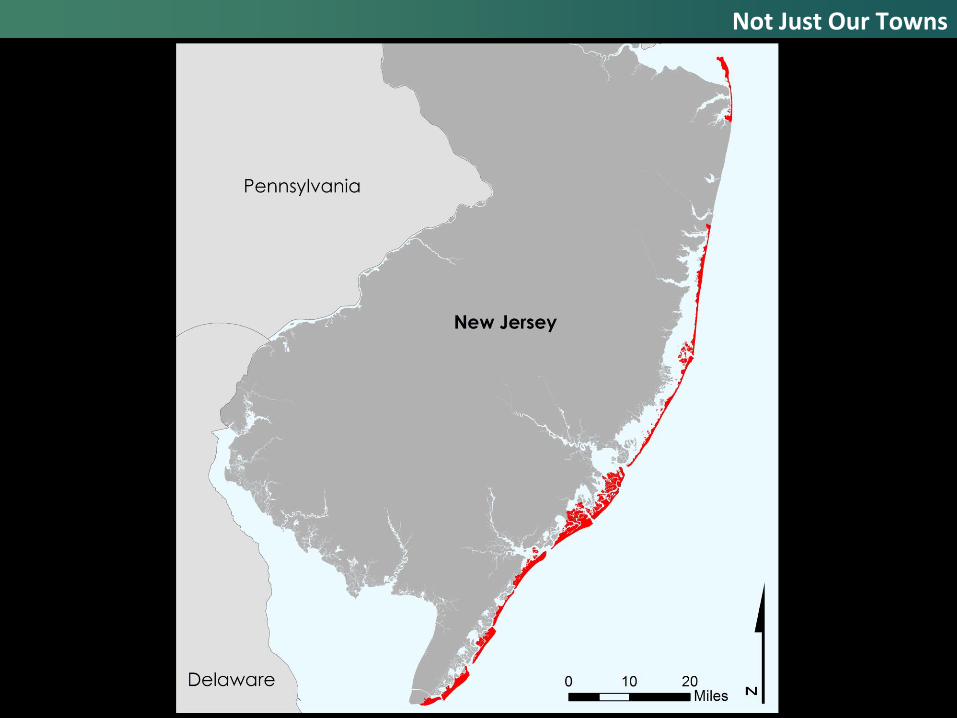
Not Just Our Towns
TACKLING RISK – WHO’S DRIVING?
PART 4:

Risk
Plan
Regulate Spend
States: Much More Than Bit Players

1. Require state and municipal hmp coordination
2. Set mitigation project/planning priorities
3. Determine how/where CDBG-DR funds are spent
4. Promote regional planning context/set common redevelopment standards (e.g. freeboard
requirements)
States: Much More Than Bit Players

Maryland
“As our climate continues to change and the seas continue to rise, Maryland’s coastal areas are highly susceptible to storms, flooding, hurricanes and other hazards…By providing funding and technical assistance we are helping our most vulnerable communities combat the threat, and build a stronger, resilient Maryland”
Governor Martin O’Malley

Delaware
“The goal of the Sea Level Rise Advisory committee is to assess Delaware’s vulnerability to current and future inundation problems that may be exacerbated by sea level rise and to develop a set of recommendations for state agencies, local governments, businesses and citizens to enable them to adapt programs, policies, business practices and make informed decisions.”
Sea Level Rise Advisory Committee
New York
“New York is assisting communities to rebuild better and safer based on community-driven plans that consider current damage, future threats to community assets, and the community’s economic future.”
Guidance for New York Rising

New Jersey
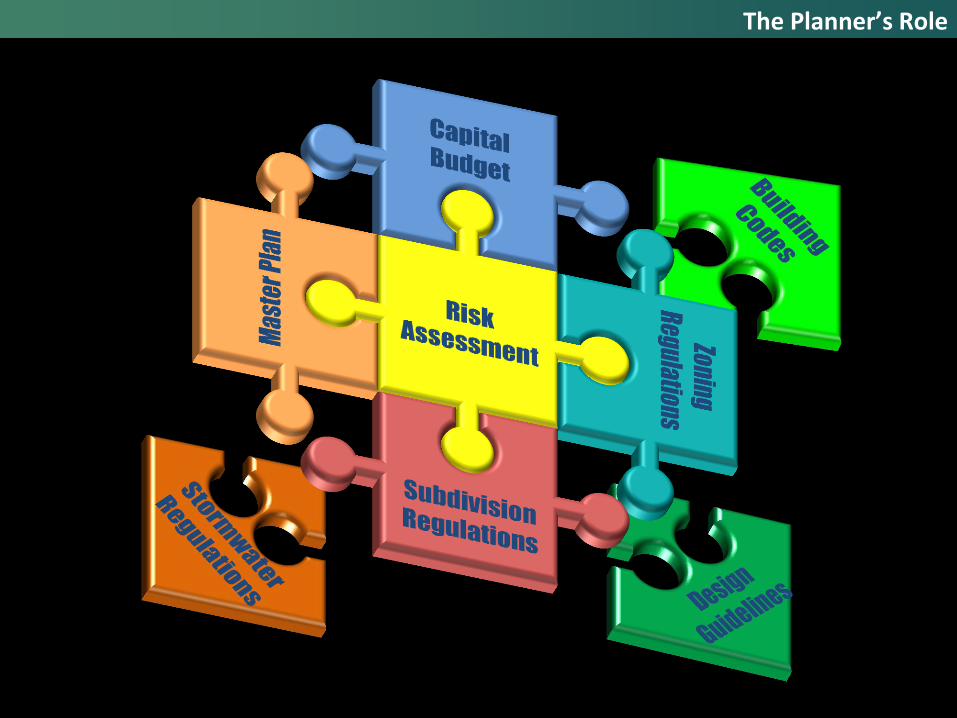
The Planner’s Role

The Age of Innocence is So Over!

1. Can we continue to develop areas at risk?
2. Can we allow areas that suffer repetitive loss to rebuild in place?
3. Will taxpayers throughout the country be willing to subsidize risky behavior?
4. How long will the banking and insurance industries continue to hedge their bets?
The Age of Innocence is So Over!

Insanity: doing the same thing over and over again
and expecting different results
Time for a new approach

We’re Done…..Your Turn