understanding and countering the private label challenge · understanding and countering the...
TRANSCRIPT

Understanding and Countering the
Private Label Challenge
Prof. dr. Jan-Benedict E.M. Steenkamp
Tilburg University
Zaventem (Brussels), March 20, 2003
Tilburg University (2)
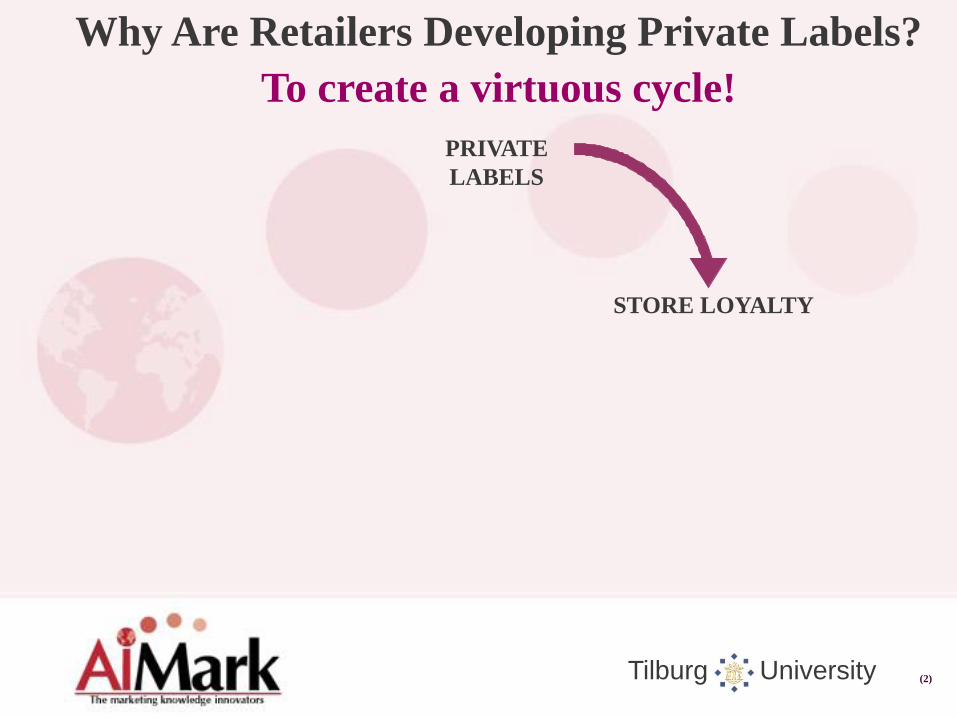
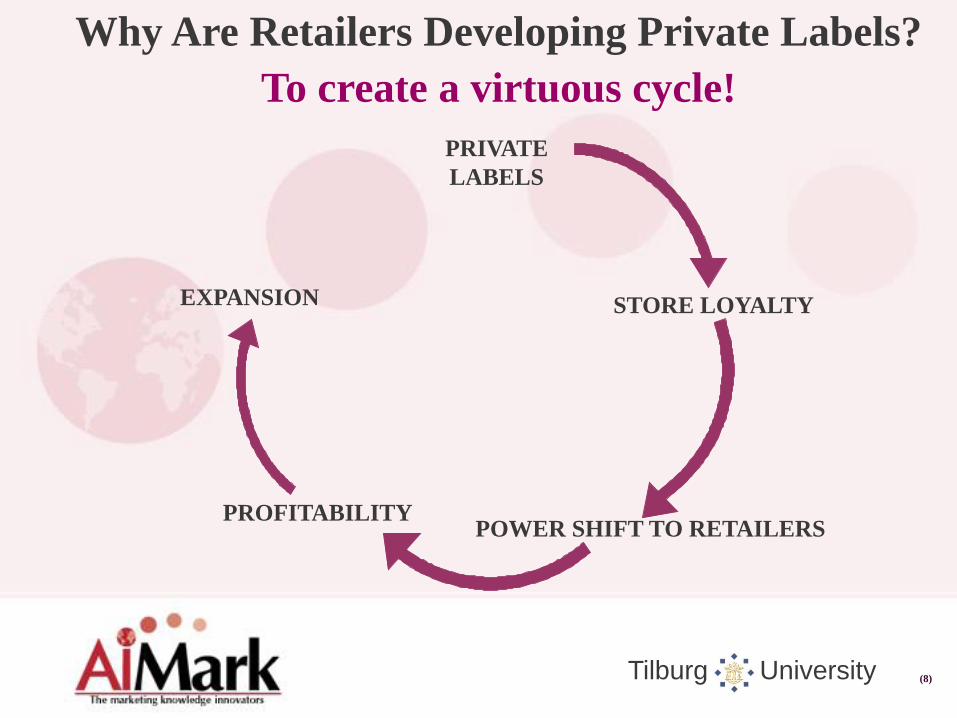
Why Are Retailers Developing Private Labels?
To create a virtuous cycle!
PRIVATE
LABELS
STORE LOYALTY

Tilburg University (3)
0
5
10
15
20
25
30
0 5 10 15 20 25
PL share in Carrefour sales (2001)
Store
loyalty*)
(2001) France
Chile
Portugal
Italy Argentina
Korea
Store Loyalty and Private Label Share of Sales:
Carrefour
*) Share of a shopper’s
weekly food expenditure
R = 0.73
Here is what retailer CEOs say:
“Consumers’ loyalty is a fundamental reason for having own labels”
“Private labels is what consumers want. It makes them loyal to the chain”
Tilburg University (4)
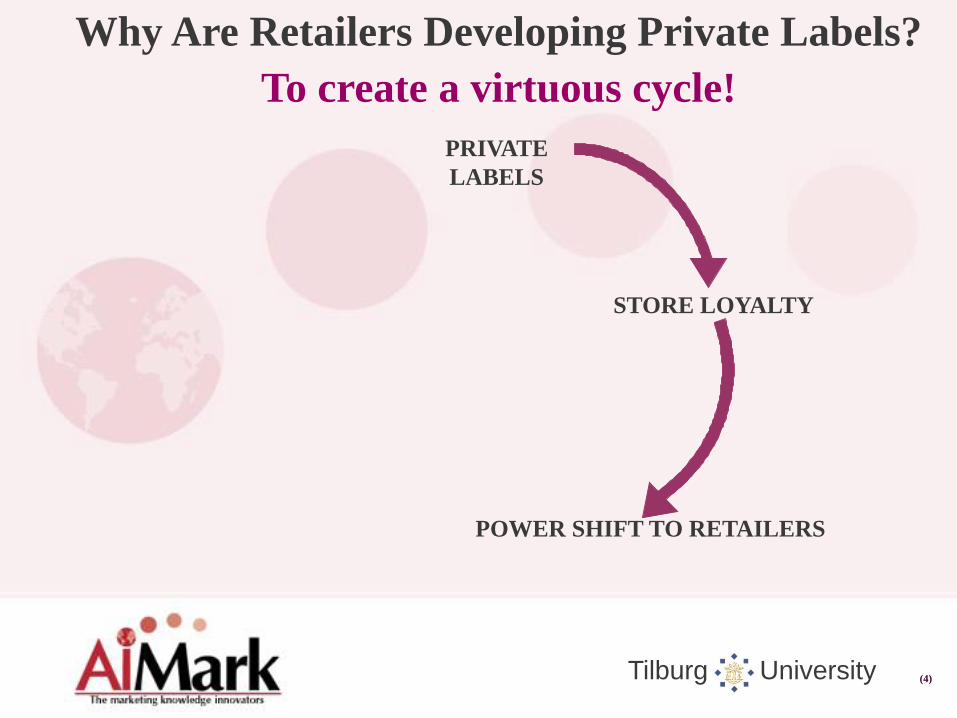
Why Are Retailers Developing Private Labels?
To create a virtuous cycle!
PRIVATE
LABELS
STORE LOYALTY
POWER SHIFT TO RETAILERS
Tilburg University (5)
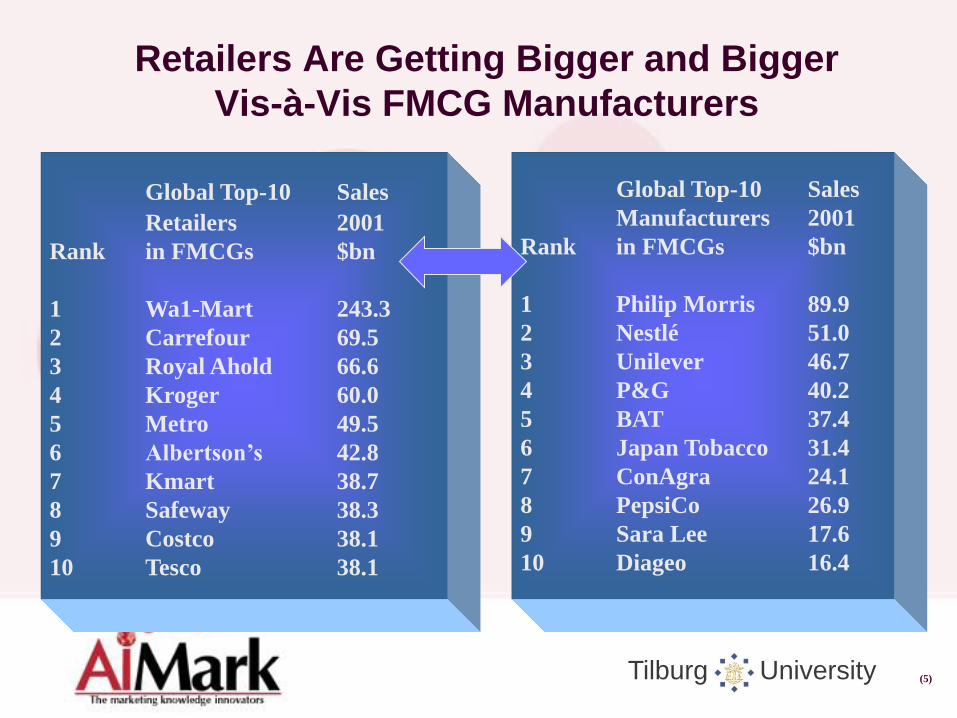
Retailers Are Getting Bigger and Bigger
Vis-à-Vis FMCG Manufacturers
Global Top-10 Sales
Retailers 2001
Rank in FMCGs $bn
1 Wa1-Mart 243.3
2 Carrefour 69.5
3 Royal Ahold 66.6
4 Kroger 60.0
5 Metro 49.5
6 Albertson’s 42.8
7 Kmart 38.7
8 Safeway 38.3
9 Costco 38.1
10 Tesco 38.1
Global Top-10 Sales
Manufacturers 2001
Rank in FMCGs $bn
1 Philip Morris 89.9
2 Nestlé 51.0
3 Unilever 46.7
4 P&G 40.2
5 BAT 37.4
6 Japan Tobacco 31.4
7 ConAgra 24.1
8 PepsiCo 26.9
9 Sara Lee 17.6
10 Diageo 16.4
Tilburg University (6)
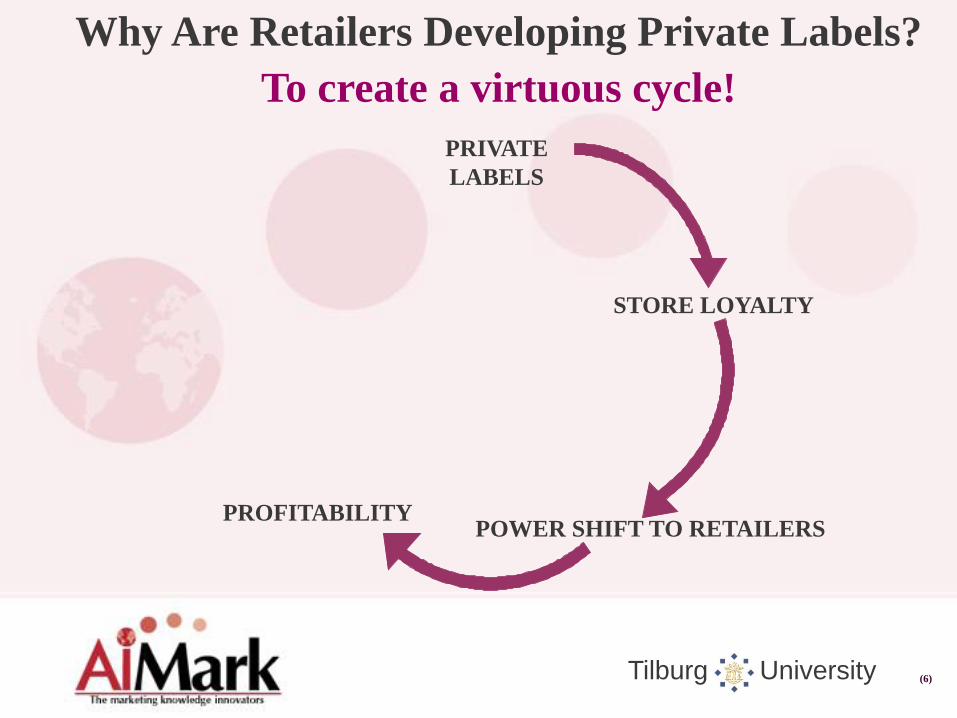
Why Are Retailers Developing Private Labels?
To create a virtuous cycle!
PRIVATE
LABELS
STORE LOYALTY
POWER SHIFT TO RETAILERS PROFITABILITY
Tilburg University (7)
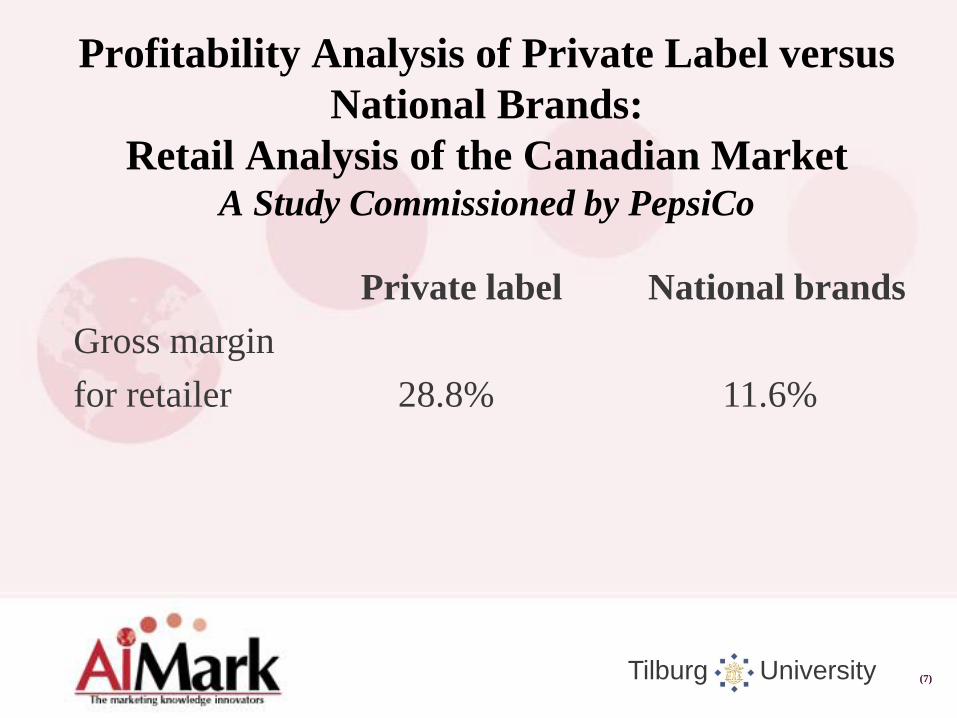
Profitability Analysis of Private Label versus
National Brands:
Retail Analysis of the Canadian Market A Study Commissioned by PepsiCo
Private label National brands
Gross margin
for retailer 28.8% 11.6%
Tilburg University (8)
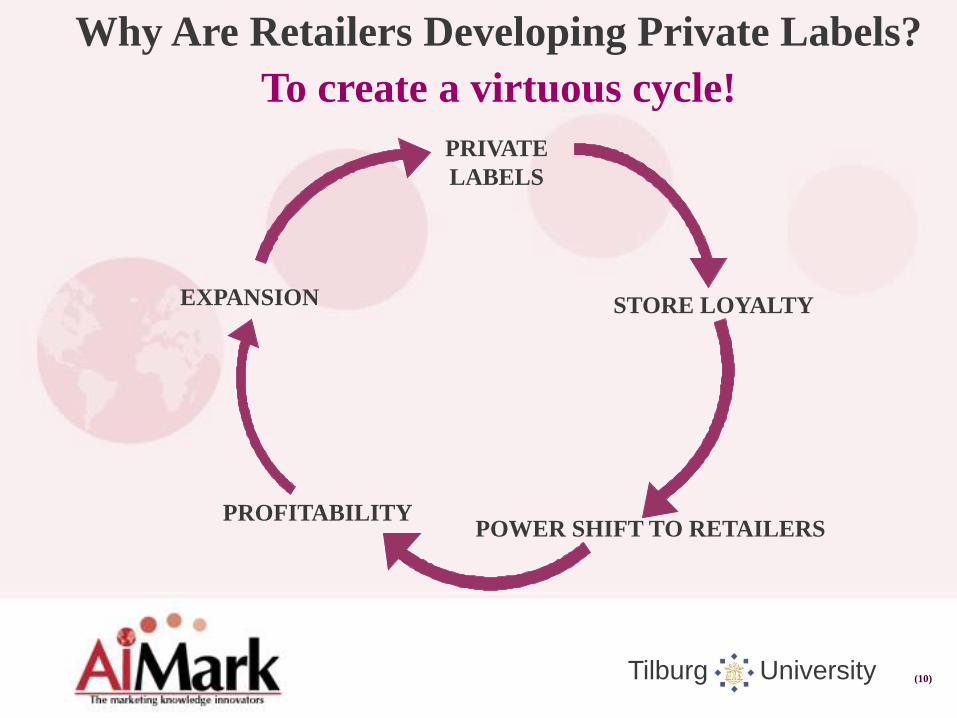
Why Are Retailers Developing Private Labels?
To create a virtuous cycle!
PRIVATE
LABELS
STORE LOYALTY
POWER SHIFT TO RETAILERS PROFITABILITY
EXPANSION

Tilburg University (9)
Retailers Are Becoming Global Players, Especially in FMCGs
Top-20 retailers world-wide with at least some FMCG sales
0
5
10
15
20
25
30
35
0 25 50 75 100
FMCG Sales (%)
No. of countries with operations
Wal-Mart
Carrefour
Ahold
Kroger
Metro
Albertson’s Kmart
Tesco Rewe
Costco
Aldi
ITM Enterprises ITO-Yokado
Daiei Jusco Sainsbury
Tengelmann
Auchan
Edeka Safeway (USA)
Tilburg University (10)
Why Are Retailers Developing Private Labels?
To create a virtuous cycle!
PRIVATE
LABELS
STORE LOYALTY
POWER SHIFT TO RETAILERS PROFITABILITY
EXPANSION
Tilburg University (11)
PL Geneva-04
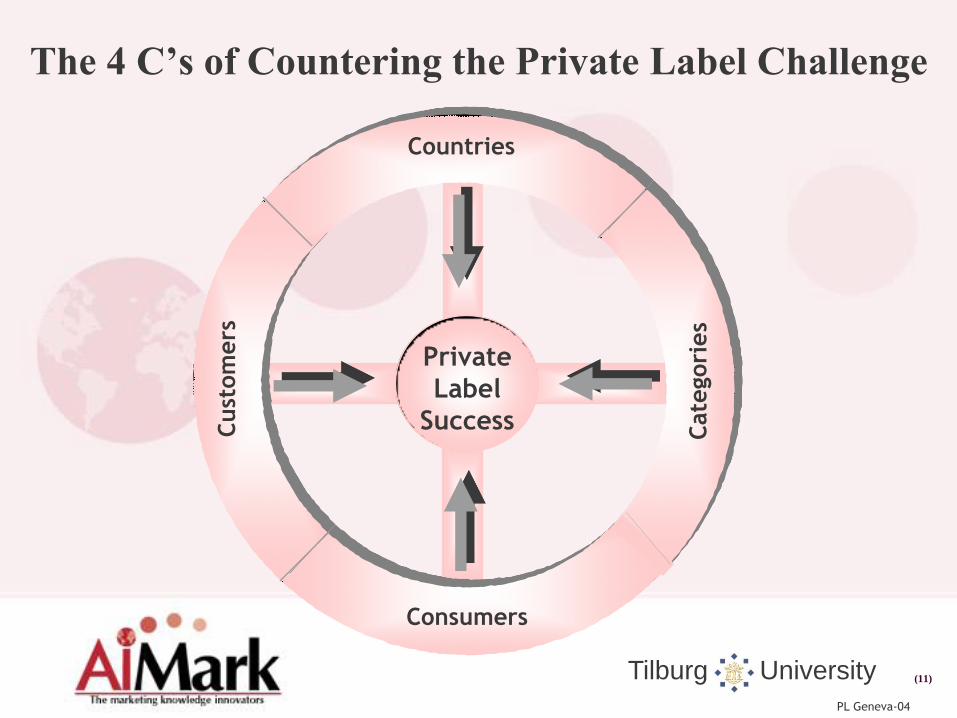
Countries
Consumers
Cust
om
ers
Cate
gori
es
Private
Label
Success
The 4 C’s of Countering the Private Label Challenge

Tilburg University (12)
Business Model: Factors Explaining PL Share and Growth
Countries • National culture
• Socioeconomic
structure
• Trade structure
PL Market Share
/Growth
Consumers • Socio-demographic
profile of PL buyers
• Perceptions of PL
buyers vs. brand buyers
• Store loyalty vs. Brand
loyalty
Customers
• Consolidation/size
• Strategy
• Advertising for PL
• Chain name for PL
• Access to better
products
• High traffic categories
• Margins/profitability
• Sales fundamentals
• Growth of discounters
• EDLP
Categories
Marketing factors
• Pace of innovation
• Advertising intensity
• Promotion intensity
• Price gap
• PL production by brand
manufacturers
• PL-brands package similarity
• PL penetration
Consumer factors
• Involvement
• Performance risk
• Social importance
• Brand trust
• Quality gap Brands-PLs
• Value gap Brands-PLs
• Price-quality inference
• Desire for variety in offering
• Willingness to pay for brands
• Share of budget
Tilburg University (13)
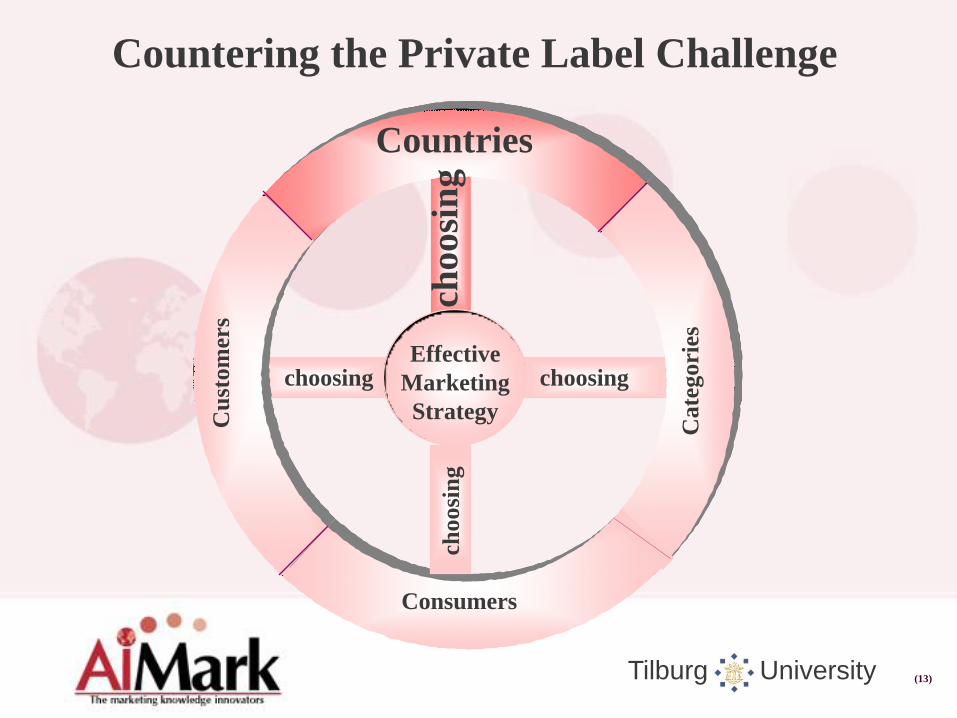
Countering the Private Label Challenge
Countries
choosing choosing
Consumers
cho
osi
ng
ch
oosi
ng
Cu
stom
ers
Cate
gori
es
Effective
Marketing
Strategy
Tilburg University (14)
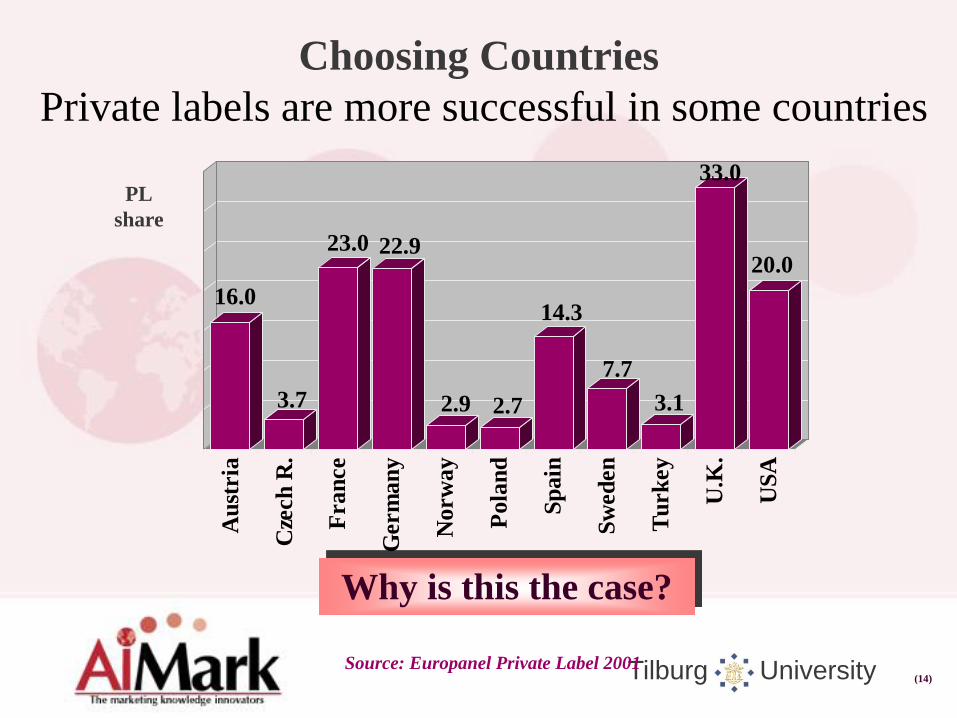
Choosing Countries
Private labels are more successful in some countries
Why is this the case?
Source: Europanel Private Label 2001
16.0
3.7
23.0 22.9
2.9 2.7
14.3
7.7
3.1
33.0
20.0
Au
stria
Cze
ch
R.
Fra
nce
Germ
an
y
No
rw
ay
Po
lan
d
Sp
ain
Sw
ed
en
Tu
rk
ey
U.K
.
US
A
PL
share

Tilburg University (15)
Differences in Private Label Share between Countries
Are Due to Culture, Socioeconomics, and Retail Factors
Low High
Uncert. Avoid.
Source: Own analyses (Private Label share based on volume)
20.0
10.0
18.1
12.1
18.7
11.6
PL
Share (%)
Small Large
Size of country
Low High
Retail concentration

Tilburg University (16)
Countering the Private Label Challenge
Countries
choosing choosing
Consumers
choosi
ng
ch
oosi
ng
Cu
stom
ers
Cate
go
ries
Effective
Marketing
Strategy
Tilburg University (17)
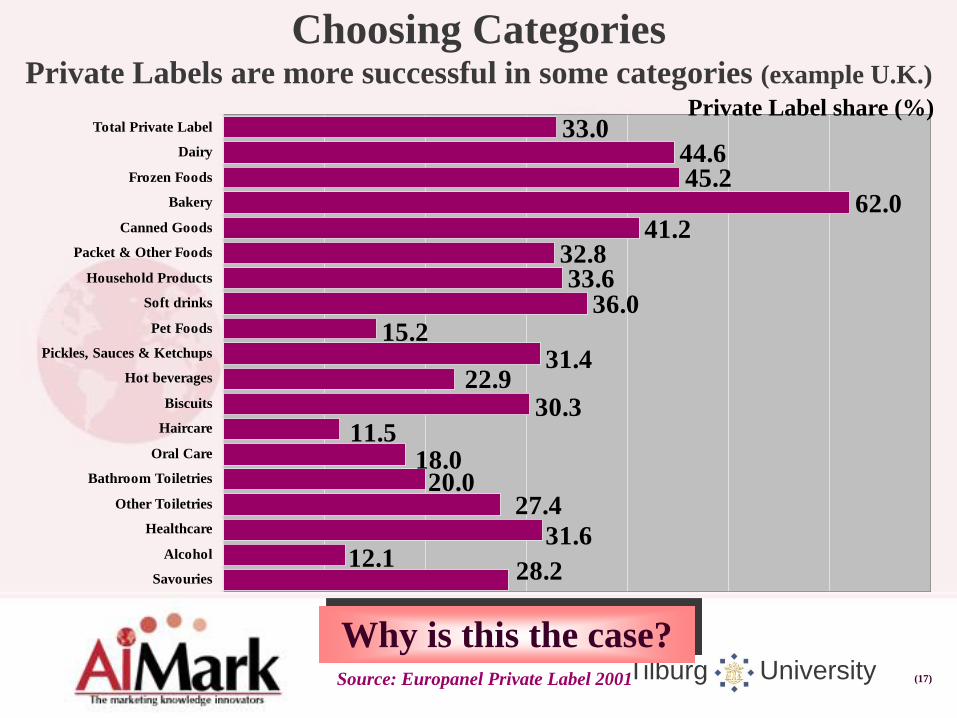
Choosing Categories Private Labels are more successful in some categories (example U.K.)
Source: Europanel Private Label 2001
36.033.6
32.841.2
62.045.244.6
33.0
28.212.1
31.6
27.420.0
18.011.5
30.322.9
31.415.2
Savouries
Alcohol
Healthcare
Other Toiletries
Bathroom Toiletries
Oral Care
Haircare
Biscuits
Hot beverages
Pickles, Sauces & Ketchups
Pet Foods
Soft drinks
Household Products
Packet & Other Foods
Canned Goods
Bakery
Frozen Foods
Dairy
Total Private Label
Private Label share (%)
Why is this the case?
Tilburg University (18)
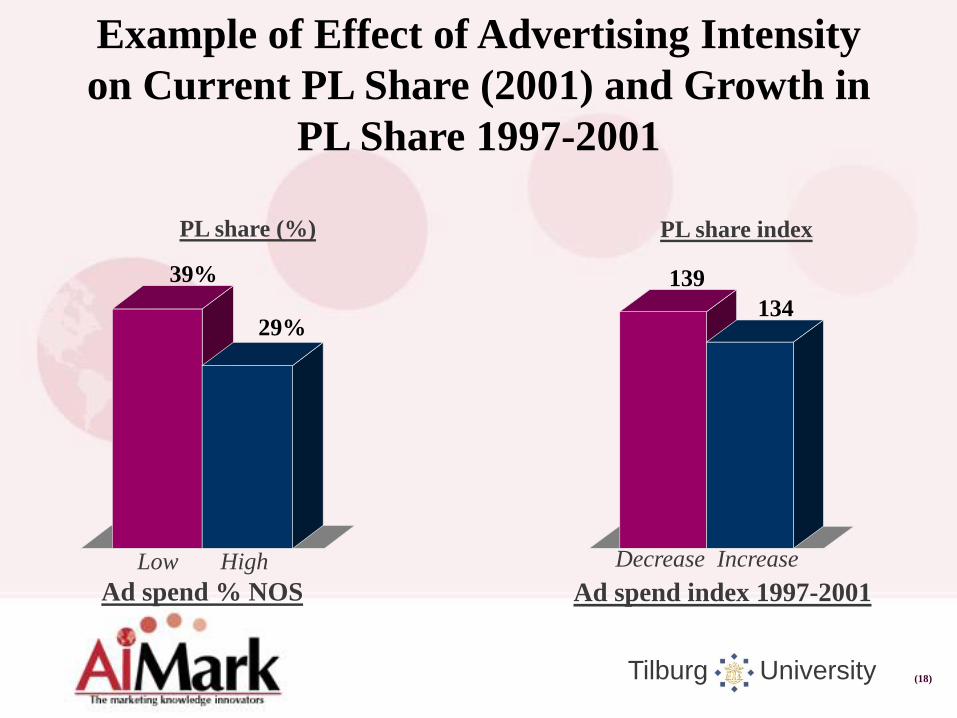
Example of Effect of Advertising Intensity
on Current PL Share (2001) and Growth in
PL Share 1997-2001
39%
29%
139
134
PL share (%)
Decrease Increase
Ad spend index 1997-2001
PL share index
Low High
Ad spend % NOS
Tilburg University (19)
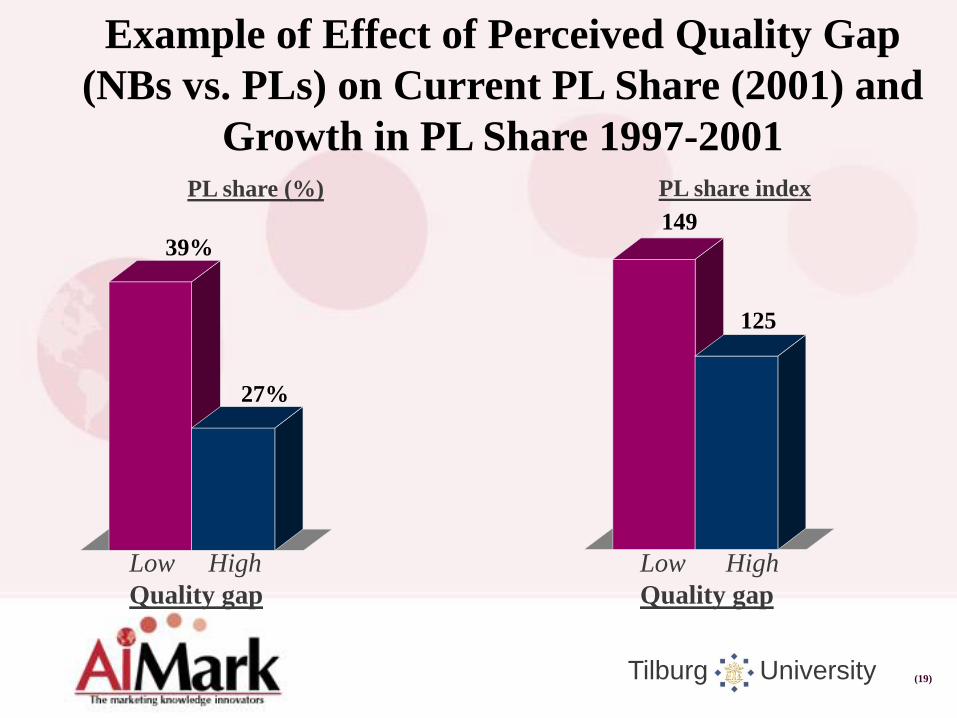
Example of Effect of Perceived Quality Gap
(NBs vs. PLs) on Current PL Share (2001) and
Growth in PL Share 1997-2001
39%
27%
149
125
PL share (%) PL share index
Low High
Quality gap
Low High
Quality gap
Tilburg University (20)
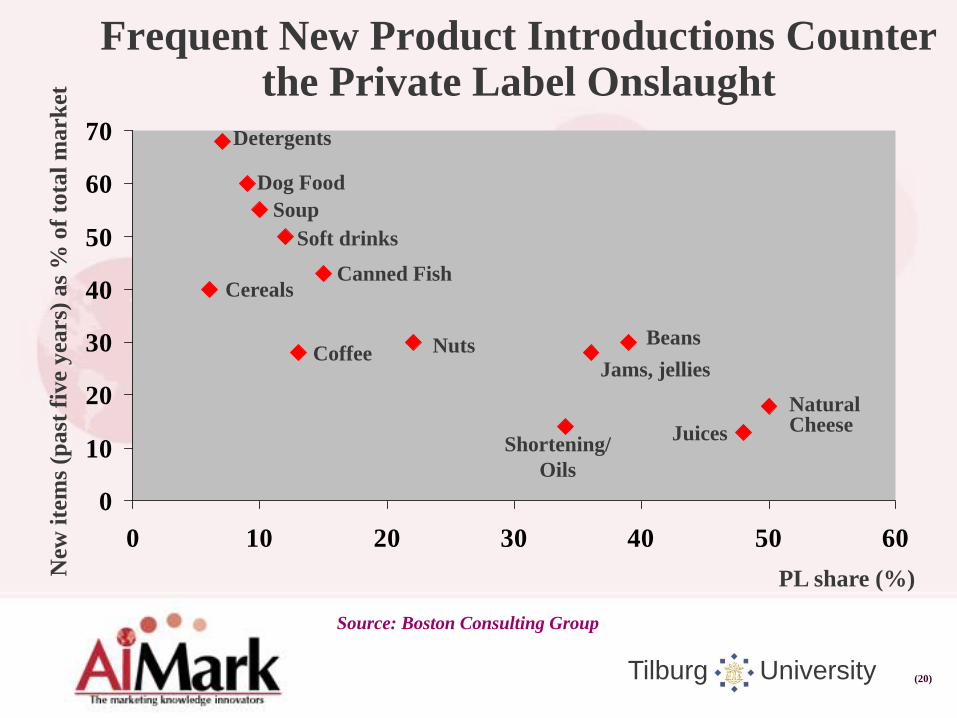
Frequent New Product Introductions Counter the Private Label Onslaught
Source: Boston Consulting Group
0
10
20
30
40
50
60
70
0 10 20 30 40 50 60
Detergents
Dog Food
Soup
Soft drinks
Cereals Canned Fish
Coffee Nuts
Jams, jellies
Shortening/
Oils
Beans
Natural Cheese Juices
New
ite
ms
(past
fiv
e yea
rs)
as
% o
f to
tal
mark
et
PL share (%)

Tilburg University (21)
Countering the Private Label Challenge
Countries
choosing choosing
Consumers
choosi
ng
ch
oo
sin
g
Cu
stom
ers
Cate
gori
es
Effective
Marketing
Strategy
Tilburg University (22)
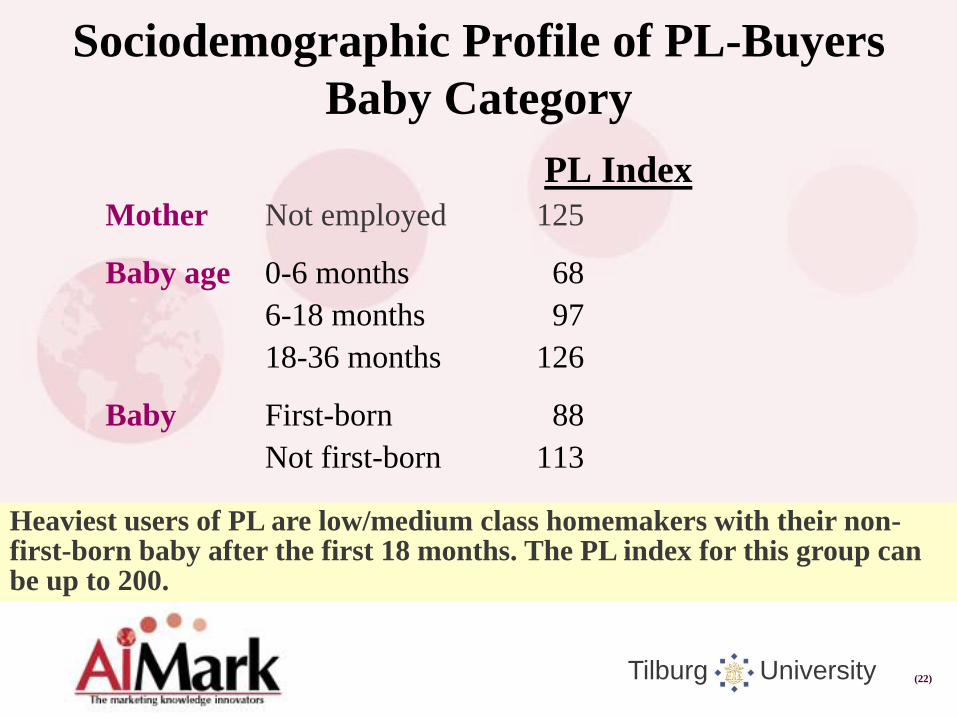
Sociodemographic Profile of PL-Buyers
Baby Category
PL Index
Mother Not employed 125
Baby age 0-6 months 68
6-18 months 97
18-36 months 126
Baby First-born 88
Not first-born 113
Social class Medium/low 110 Heaviest users of PL are low/medium class homemakers with their non-first-born baby after the first 18 months. The PL index for this group can be up to 200.

Tilburg University (23)
Category Perceptions of PL-Buyers vs. NB-Buyers
in a Category in Country A
On several key aspects, PL-buyers differ in their category perceptions from NB-buyers. PL-buyers are characterized by (+ indicates generally large difference):
Smaller quality gap between NBs and PLs (+)
Less positive (typically negative!) value of NBs vis-à-vis PLs (+)
Less quality variation in the category (also between NBs!) (+)
Weaker price-quality association: you don’t get what you pay for! (+)
Lower category involvement
Lower performance risk
More convinced that PLs are produced by brand manufacturers
Lower willingness to pay more for a NB compared to a PL
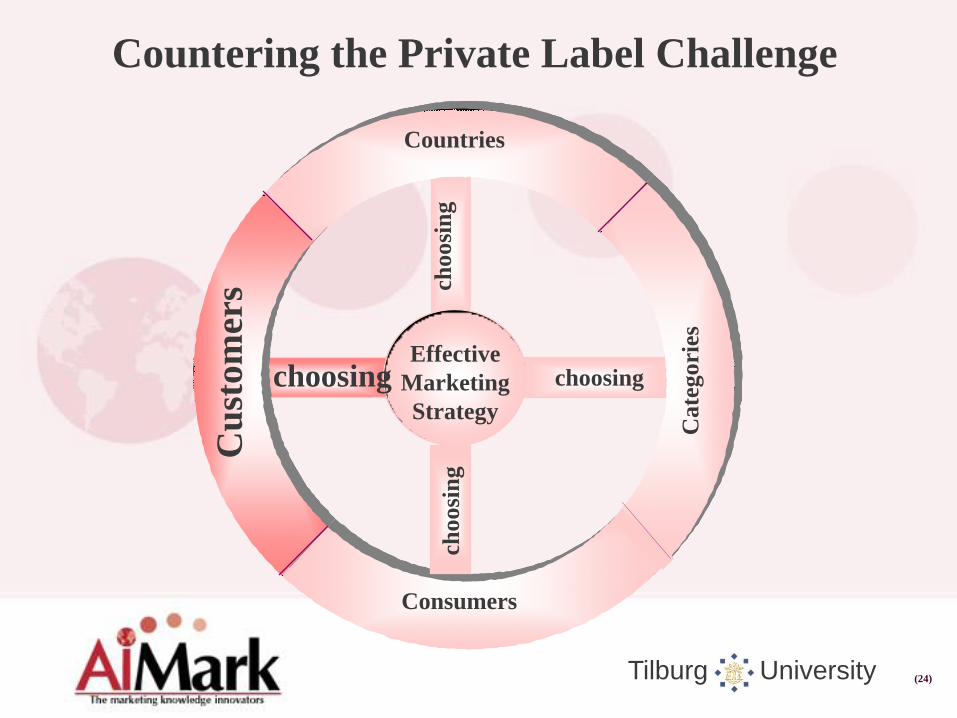
Tilburg University (24)
Countering the Private Label Challenge
Countries
choosing choosing
Consumers
choosi
ng
ch
oosi
ng
Cu
sto
mer
s
Cate
gori
es
Effective
Marketing
Strategy

Tilburg University (25)
Individual Retailers excl Discounters
FMCG Size 2001 vs Local FMCG PLShare 2001
0
2000
4000
6000
8000
10000
12000
14000
16000
18000
0 5 10 15 20 25 30 35 40 45
PL FMCG Share
FM
CG
Sale
s
The Bigger the Retailer, the Larger the PL Share Risk as retailers expand across countries
France Germany Spain UK
r = .54
Tilburg University (26)
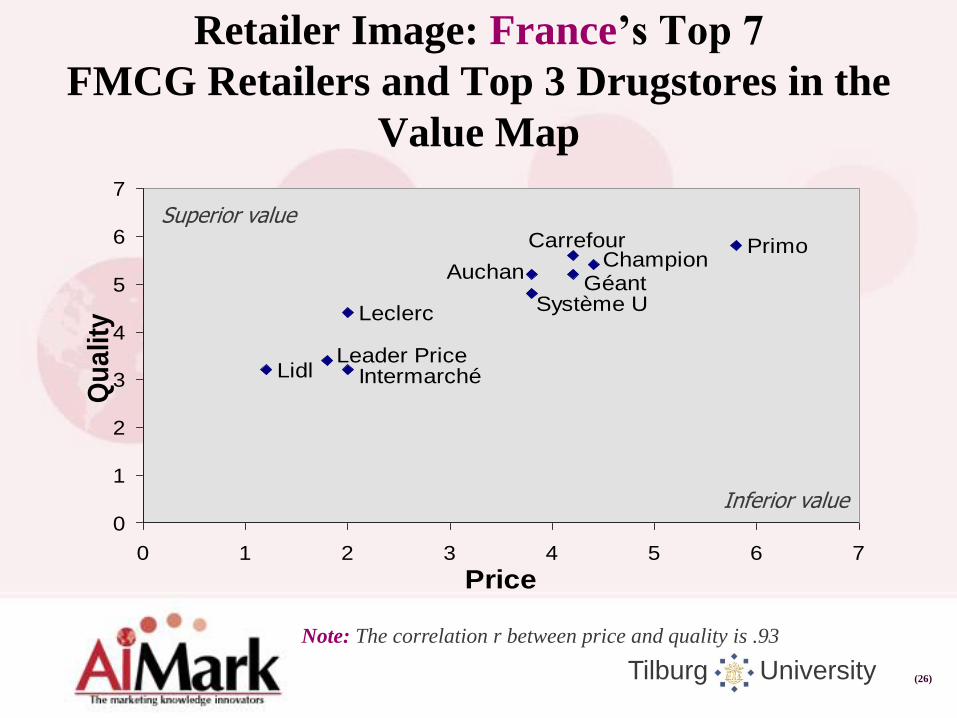
Retailer Image: France’s Top 7
FMCG Retailers and Top 3 Drugstores in the
Value Map
Lidl IntermarchéLeader Price
Leclerc Système U
AuchanGéant
ChampionCarrefour Primo
0
1
2
3
4
5
6
7
0 1 2 3 4 5 6 7
Price
Qu
ality
Superior value
Inferior value
Note: The correlation r between price and quality is .93
Tilburg University (27)
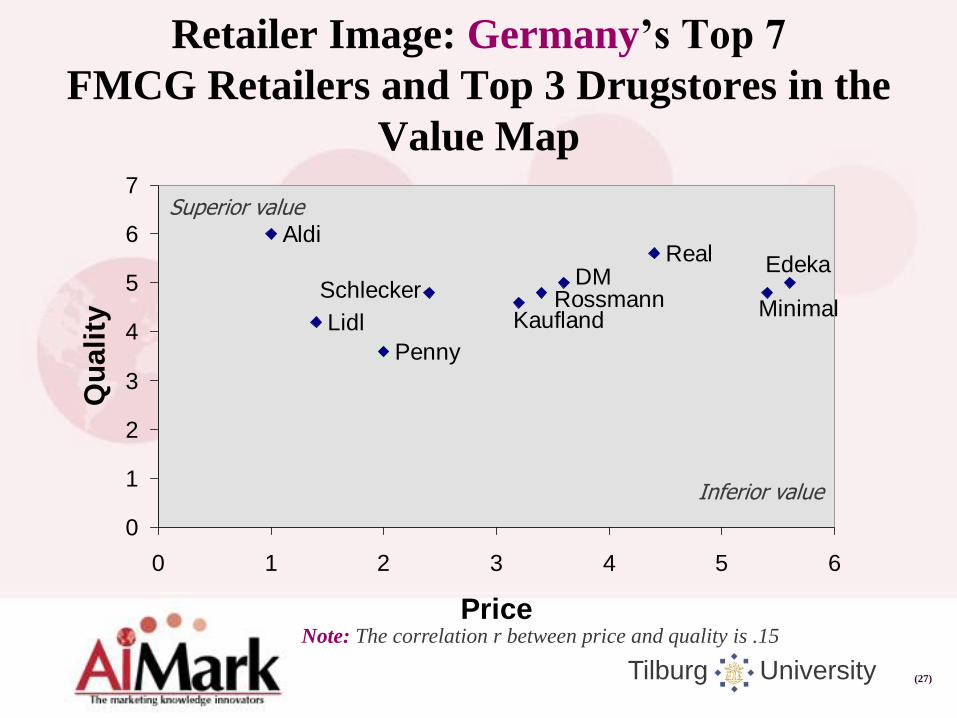
Retailer Image: Germany’s Top 7
FMCG Retailers and Top 3 Drugstores in the
Value Map
Minimal
EdekaRealDM
KauflandRossmannSchlecker
Penny
Lidl
Aldi
0
1
2
3
4
5
6
7
0 1 2 3 4 5 6
Price
Qu
ali
ty
Superior value
Inferior value
Note: The correlation r between price and quality is .15
Tilburg University (28)
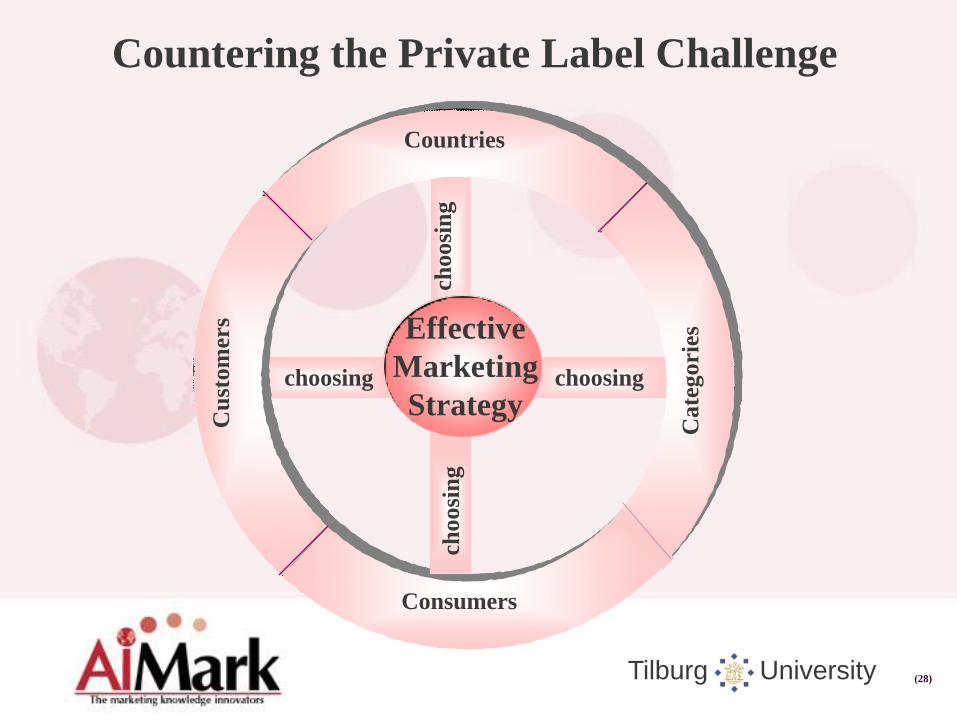
Countering the Private Label Challenge
Countries
choosing choosing
Consumers
choosi
ng
ch
oosi
ng
Cu
stom
ers
Cate
gori
es Effective
Marketing
Strategy

Tilburg University (29)
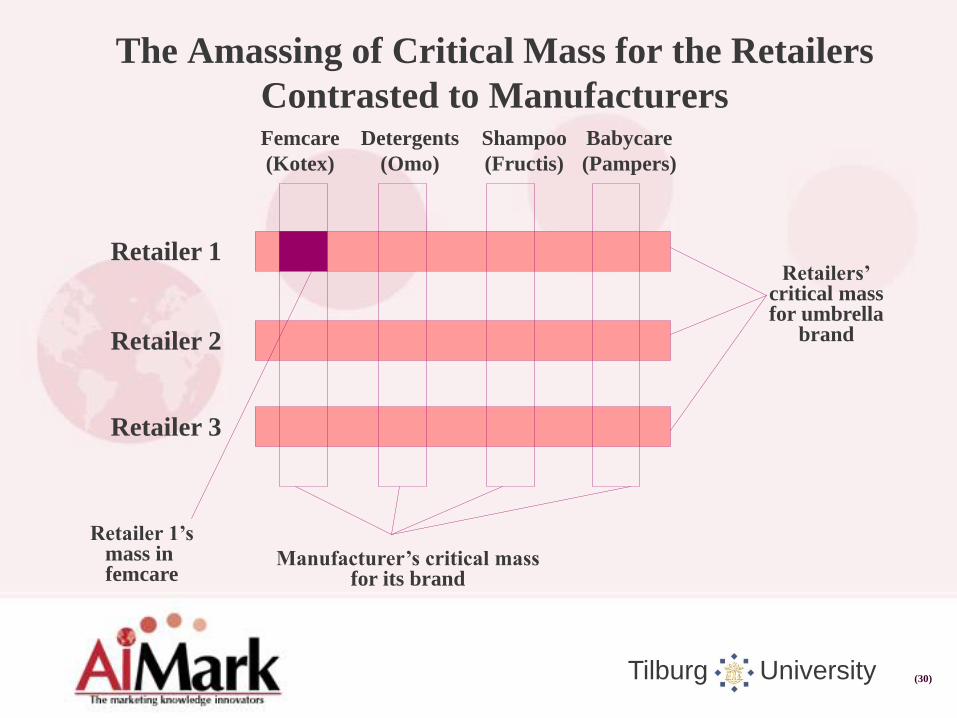
The Manufacturer Holds Some
Trump Cards Too
The retailer cannot:
Always obtain necessary critical mass in a category
Tilburg University (30)
The Amassing of Critical Mass for the Retailers
Contrasted to Manufacturers
Retailer 1
Femcare
(Kotex)
Detergents
(Omo)
Shampoo
(Fructis)
Babycare
(Pampers)
Retailer 2
Retailer 3
Retailer 1’s mass in femcare
Manufacturer’s critical mass for its brand
Retailers’ critical mass for umbrella
brand
Tilburg University (31)
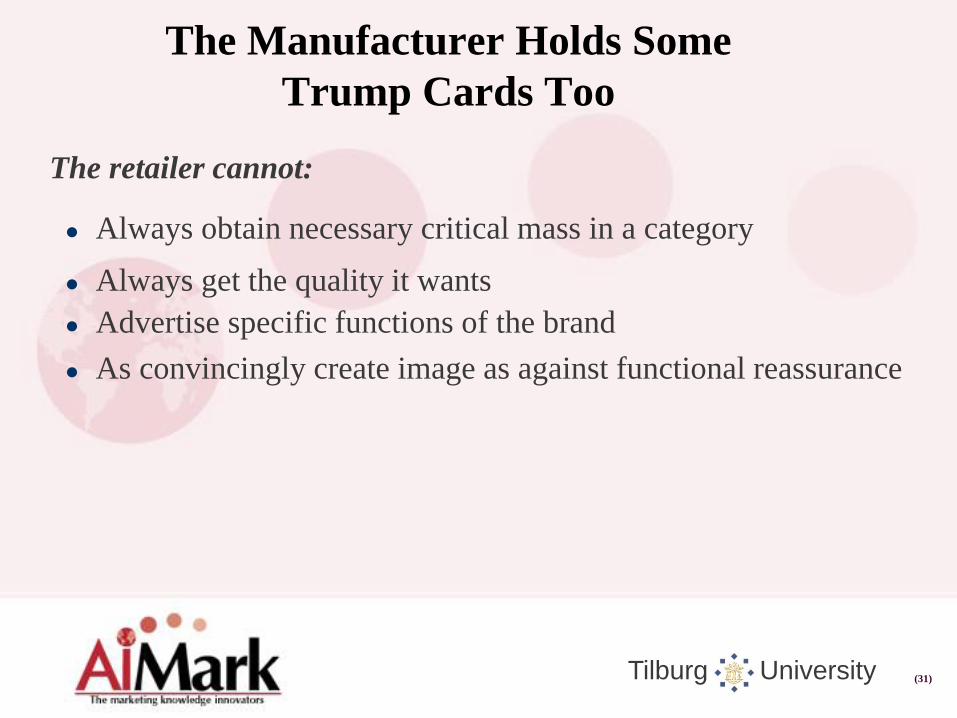
The Manufacturer Holds Some
Trump Cards Too
The retailer cannot:
Always obtain necessary critical mass in a category
Always get the quality it wants
Advertise specific functions of the brand
As convincingly create image as against functional reassurance
Tilburg University (32)
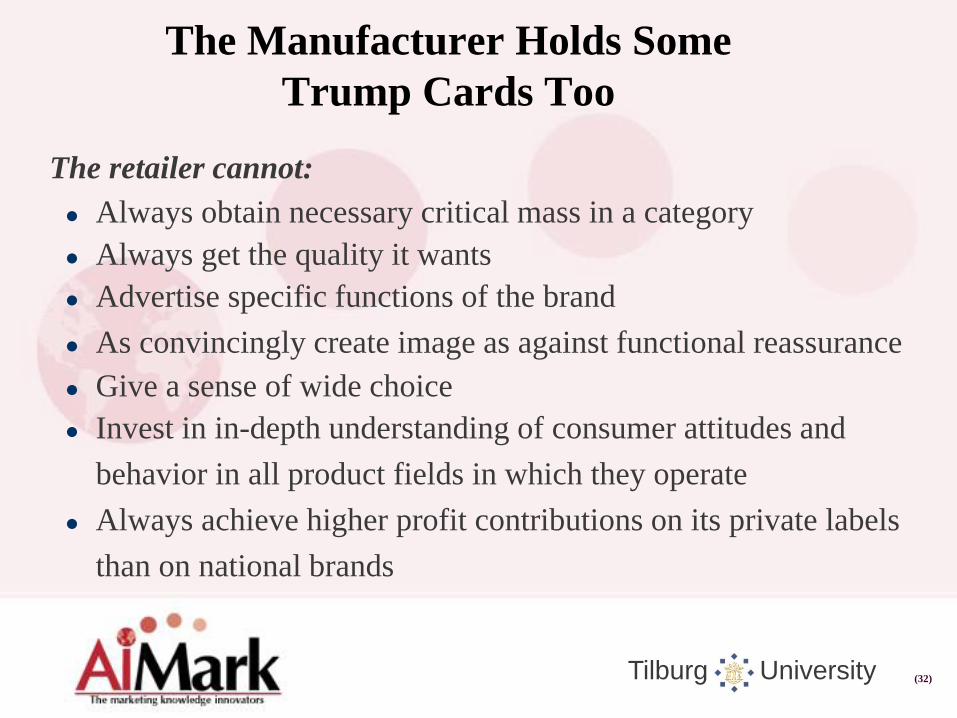
The Manufacturer Holds Some
Trump Cards Too
The retailer cannot:
Always obtain necessary critical mass in a category
Always get the quality it wants
Advertise specific functions of the brand
As convincingly create image as against functional reassurance
Give a sense of wide choice
Invest in in-depth understanding of consumer attitudes and
behavior in all product fields in which they operate
Always achieve higher profit contributions on its private labels
than on national brands
Tilburg University (33)
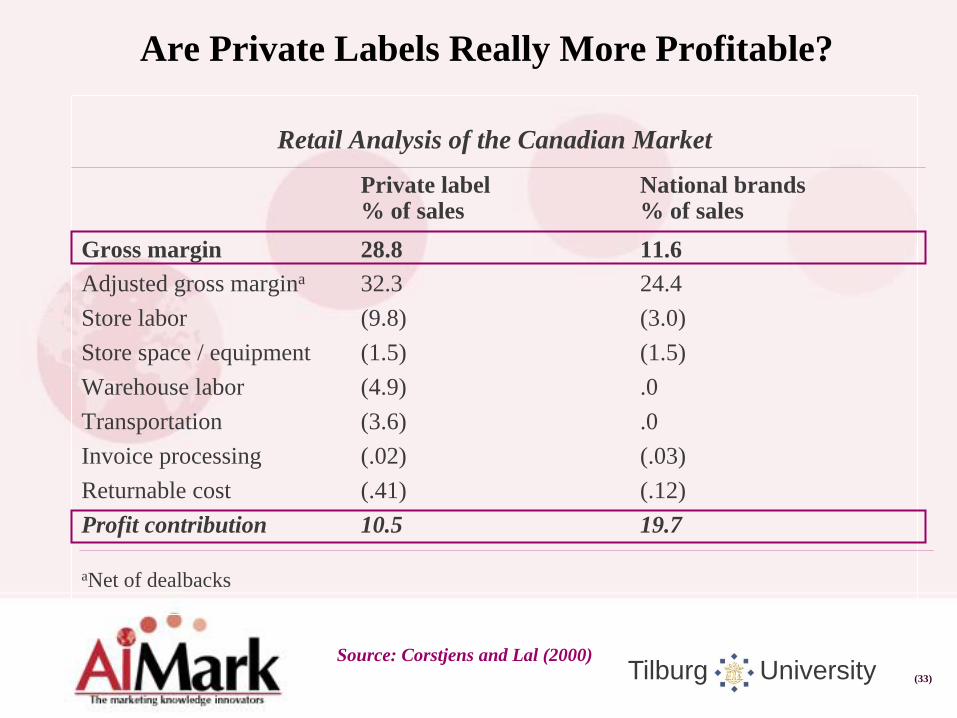
Are Private Labels Really More Profitable?
Retail Analysis of the Canadian Market
Private label National brands % of sales % of sales
Gross margin 28.8 11.6
Adjusted gross margina 32.3 24.4
Store labor (9.8) (3.0)
Store space / equipment (1.5) (1.5)
Warehouse labor (4.9) .0
Transportation (3.6) .0
Invoice processing (.02) (.03)
Returnable cost (.41) (.12)
Profit contribution 10.5 19.7
aNet of dealbacks
Source: Corstjens and Lal (2000)
Tilburg University (34)
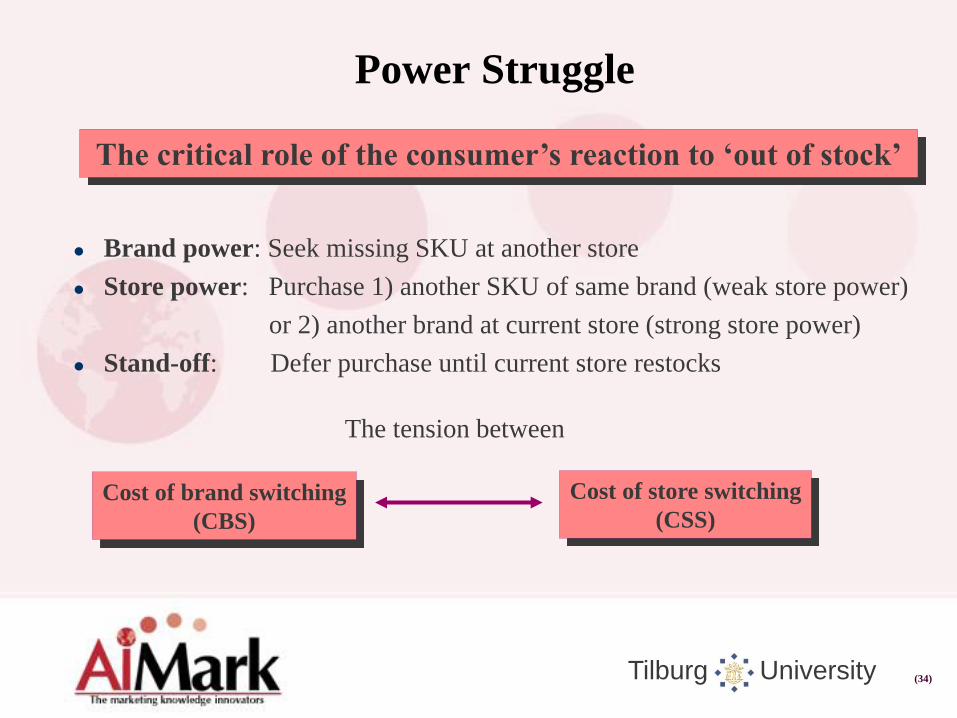
Brand power: Seek missing SKU at another store
Store power: Purchase 1) another SKU of same brand (weak store power)
or 2) another brand at current store (strong store power)
Stand-off: Defer purchase until current store restocks
Power Struggle
The critical role of the consumer’s reaction to ‘out of stock’
Cost of brand switching
(CBS)
Cost of store switching
(CSS)
The tension between
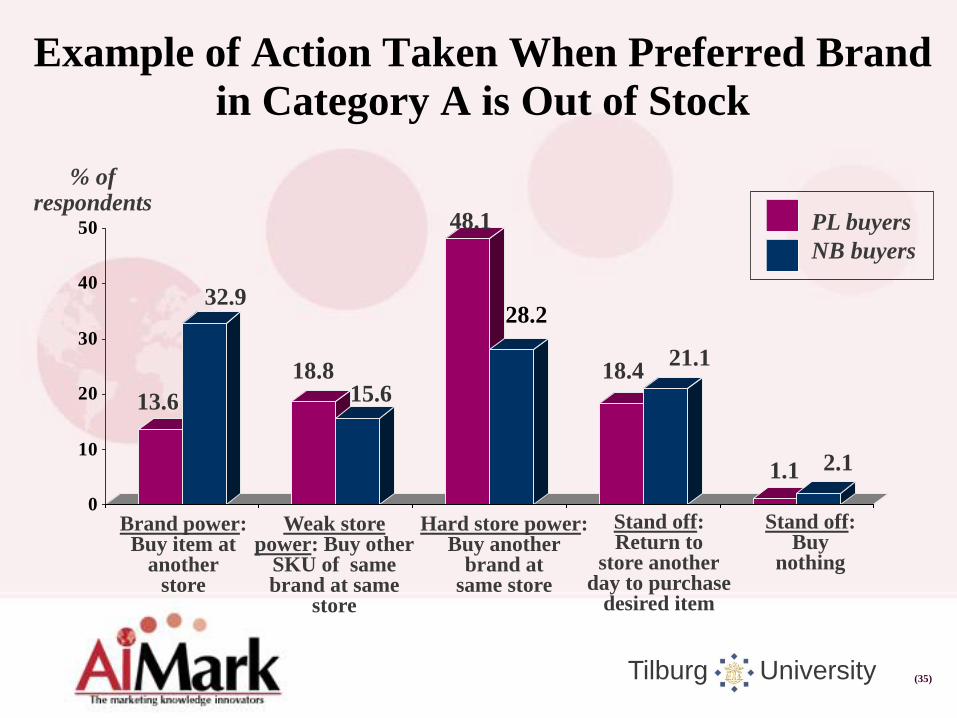
Tilburg University (35)
Example of Action Taken When Preferred Brand
in Category A is Out of Stock
13.6
32.9
18.815.6
48.1
18.421.1
1.1 2.1
0
10
20
30
40
50
28.2
% of respondents
Brand power: Buy item at
another store
Weak store power: Buy other
SKU of same brand at same
store
Hard store power: Buy another
brand at same store
Stand off: Return to
store another day to purchase
desired item
Stand off: Buy
nothing
PL buyers
NB buyers

Tilburg University (36)
These Scenarios Underline the Importance of
Increasing Cost of Brand Switching through...
Building/maintaining brand loyalty
Innovation and differentiation
Communication
Managing the price gap
In-depth knowledge of the consumers
Actions against patent infringement and copy-catting
Can you also team up with some customers?
Tilburg University (37)
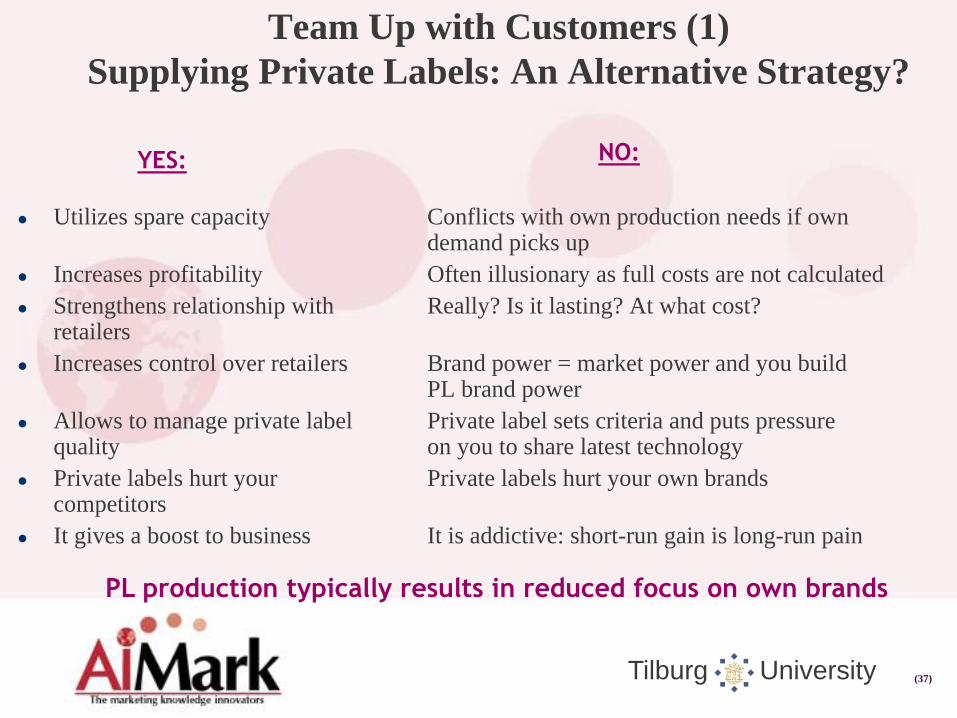
Team Up with Customers (1)
Supplying Private Labels: An Alternative Strategy?
Utilizes spare capacity Conflicts with own production needs if own demand picks up
Increases profitability Often illusionary as full costs are not calculated
Strengthens relationship with Really? Is it lasting? At what cost? retailers
Increases control over retailers Brand power = market power and you build PL brand power
Allows to manage private label Private label sets criteria and puts pressure quality on you to share latest technology
Private labels hurt your Private labels hurt your own brands competitors
It gives a boost to business It is addictive: short-run gain is long-run pain
YES: NO:
PL production typically results in reduced focus on own brands

Tilburg University (38)
Team Up with Customers (2):
Inform them: Is an emphasis on PLs more profitable?
To generate high margins, Retailer PL strategy has to be consistent with overall business model (e.g ALDI) ?
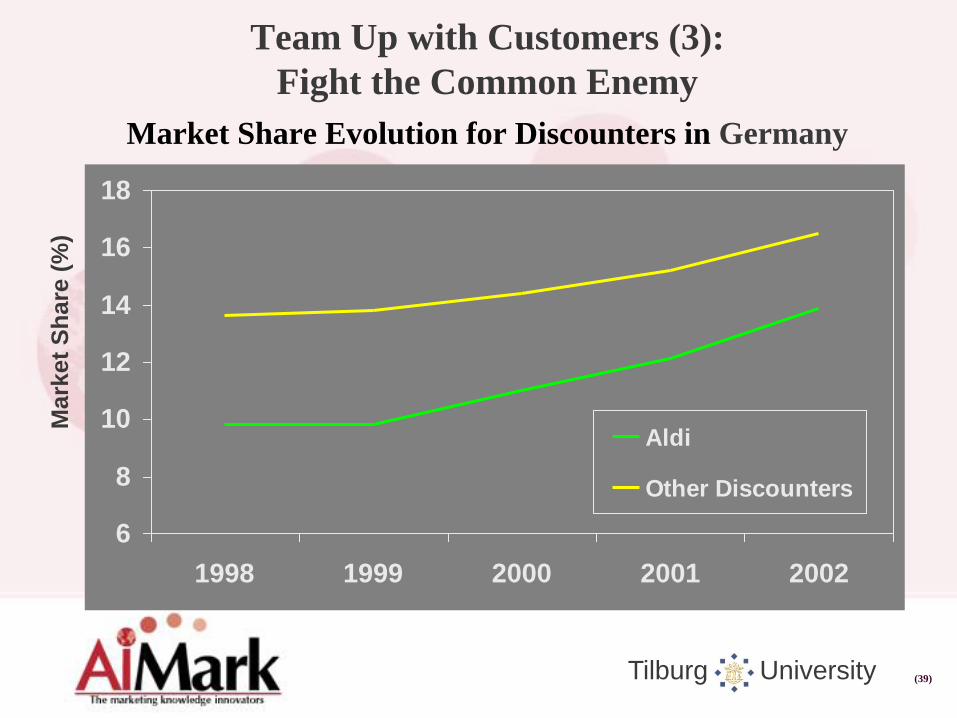
Tilburg University (39)
Team Up with Customers (3):
Fight the Common Enemy
Market Share Evolution for Discounters in Germany
6
8
10
12
14
16
18
1998 1999 2000 2001 2002
Aldi
Other Discounters
Mark
et
Sh
are
(%
)
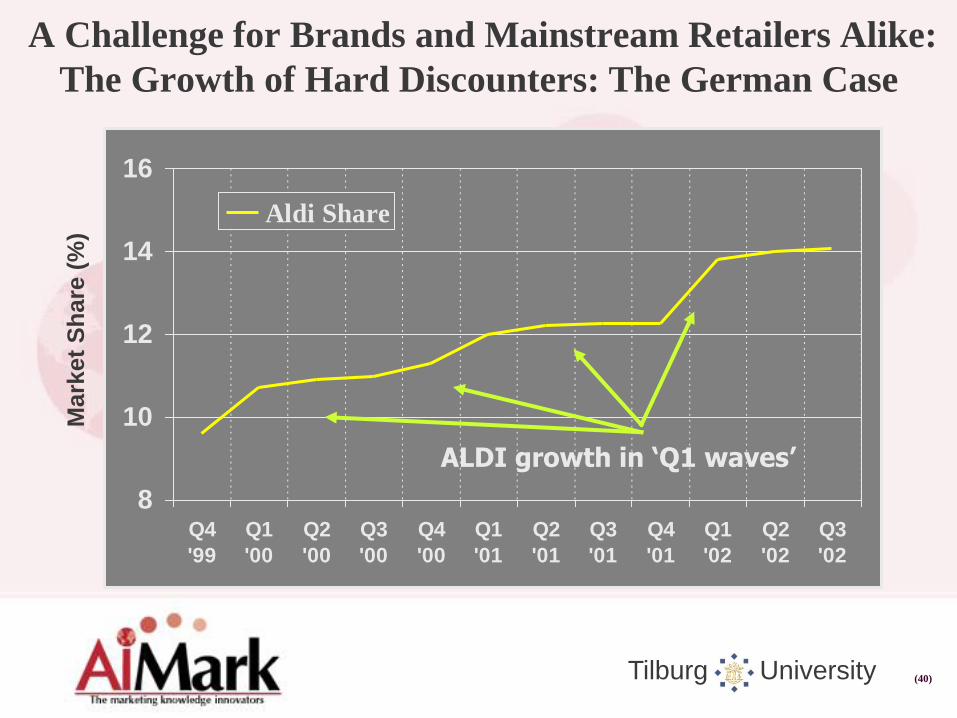
Tilburg University (40)
8
10
12
14
16
Q4
'99
Q1
'00
Q2
'00
Q3
'00
Q4
'00
Q1
'01
Q2
'01
Q3
'01
Q4
'01
Q1
'02
Q2
'02
Q3
'02
Aldi Share
A Challenge for Brands and Mainstream Retailers Alike:
The Growth of Hard Discounters: The German Case
ALDI growth in ‘Q1 waves’
Mark
et
Sh
are
(%
)