undergraduate program: bs in construction … & construction management department undergraduate...
TRANSCRIPT

Manufacturing & Construction Management Department
UNDERGRADUATE PROGRAM: BS in Construction Management
Assessment Report
Academic Year 2016-17

2
Overview Department: __Manufacturing & Construction Management ________________________________
Report Preparer: Prof. Talat Salama, PhD, PE _
Program Name and Level: B.S. Construction Management _
Program Assessment Question Response
1) URL: Provide the URL where the learning outcomes (LO) can be viewed.
http://www.ccsu.edu/mcm/constructionManagementBS.html
2) LO Changes: Identify any changes to the LO and briefly describe why they were changed (e.g., LO more discrete, LO aligned with findings)
No changes to the LO since last report. The required number of credit hours for the program was modified from 130 to 120.
3) Strengths: What about your assessment process is working well?
The Associated Constructor (AC) exam results, of the American Institute of Constructors (AIC), provide national benchmarking information. Interviews by the Industry Advisory Board (IAB) provide a flexible data source.
4) Improvements: What about your assessment process needs to improve? (a brief summary of changes to
assessment plan should be reported here)
An alumni survey would be useful.
For Each Learning Outcome (LO) complete questions 5, 6 and 7 (you may add more rows if you have more than 5 LOs): LO #1) Students will have basic knowledge of, and be able to apply, the concepts of estimating, scheduling, superintendency and project management.____________________________________________________________________________________
5) Assessment Instruments: For each LO, what is the source of the data/evidence, other than GPA, that is used to assess the stated outcomes? (e.g., capstone course,
portfolio review and scoring rubric, licensure examination, , etc.)
1. AIC Associate Constructor Exam – All students will take the exam in the semester they are scheduled to graduate. This exam is offered every year in November and April. 2. IAB Exit Interview – The Industrial Advisory Board (IAB) will conduct exit interviews with graduating students during the Fall and Spring semester of each year. These interviews will typically occur during the reading days at the end of the semester. Student learning is self-reported. 3. Student Course Evaluations – Each instructor will conduct course evaluations at the end of each semester. Students will complete the evaluations and turn them in to the Department Secretary, Department Chair or DEC Chair directly. Faculty members will not review the course evaluations prior to submission of final grades. The results will be used to evaluate faculty classroom performance.
6) Interpretation: Who interprets the evidence? (e.g., faculty, Admn.
assistant, etc.). If this differs by LO, provide information by LO.
All evidence, except the IAB interviews, is interpreted first by the Program Coordinator and then by the program faculty as a whole. The information obtained is then discussed with the IAB. The IAB interviews are interpreted first by the President of the IAB and then are discussed with the IAB and the program faculty.
7) Results: Since the most recent full report, state the conclusion(s)
Conclusion: With regard to the AIC exam, we met our primary goal of 85% of students scoring higher than 50% in 6 of the 6 sub-content areas. We met our secondary goal of 70% of students scoring 70% or higher in one
3
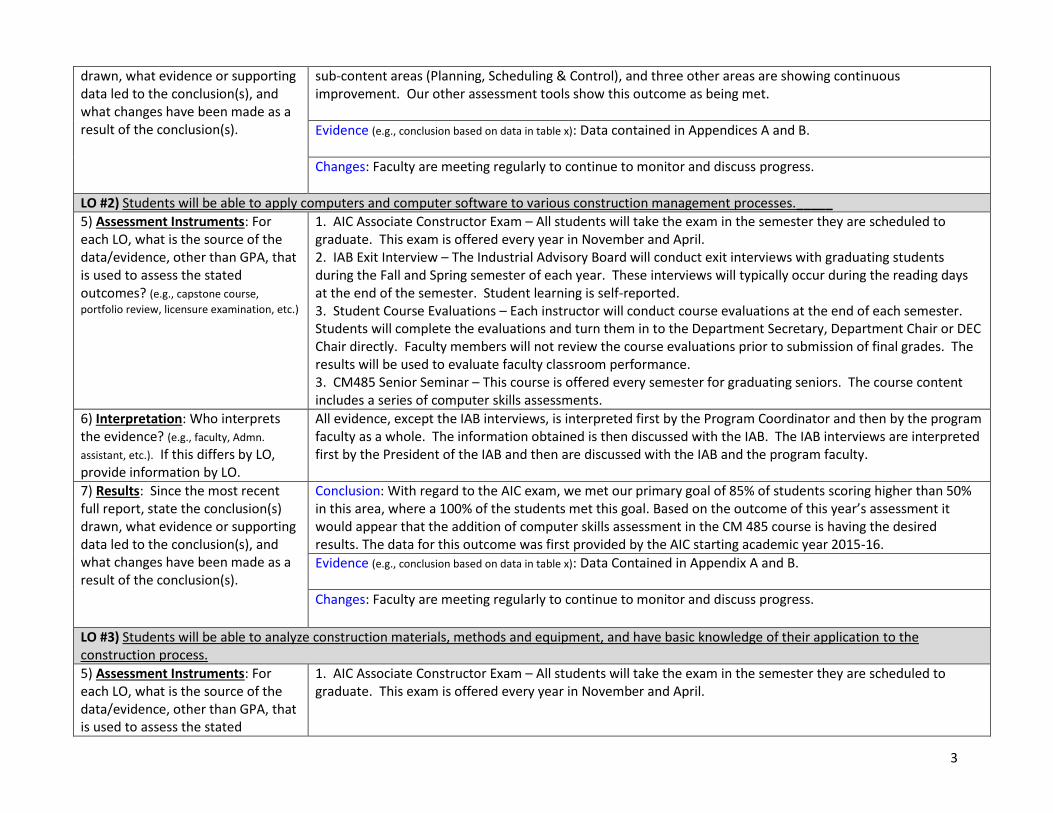
drawn, what evidence or supporting data led to the conclusion(s), and what changes have been made as a result of the conclusion(s).
sub-content areas (Planning, Scheduling & Control), and three other areas are showing continuous improvement. Our other assessment tools show this outcome as being met.
Evidence (e.g., conclusion based on data in table x): Data contained in Appendices A and B.
Changes: Faculty are meeting regularly to continue to monitor and discuss progress.
LO #2) Students will be able to apply computers and computer software to various construction management processes._____
5) Assessment Instruments: For each LO, what is the source of the data/evidence, other than GPA, that is used to assess the stated outcomes? (e.g., capstone course,
portfolio review, licensure examination, etc.)
1. AIC Associate Constructor Exam – All students will take the exam in the semester they are scheduled to graduate. This exam is offered every year in November and April. 2. IAB Exit Interview – The Industrial Advisory Board will conduct exit interviews with graduating students during the Fall and Spring semester of each year. These interviews will typically occur during the reading days at the end of the semester. Student learning is self-reported. 3. Student Course Evaluations – Each instructor will conduct course evaluations at the end of each semester. Students will complete the evaluations and turn them in to the Department Secretary, Department Chair or DEC Chair directly. Faculty members will not review the course evaluations prior to submission of final grades. The results will be used to evaluate faculty classroom performance. 3. CM485 Senior Seminar – This course is offered every semester for graduating seniors. The course content includes a series of computer skills assessments.
6) Interpretation: Who interprets the evidence? (e.g., faculty, Admn.
assistant, etc.). If this differs by LO, provide information by LO.
All evidence, except the IAB interviews, is interpreted first by the Program Coordinator and then by the program faculty as a whole. The information obtained is then discussed with the IAB. The IAB interviews are interpreted first by the President of the IAB and then are discussed with the IAB and the program faculty.
7) Results: Since the most recent full report, state the conclusion(s) drawn, what evidence or supporting data led to the conclusion(s), and what changes have been made as a result of the conclusion(s).
Conclusion: With regard to the AIC exam, we met our primary goal of 85% of students scoring higher than 50% in this area, where a 100% of the students met this goal. Based on the outcome of this year’s assessment it would appear that the addition of computer skills assessment in the CM 485 course is having the desired results. The data for this outcome was first provided by the AIC starting academic year 2015-16.
Evidence (e.g., conclusion based on data in table x): Data Contained in Appendix A and B.
Changes: Faculty are meeting regularly to continue to monitor and discuss progress.
LO #3) Students will be able to analyze construction materials, methods and equipment, and have basic knowledge of their application to the construction process.
5) Assessment Instruments: For each LO, what is the source of the data/evidence, other than GPA, that is used to assess the stated
1. AIC Associate Constructor Exam – All students will take the exam in the semester they are scheduled to graduate. This exam is offered every year in November and April.

4
outcomes? (e.g., capstone course,
portfolio review, licensure examination, etc.) 2. IAB Exit Interview – The Industrial Advisory Board will conduct exit interviews with graduating students during the Fall and Spring semester of each year. These interviews will typically occur during the reading days at the end of the semester. Student learning is self-reported. 3. Student Course Evaluations – Each instructor will conduct course evaluations at the end of each semester. Students will complete the evaluations and turn them in to the Department Secretary, Department Chair or DEC Chair directly. Faculty members will not review the course evaluations prior to submission of final grades. The results will be used to evaluate faculty classroom performance.
6) Interpretation: Who interprets the evidence? (e.g., faculty, Admn.
assistant, etc.). If this differs by LO, provide information by LO.
All evidence, except the IAB interviews, is interpreted first by the Program Coordinator and then by the program faculty as a whole. The information obtained is then discussed with the IAB. The IAB interviews are interpreted first by the President of the IAB and then are discussed with the IAB and the program faculty.
7) Results: Since the most recent full report, state the conclusion(s) drawn, what evidence or supporting data led to the conclusion(s), and what changes have been made as a result of the conclusion(s).
Conclusion: With regard to the AIC exam, we met our primary goal of 85% of students scoring higher than 50% in 2 of the 3 sub-content areas (Materials, Methods & Plan Reading and Construction Geomatics). The Engineering Concepts sub-content area stayed the same as compared to last year. The AIC exam results show that our scores are comparable to the national average in all areas. We believe that fundamental math skills need improvement. The exit interview continues to indicate success in this area.
Evidence (e.g., conclusion based on data in table x): Data contained in Appendices A and B.
Changes: The faculty teaching the courses CM 425 Applied Structural Systems and ET 241 Applied Statics and Strength of Materials met and discussed possible ways to improve this outcome. Among the changes implemented starting last Spring, Spring 2016, was changing the required book for the two courses to an up-to-date book, and having ET 241 (the pre-req course to CM 425) cover the first half of the book, and CM 425 to cover the second half. It is expected that this change will have a positive impact on the AIC 2017-18 test scores. The Program is also conducting a research study of students’ math skills at all levels. The goal of the study is to determine the appropriate point in the curriculum to focus of additional math instruction. This study is currently in its fifth year. We should have sufficient data to complete the analysis at the end of the 2017-2018 academic year.
LO #4)_Students will be able to communicate clearly and effectively.
5) Assessment Instruments: For each LO, what is the source of the data/evidence, other than GPA, that is used to assess the stated outcomes? (e.g., capstone course,
portfolio review, licensure examination, etc.)
1. AIC Associate Constructor Exam – All students will take the exam in the semester they are scheduled to graduate. This exam is offered every year in November and April. 2. IAB Exit Interview – The Industrial Advisory Board will conduct exit interviews with graduating students during the Spring semester of each year. These interviews will typically occur during the reading days at the end of the semester. Student learning is self-reported. 3. Student Course Evaluations – Each instructor will conduct course evaluations at the end of each semester. Students will complete the evaluations and turn them in to the Department Secretary, Department Chair or DEC
5
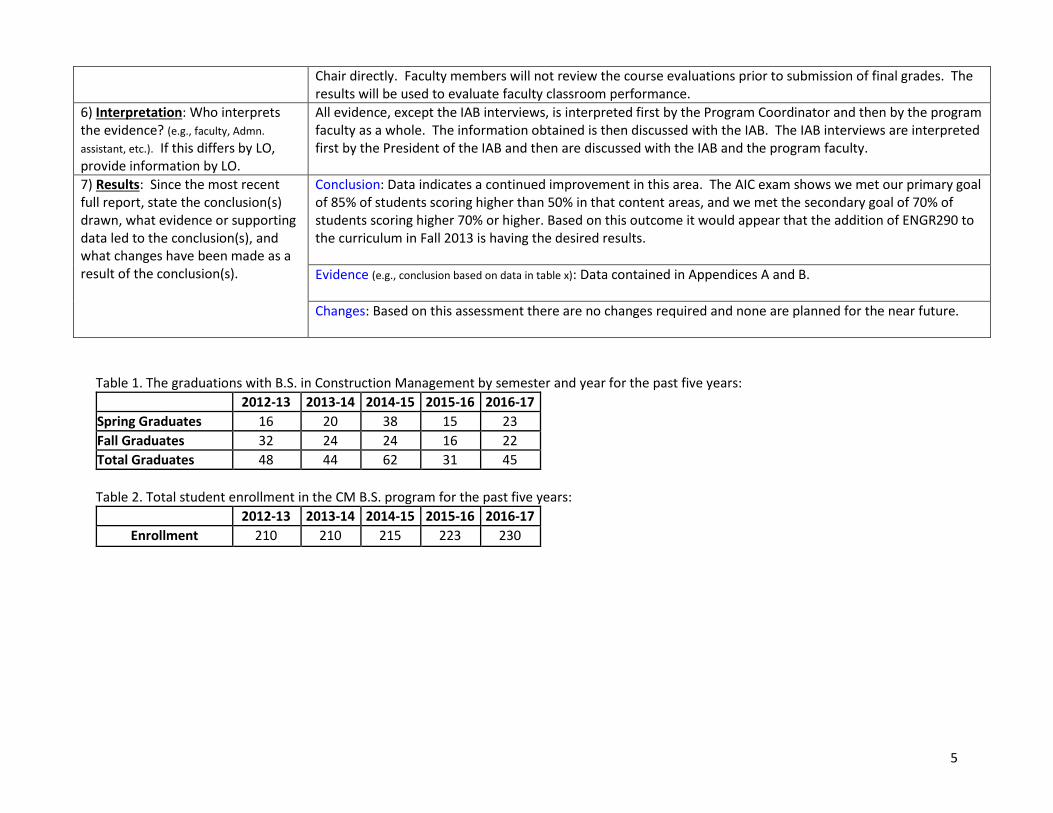
Chair directly. Faculty members will not review the course evaluations prior to submission of final grades. The results will be used to evaluate faculty classroom performance.
6) Interpretation: Who interprets the evidence? (e.g., faculty, Admn.
assistant, etc.). If this differs by LO, provide information by LO.
All evidence, except the IAB interviews, is interpreted first by the Program Coordinator and then by the program faculty as a whole. The information obtained is then discussed with the IAB. The IAB interviews are interpreted first by the President of the IAB and then are discussed with the IAB and the program faculty.
7) Results: Since the most recent full report, state the conclusion(s) drawn, what evidence or supporting data led to the conclusion(s), and what changes have been made as a result of the conclusion(s).
Conclusion: Data indicates a continued improvement in this area. The AIC exam shows we met our primary goal of 85% of students scoring higher than 50% in that content areas, and we met the secondary goal of 70% of students scoring higher 70% or higher. Based on this outcome it would appear that the addition of ENGR290 to the curriculum in Fall 2013 is having the desired results.
Evidence (e.g., conclusion based on data in table x): Data contained in Appendices A and B.
Changes: Based on this assessment there are no changes required and none are planned for the near future.
Table 1. The graduations with B.S. in Construction Management by semester and year for the past five years:
2012-13 2013-14 2014-15 2015-16 2016-17
Spring Graduates 16 20 38 15 23
Fall Graduates 32 24 24 16 22
Total Graduates 48 44 62 31 45
Table 2. Total student enrollment in the CM B.S. program for the past five years:
2012-13 2013-14 2014-15 2015-16 2016-17
Enrollment 210 210 215 223 230
6
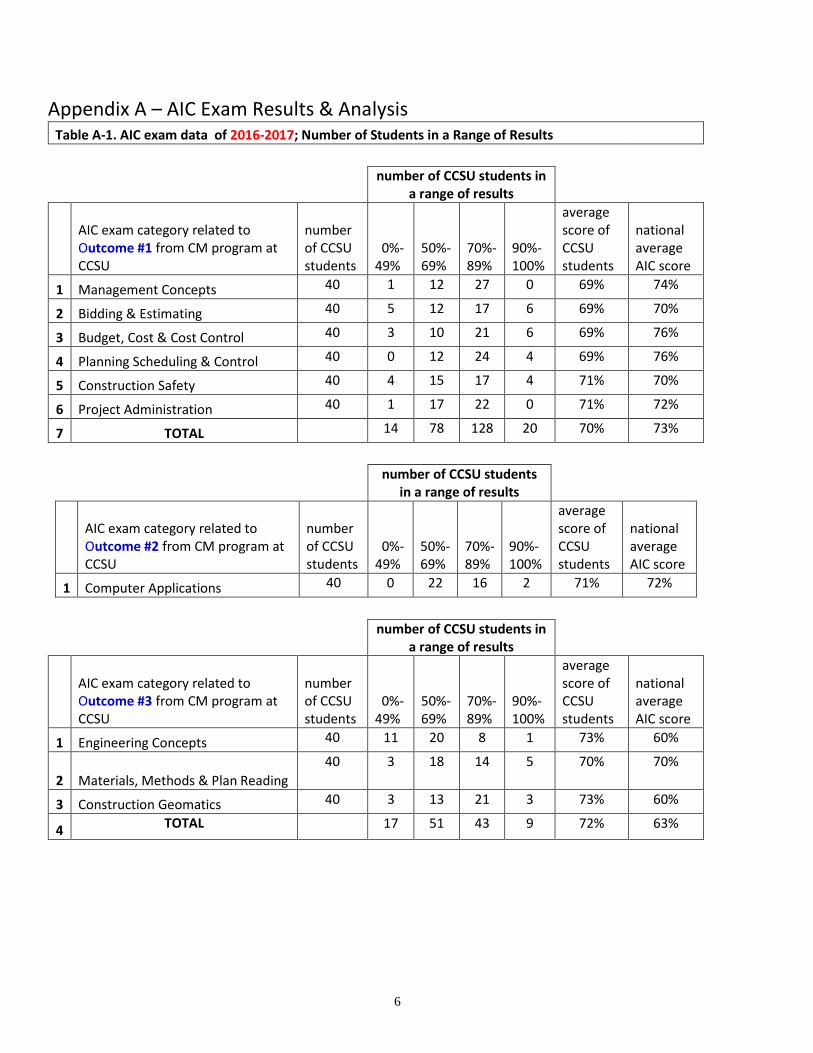
Appendix A – AIC Exam Results & Analysis Table A-1. AIC exam data of 2016-2017; Number of Students in a Range of Results
number of CCSU students in a range of results
AIC exam category related to Outcome #1 from CM program at CCSU
number of CCSU students
0%-49%
50%-69%
70%-89%
90%-100%
average score of CCSU students
national average AIC score
1 Management Concepts 40 1 12 27 0 69% 74%
2 Bidding & Estimating 40 5 12 17 6 69% 70%
3 Budget, Cost & Cost Control 40 3 10 21 6 69% 76%
4 Planning Scheduling & Control 40 0 12 24 4 69% 76%
5 Construction Safety 40 4 15 17 4 71% 70%
6 Project Administration 40 1 17 22 0 71% 72%
7 TOTAL
14 78 128 20 70% 73%
number of CCSU students in a range of results
AIC exam category related to Outcome #2 from CM program at CCSU
number of CCSU students
0%-49%
50%-69%
70%-89%
90%-100%
average score of CCSU students
national average AIC score
1 Computer Applications 40 0 22 16 2 71% 72%
number of CCSU students in a range of results
AIC exam category related to Outcome #3 from CM program at CCSU
number of CCSU students
0%-49%
50%-69%
70%-89%
90%-100%
average score of CCSU students
national average AIC score
1 Engineering Concepts 40 11 20 8 1 73% 60%
2 Materials, Methods & Plan Reading
40 3 18 14 5 70% 70%
3 Construction Geomatics 40 3 13 21 3 73% 60%
4 TOTAL
17 51 43 9 72% 63%

7
number of CCSU students in a range of results
AIC exam category related to Outcome #4 from CM program at CCSU
number of CCSU students
0%-49%
50%-69%
70%-89%
90%-100%
average score of CCSU students
national average AIC score
1 Communication Skills 40 0 12 26 2 39% 27%
Figure A-1. Graphs Showing Number of Students in a Range of Results in the Learning Outcomes of the AC Exam
Outcome #1
Outcome #2
0% 20% 40% 60% 80% 100%
1
2
3
4
5
6
7
0%-49%
50%-69%
70%-89%
90%-100%
0% 20% 40% 60% 80% 100%
1
0%-49%
50%-69%
70%-89%
90%-100%

8
Outcome #3
Outcome #4
0% 20% 40% 60% 80% 100%
1
2
3
4
0%-49%
50%-69%
70%-89%
90%-100%
0% 20% 40% 60% 80% 100%
1
0%-49%
50%-69%
70%-89%
90%-100%

9
Table A-2. Primary Goal Table; Percentage of Students Scoring 50% or higher in AC Exam Topics
2004 2005 2006 2007 2008 2009 2010 2011 2012 2013 2014 2015 2016 2017
AIC exam category related to Outcome #1 from CM program at CCSU
1 Management Concepts 31 100 100 91 96 87 89 81 90 86 88 94 95 98
2 Bidding & Estimating 54 100 90 94 88 94 89 87 80 74 67 75 88 88
3 Budget, Cost & Cost Control
69 86 90 94 58 90 91 85 80 84 85 94 95 93
4 Planning, Scheduling & Control
69 86 100 100 92 100 91 98 87 92 92 90 95 100
5 Construction Safety 62 93 90 97 85 97 98 98 90 89 94 98 98 88
6 Project Administration 92 100 100 100 96 94 98 96 87 97 85 98 100 98
AIC exam category related to Outcome #2 from CM program at CCSU
1 Computer Applications 98 100
AIC exam category related to Outcome #3 from CM program at CCSU
1 Engineering Concepts 62 71 50 79 77 90 89 83 93 58 63 73 73 73
2 Materials, Methods & Plan Reading
92 100 70 100 81 97 95 87 93 84 85 75 93 93
3 Construction Geomatics 31 100 70 91 85 94 80 83 77 76 69 65 95 93
AIC exam category related to Outcome #4 from CM program at CCSU
1 Communication Skills 77 43 90 79 31 74 89 57 90 89 81 100 98 100

10
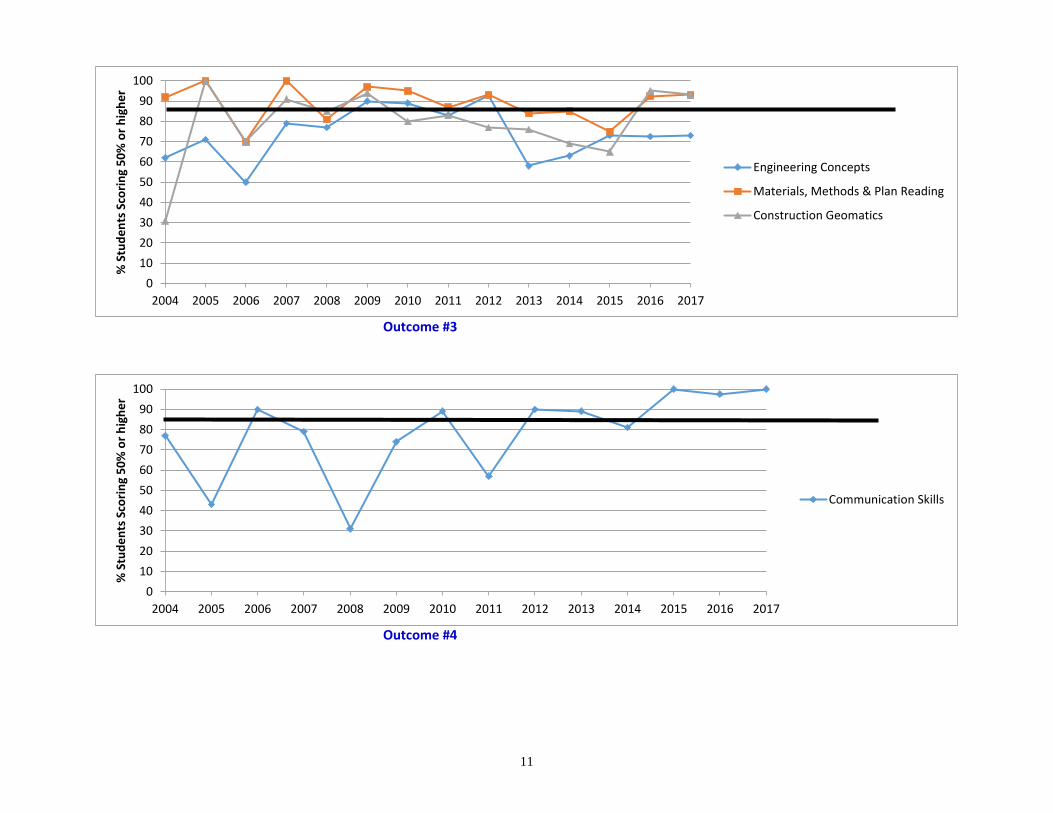
Figure A-2. Primary Goal Graphs; 85% of students scoring 50% or higher in the Learning Outcomes of the AC Exam
Outcome #1
Outcome #2
0
10
20
30
40
50
60
70
80
90
100
2004 2005 2006 2007 2008 2009 2010 2011 2012 2013 2014 2015 2016 2017
% S
tud
en
ts S
cori
ng
50
% o
r h
igh
er
Management Concepts
Bidding & Estimating
Budget, Cost & Cost Control
Planning, Scheduling & Control
Construction Safety
Project Administration
0
10
20
30
40
50
60
70
80
90
100
2013 2014 2015 2016 2017
% S
tud
en
ts S
cori
ng
50
% o
r h
igh
er
Computer Applications
11
Outcome #3
Outcome #4
0
10
20
30
40
50
60
70
80
90
100
2004 2005 2006 2007 2008 2009 2010 2011 2012 2013 2014 2015 2016 2017
% S
tud
en
ts S
cori
ng
50
% o
r h
igh
er
Engineering Concepts
Materials, Methods & Plan Reading
Construction Geomatics
0
10
20
30
40
50
60
70
80
90
100
2004 2005 2006 2007 2008 2009 2010 2011 2012 2013 2014 2015 2016 2017
% S
tud
en
ts S
cori
ng
50
% o
r h
igh
er
Communication Skills

12
Table A-3. Secondary Goal Table; Percentage of Students Scoring 70% or higher in AC Exam Topics
2004 2005 2006 2007 2008 2009 2010 2011 2012 2013 2014 2015 2016 2017
AIC exam category related to Outcome #1 from CM program at CCSU
1 Management Concepts 8 86 90 76 85 74 45 45 57 55 48 25 55 68
2 Bidding & Estimating 15 50 40 56 31 39 27 30 30 16 27 29 40 58
3 Budget, Cost & Cost Control 54 43 40 53 23 52 45 43 43 55 46 48 60 68
4 Planning, Scheduling &
Control 38 29 70 62 27 48 55 47 37 55 54 63 65 70
5 Construction Safety 15 43 40 62 38 65 61 45 57 53 50 73 68 53
6 Project Administration 31 57 40 82 42 65 43 40 40 50 56 60 78 55
AIC exam category related to Outcome #2 from CM program at CCSU
1 Computer Applications 53 45
AIC exam category related to Outcome #3 from
CM program at CCSU
1 Engineering Concepts 8 29 10 41 27 65 41 23 53 31 17 29 28 23
2 Materials, Methods & Plan
Reading 54 36 20 74 31 61 55 28 47 34 25 42 35 48
3 Construction Geomatics 8 50 30 62 62 58 43 32 50 37 44 21 20 60
AIC exam category related to Outcome #4 from
CM program at CCSU
1 Communication Skills 23 21 20 41 19 55 50 19 53 32 27 60 53 70

13
Figure A-3. Secondary Goal Graphs; 70% of students scoring 70% or higher in AC Exam Topics
Outcome 1
Outcome 2
0
10
20
30
40
50
60
70
80
90
100
2004 2005 2006 2007 2008 2009 2010 2011 2012 2013 2014 2015 2016 2017
% S
tud
en
ts S
cori
ng
70
% o
r h
igh
er
Management Concepts
Bidding & Estimating
Budget, Cost & CostControlPlanning, Scheduling &Control
0
10
20
30
40
50
60
70
80
90
100
2013 2014 2015 2016 2017
% S
tud
en
ts S
cori
ng
70
% o
r h
igh
er
Computer Applications

14
Outcome 3
Outcome 4
0
10
20
30
40
50
60
70
80
90
100
2004 2005 2006 2007 2008 2009 2010 2011 2012 2013 2014 2015 2016 2017
% S
tud
en
ts S
cori
ng
70
% o
r h
igh
er
Engineering Concepts
Materials, Methods & Plan Reading
Construction Geomatics
0
10
20
30
40
50
60
70
80
90
100
2004 2005 2006 2007 2008 2009 2010 2011 2012 2013 2014 2015 2016 2017
% S
tud
en
ts S
cori
ng
70
% o
r h
igh
er
Communication Skills

15
Appendix B – IAB Exit Interviews Summary
STUDENT LEARNING
Table B-1. Students Evaluation of Quality of Education Received at CM Program
Student Learning On a scale of 1-4, how well did CCSU
prepare you to:
Rank 4 = exceptional, 3 =
good, 2 = acceptable,
1 = dissatisfied
Total
Respondents Average
Rating
1 2 3 4
1 Perform the duties of an estimator,
scheduler, superintendent and project
manager.
0 8 22 10 40 3.05
2 Apply computers and computer software
to various construction management
processes.
1 11 16 12 40 2.98
3 Analyze construction materials, methods
and equipment, and make appropriate
decisions related to their application to
the construction process.
0 3 21 16 40 3.33
4 Communicate clearly and effectively. 0 4 18 18 40 3.35
Average Rank Over All Four Categories 3.18
STUDENT COURSE WORK: Undergraduate (Quality, Quantity, Perceived Usefulness)
Internship (students’ comments)
Benefits are extremely good as that is how he found his job (had 2 internship)
"Enjoyed and very valuable would have like to know more about print reading to be more prepared"
"Best part of program. Learned more there than in the 4 years of classes”
One Class to Delete and Why:
"None", "Scheduling", "Superintendancy", "Estimating" and "English", “CAD/BIM”, “Construction
Law”, “Business Administration”
One Class to Add and Why:
"None", "Print Reading", "BIM", "More computer classes in heavy job and bluebeam", "None",
"More Math", "More MEP", and "Estimating", “CAD class”

16
FACILITIES
Table B-2. Students Evaluation of Facilities at CM Program
Facilities On a scale of 1-4, how well did CCSU
prepare you to:
Rank 4 = exceptional, 3 =
good, 2 = acceptable,
1 = dissatisfied
Total
Respondents Average
Rating
1 2 3 4
1 Labs - equipment and maintenance
1 12 14 12 39 2.95
2 Classrooms - layout, size, comfort
level 0 5 23 12 40 3.18
3 Computer and software availability 0 7 12 21 40
3.35
4 Library usefulness 10 11 8 10 39
2.46
Average Rank Over All Four Categories 2.98
COURSE OFFERINGS Table B-3. Students Evaluation of Courses Offered by CM Program
Course Offerings On a scale of 1-4, how well did CCSU
prepare you to:
Rank 4 = exceptional, 3 =
good, 2 = acceptable,
1 = dissatisfied
Total
Respondents Average
Rating
1 2 3 4
1 Availability of required courses
1 12 18 9 40 3.10
2 Sequencing of prerequisites 0 11 20 9 40 3.18
3 Helpfulness of Faculty Advising 0 5 15 20 40 3.88
4 Course time offering 1 11 17 10 39 3.18
5
Friday or Saturday classes 9 0 4 24 37 3.81
6
CM485 2 13 14 8 37 2.97
Average Rank Over All Six Categories 3.35

17
Table B-4. Students Evaluation of Summer and Online Courses Offered by CM Progam
Summer & Online Courses Yes No Total
Respondents % Yes
1 Did you take any Summer classes 20 11 31 65%
2 Would you recommend to others to
Summer classes 8 2 10 80%
3 Did you take any online classes 16 14 30 53%
4 Would you recommend to others to
online classes 17 3 20 85%
INSTRUCTION Table B-5. Student Evaluation of Instruction Quality at CM Program
Faculty On a scale of 1-4, how well did CCSU
prepare you to:
Rank (4 = Best) Total
Respondents Average
Rating
1 2 3 4
1 Full time faculty
0 0 20 20 40 3.50
2 Adjunct faculty 1 2 14 23 40 3.48
3 Texts and Software 0 6 23 11 40 3.13
Average Rank Over All Three Categories
3.37

18
RELATIONSHIPS TO INDUSTRY Table B-6. Students Evaluation of Relationships to Industry Provided by the CM Program
Relationships to Industry On a scale of 1-4, how well did CCSU
prepare you to:
Rating Total
Respondents Percentage
Answered
Yes
Yes No
1 Career Fair attendance 34
5 39 87%
2 If yes, was attendance at the career fairs
found to be useful in furthering Students'
personal goals
27 6 33 82%
3 Student Clubs 27 12 39 69%
4 If yes, was Club participation deemed to have
provided value to the educational experience 24 2 26 92%
5 Field Trips 21 18 39 54%
6 If yes, were field trips found to be a valuable
element of education at CCSU 18 1 19 95%
Table B-7. Student Employment Placement at Graduation
Employment Rate Rating Total
Respondents
Percentage
Answered
Yes Yes No
Reported employment in the Construction
Industry lined up upon graduation: 38 2 40 95%
Table B-8. Position Offered to Student
If yes, which of the following job titles best describes what your
role will be
Total
Quantity Percentage
a Project Manager 7 18%
b Project Engineer 16 42%
c Estimator 5 13%
d Scheduler 1 3%
e Safety Manager 1 3%
f Superintendent 2 5%
g Other 6 16%

19
Table B-9. Construction Sector of Hiring Company
Jobs reported by sector of the Construction Industry Total
Quantity Percentage
a Construction management 13 34%
b General contractor 9 24%
c Specialty contractor 8 21%
d Material supplier 2 5%
e Owner 1 3%
f Legal-Insurance 3 8%
g Other 2 5%
Table B-10. Starting Salary for the Jobs Offered
Anticipated starting salary range Total
Quantity Percentage
a < $45,000 0 0%
b $45,0010 - $50,000 3 8%
c $50,001 - $55,000 4 11%
d $55,001 - $60,000 11 29%
e $60,000 13 34%
f Prefer not to answer 7 18%