uncovering the relationship between drought indices and ......between drought monitors and annual...
TRANSCRIPT

Uncovering the relationship between drought
indices and rangeland production
Collaborators, Karen Bagne, Robb Lankston
Matt Reeves,
Research Ecologist
Rocky Mountain Research Station
& USDA Climate Hub liaison
North American Drought Monitor Meeting
May, 2018, Calgary

Why?
National grazing allotment evaluation

Why?
National grazing allotment evaluation
Production assessment in support of
public land grazing management
Annual
monitoring
Seasonal
projections

Impetus: evaluating drought resiliency: How is our management working?

y = -93.8x + 190381 R² = 0.8022
0.00
500.00
1,000.00
1,500.00
2,000.00
2,500.00
3,000.00
3,500.00
1999 2001 2003 2005 2007 2009 2011 2013 2015
Piute
R² = 0.3815
0
200
400
600
800
1000
1200
0 50 100 150 200 250Anual pro
duction (
lbs\a
c)
Annual cumulated drought
Impetus: evaluating drought resiliency: How is our management working?
Piute

Why?
National grazing allotment evaluation
Production assessment in support of
public land grazing management
These issues caused us to investigate
various drought monitors
Relations with annual production
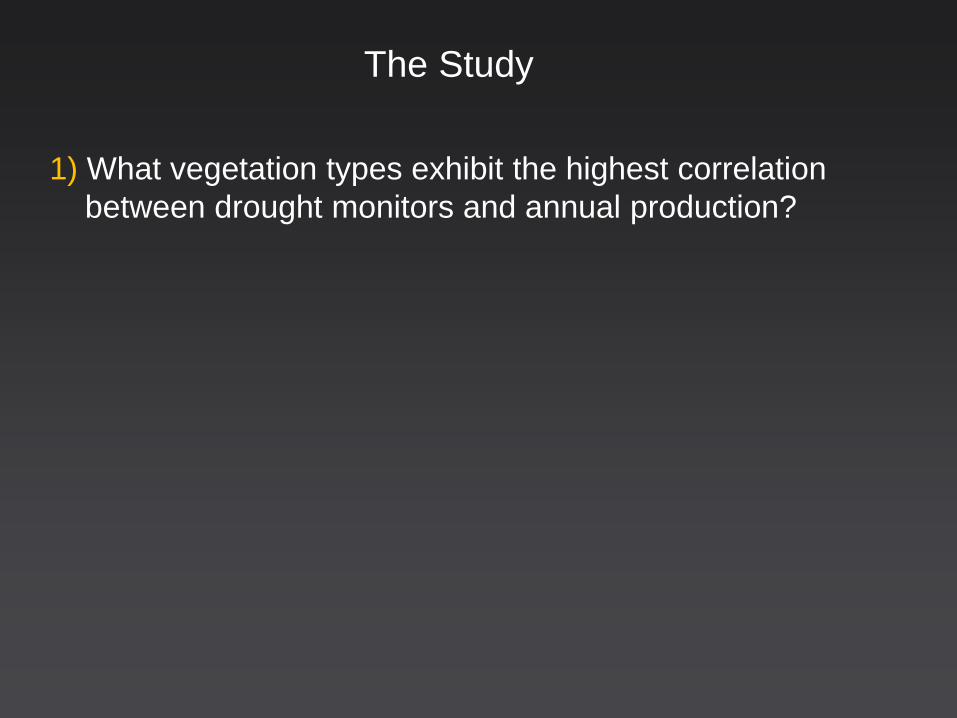
The Study
1) What vegetation types exhibit the highest correlation
between drought monitors and annual production?

The Study
1) What vegetation types exhibit the highest correlation
between drought monitors and annual production?
2) What monitor exhibits the highest correlation
with rangeland production?

The Study
1) What vegetation types exhibit the highest correlation
between drought monitors and annual production?
2) What monitor exhibits the highest correlation
with rangeland production?
3) What lag times exhibit the highest correlation between
rangeland production and drought monitors?
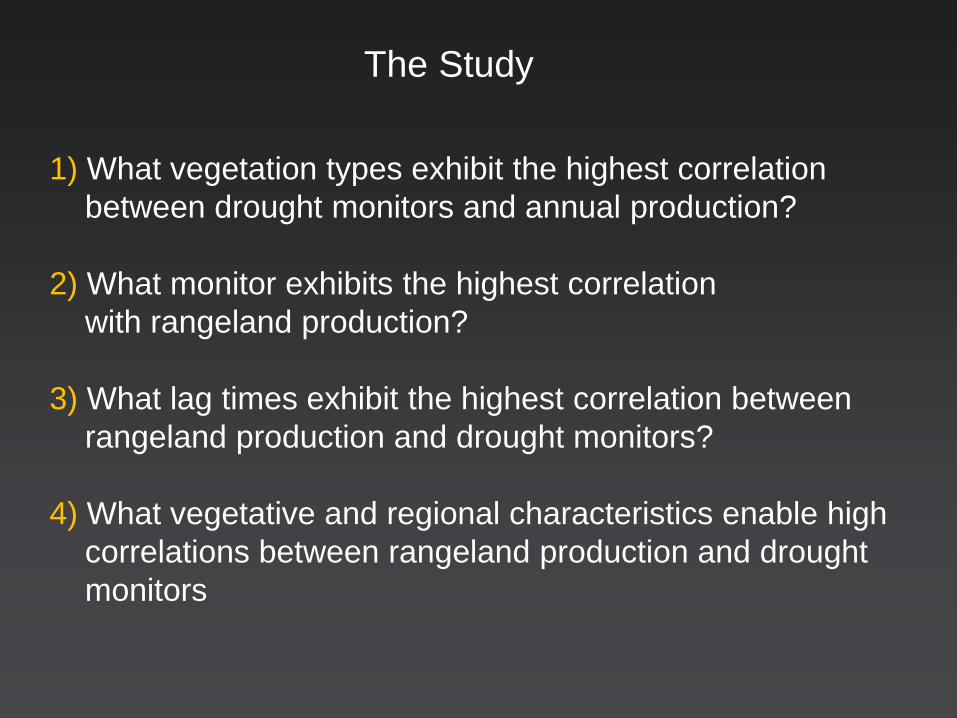
The Study
1) What vegetation types exhibit the highest correlation
between drought monitors and annual production?
2) What monitor exhibits the highest correlation
with rangeland production?
3) What lag times exhibit the highest correlation between
rangeland production and drought monitors?
4) What vegetative and regional characteristics enable high
correlations between rangeland production and drought
monitors

• Palmer Drought Severity Index (PDSI)
• Self calibrated Palmer Drought Severity Index (PDSIsc)
• US Drought Monitor (USDM)
• Evaporative Demand Drought Index (EDDI)
• Standardized Precipitation Evaporation Index 6 (SPEI6)
• Standardized Precipitation Evaporation Index 12 (SPEI12)
The Study

Results
What vegetation types exhibit the highest correlation
between drought monitors and annual production?

Results
What vegetation types exhibit the highest correlation
between drought monitors and annual production?
EVT SAF SRM Mean
max
Tamaulipan Mixed Deciduous Thornscrub Mesquite-Ganjeno-Acacia 80
Tamaulipan Mesquite Upland Scrub Mesquite-Ganjeno-Acacia 79
Tamaulipan Savanna Grassland Mesquite-Ganjeno-Acacia 78
Tamaulipan Calcareous Thornscrub Mesquite-Ganjeno-Acacia 77
South Texas Sand Sheet Grassland Mesquite-Live Oak-Seacoast Bluestem 77
Chihuahuan Succulent Desert Scrub Sideoats Grama-Sumac-Juniper 70
Edwards Plateau Limestone Shrubland Juniper-Oak 70
Edwards Plateau Limestone Savanna and Woodland Juniper-Oak 70
Western Great Plains Mesquite Woodland and Shrubland Mesquite 69
Quercus havardii Shrubland Alliance Sand Shinnery Oak 69
Chihuahuan Mixed Desert and Thornscrub Creosotebush-Tarbush 67
Sonoran Paloverde-Mixed Cacti Desert Scrub Palo Verde-Cactus 66
Sonora-Mojave Creosotebush-White Bursage Desert Scrub Creosotebush-Bursage 65
North American Warm Desert Sparsely Vegetated Systems Sparsely Vegetated 65
Apacherian-Chihuahuan Mesquite Upland Scrub Mesquite 65
Sonoran Mid-Elevation Desert Scrub Creosotebush-Bursage 62
Chihuahuan-Sonoran Desert Bottomland and Swale Grassland Alkali Sacaton-Tobosa Grass 61
Colorado Plateau Blackbrush-Mormon-tea Shrubland Blackbush 61
North American Warm Desert Riparian Systems Riparian Woodland 61
Western Great Plains Shortgrass Prairie Blue Grama-Buffalograss 59
Something in common?
Results
What vegetation types exhibit the highest correlation
between drought monitors and annual production?
C4 Dominance

Results
What monitor exhibits the highest correlation
with rangeland production?

Results
What lag times exhibit the highest correlation between
rangeland production and drought monitors?

Wrapup
EVT SAF_SRM
Inter-Mountain Basins Big Sagebrush Shrubland SRM 403: Wyoming Big Sagebrush
Inter-Mountain Basins Big Sagebrush Steppe SRM 314: Big Sagebrush-Bluebunch Wheatgrass
Western Great Plains Sand Prairie SRM 720: Sand Bluestem -Little Bluestem Dunes
Artemisia tridentata ssp. vaseyana Shrubland Alliance SRM 402: Mountain Big Sagebrush
Coleogyne ramosissima Shrubland Alliance SRM 212: Blackbrush

Lag 2 or 3
Results

Lag 2 or 3
Results

Results
Lag 0

Results
Lag 0

Results
What vegetative and regional characteristics enable high
correlations between rangeland production and drought monitors?

Results
What vegetative and regional characteristics enable high
correlations between rangeland production and drought monitors?
Correlation Analysis: what drives monitor correlation with production?
Indicator Slope (parameter estimate) Significance
PPT (AMJ) N/A
PPT (JAS) N/A
PPT (JFM) -0.00337 0.0025
PPT (OND) N/A
TMAX (AMJ) 0.07569 0.0002
TMAX (JAS) -0.04734 0.0013
TMAX (JFM) N/A
TMAX (OND) N/A
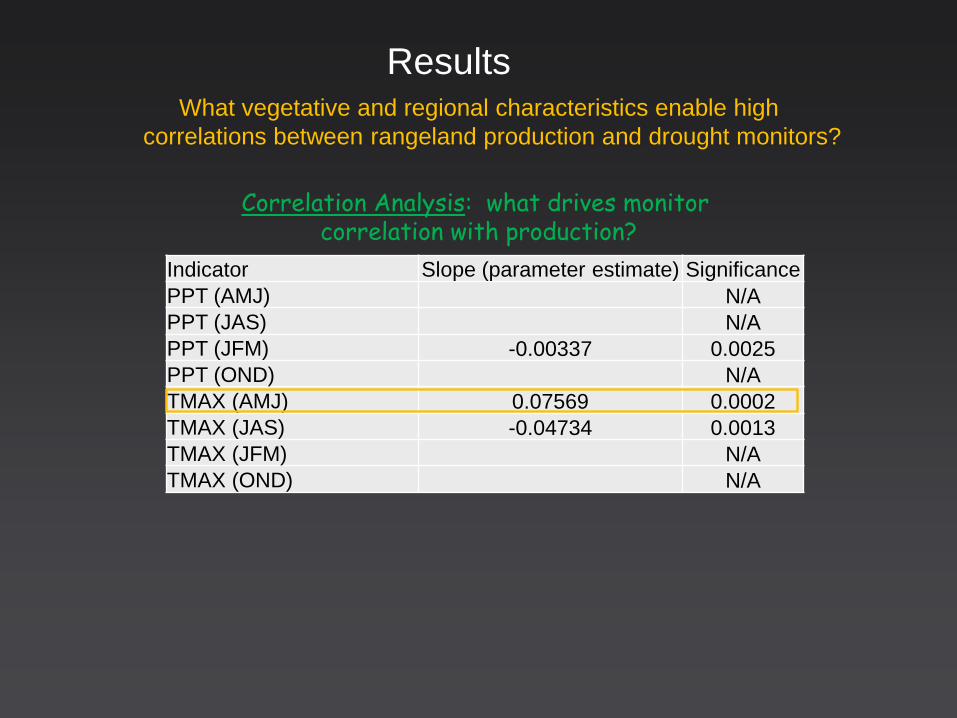

Results
What vegetative and regional characteristics enable high
correlations between rangeland production and drought monitors?
Correlation Analysis: what drives monitor correlation with production?
R² = 0.6038
15
20
25
30
35
40
45
50
55
15 25 35 45 55 65 75
Co
rre
latio
n o
f d
rou
gh
t m
on
ito
r w
ith
a
nn
ua
l p
rod
ucito
n (
r2)
Mean Seasonal Temperature (AMJ ◦C)
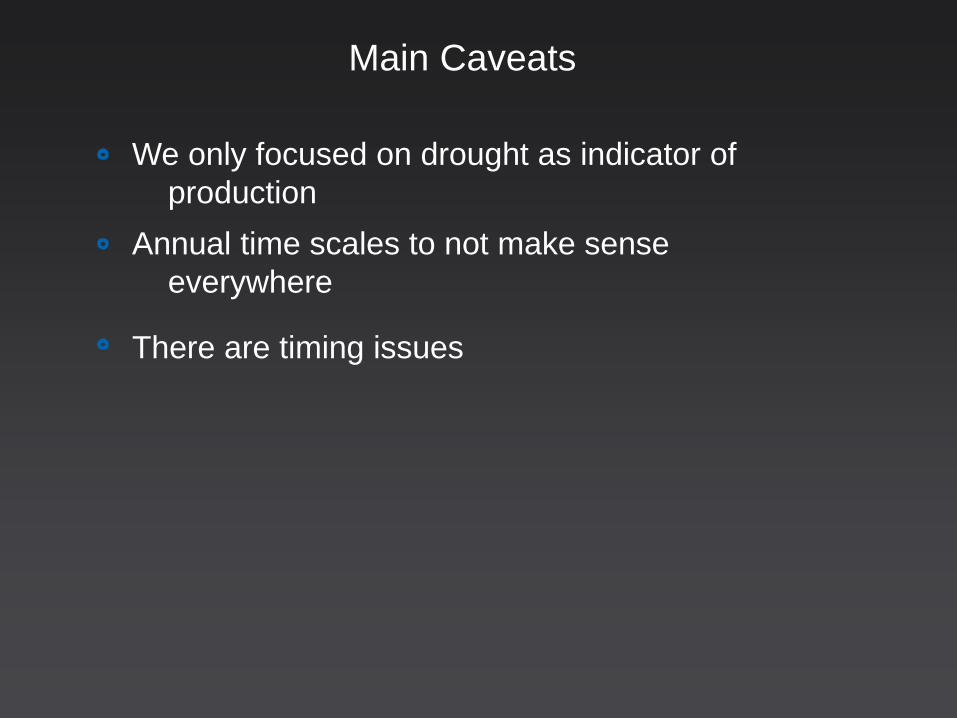
Main Caveats
We only focused on drought as indicator of
production
Annual time scales to not make sense
everywhere
There are timing issues
WRAPUP
SPEI(s) is best indicator of production
High CV of NPP increases effectiveness
Lags are very important, especially in shrubs
Warmer regions exhibit greater correlations
C4 influences monitor as does growing season
Next Steps:
- Teaming with USGS + DRI
- Intra-season dynamics
- Other drought monitors
