umesc.usgs.gov · web viewthe sediment-contaminant database for the upper mississippi river system...
TRANSCRIPT

Sediment-Contaminant Database:Data Dictionary
Introduction: The Sediment-Contaminant Database for the Upper Mississippi River System contains reliable sediment-
contaminant data of known quality in a readily accessible format. The database was compiled to facilitate
the assessment of riverine contamination, to increase the availability of historic sediment-contaminant
data, to facilitate responses to contaminant issues in the Upper Mississippi River System, and to focus
management and scientific efforts pertaining to contaminated-sediment.
Forty four (44) data sets on sediment-associated contaminants in the Upper Mississippi River, the Illinois
River, and selected tributaries have been entered into version 2 of the database, which contains
information from a total of 3950 analyzed sediment samples collected from 1974 through 2000. This total
includes 2697 samples from the Upper Mississippi River, 440 from the Illinois River and 813 from
selected tributary streams. Groups of contaminants represented in the database include metals, metalloids,
nutrients, poly-nuclear aromatic hydrocarbons, insecticides, herbicides, fungicides, industrial compounds,
sterols, petroleum-related compounds, and polychlorinated biphenyls.
Considerable care was taken to ensure the reliability of contaminant data entered into the database. The
relative completeness of quality-assurance documentation for each discreet data set entered was
characterized by a quality-assurance index. To facilitate the interpretation of the contaminant data, the
database provides information on sampling locations, methods of sediment collection, physical
characteristics of the analyzed sediments, and other ancillary variables for each sediment sample
represented.
1

Table 1: Source.csv
Field Name Field
Size
Look-up
Table
Format Value Range/Default
Data-Source Variables
DATA SET NUMBER 2 99 1-99
DATA SET NAME 2 Y 99 1-99
INSTITUTION PROVIDING DATA 2 Y 99 1-99
DATA CONTACT 2 Y 99 1-99
BIBLIOGRAPHIC REFERENCE(S) 2 Y 99 1-99
SAMPLING PURPOSE Y 99 1-99
QUALITY-ASSURANCE INDEX Y 9 1-5
NUMBER OF OBSERVATIONS IN DATA
SET
4 9999 1-9999
DATE OF ENTRY INTO DATABASE 10 MM/DD/YYYY 06/30/1999-Current
Date
DISCLAIMER 4 c(4) USGS
2
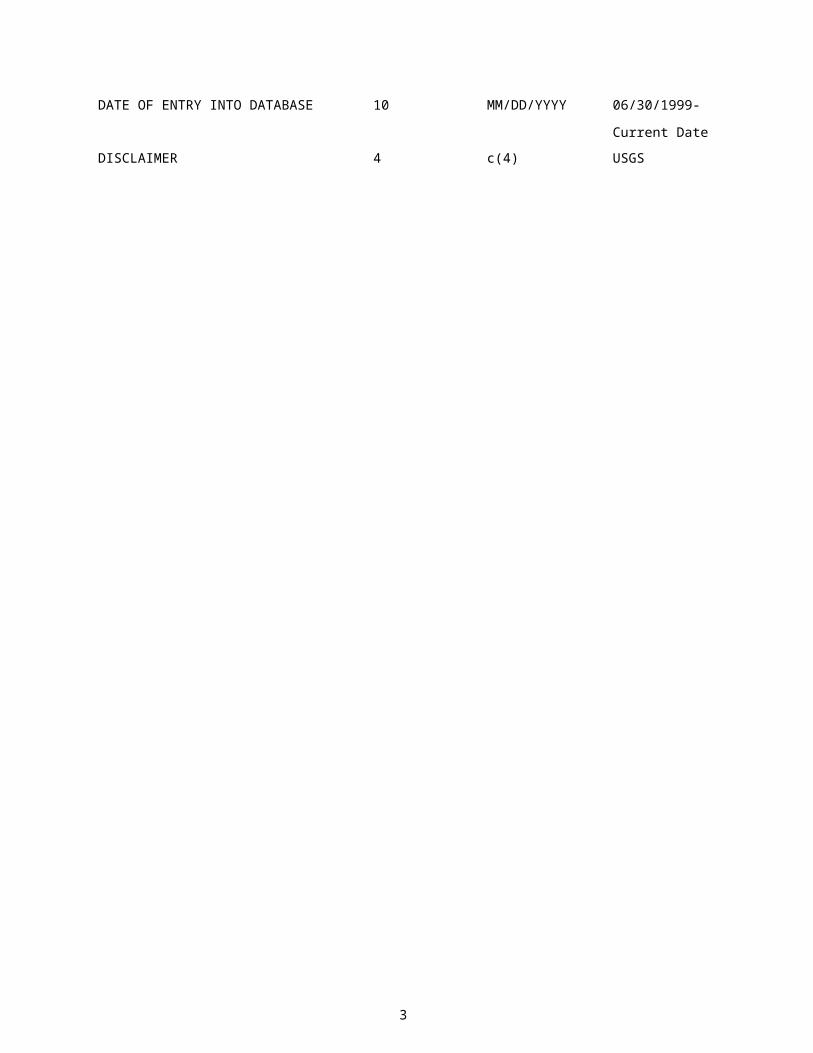
Table 2. Sample.csv
Field Name Field
Size
Look-up
Table
Format Value Range/Default
Database Sample Variables
DATA SET NUMBER 2 99 1-99
DATABASE SAMPLE NUMBER 3 999 1-999
ORIGINAL SAMPLE NUMBER 20 c(20) -
Site-Characteristics Variables
RIVER 2 Y 99 1-99
NAVIGATION POOL 2 Y 99 1-99
STATE 1 Y 9 1-7
COUNTY 50 c(50) -
RIVER MILE 5,1 999.9 0-900.0
RIVER MILE UNITS 2 Y 99 10
SITE COMMON NAME 2 Y 99 1-99
SAMPLE COORDINATES NORTHING 7 9999999 0-9999999
SAMPLE COORDINATES NORTHING
UNITS
2 Y 99 15
SAMPLE COORDINATES EASTING 7 9999999 0-9999999
SAMPLE COORDINATES EASTING UNITS 2 Y 99 15
WATER DEPTH 4,1 99.9 0-99.9
WATER DEPTH UNITS 1 Y 9 9
Methods Variables
DATE OF COLLECTION 10 MM/DD/YYYY 01/01/1950-Current
Date
SAMPLING DURATION 3 999 0-999
SAMPLING DURATION UNITS 2 Y 99 12
SAMPLE TYPE 2 Y 99 1-20
COLLECTION APPARATUS 2 Y 99 1-20
UPPER DEPTH OF SAMPLE IN SEDIMENT
PROFILE
3 999 0-999
3

UPPER DEPTH OF SAMPLE IN SEDIMENT
PROFILE UNITS
1 Y 9 8
LOWER DEPTH OF SAMPLE IN SEDIMENT
PROFILE
3 999 0-999
LOWER DEPTH OF SAMPLE IN
SEDIMENT PROFILE UNITS
1 Y 9 8
DIGESTION METHOD FOR INORGANIC
CONTAMINANTS
1 Y 9 1-9
Sediment Toxicity Variables
SEDIMENT CODE 1 Y 9 1-9
TEST ORGANISM 2 Y 99 1-20
DURATION OF EXPOSURE 3 999 0-999
DURATION OF EXPOSURE UNITS 2 Y 99 12
BIOLOGICAL RESPONSE 2 Y 99 1-20
BIOLOGICAL RESPONSE DQ 1 Y 9 1-9
Sediment-Characteristics Variables
VOLATILE MATTER CONTENT 5,2 99.99 0-99.99
VOLATILE MATTER CONTENT UNITS 1 Y 9 1
VOLATILE MATTER CONTENT DQ 1 Y 9 1-9
TOTAL CARBON 5,2 99.99 0-99.99
TOTAL CARBON UNITS 1 Y 9 1
ORGANIC CARBON 5,2 99.99 0-99.99
ORGANIC CARBON UNITS 1 Y 9 1
CARBONATE CARBON 5,2 99.99 0-99.99
CARBONATE CARBON UNITS 1 Y 9 1
TOTAL NITROGEN 5,2 99.99 0-99.99
TOTAL NITROGEN UNITS 1 Y 9 1
ACID-VOLATILE SULFIDE 5,1 999.9 0-999.9
ACID-VOLATILE SULFIDE UNITS 1 Y 9 6
GRAVEL CONTENT 2 99 0-99
GRAVEL CONTENT UNITS 1 Y 9 1
SAND CONTENT 2 99 0-99
SAND CONTENT UNITS 1 Y 9 1
4

SILT CONTENT 2 99 0-99
SILT CONTENT UNITS 1 Y 9 1
CLAY CONTENT 2 99 0-99
CLAY CONTENT UNITS 1 Y 9 1
SILT + CLAY CONTENT 2 99 0-99
SILT + CLAY CONTENT UNITS 1 Y 9 1
WATER CONTENT 2 99 0-99
WATER CONTENT UNITS 1 Y 9 1
DENSITY 4,2 9.99 0-9.99
DENSITY UNITS 1 Y 9 2
SIZE-FRACTION ANALYZED, INORGANIC
CONTAMINANTS
5,3 9.999 0-9.999
SIZE-FRACTION ANALYZED, INORGANIC
CONTAMINANTS UNITS
1 Y 9 7
SIZE-FRACTION ANALYZED, ORGANIC
CONTAMINANTS
5,3 9.999 0-9.999
SIZE-FRACTION ANALYZED, ORGANIC
CONTAMINANTS UNITS
1 Y 9 7
APPROXIMATE YEAR OF DEPOSITION 4 9999 (or YYYY) 1700-2050
APPROXIMATE YEAR OF DEPOSITION
UNITS
2 Y 99 11
TOTAL KJELDAHL NITROGEN 5,2 99.99 0-99.99
TOTAL KJELDAHL NITROGEN UNITS 1 Y 9 3
LIPID CONTENT 3,1 9.9 0-9.9
LIPID CONTENT UNITS 1 Y 9 1
5

Table 3. Metals.csv
Field Name Field
Size
Look-up
Table
Format Value Range/Default
Inorganics: Metals, Metalloids, Nutrients, and Others
DATA SET NUMBER 2 99 1-99
DATABASE SAMPLE NUMBER 3 999 1-999
RIVER 2 Y 99 1-99
NAVIGATION POOL 2 Y 99 1-99
RIVER MILE 5,1 999.9 0-900.0
RIVER MILE UNITS 2 Y 99 10
SAMPLE COORDINATES NORTHING 7 9999999 0-9999999
SAMPLE COORDINATES NORTHING UNITS 2 Y 99 15
SAMPLE COORDINATES EASTING 7 9999999 0-9999999
SAMPLE COORDINATES EASTING UNITS 2 Y 99 15
SAMPLE TYPE 2 Y 99 1-20
AMMONIA-NITROGEN 8,3 9999.999 0 - 9999.999
AMMONIA-NITROGEN UNITS 1 Y 9 3
AMMONIA-NITROGEN DQ 2 Y 99 1-20
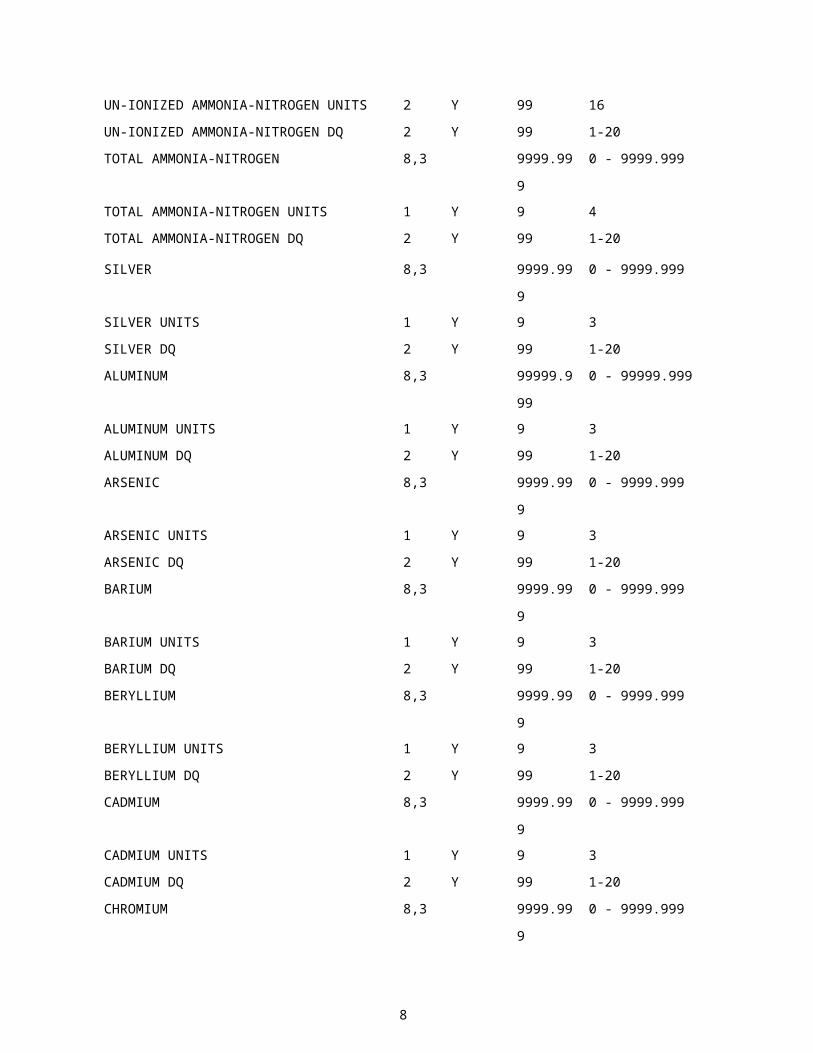
UN-IONIZED AMMONIA-NITROGEN 8,3 9999.999 0 - 9999.999
UN-IONIZED AMMONIA-NITROGEN UNITS 2 Y 99 16
UN-IONIZED AMMONIA-NITROGEN DQ 2 Y 99 1-20
TOTAL AMMONIA-NITROGEN 8,3 9999.999 0 - 9999.999
TOTAL AMMONIA-NITROGEN UNITS 1 Y 9 4
TOTAL AMMONIA-NITROGEN DQ 2 Y 99 1-20
SILVER 8,3 9999.999 0 - 9999.999
SILVER UNITS 1 Y 9 3
SILVER DQ 2 Y 99 1-20
ALUMINUM 8,3 99999.99
9
0 - 99999.999
ALUMINUM UNITS 1 Y 9 3
ALUMINUM DQ 2 Y 99 1-20
6

ARSENIC 8,3 9999.999 0 - 9999.999
ARSENIC UNITS 1 Y 9 3
ARSENIC DQ 2 Y 99 1-20
BARIUM 8,3 9999.999 0 - 9999.999
BARIUM UNITS 1 Y 9 3
BARIUM DQ 2 Y 99 1-20
BERYLLIUM 8,3 9999.999 0 - 9999.999
BERYLLIUM UNITS 1 Y 9 3
BERYLLIUM DQ 2 Y 99 1-20
CADMIUM 8,3 9999.999 0 - 9999.999
CADMIUM UNITS 1 Y 9 3
CADMIUM DQ 2 Y 99 1-20
CHROMIUM 8,3 9999.999 0 - 9999.999
CHROMIUM UNITS 1 Y 9 3
CHROMIUM DQ 2 Y 99 1-20
COPPER 8,3 9999.999 0 - 9999.999
COPPER UNITS 1 Y 9 3
COPPER DQ 2 Y 99 1-20
IRON 8,3 99999.99
9
0 - 99999.999
IRON UNITS 1 Y 9 3
IRON DQ 2 Y 99 1-20
MERCURY 8,3 9999.999 0 - 9999.999
MERCURY UNITS 1 Y 9 3
MERCURY DQ 2 Y 99 1-20
METHYLMERCURY 8,3 9999.999 0 - 9999.999
METHYLMERCURY UNITS 1 Y 9 3
METHYLMERCURY DQ 2 Y 99 1-20
MOLYBDENUM 8,3 9999.999 0 - 9999.999
MOLYBDENUM UNITS 1 Y 9 3
MOLYBDENUM DQ 2 Y 99 1-20
NICKEL 8,3 9999.999 0 - 9999.999
7
NICKEL UNITS 1 Y 9 3
NICKEL DQ 2 Y 99 1-20
LEAD 8,3 9999.999 0 - 9999.999
LEAD UNITS 1 Y 9 3
LEAD DQ 2 Y 99 1-20
MANGANESE 8,3 99999.99
9
0 - 99999.999
MANGANESE UNITS 1 Y 9 3
MANGANESE DQ 2 Y 99 1-20
TOTAL PHOSPHORUS 8,3 9999.999 0 - 9999.999
TOTAL PHOSPHORUS UNITS 1 Y 9 3
TOTAL PHOSPHORUS DQ 2 Y 99 1-20
SELENIUM 8,3 9999.999 0 - 9999.999
SELENIUM UNITS 1 Y 9 3
SELENIUM DQ 2 Y 99 1-20
ANTIMONY 8,3 9999.999 0 - 9999.999
ANTIMONY UNITS 1 Y 9 3
ANTIMONY DQ 2 Y 99 1-20
TIN 8,3 9999.999 0 - 9999.999
TIN UNITS 1 Y 9 3
TIN DQ 2 Y 99 1-20
THALLIUM 8,3 9999.999 0 - 9999.999
THALLIUM UNITS 1 Y 9 3
THALLIUM DQ 2 Y 99 1-20
VANADIUM 8,3 9999.999 0 - 9999.999
VANADIUM UNITS 1 Y 9 3
VANADIUM DQ 2 Y 99 1-20
ZINC 8,3 99999.99
9
0 - 99999.999
ZINC UNITS 1 Y 9 3
ZINC DQ 2 Y 99 1-20
POTASSIUM 8,3 9999.999 0 - 9999.999
POTASSIUM UNITS 1 Y 9 3
8

POTASSIUM DQ 2 Y 99 1-20
CALCIUM 8,3 9999.999 0 - 9999.999
CALCIUM UNITS 1 Y 9 3
CALCIUM DQ 2 Y 99 1-20
TITANIUM 8,3 9999.999 0 - 9999.999
TITANIUM UNITS 1 Y 9 3
TITANIUM DQ 2 Y 99 1-20
BROMINE 8,3 9999.999 0 - 9999.999
BROMINE UNITS 1 Y 9 3
BROMINE DQ 2 Y 99 1-20
CYANIDE 8,3 9999.999 0 - 9999.999
CYANIDE UNTIS 1 Y 9 3
CYANIDE DQ 2 Y 99 1-20
CYANIDE, AMENABLE 8,3 9999.999 0 - 9999.999
CYANIDE, AMENABLE UNITS 1 Y 9 3
CYANIDE, AMENABLE DQ 2 Y 99 1-20
BORON 8,3 9999.999 0 - 9999.999
BORON UNITS 1 Y 9 3
BORON DQ 2 Y 99 1-20
MAGNESIUM 8,3 9999.999 0 - 9999.999
MAGNESIUM UNITS 1 Y 9 3
MAGNESIUM DQ 2 Y 99 1-20
STRONTIUM 8,3 9999.999 0 - 9999.999
STRONTIUM UNITS 1 Y 9 3
STRONTIUM DQ 2 Y 99 1-20
LANTHANUM 8,3 9999.999 0 - 9999.999
LANTHANUM UNITS 1 Y 9 3
LANTHANUM DQ 2 Y 99 1-20
SODIUM 8,3 9999.999 0 - 9999.999
SODIUM UNITS 1 Y 9 3
SODIUM DQ 2 Y 99 1-20
9

GOLD 8,3 9999.999 0 - 9999.999
GOLD UNITS 1 Y 9 3
GOLD DQ 2 Y 99 1-20
BISMUTH 8,3 9999.999 0 - 9999.999
BISMUTH UNITS 1 Y 9 3
BISMUTH DQ 2 Y 99 1-20
CERIUM 8,3 9999.999 0 - 9999.999
CERIUM UNITS 1 Y 9 3
CERIUM DQ 2 Y 99 1-20
COBALT 8,3 9999.999 0 - 9999.999
COBALT UNITS 1 Y 9 3
COBALT DQ 2 Y 99 1-20
GALLIUM 8,3 9999.999 0 - 9999.999
GALLIUM UNITS 1 Y 9 3
GALLIUM DQ 2 Y 99 1-20
HOLMIUM 8,3 9999.999 0 - 9999.999
HOLMIUM UNITS 1 Y 9 3
HOLMIUM DQ 2 Y 99 1-20
EUROPIUM 8,3 9999.999 0 - 9999.999
EUROPIUM UNITS 1 Y 9 3
EUROPIUM DQ 2 Y 99 1-20
LITHIUM 8,3 9999.999 0 - 9999.999
LITHIUM UNITS 1 Y 9 3
LITHIUM DQ 2 Y 99 1-20
NIOBIUM 8,3 9999.999 0 - 9999.999
NIOBIUM UNITS 1 Y 9 3
NIOBIUM DQ 2 Y 99 1-20
NEODYMIUM 8,3 9999.999 0 - 9999.999
NEODYMIUM UNITS 1 Y 9 3
NEODYMIUM DQ 2 Y 99 1-20
SCANDIUM 8,3 9999.999 0 - 9999.999
SCANDIUM UNITS 1 Y 9 3
10

SCANDIUM DQ 2 Y 99 1-20
TANTALUM 8,3 9999.999 0 - 9999.999
TANTALUM UNITS 1 Y 9 3
TANTALUM DQ 2 Y 99 1-20
YTTRIUM 8,3 9999.999 0 - 9999.999
YTTRIUM UNITS 1 Y 9 3
YTTRIUM DQ 2 Y 99 1-20
YTTERBIUM 8,3 9999.999 0 - 9999.999
YTTERBIUM UNITS 1 Y 9 3
YTTERBIUM DQ 2 Y 99 1-20
URANIUM 8,3 9999.999 0 - 9999.999
URANIUM UNITS 1 Y 9 3
URANIUM DQ 2 Y 99 1-20
THORIUM 8,3 9999.999 0 - 9999.999
THORIUM UNITS 1 Y 9 3
THORIUM DQ 2 Y 99 1-20
SULFUR 8,3 9999.999 0 - 9999.999
SULFUR UNITS 1 Y 9 3
SULFUR DQ 2 Y 99 1-20
11

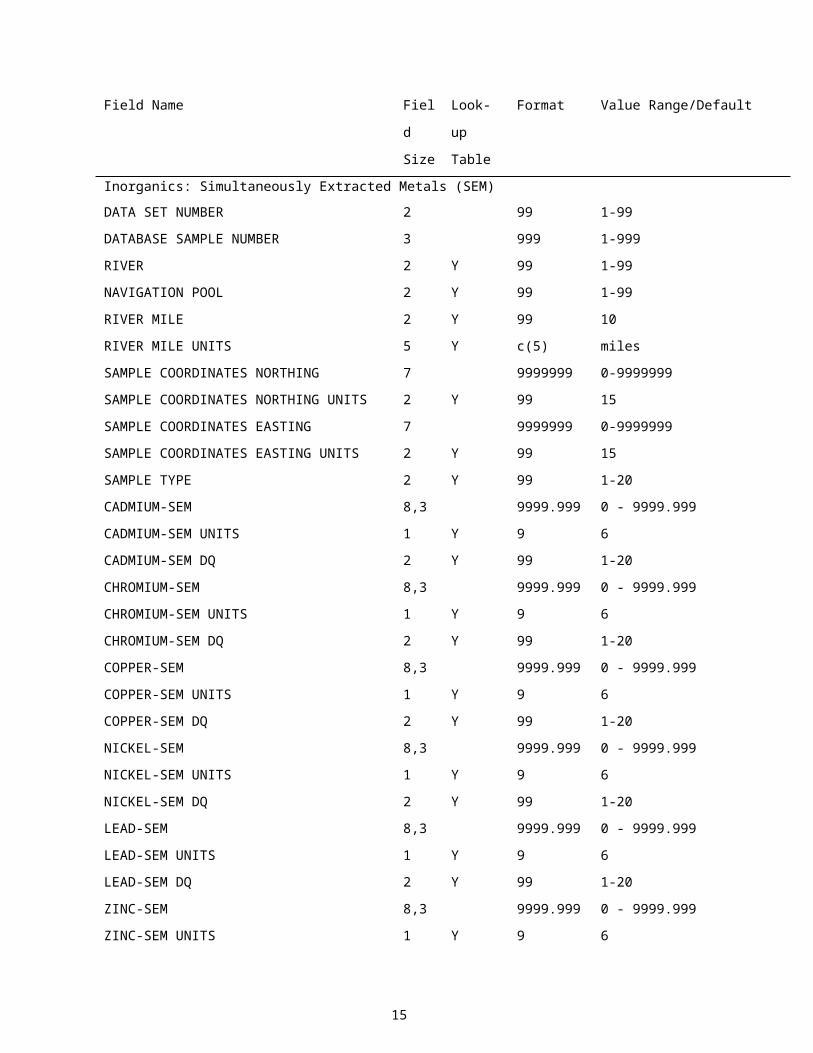
Table 4. Sems.csv
Field Name Field
Size
Look-up
Table
Format Value Range/Default
Inorganics: Simultaneously Extracted Metals (SEM)
DATA SET NUMBER 2 99 1-99
DATABASE SAMPLE NUMBER 3 999 1-999
RIVER 2 Y 99 1-99
NAVIGATION POOL 2 Y 99 1-99
RIVER MILE 2 Y 99 10
RIVER MILE UNITS 5 Y c(5) miles
SAMPLE COORDINATES NORTHING 7 9999999 0-9999999
SAMPLE COORDINATES NORTHING UNITS 2 Y 99 15
SAMPLE COORDINATES EASTING 7 9999999 0-9999999
SAMPLE COORDINATES EASTING UNITS 2 Y 99 15
SAMPLE TYPE 2 Y 99 1-20
CADMIUM-SEM 8,3 9999.999 0 - 9999.999
CADMIUM-SEM UNITS 1 Y 9 6
CADMIUM-SEM DQ 2 Y 99 1-20
CHROMIUM-SEM 8,3 9999.999 0 - 9999.999
CHROMIUM-SEM UNITS 1 Y 9 6
CHROMIUM-SEM DQ 2 Y 99 1-20
COPPER-SEM 8,3 9999.999 0 - 9999.999
COPPER-SEM UNITS 1 Y 9 6
COPPER-SEM DQ 2 Y 99 1-20
NICKEL-SEM 8,3 9999.999 0 - 9999.999
NICKEL-SEM UNITS 1 Y 9 6
NICKEL-SEM DQ 2 Y 99 1-20
LEAD-SEM 8,3 9999.999 0 - 9999.999
LEAD-SEM UNITS 1 Y 9 6
LEAD-SEM DQ 2 Y 99 1-20
ZINC-SEM 8,3 9999.999 0 - 9999.999
12

ZINC-SEM UNITS 1 Y 9 6
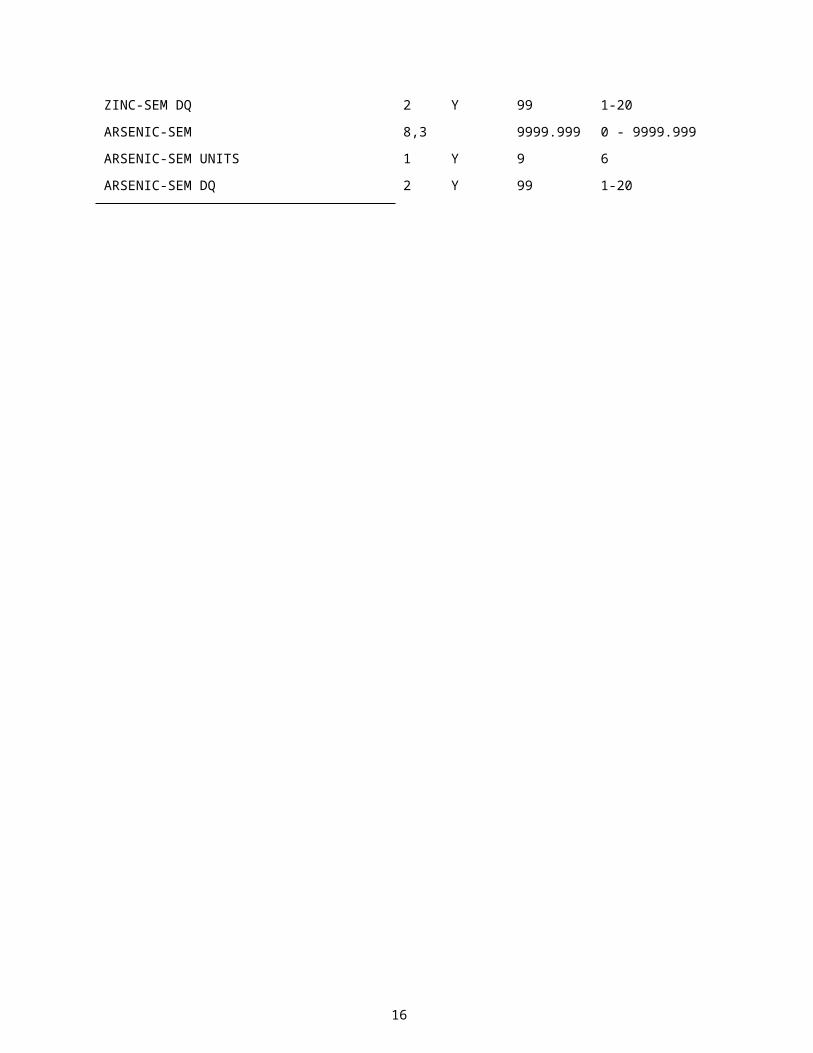
ZINC-SEM DQ 2 Y 99 1-20
ARSENIC-SEM 8,3 9999.999 0 - 9999.999
ARSENIC-SEM UNITS 1 Y 9 6
ARSENIC-SEM DQ 2 Y 99 1-20
13

Table 5. Pahs.csv
Field Name Field
Size
Look-up
Table
Format Value Range/Default
Organics: Polynuclear Aromatic Hydrocarbons (PAHs)
DATA SET NUMBER 2 99 1-99
DATABASE SAMPLE NUMBER 3 999 1-999
RIVER 2 Y 99 1-99
NAVIGATION POOL 2 Y 99 1-99
RIVER MILE 5,1 999.9 0-900.0
RIVER MILE UNITS 2 Y 99 10
SAMPLE COORDINATES NORTHING 7 9999999 0-9999999
SAMPLE COORDINATES NORTHING UNITS 2 Y 99 15
SAMPLE COORDINATES EASTING 7 9999999 0-9999999
SAMPLE COORDINATES EASTING UNITS 2 Y 99 15
SAMPLE TYPE 2 Y 99 1-20
ACENAPHTHENE 8,3 9999.999 0 - 9999.999
ACENAPHTHENE UNITS 1 Y 9 3
ACENAPHTHENE DQ 2 Y 99 1-20
ACENAPHTHYLENE 8,3 9999.999 0 - 9999.999
ACENAPHTHYLENE UNITS 1 Y 9 3
ACENAPHTHYLENE DQ 2 Y 99 1-20
ANTHRACENE 8,3 9999.999 0 - 9999.999
ANTHRACENE UNITS 1 Y 9 3
ANTHRACENE DQ 2 Y 99 1-20
BENZ(A)ANTHRACENE 8,3 9999.999 0 - 9999.999
BENZ(A)ANTHRACENE UNITS 1 Y 9 3
BENZ(A)ANTHRACENE DQ 2 Y 99 1-20
BENZO(B)FLUORANTHENE 8,3 9999.999 0 - 9999.999
BENZO(B)FLUORANTHENE UNITS 1 Y 9 3
14
BENZO(B)FLUORANTHENE DQ 2 Y 99 1-20
BENZO(K)FLUORANTHENE 8,3 9999.999 0 - 9999.999
BENZO(K)FLUORANTHENE UNITS 1 Y 9 3
BENZO(K)FLUORANTHENE DQ 2 Y 99 1-20
BENZO(G,H,I)PERYLENE 8,3 9999.999 0 - 9999.999
BENZO(G,H,I)PERYLENE UNITS 1 Y 9 3
BENZO(G,H,I)PERYLENE DQ 2 Y 99 1-20
BENZO(A)PYRENE 8,3 9999.999 0 - 9999.999
BENZO(A)PYRENE UNITS 1 Y 9 3
BENZO(A)PYRENE DQ 2 Y 99 1-20
BENZO(E)PYRENE 8,3 9999.999 0 - 9999.999
BENZO(E)PYRENE UNITS 1 Y 9 3
BENZO(E)PYRENE DQ 2 Y 99 1-20
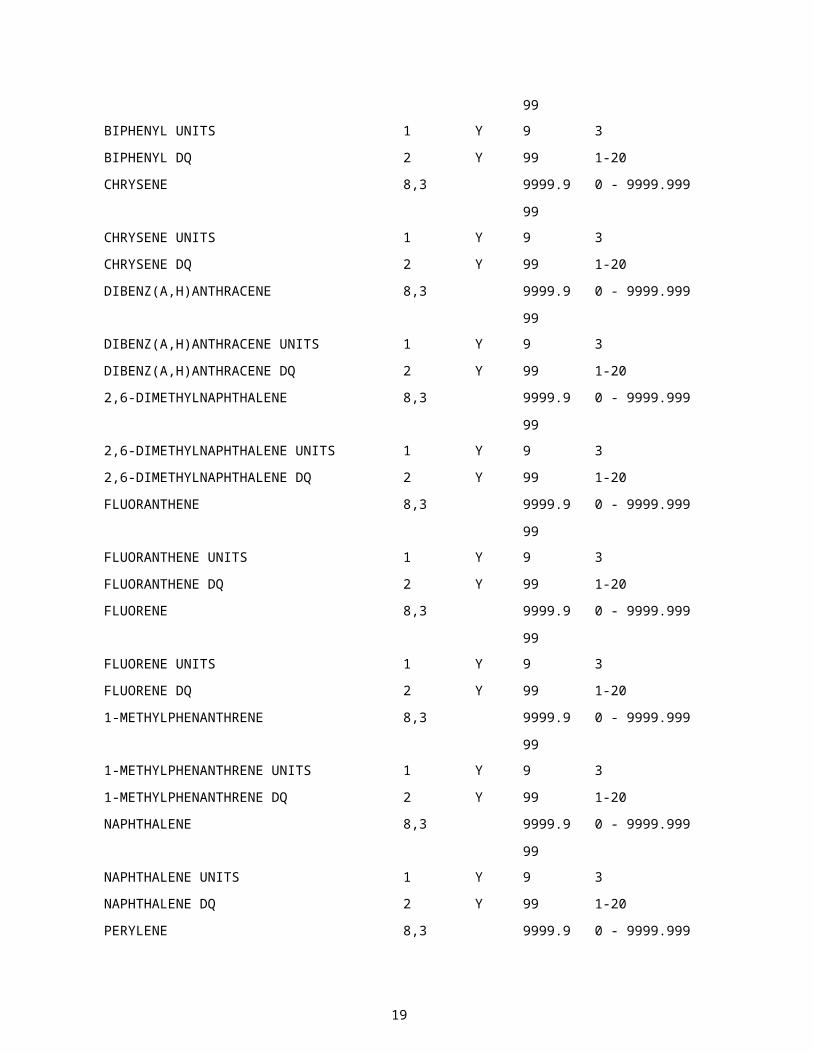
BIPHENYL 8,3 9999.999 0 - 9999.999
BIPHENYL UNITS 1 Y 9 3
BIPHENYL DQ 2 Y 99 1-20
CHRYSENE 8,3 9999.999 0 - 9999.999
CHRYSENE UNITS 1 Y 9 3
CHRYSENE DQ 2 Y 99 1-20
DIBENZ(A,H)ANTHRACENE 8,3 9999.999 0 - 9999.999
DIBENZ(A,H)ANTHRACENE UNITS 1 Y 9 3
DIBENZ(A,H)ANTHRACENE DQ 2 Y 99 1-20
2,6-DIMETHYLNAPHTHALENE 8,3 9999.999 0 - 9999.999
2,6-DIMETHYLNAPHTHALENE UNITS 1 Y 9 3
2,6-DIMETHYLNAPHTHALENE DQ 2 Y 99 1-20
FLUORANTHENE 8,3 9999.999 0 - 9999.999
FLUORANTHENE UNITS 1 Y 9 3
FLUORANTHENE DQ 2 Y 99 1-20
FLUORENE 8,3 9999.999 0 - 9999.999
FLUORENE UNITS 1 Y 9 3
15
FLUORENE DQ 2 Y 99 1-20
1-METHYLPHENANTHRENE 8,3 9999.999 0 - 9999.999
1-METHYLPHENANTHRENE UNITS 1 Y 9 3
1-METHYLPHENANTHRENE DQ 2 Y 99 1-20
NAPHTHALENE 8,3 9999.999 0 - 9999.999
NAPHTHALENE UNITS 1 Y 9 3
NAPHTHALENE DQ 2 Y 99 1-20
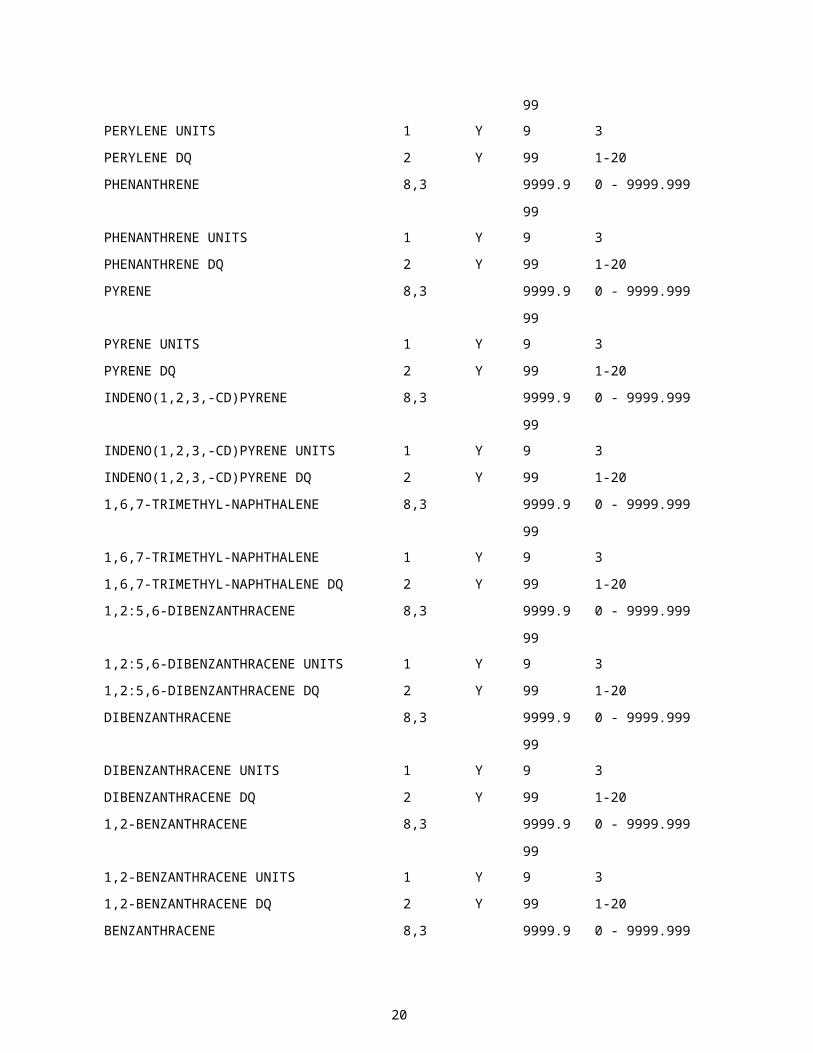
PERYLENE 8,3 9999.999 0 - 9999.999
PERYLENE UNITS 1 Y 9 3
PERYLENE DQ 2 Y 99 1-20
PHENANTHRENE 8,3 9999.999 0 - 9999.999
PHENANTHRENE UNITS 1 Y 9 3
PHENANTHRENE DQ 2 Y 99 1-20
PYRENE 8,3 9999.999 0 - 9999.999
PYRENE UNITS 1 Y 9 3
PYRENE DQ 2 Y 99 1-20
INDENO(1,2,3,-CD)PYRENE 8,3 9999.999 0 - 9999.999
INDENO(1,2,3,-CD)PYRENE UNITS 1 Y 9 3
INDENO(1,2,3,-CD)PYRENE DQ 2 Y 99 1-20
1,6,7-TRIMETHYL-NAPHTHALENE 8,3 9999.999 0 - 9999.999
1,6,7-TRIMETHYL-NAPHTHALENE 1 Y 9 3
1,6,7-TRIMETHYL-NAPHTHALENE DQ 2 Y 99 1-20
1,2:5,6-DIBENZANTHRACENE 8,3 9999.999 0 - 9999.999
1,2:5,6-DIBENZANTHRACENE UNITS 1 Y 9 3
1,2:5,6-DIBENZANTHRACENE DQ 2 Y 99 1-20
DIBENZANTHRACENE 8,3 9999.999 0 - 9999.999
DIBENZANTHRACENE UNITS 1 Y 9 3
DIBENZANTHRACENE DQ 2 Y 99 1-20
1,2-BENZANTHRACENE 8,3 9999.999 0 - 9999.999
1,2-BENZANTHRACENE UNITS 1 Y 9 3
1,2-BENZANTHRACENE DQ 2 Y 99 1-20
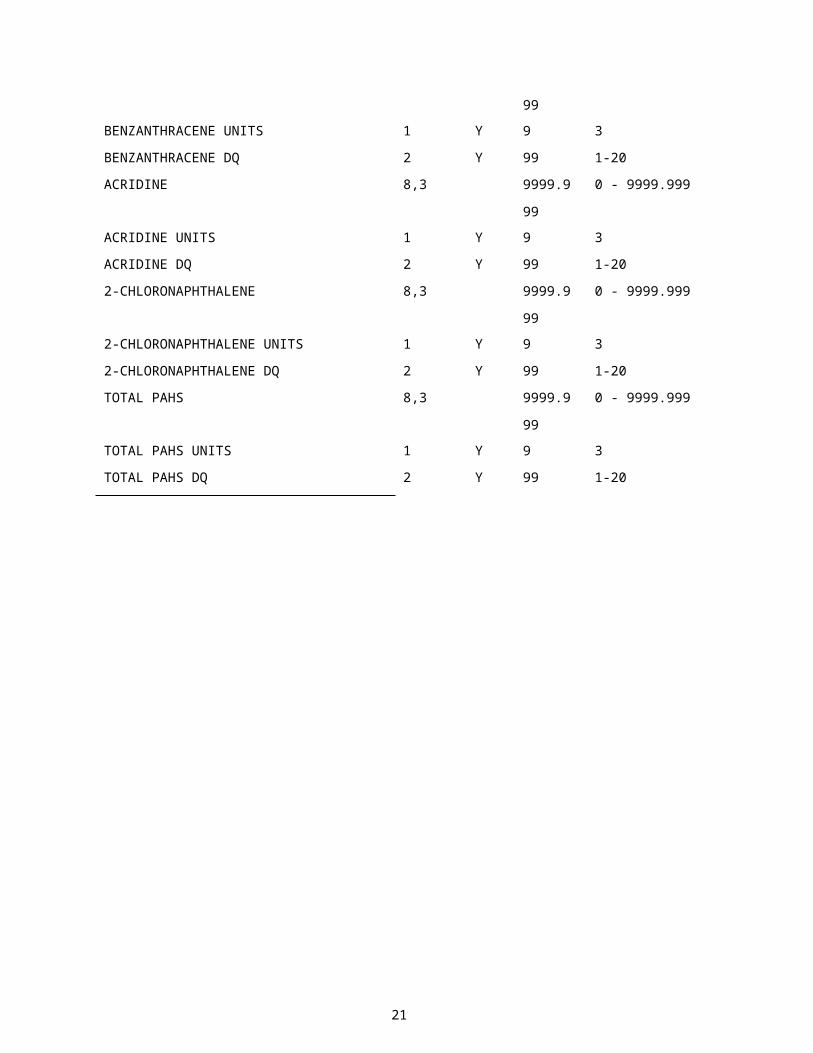
BENZANTHRACENE 8,3 9999.999 0 - 9999.999
16

BENZANTHRACENE UNITS 1 Y 9 3
BENZANTHRACENE DQ 2 Y 99 1-20
ACRIDINE 8,3 9999.999 0 - 9999.999
ACRIDINE UNITS 1 Y 9 3
ACRIDINE DQ 2 Y 99 1-20
2-CHLORONAPHTHALENE 8,3 9999.999 0 - 9999.999
2-CHLORONAPHTHALENE UNITS 1 Y 9 3
2-CHLORONAPHTHALENE DQ 2 Y 99 1-20
TOTAL PAHS 8,3 9999.999 0 - 9999.999
TOTAL PAHS UNITS 1 Y 9 3
TOTAL PAHS DQ 2 Y 99 1-20
17
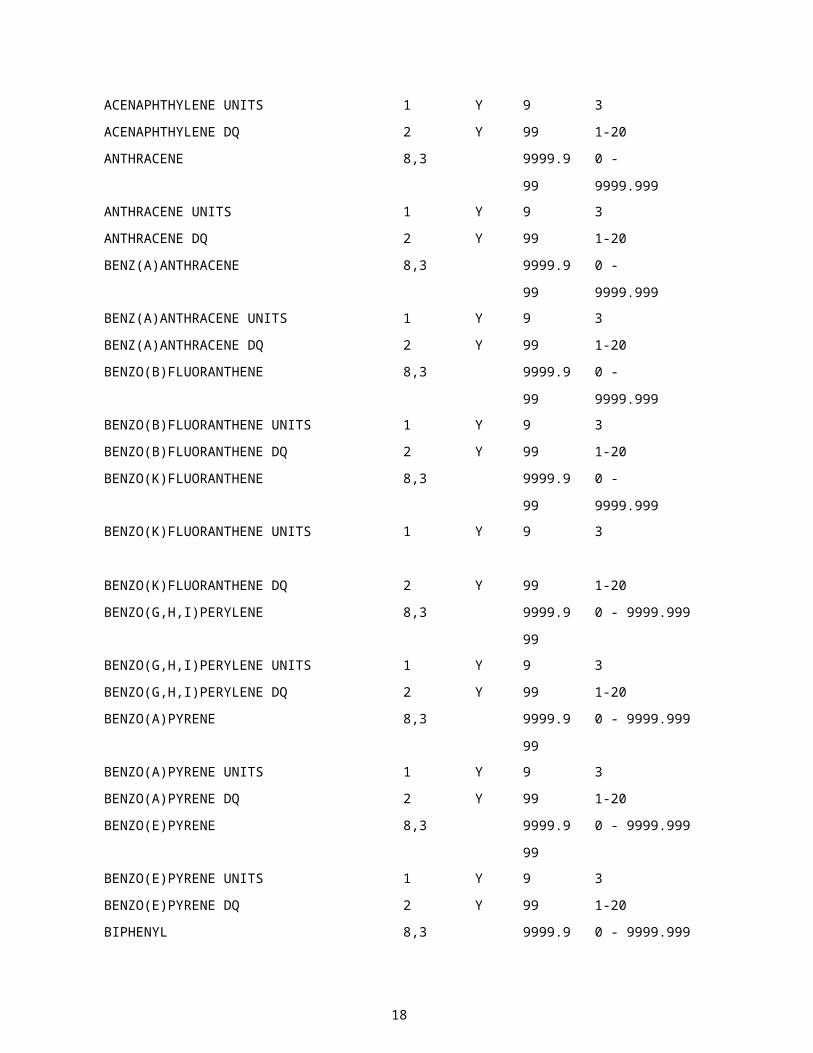
Table 6. Organo.csv
Field Name Field
Size
Look-up
Table
Format Value Range/Default
Organics: Organochlorine Insecticides
DATA SET NUMBER 2 99 1-99
DATABASE SAMPLE NUMBER 3 999 1-999
RIVER 2 Y 99 1-99
NAVIGATION POOL 2 Y 99 1-99
RIVER MILE 5,1 999.9 0-900.0
RIVER MILE UNITS 2 Y 99 10
SAMPLE COORDINATES NORTHING 7 9999999 0-9999999
SAMPLE COORDINATES NORTHING UNITS 2 Y 99 15
SAMPLE COORDINATES EASTING 7 9999999 0-9999999
SAMPLE COORDINATES EASTING UNITS 2 Y 99 15
SAMPLE TYPE 2 Y 99 1-20
ALDRIN 8,3 9999.999 0 - 9999.999
ALDRIN UNITS 1 Y 9 5
ALDRIN DQ 2 Y 99 1-20
CHLORDANE, CIS 8,3 9999.999 0 - 9999.999
CHLORDANE, CIS UNITS 1 Y 9 5
CHLORDANE, CIS DQ 2 Y 99 1-20
CHLORDANE, TRANS 8,3 9999.999 0 - 9999.999
CHLORDANE, TRANS UNITS 1 Y 9 5
CHLORDANE, TRANS DQ 2 Y 99 1-20
O, P’-DDD 8,3 9999.999 0 - 9999.999
O, P’-DDD UNITS 1 Y 9 5
O, P’-DDD DQ 2 Y 99 1-20
P, P’-DDD 8,3 9999.999 0 - 9999.999
P, P’-DDD UNITS 1 Y 9 5
P, P’-DDD DQ 2 Y 99 1-20
18
O, P’-DDE 8,3 9999.999 0 - 9999.999
O, P’-DDE UNITS 1 Y 9 5
O, P’-DDE DQ 2 Y 99 1-20
P, P’-DDE 8,3 9999.999 0 - 9999.999
P, P’-DDE UNITS 1 Y 9 5
P, P’-DDE DQ 2 Y 99 1-20
O, P’-DDT 8,3 9999.999 0 - 9999.999
O, P’-DDT UNITS 1 Y 9 5
O, P’-DDT DQ 2 Y 99 1-20
P, P’-DDT 8,3 9999.999 0 - 9999.999
P, P’-DDT UNITS 1 Y 9 5
P, P’-DDT DQ 2 Y 99 1-20
DIELDRIN 8,3 9999.999 0 - 9999.999
DIELDRIN UNITS 1 Y 9 5
DIELDRIN DQ 2 Y 99 1-20
DIETHYLHEXYPHTHALATE 8,3 9999.999 0 - 9999.999
DIETHYLHEXYPHTHALATE UNITS 1 Y 9 5
DIETHYLHEXYPHTHALATE DQ 2 Y 99 1-20
ENDRIN 8,3 9999.999 0 - 9999.999
ENDRIN UNITS 1 Y 9 5
ENDRIN DQ 2 Y 99 1-20
HEPTACHLOR 8,3 9999.999 0 - 9999.999
HEPTACHLOR UNITS 1 Y 9 5
HEPTACHLOR DQ 2 Y 99 1-20
HEPTACHLOR EPOXIDE 8,3 9999.999 0 - 9999.999
HEPTACHLOR EPOXIDE UNITS 1 Y 9 5
HEPTACHLOR EPOXIDE DQ 2 Y 99 1-20
HEXACHLOROCYCLOHEXANE, ALPHA 8,3 9999.999 0 - 9999.999
HEXACHLOROCYCLOHEXANE, ALPHA
UNITS
1 Y 9 5
HEXACHLOROCYCLOHEXANE, ALPHA DQ 2 Y 99 1-20
HEXACHLOROCYCLOHEXANE, BETA 8,3 9999.999 0 - 9999.999
19
HEXACHLOROCYCLOHEXANE, BETA UNITS 1 Y 9 5
HEXACHLOROCYCLOHEXANE, BETA DQ 2 Y 99 1-20
HEXACHLOROCYCLOHEXANE, DELTA 8,3 9999.999 0 - 9999.999
HEXACHLOROCYCLOHEXANE, DELTA
UNITS
1 Y 9 5
HEXACHLOROCYCLOHEXANE, DELTA DQ 2 Y 99 1-20
HEXACHLOROCYCLOHEXANE, GAMMA
(LINDANE)
8,3 9999.999 0 - 9999.999
HEXACHLOROCYCLOHEXANE, GAMMA
(LINDANE) UNITS
1 Y 9 5
HEXACHLOROCYCLOHEXANE, GAMMA
(LINDANE) DQ
2 Y 99 1-20
HEXACHLOROCYCLOPENTADIENE 8,3 9999.999 0 - 9999.999
HEXACHLOROCYCLOPENTADIENE UNITS 1 Y 9 5
HEXACHLOROCYCLOPENTADIENE DQ 2 Y 99 1-20
O, P’-METHOXYCHLOR 8,3 9999.999 0 - 9999.999
O, P’-METHOXYCHLOR UNITS 1 Y 9 5
O, P’-METHOXYCHLOR DQ 2 Y 99 1-20
P, P’-METHOXYCHLOR 8,3 9999.999 0 - 9999.999
P, P’-METHOXYCHLOR UNITS 1 Y 9 5
P, P’-METHOXYCHLOR DQ 2 Y 99 1-20
MIREX 8,3 9999.999 0 - 9999.999
MIREX UNITS 1 Y 9 5
MIREX DQ 2 Y 99 1-20
NONACHLOR, CIS 8,3 9999.999 0 - 9999.999
NONACHLOR, CIS UNITS 1 Y 9 5
NONACHLOR, CIS DQ 2 Y 99 1-20
NONACHLOR, TRANS 8,3 9999.999 0 - 9999.999
NONACHLOR, TRANS UNITS 1 Y 9 5
NONACHLOR, TRANS DQ 2 Y 99 1-20
OXYCHLORDANE 8,3 9999.999 0 - 9999.999
OXYCHLORDANE UNITS 1 Y 9 5
OXYCHLORDANE DQ 2 Y 99 1-20
20
PENTACHLOROANISOLE 8,3 9999.999 0 - 9999.999
PENTACHLOROANISOLE UNITS 1 Y 9 5
PENTACHLOROANISOLE DQ 2 Y 99 1-20
PERTHANE 8,3 9999.999 0 - 9999.999
PERTHANE UNITS 1 Y 9 5
PERTHANE DQ 2 Y 99 1-20
TOXAPHENE 8,3 9999.999 0 - 9999.999
TOXAPHENE UNITS 1 Y 9 5
TOXAPHENE DQ 2 Y 99 1-20
CHLORDANE 8,3 9999.999 0 - 9999.999
CHLORDANE UNITS 1 Y 9 5
CHLORDANE DQ 2 Y 99 1-20
CHLORDANE, TECHNICAL 8,3 9999.999 0 - 9999.999
CHLORDANE, TECHNICAL UNITS 1 Y 9 5
CHLORDANE, TECHNICAL DQ 2 Y 99 1-20
CHLORDANE, ALPHA 8,3 9999.999 0 - 9999.999
CHLORDANE, ALPHA UNITS 1 Y 9 5
CHLORDANE, ALPHA DQ 2 Y 99 1-20
CHLORDANE, GAMMA 8,3 9999.999 0 - 9999.999
CHLORDANE, GAMMA UNITS 1 Y 9 5
CHLORDANE, GAMMA DQ 2 Y 99 1-20
ISODRIN 8,3 9999.999 0 - 9999.999
ISODRIN UNITS 1 Y 9 5
ISODRIN DQ 2 Y 99 1-20
ENDRIN ALDEHYDE 8,3 9999.999 0 - 9999.999
ENDRIN ALDEHYDE UNITS 1 Y 9 5
ENDRIN ALDEHYDE DQ 2 Y 99 1-20
ENDOSULFAN I 8,3 9999.999 0 - 9999.999
ENDOSULFAN I UNITS 1 Y 9 5
ENDOSULFAN I DQ 2 Y 99 1-20
ENDOSULFAN II 8,3 9999.999 0 - 9999.999
ENDOSULFAN II UNITS 1 Y 9 5
21

ENDOSULFAN II DQ 2 Y 99 1-20
ENDOSULFAN SULFATE 8,3 9999.999 0 - 9999.999
ENDOSULFAN SULFATE UNITS 1 Y 9 5
ENDOSULFAN SULFATE DQ 2 Y 99 1-20
22

Table 7. Insect.csv
Field Name Field
Size
Look-up
Table
Format Value Range/Default
Organics: Insecticides
DATA SET NUMBER 2 99 1-99
DATABASE SAMPLE NUMBER 3 999 1-999
RIVER 2 Y 99 1-99
NAVIGATION POOL 2 Y 99 1-99
RIVER MILE 5,1 999.9 0-900.0
RIVER MILE UNITS 2 Y 99 10
SAMPLE COORDINATES NORTHING 7 9999999 0-9999999
SAMPLE COORDINATES NORTHING UNITS 2 Y 99 15
SAMPLE COORDINATES EASTING 7 9999999 0-9999999
SAMPLE COORDINATES EASTING UNITS 2 Y 99 15
SAMPLE TYPE 2 Y 99 1-20
PERMETHRIN, CIS 8,3 9999.999 0 - 9999.999
PERMETHRIN, CIS UNITS 1 Y 9 5
PERMETHRIN, CIS DQ 2 Y 99 1-20
PERMETHRIN, TRANS 8,3 9999.999 0 - 9999.999
PERMETHRIN, TRANS UNITS 1 Y 9 5
PERMETHRIN, TRANS DQ 2 Y 99 1-20
2,4-DINITROPHENOL 8,3 9999.999 0 - 9999.999
2,4-DINITROPHENOL UNITS 1 Y 9 5
2,4-DINITROPHENOL DQ 2 Y 99 1-20
ISOQUINOLINE 8,3 9999.999 0 - 9999.999
ISOQUINOLINE UNITS 1 Y 9 5
ISOQUINOLINE DQ 2 Y 99 1-20
AZOBENZENE 8,3 9999.999 0 - 9999.999
AZOBENZENE UNITS 1 Y 9 5
23

AZOBENZENE DQ 2 Y 99 1-20
24

Table 8. Herb.csv
Field Name Field
Size
Look-up
Table
Format Value Range/Default
Organics: Herbicides
DATA SET NUMBER 2 99 1-99
DATABASE SAMPLE NUMBER 3 999 1-999
RIVER 2 Y 99 1-99
NAVIGATION POOL 2 Y 99 1-99
RIVER MILE 5,1 999.9 0-900.0
RIVER MILE UNITS 2 Y 99 10
SAMPLE COORDINATES NORTHING 7 9999999 0-9999999
SAMPLE COORDINATES NORTHING UNITS 2 Y 99 15
SAMPLE COORDINATES EASTING 7 9999999 0-9999999
SAMPLE COORDINATES EASTING UNITS 2 Y 99 15
SAMPLE TYPE 2 Y 99 1-20
BUTACHLOR 8,3 9999.999 0 - 9999.999
BUTACHLOR UNITS 1 Y 9 5
BUTACHLOR DQ 2 Y 99 1-20
ISOPROPALIN 8,3 9999.999 0 - 9999.999
ISOPROPALIN UNITS 1 Y 9 5
ISOPROPALIN DQ 2 Y 99 1-20
TRIFLURALIN 8,3 9999.999 0 - 9999.999
TRIFLURALIN UNITS 1 Y 9 5
TRIFLURALIN DQ 2 Y 99 1-20
ATRAZINE 8,3 9999.999 0 - 9999.999
ATRAZINE UNITS 1 Y 9 5
ATRAZINE DQ 2 Y 99 1-20
DCPA 8,3 9999.999 0 - 9999.999
DCPA UNITS 1 Y 9 5
DCPA DQ 2 Y 99 1-20
25

2-METHYL-4,6-DINITROPHENOL 8,3 9999.999 0 - 9999.999
2-METHYL-4,6-DINITROPHENOL UNITS 1 Y 9 5
2-METHYL-4,6-DINITROPHENOL DQ 2 Y 99 1-20
2,4-DICHLOROPHENOL 8,3 9999.999 0 - 9999.999
2,4-DICHLOROPHENOL UNITS 1 Y 9 5
2,4-DICHLOROPHENOL DQ 2 Y 99 1-20
26
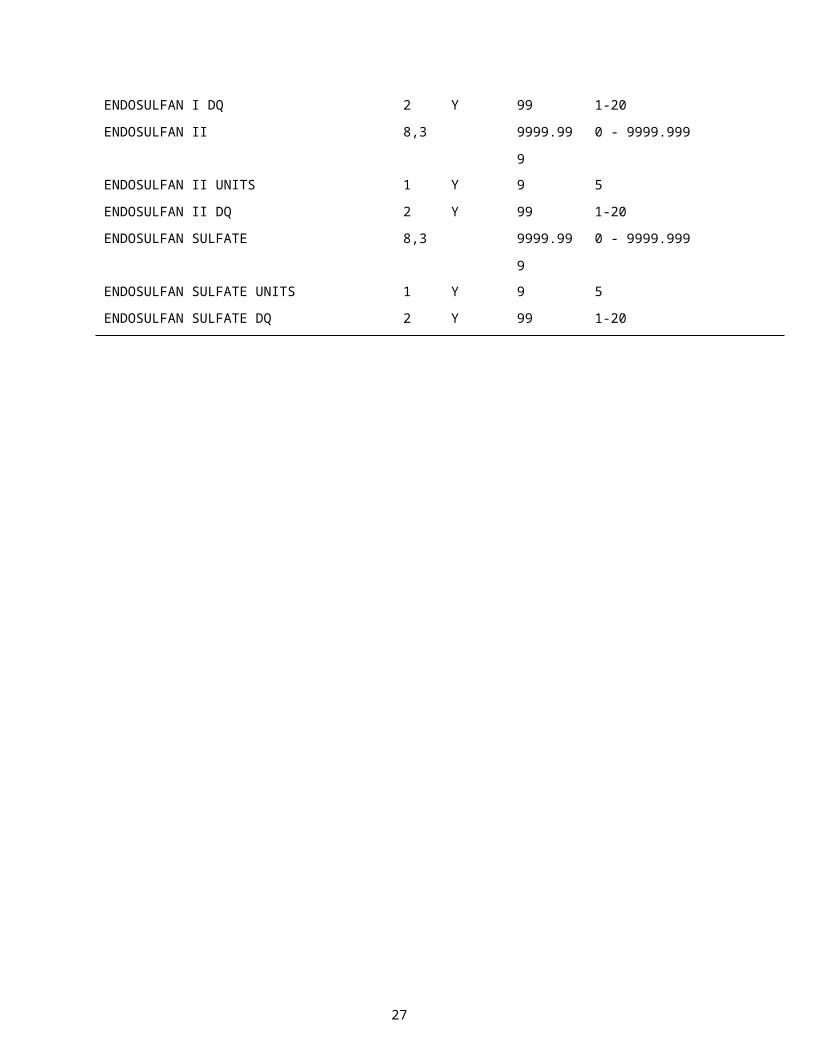
Table 9. Fung.csv
Field Name Field
Size
Look-up
Table
Format Value Range/Default
Organics: Fungicides
DATA SET NUMBER 2 99 1-99
DATABASE SAMPLE NUMBER 3 999 1-999
RIVER 2 Y 99 1-99
NAVIGATION POOL 2 Y 99 1-99
RIVER MILE 5,1 999.9 0-900.0
RIVER MILE UNITS 2 Y 99 10
SAMPLE COORDINATES NORTHING 7 9999999 0-9999999
SAMPLE COORDINATES NORTHING UNITS 2 Y 99 15
SAMPLE COORDINATES EASTING 7 9999999 0-9999999
SAMPLE COORDINATES EASTING UNITS 2 Y 99 15
SAMPLE TYPE 2 Y 99 1-20
HEXACHLOROBENZENE 8,3 9999.999 0 - 9999.999
HEXACHLOROBENZENE UNITS 1 Y 9 5
HEXACHLOROBENZENE DQ 2 Y 99 1-20
PENTACHLORONITROBENZENE 8,3 9999.999 0 - 9999.999
PENTACHLORONITROBENZENE UNITS 1 Y 9 5
PENTACHLORONITROBENZEN E DQ 2 Y 99 1-20
CHLORONEB 8,3 9999.999 0 - 9999.999
CHLORONEB UNITS 1 Y 9 5
CHLORONEB DQ 2 Y 99 1-20
P-CRESOL 8,3 9999.999 0 - 9999.999
P-CRESOL UNITS 1 Y 9 5
P-CRESOL DQ 2 Y 99 1-20
2,4,6-TRICHLOROPHENOL 8,3 9999.999 0 - 9999.999
2,4,6-TRICHLOROPHENOL UNITS 1 Y 9 5
2,4,6-TRICHLOROPHENOL DQ 2 Y 99 1-20
27
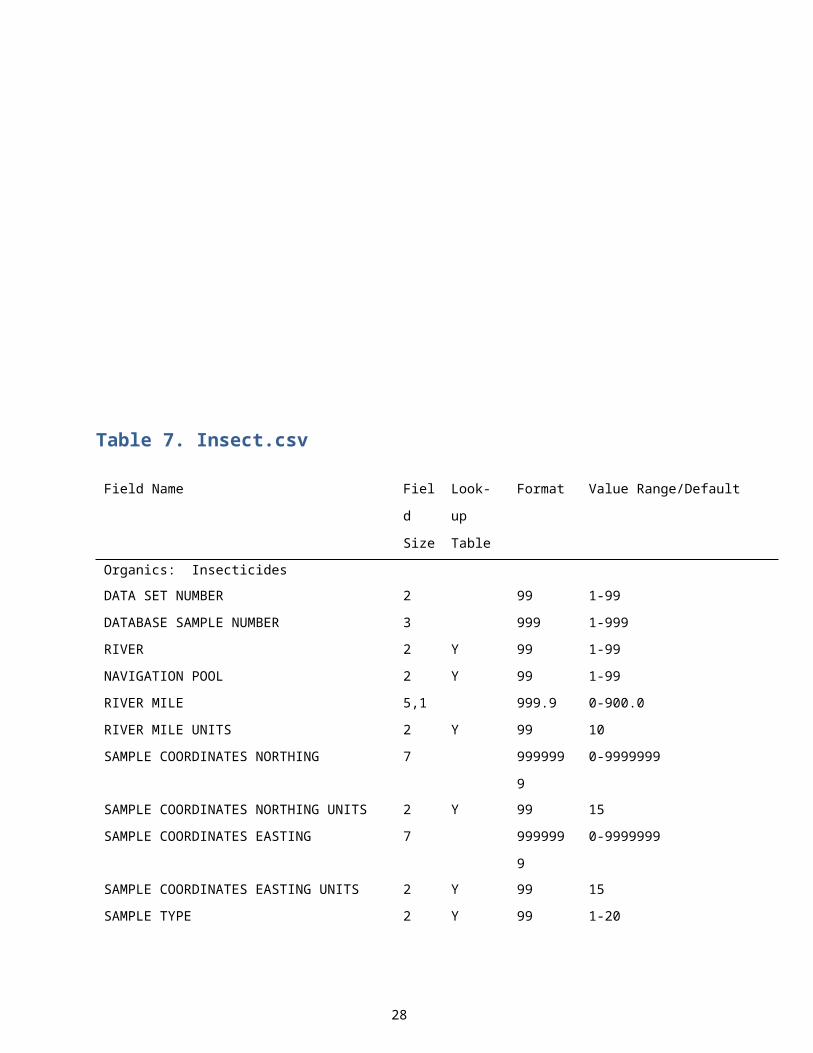
Table 10. Indusmis.csv
Field Name Field
Size
Look-up
Table
Format Value Range/Default
Organics: Industrial and Miscellaneous Compounds
DATA SET NUMBER 2 99 1-99
DATABASE SAMPLE NUMBER 3 999 1-999
RIVER 2 Y 99 1-99
NAVIGATION POOL 2 Y 99 1-99
RIVER MILE 5,1 999.9 0-900.0
RIVER MILE UNITS 2 Y 99 10
SAMPLE COORDINATES NORTHING 7 9999999 0-9999999
SAMPLE COORDINATES NORTHING UNITS 2 Y 99 15
SAMPLE COORDINATES EASTING 7 9999999 0-9999999
SAMPLE COORDINATES EASTING UNITS 2 Y 99 15
SAMPLE TYPE 2 Y 99 1-20
PENTACHLOROPHENOL 8,3 9999.999 0 - 9999.999
PENTACHLOROPHENOL UNITS 1 Y 9 5
PENTACHLOROPHENOL DQ 2 Y 99 1-20
1,2,4-TRICHLOROBENZENE 8,3 9999.999 0 - 9999.999
1,2,4-TRICHLOROBENZENE UNITS 1 Y 9 5
1,2,4-TRICHLOROBENZENE DQ 2 Y 99 1-20
4-CHLORO-3-METHYLPHENOL 8,3 9999.999 0 - 9999.999
4-CHLORO-3-METHYLPHENOL UNITS 1 Y 9 5
4-CHLORO-3-METHYLPHENOL DQ 2 Y 99 1-20
1,2-DICHLOROBENZENE 8,3 9999.999 0 - 9999.999
1,2-DICHLOROBENZENE UNITS 1 Y 9 5
1,2-DICHLOROBENZENE DQ 2 Y 99 1-20
1,3-DICHLOROBENZENE 8,3 9999.999 0 - 9999.999
28

1,3-DICHLOROBENZENE UNITS 1 Y 9 5
1,3-DICHLOROBENZENE DQ 2 Y 99 1-20
1,4-DICHLOROBENZENE 8,3 9999.999 0 - 9999.999
1,4-DICHLOROBENZENE UNITS 1 Y 9 5
1,4-DICHLOROBENZENE DQ 2 Y 99 1-20
NITROBENZENE 8,3 9999.999 0 - 9999.999
NITROBENZENE UNITS 1 Y 9 5
NITROBENZENE DQ 2 Y 99 1-20
3,3'-DICHLOROBENZIDINE 8,3 9999.999 0 - 9999.999
3,3'-DICHLOROBENZIDINE UNITS 1 Y 9 5
3,3'-DICHLOROBENZIDINE DQ 2 Y 99 1-20
BENZIDINE 8,3 9999.999 0 - 9999.999
BENZIDINE UNITS 1 Y 9 5
BENZIDINE DQ 2 Y 99 1-20
QUINOLINE 8,3 9999.999 0 - 9999.999
QUINOLINE UNITS 1 Y 9 5
QUINOLINE DQ 2 Y 99 1-20
CARBAZOLE 8,3 9999.999 0 - 9999.999
CARBAZOLE UNITS 1 Y 9 5
CARBAZOLE DQ 2 Y 99 1-20
N-NITROSODIMETHYLAMINE 8,3 9999.999 0 - 9999.999
N-NITROSODIMETHYLAMINE UNITS 1 Y 9 5
N-NITROSODIMETHYLAMINE DQ 2 Y 99 1-20
HEXACHLOROETHANE 8,3 9999.999 0 - 9999.999
HEXACHLOROETHANE UNITS 1 Y 9 5
HEXACHLOROETHANE DQ 2 Y 99 1-20
2-NITROPHENOL 8,3 9999.999 0 - 9999.999
2-NITROPHENOL UNITS 1 Y 9 5
2-NITROPHENOL DQ 2 Y 99 1-20
3-NITROPHENOL 8,3 9999.999 0 - 9999.999
3-NITROPHENOL UNITS 1 Y 9 5
3-NITROPHENOL DQ 2 Y 99 1-20
29

4-NITROPHENOL 8,3 9999.999 0 - 9999.999
4-NITROPHENOL UNITS 1 Y 9 5
4-NITROPHENOL DQ 2 Y 99 1-20
9,10-ANTHRAQUINON 8,3 9999.999 0 - 9999.999
9,10-ANTHRAQUINON UNITS 1 Y 9 5
9,10-ANTHRAQUINON DQ 2 Y 99 1-20
PHENOL 8,3 9999.999 0 - 9999.999
PHENOL UNITS 1 Y 9 5
PHENOL DQ 2 Y 99 1-20
DIETHYL PHTHALATE 8,3 9999.999 0 - 9999.999
DIETHYL PHTHALATE UNITS 1 Y 9 5
DIETHYL PHTHALATE DQ 2 Y 99 1-20
DI-N-BUTYL PHTHALATE 8,3 9999.999 0 - 9999.999
DI-N-BUTYL PHTHALATE UNITS 1 Y 9 5
DI-N-BUTYL PHTHALATE DQ 2 Y 99 1-20
DIMETHYL PHTHALATE 8,3 9999.999 0 - 9999.999
DIMETHYL PHTHALATE UNITS 1 Y 9 5
DIMETHYL PHTHALATE DQ 2 Y 99 1-20
BIS (2-ETHYLHEXYL) PHTHALATE 8,3 9999.999 0 - 9999.999
BIS (2-ETHYLHEXYL) PHTHALATE UNITS 1 Y 9 5
BIS (2-ETHYLHEXYL) PHTHALATE DQ 2 Y 99 1-20
DI-N-OCTYL PHTHALATE 8,3 9999.999 0 - 9999.999
DI-N-OCTYL PHTHALATE UNITS 1 Y 9 5
DI-N-OCTYL PHTHALATE DQ 2 Y 99 1-20
BUTYL BENZYL PHTHALATE 8,3 9999.999 0 - 9999.999
BUTYL BENZYL PHTHALATE UNITS 1 Y 9 5
BUTYL BENZYL PHTHALATE DQ 2 Y 99 1-20
P-DICHLOROBENZENE 8,3 9999.999 0 - 9999.999
P-DICHLOROBENZENE UNITS 1 Y 9 5
P-DICHLOROBENZENE DQ 2 Y 99 1-20
M-DICHLOROBENZENE 8,3 9999.999 0 - 9999.999
M-DICHLOROBENZENE UNITS 1 Y 9 5
30

M-DICHLOROBENZENE DQ 2 Y 99 1-20
BIS (2-CHLOROETHOXY) METHANE 8,3 9999.999 0 - 9999.999
BIS (2-CHLOROETHOXY) METHANE UNITS 1 Y 9 5
BIS (2-CHLOROETHOXY) METHANE DQ 2 Y 99 1-20
BIS (2-CHLOROETHYL) ETHER 8,3 9999.999 0 - 9999.999
BIS (2-CHLOROETHYL) ETHER UNITS 1 Y 9 5
BIS (2-CHLOROETHYL) ETHER DQ 2 Y 99 1-20
BIS (2-CHLOROISOPROPYL) ETHER 8,3 9999.999 0 - 9999.999
BIS (2-CHLOROISOPROPYL) ETHER UNITS 1 Y 9 5
BIS (2-CHLOROISOPROPYL) ETHER DQ 2 Y 99 1-20
4-CHLOROPHENYL PHENYL ETHER 8,3 9999.999 0 - 9999.999
4-CHLOROPHENYL PHENYL ETHER UNITS 1 Y 9 5
4-CHLOROPHENYL PHENYL ETHER DQ 2 Y 99 1-20
4-BROMOPHENYL PHENYL ETHER 8,3 9999.999 0 - 9999.999
4-BROMOPHENYL PHENYL ETHER UNITS 1 Y 9 5
4-BROMOPHENYL PHENYL ETHER DQ 2 Y 99 1-20
2,4-DINITROTOLUENE 8,3 9999.999 0 - 9999.999
2,4-DINITROTOLUENE UNITS 1 Y 9 5
2,4-DINITROTOLUENE DQ 2 Y 99 1-20
2,6-DINITROTOLUENE 8,3 9999.999 0 - 9999.999
2,6-DINITROTOLUENE UNITS 1 Y 9 5
2,6-DINITROTOLUENE DQ 2 Y 99 1-20
1,2-DIPHENYLHYDRAZINE 8,3 9999.999 0 - 9999.999
1,2-DIPHENYLHYDRAZINE UNITS 1 Y 9 5
1,2-DIPHENYLHYDRAZINE DQ 2 Y 99 1-20
HEXACHLOROBUTADIENE 8,3 9999.999 0 - 9999.999
HEXACHLOROBUTADIENE UNITS 1 Y 9 5
HEXACHLOROBUTADIENE DQ 2 Y 99 1-20
N– NITROSODI-N-PROPYLAMINE 8,3 9999.999 0 - 9999.999
N– NITROSODI-N-PROPYLAMINE UNITS 1 Y 9 5
N– NITROSODI-N-PROPYLAMINE DQ 2 Y 99 1-20
N-NITROSODIPHENYLAMINE 8,3 9999.999 0 - 9999.999
31

N-NITROSODIPHENYLAMINE UNITS 1 Y 9 5
N-NITROSODIPHENYLAMINE DQ 2 Y 99 1-20
ISOPHORONE 8,3 9999.999 0 - 9999.999
ISOPHORONE UNITS 1 Y 9 5
ISOPHORONE DQ 2 Y 99 1-20
2-CHLOROPHENOL 8,3 9999.999 0 - 9999.999
2-CHLOROPHENOL UNITS 1 Y 9 5
2-CHLOROPHENOL DQ 2 Y 99 1-20
2,4-DIMETHYLPHENOL 8,3 9999.999 0 - 9999.999
2,4-DIMETHYLPHENOL UNITS 1 Y 9 5
2,4-DIMETHYLPHENOL DQ 2 Y 99 1-20
2,2'-METHYLENEBIPHENYL 8,3 9999.999 0 - 9999.999
2,2'-METHYLENEBIPHENYL UNITS 1 Y 9 5
2,2'-METHYLENEBIPHENYL DQ 2 Y 99 1-20
GROSS POLYCHLORINATED
NAPHTHALENES
8,3 9999.999 0 - 9999.999
GROSS POLYCHLORINATED
NAPHTHALENES UNITS
1 Y 9 5
GROSS POLYCHLORINATED
NAPHTHALENES DQ
2 Y 99 1-20
MESITOL 8,3 9999.999 0 - 9999.999
MESITOL UNITS 1 Y 9 5
MESITOL DQ 2 Y 99 1-20
ACETONE 8,3 9999.999 0 - 9999.999
ACETONE UNITS 1 Y 9 5
ACETONE DQ 2 Y 99 1-20
BENZENE 8,3 9999.999 0 - 9999.999
BENZENE UNITS 1 Y 9 5
BENZENE DQ 2 Y 99 1-20
BROMODICHLOROMETHANE 8,3 9999.999 0 - 9999.999
BROMODICHLOROMETHANE UNITS 1 Y 9 5
BROMODICHLOROMETHANE DQ 2 Y 99 1-20
2-BUTANONE 8,3 9999.999 0 - 9999.999
32

2-BUTANONE UNITS 1 Y 9 5
2-BUTANONE DQ 2 Y 99 1-20
CARBON DISULFIDE 8,3 9999.999 0 - 9999.999
CARBON DISULFIDE UNITS 1 Y 9 5
CARBON DISULFIDE DQ 2 Y 99 1-20
CHLOROMETHANE 8,3 9999.999 0 - 9999.999
CHLOROMETHANE UNITS 1 Y 9 5
CHLOROMETHANE DQ 2 Y 99 1-20
1,2-DICHLOROETHENE 8,3 9999.999 0 - 9999.999
1,2-DICHLOROETHENE UNITS 1 Y 9 5
1,2-DICHLOROETHENE DQ 2 Y 99 1-20
METHYL CHLORIDE 8,3 9999.999 0 - 9999.999
METHYL CHLORIDE UNITS 1 Y 9 5
METHYL CHLORIDE DQ 2 Y 99 1-20
TETRACHLOROETHENE 8,3 9999.999 0 - 9999.999
TETRACHLOROETHENE UNITS 1 Y 9 5
TETRACHLOROETHENE DQ 2 Y 99 1-20
TOLUENE 8,3 9999.999 0 - 9999.999
TOLUENE UNITS 1 Y 9 5
TOLUENE DQ 2 Y 99 1-20
1,1,1-TRICHLOROETHANE 8,3 9999.999 0 - 9999.999
1,1,1-TRICHLOROETHANE UNITS 1 Y 9 5
1,1,1-TRICHLOROETHANE DQ 2 Y 99 1-20
TRICHLOROETHENE 8,3 9999.999 0 - 9999.999
TRICHLOROETHENE UNITS 1 Y 9 5
TRICHLOROETHENE DQ 2 Y 99 1-20
VINYL CHLORIDE 8,3 9999.999 0 - 9999.999
VINYL CHLORIDE UNITS 1 Y 9 5
VINYL CHLORIDE DQ 2 Y 99 1-20
XYLENES, TOTAL 8,3 9999.999 0 - 9999.999
XYLENES, TOTAL UNITS 1 Y 9 5
XYLENES, TOTAL DQ 2 Y 99 1-20
33

POLYDIMETHYLSILOXANE 8,3 9999.999 0 - 9999.999
POLYDIMETHYLSILOXANE UNITS 1 Y 9 5
POLYDIMETHYLSILOXANE DQ 2 Y 99 1-20
Table 11. Sterols.csv
Field Name Field
Size
Look-up
Table
Format Value Range/Default
Organics: Sterols
DATA SET NUMBER 2 99 1-99
DATABASE SAMPLE NUMBER 3 999 1-999
RIVER 2 Y 99 1-99
NAVIGATION POOL 2 Y 99 1-99
RIVER MILE 5,1 999.9 0-900.0
RIVER MILE UNITS 2 Y 99 10
SAMPLE COORDINATES NORTHING 7 9999999 0-9999999
SAMPLE COORDINATES NORTHING UNITS 2 Y 99 15
SAMPLE COORDINATES EASTING 7 9999999 0-9999999
SAMPLE COORDINATES EASTING UNITS 2 Y 99 15
SAMPLE TYPE 2 Y 99 1-20
COPROSTANOL 8,3 9999.999 0 - 9999.999
COPROSTANOL UNITS 1 Y 9 3
COPROSTANOL DQ 2 Y 99 1-20
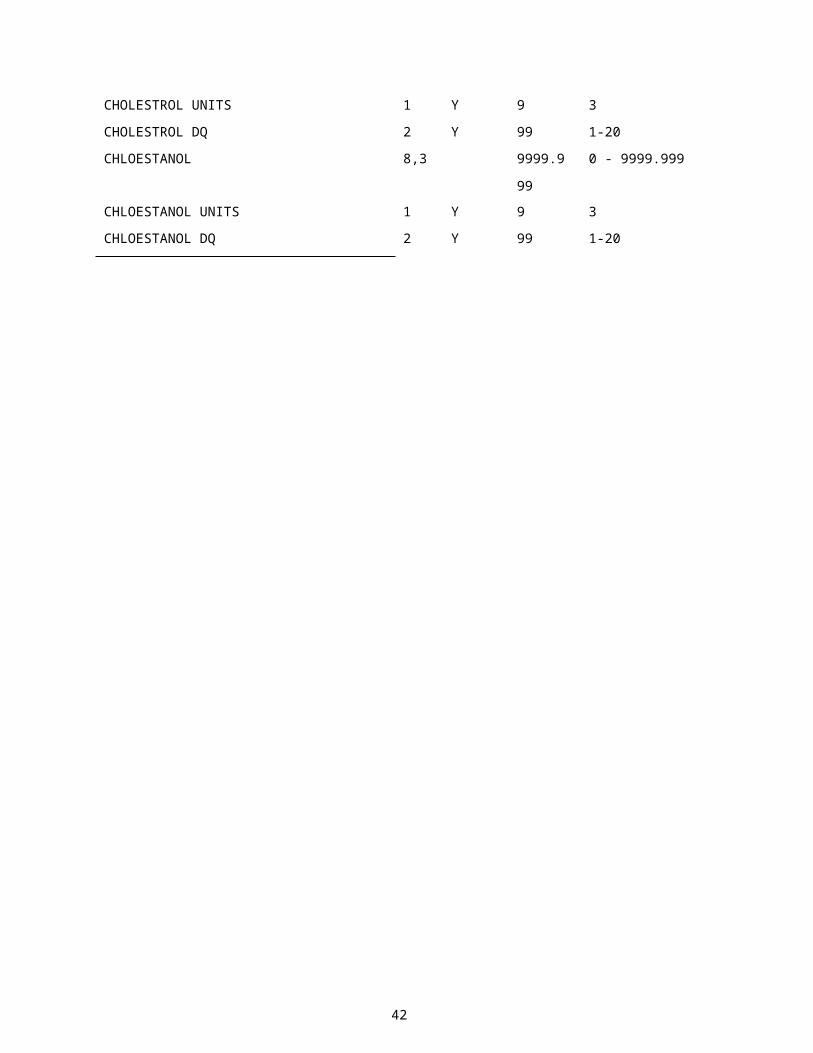
CHOLESTROL 8,3 9999.999 0 - 9999.999
CHOLESTROL UNITS 1 Y 9 3
CHOLESTROL DQ 2 Y 99 1-20
CHLOESTANOL 8,3 9999.999 0 - 9999.999
CHLOESTANOL UNITS 1 Y 9 3
CHLOESTANOL DQ 2 Y 99 1-20
34

Table 12. Petrocmp.csv
Field Name Field
Size
Look-up
Table
Format Value Range/Default
Organics: Petroleum-Related Compounds
DATA SET NUMBER 2 99 1-99
DATABASE SAMPLE NUMBER 3 999 1-999
RIVER 2 Y 99 1-99
NAVIGATION POOL 2 Y 99 1-99
RIVER MILE 5,1 999.9 0-900.0
RIVER MILE UNITS 2 Y 99 10
SAMPLE COORDINATES NORTHING 7 9999999 0-9999999
SAMPLE COORDINATES NORTHING UNITS 2 Y 99 15
SAMPLE COORDINATES EASTING 7 9999999 0-9999999
SAMPLE COORDINATES EASTING UNITS 2 Y 99 15
SAMPLE TYPE 2 Y 99 1-20
OIL AND GREASE 8,3 9999.999 0 - 9999.999
OIL AND GREASE UNITS 1 Y 9 3
OIL AND GREASE DQ 2 Y 99 1-20
N-DODECANE 8,3 9999.999 0 - 9999.999
N-DODECANE UNITS 1 Y 9 3
N-DODECANE DQ 2 Y 99 1-20
N-TRIDECANE 8,3 9999.999 0 - 9999.999
N-TRIDECANE UNITS 1 Y 9 3
N-TRIDECANE DQ 2 Y 99 1-20
N-TETRADECANE 8,3 9999.999 0 - 9999.999
N-TETRADECANE UNITS 1 Y 9 3
N-TETRADECANE DQ 2 Y 99 1-20
OCTYLCYCLOHEXANE 8,3 9999.999 0 - 9999.999
OCTYLCYCLOHEXANE UNITS 1 Y 9 3
OCTYLCYCLOHEXANE DQ 2 Y 99 1-20
35

N-PENTADECANE 8,3 9999.999 0 - 9999.999
N-PENTADECANE UNITS 1 Y 9 3
N-PENTADECANE DQ 2 Y 99 1-20
NONYLCYCLOHEXANE 8,3 9999.999 0 - 9999.999
NONYLCYCLOHEXANE UNITS 1 Y 9 3
NONYLCYCLOHEXANE DQ 2 Y 99 1-20
N-HEXADECANE 8,3 9999.999 0 - 9999.999
N-HEXADECANE UNITS 1 Y 9 3
N-HEXADECANE DQ 2 Y 99 1-20
N-HEPTADECANE 8,3 9999.999 0 - 9999.999
N-HEPTADECANE UNITS 1 Y 9 3
N-HEPTADECANE DQ 2 Y 99 1-20
PRISTANE 8,3 9999.999 0 - 9999.999
PRISTANE UNITS 1 Y 9 3
PRISTANE DQ 2 Y 99 1-20
N-OCTADECANE 8,3 9999.999 0 - 9999.999
N-OCTADECANE UNITS 1 Y 9 3
N-OCTADECANE DQ 2 Y 99 1-20
PHYTANE 8,3 9999.999 0 - 9999.999
PHYTANE UNITS 1 Y 9 3
PHYTANE DQ 2 Y 99 1-20
N-NONADECANE 8,3 9999.999 0 - 9999.999
N-NONADECANE UNITS 1 Y 9 3
N-NONADECANE DQ 2 Y 99 1-20
N-EICOSANE 8,3 9999.999 0 - 9999.999
N-EICOSANE UNITS 1 Y 9 3
N-EICOSANE DQ 2 Y 99 1-20
36

Table 13. Pcbs.csv
Field Name Field
Size
Look-up
Table
Format Value Range/Default
Organics: Polychlorinated Biphenyls (PCB)
DATA SET NUMBER 2 99 1-99
DATABASE SAMPLE NUMBER 3 999 1-999
RIVER 2 Y 99 1-99
NAVIGATION POOL 2 Y 99 1-99
RIVER MILE 5,1 999.9 0-900.0
RIVER MILE UNITS 2 Y 99 10
SAMPLE COORDINATES NORTHING 7 9999999 0-9999999
SAMPLE COORDINATES NORTHING UNITS 2 Y 99 15
SAMPLE COORDINATES EASTING 7 9999999 0-9999999
SAMPLE COORDINATES EASTING UNITS 2 Y 99 15
SAMPLE TYPE 2 Y 99 1-20
TOTAL PCB 8,3 9999.999 0 - 9999.999
TOTAL PCB UNITS 1 Y 9 5
TOTAL PCB DQ 2 Y 99 1-20
NUMBER OF PCB CONGENERS 3 999 1-150
AROCHLOR 1242 8,3 9999.999 0 - 9999.999
AROCHLOR 1242 UNITS 1 Y 9 5
AROCHLOR 1242 DQ 2 Y 99 1-20
AROCHLOR 1248 8,3 9999.999 0 - 9999.999
AROCHLOR 1248 UNITS 1 Y 9 5
AROCHLOR 1248 DQ 2 Y 99 1-20
AROCHLOR 1254 8,3 9999.999 0 - 9999.999
AROCHLOR 1254 UNITS 1 Y 9 5
AROCHLOR 1254 DQ 2 Y 99 1-20
AROCHLOR 1260 8,3 9999.999 0 - 9999.999
AROCHLOR 1260 UNITS 1 Y 9 5
37

AROCHLOR 1260 DQ 2 Y 99 1-20
AROCHLOR 1016 8,3 9999.999 0 - 9999.999
AROCHLOR 1016 UNITS 1 Y 9 5
AROCHLOR 1016 DQ 2 Y 99 1-20
AROCHLOR 1221 8,3 9999.999 0 - 9999.999
AROCHLOR 1221 UNITS 1 Y 9 5
AROCHLOR 1221 DQ 2 Y 99 1-20
AROCHLOR 1232 8,3 9999.999 0 - 9999.999
AROCHLOR 1232 UNITS 1 Y 9 5
AROCHLOR 1232 DQ 2 Y 99 1-20
38

Table 14. Toxicity.csv
Field Name Field
Size
Look-up
Table
Format Value Range/Default
Sediment Toxicity Variables
DATA SET NUMBER 2 99 1-99
DATABASE SAMPLE NUMBER 3 999 1-999
RIVER 2 Y 99 1-99
NAVIGATION POOL 2 Y 99 1-99
RIVER MILE 2 Y 99 10
RIVER MILE UNITS 5 Y c(5) miles
SAMPLE COORDINATES NORTHING 7 9999999 0-9999999
SAMPLE COORDINATES NORTHING UNITS 2 Y 99 15
SAMPLE COORDINATES EASTING 7 9999999 0-9999999
SAMPLE COORDINATES EASTING UNITS 2 Y 99 15
SAMPLE TYPE 2 Y 99 1-20
SEDIMENT CODE 1 Y 9 1-9
TEST ORGANISM 2 Y 99 1-20
DURATION OF EXPOSURE 3 999 0-999
DURATION OF EXPOSURE UNITS 2 Y 99 12
BIOLOGICAL RESPONSE 2 Y 99 1-20
BIOLOGICAL RESPONSE DQ 1 Y 9 1-9
39

1. Variable Descriptions and Definitions
Below are the definitions of the fields within each of the tables
1.1. Data-source variables
DATA SET NUMBER
This is a number given to each distinct data set where the data were obtained. The format for the variable
is a look-up table where the valid codes are as follows.
1 = 12 = 23 = 34 = 45 = 56 = 67 = 78 = 89 = 910 = 1011 = 1112 = 1213 = 1314 = 1415 = 1516 = 1617 = 1718 = 1819 = 1920 = 2021 = 2122 = 2223 = 2324 = 2425 = 2526 = 2627 = 2728 = 2829 = 2930 = 3031 = 3132 = 3233 = Other
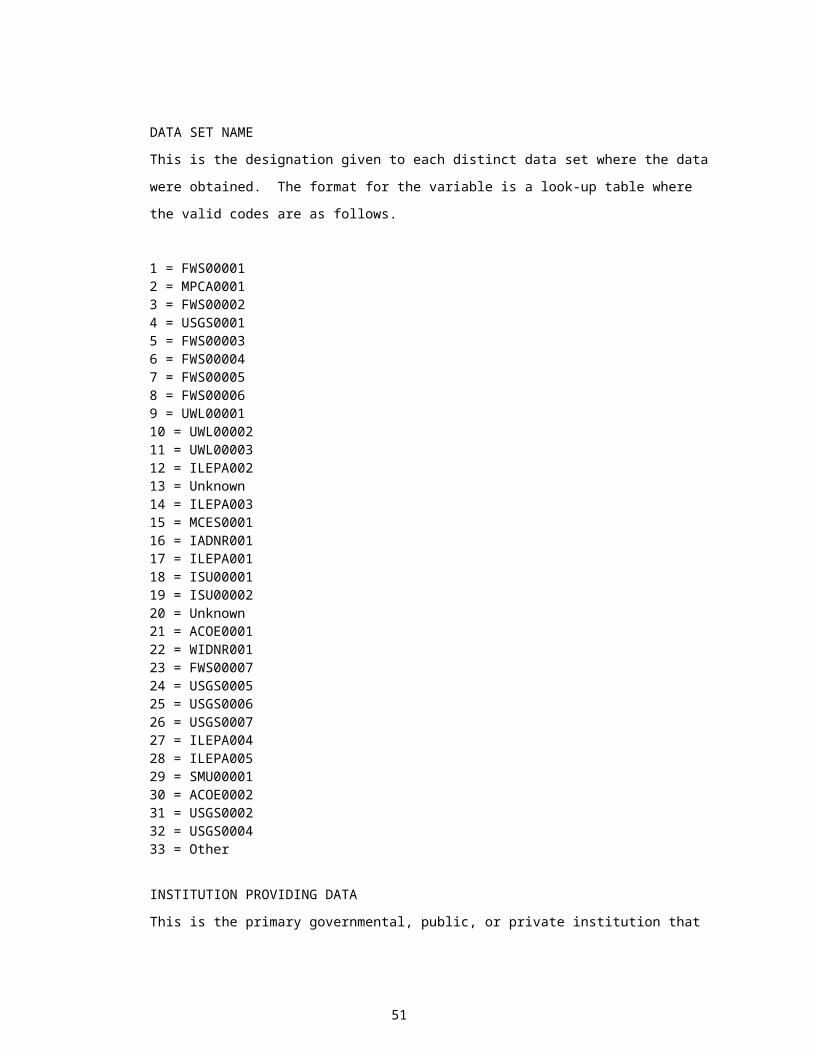
DATA SET NAME
This is the designation given to each distinct data set where the data were obtained. The format for the
variable is a look-up table where the valid codes are as follows.
1 = FWS000012 = MPCA00013 = FWS00002
40

4 = USGS00015 = FWS000036 = FWS000047 = FWS000058 = FWS000069 = UWL0000110 = UWL0000211 = UWL0000312 = ILEPA00213 = Unknown14 = ILEPA00315 = MCES000116 = IADNR00117 = ILEPA00118 = ISU0000119 = ISU0000220 = Unknown21 = ACOE000122 = WIDNR00123 = FWS0000724 = USGS000525 = USGS000626 = USGS000727 = ILEPA00428 = ILEPA00529 = SMU0000130 = ACOE000231 = USGS000232 = USGS000433 = Other
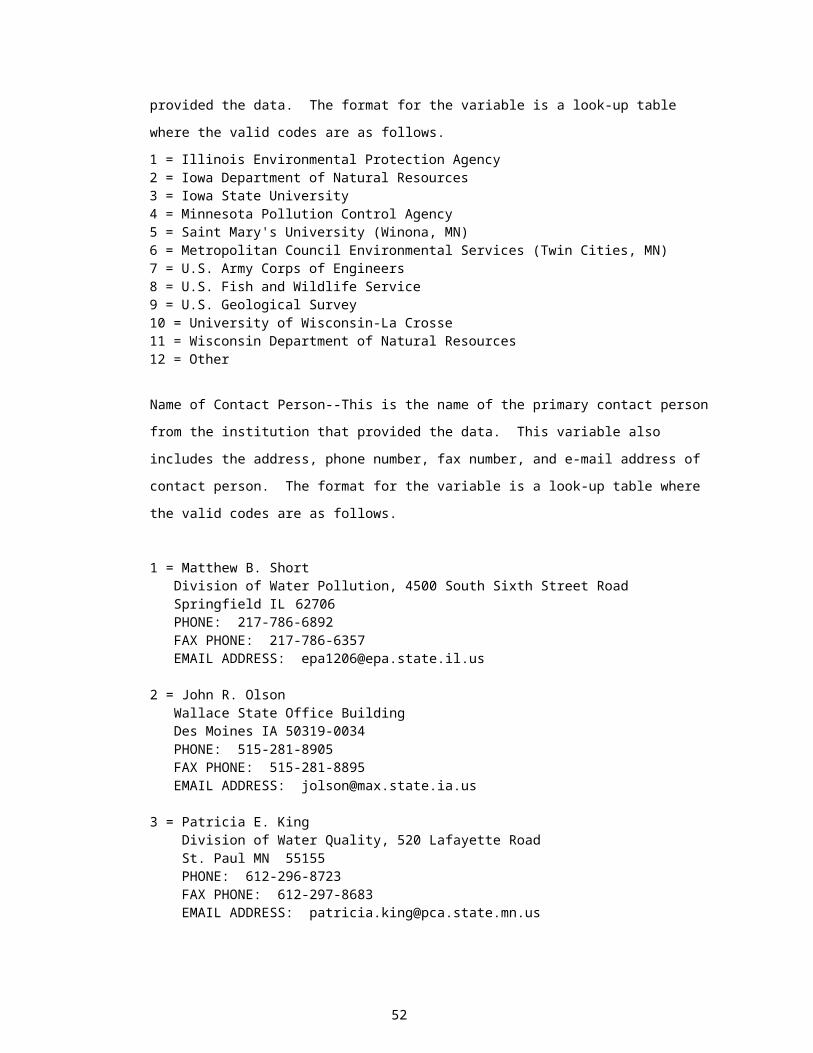
INSTITUTION PROVIDING DATA
This is the primary governmental, public, or private institution that provided the data. The format for the
variable is a look-up table where the valid codes are as follows.
1 = Illinois Environmental Protection Agency2 = Iowa Department of Natural Resources3 = Iowa State University4 = Minnesota Pollution Control Agency5 = Saint Mary's University (Winona, MN)6 = Metropolitan Council Environmental Services (Twin Cities, MN) 7 = U.S. Army Corps of Engineers8 = U.S. Fish and Wildlife Service9 = U.S. Geological Survey10 = University of Wisconsin-La Crosse11 = Wisconsin Department of Natural Resources12 = Other
Name of Contact Person--This is the name of the primary contact person from the institution that provided
the data. This variable also includes the address, phone number, fax number, and e-mail address of
contact person. The format for the variable is a look-up table where the valid codes are as follows.
41
1 = Matthew B. ShortDivision of Water Pollution, 4500 South Sixth Street RoadSpringfield IL 62706 PHONE: 217-786-6892FAX PHONE: 217-786-6357EMAIL ADDRESS: [email protected]
2 = John R. OlsonWallace State Office BuildingDes Moines IA 50319-0034PHONE: 515-281-8905FAX PHONE: 515-281-8895EMAIL ADDRESS: [email protected]
3 = Patricia E. King Division of Water Quality, 520 Lafayette Road St. Paul MN 55155 PHONE: 612-296-8723 FAX PHONE: 612-297-8683 EMAIL ADDRESS: [email protected]
4 = John F. Sullivan 3550 Mormon Coulee Road, Box 108 La Crosse WI 54601 PHONE: 608-785-9995 FAX PHONE: 608-785-9990 EMAIL ADDRESS: [email protected]
5 = Jody G. Millar Rock Island Field Office, 4469 48th Avenue Court Rock Island IL 61201
PHONE: 309-793-5800 FAX PHONE: 309-793-5804 EMAIL ADDRESS: [email protected]
6 = George E. Groschen Water Resources Division, 221 North Broadway Urbana IL 61801 PHONE: 217-344-0037 FAX PHONE: 217-344-0082 EMAIL ADDRESS: [email protected]
7 = John A. Moody Water Resources Division, Box 25046, Denver Federal Center, MS 413 Denver CO 80225-0046 PHONE: 303-236-0606 EMAIL ADDRESS: [email protected]
8 = James G. Wiener Upper Midwest Environmental Sciences Center La Crosse WI 54602-0818 PHONE: 608-783-6451 FAX PHONE: 608-783-6066 EMAIL ADDRESS: [email protected]
42

9 = Clint A. Beckert Clock Tower Building, P.O. Box2004 Rock Island IL 61204-2004 PHONE: 309-794-5412 FAX PHONE: 309-794-5584 EMAIL ADDRESS: [email protected]
10 = Bradley E. Frazier 2630 Fanta Reed Road La Crosse WI 54603 PHONE: 509-893-8003 EMAIL ADDRESS: [email protected]
11 = Gary J. Atchison Dept. of Animal Ecology, 124 Science Hall II Ames IA 50011 PHONE: 515-294-4787 FAX PHONE: 515-294-7874 EMAIL ADDRESS: [email protected]
12 = D. Kent Johnson Water Quality Section, 230 East 5th Street, Mears Park Centre St. Paul MN 55101 PHONE: 612-602-8117 FAX PHONE: 612-602-8179 EMAIL ADDRESS: [email protected]
13 = Mark T. Steingraeber La Crosse Fishery Resources Office, 555 Lester Avenue Onalaska WI 54650 PHONE: 608-783-8436 EMAIL ADDRESS: [email protected]
14 = Ronald G. Rada College of Science & Allied Health, 105 Main Hall La Crosse WI 54601 PHONE: 608-785-8259 FAX PHONE: 608-785-8221 EMAIL ADDRESS: [email protected]
15 = Kevin J. Buhl 31247 436th Avenue Yankton SD 57078 PHONE: 605-665-9217 FAX PHONE: 605-665-9335 EMAIL ADDRESS: [email protected]
16 = Michael Coffey Rock Island Field Office, 4469 48th Avenue Court Rock Island IL 61201 PHONE: 608-785-9995 FAX PHONE: 309-793-5804
17 = Other
43

BIBLIOGRAPHIC REFERENCE(S)
These are the primary references which contain some or all of the data for each specific data set. The
format for the variable is a look-up table where the valid codes are as follows.
1 = Copeland, T.A. 1995. 1992 Contaminant survey of the Upper Mississippi River National Wildlife and Fish Refuge, Pools 12 and 14. U.S. Fish and Wildlife Service Report, Study ID No.3103. Rock Island Field Office, Rock Island, IL.
Other data that exist only on data sheets.
2 = Minnesota Pollution Control Agency. 1996. Investigation of the vertical distribution of sediment contaminants in Pool 2 and Lake Pepin of the Upper Mississippi River after the 1993 flood. St. Paul, MN. 56 pp. and appendices.
Other data that exist only on data sheets.
3 = Ruelle, R. and J. Grettenberger. 1991. A preliminary contaminant and toxicological survey of Illinois River sediments. Special Project Report 90-1; U.S. Fish and Wildlife Service, Rock Island Field Office, Rock Island, IL.
Other data that exist only on data sheets.
4 = Caldwell, C. and M. Steingraeber. 1995. Bioavailability of trace metals to green sunfish (Lepomis cyanellus) exposed to suspended sediments from sites on the Upper Mississippi River. National Biological Service, Upper Mississippi Science Center Report, La Crosse WI, to USFWS, Rock Island Field Office, Rock Island, IL.
5 = Mahaffy, M., R. Ruelle, and S. Smith. 1991. A preliminary contaminant survey of the Upper Mississippi River National Wildlife and Fish Refuge. U.S. Fish and Wildlife Service Report. Rock Island Field Office, Rock Island, IL.
Other data that exist only on data sheets.
6 = Young, M. 1992. Survey for contaminants in sediments and fish at selected sites on the Illinois River and tributaries. U.S. Fish and Wildlife Report. Rock Island Field Office, Rock Island, IL.
Other data that exist only on data sheets.
7 = Ensor, K. and S. Smith. 1996. Potential toxicities of sediments a point source discharge sites along the Upper Mississippi National Wildlife and Fish Refuge. U.S. Fish and Wildlife Service Report. Project ID 92 and 94-3N05.
Other data that exist only on data sheets.
8 = Young, M. 1991. Survey for contaminants in sediments at selected sites on the Upper Mississippi River (RM 579 to RM 3) including the Mark Twain National Wildlife Refuge. U.S. Fish and Wildlife Report, Rock Island Field Office, Rock Island, IL.
Other data that exist only on data sheets.
9 = Frazier, B.E., T.J. Naimo, and M.B. Sandheinrich. 1996. Temporal and vertical distribution of total ammonia nitrogen and un-ionized ammonia nitrogen in sediment pore water from the upper Mississippi River. Environmental Toxicology and Chemistry 15:92-99.
44

Frazier, B.E. 1994. Temporal and vertical distribution of un-ionized ammonia and total ammonia nitrogen in sediment pore water in Pool 8, upper Mississippi River. Master of Science thesis, University of Wisconsin-La Crosse, La Crosse, WI.
Other data that exist only on data sheets.
10 = Minnesota Pollution Control Agency. 1996. Investigation of the vertical distribution of sediment contaminants in Pool 2 and Lake Pepin of the Upper Mississippi River after the 1993 flood. St. Paul, MN. 56 pp. and appendices.
Lebo, J.A., J.L. Zajicek, D. Tillitt, and T.R. Schwartz. 1990. Analyses of sediment cores form the Upper Mississippi River for polychlorinated biphenyls. U.S. Fish and Wildlife Service, Final Laboratory Report FY90-30-5. National Fisheries Contaminant Research Center, Columbia, MO.
Other data that exist only on data sheets.
11= Bailey, P.A. 1983. Distribution and enrichment of trace metals (Cd, Cr, Cu, Ni, Pb, Zn) in bottom sediments of Navigation Pools 4 (Lake Pepin), 5, and 9 of the Upper Mississippi River. Master of Science thesis, University of Wisconsin-La Crosse, La Crosse, WI.
Bailey, P.A. and R.G. Rada. 1984. Distribution and enrichment of trace metals (Cd, Cr, Cu, Ni, Pb, Zn) in bottom sediments of Navigation Pools 4 (Lake Pepin), 5, and 9 of the Upper Mississippi River. In J.G Wiener, R.V. Anderson, and D.R. McConville, eds. Contaminants in the Upper Mississippi River. Butterworth Publishers, Boston, MA, pp. 119-138.
Rada, R.G., J.G. Wiener, P.A. Bailey, and D.E. Powell. 1990. Recent influxes of metals into Lake Pepin, a natural lake on the Upper Mississippi River. Archives of Environmental Contamination and Toxicology 19:712-716.
12 = IEPA (Illinois Environmental Protection Agency). 1987. Quality assurance and field methods manual: 1987 revision. Division of Water Pollution Control, Springfield, Illinois.
IEPA (Illinois Environmental Protection Agency). 1993. Laboratory methods manual. Division of Labs, Springfield, Illinois.
Kelly, M.H. and R.L. Hite. 1984. Evaluation of Illinois stream sediment data: 1974-1980. IEPA/WPC/84-004. Illinois Environmental Protection Agency/Division of Water Pollution Control, Springfield, Illinois.
Data exist only on data sheets.
13 = Unknown
14 = IEPA (Illinois Environmental Protection Agency). 1987. Quality assurance and field methods manual: 1987 revision. Division of Water Pollution Control, Springfield, Illinois.
IEPA (Illinois Environmental Protection Agency). 1993. Laboratory methods manual. Division of Labs, Springfield, Illinois.
Kelly, M.H. and R.L. Hite. 1984. Evaluation of Illinois stream sediment data: 1974-1980. IEPA/WPC/84-004. Illinois Environmental Protection Agency/Division of Water Pollution Control, Springfield, Illinois.
Data exist only on data sheets.
15 = Boyer, H.A. 1984. Trace elements in the water, sediments, and fish of the Upper Mississippi River, Twin Cities Metropolitan Area. In J.G. Wiener, R.V. Anderson, and D.R. McConville (eds.),
45

Contaminants in the Upper Mississippi River, Butterworth Publishers, Stoneham, MA. pp. 195-230.
Metropolitan Waste Control Commission (MWCC), Data Report: 1981-83 Priority Pollutant Monitoring of the Receiving Waters in the Twin Cities Metropolitan Area; MWCC Report QC-81/83-88; St. Paul, MN; July 1986; 321 pp.
MWCC. October 1982. 1981 River Quality Report, Summary Volume; MWCC Report QC 81-48. St. Paul, MN. 62 pp.
MWCC. October 1982. 1981 River Quality Report, Appendix Volume II; MWCC Report QC 81-48. St. Paul, MN. 225 pp.
MWCC. October 1983. 1982 River Quality Report, Summary Volume; MWCC Report QC 82-65. St. Paul, MN. 62 pp.
MWCC. October 1983. 1982 River Quality Report, Appendix Volume; MWCC Report QC 82-63. St. Paul MN. 463 pp.
MWCC. September 1984. 1983 River Quality Report, Summary Volume; MWCC Report QC 83-76. St. Paul, MN. 57 pp.
MWCC. September 1984. 1983 River Quality Report, Appendix Volume; MWCC Report QC 83-76. St. Paul, MN. 399 pp.
MWCC. November 1985. 1984 River Quality Report, Summary Volume; MWCC Report QC 84-98. St. Paul, MN. 64 pp.
MWCC. February 1986. 1984 River Quality Report, Appendix Volume; MWCC Report QC 84-98. St. Paul, MN. 441 pp.
MWCC. November 1986. 1985 River Quality Report, Summary Volume; MWCC Report QC 85-113. St. Paul, MN. 55 pp.
MWCC. February 1987. 1985 River Quality Report, Appendix Volume; MWCC Report QC 85-113. St. Paul, MN. 483 pp.
MWCC. September 1998. 1987 River Quality Summary Report; MWCC Report QC 87-147. St. Paul, MN. 18 pp.
MWCC. February 1989. 1987 River Quality Data Report; MWCC Report QC 87-154. St. Paul, MN. 441 pp.
MWCC. July 1990. Supplement to 1987 River Quality Data Report; MWCC Report QC 87-154. St. Paul, MN. 64 pp.
MWCC. May 1990. 1988 River Quality Summary Report; MWCC Report QC 88-175. St. Paul, MN. 15 pp.
MWCC. March 1990. 1988 River Quality Data Report; MWCC Report QC 88-169. St. Paul, MN. 453 pp.
MWCC. July 1990. Supplement to 1988 River Quality Data Report; MWCC Report QC 88-169. St. Paul, MN. 50 pp.
16 = Hunt, T.D., C.M. Crane, and B.G. Isom. 1996. Sediment and water sampling results, Phase III: ALCOA-Davenport Facility. Woodward-Clyde Consultants, Franklin, Tennessee.
46

17 = ISWS (Illinois State Water Survey). 1996. Impacts of the 1993 flood on the Mississippi and Illinois Rivers. Contract Report 594. Hydrology Division, Champaign, Illinois. (Prepared for the Illinois Environmental Protection Agency).
IEPA (Illinois Environmental Protection Agency). 1987. Quality assurance and field methods manual: 1987 revision. Division of Water Pollution Control, Springfield, Illinois.
IEPA (Illinois Environmental Protection Agency). 1993. Laboratory methods manual. Division of Labs, Springfield, Illinois.
Kelly, M.H. and R.L. Hite. 1984. Evaluation of Illinois stream sediment data: 1974-1980. IEPA/WPC/84-004. Illinois Environmental Protection Agency/Division of Water Pollution Control, Springfield, Illinois.
IEPA (Illinois Environmental Protection Agency). 1997. Evaluation of Illinois sieved stream sediment data 1982-1995. IEPA/BOW/97-016. Division of Water Pollution Control, Springfield, Illinois.
Data exist only on data sheets.
18 = Beauvais, S.L., J.G. Wiener, and G.J. Atchison. 1995. Cadmium and mercury in sediment and burrowing mayfly nymphs (Hexagenia) in the Upper Mississippi River, USA. Archives of Environmental Contamination and Toxicology 28:178-183.
Other data that exist only on data sheets.
19 = Cope, W.G., J.G. Wiener, and M.T. Steingraeber. 1996. Test system for exposing fish to resuspended, contaminated sediment. Environmental Pollution 91(2):177-182.
Cope, W.G., J.G. Wiener, M.T. Steingraeber, and G.J. Atchison. 1994. Cadmium, metal-binding proteins, and growth in bluegill (Lepomis macrochirus) exposed to contaminated sediments from the Upper Mississippi River Basin. Canadian Journal of Fisheries and Aquatic Sciences 51(6):1356-1367.
Cope, W.G. 1991. Metallothionein and bioaccumulation of cadmium in juvenile bluegills exposed to aqueous and sediment-associated cadmium. Ph.D. Dissertation, Iowa State University, Ames, IA.
Other data that exist only on data sheets.
20 = Unknown
21 = USACOE (U.S. Army Corps of Engineers). 1983. Pre-dredging water, sediment, and elutriate analyses of selected parameters from seven sites on the Illinois River. U.S. Army Corps of Engineers Report, Rock Island, IL.
USACOE (U.S. Army Corps of Engineers). 1984. Pre-dredging water, sediment, and elutriate analyses of selected parameters from four Illinois River sites. U.S. Army Corps of Engineers Report, Rock Island, IL.
USACOE (U.S. Army Corps of Engineers). 1985. 1985 results of water, sediment and elutriate analyses from five potential Corps dredge sites on the Illinois River. U.S. Army Corps of Engineers Report, Rock Island, IL.
USACOE (U.S. Army Corps of Engineers). 1985. Pre-dredging water, sediment and elutriate analysis results during 1985 of selected parameters from 11 Illinois River sites identified in PCB 83-25. U.S. Army Corps of Engineers Report, Rock Island, IL.
47

USACOE (U.S. Army Corps of Engineers). 1985. Pre-dredging water, sediment and elutriate analysis results during 1985 from six Illinois Waterway sites between river miles 230.2 and 291.0. U.S. Army Corps of Engineers Report, Rock Island, IL.
USACOE (U.S. Army Corps of Engineers). 1986. Pre-dredging water, sediment and elutriate analysis results from samples collected during 1986 at 11 Illinois River sites identified in PCB 83-25. U.S. Army Corps of Engineers Report, Rock Island, IL.
USACOE (U.S. Army Corps of Engineers). 1986. Results of pre-dredging and during dredging analyses of water and sediment samples collected from the Illinois River near mile 147.6 on November 21-23, 1986. U.S. Army Corps of Engineers Report, Rock Island, IL.
USACOE (U.S. Army Corps of Engineers). 1986. Pre-dredging water, sediment and elutriate analysis results from samples collected during 1986 at six Illinois Waterway sites between river miles 230.2 and 291.0. U.S. Army Corps of Engineers Report, Rock Island, IL.
Other data that exist only on data sheets.
22 = Sullivan, J.F. 1995. Contaminants in Mississippi River suspended sediment. Unpublished Report. Wisconsin Department of Natural Resources, La Crosse, WI. 65 pp.
23 = Coffey, M. 1995. 1992 sediment quality report for Mark Twain National Wildlife Refuge Illinois, Iowa and Missouri. U.S. Fish and Wildlife Report, Project Number 3N03. Rock Island Field Office, Rock Island, IL.
Data exist only on data sheets.
24 = Wiener, J.G., G.A. Jackson, T.W. May, and B.P. Cole. 1984. Longitudinal distribution of trace elements (As, Cd, Cr, Hg, Pb, and Se) in fishes and sediment in the Upper Mississippi River. In J.G. Wiener, R.V. Anderson, and D.R. McConville (eds.), Contaminants in the Upper Mississippi River, Butterworth Publishers, Stoneham, MA. pp. 139-170.
Jackson, G.A., J.G. Wiener, T.W. May, and M.A. Ribick. 1981. Longitudinal distribution of selected trace elements and organochlorine residues in fish and sediments in the Upper Mississippi River. Draft final report, U.S. Fish and Wildlife Report, Columbia National Fisheries Research Laboratory, Columbia, MO. 84 pp.
25 = Moody, J.A. (ed.). 1997. Hydrologic, sedimentologic, and chemical data describing surficial bed sediments and water in the navigation pools of the Upper Mississippi River, July 1991-April 1992. U.S. Geological Survey Open-File Report 95-708. 276 pp.
Sullivan, J.F. and J. Moody. 1996. Contaminants in Mississippi River bed sediments collected before and after the 1993 summer flood in Navigation Pools 1 to 11. Wisconsin Department of Natural Resources, La Crosse, WI and U.S. Geological Survey, Denver, CO. 50 pp.
Barber, L.B. and J.H. Writer. 1998. Impact of the 1993 flood on the distribution of organic contaminants in bed sediment of the Upper Mississippi River. Environmental Science and Technology 32:2077-2083.
26 = Moody, J.A. (ed.). 1997. Hydrologic, sedimentologic, and chemical data describing surficial bed sediments in the navigation pools of the Upper Mississippi River, after the flood of 1993. U.S. Geological Survey Open-File Report 96-580. 237 pp.
Sullivan, J.F. and J. Moody. 1996. Contaminants in Mississippi River bed sediments collected before and after the 1993 summer flood in Navigation Pools 1 to 11. Wisconsin Department of Natural Resources, La Crosse, WI and U.S. Geological Survey, Denver, CO. 50 pp.
48

Barber, L.B. and J.H. Writer. 1998. Impact of the 1993 flood on the distribution of organic contaminants in bed sediment of the Upper Mississippi River. Environmental Science and Technology 32:2077-2083.
27 = IEPA (Illinois Environmental Protection Agency). 1987. Quality assurance and field methods manual: 1987 revision. Division of Water Pollution Control, Springfield, Illinois.
IEPA (Illinois Environmental Protection Agency). 1993. Laboratory methods manual. Division of Labs, Springfield, Illinois.
Kelly, M.H. and R.L. Hite. 1984. Evaluation of Illinois stream sediment data: 1974-1980. IEPA/WPC/84-004. Illinois Environmental Protection Agency/Division of Water Pollution Control, Springfield, Illinois.
IEPA (Illinois Environmental Protection Agency). 1997. Evaluation of Illinois sieved stream sediment data 1982-1995. IEPA/BOW/97-016. Division of Water Pollution Control, Springfield, Illinois.
Data exist only on data sheets.
28 = IEPA (Illinois Environmental Protection Agency). 1987. Quality assurance and field methods manual: 1987 revision. Division of Water Pollution Control, Springfield, Illinois.
IEPA (Illinois Environmental Protection Agency). 1993. Laboratory methods manual. Division of Labs, Springfield, Illinois.
Kelly, M.H. and R.L. Hite. 1984. Evaluation of Illinois stream sediment data: 1974-1980. IEPA/WPC/84-004. Illinois Environmental Protection Agency/Division of Water Pollution Control, Springfield, Illinois.
IEPA (Illinois Environmental Protection Agency). 1997. Evaluation of Illinois sieved stream sediment data 1982-1995. IEPA/BOW/97-016. Division of Water Pollution Control, Springfield, Illinois.
Data exist only on data sheets.
29 = Buhl, K.J., and D.R. McConville. 1984. Heavy metal accumulation in selected sessile components of Fountain City Bay, Pool 5A, of the upper Mississippi River. In J.G. Wiener, R.V. Anderson, and, D.R. McConville (eds.), Contaminants in the Upper Mississippi River, Butterworth Publishers, Stoneham, MA. pp. 171-194.
30 = USACOE (U.S. Army Corps of Engineers). 1988. Upper Mississippi River system environmental management program definite project report (R-4) with integrated environmental assessment, Andalusia Refuge rehabilitation and enhancement, technical appendices. U.S. Army Corps of Engineers Report, Rock Island, IL.
USACOE (U.S. Army Corps of Engineers). 1989. Upper Mississippi River system environmental management program definite project report with integrated environmental assessment (R-3), Bertom and McCartney Lakes rehabilitation and enhancement, technical appendices. U.S. Army Corps of Engineers Report, Rock Island, IL.
USACOE (U.S. Army Corps of Engineers). 1989. Upper Mississippi River system environmental management program definite project report with integrated environmental assessment (R-3), Bertom and McCartney Lakes rehabilitation and enhancement. U.S. Army Corps of Engineers Report, Rock Island, IL.
USACOE (U.S. Army Corps of Engineers). 1989. Upper Mississippi River system environmental management program definite project report with integrated environmental assessment (R-5), Big
49

Timber Refuge rehabilitation and enhancement, technical appendices. U.S. Army Corps of Engineers Report, Rock Island, IL.
USACOE (U.S. Army Corps of Engineers). 1990. Upper Mississippi River system environmental management program definite project report (R-6PR) with integrated environmental assessment, Peoria Lake enhancement. U.S. Army Corps of Engineers Report, Rock Island, IL.
USACOE (U.S. Army Corps of Engineers). 1990. Upper Mississippi River system environmental management program definite project report (R-6F) with integrated environmental assessment, Peoria Lake enhancement, technical appendices. U.S. Army Corps of Engineers Report, Rock Island, IL.
USACOE (U.S. Army Corps of Engineers). 1991. Upper Mississippi River system environmental management program definite project report (R-7PR) with integrated environmental assessment, Lake Chautauqua rehabilitation and enhancement. U.S. Army Corps of Engineers Report, Rock Island, IL.
USACOE (U.S. Army Corps of Engineers). 1991. Upper Mississippi River system environmental management program definite project report (R-7F) with integrated environmental assessment, Lake Chautauqua rehabilitation and enhancement, technical appendices. U.S. Army Corps of Engineers Report, Rock Island, IL.
31 = Fitzpatrick, F.A., B.C. Scudder, J.K. Crawford, A.R. Schmidt, J.B. Sieverling, and others. 1995. Water-quality assessment of the Upper Illinois River Basin in Illinois, Indiana, and Wisconsin: major and trace elements in water, sediment, and biota, 1978-90. U.S. Geological Survey Water-Resources Investigations Report 95-4045. 253 pp.
Colman, J.A. and R.F. Sanzolone. 1990. Surface-water-quality assessment of the Upper Illinois River Basin in Illinois, Indiana, and Wisconsin: geochemical data for fine-fraction streambed sediment from high- and low-order streams, 1987. U.S. Geological Survey Open-File Report 91-571. 108 pp.
32 = Colman, J.A. and R.F. Sanzolone. 1990. Surface-water-quality assessment of the Upper Illinois River Basin in Illinois, Indiana, and Wisconsin: geochemical data for fine-fraction streambed sediment from high- and low-order streams, 1987. U.S. Geological Survey Open-File Report 91-571. 108 pp.
Colman, J.A. and R.F. Sanzolone. 1992. Geochemical characterization of streambed sediment in the Upper Illinois River Basin. Water Resources Bulletin 28:933-950
33 = Other
SAMPLING PURPOSE
This is a brief statement describing the sampling purpose or main objective of the study that produced the
data set. The format for the variable is a look-up table where the valid codes are as follows.
1 = More directed sampling to further define contaminant problem areas found during a 1985 study and other areas of concern (barge and chemical terminals) within the Upper Mississippi River National Wildlife and Fish Refuge.
2 = To assess the effects of the 1993 flood on the vertical distribution of sediment contaminants by comparison to pre-flood data.
3 = To assess the toxicity of sediments and the spatial and vertical distribution of contaminants in sediments from the Illinois River (river mile 326 in downtown Chicago to river mile 5 near Grafton, Illinois).
4 = To examine the bioaccumulation and biological response of sediment-associated contaminants to fish from sediments collected from areas of the Upper Mississippi River reported to contain high
50
concentrations of metals.5 = To establish baseline sediment quality criteria by determining concentrations of organic and inorganic
contaminants at locations on or near the Upper Mississippi River National Wildlife and Fish Refuge. Samples were collected between river miles 504 and 758.6 from backwater or off-channel depositional areas containing high percentages of fine sediments.
6 = To identify potential contaminants originating from several critical point sources along the Illinois River. Primary suspected sources of contaminants to the river ecosystem included sewage outfalls and industrial outfalls in metropolitan areas.
7 = Sediment samples were collected in the vicinity of twenty regulated discharge points within Pools 4 through 10 of the Upper Mississippi River National Wildlife and Fish Refuge. Point source discharge sites that may be of biological concern were ranked based on the results of chemical and toxicological analyses.
8 = To investigate contaminants in sediments near selected industrial sites, within and adjacent to the Mark Twain National Wildlife Refuge (NWR) and the Clarence Cannon NWR, and at other areas important to migratory waterfowl on the Upper Mississippi River.
9 = To assess temporal changes in un-ionized (NH3-N) concentrations in pore water to determine if NH3-N in sediments approach concentrations shown to have adverse effects on fingernail clams in experimental studies. Specific objectives were (1) to examine the temporal and vertical distribution of total ammonia nitrogen (TAN) and NH3-N in pore water; (2) to compare the temporal patterns of TAN and NH3-N concentrations in overlying surface water with those in pore water; and (3) to examine the influence of sediment characteristics on TAN concentrations.
10 = To examine the stratigraphy of contaminants and chronology of pollution downstream of the Twin Cities metropolitan area through detailed analysis of sediment cores.
11 = To characterize the sediments of various Upper Mississippi River locations in terms of particle size, organic content, and concentrations of cadmium, chromium, copper, nickel, lead, and zinc.
12 = To examine sediment contaminants near the vicinity of the 3M discharge near Cordova, Illinois.13 =14 = Samples for this study were collected before 1980 and were part of a background monitoring effort.
Sediment samples were generally collected with fish tissue contaminant data to establish stations for the program.
15 = This study was conducted by the Metropolitan Council of Environmental Services (MCES; formerly Metropolitan Waste Control Commission). The sediment contaminant data are part of a larger monitoring effort by the MCES to obtain information on priority pollutants in surface waters of the Twin Cities MN area.
16 = The Aluminum Company of America (Alcoa) facility is near Davenport, Iowa, adjacent to Mississippi River Pool 15 (MRP15). In July 1990, Alcoa entered into an Administrative Order of Consent (AOC) with the United States Environmental Protection Agency (USEPA). The AOC covers a sediment/soil investigation in onsite drainageways and wetlands and within critical areas of MRP15. This report covers Phase III, which was conducted to quantify the vertical and horizontal extent of contamination within specific MRP15 study areas.
17 = To assess changes in water quality after the 1993 flood at selected locations in Illinois along the Upper Mississippi River and the lower Illinois River. Parameters measured in sediments were compared with historical values prior to the flood.
18 = Longitudinal patterns in the cadmium and mercury content of burrowing mayflies (Hexagenia) and surrounding sediment were examined along a 572-km reach of the Upper Mississippi River (pools 2 through 16).
19 = To assess the responses of bluegills to cadmium-contaminated, surficial sediments from the Upper Mississippi, Illinois, and Des Plaines rivers. The chief objectives were (1) to assess the bioaccumulation of cadmium in fish exposed to suspended river sediments and (2) to evaluate whole-body cadmium, hepatic metal-binding proteins, and hepatic nonthionein cytosolic cadmium in bluegills as indicators of exposure to sediment-associated cadmium.
20 = Unknown21 = The U.S. Army Corps of Engineers (Rock Island District) was required by a certification or variance
of the Illinois Environmental Protection Agency or other governing body to collect water and sediment samples at sites in the Illinois River that had been dredged quite frequently. These samples were collected before dredging and analyzed for contaminants to assess possible problems associated
51
with the dredging process and the placement of dredged material.22 = Glass sediment traps were deployed in the Upper Mississippi River to collect composite samples of
suspended sediment for contaminant analysis between 1987 and 1994. The objectives were (1) to assess the contaminant concentrations of suspended sediment, (2) to evaluate factors influencing contaminant concentrations, and (3) to assess temporal trends and compare contaminant concentrations in suspended sediments to recent contaminant investigations on the river.
23 = To assess sediment quality at backwater areas in the Mark Twain National Wildlife Refuge. The Sediment Quality Triad approach was attempted to evaluate heavy metal and nutrient contamination.
24 = To evaluate the longitudinal distribution of six potentially toxic elements in fishes and bed sediments in a 500-km stretch of the Upper Mississippi River. The objectives were (1) to obtain baseline data on the longitudinal distribution of selected trace elements in the river, (2) to identify potentially toxic elements that may be adversely affecting biota in the stretch of river studied, and (3) to assess relations between contaminant concentrations in bed sediments and fish.
25 = Surficial bed-sediment samples were collected from 25 navigation pools on the Upper Mississippi River to assess the longitudinal distribution of inorganic and organic compounds in the surficial sediments.
26 = Surficial bed-sediment samples were collected from pools 1 through 26 in the Upper Mississippi River after the flood of 1993. The purpose was to assess the longitudinal distribution of inorganic and organic compounds in the surficial sediments.
27 = Special survey sampling conducted during 1989 and 1990 by the Illinois Environmental Protection Agency at selected sites along the Illinois River.
28 = CORE program sampling conducted during 1980 to 1990 by the Illinois Environmental Protection Agency at selected sites along the Illinois River and Upper Mississippi River. The CORE program was a 37-station subset of the Agency's ambient stations where sediment and macroinvertebrate samples were collected on a 3-year rotational basis.
29 = The objectives of this study were (1) to obtain baseline information on total Cd, Cr, Cu, and Zn concentrations in four species of aquatic macrophytes and associated bed sediments from a large backwater area of the Upper Mississippi River; (2) to characterize the sediment metal levels; and (3) to elucidate the potential impact of aquatic angiosperms in mobilizing sediment-bound metals.
30 = Sediment samples in this data set were collected and analyzed by the U.S. Army Corps of Engineers (Rock Island District) for the Environmental Management Program (EMP). Shallow core samples were taken at locations representative of areas impacted by the EMP projects. The sample sites were typically located in backwater areas with fine-grained sediment.
31 = The report describes concentrations of major and trace elements in three components (water, sediment, and biota) of the aquatic environment in streams of the upper Illinois River Basin. The report describes the relations between trace-element concentrations in water, sediment, and biota so that the effects and fates of trace elements throughout the food chain can be more completely understood.
32 = This report presents geochemical data for streambeds in the upper Illinois River basin. These data can be selected from the report tables by latitude and longitude, by map reference number, or by remark code indicating purpose for collecting sample. The scope of the report includes a presentation of the investigative design, methodology, summary statistics, and raw-data results of the geochemical survey of streambed sediment in the basin.
32 = Other
QUALITY-ASSURANCE INDEX
This is the quality-assurance index for analysis of all contaminants within a specific data set entered into
the database. The quality assurance index value for each data set was based on an examination of the
quality-assurance documentation. The most comprehensive quality-assurance procedure is one that
examined (1) the precision of analyses with replicate samples, (2) the bias (recovery of spiked samples
and analysis of standard and/or internal reference materials), and (3) the detection limits for the
contaminants that were quantified. The scale of the quality assurance index reflects the relative
52

completeness of quality assurance documentation, with “1” indicating the most comprehensive
documentation and “5” indicating the minimum level required for inclusion of a data set into the database.
Definitions
The following definitions were derived largely from Sections 1010, 1020, and 1030 in Standard Methods
(American Public Health Association, American Water Works Association, and Water Environment
Federation. 1992. Standard methods for the examination of water and wastewater, 18th ed. American
Public Health Association, Washington, D.C.), which can be consulted for more detailed information.
Accuracy--A combination of bias and precision of an analytical procedure, which reflects the closeness of
a measured value to a true value.
Bias--A consistent deviation of measured values from the true value, caused by systematic errors in a
procedure. Bias is assessed by measuring the recovery of known additions (spiked samples) and
the recovery of internal standards and laboratory control standards.
Detection limits--The common term that encompasses various analytical detection limits. Some of the
common detection limits (in increasing order of concentration detected) include the
instrument detection limit (IDL), the lower limit of detection (LLD), the method
detection limit (MDL), and the limit of quantitation (LOQ). The LLD, for example, is
the contaminant concentration that produces a signal sufficiently large that 99% of the
trials with that amount will produce a detectable signal. The MDL differs from the LLD
in that samples containing the contaminant of interest are processed through the
complete analytical method. The relation among these limits is about
IDL:LLD:MDL:LOQ = 1:2:4:10. Most of the studies in this database reported one or
more of the detection limits. For purposes of assigning a quality-assurance index value
for a specific data set, any of these detection limits was considered acceptable.
Internal standard--A pure compound added to a sample extract just before instrumental analysis to permit
correction for inefficiencies.
Laboratory control standard--A standard, usually certified by an outside agency, used to measure the bias
in a procedure. Examples include the National Institute of Standards and
Technology (NIST) Standard Reference Materials and the National Research
Council of Canada (NRCC) reference materials.
Precision--A measure of the degree of agreement among replicate analyses of a sample (e.g., standard
deviation, percent difference, or percent relative standard deviation).
Replicate--A repeated operation occurring within an analytical procedure. Two or more analyses for the
same constituent in an extract of a single sample constitute replicate extract
analyses.
53

Spiked samples--Also termed the recovery of known additions, a pure compound added to a sample in the
laboratory so that the overall efficiency of a method can be determined.
Spiked samples are used to assess the bias and verify the absence of matrix
effects.
The format for the variable is a look-up table where the valid codes are as follows.
1 = The accuracy of analyses were characterized with estimates of precision (replicate samples) and bias (both spiked samples and reference materials). The detection limits were provided for all or most contaminants that were quantified.
2 = The accuracy of analyses were characterized with an estimate of precision (replicate samples) and bias (either spiked samples or reference materials). The detection limits were provided for some contaminants that were quantified.
3 = The accuracy of analyses were characterized with an estimate of precision (replicate samples) and bias (either spiked samples or reference materials). The detection limits were not available for any contaminants that were quantified.
4 = The reliability of analyses were characterized with an estimate of bias (either spiked samples or reference materials). The detection limits were not available for any contaminants that were quantified.
5 = The reliability of analyses were characterized with an estimate of precision (replicate samples). The five levels of quality assurance documentation are tabulated below
Quality
assurance index
value
Spiked samples Internal standard or laboratory
control standards
Detection
limits
Precision
1 X X X X
2 X X X
2 X X X
3 X X
3 X X
4 X
4 X
5 X
NUMBER OF OBSERVATIONS IN THE DATA SET
The total number of independent sediment samples represented in the specific data set.
DATE OF ENTRY INTO DATABASE
The date of entry of sample information into the database. In MM/DD/YYYY format; example, “June 30,
1999" is represented as 06/30/1999.
54

DISCLAIMER
USGS = The data in this database were contributed by a number of federal, state, academic, and other
institutions. These data were compiled by scientists at the USGS Upper Midwest Environmental
Sciences Center and the University of Wisconsin-La Crosse and are maintained on a computer
system at the Upper Midwest Environmental Sciences Center. No warranty, expressed or
implied, is made regarding the accuracy or utility of the data on any other system or for general
or scientific purposes, nor shall the act of distribution of the database constitute any such
warranty. The correction of errors is a continuing process, and scientists at the Upper Midwest
Environmental Sciences Center will correct or delete data, as appropriate, if errors are
discovered. The file date is referred to as the most current version of the database and should be
mentioned in all references to the sediment data provided herewith. These data have been
provided as a unit package to ensure that the user receives a valid data set collected in a
technically acceptable manner. Accordingly, these data should not be combined with data from
other sources unless the user understands the procedures and purposes used to create each set of
data and can verify that data from different sources are comparable.
1.2. Database Sample ID Variables
DATABASE SAMPLE NUMBER
Alphanumeric field for the unique database ID number used in this database.
ORIGINAL SAMPLE NUMBER
Alphanumeric field identifying the sample ID number used in a specific data set. If more than one
convention was used for the same sample (e.g., the data were used for more than one publication such as a
thesis and journal publication), the most descriptive sample ID available was entered here.
UNITS OF MEASURE
These are the units of measure for the database variables. The format for the unit of measure is a look-up
table where valid codes are as follows.
1 = %2 = g/cm33 = µg/g dry wt.4 = mg/L5 = ng/g dry wt.6 = µmol/g dry wt.7 = mm8 = cm9 = m10 = miles11 = year12 = days
55

13 = minutes14 = seconds15 = UTM16 = µg/L17 = Other
1.3. Site-Characteristics Variables
RIVER
This is the river or tributary name where the sample was obtained. The format for the variable is a
look-up table where the valid codes are as follows.
1 = Mississippi Headwaters2 = Upper Mississippi River3 = Illinois River4 = Minnesota River5 = St. Croix River6 = Des Plaines River7 = Kankakee River8 = Kaskaskia River9 = Rock River10 = Black River11 = Wisconsin River12 = Chippewa River13 = Turkey River14 = Maquoketa River15 = Wapsipinicon River16 = Iowa River17 = Skunk River18 = Des Moines River19 = Salt River20 = Chicago River21 = Chicago River, North Branch22 = Chicago River, South Branch23 = Little Calumet River24 = Calumet River25 = Grand Calumet River26 = Calumet Sag Channel27 = Chicago Sanitary and Ship Canal28 = Fox River29 = Missouri River30 = Vermillion River31 = Skokie River32 = Salt Creek33 = North Shore Channel34 = East Branch Du Page River35 = West Branch Du Page River36 = Du Page River37 = Other
NAVIGATION POOL
This is the Navigation Pool of the Mississippi River or Illinois River in which the sample was obtained.
56

The format for the variable is a look-up table where the valid codes are as follows.
1 = Pool 12 = Pool 23 = Pool 34 = Pool 45 = Pool 56 = Pool 67 = Pool 78 = Pool 89 = Pool 910 = Pool 1011 = Pool 1112 = Pool 1213 = Pool 1314 = Pool 1415 = Pool 1516 = Pool 1617 = Pool 1718 = Pool 1819 = Pool 1920 = Pool 2021 = Pool 2122 = Pool 2223 = Pool 5A24 = Pool 2425 = Pool 2526 = Pool 2627 = Pool 2728 = Dresden Island Pool29 = Marseilles Pool30 = Starved Rock Pool31 = Peoria Pool32 = La Grange Pool33 = Alton Pool34 = Brandon Road Pool35 = Lockport Pool36 = UMR Open River37 = Other
STATE
This is the state in which the sample was obtained. The format for the variable is a look-up table where
the valid codes are as follows.
1 = IA2 = IL3 = IN4 = MN5 = MO6 = SD7 = WI
COUNTY
This is the county in which the sample was obtained. No county was entered for a sample if that sample
57

was a composite from two counties (e.g., from one side of the river to the other).
RIVER MILE
Numeric field for the approximate river mile (if applicable) near where the sample was obtained,
expressed as miles.
SITE COMMON NAME
This is the common name of the site where the sample was obtained. The format for the variable is a
look-up table where the valid codes are as follows.
1 = Andalusia Slough2 = Babbs Slough3 = Baldwin Lake4 = Beaver Slough5 = Belvidere Slough6 = Big Lake7 = Big Meadow Slough8 = Big Timber Refuge9 = Blacksmith Slough10 = Brown's Lake11 = Fountain City Bay12 = Harpers Slough13 = Lake Chautauqua14 = Lake Onalaska15 = Lake Pepin16 = Lower Lake17 = McCartney Lake18 = North Lake19 = Peoria Lake20 = Pig Eye Lake21 = Robinson Lake22 = Spring Lake23 = Steamboat Bay24 = Sturgeon Lake25 = Swan Slough26 = Twin Lakes27 = Upper Lake28 = Weaver Bottoms29 = Wise Lake30 = Frentress Lake Slough31 = Betsy Slough32 = Bluff Slough33 = Lawrence Lake34 = Methodist Lake35 = Duck Lake36 = Ackerman's Cut37 = Cassville Slough38 = Hurricane Chute39 = Mud Lake40 = Lake Peosta Channel41 = Switzer Lake42 = Molo Slough
58

43 = Ninemile Island Slough44 = Casey Slough45 = Lainsville Slough46 = Beaver Slough Lake47 = Joyce Lake48 = Blue Lake49 = West Channel50 = North Shore Channel51 = Swan Lake52 = Big Denny Pond53 = Little Denny Pond54 = Round Pond55 = Fox Pond56 = Goose Pond57 = Prairie Pocket58 = Swarms Pond59 = Grey Chute60 = Willow Lake61 = Nelson Lake (Silver Lake)62 = Turner Lake63 = Miller's Slough64 = Pigs Eye Slough65 = Lake St. Croix66 = Skunk Slough67 = Coolegar Slough68 = White Chute69 = Little Mossy Lake70 = Big Pond71 = Bryants Creek72 = Prairie Pond73 = Black Lake74 = Watson Lake75 = Waumandee Creek76 = Upper Indian Creek77 = Indian Creek78 = Goose Lake79 = Bertom Lake80 = Liverpool Ditch81 = Meyers Ditch82 = Smallpox Creek Slough83 = Smoots Chute84 = Long Island Lake85 = Other
SAMPLE COORDINATES NORTHING
This is the approximate Universal Transverse Mercator (UTM) northing coordinate (in meters) for the site
where the sediment sample was obtained.
59

Samples that were located with available maps and site descriptions with ArcView software are tabulated
below.
Date set
number
Database sample numbers
3 1-13
5 1-12, 30-49, 66-68
8 1-37, 39-57, 59-70
11 1-45, 80-313
16 1-7, 9-167, 174-182
21 1-200
24 2-40
29 1-15
30 1-30
SAMPLE COORDINATES NORTHING UNITS
This is the units for the sample coordinates northing in UTMs.
SAMPLE COORDINATES EASTING
This is the approximate Universal Transverse Mercator (UTM) easting coordinate (in meters) for the site
where the sediment sample was obtained.
WATER DEPTH
This is the depth of water at the sediment sampling site, expressed in meters.
1.4. Methods Variables
DATE OF COLLECTION
This is the date of collection of the sediment sample. For samples collected over time, such as
sediment-trap samples, this is the date on which the sample was collected. In MM/DD/YYYY format;
example, “August 6, 1997" is represented as 08/06/1997.
60

SAMPLING DURATION
This is the sampling duration for samples collected over a time interval, such as samples from integrated
samplers and sediment traps, expressed in days.
SAMPLE TYPE
This is the type of sediment sample collected. The format for the variable is a look-up table where the
valid codes are as follows.
1 = Single grab sample (one sample per site)2 = Composite grab sample (>1 samples from more than 1 site grouped)3 = Sediment core4 = Sediment pore water (interstitial water)5 = Sediment-trap sample6 = Suspended sediment in water column7 = Grab by hand8 = Composite core sample (>1 samples from the same depth grouped)9 = Composite core or composite grab sample (>1 samples from more than 1 site grouped)10 = Composite core sample (>1 samples from more than 1 site grouped)11 = Other
COLLECTION APPARATUS
This is the apparatus used for the collection of the sediment sample. The format for the variable is a look-
up table where the valid codes are as follows.
1 = Ekman dredge2 = Petersen dredge3 = Ponar dredge4 = Van Veen bottom grab5 = Diver-operated corer6 = Gravity corer7 = Piston corer8 = Sediment trap9 = Integrated water (suspended-sediment) sampler10 = Stainless steel scoop, Ekman dredge, or Ponar dredge11 = Gravity corer and modified van Veen bottom grab12 = Pipe dredge13 = Push corer14 = Sieve, spoon, Ekman dredge, or Ponar dredge15 = Shovel16 = Push corer or Ponar dredge17 = Plastic scoop, Ekman dredge, or Ponar dredge18 = Other
UPPER DEPTH OF SAMPLE IN SEDIMENT PROFILE
This is the numerical value for the upper sediment depth from a core sample, expressed in centimeters.
The top of the uppermost stratum (sediment-water interface) will have a value of zero (0).
LOWER DEPTH OF SAMPLE IN SEDIMENT PROFILE
61
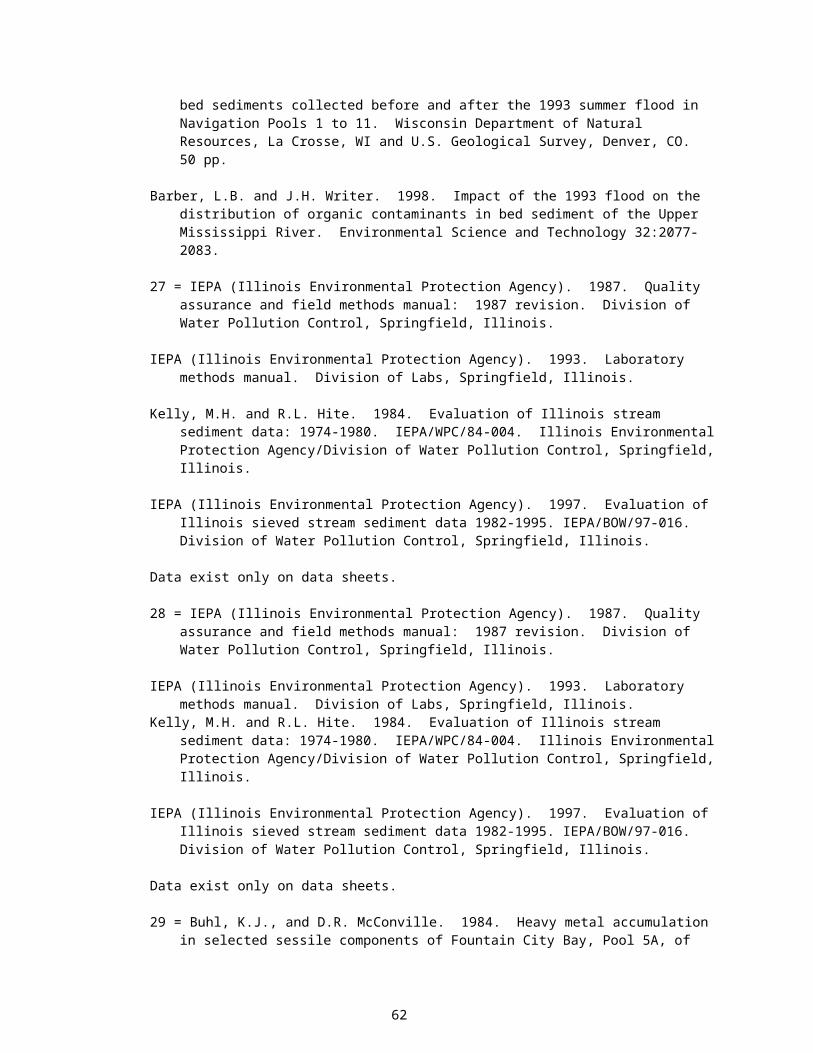
This is the numerical value for the lower sediment depth from a core sample, expressed in centimeters.
DIGESTION METHOD FOR INORGANIC CONTAMINANTS
This is a brief description of the sediment digestion method used before analyses for inorganic
contaminants. The format for the variable is a look-up table where the valid codes are as follows.
1 = Sediment digested in strong acid (> 1 N)2 = Sediment digested in weak acid (< 1 N)3 = Sediment/water elutriate analysis4 = Other
1.5. Sediment Toxicity Variables
SEDIMENT CODE
This is the code for the type or fraction of sediment used for toxicological testing. The format for the
variable is a look-up table where the valid codes are as follows.
1 = Bed sediment2 = Suspended sediment3 = Pore water4 = Sediment elutriate tests5 = Suspended sediment and bed sediment6 = Other
TEST ORGANISM
This is the test organism exposed to sediments and associated contaminants in sediment toxicity tests. The
format for the variable is a look-up table where the valid codes are as follows.
1 = Mayflies (Hexagenia)2 = Chironomids3 = Fathead minnow (Pimephales promelas)4 = Bluegill (Lepomis macrochirus)5 = Green sunfish (Lepomis cyanellus)6 = Daphnia spp.7 = Photobacterium phosphoreum (Microtox bioassay)8 = Amphipod (Hyalella)9 = Oligochaete (Lumbriculus variegatus)10 = Three ridge mussel (Amblema plicata)11 = Pocketbook mussel (Lampsilis ovata ventricosa)12 = Three ridge mussel (Amblema plicata) and Pocketbook mussel (Lampsilis cardium)13 = Fathead minnow (Pimephales promelas) and Daphnia magna14 = Bluegill (Lepomis macrochirus) and Common Carp (Cyprinus carpio)15 = Common Carp (Cyprinus carpio)16 = Mayfly (Hexagenia) nymphs17 = Other
DURATION OF EXPOSURE
Numerical field for the duration of exposure of the test organism to the sediment sample, expressed in
62

days.
BIOLOGICAL RESPONSE
This is the biological response of an organism after exposure to the sediment sample. The format for the
variable is a look-up table where the valid codes are as follows.
1 = Accumulation in field-collected organisms2 = Accumulation in experiment3 = Behavior4 = Biochemical5 = Development (teratogenic effects)6 = Growth7 = Physiology8 = Reproduction9 = Survival10 = Inhibition of Photobacterium phosphoreum bioluminescence11 = Biochemical and accumulation in experiment12 = Other
BIOLOGICAL RESPONSE DQ
This is the biological response data qualifier. The format for the variable is a look-up table where the
valid codes are as follows.
1 = Significant effect2 = No effect observed3 = Not examined4 = Other
1.6. Sediment-Characteristics Variables – NOTE: For sediment characteristics values less than the detection
limit we entered “9999" as the value.
VOLATILE MATTER CONTENT
Numeric field for the volatile matter content of the sediment sample, expressed as a percentage of dry
weight. Also known as volatile solids content and loss on ignition (LOI), volatile matter content is usually
analyzed as a surrogate for total organic carbon and is measured gravimetrically by the loss of mass upon
ignition in an oven at high temperature.
VOLATILE MATTER CONTENT DQ
Volatile matter content data qualifier code. Valid codes are as follows.
1 = Measured by the loss of mass upon ignition in an oven at 500 C (± 50).2 = Measured by the loss of mass upon ignition in an oven at 750 C.3 = Loss on ignition by ashing air-dried sediment at 1000 degrees C for 2 hours.4 = Other
63
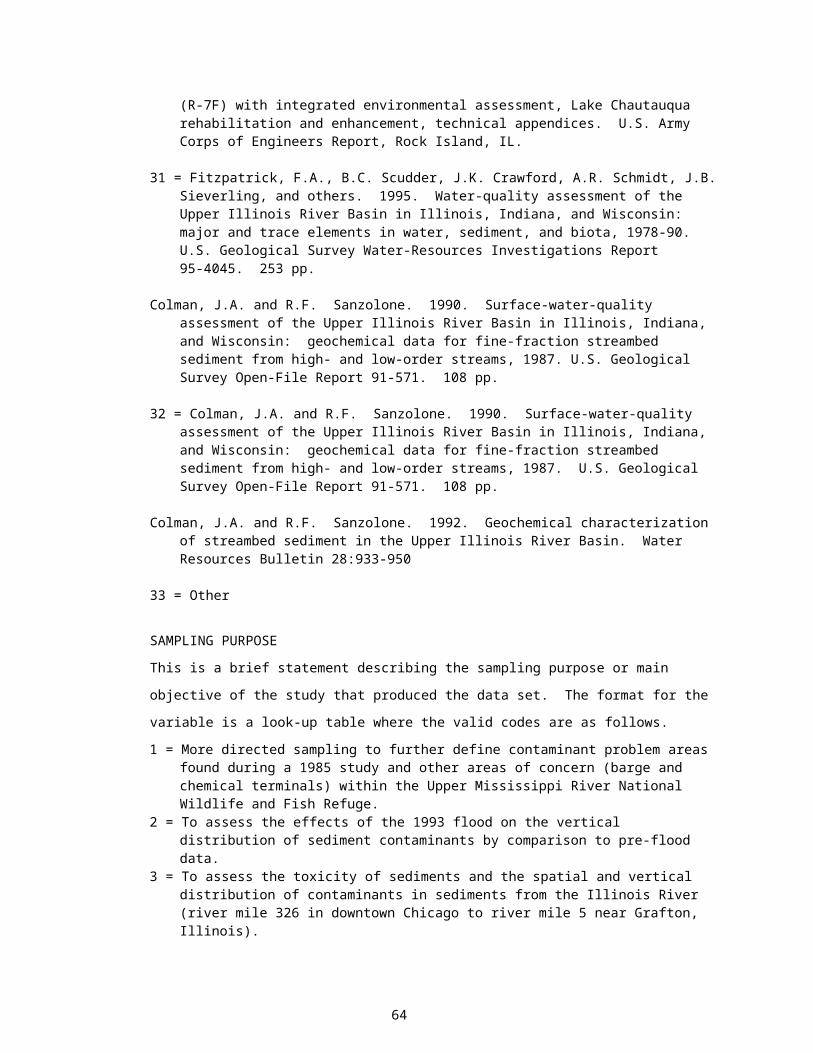
TOTAL CARBON
Numeric field for total carbon of the sediment sample, expressed as a percentage of dry weight.
ORGANIC CARBON
Numeric field for organic carbon of the sediment sample, expressed as a percentage of dry weight.
CARBONATE CARBON
Numeric field for carbonate carbon of the sediment sample, expressed as a percentage of dry weight.
TOTAL NITROGEN
Numeric field for total nitrogen of the sediment sample, expressed as a percentage of dry weight.
ACID-VOLATILE SULFIDE
Numeric field for acid-volatile sulfide of the sediment sample, expressed as µmol/g dry weight.
Note: all particle size data (sections 1.6.8 to 1.6.12) were entered to the nearest percentage, unless the
value was <10%, in which case, data were entered to the nearest one-tenth of a percentage.
GRAVEL CONTENT
Numeric field for the gravel content (usually particles greater than 2 mm) of the sediment sample,
expressed as a percentage of dry weight.
SAND CONTENT
Numeric field for the sand content of the sediment sample, expressed as a percentage of dry weight.
SILT CONTENT
Numeric field for the silt content of the sediment sample, expressed as a percentage of dry weight.
CLAY CONTENT
Numeric field for the clay content of the sediment sample, expressed as a percentage of dry weight.
SILT + CLAY CONTENT
Numeric field for the silt plus clay content of the sediment sample, expressed as a percentage of dry
weight.
WATER CONTENT
64
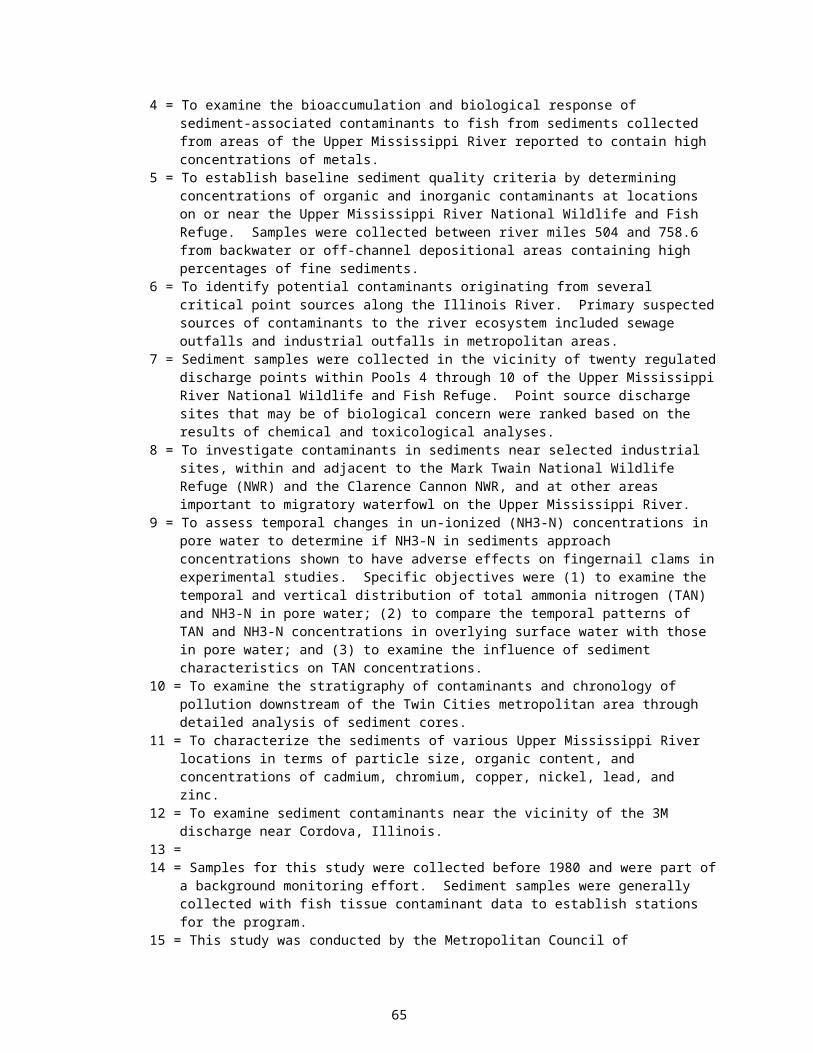
Numeric field for the water content of the sediment sample, expressed as a percentage of whole wet
sediment.
DENSITY
Numeric field for the density of bulk sediment, expressed as g/cm3.
SIZE FRACTION ANALYZED, INORGANIC CONTAMINANTS
Numeric field for the size fraction of sieved sediment analyzed for inorganic contaminants, measured in
millimeters (mm).
SIZE FRACTION ANALYZED, ORGANIC CONTAMINANTS
Numeric field for the size fraction of sieved sediment analyzed for organic contaminants, measured in
millimeters (mm).
APPROXIMATE YEAR OF DEPOSITION
Numeric field for the approximate year of deposition for strata from sediment cores that were dated (lead-
210 method, cesium-137 method, etc.).
TOTAL KJELDAHL NITROGEN
Numeric field for total Kjeldahl nitrogen of the sediment sample, expressed as a percentage of dry weight.
LIPID CONTENT
Numeric field for the lipid content of the sediment sample, expressed as a percentage of dry weight.
1.7. Classes of Contaminants, Data Qualifiers, and Individual Contaminants
The individual contaminants were placed into one of two main classes of contaminants. These classes
were (1) inorganic contaminants and (2) organic contaminants. Within each class, contaminants were
further subdivided and placed into a subclass. The class of inorganic contaminants was divided to include
(a) metals, metalloids, nutrients, and others, and (b) simultaneously extracted metals (SEMs). Organic
contaminants were placed into subclasses that included (a) polynuclear aromatic hydrocarbons (PAHs),
(b) organochlorine insecticides, (c) insecticides, (d) herbicides, (e) fungicides, (f) industrial and
miscellaneous compounds, (g) sterols, (h) petroleum-related compounds, and (i) polychlorinated biphenyls
(PCBs). To reduce redundancy, an example field description is provided for a contaminant and its
associated data qualifier (DQ) for each class (or group of classes). Exceptions within each class are noted.
The two major differences in the field descriptions among classes are (1) the units of measurement and (2)
the valid codes for the data qualifier field for each contaminant. Classes with the same units and valid
65

codes will have only one example.
Example for the Class Inorganics: (Note: replace redline text with each Inorganic contaminant)
AMMONIA-NITROGEN
Numeric field for ammonia-nitrogen concentration in the sediment sample, expressed as micrograms per
gram dry weight.
AMMONIA-NITROGEN DQ
Ammonia-nitrogen data qualifier code. The format for the variable is a look-up table where the valid
codes are as follows:
1 = Value as reported.2 = Analyzed for, but not detected.3 = Value reported is an estimated concentration.4 = Analyzed for, but not detected above the method detection limit (MDL). The value reported is the
MDL for the contaminant.5 = Value reported is less than the method quantitation limit (but greater than MDL). Measured
concentration reported.6 = Value represents the mean of replicates.7 = Value reported indicates that the constituent was not detected. One-half the detection limit is presented.8 = Value reported but interference was present during analysis.9 = Sum of PCB congeners.10 = Sum of analyzed PAHs.11 = Analyzed for, but not detected above the value reported.12 = Other
Exceptions for the Class Inorganics: (Note: both exceptions have the same data qualifier codes, as the
other Inorganics)
UN-IONIZED AMMONIA-NITROGEN
Numeric field for un-ionized ammonia-nitrogen concentration in sediment pore water for the sample,
expressed in micrograms per liter.
TOTAL AMMONIA-NITROGEN
Numeric field for total ammonia-nitrogen concentration in sediment pore water for the sample, expressed
in milligrams per liter.
Example for the Class SIMULTANEOUSLY EXTRACTED METALS (SEM): (Note: replace redline text
66

with each SEM contaminant)
CADMIUM-SEM
Numeric field for cadmium simultaneously extracted metal (SEM) concentration in the sediment sample,
expressed as micromol per gram dry weight.
CADMIUM-SEM DQ
Cadmium simultaneously extracted metal (SEM) data qualifier code. The format for the variable is a
look-up table where the valid codes are as follows:
1 = Value as reported.2 = Analyzed for, but not detected.3 = Value reported is an estimated concentration.4 = Analyzed for, but not detected above the method detection limit (MDL). The value reported is the
MDL for the contaminant.5 = Value reported is less than the method quantitation limit (but greater than MDL). Measured
concentration reported.6 = Value represents the mean of replicates.7 = Value reported indicates that the constituent was not detected. One-half the detection limit is presented.8 = Value reported but interference was present during analysis.9 = Sum of PCB congeners.10 = Sum of analyzed PAHs.11 = Analyzed for, but not detected above the value reported.12 = Other
Example for the Classes POLYNUCLEAR AROMATIC HYDROCARBONS (PAHs), STEROLS, and
PETROLEUM-RELATED COMPOUNDS: (Note: replace redline text with each contaminant)
ACENAPHTHENE
Numeric field for acenaphthene concentration in the sediment sample, expressed in micrograms per gram
dry weight.
ACENAPHTHENE DQ
Acenaphthene data qualifier code. The format for the variable is a look-up table where the valid codes are
as follows:
1 = Value as reported.2 = Analyzed for, but not detected.3 = Value reported is an estimated concentration.4 = Analyzed for, but not detected above the method detection limit (MDL). The value reported is the
MDL for the contaminant.5 = Value reported is less than the method quantitation limit (but greater than MDL). Measured
concentration reported.6 = Value represents the mean of replicates.7 = Value reported indicates that the constituent was not detected. One-half the detection limit is presented.8 = Value reported but interference was present during analysis.
67

9 = Sum of PCB congeners.10 = Sum of analyzed PAHs.11 = Analyzed for, but not detected above the value reported.12 = Other
Example for all of the remaining classes (ORGANOCHLORINE INSECTICIDES, INSECTICIDES,
HERBICIDES, FUNGICIDES, MISCELLANEOUS INDUSTRIAL COMPOUNDS, and
POLYCHLORINATED BIPHENYLS): (Note: replace redline text with each contaminant)
ALDRIN
Numeric field for aldrin concentration in the sediment sample, expressed in nanograms per gram dry
weight.
ALDRIN DQ
Aldrin data qualifier code. The format for the variable is a look-up table where the valid codes are as
follows:
1 = Value as reported.2 = Analyzed for, but not detected.3 = Value reported is an estimated concentration.4 = Analyzed for, but not detected above the method detection limit (MDL). The value reported is the
MDL for the contaminant.5 = Value reported is less than the method quantitation limit (but greater than MDL). Measured
concentration reported.6 = Value represents the mean of replicates.7 = Value reported indicates that the constituent was not detected. One-half the detection limit is
presented.8 = Value reported but interference was present during analysis.9 = Sum of PCB congeners.10 = Sum of analyzed PAHs.11 = Analyzed for, but not detected above the value reported.12 = Other
For the variable TOTAL PCBs, within the POLYCHLORINATED BIPHENYL subclass note:
NUMBER OF PCB CONGENERS
Numeric field for the number of individual PCB congeners that were analyzed for in the data set.
68