uludag
DESCRIPTION
mrTRANSCRIPT

249
9C H A P T E R 9BASIC PRINCIPLES OF FUNCTIONAL MRIKâmil Uludag* ● David J. Dubowitz* ● Richard B. Buxton*
INTRODUCTION TO FUNCTIONALMAGNETIC RESONANCE IMAGING(fMRI) 250
The MRI Signal is Sensitive to Changesin Blood Oxygenation 250
The Origins of fMRI 250fMRI Has Become an Important Tool
in Neuroscience Research 250Overview of the Chapter 251
THE PHYSIOLOGIC BASIS OF fMRI 251Neuronal Signaling and Energy
Metabolism 251The Brain is Fueled by the Oxidative
Metabolism of Glucose 253Cerebral Blood Flow Delivers O2 and
Glucose and Clears CO2 253Neuronal Activation is Followed by
a Hemodynamic Response 254Multiple Agents Mediate Neurovascular
Coupling 255The Function of Neurovascular Coupling
and the Oxygen Limitation Model 255Is Neurovascular Coupling a Feed-Forward
Mechanism? 257
THE BOLD EFFECT 257Magnetic Susceptibility Variations Distort
the Local Magnetic Field and OftenCreate Image Artifacts 257
Magnetic Susceptibility Changes dueto Blood Oxygenation Create theBOLD Effect 258
Diffusion of Water Molecules Moderatesthe GRE-BOLD Effect and Createsthe SE-BOLD Effect 259
Intravascular BOLD Effects Make aStrong Contribution to the NetSignal Change 260
Modeling the BOLD Effect 261Dynamics of the BOLD Signal 262
DESIGN AND ANALYSIS OFBOLD-fMRI EXPERIMENTS 263
Statistical Analysis is Required to DetectSmall Signal Changes 263
The General Linear Model Providesa Statistical Framework forIncorporating All the Componentsof the Signal 264
Identifying Activated Voxels 265Statistical Parametrical Maps are Used
to Display Activated Voxels 266Limitations of the General Linear
Model 266Block Designs versus Event-Related
Designs 267Detection versus Estimation 268
ARTIFACTS AND NOISE 269fMRI is More Sensitive to Imaging
Artifacts than Clinical MRI 269Minimizing and Correcting Image
Distortions 269fMRI is Sensitive to Subject Motion 270The fMRI Signal Includes Contribution
from Physiologic Fluctuations 270Correcting for Physiologic Noise 271Scanner Stability and Thermal Noise 272
MEASURING CEREBRAL BLOOD FLOW,CEREBRAL METABOLIC RATE OFOXYGEN, AND CEREBRAL BLOODVOLUME 274
Cerebral Blood Flow 274Calibrating the BOLD Signal to Measure
CMRO2 Changes 275
Assessment of Cerebral Blood VolumeUsing an Exogenous ContrastAgent 275
Assessment of Cerebral Blood VolumeUsing an Endogenous ContrastAgent 276
Magnetic Resonance Spectroscopy 277Diffusion 277Manganese Tract Tracing 277
EXPLORING THE HEMODYNAMICRESPONSE TO BRAIN ACTIVATIONWITH MRI 277
Are Oxygen and Glucose MetabolismLinked during Increased NeuralActivity? 278
Why Does Glucose Metabolism Increasemore than Oxygen Metabolism withBrain Activation? 278
What is the Underlying Neuronal Activitythat Drives the fMRI Signals? 279
Spiking versus Synaptic Activity 279Simultaneous Measurements of
Electroencephalography andEvent-Related Field Potentialswith fMRI 280
Does Inhibition Produce a BOLDResponse? 280
What is the Significance of the Transientsof the BOLD Signal? 280
Post-Stimulus Undershoot 281Nonlinearity of the BOLD Response 281The Physiologic Baseline Strongly Affects
the BOLD Signal 282Do BOLD Correlations Reveal
Long-Range Patterns ofConnectivity? 283
Spatial and Temporal Resolution 283
*The authors are supported by NIH grants NS-36722 and NS-042069.
Ch009.qxd 14/7/05 12:43 PM Page 249

INTRODUCTION TO FUNCTIONALMAGNETIC RESONANCEIMAGING (fMRI)
The MRI Signal is Sensitive toChanges in Blood Oxygenation
One of the remarkable developments in recent work onMRI is the recognition that changes in the metabolicstate of the brain affect the MR signal in a detectablefashion and therefore provide an intrinsic mechanism ofcontrast for brain activation studies. The origin of thiseffect is that the magnetic state of hemoglobin (Hb)depends upon its oxygenation, so that changes inoxygen saturation of the hemoglobin produce a smallchange in the local MR signal, the blood oxygenationlevel–dependent (BOLD) effect. Specifically, deoxy-genated hemoglobin is paramagnetic and tends toreduce the local MR signal by creating microscopicfield gradients within and around the blood vessels. Ifthe local oxygen extraction fraction (E) always remainedconstant, the local oxygenation of the blood would notchange, and the BOLD effect would simply be an inter-esting, but not particularly useful, biophysical effect.However, when combined with an unexpected physio-logic phenomenon, this becomes a powerful tool formapping brain activation. Following increased neuralactivity in the brain, the local cerebral blood flow (CBF)increases much more than the cerebral metabolic rateof oxygen (CMRO2), and as a result E decreases withactivation. Because the local blood is more oxygenated,there is less deoxyhemoglobin present and the local MRsignal increases slightly.
Brain activation studies based upon BOLD contrasttypically employ an experimental paradigm in which asubject alternates between periods of stimulation andrest while a rapid series of MR images is collected. Thetime series for each image voxel is then analyzed todetermine if the signal shows a significant correlationwith the stimulus, i.e., increasing when the stimulus wasapplied and decreasing when the stimulus was removed.Those pixels that do show a correlation are displayed incolor on a regular anatomical MR image as the areasactivated by the stimulus.
The Origins of fMRI
The fact that the magnetic state of hemoglobin changeswith its state of oxygenation was discovered in 1936 byPauling and Coryell, before the discovery of nuclearmagnetic resonance (NMR) itself.1 In 1982 Thulborn andcolleagues demonstrated relaxation rate (T2) changesin blood samples due to the magnetic susceptibilitychanges caused by the presence of paramagnetic deoxy-hemoglobin.2 However, it was not until the 1990s thatthe potential significance of this effect for functionalneuroimaging was realized.3-7
The first demonstration that changes in blood oxygena-tion had a measurable effect on the MR signal in vivowas not an activation study but rather a physiologic
manipulation in which the inspired oxygen was varied.Ogawa et al imaged the brains of mice at high magneticfields (7 and 8.4 T) with gradient-echo imaging.4 Theyfound that the veins became noticeably darker in the MRimage when the oxygen in the inspired air was reduced.The reduction of the blood signal was consistent withthe earlier in vitro NMR studies that had demonstratedthe effect of oxygenation on T2.2 But, in addition, Ogawaand colleagues made the key observation that thesignal from the tissue surrounding the veins also wasreduced, and they proposed that the cause of this effectwas a change in the magnetic susceptibility of the blood.Furthermore, the effect was greatly reduced in spin-echoimages. Both these observations were consistent withthe source of the effect being related to magnetic sus-ceptibility changes (to which gradient-echo images arehighly sensitive) brought on by the presence of thedeoxygenated hemoglobin.
Ogawa and colleagues suggested that this phe-nomenon could form the basis for monitoring regionaloxygen use in the brain, and speculated that duringactivation more oxygen would be removed from theblood and the deoxyhemoglobin concentration wouldincrease. The reality of the situation turned out to bethe opposite of this—deoxyhemoglobin concentrationdecreases with activation because of the large CBFchange—but the insight that this NMR effect couldbe used to measure brain function was the criticalbeginning of fMRI. Subsequently, Turner and colleaguesimaged cat brains under the controlled conditions ofanoxia and apnea with an echo-planar imaging (EPI)pulse sequence on a 2 T system.8 They also found MRsignal changes that were dependent on the oxygenationof the blood.
The detectability of blood oxygenation effects inthese well-controlled animal experiments at leastsuggested the possibility that such effects might be seenin humans performing tasks that alter the oxygenutilization in the brain. Kwong and colleagues acquiredimages of a normal human subject during visual stimu-lation with a gradient-echo EPI sequence using a longecho time (40 ms) in order to enhance the susceptibilityeffects.3 Temporally resolved images acquired during andin the absence of stimulation showed clear differencesin signal intensity, with the signal increasing duringstimulation, suggesting that the deoxyhemoglobin con-centration decreased with activation. In short orderseveral other studies confirmed this finding.5-7 OtherfMRI studies in the visual cortex with a high field (4 T)scanner and the motor cortex with an echo-planarsystem with specially designed gradient coils alsodemonstrated signal increases with activation.9 Similarresults were soon obtained on a conventional clinicalscanner as well.10
fMRI Has Become an ImportantTool in Neuroscience Research
From its origins in basic MRI research described above,fMRI has grown explosively to become a standard andindispensable tool in neuroscience research. Previously,
250 S E C T I O N I ■ PHYSICS, INSTRUMENTATION, AND ADVANCED TECHNIQUES
Ch009.qxd 14/7/05 12:43 PM Page 250

positron emission tomography (PET) methods ofmeasuring CBF change were the standard for mappingfunctional activity in the human brain. While PETstudies are still done for a number of applications,most human brain mapping studies are now done withfMRI.Over the last decade, the sophistication of the tech-niques has improved enormously.For example,techniquesfor retinotopic mapping have become standard instudies of the visual system. The visual image producedon the retina is mapped in a spatially coherent way ontothe visual cortex, and this coherent retinotopic map isrepeated in many sub-regions of the visual cortex. Bymapping progressive waves of activation as a subjectviews expanding rings or rotating wedges, the bound-aries of these different functional regions of the visualcortex can be mapped.11,12 Because the functionalorganization does not always match up in the same waywith the anatomical organization, fMRI studies providean enormous advance in the ability to characterize theworking human brain by identifying these functionalsub-divisions of the visual cortex in addition toanatomical sub-divisions.
Overview of the Chapter
The remainder of the chapter introduces the basicprinciples, mechanisms, and techniques that underliefMRI. In “The Physiologic Basis of fMRI,” the physiologicmechanisms linking blood flow, oxygen metabolism, andneural activity are described. In fact, in recent years fMRItechniques have become useful tools for exploring theselinks. In “The BOLD Effect,” the biophysics underlyingthe BOLD effect is described, including mathematicalmodels for how the BOLD signal depends on the localchange in the O2 extraction fraction E and the venousblood volume V. In addition, because fMRI techniquesmeasure dynamic changes, and the dynamics of E and Vmay have different time constants, there is the possibilityfor a range of transient effects in the measured BOLDresponse. Because the BOLD signal changes are small—typically only a few percent—the design and analysis offMRI experiments to detect these subtle effects is acritical component of fMRI; this is introduced in “Designand Analysis of BOLD-fMRI Experiments.” In addition,because the BOLD signal changes are small, artifacts that
would have little impact on the diagnostic utility ofclinical MR images nevertheless can severely degradefMRI data, and some of these effects and possibleremedies are discussed in “Artifacts and Noise.” One ofthe powerful features of MRI is its flexibility, and otherMR-based techniques have been developed to measuredifferent physiologic aspects of brain activation thatcomplement and enhance the standard measurementsof the BOLD effect. These other methods, and how theycan be combined with BOLD-fMRI, are introduced in“Measuring Cerebral Blood Flow, Cerebral MetabolicRate of Oxygen, and Cerebral Blood Volume.” Finally,in “Exploring the Hemodynamic Response to BrainActivation with MRI,” we describe the ways in whichfMRI is being used in current research on the physi-ology of brain activation, and some of the notable openquestions.
THE PHYSIOLOGIC BASIS OF fMRI
In a typical fMRI experiment the goal is to map patternsof neuronal activation in the subject’s brain while he orshe performs specific tasks. However, fMRI does notmeasure the neuronal activity itself. Instead, the BOLDeffect in response to activation is sensitive to the con-centration change of deoxygenated hemoglobin, whichin turn is dependent on cerebral blood flow (CBF),cerebral blood volume (CBV), and cerebral metabolicrate of oxygen (CMRO2), illustrated in Figure 9-1.
A critical goal for interpreting fMRI data is to under-stand the underlying link between neuronal activity andthe hemodynamic response. This is still an area of activeresearch, and in this section we outline the currentthinking.
Neuronal Signaling andEnergy Metabolism
In the brain,neurons are maintained in a thermodynamicstate far from equilibrium. The sodium ion (Na+)concentration outside the neuron is much higher thanthat inside the cell. Given the more negative potentialinside the cell, it is a strongly downhill reaction for Na+
to move into the cell. On the presynaptic side, calcium
C H A P T E R 9 ■ BASIC PRINCIPLES OF FUNCTIONAL MRI 251
Stimulus Neuronal activity Blood flow
Blood volume
Blood oxygenation
Oxygen metabolism
F I G U R E 9-1
The path of changes linking an appliedstimulus to the measured local BOLD signalchange in a subject’s brain during an fMRIexperiment. In this illustration, a flickeringcheckerboard stimulus triggers increasedneuronal activity in the visual cortex. This isaccompanied by increased blood flow, bloodvolume, and oxygen metabolism, and thesephysiologic changes combine to alter thelocal deoxyhemoglobin, which in turn altersthe local MR signal.
Ch009.qxd 14/7/05 12:44 PM Page 251
ions (Ca2+) are also concentrated outside the cell, andneurotransmitters are highly concentrated in smallvesicles within the presynaptic terminal waiting forrelease. The arrival of an action potential triggers acascade that includes Ca2+ influx, neurotransmitterrelease into the synaptic cleft, binding of neuro-transmitter on the post-synaptic side, and opening ofion channels for Na+ and potassium (K+) currents. Thissignaling process is all thermodynamically downhill,so no energy is required. The energy costs of neuralactivity come mainly in the recovery from this signaling:Na,+ K+,and Ca2+ must be pumped against their gradientsto restore the original ion distributions, and neuro-transmitter must be cleared from the synaptic cleft andre-packaged in vesicles in preparation for the arrivalof the next action potential. The source of thermody-namic free energy to power these uphill processes is thepool of adenosine triphosphate (ATP) and adenosinediphosphate (ADP). The ATP/ADP system is far fromequilibrium, with approximately ten times more ATPthan ADP.13 For this reason, the conversion of ATP to ADPcarries a large negative free energy (∆G) that can driveother reactions uphill. In addition to direct use of ATP,some uphill processes, such as the clearance of theneurotransmitter glutamate from the synaptic cleft, aredriven by co-transport of Na+ down its gradient from theextracellular to intracellular space. The degraded Na+
gradient, in turn, is restored by the Na+/K+ pump, whichpumps both Na+ and K+ against their gradients at theexpense of ATP. It has been estimated14 that at least halfof the energy consumed in the brain is due to the actionof the Na+/K+ pump.
In short, one can think of the brain as containing twostores of free energy—two batteries—that can be used
to drive all of the energy-consuming reactions in the cell:the ATP/ADP system,and the Na+ gradient across the cellmembrane. These two systems are in close communi-cation through the Na+/K+ pump. From a biochemicalperspective, the available free energy is defined by aratio of concentrations: [ATP]/[ADP] in one case, andextracellular/intracellular Na+ in the other. That is, it isnot the ATP itself that carries the energy; it is the highratio of [ATP]/[ADP] that is far from equilibrium thatendows the conversion of ATP to ADP with a largenegative free energy.
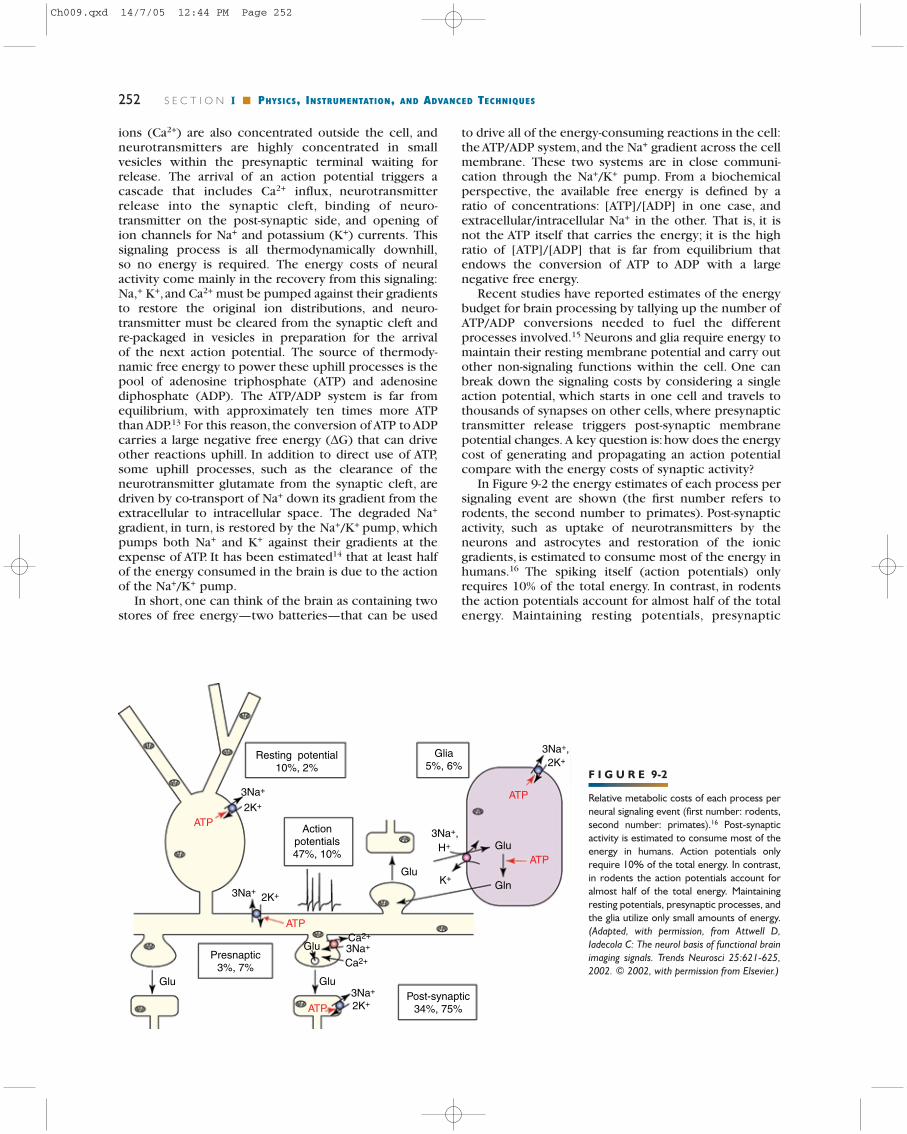
Recent studies have reported estimates of the energybudget for brain processing by tallying up the number ofATP/ADP conversions needed to fuel the differentprocesses involved.15 Neurons and glia require energy tomaintain their resting membrane potential and carry outother non-signaling functions within the cell. One canbreak down the signaling costs by considering a singleaction potential, which starts in one cell and travels tothousands of synapses on other cells, where presynaptictransmitter release triggers post-synaptic membranepotential changes. A key question is:how does the energycost of generating and propagating an action potentialcompare with the energy costs of synaptic activity?
In Figure 9-2 the energy estimates of each process persignaling event are shown (the first number refers torodents, the second number to primates). Post-synapticactivity, such as uptake of neurotransmitters by theneurons and astrocytes and restoration of the ionicgradients, is estimated to consume most of the energy inhumans.16 The spiking itself (action potentials) onlyrequires 10% of the total energy. In contrast, in rodentsthe action potentials account for almost half of the totalenergy. Maintaining resting potentials, presynaptic
252 S E C T I O N I ■ PHYSICS, INSTRUMENTATION, AND ADVANCED TECHNIQUES
F I G U R E 9-2
Relative metabolic costs of each process perneural signaling event (first number: rodents,second number: primates).16 Post-synapticactivity is estimated to consume most of theenergy in humans. Action potentials onlyrequire 10% of the total energy. In contrast,in rodents the action potentials account foralmost half of the total energy. Maintainingresting potentials, presynaptic processes, andthe glia utilize only small amounts of energy.(Adapted, with permission, from Attwell D,Iadecola C: The neurol basis of functional brainimaging signals. Trends Neurosci 25:621-625,2002. © 2002, with permission from Elsevier.)
Post-synaptic34%, 75%
3Na+
2K+
2K+
2K+
ATP
ATP
ATP
ATP
ATP
Ca2+
K+
H+
3Na+,
3Na+,2K+
Ca2+
3Na+
3Na+
3Na+
Glu
Glu
Glu
Glu
Gln
Presnaptic3%, 7%
Glu
Actionpotentials47%, 10%
Resting potential10%, 2%
Glia5%, 6%
Ch009.qxd 14/7/05 12:44 PM Page 252

processes, and the glia utilize only small amounts ofenergy. In “Exploring the Hemodynamic Response toBrain Activation with MRI,”we discuss what implicationsthis estimation has for the interpretation of the measuredfMRI signals.
The Brain is Fueled by the OxidativeMetabolism of Glucose
The ATP/ADP system that fuels the recovery from neuralactivity must be restored by coupling the uphillconversion of ADP to ATP to an even more downhillreaction: the oxidative metabolism of glucose andoxygen to carbon dioxide and water. The complete con-version of one molecule of glucose and six moleculesof O2 generates 38 ATP molecules from ADP. The fullmetabolism is illustrated in Figure 9-3.
This fundamental energy metabolism happens in twostages. In the cytoplasm, glycolysis converts the glucosemolecule to two molecules of pyruvate, stores someof the energy in the conversion of two nicotinamideadenine dinucleotide ions (NAD+) to NADH,17 and gen-erates two ATP molecules from ADP, all without usingO2.Although the ATP yield of glycolysis is low, it is veryfast. For this reason, exercising muscle relies onglycolysis to generate the ATP needed for short burstsof intense activity (e.g., sprinting), and it has beensuggested that speed of production of ATP may also beimportant in the brain.18
Much more ATP is generated in the second stage ofenergy metabolism when pyruvate and O2 diffuse intothe mitochondria and enter the tricarboxylic acid (TCA)
cycle. The end products of mitochondrial energymetabolism are six molecules each of H2O and CO2, andthe conversion of 36 ADP molecules to ATP. As part ofthis net metabolism, the NADH produced by glycolysisalso is shuttled into the mitochondria in exchange forNAD+, restoring the cytosolic balance.
It is important to recognize that, because energymetabolism occurs in two stages with glycolysis feed-ing the TCA cycle, it is possible for the rate of glycolysisto exceed the rate of pyruvate metabolism in the mito-chondria. In this case the cerebral metabolic rate of glu-cose (CMRGlc) and the cerebral metabolic rate ofoxygen (CMRO2) are not matched. Fully matchedoxidative metabolism requires that six O2 molecules areconsumed for each glucose molecule metabolized, oftendescribed as an oxygen-glucose index (OGI) of 6.0. Atypical experimental value is OGI = 5.5 at rest, but it isinteresting to note that this quantity appears to decreasewith activation: the CMRGlc change with activationexceeds the CMRO2 change18 (for further discussionsee “Exploring the Hemodynamic Response to BrainActivation with MRI”).
If the glucose and oxygen metabolic rates are notmatched, pyruvate and NADH would accumulate in thecell and ultimately disrupt glycolysis. However, animportant enzyme called lactate dehydrogenase catalyzesthe conversion of pyruvate and NADH to lactate andNAD+.17 This restores the NADH/NAD+ balance but leadsto the accumulation of lactate, which ultimately diffusesout of the cell and is carried away in the blood. Theaccumulation of lactate in the tissue, which can bemeasured with MR spectroscopy techniques (see“Measuring Cerebral Blood Flow, Cerebral MetabolicRate of Oxygen, and Cerebral Blood Volume” and“Exploring the Hemodynamic Response to BrainActivation with MRI”), is thus a sign of a mismatch ofCMRGlc and CMRO2.
Cerebral Blood Flow Delivers O2and Glucose and Clears CO2
For the brain to continue functioning, glucose andoxygen must be supplied and CO2 cleared from eachtissue element, and this is accomplished by blood flow.In order to understand hemodynamics, it is importantto keep in mind that CBF and CBV are two distinctphysiologic quantities. The CBV describes the totalvolume of the vasculature: the sum of the volumes of thearteries, arterioles, capillaries, venules, and veins in avolume of tissue (Fig. 9-4). The CBV is usually expressedas a dimensionless quantity, the fraction of the tissuevolume occupied by blood. A typical value of CBV in thebrain is 4%.
In contrast, CBF is the volume of arterial blooddelivered to an element of tissue in a specified time, i.e.,only blood flowing through arteries, arterioles, andcapillaries is counted for CBF. Thus, blood flowingthrough a volume of tissue but destined for another isnot counted for CBF of this volume. The usual units aremL/100 g/min, and a typical value in the human brainis 60 mL/100 g/min. If we refer the CBF to 1 mL of tissue
C H A P T E R 9 ■ BASIC PRINCIPLES OF FUNCTIONAL MRI 253
F I G U R E 9-3
Non-oxidative and oxidative metabolism of glucose. The non-oxidativemetabolism of glucose (glycolysis) generates two ATP molecules from ADPby converting the glucose molecule to two molecules of pyruvate. TheTCA cycle and the electron transfer chain in the mitochondria metabolizethe two pyruvate molecules and 6 O2 molecules to 6 CO2 and 6 H2Omolecules, producing 36 ATP from ADP. In the cytosol, pyruvate andlactate are in near equilibrium, and if the glucose metabolic rate exceedsthe oxygen metabolic rate, the lactate concentration will rise.
Ch009.qxd 14/7/05 12:44 PM Page 253

(with a density of about 1 g/mL), the units becomemL/mL/min, or simply inverse time. Expressed thisway, we could write a standard CBF of 60 mL/100 g/minas 0.01 s−1. This formulation of the units emphasizesthat CBF often acts like a rate constant. In particular, themetabolic rate of oxygen metabolism can always bewritten as:
(Eq. 9-1)
where Ca is the arterial concentration of O2, and E is thenet oxygen extraction fraction. This is simply the totalrate at which O2 is being delivered to tissue (Ca CBF)times the fraction of the delivered oxygen that isextracted and metabolized.
In general, it is helpful to think of CBF and CBV asindependent quantities: in plumbing terms, the volumeof the pipes and the flow being delivered to the pipes.At some level, however, there is a connection. The CBFincrease associated with neural activity is triggered byrelaxation of the smooth muscle in the wall of thearterioles. The arterioles provide most of the resistancein the vascular tree and provide a way to quickly decreasethe vascular resistance (by expanding). In this sense, anincreased blood volume is part of the mechanism ofincreasing CBF (see Fig. 9-4).
However, if the arteriolar volume fraction is small, thismay be only a small change in total CBV. As the resistanceof the arterioles decreases, the pressure drop acrossthese vessels also decreases, raising the pressure in thecapillaries and veins. These vessels may also expand dueto the increased pressure, further increasing the CBV.Experimental studies19 have indicated that the steady-
CMRO2 � E � Ca � CBF
state relationship between CBF and CBV can bedescribed with a power law:
(Eq. 9-2)
where the exponent is approximately α = 0.38, i.e., aCBF increase of 50% corresponds to a CBV increase ofapproximately 18%. This empirical relationship appliesto the entire cerebral blood volume, and only after asteady state has been reached.
The temporal dynamics of the total CBV will be aweighted composite of the changes in each of itscompartments. For example,during functional activationthe initial change will be dominated by the arterioles,butit has been postulated that the venous vessels may beslower to expand and slower to contract back tobaseline after CBF has returned to normal.20,21 In general,the CBV and CBF ratio during the transients is as yet notwell described, but measuring this ratio dynamicallypromises to provide some insights into these basicphysiologic variables and into neurovascular couplingthat may be altered in disease.
Neuronal Activation is Followedby a Hemodynamic Response
A large number of positron emission tomography (PET)studies, and more recently fMRI studies, have measuredthe changes in CBF, CBV, CMRGlc, and CMRO2 accom-panying neural activity, see for example references 19and 22 to 25. There is of course a good deal of experi-mental variation, but in rough numbers the basic patternfor a strong stimulus is that CBF increases dramatically(40%),CMRGlc also increases by about the same amount,CMRO2 increases much less (<20%), and CBV increasesby a modest amount (15%). It is useful to summarize thiscomplex of physiologic changes in terms of two keydimensionless numbers defined above, the oxygenextraction fraction (E) and the oxygen-glucose index(OGI). The key results are that with activation E and OGIboth decrease. Trying to understand this unexpectedpattern is the focus of much current research (see“Exploring the Hemodynamic Response to BrainActivation with MRI”).
The decrease of E with activation is the primary causeof the BOLD effect. Oxygenated blood is diamagneticand deoxygenated blood is paramagnetic, so the increasein blood oxygenation during activation changes themagnetic properties of the blood and the tissue andcauses the MR signal to increase. Because the temporalresolution of fMRI is much better than with PET tech-niques, the BOLD signal provides a window on the tem-poral dynamics of the hemodynamic response. Typicalexperimental responses to a very short stimulation(approximately 1 second in duration), called the impulseresponse, and to a long stimulation (20 seconds in dura-tion) measured with fMRI are shown in Figure 9-5.
The BOLD response is typically delayed by 1 to 2seconds and reaches its maximum after approximately8 s (typically between 5 and 10 s). After the end of thestimulus a post-stimulus undershoot often can be seen
CBV � CBF
254 S E C T I O N I ■ PHYSICS, INSTRUMENTATION, AND ADVANCED TECHNIQUES
F I G U R E 9-4
Vascular structure of a chinchilla measured with corrosion casts. Thefeeding arteriole (red) delivers oxygen-saturated blood to the capillaries(orange and green). The capillaries end in draining venules (blue) having onlyapproximately 60% oxygen saturation, that is, brain tissue extracts 40%of the oxygen from the capillaries. All these vascular compartments con-tribute to the cerebral blood volume (CBV). Cerebral blood flow (CBF) isthe rate of blood delivery of blood to the capillary bed. (Adapted fromHarrison RV, et al: Blood capillary distribution correlates with hemodynamic-based functional imaging in cerebral cortex. Cereb Cortex 12:225-233, 2002,by permission of Oxford University Press.)
Ch009.qxd 14/7/05 12:44 PM Page 254

which lasts typically 20 s or more. More rarely, and nothighly reproducibly, an initial undershoot of the BOLDsignal is observed (for an overview see reference 26),called the “initial dip.”For further discussion and implica-tions of the transients see “Exploring the HemodynamicResponse to Brain Activation with MRI”.
Multiple Agents MediateNeurovascular Coupling
The translation of increased neuronal activity to increasedCBF—neurovascular coupling—can be considered fromtwo different viewpoints: 1. what is the function servedby neurovascular coupling?; and 2. what is the mecha-nism that accomplishes this function? Somewhatsurprisingly, the mechanism is better understood thanthe function. A number of vasoactive agents are pro-duced in association with neural activity, and it appearsthat the particular mechanisms employed to raise CBFvary in different parts of the brain.27 Some of the keyvasoactive agents are nitric oxide (NO), potassium ions(K+), hydrogen ions (H+), adenosine, and carbon dioxide(CO2). This is only a partial list, but it already includes ahighly diffusible gas linked to G-protein activation (NO),a key player in ion homeostasis (K+), the local pH, aneurotransmitter (adenosine), a key element of theenergetic stores of the tissue (adenosine again, as thefinal form of degradation of ATP), and a key product ofenergy metabolism (CO2). This suggests that multiplemechanisms exist to increase blood flow in associationwith increased neural activity. Indeed, the experimentaldata indicate that there is no single mechanismcontrolling CBF in the brain, and the mechanism of CBFcontrol may be quite adaptive during development.
At this point, there is no shortage of possible mecha-nisms although little is known about how the fullintegrated system for neurovascular coupling works.27
Two interrelated themes have received growingattention in recent years, one focused on the central roleof glutamate and the other focused on the role of thenon-neuronal (glial) cells in neuronal signaling andneurovascular coupling.28-31 Glutamate is the primaryexcitatory neurotransmitter, and the majority of synapsesare glutamatergic. When glutamate binds to a post-synaptic receptor it opens a Na+ channel that allowsNa+ to diffuse down its gradient, and eventually it mustbe pumped back by the Na+/K+ pump. For this reason,glutamate itself would serve as a good signal for theenergy-consuming processes associated with neuralactivity, and there is some evidence that glutamate has adirect vasodilatory effect.32 But the more significantconnection is likely to be that glutamate is cleared fromthe synaptic cleft by astrocytes.29
The current view of the role of the glia has expandedsubstantially in the last few years.31,33 It has been knownfor some time that astrocytes are both positioned nearsynapses for recycling of glutamate and also havenumerous projections to blood vessels by their end-feet,suggesting at least the anatomical connections forlinking synaptic activity to blood flow. Recent work hasindicated that astrocytes have very well-developed andessentially non-overlapping territories, further support-ing a key role for the astrocytes in assessing the level ofactivity of the neurons and in some way communicatingthis to the blood vessels. In addition, astrocytes playa role in modulating neuronal activity.31 It has beenhypothesized that glia provide the energy substrate forthe neurons by shuttling lactate to the neurons,29
although this is controversial.34
The Function of Neurovascular Couplingand the Oxygen Limitation Model
The mechanisms of neurovascular coupling do notnecessarily clarify the function served; for example, evenif NO is the mechanism that triggers increased bloodflow, why is the resulting CBF increase so large? For thedescription of the function of neurovascular coupling,the details and the pathways of the CBF regulation areless important.
Because CBF increases much more than CMRO2, sothat E decreases with activation, this physiologicphenomenon was originally called an “uncoupling” ofblood flow and oxygen metabolism.35 However, it ispossible that the large change in CBF is an integral partof regulating oxygen delivery, so that the decrease of E isnecessary for increasing CMRO2, an idea we referred toas the oxygen limitation model.26,36-40
In the context of this model the large increase in CBFis required to support the smaller increase of oxygenmetabolism (Fig. 9-6). Although this idea has by nomeans been proven, it is the only quantitative explana-tion that has been proposed for the function served by alarge CBF increase. The model is based on experimentsshowing two effects: 1. at rest a large fraction of thedelivered oxygen never leaves the capillary,but nearly allof the oxygen that does enter the extravascular tissuespace is metabolized; and 2. CBF increases by increasing
C H A P T E R 9 ■ BASIC PRINCIPLES OF FUNCTIONAL MRI 255
Time (s)
10 20 30 40 50 600
MR
sig
nal c
hang
e (%
)
3
2
1
0
-1
F I G U R E 9-5
Typical experimental hemodynamic responses to a very short stimulation(approximately 1 second duration, blue), called the impulse response, andto a long stimulation (20 seconds duration, red) measured with fMRI.
Ch009.qxd 14/7/05 12:44 PM Page 255

capillary velocity rather than by opening new capillaries(i.e., there is no capillary recruitment).
The implications of these results can be understoodfrom the viewpoint of diffusion down a concentrationgradient, with oxygen diffusing from a high concen-tration in the capillary to a low concentration in themitochondria. If the net extraction is nearly equal to theunidirectional extraction, then backflux of O2 from tissueto capillary must be small, implying that the tissue PO2
is near zero. With no capillary recruitment the diffu-sion distance from capillary to mitochondria is fixed, soto increase the O2 flux either the mean capillary PO2
must be increased or the mitochondrial PO2 must bedecreased. If the mitochondrial PO2 is already near zero,then the only option is to raise capillary PO2 by raisingthe venous O2 content, and this means that E mustdecrease. At steady state, the product of E and CBF mustmatch this increased flux from capillary to mitochondria(Eq. 9-1), so CBF must increase by a larger amount toovercome the decrease of E.
The original model for the effects of limited oxygendelivery assumed the extreme form of equal unidirec-tional and net extraction fractions, and the prediction ofthat model was that the fractional change in CBF wouldneed to be approximately 5 times larger than the frac-tional change in CMRO2. Measurements in the awakehuman brain with PET and calibrated fMRI have foundthis ratio to lie in the range n = 2 to 6,35,41-46 so the pre-dicted ratio lies near the high end of the experimentalresults.
However, this form of the model is undoubtedly toosimple.Other factors can influence the diffusibility of O2,such as capillary dilation and shifts of the binding curveof O2 and hemoglobin, and these effects should beincluded in the modeling.37 An increase of diffusivitythrough these mechanisms would soften the require-
ment for the CBF increase, but detailed modeling ofthese effects in this context has not been reported.Furthermore, in the original simple form of the oxygenlimitation model the assumption of equal unidirectionaland net extraction fractions is equivalent to assuming nobackflux of O2 and a tissue PO2 of zero. This is certainlyan oversimplification, and is incompatible with studiesof the oxidation state of cytochrome oxidase,which indi-cate that at rest oxygen concentration is not a limitingfactor in determining the rate of oxidative metabolism inthe mitochondria.47
These observations can be reconciled with the oxygenlimitation model if the mitochondrial PO2 is greater thanzero but still significantly less than the average capillaryPO2, and the blood flow increase serves to maintain aconstant mitochondrial oxygen tension (see Fig. 9-6).Calculations indicate that a CBF/CMRO2 ratio of n = 4 isrequired to maintain mitochondrial PO2 at a constantvalue while increasing the oxygen flux.37 Other factorssuch as the Bohr effect and perhaps capillary dilationcould reduce the value of n required. In this case themitochondrial PO2 would be held at a high enough levelthat O2 availability would not become limiting in themitochondria.
In short, the tissue PO2 would constitute a buffer thatis normally not used with physiologic activation, butwhich could come into play under some conditions atthe beginning of stimulation or in hypoxia. However,oxygen delivery is still fundamentally limited, in thesense that maintenance of this mitochondrial PO2 requiresa steady flux of O2 from the capillaries.Variability of thisoxygen buffer (e.g., through alterations of inspiredoxygen content or resting CBF) is a possible source ofthe variability between laboratories of detection of theinitial deoxygenation26 (see “Exploring the HemodynamicResponse to Brain Activation with MRI”).
256 S E C T I O N I ■ PHYSICS, INSTRUMENTATION, AND ADVANCED TECHNIQUES
Arterioles
100
45
30
5
0Mitochondria
Po2
Capillaries Venules
Activation
RestO2 flux
F I G U R E 9-6
Illustration of the oxygen limitation model. The oxygen concentration, measured as a partial pressurePO2, varies from approximately 100 torr in the arteries to approximately 30 torr in the veins, with a meancapillary value of approximately 45 torr. The PO2 in the mitochondria is thought to be low (approximately5 torr). Oxygen diffuses from the high concentration in the capillary to a low concentration in themitochondria, and to increase the O2 flux the gradient must be increased. If mitochondrial PO2 is alreadylow, and there is no capillary recruitment to bring the blood closer to the mitochondria, then meancapillary PO2 must be increased. This requires that the oxygen extraction fraction E must be reduced, soCBF must increase more than CMRO2.
Ch009.qxd 14/7/05 12:44 PM Page 256

Is Neurovascular Couplinga Feed-Forward Mechanism?
By the model described above, the function served by alarge CBF increase following neural activity is to maintainmitochondrial PO2 at a constant value so that oxidativemetabolism can proceed without being limited byoxygen availability. Two possibilities arise for how CBF isregulated: 1. a feedback model in which the amount ofoxygen already available determines the increase in CBFfollowing functional activity; 2. a feed-forward model inwhich the change in neuronal activity determines thechange in CBF independent of oxygen availability andhence from the baseline CBF.
A feedback system that responded to a drop incytosolic PO2 would not work because the goal is toincrease cytosolic PO2 above baseline in an activatedstate and would only produce transient changes inCBF. However, a feed-forward system is consistent withthese theoretical ideas and with current experimentsusing vasoactive agents. That is, the neural activity startsa cascade of biochemical processes that leads toincreased CBF, with no direct feedback about whethersuch a CBF change is needed to support the increase inCMRO2. This idea is prompted by several recent studiesthat measured the CBF or deoxygenation (i.e., BOLD)response to activation under conditions where thebaseline CBF was altered.48-50 Baseline CBF can beincreased by breath-holding, inhalation of CO2, oracetazolamide and decreased by ingestion of caffeine.The remarkable finding from most of these studies is thatthe increment of CBF change due to the activation isunaffected. The idea that the neurons simply call out formore oxygen without sensing whether they haveenough to begin with seems inefficient. However, giventhe critical importance of oxygen for continued energymetabolism, the links between hypoxia and the initiationof apoptosis, and the theoretical reasons above for whyoxygen itself is a poor error signal for a control system, afeed-forward system begins to seem more plausible.
THE BOLD EFFECT
The primary MRI technique used for fMRI exploitsthe blood oxygenation level–dependent (BOLD) effect.The physiologic basis of the BOLD effect is that CBFincreases much more than CMRO2 during increasedneural activity, and as a result the oxygen extractionfraction E is reduced and the venous blood is moreoxygenated. The reason this physiologic change isdetectable with MRI is that the MR signal is sensitive tomicroscopic magnetic field gradients, and deoxyhemo-globin and oxyhemoglobin have different magneticproperties. In this section we consider this biophysicalbasis of the BOLD effect in some detail, with the goal ofderiving basic mathematical models that relate theunderlying physiologic changes to the measured signal.This is not a simple transformation, and indeed one ofthe complexities involved in interpreting the BOLDsignal is that it depends on several physiologic vari-
ables. Specifically, the oxygen extraction fraction Egoverns the oxygen saturation of blood leaving thecapillary, but the blood volume (CBV) also affects howmuch deoxyhemoglobin is present in an image voxel. Inthe following sections we consider how local changes indeoxyhemoglobin alter both the intravascular andextravascular MR signals for gradient-recalled echo(GRE) and spin-echo (SE) acquisitions, and then use thisas the basis for modeling the BOLD signal in terms ofE and CBV.
Magnetic Susceptibility VariationsDistort the Local Magnetic Fieldand Often Create Image Artifacts
The central physical idea at the heart of the BOLD effectis that deoxyhemoglobin alters the magnetic suscep-tibility of blood and creates magnetic field gradientsaround the vessels. In clinical MRI magnetic suscep-tibility effects are usually familiar as a source of artifacts.In BOLD imaging we exploit these effects, and indeedchoose pulse sequences that are especially sensitive tomagnetic susceptibility, in order to allow us to detect theBOLD signal changes. To understand this phenomenon,it is helpful to review the basic physics of magneticsusceptibility.
When any material is placed in a uniform magneticfield B0, the intrinsic magnetic moments within thematerial partially align with the field, so that the materialbecomes slightly magnetized. The magnitude of thisinduced magnetization is described by the magneticsusceptibility χ. The magnetization M = χ�B0 is theequivalent dipole density of the material, and so dependson both the intrinsic dipole density and the degree ofalignment of the dipoles with B0. Because the material isnow magnetized, it creates an additional magnetic fieldthat adds to B0. It is important to note that a uniformlymagnetized object generally produces a distinctly non-uniform magnetic field that depends strongly on thegeometric shape of the object. For example, a uniformlymagnetized cylinder produces a uniform field inside,but a dipole-like field outside (Fig. 9-7). This idealizedgeometry can serve as a model for the field distortionsaround a blood vessel containing deoxyhemoglobin.
To understand the effects of microscopic field distor-tions on the MR signal, it is helpful to think of the fielddistortion (illustrated in Fig. 9-7) on two distinct spatialscales. On the macroscopic scale the full frame of thefigure corresponds to a normal image, and the fielddistortions are due to large structures such as sinuscavities or the petrous bones. The field gradients due tothese susceptibility differences between tissues add tothe imaging gradients and can create image distortions.On the microscopic scale, Figure 9-7 corresponds to asingle image voxel, with microscopic field distortionsaround venules and small veins containing deoxyhemo-globin. In a gradient-recalled echo (GRE) MR experimenta 90° radiofrequency (RF) pulse tips the longitudinalmagnetization into the transverse plane where it beginsto precess with a frequency proportional to the field
C H A P T E R 9 ■ BASIC PRINCIPLES OF FUNCTIONAL MRI 257
Ch009.qxd 14/7/05 12:44 PM Page 257

at the location of that spin. At time TE the signal ismeasured, and the image intensity can then be viewed asa snapshot of the net signal from the voxel at TE. Ifthe signals from each sub-region of the voxel are outof phase due to local field offsets, the net signal willbe reduced due to the local phase dispersion. As TEincreases so does the degree of phase dispersion, and sothe signal is more attenuated. Microscopic field distor-tions around blood vessels thus attenuate the local signal.
On the other hand, if there was no microscopicvariation in magnetic susceptibility, so that within avoxel all spins experienced the same field offset, thenthe magnitude of the local MR signal would not bereduced but the phase of that signal would reflect thefield offset of the voxel. In other words, the phase mapof a GRE image can be taken as a map of large-scalemagnetic field distortions within the imaged object. Thephase image in Figure 9-8 was collected in this way, andthe light to dark transitions, as the phase cycles from359° to 0°, can be thought of as contour lines of themagnetic field.
Thus the local GRE signal is affected in two ways:macroscopic field variations across the brain affect thephase of the signal, while microscopic field offsetswithin a voxel reduce the magnitude of the signal. Asnoted above, magnetic susceptibility variations also caninterfere with mapping the local signal to its properlocation in space. MRI relies on using magnetic fieldgradients to encode the spatial origin of the MR signalwithin the signal itself. Specifically this means that thebasic assumption of MRI is that the magnetic field isperfectly uniform until the gradients are applied, so thatany phase offsets in the signal are due just to thoseapplied gradients. Magnetic susceptibility differencesbetween tissues (e.g., brain, bone, and air) create broadstatic field gradients that add to the applied pulsed fieldgradients used in imaging. The result is that the MRsignals are mismapped, creating distortions in the image.In Figure 9-8 the large-scale field distortions due to the
sinus cavities are readily apparent. In general, these large-scale effects are a nuisance, distorting the image andsometimes creating signal dropouts. In addition, signalsfrom spins lying in different fields are mapped into thesame voxel.When this happens the individual signals addincoherently and so partially (or completely) cancel out.In functional brain imaging, this is most prominent in theprefrontal cortex and midbrain.
Magnetic Susceptibility Changesdue to Blood OxygenationCreate the BOLD Effect
The field distortions around a magnetized blood vesseldue to deoxyhemoglobin (see Fig. 9-7) occur on a muchfiner spatial scale than the broad field distortions thatproduce image distortions. For modeling the effect ofthese microscopic field distortions,our primary goal is tounderstand how they produce phase dispersion withinthe voxel and a reduction of the net signal. Initiallywe will consider the GRE pulse sequence, the techniquemost sensitive to field offsets. Empirically, the signaldecay with increasing TE in a GRE image is described interms of an apparent transverse relaxation time T2*. Incontrast,with a spin-echo (SE) pulse sequence, a 180° RFrefocusing pulse is applied at time TE/2. By reversing thephase of each local signal halfway through, the phase
258 S E C T I O N I ■ PHYSICS, INSTRUMENTATION, AND ADVANCED TECHNIQUES
F I G U R E 9-7
Magnetic field distortions around a cylinder due to a magnetic susceptibilitydifference between the inside of the cylinder and the surrounding medium.The cylinder is oriented perpendicular to the main magnetic field B0,creating a dipole pattern of the Bz component in the space around thecylinder.
F I G U R E 9-8
Gradient-recalled echo (GRE) phase maps showing magnetic fielddistortions, with magnitude images displayed on the top and phase imageson the bottom: left, in a coronal section through a human head, and right,around a cylinder (as in Fig. 9-7). The local phase is proportional to thelocal field offset, and the transitions from black to white (from 359° to 0°)can be viewed as contour lines of the magnetic field. Note the fielddistortion in the brain due to the sinus cavity.
Ch009.qxd 14/7/05 12:44 PM Page 258

accumulation due to a constant field offset is perfectlyrefocused for each local spin group. As a result, theeffects of local field offsets are compensated, and thesignal decay with increasing TE is described by the trueintrinsic T2, with T2 being greater than T2*. This simplepicture must be modified to consider how diffusionmakes the refocusing incomplete, so that the SE signaldoes have some sensitivity to the BOLD effect. This isdiscussed below, after first describing the more pro-nounced BOLD effect seen with GRE imaging.
The basic effect of increased deoxyhemoglobincreating field offsets around the vessels and reducingthe MR signal can be described as a reduction of T2*.With activation there is less deoxyhemoglobin present,and so the BOLD effect is really a partial lifting of thissignal reduction. That is, the signal increase associatedwith the BOLD effect can be described as an increasein the local T2*. In the literature, the decay of the GREsignal is often written as e−TE·R2*, where R2*, the apparenttransverse rate constant, is simply the inverse of T2*. Thisformulation is simpler to work with in the modeling(considered in more detail below). At 1.5 T, a typicalvalue for T2* in the brain is 50 ms (R2* = 20 s−1). Withactivation, the increase of T2* is described as a decreaseof R2*: a negative ∆R2*. A strong activation measured at1.5 T will create a change in R2* due to the BOLD effectthat is on the order of ∆R2* = −1.0 s−1.With TE = 40 ms,the fractional change of the MR signal is then about 4%.
From the basic arguments above, the field distor-tions around vessels due to deoxyhemoglobin shouldaffect the GRE signal, but not the SE signal. However,the physical picture is not yet complete; we must stillconsider the effects of diffusion and the changes of theintravascular signal, and these effects make the result-ing GRE and SE signals more complex than the basicpicture above.
Diffusion of Water MoleculesModerates the GRE-BOLD Effectand Creates the SE-BOLD Effect
Water molecules continually tumble and move about dueto random thermal motions, and molecules starting atthe same location will spread out over time like a dropof ink in water. Specifically, for pure diffusion a group ofspins starting at x = 0 at t = 0 will spread into a gaussiandistribution centered on x = 0 (there is no shift of themean position) with a variance that grows with time.This variance is σ2 = 2Dt, where D is the diffusioncoefficient (approximately 10−5 cm2/s, or 1 µm2/ms inbrain). Note that this means that the characteristic widthof the distribution, σ, grows only with the square root ofthe time. For example, in brain the characteristicdistance moved due to diffusion in 10 ms is approxi-mately 4.5 µm, and in 100 ms it is approximately 14 µm.
This diffusion of water molecules is slow, but it doeshave a measurable effect on the MR signal. To understandthe effect, we start by considering a simple GRE pulsesequence used to image a voxel containing magnetizedvessels. An excitation pulse is applied at t = 0, and the
image data are acquired at t = TE. To keep the argumentsimple, imagine that the data acquisition time is veryshort, so that we are essentially taking a snapshot of thenet signal at the time TE. The signal attenuation is directlyrelated to the dispersion of the spin phases at time TE. Ifthere is no diffusion each spin stays at the same location,and precesses in the same field offset, for the entireduration TE. In this case the distribution of phases isdirectly proportional to the distribution of field offsets. Ifwe now introduce diffusion, each spin undergoes arandom walk, moving around and sampling differentlocations (Fig. 9-9). For any one spin the final phase willcorrespond to the average field offset experienced bythe spin in its random walk—diffusion effectivelysmooths the distribution of field offsets. In the limitingcase of very rapid diffusion,each spin wanders all aroundthe vessel, sampling the full range of field offsets. Thisreduces the phase dispersion because all the spins havesimilar histories, regardless of where they started out att = 0. In this limit there is little phase dispersion and solittle signal attenuation. This is called motional narrow-ing, meaning that the random motions have narrowedthe distribution of phases at the time of data acquisition.
In short, diffusion moderates the effects of the fieldoffsets, so the GRE signal is most attenuated when diffu-sion effects are negligible, and much less attenuatedwhen diffusion effects are prominent (Fig. 9-10). Thekey physical parameter that defines whether diffusionis important is τ, the typical time required for a spin todiffuse a distance equal to the radius of the magnetizedvessel (τ = r2 / 2D, where r is the radius of the vessel).For example, for a capillary with radius 3 mm, τ isapproximately 4.5 ms in the brain, for a venule withradius 15 mm τ is approximately 112 ms, and for asmall vein with a radius of 100 mm τ is approximately5 s (Fig. 9-9 illustrates the relative scale of a randomwalk path for TE = 40 ms compared with different
C H A P T E R 9 ■ BASIC PRINCIPLES OF FUNCTIONAL MRI 259
Small vein
r = 100 mm
Venule
r = 15 mm
Capillary
r = 3 mm
F I G U R E 9-9
Diffusion through magnetic field gradients affects the GRE signal. Watermolecules undergo a random walk, shown as a jagged path, through themagnetic field gradients around a vessel. The spatial scale of the fieldgradient is proportional to the vessel radius, shown as a contour map onthe left. The effects of diffusion are important only if the random walkcarries the spin through a range of field offsets during the duration of theexperiment TE. On the right is shown a random walk corresponding to a40 ms duration compared with the spatial scale of capillaries, venules, andsmall veins. Motion due to diffusion will tend to sample the full range offield offsets for a capillary but will have little effect for a small vein.
Ch009.qxd 14/7/05 12:44 PM Page 259

vessels). If τ is much less than TE, so that each spin is ableto sample all of the field offsets around a magnetizedvessel, then diffusion effects are important and there islittle signal loss due to the field offsets. On the otherhand, if τ is much greater than TE, then each spin essen-tially samples only the relatively uniform field nearits starting location, and the larger phase dispersionbetween spins attenuates the signal. From these argu-ments we expect that for a typical TE = 40 ms, diffusionreduces the GRE-BOLD effect around capillaries but haslittle effect on venules and small veins.
For SE measurements, the same ideas apply, but thephysics is a bit more complicated because of the 180°refocusing pulse. One can think of the action of a180° pulse as flipping the sign of the precessional phaseof a spin. If a spin has acquired a phase φ1 during theinterval TE/2 due to field offsets, then after the 180°pulse the phase will be −φ1.During the next interval TE/2,the spin will pick up an additional phase φ2, so the netphase angle at the time of data acquisition (TE) is φ2 − φ1.If these accumulated phases are due just to precessionwith a constant field offset, then −φ1 = φ2 and the netphase is zero—all spins will be coherent at the time ofdata collection. When diffusion is added to this simplepicture, the two phases φ1 and φ2 will not be the same,because each is the result of an independent randomwalk. In short, if field distortions are on a small enoughscale that diffusion becomes important, the spin-echoprocess does not fully refocus the signal, and so there isattenuation of the SE signal.
In general, the resulting attenuation of the SE signal ishard to model because it depends on the geometry ofthe field offsets and the interaction of this geometry withthe diffusion process.51-56 However, two limiting casesbracket the effect, and define the character of the signalattenuation (see Figs 9-9 and 9-10). At one extreme is thecase TE is much less than τ, in which the availablediffusion time is much less than the time required for adiffusing spin to sample all of the field offsets. Inthis “static broadening” regime the effects of diffusionare small, the 180° pulse works well to refocus phase off-sets, and there is little signal attenuation. At the otherextreme,TE is much greater than τ, each spin samples allof the field offsets and acquires approximately the samephase in the two periods before and after the 180° pulse.In this “motional narrowing” case there is again littleattenuation, although it is not because of the 180° pulse;as described above, in this regime there is little attenua-tion of the GRE signal either. The result is that it is onlyin the “intermediate regime,” when TE is approximatelyequal to τ, that the SE signal is attenuated. Interestingly,diffusion of water around brain capillaries appears to bein this intermediate regime, and for this reason theSE signal has often been viewed as being particularlysensitive to susceptibility changes in the capillary bedrather than larger veins. A particular concern is that avein draining an activated region may be displaced fromthe actual site of activity,producing errors in localization,and that for this reason SE-BOLD activations, althoughweaker, may provide better localization. However, thereis one more complicating factor that must be considered:the intrinsic signal change of the blood itself.
Intravascular BOLD Effects Makea Strong Contribution to theNet Signal Change
The discussion above has dealt primarily with the extra-vascular signal change. The blood has been treated as auniform medium whose susceptibility depends onhemoglobin saturation. This is a reasonable model forthe field offsets produced outside the vessel, as inFigure 9-7. But the reality, of course, is that the blood isa much more complex medium. The deoxyhemoglobinis sequestered in the erythrocytes,disks a few µm across,and the water molecules of blood diffuse around andthrough the erythrocytes. Because the intravascularwater is much closer to the source of the paramagneticinhomogeneity—the deoxyhemoglobin—the phasechanges produced would be expected to be much largerthan for the extravascular water. This effect is partlytempered by diffusion effects for GRE signals, but thenet signal from blood is much more strongly dependenton the oxygenation of the hemoglobin. While the netsignal change from extravascular spins may change byonly approximately 1% with activation, the intravascularsignal may change by 40%. If the venous blood volumefraction is approximately 3%, a 40% change of the intrin-sic intravascular signal would contribute a change of1.2% to the net signal change. For this reason, at least
260 S E C T I O N I ■ PHYSICS, INSTRUMENTATION, AND ADVANCED TECHNIQUES
Motinalnarrowing
Static broadening
DR2*
DR2*SE
GRE
0.8
0.6
0.4
0.2
3 10 30
Radius (mm)
S–1
F I G U R E 9-10
Change in the transverse relaxation rates ∆R2 (for an SE experiment withTE of 100 ms) and ∆R2* (for a GRE experiment with TE of 40 ms) of theextravascular signal as a function of the radius of the vessel creating themagnetic field distortion. For large vessels (the static broadening regime)the gradient-echo (GRE) effect is large, but the SE effect is small becausethe 180° pulse is effective in refocusing the signal. For very small vessels(the motional narrowing regime) diffusion ensures that each spin samplesthe full range of field offsets around the vessel, and there is little phasedispersion for either GRE or SE signals. The intermediate regime occurswhen the typical distance moved due to diffusion is comparable to the sizeof the vessel, and only in this regime is there an appreciable SE effect. Thisregime happens to correspond to the capillary and small venule size scale.(Curves adapted from Weisskoff.56 Weisskoff RM: Basic theoretical models ofBOLD signal change. In Bandettini PA, Moonen CTW (eds): Functional MRI.Berlin: Springer, 1999.)
Ch009.qxd 14/7/05 12:44 PM Page 260

half of the net BOLD signal change at 1.5 T has beenestimated to be due to the intrinsic change of the intra-vascular component.57
Recently, modeling of the SE signal of blood hassuggested that most of the signal change seen with a SEexperiment at 1.5 T is due to the change of the bloodsignal.58,59 This complicates the argument that the SEsignal is more sensitive to changes at the capillary level.The largest signal change in blood should be in theveins, where the greatest change in oxygenation occurs.Because the extravascular signal change with a SE experi-ment is small, this suggests that the SE signal may beeven more dominated by draining veins than the GREsignal. Note, however, that the contribution of the intra-vascular signal change becomes smaller at highermagnetic fields. As the magnetic field increases, the T2*of venous blood becomes very small, so that even withactivation the intravascular signal becomes unimportant.In this high field limit, the SE signal should only dependon extravascular signal changes, and these in turnshould depend primarily on changes in oxygenation ofthe capillary blood. Thus, at high magnetic fields the SEsignal, although intrinsically less sensitive to the BOLDeffect than the GRE signal, may nevertheless be morespecific to the capillary bed and less sensitive to largedraining veins.
Modeling the BOLD Effect
Davis and colleagues introduced a model for the BOLDsignal change based on reasonable approximationsand the results of numerical simulations.43 Because of itssimplicity, the model has proven to be a useful tool forunderstanding the BOLD effect in a quantitative way.The model starts from the simple picture of how theBOLD effect arises, and relates the signal change to theunderlying physiologic variables and a few parametersthat describe the local tissue.
The MR signal is modeled in the usual way as a simpleexponential dependence on the echo time TE, and canbe written as:
(Eq. 9-3)
where S0 is the effective spin density (the signal thatwould be measured if TE could be reduced to zero). Thetransverse relaxation rate constant R2* is written as a sumof two terms: R0 is the value of R2* if no deoxyhemo-globin is present, and R describes the additionalrelaxation produced by deoxyhemoglobin. Note thattypically R0 is much larger than R, i.e., the local T2* thatdescribes the decay of the signal is largely determined bythe intrinsic T2 and large-scale field gradients throughthe voxel, and the additional effect of deoxyhemoglobinis minor.
We now assume that with activation R is the onlyparameter that changes. Using the subscript “rest” todenote the resting value, and “act” to denote the acti-vated value, the BOLD signal change with activation,∆S = Sact − Srest, is then:
S � S0 � e�TE �R2*
R2 � R0� R*
(Eq. 9-4)
The key question is: how does ∆R depend on bloodoxygenation and volume? The magnitude of the fieldoffset ∆B near a magnetized vessel is proportional to∆χ�B0, the magnetic susceptibility difference betweenthe blood and the surrounding extravascular spacemultiplied with the main magnetic field. Experimentsindicate that ∆χ, in turn, can be accurately modeled ashaving a linear dependence on the local deoxyhemo-globin concentration in blood, and this quantity in turncan be expressed in terms of the change in the oxygenextraction fraction E. Specifically, the concentration ofdeoxyhemoglobin is proportional to E. Then the localfield offsets produced by deoxyhemoglobin shouldvary as:
(Eq. 9-5)
However, the scaling of the field offsets does notnecessarily define the scaling of the signal attenuation.As spins evolve in an inhomogeneous field a distributionof phase angles develops, and it is this phase dispersionat the time of data collection that determines the signalchange and thus ∆R2*. In particular, as noted above,diffusion effectively smooths the field distribution tocreate a narrower spread of phases in a GRE experiment.To model this in an approximate way we follow Davis etal and assume a power law relationship between R and∆B, the magnitude of the field distortions:
(Eq. 9-6)
Numerical simulations54,60 and theoretical analyses55
suggest that when diffusion is not important, β approxi-mates to 1. Numerical simulations with diffusion suggestthat β approximates to 2 gives a better description aroundthe smallest vessels when diffusion effects are signifi-cant. In reality we are dealing with both intravascularand extravascular effects. Note that with GRE methods,the signal change is likely to be largest in the vicinity ofsmall veins, where the change in deoxyhemoglobin islargest. For the extravascular signal we would expectthat diffusion is not important, and so β ≈ 1 would beappropriate. However, within the vessel diffusion is veryimportant, and so β ≈ 2 would be more appropriate forthe intravascular signal change. Numerical simulationssuggest that β ≈ 1.5 is a good approximation for thenet change in R at 1.5 T. At higher magnetic fields,the intrinsic signal of the intravascular compartment isreduced, and the BOLD signal is dominated by the extra-vascular effect, and β should approach one.
In addition to the change in E with activation, achange in blood volume also affects R.For example,evenif the oxygenation of the blood did not change but thevenous blood volume increased, the total deoxyhemo-globin would be increased, and we would expect this toincrease R and decrease the net MR signal. Numerical
R � ∆B
∆B � B0 � E
∆SSrest
� e�∆R �TE
∆R � Ract � Rrest
�1 � �∆R � TE
C H A P T E R 9 ■ BASIC PRINCIPLES OF FUNCTIONAL MRI 261
Ch009.qxd 14/7/05 12:44 PM Page 261
simulations suggest that a reasonable approximation isto assume that R is proportional to V, the venous bloodvolume.
Combining these arguments, we can model the BOLDsignal as43:
(Eq. 9-7)
where k is the net proportionality constant from all ofthe proportionalities above,V is blood volume, and A is alocal scaling factor given by:
(Eq. 9-8)
This final equation for the BOLD signal change is quitesimple, depending on two physiologic changes (thechange in blood volume V and oxygen extraction frac-tion E) and two additional parameters β and A. The formof the signal equation directly describes the ceilingeffect on the BOLD signal. In simple terms,A is the maxi-mum BOLD signal change that could occur, correspon-ding to complete removal of deoxyhemoglobin fromthe voxel. The parameter β should be primarily fielddependent, and we can assume that it is not a functionof brain region. The parameter A, however, is a localparameter and so may vary across different voxels inthe brain. Note that this parameter is proportional to thevalue of R at rest, the relaxation rate produced bydeoxyhemoglobin in the baseline state. This meansthat the more deoxyhemoglobin is present at rest, thelarger the BOLD signal change will be for the samefractional change in V and E with activation. We willcome back to this later in the chapter when we considerthe effect of the baseline condition on the magnitudeof the BOLD effect.
At 1.5 T, measured values of A range from 0.08 to0.22.43,50 In practice, the observed BOLD signal change,∆S, in brain tissues is somewhat smaller.Signal changes of1.9 ± 0.7% are seen in brain parenchyma of visual cortexat 1.5 T. This increases superlinearly with increasing B0
field strength to 3.3 ± 0.2% in visual cortex at 4 T.61 Inaddition to measuring the BOLD signal, the underlyinghemodynamic changes in CBF and CBV can also bemeasured independently. This is important for calcu-lating the local CMRO2 (see “Measuring Cerebral BloodFlow, Cerebral Metabolic Rate of Oxygen, and CerebralBlood Volume”). Additionally, these individual compo-nents of the BOLD response can have a superior spatialcorrespondence with the underlying neural activity thanthe measured BOLD signal itself (see “Exploring theHemodynamic Response to Brain Activation with MRI”).
Although this is a very useful model for the BOLDsignal, the reader should bear in mind that it does notdescribe all of the effects that may contribute to themeasured signal change in an activation experiment.Specifically, small direct effects of CBF and CBV changeson the MR signal that are independent of the BOLD
A � k � TE � Vrest � ��B0 � Erest�
� �TE � ��k �Vact� �B0� Eact� � k �Vrest� �B0� Erest� �∆SSrest
� A� 1� �Vact
Vrest
Eact
Erest� �� �
effect are likely present in real data. For example, if therepetition time TR is shorter than the T1 of blood, andthe flip angle is large (e.g., 90°), the increased delivery offresh unsaturated blood due to increased CBF couldincrease the net signal slightly. In addition, the intrinsicsignal from arterial blood is larger than the intrinsicsignal of the extravascular space, so increasing thearterial blood volume fraction of the voxel also couldproduce a slight signal increase. Note that both of theseeffects are due to arterial blood changes, where deoxy-hemoglobin is negligible, so these are effects in additionto the BOLD effect. In most applications these effects arethought to be small compared to the BOLD effect,especially at higher magnetic fields, but they may not benegligible.
Dynamics of the BOLD Signal
Equation 9-7 relates the BOLD signal change to the changein oxygen extraction fraction E and blood volume V.Wecan go one step further and try to relate these twophysiologic quantities to the change in CBF. The CBFincrease associated with neural activity is triggered by arelaxation of the smooth muscle in the wall of thearterioles. The arterioles provide most of the resistancein the vascular tree and provide a way to quickly decreasethe vascular resistance by dilating. As the resistance ofthe arterioles decreases, the pressure drop across thesevessels also decreases, raising the pressure in thecapillaries and veins. These vessels may also expand dueto the increased pressure, further increasing the CBV. Asnoted earlier, experimental studies have suggested thatthe relationship between CBF and CBV can be modeledas a power law (Eq. 9-2) with an exponent that isapproximately α = 0.38.19
The oxygen extraction fraction E depends on thechange in CBF relative to the change in CMRO2. FromEquation 9-1 at steady state, this relationship is:
(Eq. 9-9)
We can adopt a more compact notation by intro-ducing dimensionless variables in which each physiologicvariable is normalized to its value at rest: f = CBFact/CBFrest,v = Vact/Vrest, and m = CMRO2act/CMRO2rest. Then forthe resting state f = v = m = 1, and with activation allthree variables increase to different degrees, andEquation 9-2 becomes v = f α. The BOLD signal can thenbe expressed as:
(Eq. 9-10)
Equation 9-10 can be used to illustrate the possibledynamics of the BOLD effect. Each of the physiologicalparameters v, m, and f is a function of time. When astimulus is applied the state of the brain changes to anew steady state, characterized by particular relation-ships between these physiologic variables. Empirically,these relationships are:
� A� 1�v �∆SS f
m� �
Eact
Erest
CMRO2act
CMRO2rest
CBFrest
CBFact� �
262 S E C T I O N I ■ PHYSICS, INSTRUMENTATION, AND ADVANCED TECHNIQUES
Ch009.qxd 14/7/05 12:44 PM Page 262

(Eq. 9-11)
where the first equation is simply Equation 9-2 in ournotation with normalized physiologic variables. Thesecond equation represents the empirical finding thatCBF and CMRO2 increase together, but the fractionalchange in CBF is larger than the fractional change inCMRO2 by a factor of n. Most experimental studies havefound n = 2 to 3, although larger values also have beenreported.43,44
Equations 9-11 can be taken as steady-state relation-ships between the physiologic variables.However,duringthe transitions between one steady state and another thevariables may change at different rates, even though theyeventually settle into the relationships defined byEquations 9-11. This possibility for different dynamics ofthe underlying physiologic variables can introduce tran-sient features into the BOLD signal response (Fig. 9-11).
For example, a common observation is a dip of theBOLD signal below baseline after the end of the stim-ulus, referred to as a post-stimulus undershoot, that cantake a long time to resolve (more than 30 s). In blockdesign experiments in which the rest period is notsufficiently long to allow the undershoot to resolve, theeffect appears as an apparent lowering of the baselineafter the first stimulus block. When the CBF responseitself is measured with arterial spin labeling techniques,the post-stimulus undershoot is smaller (or not evident)and resolves more quickly. For this reason, the post-stimulus undershoot of the BOLD signal cannot beexplained in terms of an undershoot of CBF. Two simi-lar models, the balloon model20 and the windkesselmodel,21 have been proposed to explain this phenom-enon as a slow return of CBV to baseline after thestimulus. These models were motivated by the observa-
� n
v � f a
f �1
m�1
tion of such a slow return of CBV in a rat model,62
corresponding to the duration of the BOLD post-stimulus undershoot, and occurring despite a morerapid return of CBF to baseline. The basic idea is thatif CBF and CMRO2 return to baseline values, theoxygenation of venous blood also returns to normal.However, if the total venous blood volume remainselevated, there is more deoxyhemoglobin present, so thesignal dips below baseline. Figure 9-11 illustrates thisphenomenon with balloon model calculations.
A less common finding is a brief initial dip of theBOLD signal prior to the larger signal increase.63-68 Theeffect is small and not always present,26 but it has stirredinterest because it may reflect a rapid increase of CMRO2
prior to the CBF increase,69 and this phenomenon maybe better localized to the area of increased metabolism(that is, the CBF increase may cover a wider area).Optical studies have found a brief initial increase ofdeoxyhemoglobin, consistent with the initial dip of theBOLD signal.69-72 This was interpreted as an increase ofCMRO2 that precedes the increase in CBF, creating ashort increase in the oxygen extraction fraction E. Inprinciple, however, an initial increase in deoxyhemo-globin also could occur due to a rapid rise in bloodvolume V. Early experimental studies usually showed anincrease in deoxyhemoglobin, but no correspondingdecrease of oxyhemoglobin, suggesting a combinedchange of E and V. A more recent study, however, found acorresponding initial decrease in oxyhemoglobin inconjunction with an increase in deoxyhemoglobin,more clearly suggesting a change in E.73 Figure 9-11shows how a delay of 1 s between the CMRO2 responseand the CBF response can produce an initial dip in theBOLD signal.
DESIGN AND ANALYSIS OFBOLD-fMRI EXPERIMENTS
Statistical Analysis is Requiredto Detect Small Signal Changes
The basic data analysis done in fMRI is to examine thetime course from each voxel of the image and identifythose voxels in which the signal intensity increaseswhen the stimulus is on. The intrinsic difficulty with thisanalysis is that the effect is subtle, with a CBF changeof 30% causing a BOLD signal change of only approxi-mately 1% at 1.5 T.
Even without any stimulation the MR signal varies,due to a number of physical and physiologic pertur-bations. Because the BOLD signal change is small, it isnecessary to take these perturbations into account whenperforming a statistical analysis. The key challenge is todistinguish the signal changes due to neural activity inresponse to the stimulus from all the other random andsystematic sources of variation of the MR signal. Hence,the general idea of the statistical analysis is to estimatewhether a response to the stimulus pattern accountsfor a sufficiently large fraction of the measured signalvariance to reach statistical significance. Because the
C H A P T E R 9 ■ BASIC PRINCIPLES OF FUNCTIONAL MRI 263
1.4
1.2
1
1.4
1.2
1
1
0
1
0
20 40
20Time (s) Time (s)
40
BOLD signal BOLD signal
20 40
20 40
CBFCMRO2 CMRO2CBV
CBF
CBV
F I G U R E 9-11
Dynamic curves for CBF, CMRO2, CBV, and the resulting BOLD signal,showing left, a simple response in which the physiologic variables co-varywith similar time courses, and right, transients due to a CBV change that isslow to return to baseline, creating a post-stimulus undershoot. In additionthe CBF response lags behind the CMRO2 by 1 s, producing an initial dip.
Ch009.qxd 14/7/05 12:44 PM Page 263

statistical analysis is an integral part of an fMRI experi-ment, in this section a short introduction to the generalprinciples is presented.
The MR signal always contains random thermal noise,and this adds random fluctuations to the signal that arealso on the order of 1%. A primary goal of MR technologydevelopment is to improve the intrinsic signal-to-noiseratio (SNR), either by moving to higher magnetic fieldsor by improvements in RF coil design, such as multi-channel coils. However, random thermal noise is not theonly source of signal variability, and indeed often is notthe primary problem. A number of systematic effectsalso create signal fluctuations, including instrumentaleffects, such as coil heating, but also physiologicfluctuations. The most important physiologic fluctuationsare due to heartbeat (approximately 1 Hz), respiration(approximately 0.3 Hz), and the so-called “slow oscilla-tions” (approximately 0.1 Hz, and discussed furtherin “Exploring the Hemodynamic Response to BrainActivation with MRI”). In addition, the appearance ofthese fluctuations in the MR signal is complicatedbecause the data sampling rate (1/TR) is typically not fastenough to resolve the cardiac frequency, and so thesefluctuations are aliased to lower frequencies in the data.For these reasons, the observed fluctuations in theMR signal are a composite of physical and physiologicperturbations.
The required statistical analysis is essentially analysisof variance. The signal exhibits fluctuations around amean value, and the variance of these fluctuations hasseveral sources: 1. the BOLD fluctuations driven by thestimulus, the effect of interest; 2. systematic physiologicand instrumental fluctuations, described as confoundingeffects; and 3. random errors that are taken to begaussian noise. The aim of the statistical analysis is todetermine if there is sufficient evidence to say withconfidence that the contribution of the effect of interestis different from zero. This is done by calculating astatistic, such as a correlation coefficient, a t-statistic, or az-score, that essentially measures the ratio of the signalvariance that can be attributed to the effect of interest(stimulus-driven BOLD signal changes) to the variancedue to noise, after taking into account the variance dueto the confounding effects.
Note that in this formulation we have specificallyseparated systematic effects from gaussian noise. Thisis essentially a physics approach, aimed at identifyingand measuring all systematic fluctuations in order toremove them from the data. For example, key physio-logic variables such as the cardiac and respiratory cyclescan be measured during data acquisition, and theircontributions to the total signal variance can be includedin the analysis (see “Artifacts and Noise”). A more generalstatistical approach is to consider all of the error signalstogether as one source of error, but with a non-gaussiandistribution. Then the data can be analyzed to empiricallyderive the statistics of the noise, or smoothed (tempo-rally and/or spatially) to force the distribution closer togaussian. The combination of these two approaches, thephysical and the statistical, provides the best promise forachieving the maximum sensitivity for detecting subtleactivations, by carefully removing as many physiologic
sources of variance as possible, and then analyzingvariance that remains to determine the distribution. Forthe rest of this section, which is meant to be simply anintroduction, we will assume that the total error consistsof random gaussian noise and low-frequency systematicvariations of the MR signal.
The General Linear Model Providesa Statistical Framework for IncorporatingAll the Components of the Signal
The most used statistical method in analyzing fMRI datais the general linear model (GLM).74 Essentially, the GLMregards the measured signal as the weighted sum ofdifferent model functions, with unknown weights, andrandom gaussian noise. The analysis then amounts tofitting the collection of models to the data to estimatethe weighting factors, or more generally, the unknownparameters that define the model functions. An illustra-tion of the GLM is shown in Figure 9-12, with modelfunctions shown for the stimulus response, a systematiccardiac signal, and a linear drift.
The stimulus response function is usually obtained byconvolving the stimulus waveform with an assumedideal impulse hemodynamic response, which can berepresented by one or more of the so-called “basis func-tions”. As an example, in Figure 9-13 a gamma-variatehemodynamic response function it with a full widthat half maximum (FWHM) of about 4 s and its derivativeare shown.
The mathematical expression of the gamma-variateh(t) is:
(Eq. 9-12)
Typical values used are k = 3, and τh = 1.2. In addition,to cover the delay of the hemodynamic response, a timelag of 1 s is used. Ideally, this delay is simply anotherparameter of the model function, and should be esti-mated along with the amplitude. However, the signaldoes not depend on this parameter in a linear way, so itcannot fit into the GLM analysis. A shift of the hemo-dynamic response function can be approximated in alinear way by including the derivative of it as a secondmodel function. Then to a first approximation, a non-zero weight for this additional model function shifts itin time. That is, the weighted sum of h(t) and its deriva-tive is similar to a shifted hemodynamic response func-tion (HRF), so by using both functions hemodynamicresponses with different delays can be modeled. This isvery useful because it is known that the HRFs in differentbrain areas vary in their delays.75
In mathematical terms, the total MR signal timecourse from a voxel can be modeled as:
(Eq. 9-13a)
Y � 1 � hemodynamic response � 2 � heartbeat � … � gaussian noise
Y � 1 � X1 � 2 � X2 � … � e
ht � e�t/ h1 t k
k hk �1! h
264 S E C T I O N I ■ PHYSICS, INSTRUMENTATION, AND ADVANCED TECHNIQUES
Ch009.qxd 14/7/05 12:44 PM Page 264

The term Y denotes BOLD signal, the terms Xi themodel functions, � their weightings, and e the residualnoise assumed to be gaussian. In a more compact waythis equation can be written in matrix terms:
(Eq. 9-13b)
The matrix X is called the design matrix, the vector Ythe observed variable, the term � is the weighting vector,and e the noise vector. For each voxel the GLM analysisprovides estimates of the weights for each modelfunction that give the best fit to the data. The best fit isdefined in a least-squares sense, such that the sum of thesquared residuals, obtained after the model fit issubtracted from the data, is minimized. Provided thatthe noise has a gaussian distribution, the least-squaressolution to Equation 9-13 is:
(Eq. 9-14)
The superscript T denotes the transpose of thematrix.
Identifying Activated Voxels
The statistical goal is now to determine if the voxel timecourse shows a stimulus response, by testing whetherthe amplitude of the stimulus-driven model functionestimated from Equation 9-14 is significantly differentfrom zero. That is, even if there was no stimulus-driven
� �XT�X ��1�XT�Y
Y � X � � e
activity whatsoever in the voxel, the GLM analysis couldproduce a non-zero amplitude for the stimulus modelfunction just because of the randomness of the noise.The key question is whether the estimated amplitude issufficiently larger than the range of amplitudes we wouldexpect due to just noise alone. For this purpose thesignal contribution due to the stimulus response has tobe compared with the noise level. The higher the signal-to-noise ratio, the more likely it is that the voxel is trulyactivated. This can be quantified in terms of a t-statistic,
C H A P T E R 9 ■ BASIC PRINCIPLES OF FUNCTIONAL MRI 265
Stimulus response
Physiologic noise
Scanner drifts
Time (s)0 50 100 150 200 250
Random noise
Time (s)0 50 100 150 200 250
Measured data
Time (s)0 50 100 150 200 250
F I G U R E 9-12
Illustration of the general linear model (GLM).Model functions such as an ideal stimulusresponse, physiologic noise, and scanner driftare fitted to measured data assuming that theresidual is purely random noise. For eachvoxel the GLM analysis provides estimates ofthe weights for each model function that givethe best fit to the data. The GLM analysis testswhether the estimated amplitude of thestimulus-driven model function is significantlydifferent from zero for the estimated levelof noise.
HRF
Derivative
Time (s)
0 5 10 15 20
F I G U R E 9-13
A gamma-variate hemodynamic response function (HRF) and its derivative.The ideal stimulus response function used in the GLM formalism is usuallyobtained by convolving the stimulus waveform with an assumed idealimpulse hemodynamic response. A shift of the HRF can be approximatedin a linear way by including the derivative of HRF as a second model function.
Ch009.qxd 14/7/05 12:44 PM Page 265

whose distribution is known, so that the probability thatthe fitted amplitude could result from chance—thep-value—can be estimated.For example,a p-value of 0.05means that by chance there is a 5% probability that thist-value or larger is obtained. The higher the t-value, thehigher the significance and the less likely that this is achance event, and thus the lower the p-value.
An alternative way of describing the signal-to-noisevalue is the correlation between the model stimulusresponse and the measured response.76 The correlationcoefficient r varies between −1 and 1, with the value 1being a total correspondence between the referencefunction and the measured response and the value −1corresponding to a perfect inverse correlation betweenthe responses. The value r = 0 means that there is nocorrespondence between the model response and thedata. Analyzing the data in terms of either a t-value or acorrelation coefficient is equivalent, because r can betransformed to a corresponding t-value using the formula:
(Eq. 9-15)
The variable � represents the “degrees of freedom”(dof),which is the number of time points reduced by thenumber of model functions. The source of this term isthat we begin with N independent measurements in thetime series, and from these data we estimate k modelparameters. This leaves � = N−k measurements toestimate the variance of the random gaussian noise (i.e.,the variance of what remains after subtracting out thebest-fit model functions). For this reason the significanceof a given correlation coefficient depends on the degreesof freedom;the higher the dof, the higher is the statisticalsignificance.
If the stimulus is presented in a periodic fashion,another approach for determining if there is a statis-tically significant activation is to work in the frequencydomain and compare the amplitude at the stimulusfrequency with the amplitudes at other frequencies. Auseful feature of this approach is that the Fourier trans-form also provides a phase for each frequency compo-nent, and this phase translates directly into the timedelay between the frequency components. For a periodicdesign the main frequency representing the stimulationis the inverse of the time of the stimulation cycle.Hence,the magnitude of this component can be statisticallycompared with the magnitude of the other frequencycomponents using the t-statistic as described above inorder to determine the contribution of the stimulus tothe total variance. An additional feature of this frequencyanalysis is that it can give information about otherneuronal populations that have an atypical response tothe stimulus pattern. For example, neurons that respondwhile the stimulus is on will show a strong response atthe fundamental frequency of the stimulus, whileneurons that respond to a change of stimulus, firing atthe beginning and end of the stimulus,will show a strongresponse at twice the fundamental frequency.
While the implementation of the Fourier approachseems different from the GLM approach, it is really just a
t � v �1�r2
r
GLM analysis with sine waves as the model functions.The particular advantage of sines and cosines is that theyare derivatives of each other, and a shifted sine wave,representing a delayed response, is precisely modeled asa linear combination of a sine and cosine wave with thesame frequency. For the more general shape of responsedescribed above, the inclusion of the derivative functionas another linear model function is only an approximateway to include a shift of the response. For sine waves itis exact.
Statistical Parametrical Maps areUsed to Display Activated Voxels
After the time course of each voxel has been analyzed todetermine a t-value (or correlation coefficient), the dataare displayed as a statistical parametric map. This istypically done by choosing a threshold for the statisticand overlaying the map of voxels passing the thresholdon a high-resolution, black and white anatomic image.The colored image is then presented as a map of thebrain activation pattern associated with the stimulus.However, it is important to note that this approach todeciding whether a voxel is activated or not is basedon a signal-to-noise evaluation, not a pure signal evalua-tion. For example, it is conceivable that two voxels indifferent parts of the brain would exhibit the sameneural activation and BOLD signal change (say, 1%), butthe other sources of signal fluctuations are much higherin one voxel than the other. Because the statistical testfor whether a voxel is activated measures the signal-to-noise ratio, one voxel could pass the threshold and beidentified as “activated”while the other does not, despiteidentical levels of BOLD signal change. To put this moreprecisely, this statistical parametric mapping approachidentifies voxels in which the signal time course showsa fluctuation due to the stimulus that is sufficiently largethat it is unlikely to happen randomly due to the noisefluctuations of the voxel. Thus this is a test that isdesigned to protect against false positives,but not againstfalse negatives. For this reason, the correct interpretationof a statistical parametric map is that we can say withconfidence that the colored voxels were activated, butwe cannot make that statement for the other voxels. Inother words, we cannot conclude from this analysisalone that the other areas were not activated unless weknow that the noise level is similar across the brain.
Limitations of the General Linear Model
Potentially, there are several problems with the GLMapproach deriving from the basic assumptions, whichare not necessarily valid for fMRI data obtained on theliving human brain. The assumptions and prerequisitesof the GLM are:
1. Model functions have to be specified. This requiresprior knowledge about which functions—hemo-dynamic response and confounds—should be includedin the design matrix. The hemodynamic response is
266 S E C T I O N I ■ PHYSICS, INSTRUMENTATION, AND ADVANCED TECHNIQUES
Ch009.qxd 14/7/05 12:44 PM Page 266

still incompletely understood (see “Exploring theHemodynamic Response to Brain Activation withMRI”) and may vary across the brain and with age anddisease.75 In order to be flexible with the assumedresponse, two or more hemodynamic model func-tions (see above) can be used enabling modeling ofdifferent hemodynamic responses.74 The other modelfunctions used in the analysis are usually linear andquadratic drifts due to scanner instabilities. Thephysiologic confounds are more difficult to treat, andit is still an area of active investigation to determinehow they translate into fluctuations in MR signal timeseries (see “Artifacts and Noise”). Several correctionschemes have been proposed for removing cardiacand respiratory fluctuations (for an overview, seereference 77).
2. The residual noise is assumed to be gaussian,althoughreal fMRI data show a non-gaussian distribution. Oneapproach to deal with this problem is to “whiten” thenoise into a gaussian form by filtering.78 Anotherapproach is to use the data themselves to estimate thedistribution.
3. The physical and physiologic noise levels are non-uniformly distributed over the brain areas. Becausethe statistical significance is essentially determinedby the signal-to-noise ratio, the GLM favors areas inwhich the noise level is low and the signal sensitivityis high. Smoothing the data spatially reduces the non-uniform distribution of the noise. However, this leadsto an effective lowering of the spatial resolution. As arecommendation, if a hypothesis about the activity ofone area is specified or discussed, a close look at itstime series and averaging data over time and spaceshould be done; this is also the case when the statis-tical analysis fails to result in significant voxels inthis area. This is especially important when differentgroups are compared, because their spatial noisedistribution and noise level might differ.
4. The statistical analysis is performed voxel-wise.Because of the huge number of voxels (64 × 64 × 24approximates to 100,000 voxels in a typical experi-ment) some voxels can be active by chance. Forexample, if p = 0.01 was chosen as the threshold,approximately 1000 voxels would be classified asactivated by chance, referred to as the “multiple com-parison” problem. The most conservative approach isto take the multiple comparisons into account withthe Bonferroni correction, choosing a much moreconservative p-value to determine the threshold. Bydividing the desired p-value (e.g., p = 0.01) by thenumber of voxels, the probability of detecting a falseactivation anywhere in the brain is reduced to thedesired p-value. Because the resulting threshold isusually too strict, several other correction schemeshave been proposed. However, the multiple compar-ison problem cannot be regarded as solved. One wayof reducing the problem is to look at clusters of acti-vated voxels, because it is less probable that severalvoxels are activated by chance than that only onevoxel is activated by chance. The bigger the clustersize, the lower is the probability of recording a falseactivation. A drawback of this approach is that it biases
the analysis to regions where the expected activity ismore spatially distributed, such as sensory areas, thanto regions of more focal activation,such as small nuclei.
Block Designs versusEvent-Related Designs
In nearly all fMRI experiments the hemodynamicresponse is treated as a linear smoothing filter. Thesimplest experimental design is to block the stimuli in20 to 60 s blocks alternated with equal blocks of the restcondition, and repeat this pattern for several cycles. Asdescribed above, the typical data analysis strategy is toconvolve the stimulus pattern with an assumed impulseresponse function, and then correlate this estimatedresponse with the time course of the signal from eachvoxel.76 The BOLD impulse response function is oftentaken as a gamma-variate function with a width of 4 to6 s. However, for a block design the assumption ofthe shape of the impulse response is not critical: if theblock length is significantly longer than the width ofthe impulse response, then the amplitude of the BOLDresponse on the plateau of a block will depend just onthe area under the impulse response, and not on detailsof the shape (Fig.9-14). Most of the fMRI studies done to
C H A P T E R 9 ■ BASIC PRINCIPLES OF FUNCTIONAL MRI 267
10 20 30 40 50 60 70 80 90Time (s)
10 20 30 40 50 60 70 80 90
Hemodynamicresponses
5 10 15 20
F I G U R E 9-14
Block designs and event-related designs of fMRI experiments. Top, Twopossible hemodynamic response functions (HRFs), constructed to have thesame area. The lower figures show the resulting time courses when theHRFs are convolved with a block design (middle) and a randomized event-related design (bottom). The block design is more efficient for detecting aresponse from the variance of the signal, while the event-related design ismore efficient for estimating the shape of the HRF.
Ch009.qxd 14/7/05 12:44 PM Page 267

date have used block designs, and so the measuredquantity that is used for mapping activation has beenprimarily the area of the impulse response. For most ofthese studies the goal was to detect whether a localpiece of tissue was activated, not to characterize theshape of the BOLD response.
For many applications a block design is not feasible,orat the very least introduces an artificial quality into thestimulus that makes the results difficult to interpret. Atrial-based (or event-related) design significantly broadensthe types of neural processes that can be investigated.79-88
A block design by definition presents similar stimulitogether, which makes it difficult to study processeswhere predictability of the stimulus is an important con-sideration. For example, studies of recognition usingfamiliar stimuli and novel stimuli are hampered if all ofthe familiar stimuli are presented together. A trial-baseddesign allows randomization of different stimuli and amore sophisticated experimental design.
To analyze event-related data one could use thesame correlation approach used for block designs, byconvolving the stimulus pattern with an assumedhemodynamic response and correlating the resultingmodel curve with each voxel time course. However,for an event-related design the resulting model curveis much more dependent on the exact shape of theassumed BOLD response, as illustrated in Figure 9-14.Two impulse response functions were constructed tohave the same area but different shapes, and then con-volved with a block of stimuli and a random presentationof stimuli. For the block design the two predictedresponses are similar, but for the event-related designthere is a greater difference. The reason for this is thatthe expected BOLD response depends strongly on theshape of the impulse response only during transitions(e.g., the beginning and end of a block), while the steadystate (e.g., the plateau of a block) depends only on thearea of the impulse response.With long blocks there arelong steady-state periods but only a few transitionperiods, but with an event-related design there are manytransition periods and typically no steady-state periods.
The introduction of event-related designs into fMRIexperiments has significantly expanded the field, but ithas also made our lack of understanding of the hemo-dynamic response a more acute and significant problem.A fruitful approach for dealing with the uncertaintyabout the exact shape of the hemodynamic response isto estimate the response from the data.82 Specifically,instead of assuming a given shape for the impulseresponse, with only a single unknown amplitude, theimpulse response is treated as set of unknown ampli-tudes at different time lags after the initiation of astimulus. That is, the amplitudes of the response 1 s afterthe stimulus, 2 s after the stimulus, etc., are treated asseparate model functions within the GLM. For example,if the impulse response is assumed to last 15 s and itwill be estimated at 1 s intervals, this is equivalent toincluding 15 model functions corresponding to each ofthe time lags. A hemodynamic response is then estimatedfor each voxel, and the full response (or a specifiedrange) is then examined to determine if it differs signifi-cantly from zero.
Detection versus Estimation
An interesting feature that emerges from considerationof block and event-related designs is that there areactually two distinct criteria that can be used to evaluatedifferent experimental designs: the detection sensitivityand the estimation sensitivity.89 If we are only interestedin detecting whether a response is present, and do notcare what the shape of the response is, then the primarymeasure of efficiency is the signal variance produced bythe stimulus. For example, Figure 9-14 illustrates twodistinct patterns for presenting the same 48 stimuli. Foreach one we can convolve the pattern with a simpleassumed response and then calculate the variance of theresulting model curve. The statistical analysis will thencompare this variance to the variance produced byother noise sources to determine if the voxel is acti-vated, so the larger this intrinsic variance the greater theprobability of detecting the response. As illustratedin Figure 9-14, blocking the stimuli creates a varianceapproximately four times larger than the variance for therandomized pattern, and so creates a more detectableresponse.
However, if the goal is to estimate the shape of theresponse itself, a different criterion is needed to evaluatedifferent stimulus patterns. Dale and colleagues intro-duced the figure of merit for this purpose; it is calculatedjust from the pattern of stimuli,and is independent of theshape of the hemodynamic response.82 In the examplein Figure 9-14, this figure of merit is approximately fourtimes larger for the random design than for the blockdesign, so the random design is much more efficient forestimating the impulse response.
The differences in detection efficiency and estima-tion efficiency can be traced to the width of the impulseresponse,which creates overlap of responses from differ-ent events. Such overlap can be good or bad, dependingon the type of sensitivity of interest. The variability of theestimation efficiency comes primarily from differencesin the degree of systematic overlap of responses fromdifferent stimuli, such as the poor efficiency of a periodicclosely spaced single trial design with perfectly regularoverlap of responses. The variability of the detectionpower can be traced to the constructive effects of over-lapping responses to different events,as in a block design,where the addition of responses to closely spaced eventsserves to increase the final variance of the signal. Both ofthese sources of variability in the sensitivity of stimulusdesigns would be removed if we restricted the minimumtime between events to be greater than the width of theimpulse response. In that case there would be no overlapof responses from different events, and all designs withthe same number of events would have the same detec-tion efficiency and estimation efficiency. Because this isnot the case, the design of fMRI experiments is a richerand more complex field.
In general, event-related designs are a powerful androbust approach for fMRI experimental design. Manyexperiments do not fit into a block design, and thevariability of the hemodynamic response across brainregions, subjects, and experimental conditions is animportant factor to take into account. Event-related
268 S E C T I O N I ■ PHYSICS, INSTRUMENTATION, AND ADVANCED TECHNIQUES
Ch009.qxd 14/7/05 12:44 PM Page 268

designs allow one to do this in a systematic way, and theefficiency of potential designs can be evaluated numeri-cally to optimize the experiment in advance.81,82,90-92
Finally, block and random event–related designsrepresent two ends of a spectrum, with one of the keydifferences being predictability of the stimulus. Anintermediate design, with some pseudo-random portionsand some pseudo-block portions, can make the stimulusless predictable while retaining some of the detectionefficiency of a block design.86,89
ARTIFACTS AND NOISE
fMRI is More Sensitive to ImagingArtifacts than Clinical MRI
Functional MRI of brain activation is one of the moredemanding applications for an MRI scanner. It relies ondetecting MR signal changes of only a few percent (orless) over a relatively prolonged measurement period,typically 20 to 40 minutes. There are several sources ofnoise in fMRI; the primary sources are noise introducedby the MRI scanner or associated hardware, and physio-logic noise introduced by the subject (e.g., changes inthe MR signal due to thermodynamic or electrical noise,or changes in MR signal due to cardiac or respiratorymotion). In addition to noise, distortions in the image(which degrade image quality) as well as susceptibilitydropouts will also reduce the available SNR. To detectthe small perturbations in the MR signal which are asso-ciated with fMRI it is critically important that the noiseand scan-to-scan variability are well below the signalchanges being investigated. This section addresses someof these sources of artifacts and noise and how theirinfluence can be minimized.
Minimizing and CorrectingImage Distortions
MRI relies on a homogeneous magnetic field to correctlyencode the gradient-induced distribution in precessionalfrequencies of nuclear spins into an image. Inhomo-geneities in the static magnetic field will result indistortions and signal loss in the final MR image. fMRIutilizes rapid gradient-echo pulse sequences that areparticularly sensitive to the microscopic susceptibilityperturbations induced by deoxyhemoglobin. This isparticularly evident in single-shot EPI or spiral gradient-echo sequences, where the read-out window is of thesame order as the echo time; these sequences will alsobe sensitive to bulk susceptibility changes. There is agreater need in fMRI than in most conventional clinicalMRI applications to minimize these macroscopic inhomo-geneities in the magnetic field. Functional MRI studiesfrequently rely on the use of additional materials formonitoring subjects (eye tracking, EEG electrodes, head-phones) or to stabilize the head (bite bar, plastic pads).Even though these materials are non-metallic they mayhave susceptibility different from the adjacent tissues
and cause local field distortions.93 Materials used insidethe MR scanner during fMRI studies must thus be chosencarefully.
Even without extraneous materials in the scanner,the patient or subject alone will cause inhomogeneitiesin the magnetic field. The close juxtaposition of air, fat,bone, and tissue in the human head is not conducive tomaintaining a homogeneous magnetic field. The suscep-tibility distortions around the sinuses and petrous partsof the temporal bones are often the most evident andcan be difficult to correct, resulting in signal loss in theprefrontal cortex and temporal lobes. The use of high-order shims to minimize bulk susceptibility effects isparticularly important, particularly with the use of high-field MRI (3 T and above). In addition to shimming, theposition of the head within the static magnetic field isalso important. Tyszka and Mamelak demonstrated thatthe normal anatomic position used for radiographicpositioning for almost a century might actually worsenthe inhomogeneities around the prefrontal and temporalcortices. By tipping the head upwards so that the posi-tion of the sinus is moved more cranially, the orientationof the induced gradients relative to the B0 field linestends to reduce the effects on local field inhomogeneity.94
Figure 9-15 shows the dependence of B0 homogeneityon head position.94
In addition to externally applied shims, otherapproaches have been suggested to minimize the localmagnetic field inhomogeneity around the paranasalsinuses.Wilson et al95,96 proposed the use of local shimsin the mouth to reduce the local field inhomogeneities ininferior frontal lobes from the paranasal sinuses and skullbase. Pyrolytic graphite is strongly diamagnetic and can
C H A P T E R 9 ■ BASIC PRINCIPLES OF FUNCTIONAL MRI 269
Chindown
Headneutral
Chinup
0.4
0.3
0.2
B0
offs
et (
ppm
)
0.1
0
-0.1
-0.2
-0.3
-0.4
F I G U R E 9-15
Mean registered B0 maps calculated following synthetic linear shimmingfrom five subjects with head position: chin down (upper panel), headneutral (middle panel), and chin up (lower panel). The improvement inhomogeneity as the head tilts up is most evident in the inferior regions ofthe frontal and temporal lobes, as well as in occipital cortex. (Modifiedfrom Tyszka JM, Mamelak AN: Quantification of B0 homogeneity variation withhead pitch by registered three-dimensional field mapping. J Magn Reson159:213-218, 2002.)
Ch009.qxd 14/7/05 12:45 PM Page 269

be used to change the local magnetic field to minimizelocal susceptibility-induced gradients. Figure 9-16 showsthe improved B0 homogeneity and image quality fromstrategic placement of local shims against the hardpalate.
In addition to signal loss, susceptibility differencesbetween tissues also cause distortion in the image as thespatial mapping of the MR signal assumes the magneticfield is homogeneous. The mislocalization of a particularpixel is predictable if the local magnetic environment isknown. An additional measurement made of the actuallocal field (the “field map”) acquired at the same time theEPI or spiral acquisition is made can then be used toreposition pixels and reduce distortions.97,98
fMRI is Sensitive to Subject Motion
Functional MRI studies are extremely sensitive to subjectmotion. This is most evident at tissue or contrast bound-aries where even sub-pixel movement can generate largeperturbations in the MR signal, frequently several timesgreater than the underlying BOLD signal itself. The
best approach to removing motion artifacts in the MRdata is to try to prevent them at the outset. The com-fort of the subject in the MR scanner is of paramountimportance. Subjects should be dissuaded from drinkingexcessively prior to the examination, and allowed toempty their bladder immediately before the examina-tion. Although minor discomfort (insufficient paddingaround the head, knees not well supported, hardexamination table, neck over or under extended) mayseem trivial at the beginning of the examination, after30 minutes it may no longer be tolerable, resulting involuntary and involuntary movement. Many groups alsoemploy a bite-bar or a vacuum pad to further stabilizethe head. Although very effective, this requires carefulset-up and subject cooperation or it too can becomeuncomfortable part way through the examination.
Subject motion results in displacement or rotation ofthe image in successive acquisitions. Small degreesof motion can be corrected with image registration. Themost common of these are based on the automated imageregistration (AIR) algorithm.99,100 Slow patient driftwithin the magnet may appear as a linear drift in the MRtime series and can also be compensated for in thegeneral linear model during post-processing. Subjectmotion that is most difficult to remove is motion that istemporally correlated with the stimulus. This most oftenoccurs with poorly trained subjects or with strongstimuli that produce a startle response coincident withthe onset of stimulation (e.g., loud noises, bright lights,or painful somatosensory stimuli). A careful examinationof the raw data is needed to ensure that apparent BOLDactivation is not biased by patient motion. Excessivelylarge signal changes out of proportion to the expectedfMRI response, and apparent activation at contrast andtissue boundaries or in areas not expected to beassociated with fMRI activation (e.g., the scalp) aresigns of patient motion rather than true activation.Changes on the statistical map that are out of phase oneither side of a tissue boundary (i.e.,positively correlatedsignal change on one side of the head, and negativelycorrelated signal change on the other side of the head)are also signs of gross subject movement.
The fMRI Signal Includes Contributionfrom Physiologic Fluctuations
A significant source of artifact in fMRI results from theperiodic modulation of the MRI signal by physiologicprocesses, particularly from respiration and cardiacpulsations.101,102 These periodic modulations increasenoise and reduce the statistical significance of theactivation signals,103 and are collectively referred to asphysiologic noise. Artifacts due to physiologic effects arewell recognized in clinical MRI and a number ofstrategies have been suggested to try to minimize them,in particular breath-holding,novel k-space trajectories,104
reordering k-space to time lock it with respiration orcardiac motion,105 navigator echoes,106 cardiac and respi-ratory gating, and flow compensation. However, not allthe techniques used in clinical imaging are applicable for
270 S E C T I O N I ■ PHYSICS, INSTRUMENTATION, AND ADVANCED TECHNIQUES
Noshim Shim
B0
GE EPI
F I G U R E 9-16
Improved B0 homogeneity (upper panel) and image quality on GREecho-planar images (lower panel) from strategic placement of intraorallocal shims (made from continuously nucleated pyrolytic graphite). The B0
range is −0.8 ppm (white) to +0.8 ppm (black). Note the improved B0
homogeneity in the inferior frontal cortex, and corresponding reduceddistortion and improved gray matter/white matter interface on the EPIimages. (Modified from Wilson JL, Jenkinson M, Jezzard P: Protocol to determinethe optimal intraoral passive shim for minimisation of susceptibility artifact inhuman inferior frontal cortex. Neuroimage 19:1802-1811, 2003. © 2003, withpermission from Elsevier.)
Ch009.qxd 14/7/05 12:45 PM Page 270

functional MRI. Use of navigator acquisitions in fMRIrequires some additional modification since there isonly a short time available between excitation and dataacquisition.107 Additionally, gated acquisitions aredifficult to implement in fMRI as this results in a variableTR. This introduces additional signal fluctuations unlessthe TR is sufficiently long.108 Also signal variations relatedto motion,such as respiration,are incompletely addressedwith flow compensation.107 The problem of physiologicnoise requires some additional techniques more specifi-cally suited to fMRI. We present here an overview ofthe effects of this physiologic noise on the MR signaland T2*-weighted images, and consequently on the fMRIstatistical power. Strategies to reduce its impact are alsoaddressed.
Physiologic motion that occurs during the mapping ofMR signals into k-space will result in phase offsets andghosts in the T2*-weighted images. This is most evidentfor multi-shot techniques (fast low-angle shot [FLASH]imaging, multi-shot EPI). The ghosts can be identifiedduring a careful inspection of the raw images prior tomaking statistical maps.Physiologic variation that occursbetween successive repetitions of snapshot EPI or spiralacquisitions will tend to lead to periodic variations insignal intensity synchronous with the cardiac orrespiratory cycle. The most effective way to observethese effects is by analysis of the frequency distributionby Fourier transform of the fMRI time-series data (thepower spectrum). Figure 9-17 shows a power spectrumacquired during a visual task with a stimulus repetitionrate of 0.016 Hz. The fundamental frequency of thestimulus is clearly seen in the spectrum. Additionally,periodic variations in MRI signal are also seen at 0.85 to0.95 Hz and at 0.15 to 0.25 Hz, corresponding to cardiacand respiratory components.
A number of processes lead to this periodic variationin the MR signal.For respiratory pulsations, the dominanteffect is from susceptibility changes originating in thechest due to the cyclical change in the proportion ofwater and air. This leads to a magnetic gradient in thez-direction, and results in small amounts of intra-slicedephasing and minor misregistration of slice position(for axial images) or distortions (for sagittal and coronalimages).77 In addition to the periodic modulation of thefield homogeneity, there is also evidence that the brainphysically moves between 110 and 950 µm during therespiratory and cardiac cycle.109 Changes in intrathoracicpressure are transmitted to the head as changes in intra-vascular and CSF pressure, with secondary cyclicaleffects on cerebral blood flow. Since the volume of thecalvaria is fixed, this results in displacement of brainparenchyma. In addition, depending on the positioningof the subject, movement in the anterior chest wall maybe directly transmitted as a pitching head motion.
Cardiac-induced susceptibility changes are significantlysmaller, and the dominant transmission of cardiacartifacts to the brain is a direct result of fluctuation incerebral blood volume and oxygenation (and conse-quently brain and CSF volume) within the calvaria. Anadditional source of physiologic noise that has receivedincreasing attention in recent years is slow oscillations,synonymously referred to as vasomotion, V-signal,
spontaneous oscillation, and low-frequency waves (seereference 110 for overview). These oscillations are cen-tered on 0.1 Hz, and their origin is still under debate(metabolic, vascular, or neuronal). Even lower frequencydrifts have been described, and these may also representphysiologic noise or patient drift. However as theseeffects are also seen in cadaveric studies,111 they can bevery difficult to distinguish from signal drifts originatingwithin the MRI hardware.
Correcting for Physiologic Noise
Strategies to reduce the effects of physiologic noise canbe broadly divided into methods to remove the effectsbeforehand, and methods to remove the effects usingpost-processing. Training subjects to maintain steadybreathing and to avoid excessive, large excursions inchest motion will help reduce some of the larger signalchanges from respiratory motion. Careful positioningand head restraint (ideally using a bite-bar) will alsohelp to minimize pitching motions of the head duringthoracic wall motion. Since the predominant effect ofphysiologic noise is to cause a phase shift in successiveimage acquisitions, Hu and Kim107 proposed applyingnavigator echoes to track these induced phase varia-tions. Acquiring an additional line at the center of k-space(for gradient-echo [FLASH] acquisitions) or an additionaldata point at the center of k-space (for EPI acquisitions)before the phase-encode gradient allows the phase offsetdue to motion or B0 fluctuation to be quantified and thus
C H A P T E R 9 ■ BASIC PRINCIPLES OF FUNCTIONAL MRI 271
Stimulus response
Slow oscillations
Respiration
0.0 0.2 0.4 0.6
Frequency (HZ)
0.8 1.0 1.2
Heartbeat
F I G U R E 9-17
Frequency distribution of the MR signal from a 4 mm3 region in primaryvisual cortex during a visual functional MRI experiment (alternating 20 sflickering checkerboard, 40 s darkness). Note spectral power in the 0.15 to0.25 Hz band corresponding to respiration, in the 0.85 to 0.95 Hz bandcorresponding to cardiac pulsations, and at 0.016 Hz corresponding to thefundamental frequency of the stimulus. Slow oscillations are seen around0.1 Hz. (The relative power at the different frequency bands varies withchoice of region of interest and subject.)
Ch009.qxd 14/7/05 12:45 PM Page 271

accounted for. This can reduce the spectral power dueto physiologic noise by 30% to 50% (depending on exactlocation). Imaging sequences that collect additionalmeasurements of the center of k-space can also be usedto remove the phase offsets from periodic noise. Forexample, a rosette trajectory that over-samples the centerof k-space allows a 25% to 62% reduction in the standarddeviation of the noise.104 Removing respiratory and cardiacmotion with gated acquisitions is not widely used infMRI as this induces a variation in TR, introducing signalmodulation due to variable longitudinal relaxation andthus increasing the variance in the fMRI signal. Forimaging the brainstem, where there is significant brainmotion with the cardiorespiratory cycle, Guimaraes et alproposed a combination of prospective cardiac gatingand retrospective correction for the variable longitudinalrelaxation based on recordings of the actual imaging TR
for each acquisition.112
Several strategies have also been proposed to removephysiologic noise retrospectively. An examination of thepower spectrum (see Fig. 9-17) shows that the physio-logic noise often falls into well-defined frequency bands.It would appear that a simple approach to removephysiologic noise is selective digital filtering of a specificfrequency band. The sampling rate for the physiologicfluctuations is determined by the imaging TR.For a typicalMR experiment this is typically 1 to 2 s,corresponding toa temporal resolution of between 0.5 and 0.25 Hz. Asthe cardiac rate is around 1 to 2 Hz, this will be under-sampled at this TR and the signal will be aliased.113 Thealiased signal will no longer appear in the same well-defined frequency band and may also be superimposedat the fundamental frequency of the stimulus/response,making it more difficult to selectively filter. Severalapproaches have been proposed to address these aliasednoise signals. By repeating the task at a different rate, theeffective sampling rate is changed and the degree ofaliasing may be reduced or the position in the frequencyspectrum where physiologic noise signals becomesuperimposed can be shifted. Frank et al proposed atechnique that utilizes the fact that physiologic noise isspatially correlated across large areas of the brain andtreats adjacent slices as phase-shifted additional samples,increasing the effective sampling rate of physiologic noiseand allowing previously aliased signals to be retrievedand removed.114 Biswal and colleagues measured thecardiac and respiratory contributions separately by resam-pling contemporaneous pulse oximeter waveformsrecordings at the same sampling rate as the imagingTR, time-locked to the fMRI signal acquisition.113 Thefrequency location of aliased physiologic signals couldthen be determined, allowing them to be selectivelyfiltered.
The relative under-sampling of noise data is a sig-nificant limitation to identifying and characterizingphysiologic noise. An alternative approach is to recordphysiologic and cardiac signals as a separate time seriesusing a photoplethysmograph and pneumatic belt torecord cardiac pulsations and respiratory excursionsrespectively. The cardiac and respiratory changes canthen be sampled at a considerably higher rate, and theircontribution to the MRI signal estimated and removed.
Mitra and Pesaran propose that since cardiac andrespiratory effects are approximately periodic in nature,they can be modeled in terms of slow amplitude- andfrequency-modulated sinusoids.115 The contributions tothe MR signal can be removed from the data in thefrequency domain. Other techniques take a similarapproach and characterize the cardiorespiratory contri-bution from a separate time series, but remove the noiseusing image-based techniques and are thus less relianton the periodicity of the noise. A second-order Fourierseries is expanded in terms of cardiac and respiratoryphases (calculated from the separate cardiac and res-piratory activity measured during the fMRI study). Theweights of the Fourier terms can be estimated with ageneral linear model and are then applied to the image116
or the k-space data.108 Another approach involves decom-position of the imaging data into its principal orindependent components115,117,118 This differs from theimage and frequency domain techniques described so farin being data driven (rather than being constrained to aparticular model, waveform, or time course). However,removing selected components with such a decomposi-tion of the data must be done cautiously as the noisecomponent is not necessarily uniquely contained in anysingle component.115
No single technique will remove all the physiologicnoise from every data acquisition. Thus, whicheverapproach is employed, it remains imperative to carefullyexamine the raw data visually (looking at the raw images,or a movie of the images and the power spectra of thedata series) both as a crude check of the quality of datacollection and to direct further analysis.
Scanner Stability and Thermal Noise
The fidelity and stability demanded for good fMRI arenot typically included in the quality assurance (QA)specifications of a routine clinical MR scanner. However,with the more widespread use of fMRI in clinical andneuroscience applications, it is now more importantthan ever to address the performance capabilities of theMR instrument and hardware chain. Ensuring homo-geneous scanner performance also provides qualityassurance for longitudinal investigations, studies acrossmultiple subjects, or comparison of measurementsfrom different institutions. A number of techniques haveappeared in the literature in recent years to address MRscanner stability and baseline performance, but theirimplementation has traditionally been guided by theneeds of individual scanner operators. A more wide-spread initiative is required to standardize these measuresand facilitate comparison of scanner performance fromdifferent manufacturers, from different sites, or obtainedat different time points.
The Biomedical Informatics Research Network (BIRN)(http://www.nbirn.org) is an initiative sponsored by theNational Institutes of Health (NIH) and National Centerfor Research Resources (NCRR) that facilitates large-scalebiomedical science collaborations. Standardization ofMR scanner performance has been one of the foci ofattention of BIRN. As well as addressing stability of a
272 S E C T I O N I ■ PHYSICS, INSTRUMENTATION, AND ADVANCED TECHNIQUES
Ch009.qxd 14/7/05 12:45 PM Page 272

particular scanner, BIRN also proposes to standardizelevels of performance for fMRI across centers, allowingstudies from different sites to be compared. To addressthe noise and variation introduced into an fMRI studyby the MR instrument itself, four basic measures havebeen identified by BIRN to measure scanner perform-ance and ongoing stability: 1. the root mean square(RMS) signal stability over a region of interest (typically20 × 20 pixels) expressed as percent fluctuation; 2. thesignal-to-fluctuation-noise ratio (SFNR) calculated foreach pixel and averaged over the same region of interest;3. the correlation diameter (rdc); and 4. the drift in thesignal over time, calculated per pixel and expressed as apercent change. The basis of these tests,and a suitable pro-tocol for making the measurements, are presented here.
Quality assurance measurements are done on a 17 cmspherical phantom filled with agar gel using a standardhead coil. It is recommended that the tests be performedat least weekly (ideally, daily) to quickly identify adversetrends that may affect scanner performance. The imagingparameters for the test are similar to those used in atypical fMRI study. Thirty-five contiguous 4 mm slices areacquired axially through the phantom using a single-shotEPI or spiral gradient-echo imaging sequence. Theacquisition is repeated for 200 time frames with field ofview (FOV) of 22 cm, matrix of 64 × 64,TR of 3000 ms,TE
of 30 ms (at 3 T) or 40 ms (at 1.5 T), and flip angle of 90°.The bandwidth (BW) is 100 kHz or higher. Acquisitiontime is typically 10 minutes. Through-time measurementsof MR signal variation in the central slice are used tocalculate RMS stability, drift, mean signal, and SNR. Thefirst two time points are ignored to allow longitudinalmagnetization to reach steady state.
The RMS stability is measured as the fluctuation overtime of the average signal from a 20 × 20 pixel region ofinterest (ROI). Trends are removed by fitting a second-order polynomial. The residual fluctuation is expressedas a percentage. Typically, this should be less than 0.15%.This provides a measure of the fluctuation over time ofthe average signal across 400 pixels. This is useful todetect global fluctuations in the MR signal, for example,due to instabilities in the RF amplifiers, receiver gaininstabilities, shim instabilities, or timing errors in theeffective echo time.
The SFNR is calculated from maps of signal mean andsignal standard deviation across the 198 time points. Foreach pixel within a 20 × 20 ROI the ratio of mean tostandard deviation is calculated and the average value ofthis ratio is reported as SFNR. The SFNR should be 200or greater. The SFNR is an important metric for fMRI. Itdescribes the variance in a single pixel independent ofany functional activation and thus directly influencesthe statistical power of any activation-induced changes.The RMS and SFNR measures are both used to examinespatially varying effects induced by the MR scannerhardware. SFNR is different from the RMS measurementin that this is the average of the fluctuations in 400 pixels(rather than the fluctuation of the average). Effects thatact globally such as hardware instabilities will tend toinfluence both measures. Effects that act more locallysuch as random noise in the image will be more evidentin the SFNR than the RMS measurement.
The rdc (correlation diameter) is a measure of thespatial auto-correlation of the noise in the MR signal overthe 20-pixel diameter of the sampled ROI. If the variationin the MRI signal was purely thermodynamic noise (i.e.,uncorrelated noise), then this could be reduced bysimple averaging (the basis for improving imaging SNRin clinical scanning by increasing the NEX value). In thiscase, averaging adjacent pixels together would decreasethe relative noise standard deviation in proportion to thesquare root of the number of pixels averaged (i.e., a four-fold increase in pixels would decrease the relative noisestandard deviation two-fold). Other sources of correlatednoise, such as fluctuations in amplifier performance orspikes from the gradients, will tend to affect large num-bers of pixels similarly. Thus averaging across severalpixels will not reduce this spatially correlated noise.119
For an ideal scanner, a plot of noise standard deviationagainst number of pixels would follow an inverse squareroot relationship. Any deviation from this relationshipindicates the presence of correlated noise. The point atwhich the plot of noise versus ROI width deviates fromthis ideal negative square root relationship is a quantita-tive indication of the degree of correlated noise presentin the MR system. This is expressed as a pixel diameter—the correlation diameter or rdc. For an ideal scanner,this value will be 20 (or higher if larger ROI measure-ments were taken) indicating that even up to a diameterof 20 (or more) pixels, there is still an SNR benefit frompixel averaging (i.e., presence of uncorrelated noise).A poorly performing scanner will have a low value of1 or 2 pixels, indicating that the noise is strongly corre-lated. A well-performing scanner should have a rdc valueof 5 or higher; a value lower than this is an indication oflarger correlated noise contributions from the systemhardware.Deterioration in the rdc value indicates potentialinstabilities in subsystem hardware components such asgradients, RF amplifiers, or resistive shims.
Drifts in the MR signal over time are also important.These may be caused by problems in the amplifiers orshims,or may indicate drifts of the B0 field itself.Problemsin the gradients, which cause excessive heating, can alsobe seen as drifts in the MR signal and the heating mayalso change the temperature of the resistive shims,exacer-bating any drifts in signal. Drift is calculated on a pixel-by-pixel basis and expressed as a percent change over adefined time interval.
Figure 9-18 shows plots of signal fluctuation and fre-quency spectra for a clinical 3 T scanner while operatingat a baseline level for that scanner,and subsequently whenimage quality was degraded by large noise contributions.
EPI acquisitions are prone to ghosting artifacts, anapparent displacement of some of the image intensity byhalf of the field of view (FOV). Ghosting in EPI images isanother source of noise in fMRI, and needs to be tightlycontrolled (typically less than 2% to 3% signal power inthe ghosts). An analysis of the frequency spectrum ofany scanner noise or ghosting is valuable in determin-ing its origin and significance. Thermodynamic noise isuncorrelated and has equal amplitude at all frequencies.Hardware noise often occurs at a particular frequencyand will thus appear as individual spikes in thefrequency spectrum (see Fig. 9-18).
C H A P T E R 9 ■ BASIC PRINCIPLES OF FUNCTIONAL MRI 273
Ch009.qxd 14/7/05 12:45 PM Page 273

Additional measurements that should be recorded inthe regular quality assurance are the transmitter gain andreceiver gain used for the EPI measurements on thestandard phantom and the center frequency of thescanner. Minor statistical fluctuations in all of theseparameters are expected on a day-to-day basis, howeverthe ability to monitor trends can identify emergingproblems with scanner fidelity even before image qualityis adversely affected.
MEASURING CEREBRAL BLOOD FLOW,CEREBRAL METABOLIC RATE OFOXYGEN, AND CEREBRALBLOOD VOLUME
Cerebral Blood Flow
Cerebral blood flow (CBF) studies using 15O-labeled wateras the contrast agent have been used extensively forfunctional mapping with positron emission tomography(PET).120 The magnetic resonance counterpart to this
PET technique is to magnetically label (“spin label”)arterial water with an applied RF pulse.121 In a typicalimplementation, the magnetization of blood is invertedon the proximal side of the slice, and after a delay of 1to 1.5 s to allow labeled spin to flow into the slice, theimage is acquired. The experiment is then repeated with-out the inversion, and a subtraction of these tagged andnon-tagged images then yields a net signal proportionalto the arterial spin delivered to the voxel. For this reasonthe difference image directly reflects CBF.
Arterial spin labeling (ASL) can be used to measurethe baseline CBF,as well as activation-dependent changesin CBF.Because most of the water molecules delivered toa capillary bed in the brain are extracted, and becausethe inflow time in these experiments is very short, fewif any of the tagged spins reach the venous side of thevasculature. For this reason, the ASL signal reflectsdelivery rather than clearance, so the ASL signal islocalized in parenchyma rather than draining veins.Images of CBF using the ASL technique result inimproved spatial correlation with brain parenchymacompared with conventional BOLD fMRI in bothhuman122 and animal studies.123 ASL also provides aquantitative means to study the mechanisms underlying
274 S E C T I O N I ■ PHYSICS, INSTRUMENTATION, AND ADVANCED TECHNIQUES
5400
5200
5000
4800
5000
4800
4600
4400
1500
1000
500
00 0.02 0.04 0.06 0.08 0.1 0.12 0.14 0.16 0.18
200
100
0 4020 60 80 120100 140 160 180 200
0 4020 60 80 120100 140 160 180 200
00
0.040.02 0.06 0.08 0.120.1 0.14 0.16 0.18
Raw
sig
nal
Raw
sig
nal
Spe
ctru
mS
pect
rum
Percent fluctuation (trend removed) = 0.08, drift = –1.69
Mean = 5292.8, SNR = 603.9, SFNS = 546.0
Percent fluctuation (trend removed) = 0.25, drift = –6.58
Mean = 4667.0, SNR = 380.0, SFNR = 271.6
Frame number
Frequency, Hz
Frame number
Frequency, Hz
F I G U R E 9-18
Two examples of measurements of scanner stabilitytaken on the same 3 T MR scanner on differentdays (day 1: A and B; day 2: C and D). On day 1,signal fluctuation (A) is less than 0.15% (0.08%)and there is minor drift in the baseline signal overthe 200 acquisitions (600 s). SFNR is greater than200, and the spectrum (B) shows the noise poweris low and white. The RDC measure was 2.2 pixels(data not shown). These numbers can then be usedas the baseline indicators for scanner performanceon subsequent days. On day 2, signal drift (C) over600 seconds has now increased (−6.58), and thenoise fluctuation is now greater than 0.15%(0.25%). The reason for this is apparent on thenoise power spectrum (D), which is no longerwhite and shows large spectral power at 0.02 Hz(excessive low-frequency oscillatory noise). TheRDC value was lower (1.2 pixels), indicating thenoise is more spatially correlated across pixels thanpreviously.
Ch009.qxd 14/7/05 12:45 PM Page 274

the BOLD technique itself.50,124 A number of ASLtechniques have been developed; they can be broadlydivided into continuous and pulsed tagging techniques.In pulsed techniques the inversion is done with a sliceselective 180° pulse, and with continuous labeling theinversion is done adiabatically as the blood movesthrough a gradient field during a continuous RF pulse.Both classes of ASL have been used for measuring CBFchanges in humans following neuronal activation. Thedurations of CBF and BOLD signals are similar20 (see Fig.9-11) and the same stimulus design can be adapted forboth BOLD and flow activation measurements.125
Calibrating the BOLD Signalto Measure CMRO2 Changes
As noted above, ASL techniques have been useful forunraveling the possible sources of transients in theBOLD experiment. But if we now return to the con-sideration of steady-state changes, Equation 9-10 can beused as the basis for calibrating the BOLD effect andestimating the CMRO2 change with activation. Considera block design experiment in which the responsereaches a plateau steady-state value and both the BOLDsignal change ∆S/S and the CBF change ( f ) are measuredfor each voxel. If we assume that v is related to f bythe empirical relationship of Equation 9-11 there arethen only two unknown quantities in Equation 9-10: A,the local scaling factor, and m, the normalized changein CMRO2. The innovation of Davis et al43 was to showthat the local scaling factor A can be measured with aseparate experiment, and the combination of measuredvalues of A, ∆S/S, and f then provides an estimate of thechange in CMRO2 (m) through Equation 9-10. The trickfor measuring A is to make use of the fact that inhala-tion of CO2 causes a pronounced increase in CBF, butapparently no change in CMRO2.126 The experiment isthen to use the same ASL/BOLD imaging with CO2 as achallenge.Equation 9-10 is then applied with the assump-tion that m = 1 (no CMRO2 change), so the measuredBOLD signal and CBF changes with CO2 allow calcula-tion of the local value of A. This calibrated BOLD approachhas been used very effectively to show that the CBFincrease with activation is 2 to 3 times larger than theCMRO2 increase.43,44
The limitation of this technique is that, currently, onlya limited number of slices can be imaged at a time, andthe slices chosen need to be as orthogonal as possible tothe feeding artery for optimal spin-tagging.122 Althoughthe magnitude of the physiologic change is higher, theMR signal, and hence the available SNR, is lower forquantitative CBF measures.122 The CBF and BOLD signalsfrom this combined technique are not without some“crosstalk.”The T1 of blood is known to be longer thanthat of tissue, so there is some residual negative flowweighting in the average due to exchange of blood waterwith tissue water. Typically, the flow signal in the averageof tag and control images is approximately 18% of theflow signal in the difference signal between tag andcontrol states. This flow contribution has the opposite
sign to that of the BOLD signal, and thus causes a smallunderestimation of the BOLD signal. Conversely, theBOLD effects can also contaminate perfusion measure-ments. This effect is smaller than the effect of flow onthe BOLD signal. To a first approximation, the BOLDeffect causes a simple scaling of the MR signal on theorder of 2% to 4% during activation, which is just at thelimit of detectability.122
Assessment of Cerebral Blood VolumeUsing an Exogenous Contrast Agent
The earliest implementations of functional MRI usedcontrast based on cerebral blood volume (CBV) ratherthan blood oxygenation. These utilized the intensity ofsignal change during the first-pass passage of an intra-venous bolus of paramagnetic contrast agent throughthe brain and tracer kinetics analysis to estimate changesin CBV.127 The passage takes approximately a minute tocomplete, and additional time is required for clearanceof the contrast agent before the measurement can berepeated. Temporal resolution is thus limited, and thisapproach provides only a “snapshot”measure of cerebralblood volume. These first-pass measurements of dynamicsusceptibility contrast using gadolinium can be useful forassessing resting blood volume or abnormal CBV/CBFassociated with tumor neovascularization or cerebralischemia,128 but they lack the temporal resolution neces-sary to examine CBV changes during neuronal activa-tion. Greater temporal resolution can be achieved withintravascular contrast agents that maintain a prolongedsteady-state concentration. Depending on the type ofcontrast agent used, the sensitivity to CBV can alter theT1 or T2 relaxation time; however, the use of T2 agentsappears to give better sensitivity to CBV changes thandoes the use of T1 agents.62 Dextran-coated monocrys-talline iron oxide nanoparticles (MION) affect T2relaxation and have a prolonged blood half-life (rangingfrom 3 to 15 hours in monkeys129,130), making themvery suitable as susceptibility agents for measuring CBV.At a sufficiently large dose the contribution to bloodmagnetization from the contrast agent far exceeds thatfrom deoxyhemoglobin, so T2*-weighted MR sequencesare rendered insensitive to changes in deoxyhemoglobinconcentration. Flow changes also have no effect (theconcentration of paramagnetic agent is essentially thesame in the arterial and venous circulation, so increasedflow does not affect susceptibility). The imaging contrastis thus only sensitive to the concentration of paramag-netic agent in the imaging voxel. As local CBV increases,the vascular proportion of the voxel (and hence theobserved amount of contrast agent) increases. SinceT2 agents shorten T2 and T2*, the effect of increasedblood volume (and increased iron concentration) is toreduce the signal in the voxel, thus neuronal activationis associated with a decrease in MR signal for theseCBV-weighted images.129
The signal advantage of the CBV measurement overBOLD for fMRI is most evident at low B0 field strengths.Several factors contribute to this. First, the effect of the
C H A P T E R 9 ■ BASIC PRINCIPLES OF FUNCTIONAL MRI 275
Ch009.qxd 14/7/05 12:45 PM Page 275

BOLD signal (which increases with functional activa-tion) is opposite to the CBV signal (which reduces withactivation). A BOLD signal is still present, but the largernegative signal change from CBV measurement domi-nates any positive signal change due to BOLD. BOLDcontamination of the CBV signal is more pronounced athigher B0 field strength for a given dose of contrastagent.62 Second, as the effect of the contrast agent is todecrease the MR signal, the injected dose of contrastagent needs to be reduced at large B0 fields, or the MRsignal becomes too small to measure above the noise.Finally, the maximum CBV signal change is constrainedby the actual physiologic CBV change (which, unlikeBOLD, is field independent). The signal boosting effectof contrast agent will be less when the BOLD effect ishighest (at high B0 field), and the maximum improve-ment in SNR is thus seen at lower field strengths.62
Threefold increases in signal at 1.5 T and 3 T have beenreported compared to BOLD studies.129,130 Since theBOLD signal and contrast-enhanced CBV signal haveopposite sign, enough contrast agent must be used toovercome the BOLD signal. Using high-dose contrastand short echo times at 1.5 T, fivefold increases inSNR have been observed.131 This increased SNR allowshigher resolution imaging, and voxel dimensions of2 mm × 2 mm × 2 mm are achievable at 1.5 T with thismethod.131 Signals from large veins relax very quicklyand do not contribute significantly to the image, so theCBV signals are thus better spatially correlated withbrain parenchyma than BOLD fMRI.62
In addition to providing improved SNR for functionalMRI studies, this method also allows the actual CBVchange to be calculated, and like CBF measures of func-tional activity, the CBV change provides quantitativeinformation. By measuring the iron concentration invenous blood it is possible to calibrate the R2* relaxationrate, and thus get an absolute measure of CBV changewith neuronal activation (the CBV can be calculatedfrom the slope of R2* change with [Fe]blood (for derivationsee references 62 and 129).
(Eq. 9-16)
R2* is the relaxation rate at rest (r), during activation(a), and without MION prior to the start of theexperiment (0).
For photic stimulation from a 6-second duration 8 Hzflickering checkerboard, the CBV change in macaqueprimary visual cortex using the iron oxide contrast agentmethod is 32%. This value corresponds closely to theCBV changes measure in humans127 using the first-passgadolinium contrast agent method.
Iron oxide contrast media enter the normal ironstores in the body and are excreted by the liver. The largedose needed to overcome the signal from BOLD(approximately 5 to 7 mg Fe/kg at 1.5 T) would rapidlylead to overload of the normal iron stores. This haslimited these iron oxide–based methods to studies inanimal models.
�
�1n∆CBV
CBV r R2* r � R2* 0
�1TE
SaSr
Assessment of Cerebral Blood VolumeUsing an Endogenous Contrast Agent
In recent years, noninvasive techniques have been pro-posed using the blood itself as the contrast agent todetermine the CBV. These are based on nulling the bloodpool signal using flow-weighting gradients132,133 orinversion recovery.134
Determining the activation-induced change in CBVfrom the nulled blood pool signal is not trivial. Theflow-weighting method is based on the observationthat the application of flow-weighting gradients leadsto a greater attenuation of blood signal than of brainparenchyma because of the intravoxel dephasing ofrandomly oriented vessels in the microvasculature.Thus, the difference of images acquired with and with-out flow-weighting gradients yields an image that isproportional to CBV. Confounding factors include slightdiffusion weighting of brain parenchyma, artifacts due tothe pulsatility of CSF, and activation-related changes inthe T2 of venous blood. To address these confounds,Liu et al132 used a T2-FLAIR preparation sequence135
followed by a spin-echo sequence with a spiral readoutto null out the CSF signal and compensate for bloodT2 changes. The diffusion weighting of parenchymawas minimal and could be compensated for by a multi-plicative term based on the average diffusion coefficientfor brain tissue. A remaining confounding factor isthe increased attenuation of blood signal due to theactivation-related increase of microvascular bloodvelocities, which can result in an overestimate of theCBV change. Calculations based on current knowledgeof the microvasculature architecture indicate that thisfactor is small; however, a comparison of the flow-weighting method with CBV measurements from theMION measurement described above would provide anindependent validation of the accuracy of the method.
The vascular space occupancy (VASO) methodproposed by Lu et al134 uses a nonselective inversionpulse to null out the blood signal. Because the T1 ofblood has been shown to be independent of oxygena-tion, this pulse nulls out blood in all compartments ofthe microvasculature. The remaining VASO signal is com-posed of brain parenchyma and CSF. As CBV increases,the VASO signal should decrease as parenchyma isdisplaced by blood. In experiments with healthy humanvolunteers, Lu et al found that the VASO signal decreaseswith hypercapnia, increases with hypocapnia, anddecreases with visual stimulation. The temporaldynamics of the VASO signal with visual activation wereconsistent with a rapid increase in arteriolar volumeupon onset of activation and a slow decrease in venousvolume at the end of activation. Although the VASOsignal provides an indication of the dynamics of CBV, itdoes not currently provide a quantitative measurementof either the percent change in CBV or the absolute valuesof CBV in the rest and active conditions. A comparisonof the VASO signal to CBV measurements obtained withMION has the potential to provide a calibration methodfor the VASO method. At present these techniques forfMRI based on CBV change are less widely used forhuman subjects than BOLD and CBF studies.
276 S E C T I O N I ■ PHYSICS, INSTRUMENTATION, AND ADVANCED TECHNIQUES
Ch009.qxd 14/7/05 12:45 PM Page 276

Magnetic Resonance Spectroscopy
MR methods other than fMRI can be utilized to measurefunctional activity and also provide measures of additionalaspects of cerebral physiology. A number of studies havedemonstrated stimulus-related changes in cerebralmetabolites, in particular reduced glucose and elevatedlactate levels, following visual,136,137 somatosensory,138-140
motor,141 auditory,142 and cognitive stimulation.143,144
Recent functional MR spectroscopy studies have improvedthe temporal resolution using time-resolved145,146 or EPI-based techniques.142,147 These show good spatial con-cordance of spectroscopic changes with BOLD fMRI.147
The SNR for spectroscopic techniques is lower than withBOLD, and thus there is reduced spatial and/or temporalresolution. However, they allow investigation of addi-tional cerebral parameters associated with neuronalactivation, and thus provide further insight into controlof cerebral metabolism.
Diffusion
Diffusion tensor MRI (DTI) provides quantitative maps ofnatural microscopic displacements of water moleculesthat occur in tissues as part of the physical diffusionprocess. During typical diffusion times of 50 to 100 ms,unrestricted water molecules move approximately15 µm.148 Measurement of any restriction in waterdiffusion reveals microscopic architectural detailsabout tissue structure. Although more widely used todiagnose cerebral ischemia149-151 or to map white mattertract architecture,152 functional changes in diffusionanisotropy may also be used to image cerebral activa-tion.153 Direct optical measurements in animals demon-strate an early change in photon scattering followingneuronal activation. Changes in neuronal volume,particularly at the axon hillock, have been proposed as apossible mechanism for this observation.154,155 Smallchanges (less than 1%) seen in the apparent diffusioncoefficient (ADC) following visual stimulation may reflectthis change in neuronal and glial cell shape.156 This MRItechnique thus provides another way of interrogatingchanges in cellular physiology associated with neuronalactivation.
Manganese Tract Tracing
As described above, measures of diffusion anisotropycan provide architectural detail of white matter tracts.The fiber maps generated using this DTI techniqueimpart structural connectivity information based ondiffusion of water, but do not necessarily detail func-tional connectivity. Manganese tracking is an emergingMRI technique that maps functional white matterconnectivity by tracking the transport of manganesechloride contrast agent.157-160 Manganese is a T1 contrastagent which acts as a calcium analog. It is transportedboth anterogradely and retrogradely along neuronal
tracts and crosses synaptic junctions. Synaptic transportof manganese parallels neuronal activity,161 thusproviding images based on actual functional connec-tivity. Figure 9-19 shows retinal and optic tract enhance-ment in a mouse after injection of manganese chlorideinto the anterior chamber of the eye. At present thetechnique is limited to animal studies due to the needto deliver the manganese directly into the tract underinvestigation and also toxicity associated with man-ganese. With further improvements in mechanisms fordelivery and safety, this technique holds promise forstudying functional connectivity in normal humansubjects and patients.
EXPLORING THE HEMODYNAMICRESPONSE TO BRAIN ACTIVATIONWITH MRI
In the previous sections we introduced and reviewed thecurrent thinking about fMRI signals, their physiologicbasis, and the analytic methods typically employed. Inthis section we discuss concepts and issues that arecurrently being debated and researched. By its nature,the selection of the topics discussed is somewhatarbitrary.
C H A P T E R 9 ■ BASIC PRINCIPLES OF FUNCTIONAL MRI 277
5 mm
F I G U R E 9-19
T1-weighted axial-oblique image of the brain of a mouse at 7 tesla followinginjection of 1 µL of manganese chloride into the anterior chamber of theright eye. Manganese is a T1 contrast agent that is transported bothantegradely and retrogradely along activated neurons. The globe, retina,and optic tracts are enhanced by the contrast agent. (Image courtesy ofMiriam Scadeng and James Lindsey.)
Ch009.qxd 14/7/05 12:45 PM Page 277

Are Oxygen and Glucose MetabolismLinked during Increased Neural Activity?
As mentioned earlier (see “The Physiologic Basis of fMRI”),recent evidence suggests that CBF and CMRO2 change ina graded fashion with different neural activity states, theCBF change being approximately twice as large as theCMRO2 change. These data provide some support for thegeneral idea that neural activity leads to increased energydemand and that CBF increases to provide the oxygenand glucose for energy metabolism, and suggests thatneuronal activity changes are appropriately reflected byCBF changes. However, the link between oxygen metabo-lism, glucose metabolism, and neuronal activity is yet notwell established.
The primary expenditure of energy is required torestore the ion gradients degraded during neural activa-tion. The intracellular/extracellular Na+ gradient is farfrom equilibrium,so pumping Na+ against this gradient isa strongly uphill reaction in a thermodynamic sense. Forthis reason, the most costly aspect of neural activityis likely to be excitatory synaptic activity in whichglutamate opens sodium channels. Indeed, the action ofthe Na+/K+ pump is thought to consume a large fractionof the ATP energy budget in the brain.14 In a recentanimal experiment, blocking voltage-dependent sodiumchannels substantially reduced the CBF response,162
supporting the idea that the dominant energy-consumingprocess in the brain is recovery from excitatory activity.
Glucose metabolism has attracted less attention thanoxygen metabolism from the MRI community, although13C spectroscopy techniques show considerable promisefor addressing critical questions.163,164 The delivery ofglucose is not as limited as that of oxygen (see “TheFunction of Neurovascular Coupling and the OxygenLimitation Model”). In fact, almost half of the glucoseextracted from the blood vessels is not metabolized anddiffuses back into the venous blood. This means that, atleast in principle, an increase in glucose metabolism canbe accomplished without a concomitant increase inCBF. In animal experiments in which the CBF responseto activation was blocked, the glucose metabolic ratenevertheless increased by the same amount as it didwhen the CBF change was not blocked.165 Thus, withincertain physiologic limits, the glucose metabolismchange might be functionally independent of the CBF.
Despite this independence during activation, atbaseline CBF and CMRGlc appear to be well matched.The glucose transporters Glut1 and Glut3 are mainlyresponsible for the transport process in the brain byfacilitated diffusion.165 As reported by Duelli andKuschinsky, the density of these transporters matchesthe local glucose utilization measured with the2-[14C]deoxyglucose method. In addition, it was foundthat the transporter density was highly correlated withthe capillary density. The transporter density can beregulated upward or downward by a chronic (approxi-mately a few days) increase or decrease in glucosemetabolism. This finding, together with the hypothesisof Harder et al166 that astrocytes sense neuronal activityand lead to angiogenesis as observed in cell cultures,leads to an intriguing speculation about the function of
hyperemia following stimulation: that the CBF increase isneeded rather for the formation of new capillaries thanfor nutritional support. While angiogenesis followingstimulation is most likely true for chronic hyperemia, itis, however, unlikely that this could serve as a generalexplanation for the large transient CBF changes asso-ciated with the short stimulation periods (less than a fewminutes) used in fMRI studies.
The close correspondence in the baseline statebetween the enzymes associated with glucose metabo-lism and CBF is similar to the situation for oxygenmetabolism. Stains for cytochrome oxidase, a keyenzyme in the mitochondrial respiratory chain, correlateclosely with capillary density.167 In addition, Raichle andcolleagues167a reported that from many PET studies theoxygen extraction fraction E is nearly uniform acrossthe brain with a value of approximately 40%. This sug-gests a close coupling of CBF and CMRO2 in the baselinestate.Also, the oxygen glucose index (OGI), the ratio ofCMRO2 to CMRGlc, is typically approximately 5.5 at rest,close to the theoretical ratio of 6 for full oxidativemetabolism of glucose.18
In short, a number of measures support a close asso-ciation of CBF, CMRO2, and CMRGlc at rest, reflected bya uniform value of E and an OGI near 6. What is thensurprising is that this pattern is not followed withactivation. As we have described in detail, E decreaseswith activation, and produces the BOLD effect. The OGIalso decreases with activation, meaning that CMRGlcincreases more than CMRO2.
Why Does Glucose Metabolism Increasemore than Oxygen Metabolism withBrain Activation?
As noted above, the OGI is approximately 5.5 during restand deviates from the expected value of full oxygenmetabolism of 6 (see “The Physiologic Basis of fMRI”).18
In addition, the OGI even decreases to a lower valueduring activation.168 It is currently not known why thisOGI pattern during rest and activation occurs. Somepossible explanations are:
1. Glucose is metabolized non-oxidatively to pyruvateand then lactate, which is partly cleared by venousflow and is lost for full oxidative metabolism. MRspectroscopy can be utilized to measure the increasein lactate concentration in the brain137,169,170 and thusallows the study of the fate of the glucose used.
2. Glucose is used to produce other chemical products(e.g., glutamate, glutamine) and hence serves otherfunctions than metabolism alone.171 The products arethen metabolized after stimulation ends, replacingglucose and reducing the glucose extraction fractionuntil the resting concentrations are reached. An MRmethod to measure these metabolites is [13C]-MRspectroscopy.28
3. Another hypothesis for the extensive use of glucose isthat the non-oxidative metabolism is needed for fastprocesses. Glycolysis generates ATP much faster thanfull oxidative metabolism.170 Shulman and colleagues
278 S E C T I O N I ■ PHYSICS, INSTRUMENTATION, AND ADVANCED TECHNIQUES
Ch009.qxd 14/7/05 12:45 PM Page 278

proposed a “glycogen shunt” model in which glucoseis metabolized to glycogen during rest to fill up theglycogen pool in astrocytes, which in turn duringstimulation is metabolized quickly within millisecondsin order to deliver the energy needed to recycle theneurotransmitters released during neuronal activity.However, this model would only explain transientchanges in OGI.
4. In some structures in the brain oxidative metabolismmay not be possible,e.g.,due to missing mitochondriain some dendritic spines.172 However, energy metabo-lism is still required. No estimate has been presentedof how much of the glucose metabolism needs to benon-oxidative and if this mechanism can explain theexperimental findings during rest and stimulation.
Future studies using MR spectroscopy combined withfMRI are needed to resolve these issues and will be veryuseful for investigations of the physiologic basis offMRI signals.
What is the Underlying Neuronal Activitythat Drives the fMRI Signals?
With these uncertainties in mind we come back to thequestion of what neuronal processes are mainly reflectedby CBF and the BOLD signal. Synaptic activity may beexcitatory or inhibitory, and this synaptic activity mayor may not produce spiking activity. Different fMRIsignals that differ between brain areas or between sub-jects might be due to different types of neuronal activityor differences in neurovascular coupling (or both).This clarification is important for two reasons. First,as pointed out earlier, the hemodynamic response istightly coupled to oxygen metabolism. The neurovas-cular coupling translates very different neuronal andastrocytic processes into one dimension of CBF response,most likely reflecting just the total oxygen metabolism ofthese processes. Thus, different activities of neurons andastrocytes can lead to the same CBF change. Second, thelocation of the hemodynamic response may differ fromthe location of the neuronal activity not only because thehemodynamic response is controlled in a coarse mannerfrom feeding arterioles,but also because local processingand input from another brain area may elicit differentresponses (see below).
Spiking versus Synaptic Activity
The current debate about precisely which aspect ofneural activity drives the CBF change is usually framed interms of synaptic activity versus spiking activity.Synapticactivity includes neurotransmitter release and recycling,post-synaptic potential changes, and ion fluxes initiatedby the neurotransmitter, while spiking activity refersto the generation and propagation of action potentials.Rees et al and Heeger et al have demonstrated a linearrelationship between spiking activity in monkeys andBOLD signal in a similar cortical area in humans; in theformer study 9 spikes per second per neuron in V5
and in the latter study 0.4 spikes per second per neuronin V1 was found to correspond to 1% BOLD signalchange.173,174 One of the difficulties in interpreting thesestudies is that the spiking and post-synaptic activity areusually strongly correlated.
Two studies have successfully dissociated synapticand spiking activity. In one study, Lauritzen andcolleagues stimulated either the parallel or the climbingfibers in the rat cerebellum,which have either inhibitoryor excitatory effect on the Purkinje cells in (for a reviewsee reference 175).With this method they were able tominimize the spiking activity while synaptic activitycontinued, and this correlated with a CBF increase dueto stimulation despite zero spiking activity. A secondstudy comparing BOLD signal with high-frequencyelectrical activity or multi-unit activity (thought to reflectspiking activity) and the mean local field potential(thought to reflect synaptic activity) found a slightlyhigher correlation between BOLD signal and local fieldpotential (LFP).176 Recently, by injecting serotonin, thesame group succeeded in suppressing the multi-unitactivity while leaving the LFP unchanged.177 The BOLDresponse also remained unchanged, enforcing the strongconnection between LFP and BOLD signal.
However, the relationship between electrical activityof neuronal ensembles and CBF might be even morecomplicated. In a recent study from Caesar et al, usingtopical application of GABAA (muscimol) receptor agonistin the cerebellum of the rat, the baseline CBF did notchange whereas the spiking activity and the CBF responseto climbing fiber stimulation were reduced.178 However,the agonist did not affect the LFP. One conclusion mightbe that the correlation of LFP and CBF is valid for excita-tion circuits but not for inhibition circuits (see “DoesInhibition Produce a BOLD Response?”).
In summary, the experimental results favor synapticactivity rather than spiking activity as the prime driver ofCBF changes. This is reinforced by theoretical estimatesthat for the primate brain 70% or more of the requiredenergy metabolism is due to synaptic activity (see Fig.9-2). These findings might have important implicationsin interpreting CBF and BOLD changes regarding thespatial information encoded by these signals.
Input signals to one area or in one neuron are mainlyrepresented by synaptic activity,whereas spiking activityrepresents the output signals.176 Therefore the currentsuggestion is that CBF represents the input to an arearather than the output. This would have the importantimplication that BOLD and CBF changes in one area canbe caused remotely by input signals of another area andhence that these changes may spatially misrepresent theregions with increased spiking activity. However, localprocessing in one area evokes both spiking and synapticactivity because of the many local connections, so it isreasonable to assume that most of the neuronal signalscausing CBF changes are within the area measured.Thus, mapping CBF changes to infer neural activitychanges should only miss activated areas that are spikingwith minimal synaptic activity. In addition, subthresholdactivity in one area has a broader spatial extent thanspiking activity, such as LFP, and thus CBF should have abroader spatial distribution than the spiking activity.
C H A P T E R 9 ■ BASIC PRINCIPLES OF FUNCTIONAL MRI 279
Ch009.qxd 14/7/05 12:45 PM Page 279

Simultaneous Measurementsof Electroencephalographyand Event-Related FieldPotentials with fMRI
Event-related field potentials (ERP) and electroen-cephalography (EEG) measured with fMRI have beenutilized to investigate noninvasively the relationshipbetween CBF and underlying neuronal activity. ERP andLFP have a close relationship because both are assumedto be a weighted sum of post-synaptic currents. In con-trast, EEG oscillations reflect mainly synchronizedneuronal activity.
Arthurs and colleagues have found a linear correlationbetween somatosensory evoked potentials and BOLDresponse in humans.179 Using two-pulse stimulation withdifferent inter-stimulus intervals up to 100 ms, Ogawa etal showed in rats that neuronal interaction measured assuppression of the ERP magnitude to the secondstimulus is reflected by the BOLD signal.180 By the way,this experiment showed that although the hemodynamicresponse evolves in seconds, the magnitude of the hemo-dynamic response could encode events and interactionson a millisecond time scale. In a recent study intraduralERP in patients and BOLD signal in healthy volunteersduring the same visual stimulation were measured.181
ERP and BOLD signal did not correspond coherentlyfor all areas. Furthermore, additional analysis revealedno consistent correlation between the EEG and BOLDsignal. In summary, the connection between ERP andBOLD signal clearly needs further investigation.
In the near future, the main problems in combiningboth measures (e.g., a non-magnetic EEG device, EEGtime course artifacts caused by switching MR gradients,etc.) will be solved and this will lead to routinelycombined fMRI-EEG measurements in healthy volunteersand in disease populations. In the last few years manygroups have made combined measurements with fMRIand EEG. As an example from the increasing literature,several groups have correlated BOLD baseline fluctua-tions (resting either with eyes open or eyes closed) withα-power in EEG and have found negative correlations inthe visual cortex and positive correlations in thethalamus.182 This finding is supported by the hypothesisthat the generator of the α-rhythm is the thalamus creat-ing a subsequent local deactivation in the visual cortex.
However, in our opinion the α-power (or a complexcomposite of EEG oscillations) cannot be regarded as ageneral predictor of the CBF time course. Synchronizedactivity of the pyramidal cells reflected in the EEGoscillations does not have to be more (or less) energydemanding than non-synchronized activity and, thus, cancause similar CBF and BOLD response. That is, in otherareas other EEG oscillations are expected to correlatewith CBF changes. Therefore the positive finding of thesestudies should be considered as a special case of highcorrespondence of CBF and EEG. However, to under-stand the neural basis of the fMRI signals it is not onlythe EEG signals that correlate with the BOLD signalthat are important but also the EEG signals that do notcorrelate. Clearly more work is needed to explore the
relation between changes in the fMRI signals andthe underlying electrophysiologic signals, which can bemeasured directly by invasive means or indirectlynoninvasively with EEG and ERP.
Does Inhibition Producea BOLD Response?
In the cortex the number of excitatory neurons is approxi-mately five times larger than the number of inhibitoryneurons.183 Release of the main excitatory transmitterglutamate triggers increased metabolism in astrocytes,184
which in turn has been shown to correlate to neuronaloxidative metabolism.28 In addition, the couplingbetween CBF and CMRO2 has been shown to be thesame during increased and decreased activity withinthe range of physiologic manipulations.185 Thus, theassociation of excitatory synaptic activity with increasedenergy metabolism is clear. Does the main inhibitoryneurotransmitter, GABA, produce the same increase (oreven a decrease) in metabolism as glutamate?
Excitation and inhibition share common energy con-suming processes in synapses, such as clearing neuro-transmitter from the synaptic cleft and repackagingneurotransmitter in vesicles. For both types of activityionic gradients must be restored, although the energyrequirements may be different because the ions aredifferent. Excitatory activity opens sodium channels,while inhibitory activity opens chloride and/or potas-sium channels. The sodium distribution across the cellmembrane is the farthest from equilibrium, and so thethermodynamic energy cost may be higher for pump-ing sodium than chloride or potassium. Therefore, itis reasonable to assume that inhibition also is energydemanding, but it is not clear whether it is as demand-ing as excitatory activity. That is, like excitation, inhibi-tion should cause an increase in CBF, which in fact wasfound in the hippocampus186 and in rat cerebellum.187
However, in cell cultures no increase in metabolismcaused by GABA release was found in astrocytes.188 Insupport of this finding, no change in CBF during inhi-bition was observed using a go/no-go event-relatedparadigm and combined transcranial magnetic stimu-lation and fMRI measures.189 Interpreting these resultsin a conclusive way is difficult, because inhibitionmight also cause a decrease in CBF by suppressing theexcitatory activity in the subsequent neuronal circuit:for example, a decrease in CBF is often found duringsensorimotor stimulation in the ipsilateral cortex areadue to transcallosal inhibition (see, e.g., reference 190).In summary, the net effect of inhibition might be anincrease, no change, or a decrease of CBF (for a reviewsee reference 191).
What is the Significance of theTransients of the BOLD Signal?
The evoked hemodynamic response has some typicalcharacteristics. Notable features of experimental measure-ments of the BOLD response are the transients, an
280 S E C T I O N I ■ PHYSICS, INSTRUMENTATION, AND ADVANCED TECHNIQUES
Ch009.qxd 14/7/05 12:45 PM Page 280

occasional brief initial dip at the beginning or the morecommon prolonged post-stimulus undershoot.20,26 Thepositive BOLD response reaches its maximum afterapproximately 5 to 8 seconds. For a block design aninitial overshoot is observed if a post-stimulus under-shoot is present in the response to an event. A typicalBOLD response is shown in Figure 9-20. The post-stimulus undershoot often appears as an apparentlowering of the baseline after the first stimulus block,when the undershoot has not fully resolved before thenext stimulus block begins. In general, to clearlydistinguish the undershoot, the rest block should belonger than the stimulus block.
In the balloon model,20 such transients have twodistinct sources. The initial dip is modeled as a slightdelay (approximately 1 s) of the CBF response comparedto the CMRO2 response. The post-stimulus undershootarises in the model because CBV is slower to recoverthan CBF and CMRO2. Then if the oxygen extractionfraction returns to baseline at the end of the stimulus,but the venous blood volume remains elevated, totaldeoxyhemoglobin will be higher than baseline, reducingthe BOLD signal.
In the original version of the balloon model20 it wasnoted that an initial dip could result from a rapid rise inblood volume. A number of optical studies found thatthe initial dip period corresponded to an increase ofdeoxyhemoglobin but without a dip in deoxyhemoglo-bin, suggesting a combined change in CBV and E.69,192
A more recent study, however, found a correspondinginitial decrease in oxyhemoglobin in conjunction withan increase in deoxyhemoglobin, more clearly suggest-ing a change in E.73 Some recent data show that in factthe tissue oxygenation decreases shortly after beginningof the stimulation.193 However, whether this tissuedeoxygenation is translated into vascular deoxygena-tion has still to be proven. Although more data are clearlyneeded to resolve the experimental inconsistencies,recent experimental work suggests the change in E asthe source of the initial dip. Despite its elusive nature,26
it has excited great interest because it appears to be
better localized than the primary BOLD effect (see below),and because it may represent a transient uncoupling ofCBF and oxygen metabolism.
Post-Stimulus Undershoot
The most frequently observed transient is a post-stimulusundershoot that often lasts for tens of seconds. A possibleexplanation for this phenomenon is that the CBV changeresolves more slowly than the CBF change at the end ofthe stimulus. This effect has been seen in a study in a ratmodel,21 and two similar theoretical models have beenproposed to explain the effect (the delayed compliancemodel21 and the balloon model20). Both of these modelsare based on the distensibility of the venous vessels, andthe long time constant for CBV to adjust is then treatedas a biomechanical property of the vessels.Note that thisview involves some subtlety with regard to the relation-ship between CBV and CBF. In order to increase CBF,the vascular resistance must be decreased by dilating thearterioles. This active volume change on the arterial side,the direct cause of the CBF change, is thought to be asmall fraction of the total CBV change. The venouschange, however, is thought to be a passive response tothe increased CBF and corresponding pressure changes.However,much of this picture is still speculative,althoughthe resulting model curves often describe experimentalBOLD data quite well. A recent finding supports thisbasic picture:using a sequence sensitive to blood volumechanges (called VASO), Lu and colleagues reportedthat the early change in VASO signal is parallel to theincrease in CBF, consistent with the idea that the earlyincrease in CBV is caused by the arterioles,which in turnleads to the CBF increase.134 However, the VASO signalafter the stimulus ended showed a much slowerrecovery to baseline than CBF, consistent with the ideathat the late part of the VASO signal is dominated byvenous blood volume changes.
Other explanations of the post-stimulus undershootare still under discussion: 1. CMRO2 recovers to its base-line value more slowly than CBF,136 hence oxygen isextracted even after CBF recovered to baseline producingtransient hypo-oxygenation; 2. CBF drops below baselineafter the stimulus ending, presumably due to neuronalinhibition and a corresponding decrease of neural activityin the post-stimulus period.177
Only the first explanation is not compatible with aconsistent coupling of CBF and CMRO2 and requires atransient uncoupling. However, as pointed out above,experimental data suggest that the post-stimulus under-shoot is a result of the temporal mismatch of CBF andCBV and enhanced by a CBF undershoot. However, thetemporal dynamics of the post-stimulus undershoot andits dependence on the baseline CBF value are not wellunderstood and are still under investigation.
Nonlinearity of the BOLD Response
Although the standard statistical analysis assumes a linearresponse, such that the net response to several stimuli issimply the sum of the individual responses to a single
C H A P T E R 9 ■ BASIC PRINCIPLES OF FUNCTIONAL MRI 281
Initial overshoot
Post-stimulus undershoot
"Dip"
F I G U R E 9-20
A typical BOLD response for a block design stimulus. Transients are anoccasional brief initial dip at the beginning, an initial overshoot, and aprolonged post-stimulus undershoot.
Ch009.qxd 14/7/05 12:45 PM Page 281

stimulus, the hemodynamic response is often nonlinear.The BOLD response typically exhibits a temporalnonlinearity, such that an appropriately shifted andadded response to a brief stimulus over-predicts the trueresponse to an extended stimulus.85,194-199 This temporalnonlinearity is most pronounced when the briefstimulus is less than about 4 s and the extended stimulusis longer than 6 s. Comparing short and long durationstimuli that are both longer than approximately 4 s, thetemporal nonlinearity is reduced.
A nonlinearity such as this could arise in several ways.In the step from the stimulus to the evoked neuralactivity, adaptation can produce an initial sharp rise inactivity that decreases to a lower plateau level, even witha constant stimulus. In addition, the step from neuralactivity to CBF response could be nonlinear, for examplethrough a ceiling effect on CBF change.
Friston et al suggested that a large part of the non-linearity of the BOLD response arises from the transfor-mation of a CBF response to the BOLD signal change.85
In a subsequent study they showed that the Volterrakernel characterization of experimentally observednonlinearities could be accounted for with the balloonmodel plus a linear transformation up to the CBFresponse, again supporting the idea that the primarynonlinearity is in the transformation from the CBF tothe BOLD response.200 The two sources of nonlinearity(neural or vascular) can be distinguished experimen-tally by whether the nonlinearity is present in justthe BOLD response or in both the BOLD and CBFresponses. For example, Miller et al199 found that bothvisual and motor cortices exhibited a nonlinear BOLDresponse, but only the visual cortex showed a nonlinearCBF response.
This source of nonlinearity in the step from CBF toBOLD can be explained as a BOLD ceiling effect. Even aninfinite CBF change could still produce only a finiteBOLD response, corresponding to removing all deoxy-hemoglobin from the voxel. This effect produces an over-prediction of the amplitude of a long duration stimulusfrom a short duration stimulus when the flow changedue to the short stimulus is substantially weaker than theflow change due to the longer stimulus. That is, the BOLDceiling effect should introduce a nonlinear responsewhen the shorter stimulus is narrower than the width ofthe CBF response, which is approximately 4 s, in goodagreement with experimental data.
In addition to the nonlinearity of the amplitude, thereare nonlinearities of the timing of the response, such aslatency or response width. A recent proposal by Behzadiet al201 and Baird and Warach202 is a promising approachfor accounting for these effects. Instead of treating CBFas a linear convolution with the neural activity, it isassumed that neural activity releases a vasoactive agentthat alters CBF, as in the model described in reference200. The difference is that the agent is modeled as actingon the compliance of the vessel. The compliance in turnis treated as a combination of the smooth muscletension, which can be controlled by the agent, and afixed elastic component that becomes a more dominantfactor in determining compliance when the vessel isexpanded. In this way, the same concentration of the
agent will have a greater effect on CBF when the flowis lower, and potentially a different effect on the non-linearity of the response.
The Physiologic Baseline StronglyAffects the BOLD Signal
The fact that the BOLD signal depends on a combinationof changes in CBF, CBV, and CMRO2, and also on thebaseline physiologic state, makes it difficult to interpretthe magnitude of the BOLD signal change unambigu-ously without further experimental information. For thisreason, the BOLD effect has been used primarily as amapping tool, based on detecting signal changes, ratherthan as a probe of the underlying physiology based on adetailed analysis of the BOLD response.
However, combined measurements of BOLD and CBFcan be used to model the effects of the physiologicbaseline on the BOLD response. Experiments havefound that when baseline CBF is increased by breathingCO2 or administering acetazolamide, the BOLD responseis reduced. For example, Brown et al49 found that aceta-zolamide raised baseline CBF by 20% and the BOLDresponse in the motor cortex with finger tapping wasreduced by 35%, but the CBF change (∆CBF) withactivation stayed the same.
With CO2 inhalation CBF increases but it is thoughtthat CMRO2 remains the same. This means that at thisnew baseline the oxygen extraction fraction E must besmaller than it was at the previous baseline, and thisimplies that there is less deoxyhemoglobin present atthe new baseline. Thus, even if the fractional changes ofthe physiologic quantities were the same, the BOLDsignal would be reduced. However, in addition, theexperimental data suggest that ∆CBF remains constantdespite the raised baseline CBF, so the fractional CBFchange is smaller at the elevated baseline, and this willfurther reduce the BOLD response.
As a numerical example, consider an activation thatproduces a 30% change in CBF and a 10% change inCMRO2 from the initial baseline state, giving a BOLDsignal change of 1.36% (calculated with Equation 9-10and A = 0.1). If the subject now breathes CO2 thatproduces a 20% increase of baseline CBF with no changein CMRO2, the raw BOLD signal baseline will increase by1.82%. If the same activation on top of this new baselinestate produces the same absolute changes in CBF andCMRO2, we can calculate the net effect by first con-sidering that if this net physiologic change had occurredin the original baseline state, the relevant changes wouldhave been a 50% change in CBF and a 10% change inCMRO2, which would have given a BOLD signal changeof 2.61% from the original baseline. Subtracting theBOLD baseline shift of the new state, the BOLD signalchange from the new baseline is 0.79%. This is a 42%reduction of the BOLD response to the same activationdue just to the 20% increase of the CBF baseline, and isin reasonable agreement with the experimental data.
The implication of this sensitivity of the BOLD signalto the baseline state is that, potentially, many factorscould alter the baseline state of a patient group (e.g.,
282 S E C T I O N I ■ PHYSICS, INSTRUMENTATION, AND ADVANCED TECHNIQUES
Ch009.qxd 14/7/05 12:45 PM Page 282

anxiety or vasoactive medications) that could make theirBOLD responses significantly different from a healthypopulation even if the neural responses in the twogroups were identical. For this reason, the ∆CBFmeasured with ASL techniques may prove to be a muchmore robust approach for quantitative fMRI studies.
While these considerations show how changes in thebaseline CBF can affect the BOLD response, we have notdealt with the issue of what determines the baselineCBF. A recent theory, which requires further develop-ment, is that CBF is regulated to maintain a constant ratioof O2 to CO2 at the mitochondria, in order to preservethe thermodynamic free energy available from oxidativemetabolism of glucose.203 The O2 concentration at themitochondria ([O2]) is determined by E, so to increasethe diffusive flux of O2 from capillaries to mitochondria,while maintaining [O2], requires E to decrease with acti-vation. In addition, increasing CO2 in the blood increasesCO2 in the tissue as well, degrading the [O2]/[CO2] ratio,and this is again restored by decreasing E. Thus, themodel predicts that CBF should increase with CO2, andthat an additional increase is required to meet the needsof increased CMRO2.
As commonly used, the terms activation and deactiva-tion are relative terms, so the choice of an appropriatetask to define the neural activity of the baseline con-dition plays a critical role in an fMRI experiment.204 Theuncritical use of the notion of baseline may lead toerroneous interpretation of fMRI data. Essentially, thebrain is always intrinsically active as the high value of“resting” metabolism shows. The brain has a weight ofapproximately 2% of the weight of the whole body,but accounts for 20% of the whole metabolism. Strictlyspeaking, in stimulation experiments, two differentactive states are compared with each other and one isreferred arbitrarily to be the baseline state. This isespecially problematic for complex brain functions andthus the baseline state has to be chosen carefully.
Do BOLD Correlations RevealLong-Range Patterns of Connectivity?
As pointed out earlier (see “Design and Analysis ofBOLD-fMRI Experiments” and “Artifacts and Noise”), theBOLD signal varies due to physiologic fluctuations.Beside heartbeat and respiration related changes theso-called “slow oscillations” (approximately 0.1 Hz) areobserved.110 It is currently debated whether theseoscillations are vascular or neuronal in origin. The vas-cular hypothesis refers to brain blood pressure auto-regulation, with 0.1 Hz as the mean frequency of theautoregulation, so that the vascular system acts as afrequency filter at 0.1 Hz. Thus, according to this view,correlations of these oscillations reveal only vascularsymmetry.
However, a growing number of studies are now usingBOLD baseline fluctuations in order to find modularneuronal networks in the brain.205 The basis for this isthe assumption that neuronal connectivity is reflected byBOLD signal fluctuations.Neuronal connected areas havesimultaneous fluctuations in baseline activity and thus
should create temporally correlated fluctuations inBOLD signal. However, although this is certainly true,until now no estimation exists of the magnitude and thefrequency of these BOLD fluctuations. Therefore, resultsof this approach should be interpreted cautiously.
Spatial and Temporal Resolution
The transformation of neuronal signals to vasculardynamics may lead to information loss:
1. Qualitatively: Different dimensions of neuronalprocesses like inhibition and excitation or pre-synaptic and post-synaptic activity are transformedinto vascular changes. Clever experimental designsare needed in order to recover this information anddistinguish these processes from measured vascularchanges.
2. Time domain: The vascular response is on the orderof one second, whereas the neuronal changes are onthe order of milliseconds. Thus, neuronal changesare averaged and temporally blurred in the vasculardomain. However, as noted above, Ogawa et al haveshown that using two-pulse stimulation of 10 ms dura-tion the amplitude of the vascular changes can encodeneuronal changes which are separated by only a fewmilliseconds.180 This idea needs further elaborationand more experiments are required to elucidate thetemporal limits of fMRI. In particular, interactionanalysis and nonlinearities seem to provide a versatiletool to improve the temporal limits of fMRI.
3. Spatial domain: It is not clear what the minimumspatial scale is for the vascular changes to occur. In theolfactory cortex it was shown by Chaigneau andcolleagues in 2003 with two-photon optical imagingthat capillaries 100 µm remote from the activated areaare not showing any stimulus-correlated change.206 Ina recent review, Iadecola pointed out that this findingis an argument against diffusion-controlled changes inCBF and an argument for direct control of CBF byneurons. This direct control can be employed byinterneurons, which integrate the neuronal activity inlocal neuronal circuits.207
Harrison et al showed that vascular imaging signalscorrespond well with the underlying vascular structureas shown in Figure 9-21.208 However, the translation ofthe neuronal activity to CBF response introduces spatialblurring. It is often assumed that CBF changes areactively controlled by the arterioles. The feeding regionof an arteriole is on the order of a millimeter,207 i.e.,changes of neuronal activity within different neuronalpopulations in the “receptive field” of the same arteriolecannot be spatially separated by fMRI signals. Thus, fMRIsignals reflect activity of a population of neurons, anda subpopulation of these neurons cannot be spatiallyresolved by fMRI. In addition, due to intravascularsignaling, arterial blood vessels upstream from thelocation of the neuronal activity also dilate. This effect iscalled retrograde vasodilation,207 introducing furtherspatial blurring.
C H A P T E R 9 ■ BASIC PRINCIPLES OF FUNCTIONAL MRI 283
Ch009.qxd 14/7/05 12:45 PM Page 283

Beyond the CBF response the “initial dip” (see “Whatis the Significance of the Transients of the BOLD Signal?”)has been suggested as a way to improve the spatialresolution of imaging signals. The dip is thought to beproduced by initial oxygen consumption, and so mightbe more precisely located than the ensuing CBF andBOLD changes. Kim and colleagues have measuredcortical columns in the visual cortex of cats with a func-tional distance of the columns of approximately 1 mm.209
However,Logothetis,who has shown that the “early fMRIsignal”was also found in the sagittal sinus,challenged theinterpretation of this study.210 Studies in monkeys176,211
found correlation between neuronal activity and BOLDin parenchyma, but this decreased close to large vessels.For typical fMRI in humans with imaging resolution3 mm × 3 mm × 3 mm, the inclusion of small drainingveins in the imaging voxel does not unduly skew therepresentation of neuronal activity. As resolution isincreased, steps need to be taken to reduce the influenceof large vessels. At higher fields, the use of spin-echoacquisition123 or diffusion weighting during a BOLDexperiment reduces the signal contribution fromlarge veins.
In a different study, Kim et al measured the spatialcorrelation of single- and multi-unit activity with BOLDsignal and found a linear relationship between thesesignals when the voxel size is greater than approxi-mately 3 × 3 mm2. Because most studies utilize voxelsize greater than this value, the BOLD signal reflectsaccurately the underlying neuronal signal.212 Finally, arecent study using ASL techniques was able to resolve
cortical columns, suggesting fairly tight spatial control ofCBF.213 In sum, the limits of the spatial resolution of theCBF and BOLD response are not well understood andneed further investigation.
R E F E R E N C E S
1. Pauling L, Coryell CD: The magnetic properties and structure of hemoglobin,oxyhemoglobin, and carbonmonoxyhemoglobin. Proc Natl Acad Sci USA22:210-216, 1936.
2. Thulborn KR, Waterton JC, Matthews PM, Radda GK: Oxygenationdependence of the transverse relaxation time of water protons in whole bloodat high field. Biochim Biophys Acta 714:265-270, 1982.
3. Kwong KK, Belliveau JW, Chester DA, et al: Dynamic magnetic resonanceimaging of human brain activity during primary sensory stimulation. ProcNatl Acad Sci USA 89:5675-5679, 1992.
4. Ogawa S, Lee TM, Nayak AS, Glynn P: Oxygenation-sensitive contrast inmagnetic resonance image of rodent brain at high magnetic fields. MagnReson Med 14:68-78, 1990.
5. Ogawa S, Tank DW, Menon R, et al: Intrinsic signal changes accompanyingsensory stimulation: functional brain mapping with magnetic resonanceimaging. Proc Natl Acad Sci USA 89:5951-5955, 1992.
6. Frahm J, Bruhn H, Merboldt KD, et al: Dynamic MR imaging of human brainoxygenation during rest and photic stimulation. J Magn Reson Imaging2:501-505, 1992.
7. Bandettini PA, Wong EC, Hinks RS, et al: Time course EPI of human brainfunction during task activation. Magn Reson Med 25:390-397, 1992.
8. Turner R, Le Bihan D, Moonen CT, et al: Echo-planar time course MRI ofcat brain oxygenation changes. Magn Reson Med 27:159-166, 1991.
9. Turner R, Jezzard P, Wen H, et al: Functional mapping of the human visualcortex at 4 and 1.5 tesla using deoxygenation contrast EPI. Magn Reson Med29:277-279, 1993.
10. Constable RT, McCarthy G, Allison T, et al: Functional brain imaging at 1.5T using conventional gradient echo MR imaging techniques. Magn ResonImaging 11:451-459, 1993.
11. Sereno MI, Dale AM, Reppas JB, et al: Functional MRI reveals borders ofmultiple visual areas in humans. Science 268: 889-893, 1995.
12. Engel SA, Rumelhart DE, Wandell BA, et al: fMRI of human visual cortex.Nature 369:525, 1994.
13. Erecinska M, Silver IA: Ions and energy in mammalian brain. Prog Neurobiol43:37-71, 1994.
14. Ames A III: CNS energy metabolism as related to function. Brain Res BrainRes Rev 34:42-68, 2000.
15. Attwell D, Laughlin SB: An energy budget for signaling in the grey matter ofthe brain. J Cereb Blood Flow Metab 21:1133-1145, 2001.
16. Attwell D, Iadecola C: The neural basis of functional brain imaging signals.Trends Neurosci 25:621-625, 2002.
17. Ido Y, Chang K, Woolsey TA, Williamson JR, et al: NADH: sensor of bloodflow need in brain, muscle and other tissues. FASEB J 15:1419-1421, 2001.
18. Shulman RG, Hyder F, Rothman DL: Lactate efflux and the neuroenergeticbasis of brain function. NMR Biomed 14:389-396, 2001.
19. Grubb RL, Raichle MF, Eichling JO, Ter-Pogossian MM: The effects of changesin PaCO2 on cerebral blood volume, blood flow, and vascular mean transittime. Stroke 5:630-639, 1974.
20. Buxton RB, Wong EC, Frank LR: Dynamics of blood flow and oxygenationchanges during brain activation: the balloon model. Magn Reson Med39:855-864, 1998.
21. Mandeville JB, Marota JJ, Ayata C, et al: Evidence of a cerebrovascular post-arteriole Windkessel with delayed compliance. J Cereb Blood Flow Metab19:679-689, 1999.
22. Fox PT, Mintum MA, Raichle ME, et al: Mapping the visual cortex withpositron emission tomography. Nature 323:806-809, 1986.
23. Mandeville JB, Marota JJ, Ayata C, et al: MRI measurement of the temporalevolution of relative CMRO2 during rat forepaw stimulation. Magn ResonMed 42:944-951, 1999.
24. Lee SP, Duong TQ, Yang G, et al: Relative changes of cerebral arterial andvenous blood volumes during increased cerebral blood flow: implications forBOLD fMRI. Magn Reson Med 45:791-800, 2001.
25. Hyder F, Rothman DL, Shulman RG: Total neuroenergetics support localizedbrain activity: implications for the interpretation of fMRI. Proc Natl Acad SciUSA, 99:10771-10776, 2002.
26. Buxton RB: The elusive initial dip. Neuroimage 13:953-958, 2001.27. Villringer A, Dirnagl U: Coupling of brain activity and cerebral blood flow:
basis of functional neuroimaging. Cerebrovasc Brain Metab Rev 7:240-276,1995.
28. Rothman DL, Behar KL, Hyder F, Shulman RG: In vivo NMR studies of theglutamate neurotransmitter flux and neuroenergetics: Implications for brainfunction. Annu Rev Physiol 65:401-427, 2003.
29. Magistretti PJ, Pellerin L, Rothman DL, Shulman RG: Energy on demand.Science 283:496-497, 1999.
284 S E C T I O N I ■ PHYSICS, INSTRUMENTATION, AND ADVANCED TECHNIQUES
F I G U R E 9-21
Vascular structure of a chinchilla measured with corrosion casts and regionof changes in the imaging signal (top right, inset). Vascular imaging signalscorrespond well with the underlying structure of the vasculature. (Adaptedfrom Harrison RV, et al: Blood capillary distribution correlates withhemodynamic-based functional imaging in cerebral cortex. Cereb Cortex12:225-233, 2002, by permission of Oxford University Press.)
Ch009.qxd 14/7/05 12:45 PM Page 284

30. Zonta M, Angulo MC, Gobbo S, et al: Neuron-to-astrocyte signaling is centralto the dynamic control of brain microcirculation. Nat Neurosci 6:43-50,2003.
31. Fields RD, Stevens-Graham B: New insights into neuron-glia communica-tion. Science 298:556-562, 2002.
32. Erecinska M, Silver IA: Metabolism and role of glutamate in mammalianbrain. Prog Neurobiol 35:245-296, 1990.
33. Nedergaard M, Ransom B, Goldman SA: New roles for astrocytes: redefiningthe functional architecture of the brain. Trends Neurosci 26:523-530, 2003.
34. Chih CP, Lipton P, Roberts EL Jr: Do active cerebral neurons really use lactaterather than glucose? Trends Neurosci 24:573-578, 2001.
35. Fox PT, Raichle ME: Focal physiological uncoupling of cerebral blood flowand oxidative metabolism during somatosensory stimulation in humansubjects. Proc Natl Acad Sci USA 83:1140-1144, 1986.
36. Buxton RB, Frank LR: A model for the coupling between cerebral blood flowand oxygen metabolism during neural stimulation. J Cereb Blood FlowMetab 17:64-72, 1997.
37. Buxton RB: Coupling between CBF and CMRO2 during neuronal activity.In Tomita M, Kanno I, Hamel E (eds): Brain Activation and CBF Control.Amsterdam: Elsevier Science, 2002, pp 23-32.
38. Gjedde A, Poulsen PH, Ostergaard L: On the oxygenation of hemoglobin inthe human brain. Adv Exp Med Biol 471:67-81, 1999.
39. Gjedde A: Cerebral blood flow change in arterial hypoxemia is consistentwith negligible oxygen tension in brain mitochondria. Neuroimage 17:1876-1881, 2002.
40. Hyder F, Shulman RG, Rothman DL: A model for the regulation of cerebraloxygen delivery. J Appl Physiol 85:554-564, 1998.
41. Seitz RJ, Roland PE: Vibratory stimulation increases and decreases theregional cerebral blood flow and oxidative metabolism: a positron emissiontomography (PET) study. Acta Neurol Scand 86:60-67, 1992.
42. Marrett S, Gjedde A: Changes of blood flow and oxygen consumption invisual cortex of living humans. Adv Exp Med Biol 413:205-208, 1997.
43. Davis TL, Kwong KK, Weisskoff RM, Rosen BR: Calibrated functional MRI:mapping the dynamics of oxidative metabolism. Proc Natl Acad Sci USA95:1834-1839, 1998.
44. Hoge RD, Atkinson J, Gill B, et al: Linear coupling between cerebral bloodflow and oxygen consumption in activated human cortex. Proc Natl Acad SciUSA 96:9403-9408, 1999.
45. Kim SG, Rostrup E, Larsson HB, et al: Determination of relative CMRO2
from CBF and BOLD changes: significant increase of oxygen consumptionrate during visual stimulation. Magn Reson Med 41:1152-1161, 1999.
46. Kastrup A, Kruger G, Neuman-Haefelin T, et al: Changes of cerebral bloodflow, oxygenation, and oxidative metabolism during graded motor activation.Neuroimage 15:74-82, 2002.
47. Springett R, Wylezinska M, Cady EB, et al: Oxygen dependency of cerebraloxidative phosphorylation in newborn piglets. J Cereb Blood Flow Metab20:280-289, 2000.
48. Kastrup A, Kruger G, Glover GH, et al: Assessment of cerebral oxidativemetabolism with breath holding and fMRI. Magn Reson Med 42:608-611,1999.
49. Brown GG, Eyler Zorrilla LT, Georgy B, et al: BOLD and perfusion responseto finger-thumb apposition after acetazolamide administration: Differentialrelationship to global perfusion. J Cereb Blood Flow Metab 23:829-837,2003.
50. Hoge RD, Atkinson J, Gill B, et al: Investigation of BOLD signal dependenceon cerebral blood flow and oxygen consumption: the deoxyhemoglobindilution model. Magn Reson Med 42:849-863, 1999.
51. Kennan RP, Zhong J, Gore JC: Intravascular susceptibility contrastmechanisms in tissues. Magn Reson Med 31:9-21, 1994.
52. Fisel CR, Ackerman JL, Buxton RB, et al: MR contrast due to microscopicallyheterogeneous magnetic susceptibility: numerical simulations and applica-tions to cerebral physiology. Magn Reson Med 17:336-347, 1991.
53. Hardy PA, Henkleman RM: On the transverse relaxation rate enhancementinduced by diffusion of spins through inhomogeneous fields. Magn ResonMed 17:348-356, 1991.
54. Boxerman JL, Hamberg LM, Rosen BR, Weisskoff RM: MR contrast dueto intravascular magnetic susceptibility perturbations. Magn Reson Med34:555-566, 1995.
55. Yablonsky DA, Haacke EM: Theory of NMR signal behavior in magneticallyinhomogenous tissues: the static dephasing regime. Magn Reson Med32:749-763, 1994.
56. Weisskoff RM: Basic theoretical models of BOLD signal change. InBandettini PA, Moonen CTW (eds): Functional MRI. Berlin: Springer, 1999.
57. Boxerman JL, Bandettini PA, Kwong KK, et al: The intravascular contribu-tion to fMRI signal change: Monte Carlo modeling and diffusion-weightedstudies in vivo. Magn Reson Med 34:4-10, 1995.
58. Oja JME, Gillen J, Kauppinen RA, et al: Venous blood effects in spin-echofMRI of human brain. Magn Reson Med 42:617-626, 1999.
59. van Zijl PC, Eleff SM, Ulatowski JA, et al: Quantitative assessment of bloodflow, blood volume and blood oxygenation effects in functional magneticresonance imaging. Nat Med 4:159-167, 1998.
60. Ogawa S, Menon RS, Tank DW, et al: Functional brain mapping by bloodoxygenation level-dependent contrast magnetic resonance imaging: acomparison of signal characteristics with a biophysical model. Biophys J64:803-812, 1993.
61. Gati JS, Menon RS, Ugurbil K, Rutt BK: Experimental determination of theBOLD field strength dependence in vessels and tissue. Magn Reson Med38:296-302, 1997.
62. Mandeville JB, Marota JJ, Kosofsky BE, et al: Dynamic functional imaging ofrelative cerebral blood volume during rat forepaw stimulation. Magn ResonMed 39:615-624, 1998.
63. Menon RS, Ogawa S, Hu X, et al: BOLD based functional MRI at 4 teslaincludes a capillary bed contribution: echo-planar imaging correlates withprevious optical imaging using intrinsic signals. Magn Reson Med 33:453-459, 1995.
64. Hu X, Le TH, Ugurbil K: Evaluation of the early response in fMRI in indi-vidual subjects using short stimulus duration. Magn Reson Med 37:877-884,1997.
65. Yacoub E, Hu X: Detection of the early negative response in fMRI at 1.5T.Magn Reson Med 41:1088-1092, 1999.
66. Yacoub E, Le TH, Ugurbil K, Hu X: Further evaluation of the initial negativeresponse in functional magnetic resonance imaging. Magn Reson Med41:436-441, 1999.
67. Yacoub E, Hu X: Detection of the early decrease in fMRI signal in the motorarea. Magn Reson Med 45:184-190, 2001.
68. Ernst T, Hennig J: Observation of a fast response in functional MR. MagnReson Med 32:146-149, 1994.
69. Malonek D, Grinvald A: Interactions between electrical activity and corticalmicrocirculation revealed by imaging spectroscopy: implications for func-tional brain mapping. Science 272:551-554, 1996.
70. Vanzetta I, Grinvald A: Evidence and lack of evidence for the initial dip inthe anesthetized rat: implications for human functional brain imaging.Neuroimage 13:959-967, 2001.
71. Mayhew J, Johnston D, Martindale J, et al: Increased oxygen consumptionfollowing activation of brain: theoretical footnotes using spectroscopic datafrom barrel cortex. Neuroimage 13:975-987, 2001.
72. Lindauer U, Royl G, Leithner C, et al: No evidence for early decrease in bloodoxygenation in rat whisker cortex in response to functional activation.Neuroimage 13:988-1001, 2001.
73. Devor A, Dunn AK, Andermann ML, et al: Coupling of total hemoglobinconcentration, oxygenation, and neural activity in rat somatosensory cortex.Neuron 39:353-359, 2003.
74. Friston KJ, et al: Statistical parametric maps in functional imaging: A generallinear approach. Hum Brain Mapping 2:189-210, 1995.
75. D’Esposito M, Deouell LY, Gazzaley A: Alterations in the BOLD fMRI signalwith ageing and disease: a challenge for neuroimaging. Nat Rev Neurosci4:863-872, 2003.
76. Bandettini PA, Jesmanowicz A, Wong EC, et al: Processing strategies for time-course data sets in functional MRI of the human brain. Magn Reson Med30:161-173, 1993.
77. Jezzard P: Physiological noise: Strategies for correction. In Moonen CTW,Bandettini PA (eds): Functional MRI. Berlin: Springer-Verlag, 1999, pp 173-181.
78. Friston KJ, Jezzard P, Turner R: Analysis of functional MRI time-series.Hum Brain Mapping 1:153-171, 1994.
79. Buckner RL, Bandettini PA, O’Craven KM, et al: Detection of corticalactivation during averaged single trials of a cognitive task using functionalmagnetic resonance imaging. Proc Natl Acad Sci USA 93:14878-14883, 1996.
80. Buckner RL, Goodman J, Burock M, et al: Functional-anatomic correlates ofobject priming in humans revealed by rapid presentation event-related fMRI.Neuron 20:285-296, 1998.
81. Burock MA, Buckner RL, Woldorff MG, et al: Randomized event-relatedexperimental designs allow for extremely rapid presentation rates usingfunctional MRI. NeuroReport 9:3735-3739, 1998.
82. Dale AM: Optimal experimental design for event-related fMRI. Hum BrainMapping 8:109-114, 1999.
83. Dale AM, Buckner RL: Selective averaging of rapidly presented individualtrials using fMRI. Hum Brain Mapping 5:329-340, 1997.
84. Friston KJ, Fletcher P, Josephs O, et al: Event-related fMRI: characterizingdifferential responses. Neuroimage 7:30-40, 1998.
85. Friston KJ, Josephs O, Rees G, Turner R: Non-linear event related responsesin fMRI. Magn Reson Med 39:41-52, 1998.
86. Friston KJ, Zarahn E, Josephs O, et al: Stochastic designs in event-relatedfMRI. Neuroimage 10:607-619, 1999.
87. Josephs O, Turner R, Friston KJ: Event related fMRI. Hum Brain Mapping5:243-248, 1997.
88. Zarahn E, Aguirre G, D’Esposito M: A trial based experimental design forfMRI. Neuroimage 5:179-197, 1997.
89. Liu TT, Frank LR, Wong EC, Buxton RB: Detection power, estimation efficiency,and predictability in event-related fMRI. Neuroimage 13:759-773, 2001.
90. Buracas GT, Boynton GM: Efficient design of event-related fMRI experi-ments using M-sequences. Neuroimage 16:801-813, 2002.
91. Liu TT, Frank LR: Efficiency, power, and entropy in event-related FMRI withmultiple trial types. Part I: theory. Neuroimage 21:387-400, 2004.
92. Liu TT: Efficiency, power, and entropy in event-related fMRI with multipletrial types. Part II: design of experiments. Neuroimage 21:401-413, 2004.
93. Van Kylen J, Jesmanowicz A, Wong EC, Hyde JS: Material influencedsusceptibility induced phase shifts. Presented at the third meeting of theInternational Society for Magnetic Resonance in Medicine: p 762, May 1995,Nice, France.
C H A P T E R 9 ■ BASIC PRINCIPLES OF FUNCTIONAL MRI 285
Ch009.qxd 14/7/05 12:45 PM Page 285

94. Tyszka JM, Mamelak AN: Quantification of B0 homogeneity variation withhead pitch by registered three-dimensional field mapping. J Magn Reson159:213-218, 2002.
95. Wilson JL, Jenkinson M, Jezzard P: Protocol to determine the optimalintraoral passive shim for minimisation of susceptibility artifact in humaninferior frontal cortex. Neuroimage 19:1802-1811, 2003.
96. Wilson JL, Jezzard P: Utilization of an intra-oral diamagnetic passive shim infunctional MRI of the inferior frontal cortex. Magn Reson Med 50:1089-1094, 2003.
97. Jezzard P, Balaban RS: Correction for geometric distortion in echo planarimages from B0 field distortions. Magn Reson Med 34:65-73, 1995.
98. Reber PJ, Wong EC, Buxton RB, Frank LR: Correction of off resonance-related distortion in echo-planar imaging using EPI-based field maps. MagnReson Med 39:328-330, 1998.
99. Woods RP, Grafton ST, Holmes CJ, et al: Automated image registration: I.General methods and intrasubject, intramodality validation. J Comput AssistTomogr 22:139-152, 1998.
100. Woods RP, Grafton ST, Watson JD, et al: Automated image registration: II.Intersubject validation of linear and nonlinear models. J Comput AssistTomogr 22:153-165, 1998.
101. Weisskoff RM, Baker J, Belliveau J, et al: Paper presented at the 12th meetingof the Society for Magnetic Resonance in Medicine: p 7, May 1993, New York.
102. Jezzard P, Lebihan D, Cuenod C, et al: Paper presented at the 12th meetingof the Society for Magnetic Resonance in Medicine: p 1392, May 1993,New York.
103. Purdon PL, Weisskoff RM: Effect of temporal autocorrelation due tophysiological noise and stimulus paradigm on voxel-level false-positive ratesin fMRI. Hum Brain Mapping 6:239-249, 1998.
104. Peltier SJ, Noll DC: Systematic noise compensation for simultaneous multi-slice acquisition using rosette trajectories (SMART). Magn Reson Med41:1073-1076, 1999.
105. Stenger VA, Peltier S, Boada FE, Noll DC: 3D spiral cardiac/respiratoryordered fMRI data acquisition at 3 Tesla. Magn Reson Med 41:983-991, 1999.
106. Ehman RL, Felmlee JP: Adaptive technique for high-definition MR imagingof moving structures. Radiology 173:255-263, 1989.
107. Hu X, Kim S-G: Reduction of signal fluctuations in functional MRI usingnavigator echoes. Magn Reson Med 31:495-503, 1994.
108. Hu X, Le TH, Parrish T, Erhard P: Retrospective estimation and correction ofphysiological fluctuation in functional MRI. Magn Reson Med 34:201-212,1995.
109. Britt RH, Rossi GT: Quantitative analysis of methods for reducing physi-ological brain pulsations. J Neurosci Methods 6:219-229, 1982.
110. Obrig H, Neufang M, Wenzel R, et al: Spontaneous low frequency oscillationsof cerebral hemodynamics and metabolism in human adults. Neuroimage12:623-639, 2000.
111. Smith AM, Lewis BK, Ruttimann UE, et al: Investigation of low frequencydrift in fMRI signal. Neuroimage 9:526-533, 1999.
112. Guimaraes AR, Melcher JR, Talavage TM, et al: Imaging subcortical auditoryactivity in humans. Hum Brain Mapping 6:33-41, 1998.
113. Biswal B, DeYoe AE, Hyde JS: Reduction of physiological fluctuations infMRI using digital filters. Magn Reson Med 35:107-113, 1996.
114. Frank LR, Buxton RB, Wong EC: Estimation of respiration-induced noisefluctuations from undersampled multislice fMRI data. Magn Reson Med45:635-644, 2001.
115. Mitra PP, Pesaran B: Analysis of dynamic brain imaging data. Biophys J76:691-708, 1999.
116. Glover GH, Li TQ, Ress D: Image-based method for retrospective correctionof physiological motion effects in fMRI: RETROICOR. Magn Reson Med44:162-167, 2000.
117. Andersen AH, Gash DM, Avison MJ: Principal component analysis of thedynamic response measured by fMRI: a generalized linear systems frame-work. Magn Reson Imaging 17:795-815, 1999.
118. McKeown MJ, Hansen LK, Sejnowsk TJ: Independent component analysis offunctional MRI: what is signal and what is noise? Curr Opin Neurobiol13:620-629, 2003.
119. Weisskoff RM: Simple measurement of scanner stability for functional NMRimaging of activation in the brain. Magn Reson Med 36:643-645, 1996.
120. Frackowiak RSJ, Lenzi GL, Jones T, Heather JD: Quantitative measurementof regional cerebral blood flow and oxygen metabolism in man using 15Oand positron emission tomography: theory, procedure, and normal values.J Comput Assist Tomogr 4:727-736, 1980.
121. Detre JA, Leigh JS, Williams DS, Koretsky AP: Perfusion imaging. MagnReson Med 23:37-45, 1992.
122. Wong EC, Buxton RB, Frank LR: Implementation of quantitative perfusionimaging techniques for functional brain mapping using pulsed arterial spinlabeling. NMR Biomed 10:237-249, 1997.
123. Lee SP, Silva AC, Kim SG: Comparison of diffusion-weighted high-resolutionCBF and spin-echo BOLD fMRI at 9.4 T. Magn Reson Med 47:736-741, 2002.
124. Buxton RB, Frank LR, Wong EC, et al: A general kinetic model for quanti-tative perfusion imaging with arterial spin labeling. Magn Reson Med40:383-396, 1998.
125. Buxton RB: Introduction to Functional Magnetic Resonance Imaging:Principles and Techniques. Cambridge: Cambridge University Press, 2002.
126. Hoge R, et al: Flow-metabolism regulation during brain activation and respi-ratory manipulations. In Tomita M, Kanno I, Hamel E (eds): Brain Activationand CBF Control. Amsterdam: Elsevier Science BV, 2002, pp 33-38.
127. Belliveau JW, Kennedy DN, Mackinstry RC, et al: Functional mapping of thehuman visual cortex by magnetic resonance imaging. Science 254:716-719,1991.
128. Lia TQ, Guang Chen Z, Ostergaard L, et al: Quantification of cerebral bloodflow by bolus tracking and artery spin tagging methods. Magn Reson Imaging18:503-512, 2000.
129. Dubowitz DJ, Bernheim KA, Chen DY, et al: Enhancing fMRI contrast inawake-behaving primates using intravascular magnetite dextrannanoparticles. Neuroreport 12:2335-2340, 2001.
130. Leite FP, Tsao D, Vanduffel W, et al: Repeated fMRI using iron oxide contrastagent in awake, behaving macaques at 3 Tesla. Neuroimage 16:283-294, 2002.
131. Vanduffel W, Fize D, Mandeville JB, et al: Visual motion processing inves-tigated using contrast agent-enhanced fMRI in awake behaving monkeys.Neuron 32:565-577, 2001.
132. Liu TT, Luh W-M, Wong EC, et al: A method for dynamic measurementof blood volume with compensation for T2 changes. In Proceedings ofInternational Society for Magnetic Resonance in Medicine, May 2000, Denver.
133. Wong EC, Buxton RB, Frank LR: A method for dynamic imaging of bloodvolume. In Fifth Meeting, International Society for Magnetic Resonance inMedicine, May 1997, Vancouver.
134. Lu H, Golay X, Pekar JJ, et al: Functional magnetic resonance imagingbased on changes in vascular space occupancy. Magn Reson Med 50:263-274,2003.
135. Wong EC, Liu TT, Luh WM, et al: T1 and T2 selective method for improvedSNR in CSF-attenuated imaging: (T2FLAIR). Magn Reson Med 45:529-532,2001.
136. Frahm J, Kruger G, Merboldt KD, et al: Dynamic uncoupling and recouplingof perfusion and oxidative metabolism during focal activation in man.Magn Reson Med 35:143-148, 1996.
137. Prichard J, Rothman D, Novotny E, et al: Lactate rise detected by 1H NMR inhuman visual cortex during physiologic stimulation. Proc Natl Acad Sci USA88:5829-5831, 1991.
138. Hu Y, Wilson GS: A temporary local energy pool coupled to neuronal activity:fluctuations of extracellular lactate levels in rat brain monitored with rapid-response enzyme-based sensor. J Neurochem 69:1484-1490, 1997.
139. Kuhr WG, Korf J: Extracellular lactic acid as an indicator of brainmetabolism: continuous on-line measurement in conscious, freely movingrats with intrastriatal dialysis. J Cereb Blood Flow Metab 8:130-137, 1988.
140. Madsen PL, Cruz NF, Sokoloff L, Dienel GA: Cerebral oxygen/glucose rationis low during sensory stimulation and rises above normal during recovery:excess glucose consumption during stimulation is not accounted for bylactate efflux from or accumulation in brain tissue. J Cereb Blood FlowMetab 19:393-400, 1999.
141. Kuwabara T, Watanabe H, Tsuji S, Yuasa T: Lactate rise in the basal gangliaaccompanying finger movements: a localized 1H-MRS study. Brain Res670:326-328, 1995.
142. Richards TL, Gates GA, Gardner JC, et al: Functional MR spectroscopy ofthe auditory cortex in healthy subjects and patients with sudden hearingloss. Am J Neuroradiol 18:611-620, 1997.
143. Richards TL, Duger SR, Corina D, et al: Dyslexic children have abnormalbrain lactate response to reading-related language tasks. Am J Neuroradiol20:1393-1398, 1999.
144. Richards TL, Corina D, Serafini S, et al: Effects of a phonologically driventreatment for dyslexia on lactate levels measured by proton MR spectroscopicimaging. Am J Neuroradiol 21:916-922, 2000.
145. Mangia S, Garreffa G, Bianciardi M, et al: The aerobic brain: lactate decreaseat the onset of neural activity. Neuroscience 118:7-10, 2003.
146. Janz C, Speck O, Hennig J: Time-resolved measurements of brain activationafter a short visual stimulus: new results on the physiological mechanisms ofthe cortical response. NMR Biomed 10:222-229, 1997.
147. Serafini S, Steury K, Richards T, et al: Comparison of fMRI and PEPSI duringlanguage processing in children. Magn Reson Med 45:217-225, 2001.
148. Le Bihan D: Looking into the functional architecture of the brain withdiffusion MRI. Nat Rev Neurosci 4:469-480, 2003.
149. Moseley ME, Mintorovitch J, Cohen Y, et al: Early detection of ischemicinjury: comparison of spectroscopy, diffusion-, T2-, and magnetic susceptibility-weighted MRI in cats. Acta Neurochir Suppl (Wien) 51:207-209, 1990.
150. Hossmann KA, Hoehn-Berlage M: Diffusion and perfusion MR imaging ofcerebral ischemia. Cerebrovasc Brain Metab Rev 7:187-217, 1995.
151. Sotak CH: The role of diffusion tensor imaging in the evaluation of ischemicbrain injury—a review. NMR Biomed 15:561-569, 2002.
152. Mori S, van Zijl PC: Fiber tracking: principles and strategies—a technicalreview. NMR Biomed 15:468-480, 2002.
153. Zhong J, Petroff OA, Prichard JW, Gore JC: Changes in water diffusion andrelaxation properties of rat cerebrum during status epilepticus. Magn ResonMed 30:241-246, 1993.
154. Cohen LB: Changes in neuron structure during action potential propagationand synaptic transmission. Physiol Rev 53:373-418, 1973.
155. Andrew RD, MacVicar BA: Imaging cell volume changes and neuronalexcitation in the hippocampal slice. Neuroscience 62:371-383, 1994.
286 S E C T I O N I ■ PHYSICS, INSTRUMENTATION, AND ADVANCED TECHNIQUES
Ch009.qxd 14/7/05 12:45 PM Page 286

156. Darquie A, Poline JB, Poupon C, et al: Transient decrease in water diffusionobserved in human occipital cortex during visual stimulation. Proc NatlAcad Sci USA 98:9391-9395, 2001.
157. Saleem KS, Pauls JM, Augath M, et al: Magnetic resonance imaging ofneuronal connections in the macaque monkey. Neuron 34:685-700, 2002.
158. Pautler RG, Koretsky AP: Tracing odor-induced activation in the olfactorybulbs of mice using manganese-enhanced magnetic resonance imaging.Neuroimage 16:441-448, 2002.
159. Pautler RG, Mongeau R, Jacobs RE: In vivo trans-synaptic tract tracing fromthe murine striatum and amygdala utilizing manganese enhanced MRI(MEMRI). Magn Reson Med 50:33-39, 2003.
160. Pautler RG, Silva AC, Koretsky AP: In vivo neuronal tract tracing usingmanganese-enhanced magnetic resonance imaging. Magn Reson Med40:740-748, 1998.
161. Van der Linden A, Verhoye M, van Meir V, et al: In vivo manganese-enhancedmagnetic resonance imaging reveals connections and functional propertiesof the songbird vocal control system. Neuroscience 112:467-474, 2002.
162. Kida I, Hyder F, Behar KL: Inhibition of voltage-dependent sodium channelssuppresses the functional magnetic resonance imaging response to forepawsomatosensory activation in the rodent. J Cereb Blood Flow Metab21:585-591, 2001.
163. Gruetter R: In vivo 13C NMR studies of compartmentalized cerebral carbo-hydrate metabolism. Neurochem Int 41:143-154, 2002.
164. Rothman DL: Studies of metabolic compartmentation and glucose transportusing in vivo MRS. NMR Biomed 14:149-160, 2001.
165. Duelli R, Kuschinsky W: Brain glucose transporters: relationship to localenergy demand. News Physiol Sci 16:71-76, 2001.
166. Harder DR, Zhang C, Gebremedhin D: Astrocytes function in matchingblood flow to metabolic activity. News Physiol Sci 17:27-31, 2002.
167. Zheng D, LaMantia AS, Purves D: Specialized vascularization of the primatevisual cortex. J Neurosci 11:2622-2629, 1991.
167a. Raichle ME, MacLeod AM, Snyder AZ, et al: A default mode of brainfunction. Proc Natl Acad Sci USA 98:676-682, 2001.
168. Fox PT, Raichle ME, Mintun MA, Dence C: Nonoxidative glucose consump-tion during focal physiologic neural activity. Science 241:462-464, 1988.
169. Sappey-Marinier D, Calabrese G, Fein G, et al: Effect of photic stimulation onhuman visual cortex lactate and phosphates using 1H and 31P magneticresonance spectroscopy. J Cereb Blood Flow Metab 12:584-592, 1992.
170. Shulman RG, Hyder F, Rothman DL: Cerebral energetics and the glycogenshunt: neurochemical basis of functional imaging. Proc Natl Acad Sci USA98:6417-6422, 2001.
171. Hertz L, Fillenz M: Does the “mystery of the extra glucose” during CNSactivation reflect glutamate synthesis? Neurochem Int 34:71-75, 1999.
172. Chih CP, Roberts EL Jr: Energy substrates for neurons during neural activity:a critical review of the astrocyte-neuron lactate shuttle hypothesis. J CerebBlood Flow Metab 23:1263-1281, 2003.
173. Rees G, Friston K, Koch C: A direct quantitative relationship between thefunctional properties of human and macaque V5. Nat Neurosci 3:716-723,2000.
174. Heeger DJ, Huk AC, Geisler WS, Albrecht DG: Spikes versus BOLD: whatdoes neuroimaging tell us about neuronal activity? Nat Neurosci 3:631-633,2000.
175. Lauritzen M, Gold L: Brain function and neurophysiological correlates ofsignals used in functional neuroimaging. J Neurosci 23:3972-3980, 2003.
176. Logothetis NK, Pauls J, Augath M, et al: Neurophysiological investigation ofthe basis of the fMRI signal. Nature 412:150-157, 2001.
177. Logothetis NK: The underpinnings of the BOLD functional magnetic reso-nance imaging signal. J Neurosci 23:3963-3971, 2003.
178. Caesar K, Thomsen K, Lauritzen M: Dissociation of spikes, synaptic activity,and activity-dependent increments in rat cerebellar blood flow by tonicsynaptic inhibition. Proc Natl Acad Sci USA 100:16000-16005, 2003.
179. Arthurs OJ, Williams EJ, Carpenter TA, et al: Linear coupling betweenfunctional magnetic resonance imaging and evoked potential amplitude inhuman somatosensory cortex. Neuroscience 101:803-806, 2000.
180. Ogawa S, Lee TM, Stepnoski R, et al: An approach to probe some neuralsystems interaction by functional MRI at neural time scale down tomilliseconds. Proc Natl Acad Sci USA 97:11026-11031, 2000.
181. Huettel SA, McKeown MJ, Song AW, et al: Linking hemodynamic andelectrophysiological measures of brain activity: evidence from functionalMRI and intracranial field potentials. Cereb Cortex 14:165-173, 2004.
182. Goldman RI, Stern JM, Engel J, Cohen MS: Simultaneous EEG and fMRI ofthe alpha rhythm. Neuroreport 13:2487-2492, 2002.
183. Beaulieu C, Colonnier M: A comparison of the number of neurons inindividual laminae of cortical areas 17, 18 and posteromedial suprasylvian(PMLS) area in the cat. Brain Res 339:166-170, 1985.
184. Magistretti PJ, Pellerin L: Cellular bases of brain energy metabolism andtheir relevance to functional brain imaging: evidence for a primary role ofastrocytes. Cerebral Cortex 6:50-61, 1996.
185. Uludag K, Dubowitz DJ, Yoder EJ, et al: Coupling of cerebral blood flow andoxygen metabolism during physiological activation and deactivationmeasured with fMRI. Neuroimage 23:148-155, 2004.
186. Ackermann RF, Finch DM, Babb TL, Engel J: Increased glucose metabolismduring long-duration recurrent inhibition of hippocampal pyramidal cells.J Neurosci 4:251-264, 1984.
187. Mathiesen C, Caesar K, Lauritzen M, et al: Modification of activity-dependent increases of cerebral blood flow by excitatory synaptic activity andspikes in rat cerebellar cortex. J Physiol 512:555-566, 1998.
188. Chatton JY, Pellerin L, Magistretti PJ: GABA uptake into astrocytes is notassociated with significant metabolic cost: implications for brain imaging ofinhibitory transmission. Proc Natl Acad Sci USA 100:12456-12461, 2003.
189. Waldvogel D, van Gelderen P, Muellbacher W, et al: The relative metabolicdemand of inhibition and excitation. Nature 406:995-998, 2000.
190. Allison JD, Meador KJ, Loring DW, et al: Functional MRI cerebral activationand deactivation during finger movement. Neurology 54:135-142, 2000.
191. Wobst P, Villringer A: Inhibition. In Tomita M, Kanno I, Hamel E (eds): BrainActivation and CBF Control. Amsterdam: Elsevier Science, 2002, pp 23-32.
192. Jones M, Berwick J, Johnston D, Mayhew J: Concurrent optical imagingspectroscopy and laser-Doppler flowmetry: the relationship between bloodflow, oxygenation, and volume in rodent barrel cortex. Neuroimage 13:1002-1015, 2001.
193. Thompson JK, Peterson MR, Freeman RD: Single-neuron activity and tissueoxygenation in the cerebral cortex. Science 299:1070-1072, 2003.
194. Boynton GM, Engel SA, Glover GH, Heeger DJ: Linear systems analysisof functional magnetic resonance imaging in human V1. J Neurosci 16:4207-4221, 1996.
195. Robson MW, Dorosz JL, Gore JC: Measurements of the temporal fMRIresponse of the human auditory cortex to trains of tones. Neuroimage7:185-198, 1998.
196. Glover GH: Deconvolution of impulse response in event-related fMRI.Neuroimage 9:416-429, 1999.
197. Vasquez AL, Noll DC: Nonlinear aspects of the BOLD response in functionalMRI. Neuroimage 7:108-118, 1998.
198. Birn RM, Saad ZS, Bandettini PA: Spatial heterogeneity of the nonlineardynamics in the FMRI BOLD response. Neuroimage 14: 817-826, 2001.
199. Miller KL, Luh WM, Liu TT, et al: Nonlinear temporal dynamics of thecerebral blood flow response. Hum Brain Mapping 13:1-12, 2001.
200. Friston KJ, Mechelli A, Turner R, Price CJ: Nonlinear responses in fMRI: theBalloon model, Volterra kernels, and other hemodynamics. Neuroimage12:466-477, 2000.
201. Behzadi Y, Restom K, Liu TT: Modeling the effect of baseline arteriolarcompliance on BOLD dynamics. Paper presented at the 12th ScientificMeeting of the International Society for Magnetic Resonance in Medicine,May 2004, Kyoto, Japan.
202. Baird AE, Warach S: Magnetic resonance imaging of acute stroke. J CerebBlood Flow Metab 18:583-609, 1998.
203. Obata T, Liu TT, Miller KL, et al: Discrepancies between BOLD and flowdynamics in primary and supplementary motor areas: application of theballoon model to the interpretation of BOLD transients. Neuroimage21:144-153, 2004.
204. Stark CE, Squire LR: When zero is not zero: the problem of ambiguousbaseline conditions in fMRI. Proc Natl Acad Sci USA 98:12760-12766, 2001.
205. Biswal B, Yetkin FZ, Haughton VM, Hyde JS: Functional connectivity in themotor cortex of resting human brain using echo planar MRI. Magn ResonMed 34:537-541, 1995.
206. Chaigneau E, Oheim M, Audinat E, Charpak S: Two-photon imaging ofcapillary blood flow in olfactory bulb glomeruli. Proc Natl Acad Sci USA100:13081-13086, 2003.
207. Iadecola C: Neurovascular regulation in the normal brain and in Alzheimer’sdisease. Nat Rev Neurosci 5:347-360, 2004.
208. Harrison RV, Harel N, Pansar J, Mount RJ: Blood capillary distributioncorrelates with hemodynamic-based functional imaging in cerebral cortex.Cereb Cortex 12:225-233, 2002.
209. Kim DS, Duong TQ, Kim SG: High-resolution mapping of iso-orientationcolumns by fMRI. Nat Neurosci 3:164-169, 2000.
210. Logothetis N: Can current fMRI techniques reveal the micro-architecture ofcortex? [letter; comment]. Nat Neurosci 3:413-414, 2000.
211. Disbrow EA, Slutsky DA, Roberts TP, Krubitzer LA: Functional MRI at1.5 tesla: a comparison of the blood oxygenation level-dependent signal andelectrophysiology. Proc Natl Acad Sci USA 97:9718-9723, 2000.
212. Kim DS, Ronen I, Olman C, et al: Spatial relationship between neuronalactivity and BOLD functional MRI. Neuroimage 21:876-885, 2004.
213. Duong TQ, Yacoub E, Adriany G, et al: Microvascular BOLD contributionat 4 and 7 T in the human brain: gradient-echo and spin-echo fMRI withsuppression of blood effects. Magn Reson Med 49:1019-1027, 2003.
C H A P T E R 9 ■ BASIC PRINCIPLES OF FUNCTIONAL MRI 287
Ch009.qxd 14/7/05 12:45 PM Page 287