ultrasound assisted extraction of bioactive compounds from ... · vigna nivetha),...
TRANSCRIPT

Arabian Journal of Chemistry (2017) 10, S1145–S1157
King Saud University
Arabian Journal of Chemistry
www.ksu.edu.sawww.sciencedirect.com
ORIGINAL ARTICLE
Ultrasound assisted extraction of bioactive
compounds from Nephelium lappaceum L. fruit peel
using central composite face centered response
surface design
* Corresponding author. Tel.: +91 4294 226606; fax: +91 4294
220087.
E-mail addresses: [email protected] (J. Prakash Maran),
[email protected] (S. Manikandan), [email protected] (C.
Vigna Nivetha), [email protected] (R. Dinesh).
Peer review under responsibility of King Saud University.
Production and hosting by Elsevier
http://dx.doi.org/10.1016/j.arabjc.2013.02.007
1878-5352 ª 2013 Production and hosting by Elsevier B.V. on behalf of King Saud University.
This is an open access article under the CC BY-NC-ND license (http://creativecommons.org/licenses/by-nc-nd/3.0/).
J. Prakash Maran a,*, S. Manikandan b, C. Vigna Nivetha a, R. Dinesh a
a Department of Food Technology, Kongu Engineering College, Perundurai, Erode 638 052, TN, Indiab Department of Food and Process Engineering, SRM University, SRM Nagar, Kattankulathur, Chennai 603 203, TN, India
Received 18 September 2012; accepted 4 February 2013
Available online 20 February 2013
KEYWORDS
Extraction;
Ultrasound;
Optimization;
Anthocyanin;
Phenolics;
Flavonoid
Abstract In this study, four factors at three level central composite face centered design was
employed to study and optimize the process variables on extraction of bioactive compounds (total
anthocyanin, phenolic and flavonoid content) from Nephelium lappaceum L. fruit peel. The effect of
process variables such as extraction temperature (30–50 �C), power of ultrasound (20–40 W),
extraction time (10–30 min) and solid–liquid ratio (1:10–1:20 g/ml) is studied. Multiple regression
analysis was done on the experimental data to develop second-order polynomial models with high
coefficient of determination value (R2 > 0.99). The optimal conditions based on both individual
and combinations of all process variables (extraction temperature of 50 �C, ultrasound power of
20 W, extraction time of 20 min and solid–liquid ratio of 1:18.6 g/ml) were determined by Derrin-
ger’s desired function methodology. Under these conditions, total anthocyanin (10.26 ± 0.39 (mg/
100 g)), phenolics (552.64 ± 1.57 (mg GAE/100 g)) and flavonoid (104 ± 1.13 (mg RE/100 g)) con-
tent values were determined and it is closely related with the predicted values (10.17 mg/100 g of
total anthocyanin, 546.98 mg GAE/100 g of total phenolics and 100.93 mg RE/100 g of total flavo-
noid content) and indicted the suitability of the developed models.ª 2013 Production and hosting by Elsevier B.V. on behalf of King Saud University. This is an open access
article under the CC BY-NC-ND license (http://creativecommons.org/licenses/by-nc-nd/3.0/).
1. Introduction
The globalization of the food industry has shown a highly
increasing demand for functional foods, value addition andreutilization of agricultural waste. Recently, there has been anincreasing interest in bioactive compounds from fruits, which
function as free radical scavengers. Pigments and polyphenolsare ubiquitous bioactive compounds which belong to a diversegroup of secondary metabolites and are universally present in
higher plants. In this prospect, phytochemicals have beenshown to possess significant antioxidant capacities that can

S1146 J. Prakash Maran et al.
protect human body from the aforementioned health problems.Interestingly, recent research has revealed that fruit peels andseeds, such as grape seeds and peel (Jayaprakasha et al., 2003;
Jayaprakasha et al., 2001; Negro et al., 2003), pomegranate peel(Singh et al., 2002), sweet orange peel (Anagnostopoulou et al.,2006) and mango seed kernel (Kabuki et al., 2000) may poten-
tially possess antioxidant and/or antimicrobial properties.The extraction of bioactive compounds frompermeable solid
plant materials using solvents constitutes an important step in
the manufacture of phytochemical-rich products. The biologi-cally functional phenolics from various plants were isolated byextraction methods such as maceration and soxhlet extraction.However, these conventional extractionmethods were generally
time-consuming and had low efficiency (Ma et al., 2008). Recentyears have seen an increasing demand for new extraction tech-niques enabling automation, shortening extraction times, and
reducing consumption of organic solvent. In contrast, ultra-sound in combinationwith conventional extraction is a potentialtechnique in enhancing the rates and extent of mass transfer to
and from the interfaces. The beneficial effects of ultrasoundare derived from itsmechanical effects on the process by increas-ing the penetration of solvent into the product due to disruption
of the cell walls produced by acoustical cavitation (Toma et al.,2001). Moreover, it is achieved at lower temperatures and hencemore suitable for enhancing the extraction of thermally unstablecompounds (Wu et al., 2001) as compared to conventionalmeth-
ods. Recently, ultrasound-assisted extraction (UAE) has beenwidely used in the extraction of phenolics from different vegeta-ble materials (Wang et al., 2008; Tiwari et al., 2010; Rostagno
et al., 2003, 2007; Toma et al., 2001; Rodrigues and Pinto, 2007).Nephelium lappaceum L. (rambutan) belongs to the family
Sapindaceae, which is common in Southeast Asia. Due to its
refreshing flavor and exotic appearance, this fruit is consumedas fresh, canned or processed. After being processed, the resi-dues such as seeds and peels were discarded. From the previous
findings, it was found that, the discarded peel of rambutanfruit comprises powerful phenolic antioxidants and scavengingactivities (Thitilertdecha et al., 2010; Okonogi et al., 2007;Khonkarn et al., 2010; Palanisamy et al., 2008;) and possess
various biological properties such as antibacterial and anti-herpes (Nawawi et al., 1999; Thitilertdecha et al., 2010).
Ultrasound-assisted extraction (UAE) is an ideal extraction
method capable of producing high quantities of bioactive com-pounds with a shorter extraction time. Development of an eco-nomical and efficient UAE technique for the separation of
biologically active compounds, such as pigments and polyphe-nols from rambutan fruit peel is an emerging interest in the bio-medical area and also creates novel opportunities to exploit itsvaluable properties. Hence, in this present work, four factors
with three level central composite face-centered design was usedto optimize and study the effects of extraction temperature,power of ultrasound, extraction time and solid–liquid ratio in
UAE on the maximum yield of total anthocyanin, phenolicand flavonoid content from rambutan fruit peel.
2. Materials and methods
2.1. Plant materials
Fresh fruits of rambutan (N. lappaceum L.) at the commercialmature stage were procured from a commercial fruit market
near Chennai, India on May 2012. Fruits were selected basedon their uniformity in shape and color. The fruits were washedthoroughly in potable water and then air-dried. Thick layer of
skin and thorns were peeled off from the fruits manually. Fruitpeels were washed thoroughly in running tap water to get ridof adhered impurities on the surface. The fruit peels were dried
in a vacuum oven at 40 �C until to obtain the constant weight.The dried peels were pulverized and sieved through a 40-meshsieve to obtain the powdered samples. Powder samples (mois-
ture content 12–14%) were stored in dark bags to prevent oxi-dation of active compounds due to sun light and kept in dryenvironment prior to the experiments.
2.2. Chemicals and reagents
Cyanidin-3-glucoside (C-3-G), gallic acid (GA) and rutin werepurchased from Sigma chemicals, Mumbai. Folin–Ciocalteu
reagent, sodium carbonate, Aluminum chloride, sodium nitriteand sodium hydroxide were obtained from Loba chemicals,Mumbai. All the chemicals used in this study are of analytical
and HPLC grade.
2.3. UAE of pigment and polyphenols
UAE was performed according to the method described byYing et al. (2011) in an ultrasonic bath (Power sonic, Korea)equipped with digital sonication power, time and temperaturecontroller with a useful volume of 10 L (internal dimensions:
30 · 24 · 15 cm) to carry out the extraction. About 10 g ofground powder was mixed with an appropriate quantity of dis-tilled water. Triplicate experiments were carried out according
to Table 1. After extraction, the extracts were centrifuged at2600g for 15 min (Remi R-24 Centrifuge, India) and filteredthrough a filter paper (Whatman No. 1, England). The ob-
tained supernatants (extracts) were collected in a screw-cappeddark glass container and stored in the refrigerator until furtheranalysis.
2.4. Total anthocyanin content
The total anthocyanin content (TAC) was estimated by a pHdifferential method which relies on the structural transforma-
tion of the anthocyanin chromophore as a function of pH va-lue (Giusti and Wrolstad, 2000), which can be measured usinga spectrophotometer (Shimadzu UV-1800, Kyoto, Japan). Ali-
quots of extracts were brought to pH 1.0 using potassium chlo-ride (0.025 M) and pH 4.5 using sodium acetate (0.4 M) andallowed to equilibrate for 1 h. The absorbance was recorded
at 530 and 700 nm using a spectrophotometer calibrated withdistilled water as the blank. The difference in absorbance be-tween pH values and wavelengths was calculated using the
formula:
A ¼ ðA530nm � A700nmÞpH 1:0 � ðA530nm � A700nmÞpH 4:5 ð1Þ
The total monomeric anthocyanin content was obtained by
TMA ¼ A�MW�DF� 1000
e� 1ð2Þ
where A is the absorbance, MW is the molecular weight ofcyanidin-3-glucoside (449.2 g mol�1), DF is the dilution factor,
e is the molar absorptivity of cyanidin-3-glucoside

Table 1 Uncoded and coded values of the independent variables and observed responses.
Run
order
Extraction temperature
(X1, C)
Power of ultrasound
(X2, W)
Extraction time (X3,
min)
Solid–liquid ratio (X4,
g/ml)
TAC (mg/
100 g)
TPC (mg GAE/
100 g)
TFC (mg RE/
100 g)
1 30 (�1) 40 (1) 10 (�1) 1:20 (1) 3.47 192.53 37.70
2 30 (�1) 20 (�1) 30 (1) 1:20 (1) 4.49 241.78 45.63
3 40 (0) 30 (0) 20 (0) 1:15 (0) 7.03 373.86 70.48
4 50 (1) 20 (�1) 30 (1) 1:20 (1) 7.76 421.68 77.72
5 40 (0) 40 (1) 20 (0) 1:15 (0) 6.85 362.28 68.60
6 40 (0) 30 (0) 30 (1) 1:15 (0) 5.07 264.62 50.01
7 30 (�1) 30 (0) 20 (0) 1:15 (0) 6.06 325.27 60.73
8 50 (1) 20 (�1) 10 (�1) 1:20 (1) 10.16 540.31 99.31
9 30 (�1) 20 (�1) 10 (�1) 1:10 (�1) 3.18 165.11 32.10
10 30 (�1) 40 (1) 30 (1) 1:10 (�1) 5.52 291.55 57.55
11 30 (�1) 20 (�1) 30 (1) 1:10 (�1) 3.92 207.47 39.66
12 50 (1) 20 (�1) 30 (1) 1:10 (�1) 7.53 405.45 76.36
13 50 (1) 40 (1) 30 (1) 1:20 (1) 6.92 369.01 67.96
14 50 (1) 30 (0) 20 (0) 1:15 (0) 9.89 527.95 98.85
15 30 (�1) 20 (�1) 10 (�1) 1:20 (1) 6.57 346.39 66.17
16 40 (0) 30 (0) 20 (0) 1:15 (0) 7.09 377.05 70.89
17 50 (1) 40 (1) 10 (�1) 1:20 (1) 7.58 405.10 78.25
18 50 (1) 40 (1) 10 (�1) 1:10 (�1) 7.55 407.51 77.84
19 40 (0) 30 (0) 20 (0) 1:20 (1) 7.37 391.94 73.69
20 50 (1) 20 (�1) 10 (�1) 1:10 (�1) 7.27 384.62 72.85
21 40 (0) 30 (0) 20 (0) 1:15 (0) 7.05 374.92 70.06
22 40 (0) 30 (0) 20 (0) 1:15 (0) 7.08 376.51 71.57
23 40 (0) 30 (0) 20 (0) 1:15 (0) 7.04 374.39 71.35
24 40 (0) 20 (�1) 20 (0) 1:15 (0) 7.27 389.62 72.69
25 30 (�1) 40 (1) 10 (�1) 1:10 (�1) 3.69 198.23 36.69
26 40 (0) 30 (0) 20 (0) 1:10 (�1) 7.14 379.71 71.50
27 40 (0) 30 (0) 10 (�1) 1:15 (0) 4.96 260.77 50.38
28 50 (1) 40 (1) 30 (1) 1:10 (�1) 9.72 512.91 98.65
29 40 (0) 30 (0) 20 (0) 1:15 (0) 7.07 375.98 71.29
30 30 (�1) 40 (1) 30 (1) 1:20 (1) 3.17 167.58 33.46
Ultra
soundassisted
extra
ctionofbioactiv
ecompoundsfro
mN.lappaceu
mL.fru
itpeel
S1147

S1148 J. Prakash Maran et al.
(26,900 L cm�1 mol�1), and 1 is for a standard 1 cm path
length. Total anthocyanins were reported in milligrams antho-cyanins per 100 g of fruit peel (mg cyanidin-3-glucoside/100 gfruit peel).
2.5. Total phenolic content
The total phenolic content (TPC) was measured by Folin–Ciocalteu method as described by Vatai et al. (2009) with min-
or modifications. A known amount of (0.5 ml) diluted samplewas mixed with 2.5 ml of Folin–Ciocalteu reagent (0.2 mol/L),and after 5 min, 2.0 ml of sodium carbonate (7.5 g/100 ml) was
added. The mixture was kept at room temperature for 2 h aftershaken and absorbance of the mixture was measured at754 nm against a reagent blank (0.5 ml distilled water instead
of the sample) with a UV–visible spectrophotometer (Elico,SL 244, India). Results were calculated on the basis of thecalibration curve of gallic acid and expressed as gallic acidequivalents (mg GAE/100 g). All samples were analyzed in
triplicates and the average values were calculated.
2.6. Total flavonoid content
Aluminum chloride assay method (Zhishen et al., 1999) wasused to determine the total flavonoid content (TFC) of thesamples. A known volume of extract (0.5 ml) was mixed with
distilled water to make 5 ml solution, and 0.3 ml 5% NaNO2
was added. After 5 min, 0.3 ml 10% AlCl3 was added. At6th min, 2 ml 1 M NaOH was added and the total volume
was made up to 10 ml with distilled water. The solution wasmixed well and the absorbance was measured at 510 nm. Totalflavonoid content was calculated on the basis of the calibrationcurve of rutin and expressed as rutin equivalents (mg RE/
100 g). All samples were analyzed in triplicates and the averagevalues were calculated.
2.7. Experimental design
Box-Wilson design, also called central composite design(CCD), is an experimental design used to achieve maximal
information about a process from a minimal number of exper-iments (Yang et al., 2009). In CCD, the central composite face-centered (CCFC) experimental design was used in this study to
determine the optimal conditions and study the effect of fourvariables (extraction temperature (�C), power of ultrasound(W), extraction time (min) and solid–liquid ratio (g/ml)) onthree responses (total anthocyanin content (TAC), total phe-
nolic content (TPC) and total flavonoid content (TFC)) ofultrasound-assisted N. lappaceum L. peel extracts. From thepreliminary experimental results, process variables and their
ranges (extraction temperature (30–50 �C), power of ultra-sound (20–40 W), extraction time (10–30 min) and solid–liquidratio (1:10–1:20 g/ml)) were determined. After selection of
independent variables and their ranges, experiments wereestablished based on a CCFC design with four factors at threelevels and each independent variable was coded at three levels
between �1, 0 and +1. The coding of the variables was doneby the following equation (Prakash Maran et al., 2013):
xi ¼Xi � Xz
DXi
i ¼ 1; 2; 3 . . . k ð3Þ
where xi, is the dimensionless value of an independent variable;
Xi, the real value of an independent variable; Xz, the real valueof an independent variable at the center point; and DXi, stepchange of the real value of the variable i corresponding to a
variation of a unit for the dimensionless value of the variablei. In this design, the star points are at the center of each faceof the factorial space, thus ±a =±1. The coded and uncodedindependent variables used in this study are listed in Table 1.
In this study, total number of 30 experiments (consisting of16 factorial points, eight star points and six replicates at thecenter points (in order to allow the estimation of pure error))
were carried out and the total number experiments were calcu-lated from the following equation (Azargohar and Dalai,2005):
N ¼ 2n þ 2nþ nc ð4Þ
where N is the total number of experiments required; n is thenumber of factors; and c is the number of center points.
The experimental sequence was randomized in order to
minimize the effects of unexpected variability in the responsesdue to extraneous factors. A second-order polynomial equa-tion was used in order to develop an empirical model whichcorrelated the responses to the independent variables. The gen-
eral form second order polynomial equation is
Y ¼ b0 þXkj¼1
bjXj þXkj¼1
bjjX2j þ
Xi
Xk<j¼2
bijXiXj þ ei ð5Þ
where Y is the response; Xi and Xj are variables (i and j rangefrom 1 to k); b0 is the model intercept coefficient; bj, bjj and bij
are interaction coefficients of linear, quadratic and the second-
order terms, respectively; k is the number of independentparameters (k= 4 in this study); and ei is the error (PrakashMaran et al., 2013).
2.8. Statistical analysis
The statistical analysis was performed using Design ExpertStatistical Software package 8.0.7.1 (Stat Ease Inc., Minneap-
olis, USA). The experimental data were analyzed by multipleregression analysis through the least square method. Two dif-ferent tests namely sequential sum of squares and model sum-
mary statistics were carried out on the experimental data inorder to find out adequacy of various models. The regressioncoefficients of all the terms (linear, quadratic, and interaction)
involved in the model and their effect were analyzed by Paretoanalysis of variance (ANOVA) and ANOVA tables were gen-erated. All the terms of the model were tested and verified sta-tistically by F-test at probability levels (p 6 0.05). Adequacy of
the developed models was tested by performing coefficient ofdetermination (R2), adjusted coefficient of determination(R2
adj) and predicted coefficient of determination (R2pre). After
fitting the models, surfaces and contour plots were constructedto predict the relationship between the independent variablesand responses.
2.9. Optimization
A numerical optimization technique (Derringer’s desired func-tion method) was employed for optimizing the various re-
sponses simultaneously involved in the UAE process. Thedesirability function method was applied for generating
Ultrasound assisted extraction of bioactive compounds from N. lappaceum L. fruit peel S1149
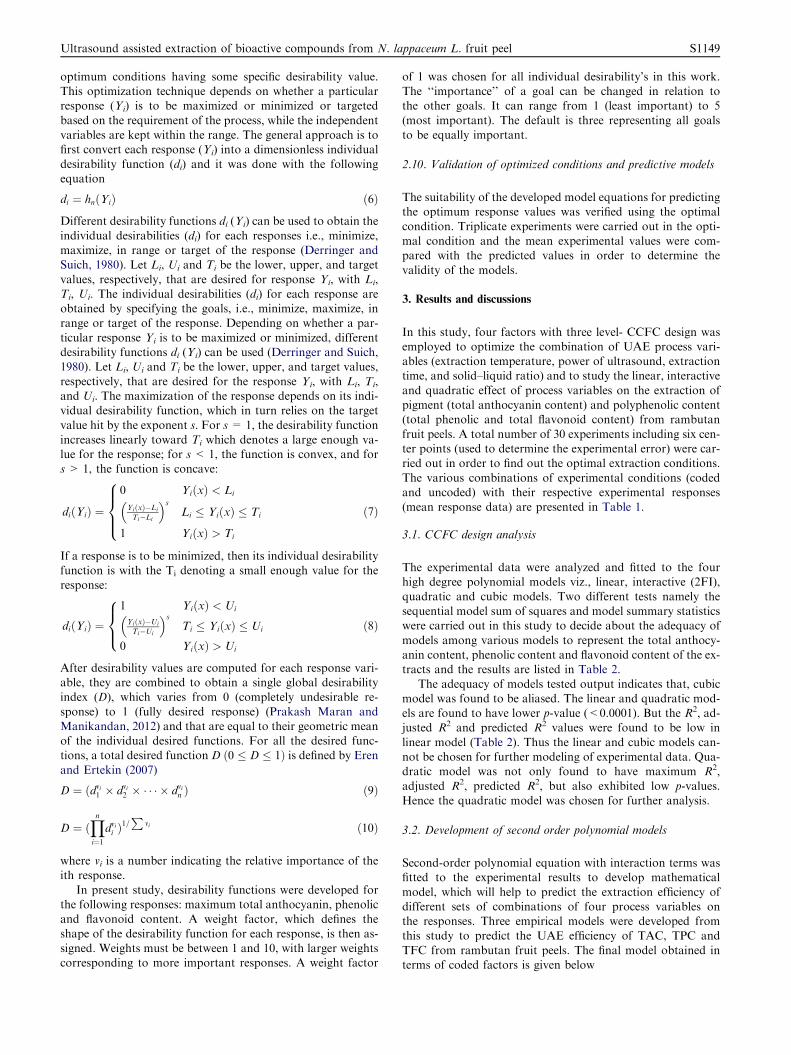
optimum conditions having some specific desirability value.This optimization technique depends on whether a particularresponse (Yi) is to be maximized or minimized or targeted
based on the requirement of the process, while the independentvariables are kept within the range. The general approach is tofirst convert each response (Yi) into a dimensionless individual
desirability function (di) and it was done with the followingequation
di ¼ hnðYiÞ ð6Þ
Different desirability functions di (Yi) can be used to obtain the
individual desirabilities (di) for each responses i.e., minimize,maximize, in range or target of the response (Derringer andSuich, 1980). Let Li, Ui and Ti be the lower, upper, and target
values, respectively, that are desired for response Yi, with Li,Ti, Ui. The individual desirabilities (di) for each response areobtained by specifying the goals, i.e., minimize, maximize, inrange or target of the response. Depending on whether a par-
ticular response Yi is to be maximized or minimized, differentdesirability functions di (Yi) can be used (Derringer and Suich,1980). Let Li, Ui and Ti be the lower, upper, and target values,
respectively, that are desired for the response Yi, with Li, Ti,and Ui. The maximization of the response depends on its indi-vidual desirability function, which in turn relies on the target
value hit by the exponent s. For s= 1, the desirability functionincreases linearly toward Ti which denotes a large enough va-lue for the response; for s< 1, the function is convex, and fors> 1, the function is concave:
diðYiÞ ¼
0 YiðxÞ < Li
YiðxÞ�Li
Ti�Li
� �sLi � YiðxÞ � Ti
1 YiðxÞ > Ti
8>><>>:
ð7Þ
If a response is to be minimized, then its individual desirabilityfunction is with the Ti denoting a small enough value for theresponse:
diðYiÞ ¼1 YiðxÞ < Ui
YiðxÞ�Ui
Ti�Ui
� �sTi � YiðxÞ � Ui
0 YiðxÞ > Ui
8><>:
ð8Þ
After desirability values are computed for each response vari-able, they are combined to obtain a single global desirabilityindex (D), which varies from 0 (completely undesirable re-
sponse) to 1 (fully desired response) (Prakash Maran andManikandan, 2012) and that are equal to their geometric meanof the individual desired functions. For all the desired func-tions, a total desired function D ð0 � D � 1Þ is defined by Eren
and Ertekin (2007)
D ¼ ðdvi1 � dvi2 � � � � � dvin Þ ð9Þ
D ¼ ðYni¼1
dvii Þ1=P
vi ð10Þ
where vi is a number indicating the relative importance of theith response.
In present study, desirability functions were developed forthe following responses: maximum total anthocyanin, phenolicand flavonoid content. A weight factor, which defines the
shape of the desirability function for each response, is then as-signed. Weights must be between 1 and 10, with larger weightscorresponding to more important responses. A weight factor
of 1 was chosen for all individual desirability’s in this work.The ‘‘importance’’ of a goal can be changed in relation tothe other goals. It can range from 1 (least important) to 5
(most important). The default is three representing all goalsto be equally important.
2.10. Validation of optimized conditions and predictive models
The suitability of the developed model equations for predictingthe optimum response values was verified using the optimal
condition. Triplicate experiments were carried out in the opti-mal condition and the mean experimental values were com-pared with the predicted values in order to determine the
validity of the models.
3. Results and discussions
In this study, four factors with three level- CCFC design wasemployed to optimize the combination of UAE process vari-ables (extraction temperature, power of ultrasound, extractiontime, and solid–liquid ratio) and to study the linear, interactive
and quadratic effect of process variables on the extraction ofpigment (total anthocyanin content) and polyphenolic content(total phenolic and total flavonoid content) from rambutan
fruit peels. A total number of 30 experiments including six cen-ter points (used to determine the experimental error) were car-ried out in order to find out the optimal extraction conditions.
The various combinations of experimental conditions (codedand uncoded) with their respective experimental responses(mean response data) are presented in Table 1.
3.1. CCFC design analysis
The experimental data were analyzed and fitted to the fourhigh degree polynomial models viz., linear, interactive (2FI),
quadratic and cubic models. Two different tests namely thesequential model sum of squares and model summary statisticswere carried out in this study to decide about the adequacy of
models among various models to represent the total anthocy-anin content, phenolic content and flavonoid content of the ex-tracts and the results are listed in Table 2.
The adequacy of models tested output indicates that, cubicmodel was found to be aliased. The linear and quadratic mod-els are found to have lower p-value (<0.0001). But the R2, ad-justed R2 and predicted R2 values were found to be low in
linear model (Table 2). Thus the linear and cubic models can-not be chosen for further modeling of experimental data. Qua-dratic model was not only found to have maximum R2,
adjusted R2, predicted R2, but also exhibited low p-values.Hence the quadratic model was chosen for further analysis.
3.2. Development of second order polynomial models
Second-order polynomial equation with interaction terms wasfitted to the experimental results to develop mathematical
model, which will help to predict the extraction efficiency ofdifferent sets of combinations of four process variables onthe responses. Three empirical models were developed fromthis study to predict the UAE efficiency of TAC, TPC and
TFC from rambutan fruit peels. The final model obtained interms of coded factors is given below

Table 2 Adequacy of the models.
Source Sum of squares Degree of freedom Mean square F value Prob > F Remarks
Sequential model sum of squares for total anthocyanin content
Mean 1273.62 1 1273.62
Linear 66.37 4 16.59 12.28 <0.0001
2FI 19.34 6 3.22 4.24 0.0071
Quadratic 14.29 4 3.57 334.03 <0.0001 Suggested
Cubic 0.11 8 0.01 1.97 0.1929 Aliased
Residual 0.05 7 0.01
Total 1373.78 30 45.79
Sequential model sum of squares for total phenolic content
Mean 3613723.80 1 3613723.80
Linear 190801.80 4 47700.45 12.64 <0.0001
2FI 52180.22 6 8696.70 3.92 0.0102
Quadratic 41862.81 4 10465.70 523.62 <0.0001 Suggested
Cubic 228.69 8 28.59 2.81 0.0953 Aliased
Residual 71.12 7 10.16
Total 3898868.44 30 129962.28
Sequential model sum of squares for total flavonoid content
Mean 129363.26 1 129363.26
Linear 6403.90 4 1600.97 12.14 <0.0001
2FI 1922.50 6 320.42 4.43 0.0058
Quadratic 1363.17 4 340.79 438.57 <0.0001 Suggested
Cubic 3.83 8 0.48 0.43 0.8708 Aliased
Residual 7.82 7 1.12
Total 139064.48 30 4635.48
Source Std. Dev. R2 Adjusted R2 Predicted R2 PRESS Remarks
Model summary statistics for total anthocyanin content
Linear 1.16 0.6627 0.6087 0.4670 53.39
2FI 0.87 0.8557 0.7797 0.6933 30.72
Quadratic 0.10 0.9984 0.9969 0.9870 1.30 Suggested
Cubic 0.08 0.9995 0.9980 0.8855 11.47 Aliased
Model summary statistics for total phenolic content
Linear 61.43 0.6691 0.6162 0.4819 147727.40
2FI 47.11 0.8521 0.7743 0.7013 85181.82
Quadratic 4.47 0.9989 0.9980 0.9919 2319.49 Suggested
Cubic 3.19 0.9998 0.9990 0.9470 15101.42 Aliased
Model summary statistics for total flavonoid content
Linear 11.48 0.6601 0.6057 0.4628 5211.57
2FI 8.51 0.8583 0.7837 0.7168 2746.96
Quadratic 0.88 0.9988 0.9977 0.9921 76.78 Suggested
Cubic 1.06 0.9992 0.9967 0.8575 1382.59 Aliased
TAC¼7:06þ1:91X1�0:2X2�0:018X3þ0:11X4þ0:085X1X2�0:051X1X3�0:065X1X4
þ0:41X2X3�0:78X2X4�0:65X3X4þ0:92X21þ8:772E�003X2
2�2:04X23þ0:2X2
4
ð11Þ
TPC¼374:91þ102:41X1�10:87X2�1:03X3þ6:88X4þ3:33X1X2�2:16X1X3�3:77X1X4
þ18:61X2X3�41:47X2X4�34:14X3X4þ52:24X21þ1:58X2
2�111:67X23þ11:45X2
4
ð12Þ
TFC ¼ 70:66þ 18:78X1 � 1:43X2 � 0:24X3 þ 0:93X4 þ 0:91X1X2 � 0:7X1X3 � 1:21X1X4
þ3:64X2X3 � 7:57X2X4 � 6:84X3X4 þ 9:41X21 þ 0:26X2
2 � 2:0:19X23 þ 2:21X2
4
ð13Þ
S1150 J. Prakash Maran et al.
3.3. Statistical analysis
Multiple regression analysis and Pareto analysis of variance(ANOVA) were used to check the adequacy and fitness of
the developed models and results of ANOVA are given inTable 3. Table 3 summarized the effects of the model termsand associated p values for all three responses. At a 95% con-
fidence level, a model was considered significant, if the p value<0.05. The sign and value of the quantitative effect representtendency and magnitude of the term’s influence on the re-
sponse, respectively. A positive value in the regression equa-tion exhibits an effect that favors the optimization due tosynergistic effect, while a negative value indicates an inverserelationship or antagonistic effect between the factor and the

Figure 1 Diagnostic between experimental and predicted values
for TAC (A), TPC (B), and TFC (C).
Ultrasound assisted extraction of bioactive compounds from N. lappaceum L. fruit peel S1151
response (Verma et al., 2009). From the ANOVA table, it wasfound that the developed models for all the responses werehighly significant at probability level p < 0.0001 and also
showed higher Fisher F-value (667.71 for TAC, 1017.95 forTPC and 890.68 for TFC) with significant p-value(p< 0.0001), which indicates that most of the variation in
the response could be explained by the developed models.Determination coefficient (R2), adjusted determination
coefficient (R2adj), predicted determination coefficient (R2
pre)
and coefficient of variation (CV%) were calculated to checkthe goodness and behavior of the developed models with theexperimental data. A high R2 coefficient ensures a satisfactoryadjustment of the quadratic model to the experimental data.
The calculated R2 (0.998 for TAC, 0.999 for TPC and 0.998for TFC), R2
adj (0.996 for TAC, 0.998 for TPC and 0.997 forTFC) and R2
pre (0.987 for TAC, 0.991 for TPC and 0.992 for
TFC) values were high and advocate a high correlation be-tween the observed and the predicted values. The analysisshows that the form of the model chosen to explain the rela-
tionship between the factors and the response is well-correlatedand proved that the developed models defined exactly the truebehavior of the process. The low CV values (1.59, 1.29 and
1.34) clearly indicated that, the deviations between experimen-tal and predicted values are low and also showed a high degreeof precision and a good deal of reliability in conducted exper-iments. Adequate precision is greater than four is desirable
(Prakash Maran et al., 2013b) and the ratio was found to be>95, which indicates an adequate signal and confirms that thismodel can be used to navigate the design space.
3.4. Adequacy of the models
In general, the exploration of fitted response surface models
may produce poor or misleading results, unless the modelexhibits a good fit, which makes checking of the model ade-quacy essential (Prakash Maran et al., 2013a). Diagnostic plot
such as predicted versus actual values (Fig. 1) is used to eval-uate the relationship and model satisfactoriness between exper-imental data and predicted data obtained from the developedmodels. From Fig. 1, it was observed that, the data points
lie very closely to the straight line. It exhibited high correlationbetween the experimental data and predicted data obtainedfrom the models.
Data were also analyzed to check the residuals. The resid-ual gives the difference between the observed value of a re-sponse measurement and the value that is fitted under the
theorized model. Small residual value indicates that model pre-diction is accurate (Herbach et al., 2004). By constructinginternally studentized residuals plot, a check was made to ana-lyze the experimental data and to find out the satisfactory fit of
the developed models and the plots are shown in Fig. 2.Normal probability plot represents the normal distribution
of the residuals and constructing a normal probability plot of
the residuals allows the assessment of the normal distributionof the data. The normal probability plots of the residuals areshown in Fig. 3 and the data points on this plot lie reasonably
close to a straight line indicating an acceptable fit.
3.5. Effect of process variables
In the present study, four factors at three level CCFC designused to study the influence of process variables such as
extraction temperature, power of ultrasound, extraction time,and solid–liquid ratio were investigated on the UAE extractionof pigment and polyphenols from rambutan fruit peels. The
three dimensional response surface and contour plots wereconstructed from the developed models. Response surfaceand contour plots are graphical representations of a regression
equation that illustrate the main and interactive effects of inde-pendent variables on a response variable. These graphs aredrawn by maintaining two factors constant (in turn at its cen-
tral level) and varying the other two factors in order to under-stand their main and interactive effects on the dependentvariables (Prakash Maran et al., 2013). These graphs are easyto understand and represent the interactions between pairs of

Figure 3 Normal probability plot for TAC (A), TPC (B), and
TFC (C).
Figure 2 Internally studentized residuals plot for TAC (A), TPC
(B), and TFC (C).
S1152 J. Prakash Maran et al.
independent variables on the responses and also used to locate
their optimal levels.
3.5.1. Effect of extraction temperature
The effect of extraction temperature on the yield of anthocya-
nin and polyphenols was studied. The results showed that, theextraction temperature exhibited a positive linear and qua-dratic effect (Table 3) on the yield. When the temperature
was increased from 30 to 50 �C, the extraction yield of pigmentand polyphenols was increased (Fig. 4), which is due to thehigh number of cavitational nucleus formed during higherextraction temperatures as a result of high cavitation threshold
which is responsible for acoustic cavitation. The relative great-
er force ruptured the cavitational nucleus and disrupted thecell tissues during extraction, which will enhance the masstransfer (Toma et al., 2001). However, higher temperature
could enhance the solubility of pigment and phenolic com-pounds in rambutan fruit peel and decrease the viscosity anddensity of the extracts (Chen et al., 2012). Reduced viscosity
and density facilitate the solvent penetration deeper into thesample matrix which in turn enhances the extraction efficiencyby exposing more surface area of the sample to the solventused.

Figure 5 Response surface plots representing the effect of power
of ultrasound on the responses.
Figure 4 Response surface plots representing the effect of
extraction temperature on the responses.
Ultrasound assisted extraction of bioactive compounds from N. lappaceum L. fruit peel S1153
3.5.2. Effect of extraction power of ultrasound
The efficiency of extraction power of ultrasound on the antho-cyanin and polyphenols was evaluated and the results showedthat, the yield increased with the increasing power of ultra-
sound (Fig. 5). The increase in extraction power facilitatesthe disruption of the cell walls of the peels, enhances the solu-bility of the compounds present in the peels and increases the
extraction yield (Ying et al., 2011). This enhancement inextraction with ultrasound could be attributed to the ultra-sonic effects such as micro jet formation and acoustic stream-
ing (Sivakumar et al., 2009). Moreover, the intensity ofultrasound transmitted to the medium is directly related tothe vibration amplitude of sonication, producing greater num-
ber of cavitation bubbles and therefore increased extractionefficiency (Dash et al., 2005).
3.5.3. Effect of extraction time
The pigment and polyphenols’ yield was increased when theduration was maintained from 10 to 20 min but slowly de-creased when the duration continued to be extended (Fig. 6).
Most of the anthocyanin and polyphenols in broken cells are
released at the early period of extraction, because ultrasoundenhanced the release of those compounds into the exterior sol-vent and increased the yield in the first 20 min. However, long-er extraction time with ultrasound treatment might induce the
degradation of pigment and polyphenols (Tiwari et al.,2009).The number of cavitation micro-bubbles created byultrasound increased with the duration extended. The asym-
metric collapse of micro-bubbles near surfaces was also associ-ated with micro-jets that could scour surfaces and damagesubstance in solution (Vilkhu et al., 2008). The structure of
pigment and polyphenols was destroyed and its stability de-creased because of continual collapse of micro-bubbles. Theresults are in agreement with Rostagno et al. (2007), who
clearly indicated that 20 min of sonication time was sufficientenough to extract phenolics from soy beverages.
3.5.4. Effect of solid–liquid ratio
As shown in Fig. 7, the yield of anthocyanin and polyphenolswas increased gradually when the solid–liquid ratio ranged
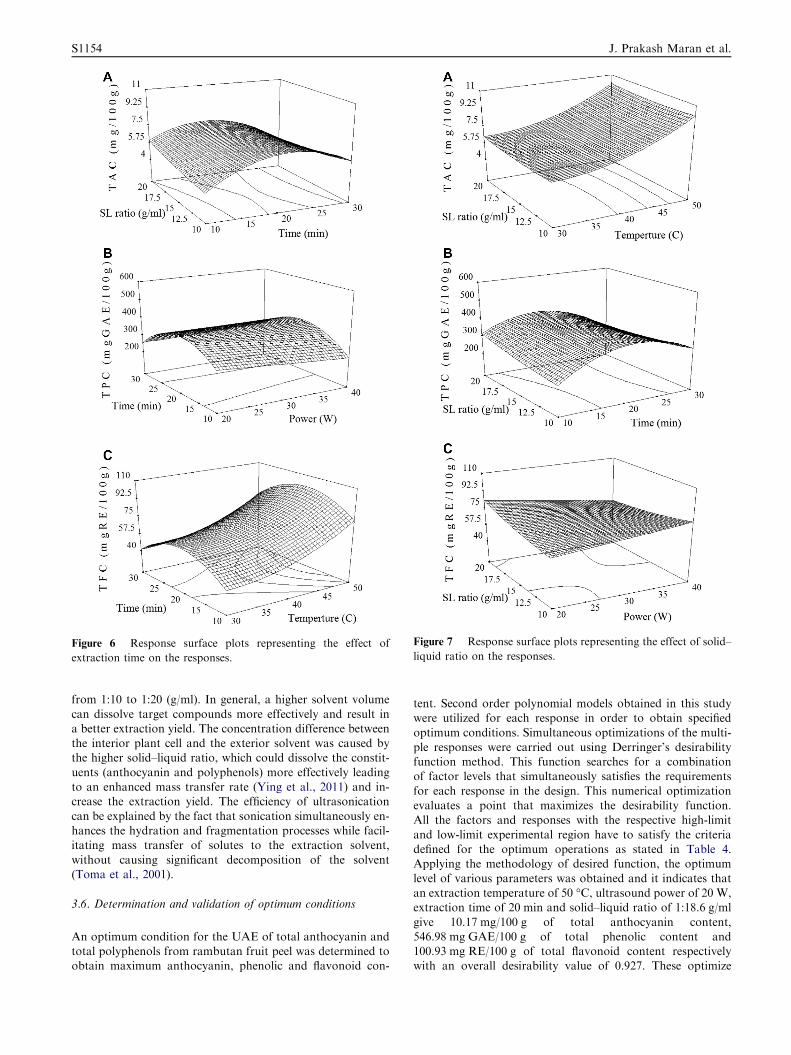
Figure 6 Response surface plots representing the effect of
extraction time on the responses.
Figure 7 Response surface plots representing the effect of solid–
liquid ratio on the responses.
S1154 J. Prakash Maran et al.
from 1:10 to 1:20 (g/ml). In general, a higher solvent volume
can dissolve target compounds more effectively and result ina better extraction yield. The concentration difference betweenthe interior plant cell and the exterior solvent was caused bythe higher solid–liquid ratio, which could dissolve the constit-
uents (anthocyanin and polyphenols) more effectively leadingto an enhanced mass transfer rate (Ying et al., 2011) and in-crease the extraction yield. The efficiency of ultrasonication
can be explained by the fact that sonication simultaneously en-hances the hydration and fragmentation processes while facil-itating mass transfer of solutes to the extraction solvent,
without causing significant decomposition of the solvent(Toma et al., 2001).
3.6. Determination and validation of optimum conditions
An optimum condition for the UAE of total anthocyanin andtotal polyphenols from rambutan fruit peel was determined toobtain maximum anthocyanin, phenolic and flavonoid con-
tent. Second order polynomial models obtained in this studywere utilized for each response in order to obtain specified
optimum conditions. Simultaneous optimizations of the multi-ple responses were carried out using Derringer’s desirabilityfunction method. This function searches for a combinationof factor levels that simultaneously satisfies the requirements
for each response in the design. This numerical optimizationevaluates a point that maximizes the desirability function.All the factors and responses with the respective high-limit
and low-limit experimental region have to satisfy the criteriadefined for the optimum operations as stated in Table 4.Applying the methodology of desired function, the optimum
level of various parameters was obtained and it indicates thatan extraction temperature of 50 �C, ultrasound power of 20 W,extraction time of 20 min and solid–liquid ratio of 1:18.6 g/ml
give 10.17 mg/100 g of total anthocyanin content,546.98 mg GAE/100 g of total phenolic content and100.93 mg RE/100 g of total flavonoid content respectivelywith an overall desirability value of 0.927. These optimize

Table 3 Analysis of variance for the fitted second order polynomial models.
Source Coefficient estimate Sum of squares DF Standard error Mean square F-value p-Value
Total anthocyanin content
Model 7.06 100.00 14 0.03 7.14 667.71 <0.0001
X1 1.91 65.40 1 0.02 65.40 6113.33 <0.0001
X2 �0.20 0.75 1 0.02 0.75 70.33 <0.0001
X3 �0.02 0.01 1 0.02 0.01 0.57 0.4637
X4 0.11 0.22 1 0.02 0.22 20.15 0.0004
X12 0.09 0.12 1 0.03 0.12 10.81 0.0050
X13 �0.05 0.04 1 0.03 0.04 3.93 0.0661
X14 �0.07 0.07 1 0.03 0.07 6.32 0.0238
X23 0.41 2.66 1 0.03 2.66 248.36 <0.0001
X24 �0.78 9.64 1 0.03 9.64 901.22 <0.0001
X34 �0.65 6.81 1 0.03 6.81 636.78 <0.0001
X21 0.92 2.21 1 0.06 2.21 206.68 <0.0001
X22 0.01 0.00 1 0.06 0.00 0.02 0.8932
X23 �2.04 10.74 1 0.06 10.74 1004.19 <0.0001
X24 0.20 0.11 1 0.06 0.11 10.06 0.0063
Residual error 0.16
Lack of fit 0.16
Mean 6.52
C.V.% 1.59
Adeq. precision 95.51
Total phenolic content
Model 374.91 284844.83 14 1.39 20346.06 1017.95 <0.0001
X1 102.14 187803.96 1 1.05 187803.96 9396.19 <0.0001
X2 �10.87 2127.75 1 1.05 2127.75 106.46 <0.0001
X3 �1.03 19.12 1 1.05 19.12 0.96 0.3436
X4 6.88 850.98 1 1.05 850.98 42.58 <0.0001
X12 3.33 177.72 1 1.12 177.72 8.89 0.0093
X13 �2.16 74.86 1 1.12 74.86 3.75 0.0720
X14 �3.77 227.31 1 1.12 227.31 11.37 0.0042
X23 18.61 5540.33 1 1.12 5540.33 277.19 <0.0001
X24 �41.47 27514.15 1 1.12 27514.15 1376.58 <0.0001
X34 �34.14 18645.85 1 1.12 18645.85 932.89 <0.0001
X21 52.24 7070.70 1 2.78 7070.70 353.76 <0.0001
X22 1.58 6.47 1 2.78 6.47 0.32 0.5777
X23 �111.67 32310.62 1 2.78 32310.62 1616.56 <0.0001
X24 11.45 339.71 1 2.78 339.71 17.00 0.0009
Residual error 299.81
Lack of fit 291.89
Mean 347.07
C.V.% 1.29
Adeq.precision 117.60
Total flavonoid content
Model 70.66 9689.56 14 0.27 692.11 890.68 <0.0001
X1 18.78 6350.41 1 0.21 6350.41 8172.36 <0.0001
X2 �1.43 36.98 1 0.21 36.98 47.59 <0.0001
X3 �0.24 1.02 1 0.21 1.02 1.31 0.2708
X4 0.93 15.49 1 0.21 15.49 19.93 0.0005
X12 0.91 13.32 1 0.22 13.32 17.14 0.0009
X13 �0.70 7.84 1 0.22 7.84 10.09 0.0063
X14 �1.21 23.52 1 0.22 23.52 30.27 <0.0001
X23 3.64 211.70 1 0.22 211.70 272.44 <0.0001
X24 �7.58 918.09 1 0.22 918.09 1181.49 <0.0001
X34 �6.84 748.02 1 0.22 748.02 962.63 <0.0001
X21 9.41 229.18 1 0.55 229.18 294.94 <0.0001
X22 0.26 0.17 1 0.55 0.17 0.22 0.6480
X23 �20.19 1056.63 1 0.55 1056.63 1359.78 <0.0001
X24 2.21 12.60 1 0.55 12.60 16.21 0.0011
Residual error 11.66
Lack of fit 9.98
Mean 65.67
C.V.% 1.34
Adeq. precision 108.81
Ultrasound assisted extraction of bioactive compounds from N. lappaceum L. fruit peel S1155

Table 4 Settings for multi-criteria optimization.
Factor/response Goal Lower limit Upper limit Importance
X1 In range 30 50 3
X2 In range 20 40 3
X3 In range 10.00 30.00 3
X4 In range 1:10 1:20 3
TAC maximize 3.17 10.16 3
TPC Maximize 165.11 540.31 3
TFC Maximize 32.1 99.31 3
Table 5 Predicted and experimental values of the responses at optimum conditions.
Optimal levels of process parameters Optimized values (predicted values) Experimental values
TAC
(mg/100 g)
TPC
(mg GAE/100 g)
TFC
(mg RE/100 g)
TAC
(mg/100 g)
TPC
(mg GAE/100 g)
TFC
(mg RE/100 g)
X1 (�C) = 50 10.17 546.98 100.93 10.26 ± 0.39 552.64 ± 1.57 104 ± 1.13
X2 (W) = 20
X3 (min) = 20
X4 (g/ml) = 1:18.6
S1156 J. Prakash Maran et al.
conditions could be considered as optimum as well as feasibleconditions.
The suitability of the model equations for predicting opti-mum response values was tested under the conditions (extrac-tion temperature of 50 �C, ultrasound power of 20 W,
extraction time of 20 min and solid–liquid ratio of 1:18.6 g/ml) as determined by Derringer’s desired function methodol-ogy. Experiments were carried out under the optimal condi-
tions in order to compare the experimental results with thepredicted values of the responses using the developed empiricalmodel equation (Eqs. (11)–(13)). The experiments were con-ducted in triplicates and the average values are reported in
Table 5. The mean values of the TAC, TPC and TFC obtainedwere compared with the predicted values. The experimentalvalues were found to be in agreement with the predicted values
and clearly indicated the suitability of the developed quadraticmodels. The results obtained through confirmation experi-ments indicate the suitability of the developed quadratic mod-
els and it may be noted that these optimal values are validwithin the specified range of process parameters.
4. Conclusions
Central composite face-centered design was successfully em-ployed to optimize and study the individual and interactive ef-
fect of process variables such as extraction temperature, powerof ultrasound, extraction time and solid–liquid ratio on theUAE of anthocyanin, polyphenols from rambutan fruit peel.The results showed that, the extraction conditions showed sig-
nificant effects on the pigment and polyphenols’ content. Fromthis study, second-order models were developed to describe therelationship between the independent variables and the re-
sponses. The developed models could have the ability to pre-dict the total anthocyanin, phenolic and flavonoid and wasfound to be comparable with that of the experimental values.
Analysis of variance showed a high coefficient of determina-tion values (R2) of 0.998 for TAC, 0.999 for TPC and 0.998
for TFC, ensuring a satisfactory fit of the developed second-or-der polynomial models with the experimental data. The opti-mum conditions were found to be, extraction temperature of
50 �C, ultrasound power of 20 W, extraction time of 20 minand solid–liquid ratio of 1:18.6 and the predicted maximumTAC yield of 10.71 mg/100 g, TPC of 546.98 mg GAE/100 g
and 100.93 mg RE/100 g respectively. Under the optimizedconditions, the experimental values (total anthocyanin(10.26 ± 0.39 (mg/100 g)), phenolics (552.64 ± 1.57(mg GAE/100 g)) and flavonoid content (104 ± 1.13
(mg RE/100 g)) closely agreed with the predicted values(10.17 mg/100 g of total anthocyanin, 546.98 mg GAE/100 gof total phenolics and 100.93 mg RE/100 g of total flavonoid
content) and indicated the suitability of the developed models.
References
Anagnostopoulou, M.A., Kefalas, P., Papageorgiou, V.P., Assimo-
poulou, A.N., Boskou, D., 2006. Radical scavenging activity of
various extracts and fractions of sweet orange peel Citrus sinensis.
Food Chem. 94, 19–25.
Azargohar, R., Dalai, A.K., 2005. Production of activated carbon
from Luscar char: experimental and modeling studies. Micropo-
rous Mesoporous Mater. 85, 219–225.
Chen, W., Huang, Y., Qi, J., Tang, M., Zheng, Y., Zhao, S., Chen, L.,
2012. Optimization of ultrasound-assisted extraction of phenolic
compounds from areca husk. J. Food Process. Preserv. http://
dx.doi.org/10.1111/j.1745-4549.2012.00748.x.
Dash, K., Thangavel, Krishnamurthy, N.V., Rao, S.V., Karunasagar,
D., Arunachalam, J., 2005. Ultrasound-assisted analyte extraction
for the determination of sulphate and elemental sulphur in zinc
sulphide by different liquid chromatography techniques. The
Analyst 130, 498–501.
Derringer, G., Suich, R., 1980. Simultaneous optimization of several
response variables. J. Qual. Technol. 12, 214–219.

Ultrasound assisted extraction of bioactive compounds from N. lappaceum L. fruit peel S1157
Eren, _I., Ertekin, F.K., 2007. Optimization of osmotic dehydration of
potato using response surface methodology. J. Food Eng. 79 (1),
344–352.
Giusti, M.M., Wrolstad, R.E., 2000. Current Protocols in Food
Analytical Chemistry. John WileySons, NewYork.
Herbach, K.M., Stintzing, F.C., Carle, R., 2004. Thermal degradation
of betacyanins in juices from purple pitaya [Hylocereus polyrhizus
Weber, Britton Rose] monitored by high-performance liquid
chromatography–tandem mass spectrometric analyses. Eur. Food
Res. Technol. 219, 377–385.
Jayaprakasha, G.K., Selvi, T., Sakariah, K.K., 2003. Antibacterial and
antioxidant activities of grape Vitis vinisfera seed extracts. Food
Res. Int. 36, 117–122.
Jayaprakasha, G.K., Singh, R.P., Sakariah, K.K., 2001. Antioxidant
activity of grape seed Vitis vinifera extracts on peroxidation models
in vitro. Food Chem. 73, 285–290.
Kabuki, T., Nakajima, H., Arai, M., Ueda, S., Kuwabara, Y.,
Dosako, S., 2000. Characterization of novel antimicrobial com-
pounds from mango Mangifera indica L. kernel seeds. Food Chem.
71, 61–66.
Khonkarn, R., Okonogi, S., Ampasavate, C., Anuchapreeda, S., 2010.
Investigation of fruit peel extracts as sources for compounds with
antioxidant and antiproliferative activities against human cell lines.
Food Chem. Toxicol. 48, 2122–2129.
Ma, Y.-Q., Chen, J.-C., Liu, D.H., Ye, X.Q., 2008. Effect of ultrasonic
treatment on the total phenolic and antioxidant activity of extracts
from citrus peel. J. Food Sci. 73, T115–T120.
Nawawi, A., Nakamura, N., Hattori, M., Kurokawa, M., Shiraki, K.,
1999. Inhibitory effects of Indonesian medicinal plants on the
infection of herpes simplex virus type 1. Phytother. Res. 13, 37–41.
Negro, C., Tommasi, L., Miceli, A., 2003. Phenolic compounds and
antioxidant activity from red grape marc extracts. Bioresour.
Technol. 87, 41–44.
Okonogi, S., Duangrat, C., Anuchpreeda, S., Tachakittirungrod, S.,
Chowwanapoonpohn, S., 2007. Comparison of antioxidant capac-
ities and cytotoxicities of certain fruit peels. Food Chem. 103, 839–
846.
Palanisamy, U., Cheng, H.M., Masilamani, T., Subramaniam, T.,
Ling, L.T., Radhakrishnan, A.K., 2008. Rind of rambutan,
Nephelium lappaceum, a potential source of natural antioxidants.
Food Chem. 109, 54–63.
Prakash Maran, J., Manikandan, S., 2012. Response surface modeling
and optimization of process parameters for aqueous extraction of
pigments from prickly pear (Opuntia ficus-indica) fruit. Dyes Pigm.
95, 465–472.
Prakash Maran, J., Mekala, V., Manikandan, S., 2013. Modeling and
optimization of ultrasound-assisted extraction of polysaccharide
from Cucurbita moschata. Carbohydr. Polym. 92, 2018–2026.
Prakash Maran, J., Manikandan, S., Thirugnanasambandham, K.,
Vigna Nivetha, C., Dinesh, R., 2013a. Box-Behnken design based
statistical modeling for ultrasound-assisted extraction of corn silk
polysaccharide. Carbohydr. Polym. 92, 604–611.
Prakash Maran, J., Sivakumar, V., Sridhar, R., Prince Immanuel, V.,
2013b. Development of model for mechanical properties of tapioca
starch based edible films. Ind. Crop. Prod. 42, 159–168.
Prakash Maran, J., Sivakumar, V., Sridhar, R., Thirugnanasamband-
ham, K., 2013c. Development of model for barrier and optical
properties of tapioca starch based edible films. Carbohydr. Polym.
92, 1335–1347.
Rodrigues, S., Pinto, G.A.S., 2007. Ultrasound extraction of phenolic
compounds from coconut Cocos nucifera shell powder. J. Food
Eng. 80, 869–872.
Rostagno, M.A., Palma, M., Barroso, C.G., 2003. Ultrasound-assisted
extraction of soy isoflavones. J. Chromatogr. A 1012, 119–128.
Rostagno, M.A., Palma, M., Barroso, C.G., 2007. Ultrasound-assisted
extraction of isoflavones from soy beverages blended with fruit
juices. Anal. Chim. Acta 597, 265–272.
Singh, R.P., Murthy, K.N.C., Jayaprakasha, G.K., 2002. Studies on
the antioxidant activity of pomegranate Punica granatum peel and
seed extracts using in vitro models. J. Agric. Food Chem. 50, 81–86.
Sivakumar, V., Lakshmi Anna, J., Vijayeeswaree, J., Swaminathan,
G., 2009. Ultrasound assisted enhancement in natural dye extrac-
tion from beetroot for industrial applications and natural dyeing of
leather. Ultrason. Sonochem. 16 (6), 782–789.
Thitilertdecha, N., Teerawutgulrag, A., Kilburn, J.D., Rakariyatham,
N., 2010. Identification of major phenolic compounds from
Nephelium lappaceum L. and their antioxidant activities. Molecules
15, 1453–1465.
Tiwari, B.K., Donnell, C.P., Cullen, P.J., 2009. Effect of sonication on
retention of anthocyanins in blackberry juice. J. Food Eng. 93,
166–171.
Tiwari, B.K., Patras, A., Brunton, N., Cullen, P.J., O’Donnell, C.P.,
2010. Effect of ultrasound processing on anthocyanins and color of
red grape juice. Ultrason. Sonochem. 17, 598–604.
Toma, M., Vinatoru, M., Paniwnyk, L., Mason, T.J., 2001. Investi-
gation of the effects of ultrasound on vegetal tissues during solvent
extraction. Ultrason. Sonochem. 8, 137–142.
Vatai, T., Skerget, M., Knez, Z., 2009. Extraction of phenolic
compounds from elder berry and different grape marc varieties
using organic solvents and/or supercritical carbon dioxide. J. Food
Eng. 90, 246–254.
Verma, Lan, Y., Gokhale, R., Burgess, D.J., 2009. Quality by design
approach to understand the process of nanosuspension prepara-
tion. Int. J. Pharm. 377, 185–198.
Vilkhu, K., Mawson, R., Simons, L., Bates, D., 2008. Applications and
opportunities for ultrasound assisted extraction in the food
industry –– a review. Innov. Food Sci. Emerg. Technol. 9, 161–169.
Wang, J., Sun, B., Cao, Y., Tian, Y., Li, X., 2008. Optimisation of
ultrasound-assisted extraction of phenolic compounds from wheat
bran. Food Chem. 106, 804–810.
Wu, H., Hulbert, G.J., Mount, J.R., 2001. Effects of ultrasound on
milk homogenization and fermentation with yoghurt starter.
Innov. Food Sci. Emerg. Technol. 1, 211–218.
Yang, B., Liu, X., Gao, Y., 2009. Extraction optimization of bioactive
compounds crocin, geniposide and total phenolic compounds from
Gardenia Gardenia jasminoides Ellis fruits with response surface
methodology. Innov. Food Sci. Emerg. Technol. 10, 610–615.
Ying, Z., Han, X., Li, J., 2011. Ultrasound-assisted extraction of
polysaccharides from mulberry leaves. Food Chem. 127, 1273–
1279.
Zhishen, J., Mengchang, T., Jianming, W., 1999. The determination of
flavonoid contents in mulberry and their scavenging effects on
superoxide radicals. Food Chem. 64, 555–559.