uk guarantees scheme for infrastructure€¦ · national audit act 1983 for presentation to the...
TRANSCRIPT

Reportby the Comptroller and Auditor General
HM Treasury
UK Guarantees scheme for infrastructure
HC 909 SESSION 2014-15 28 JANUARY 2015

Our vision is to help the nation spend wisely.
Our public audit perspective helps Parliament hold government to account and improve public services.
The National Audit Office scrutinises public spending for Parliament and is independent of government. The Comptroller and Auditor General (C&AG), Sir Amyas Morse KCB, is an Officer of the House of Commons and leads the NAO, which employs some 820 employees. The C&AG certifies the accounts of all government departments and many other public sector bodies. He has statutory authority to examine and report to Parliament on whether departments and the bodies they fund have used their resources efficiently, effectively, and with economy. Our studies evaluate the value for money of public spending, nationally and locally. Our recommendations and reports on good practice help government improve public services, and our work led to audited savings of £1.1 billion in 2013.

Report by the Comptroller and Auditor General
Ordered by the House of Commons to be printed on 26 January 2015
This report has been prepared under Section 6 of the National Audit Act 1983 for presentation to the House of Commons in accordance with Section 9 of the Act
Sir Amyas Morse KCB Comptroller and Auditor General National Audit Office
21 January 2015
HC 909 | £10.00
HM Treasury
UK Guarantees scheme for infrastructure

This study examines the risks to value for money associated with guarantees for infrastructure projects, and how HM Treasury manages taxpayers’ exposure to the risk.
© National Audit Office 2015
The material featured in this document is subject to National Audit Office (NAO) copyright. The material may be copied or reproduced for non-commercial purposes only, namely reproduction for research, private study or for limited internal circulation within an organisation for the purpose of review.
Copying for non-commercial purposes is subject to the material being accompanied by a sufficient acknowledgement, reproduced accurately, and not being used in a misleading context. To reproduce NAO copyright material for any other use, you must contact [email protected]. Please tell us who you are, the organisation you represent (if any) and how and why you wish to use our material. Please include your full contact details: name, address, telephone number and email.
Please note that the material featured in this document may not be reproduced for commercial gain without the NAO’s express and direct permission and that the NAO reserves its right to pursue copyright infringement proceedings against individuals or companies who reproduce material for commercial gain without our permission.
Links to external websites were valid at the time of publication of this report. The National Audit Office is not responsible for the future validity of the links.
10543 01/15 NAO

The National Audit Office study team consisted of: Robert Cook, Charlotta Blomberg, Sarah Shakespeare, Colin Ratcliffe, Afnan Khokhar, Vasilisa Starodubtseva, under the direction of Matthew Rees.
This report can be found on the National Audit Office website at www.nao.org.uk
For further information about the National Audit Office please contact:
National Audit Office Press Office 157–197 Buckingham Palace Road Victoria London SW1W 9SP
Tel: 020 7798 7400
Enquiries: www.nao.org.uk/contact-us
Website: www.nao.org.uk
Twitter: @NAOorguk
Contents
Key facts 4
Summary 5
Part OneRationale and Scheme design 12
Part TwoImplementation 20
Part ThreeRisk 26
Part FourPrice 36
Appendix OnePricing theory and market data 48
Appendix TwoOur audit approach 52
Appendix ThreeOur evidence base 54
Appendix FourSummary details of the first 5 guarantees signed by HM Treasury 55
Glossary 64

4 Key facts UK Guarantees scheme for infrastructure
Key facts
£40bnmaximum value of support provided under the UK Guarantees Scheme (excluding interest)
£1.7bntotal value of commitments entered into by HM Treasury as at 31 December 2014 (excluding interest)
£12.3mHM Treasury’s estimated annual fee income from the fi rst 7 guarantees in 2014-15
7 guarantees (and 1 standby facility) signed or approved at 31 December 2014
44 years the longest life of the signed guarantees, requiring ongoing monitoring until 2058
39 projects remain pre-qualifi ed by HM Treasury as eligible for guarantees
£24 billion potential maximum level of guarantees based on pre-qualifi ed projects, including up to £17 billion for Hinkley Point C nuclear power plant
£173 billion reported value of contingent liabilities and guarantees across the public sector

UK Guarantees scheme for infrastructure Summary 5
Summary
1 The value of lending to new UK infrastructure projects halved from £6 billion before the financial crisis to £3 billion in 2010. In October 2012 the Infrastructure (Financial Assistance) Act became law, allowing government to issue guarantees to projects meeting a broad definition of infrastructure, spanning energy, transport, health, education, courts, prisons and housing. The UK Guarantees scheme (the Scheme) is designed to avoid delays to investment in UK infrastructure projects that may have stalled because of adverse credit conditions and provides a sovereign-backed guarantee to help projects access finance. HM Treasury (the Treasury) also aims to attract new sources of finance into infrastructure projects, such as pension and institutional investors.
2 The Scheme is operated by a team of experienced commercial specialists within Infrastructure UK, a unit within the Treasury and is open to applications from infrastructure projects in the public and private sectors. The Scheme enables the Treasury to issue an unconditional and irrevocable guarantee to the lenders to infrastructure projects ensuring that scheduled interest and principal payments will be paid in full, irrespective of project performance. This transfers project risk to government, and ultimately taxpayers, in return for a fee (Figure 1, overleaf). The Scheme provides stronger protection to lenders than comparable European state schemes, which provide credit enhancement but not a full sovereign guarantee of principal and interest.
3 The first guarantee was issued in April 2013 and by December 2014 the Treasury had agreed guarantees with a value of £1.7 billion (excluding interest) to 7 projects (and 1 standby facility), with 39 more projects pre-qualified for a guarantee. The Scheme has a limit of £40 billion in guaranteed lending (excluding interest) and is currently due to close in December 2016.
4 To comply with European State Aid guidance on the issue of guarantees by member states, the Scheme is not intended to provide subsidised loans to infrastructure projects. To ensure this, the Treasury charges each infrastructure project company a market-oriented fee. The fee is determined by the Treasury’s assessment of project risk and prevailing market prices for equivalent risks. At an overall Scheme level, the Treasury expects taxpayer risk to be minimised because fee income should exceed expected losses and the Scheme’s running costs and the Treasury has standard rights of senior lenders to enable the recovery of monies in the event that there is a call on a guarantee.

6 Summary UK Guarantees scheme for infrastructure
5 This report considers the risks to value for money associated with this Scheme that the Treasury must manage. This may inform the issuance of guarantees in future and may be applicable to other guarantees and contingent liabilities in government, which we plan to return to in future work. This report comes halfway through the life of the Scheme and reviews the Treasury’s approach to the first 5 guarantees (but does not assess whether the underlying projects represent value for money). Background information on the first 5 guarantees is available in Appendix Four. Our approach and methods are described in Appendices Two and Three.
6 This report is structured as follows:
• Part One describes the rationale for the Scheme;
• Part Two reviews implementation including the Treasury’s pre-qualification process, eligibility criteria and approach to value for money;
• Part Three examines the Treasury’s approach to measuring and managing taxpayer risks at 3 levels: the projects, the Scheme, and government; and
• Part Four examines how the Treasury derives the price of guarantees and the role of financial market indicators.
Figure 1How the Scheme works
Guaranteed lender or bond investor
(Substitutes company credit risk for risk of lending to UK government)
Note
1 The company agrees to reimburse HM Treasury for any payments under the UK Guarantees Scheme. HM Treasury and the company document various bilateral rights.
Source: National Audit Offi ce, based on A brief overview of the standard documentation 2013, Allen & Overy for HM Treasury
Guarantee fee (see note)
Lender provides finance (through bonds and/or loans)
Payment obligations (interest and principal)
HM Treasury guarantees the lender will be paid all interest and principal due HM Treasury
(Takes company credit risk in return for a fee)
Company
(Borrows to finance infrastructure and makes payments to both lender and HM Treasury)

UK Guarantees scheme for infrastructure Summary 7
Key findings
Rationale and implementation
7 When the Scheme was launched in 2012, private finance for infrastructure had been heavily constrained. Market conditions have since improved. By the time the first guarantee was issued in April 2013, lending to UK infrastructure projects had returned to 2006 levels, although bond issuance remained very limited and bank lending was concentrated in a few large projects. In 2013 the Treasury extended the Scheme deadline to December 2016 in part to accommodate renewable energy projects associated with the government’s Electricity Market Reforms. By 2014, the Treasury identified greater availability and diversity in sources of infrastructure finance (including through this Scheme) and considered the infrastructure investment market would remain buoyant (paragraphs 1.3, 1.5 to 1.9, Figures 3 and 4).
8 The contribution of the Scheme to the National Infrastructure Plan has been modest to date but may increase substantially. The Treasury has received more than 200 enquiries, agreed 7 guarantees (and 1 standby facility) and pre-qualified 39 other projects. The pre-qualified projects have a total value of £34 billion, equivalent to 7% of the investment identified in the most recent National Infrastructure Plan (£466 billion) and could result in up to £24 billion in guarantees, including the Hinkley Point C nuclear power plant (up to £17 billion). Although the £1.7 billion of signed guarantees is relatively small in relation to the Scheme limit, the Treasury supported £827 million of UK project finance in 2014, making it the second most active lender to new infrastructure (paragraphs 1.1, 1.7, 2.2 to 2.3, 3.12, 3.13, Figure 2 and Figure 12).
9 Eligibility criteria are not strictly applied. The Treasury set 5 criteria to pre-qualify projects as potentially eligible for a guarantee but has not defined important aspects of 2 criteria, such as how to test whether projects need a guarantee and are of an acceptable credit quality (risk). The Treasury told us it chose to keep these criteria flexible as projects could find objective tests an onerous requirement. The Treasury does not document analysis against its criteria, for example evidence to demonstrate that projects make a positive contribution to economic growth. Three criteria were precisely defined: we found that 4 out of the 5 projects we examined met them, but the Treasury supported one £8.8 million project (SDCL EE) that cannot reasonably be described as meeting its ‘nationally significant’ test (paragraphs 2.4 to 2.8, Figure 7).
10 In relation to the Scheme, the Treasury does not consider the overall value for money of projects, but considers the guarantee to be value for money using a narrow test of whether the fee represents a market price for the risk. The Treasury’s own guidance states that departments need to consider the impact of initiatives across the public sector. Our review of the first 5 signed guarantees identified involvement by various parts of the public sector. It is unclear how any individual Accounting Officer has an overall perspective. Infrastructure UK takes the value for money of projects as a given and focuses on getting projects delivered provided they are consistent with existing government policy. We have previously reported on the need for government to take a portfolio view of its activities (paragraphs 2.9 to 2.11, Figure 8).

8 Summary UK Guarantees scheme for infrastructure
Risk
11 The Treasury has assembled an experienced commercial team and internal governance arrangements to measure and manage risks to the taxpayer. Approval decisions rest with Ministers. Infrastructure UK has a team of 12 commercial specialists with backgrounds in project and infrastructure finance and commercial guarantees. The team apply recognised commercial practices (due diligence and techniques similar to project finance banks) to assess the risk of each project and negotiate terms to mitigate risks where possible. The Treasury has also put in place a governance process that subjects risk assessments and deal terms to challenge and scrutiny by an internal risk expert and internal risk committee prior to submission for ministerial approval (paragraphs 3.2 to 3.8).
12 The Treasury has underwritten some higher-risk projects and there is no limit on the probability of default over the life of a guarantee. However, the Treasury considers that guarantees with a very high risk rating (corresponding to a greater than 5% probability of default in any given year) would be incompatible with European State Aid guidelines. In practice, the Treasury considers many infrastructure projects with construction risk are likely to be ‘non-investment grade’ (the Treasury assessed 3 of the first 5 deals to be in this risk category), although recovery levels can be higher than for other assets. Historic data for non-investment grade credit suggest it has a higher than 5% probability of default over 5 years (paragraphs 3.2 to 3.3, Figure 9).
13 The Treasury has not issued guarantees where it considers projects do not stand up to commercial scrutiny or if is unable to identify price benchmarks. The Treasury identified 3 main reasons why few of the 200-plus enquiries resulted in guarantees: first, for many projects it was too early to finalise financing (for example, planning permission or revenue subsidies were not yet secured); second, where the Treasury’s due diligence concluded projects were poorly structured and therefore not commercially viable; third, if there are no relevant price benchmarks (necessary for compliance with European State Aid guidance). A lack of price benchmarks for weaker non-investment grade risk over 10 years can limit the level and duration of risk exposure: none of the non-investment grade guarantees the Treasury has provided are for longer than 5 years (paragraphs 2.2, 3.2 and 3.4, Figures 6 and 7).
14 The Scheme has an overall limit of £40 billion of guaranteed lending but risks are not evenly distributed (and the Treasury never intended them to be). The £40 billion excludes interest, which is potentially significant for longer dated commitments. The Scheme has underwritten a diverse range of project risks across a range of industries and risk ratings, and support ranges in value from £8.8 million to £750 million and exposure lasts up to 44 years in the case of the University of Northampton guaranteed bond and loans. The Scheme is currently dominated by its largest commitment (currently the £750 million Northern Line Extension standby refinancing facility). The uneven distribution would become much more pronounced if the Hinkley Point C guarantee is issued, focusing a substantial proportion of the planned guarantee capacity on the risk of 1 project (paragraphs 3.12 to 3.14, Figure 12).
UK Guarantees scheme for infrastructure Summary 9
15 There have been no calls on the issued guarantees under this Scheme but this has happened unexpectedly to government on previous occasions. The Treasury has put in place ongoing monitoring to manage this risk. It is possible that none of the guaranteed debt will be called. The government has experienced previous calls on guarantees it provided to transport infrastructure (HS1 and Metronet). To manage such risks, the Treasury has negotiated standard senior lender rights in the event of default and put in place a small team to monitor projects for their lifespan. (paragraphs 3.9, 3.11, 3.18 to 3.19, Figure 11).
16 Government discloses limited information about guarantees and contingent liabilities. Beyond this Scheme, the Whole of Government Accounts identifies £173 billion in guarantees and contingent liabilities across the public sector (including Network Rail and export credit guarantees). Government financial statements provide details of total exposure where this can be quantified, but do not set out the probability of default, or the duration of exposure. The Treasury discloses the aggregate value of each of the guarantees it has signed, but it does not disclose the individual risk ratings or the amount of interest guaranteed (paragraphs 3.17 to 3.20, Figure 13).
Price
17 There are no directly comparable market benchmarks for the Treasury guarantee fee because the guarantee is superior to commercial alternatives. The Treasury charges each project a fee which seeks to ensure it pays a market-oriented cost for debt finance, to comply with European State Aid guidance. However the Treasury guarantees have unique characteristics that cannot be readily observed in market prices for commercial guarantees because no commercial products can provide the extensive protection provided by substituting the UK’s credit rating for the risk of the project (paragraphs 1.17 to 1.19 and 4.3, 4.6 to 4.7, and 4.9).
18 We do not have full confidence in the reliability or completeness of market benchmarks used to measure actual risks to taxpayers. To set market-oriented prices, the Treasury uses a broad variety of publicly available market prices, and has constructed a database including some 800 corporate bonds and credit default swaps. The database has not been subject to third-party review to validate the reliability of the data. On detailed inspection the database contains relatively few financial instruments with similar characteristics to individual projects under review, for example, it did not include the INEOS group (and using this information could have resulted in higher fees). The prices of non-investment grade credit are particularly volatile (paragraphs 4.11 to 4.23, Appendix One).

10 Summary UK Guarantees scheme for infrastructure
19 The Treasury sets the fee for the whole life of the guarantee using the prevailing price at the date the guarantee is issued, even though credit markets can be volatile and project risk might change. Market prices and underlying project risks may vary independently of each other, therefore market price does not necessarily reflect the financial risk from guarantees. Guarantee fees are determined with reference to market prices, but once the Treasury has issued a guarantee it cannot withdraw it or change the price if project risk or market prices change. This removes price volatility for projects, as is common in project finance deals. If a project could obtain cheaper sources of finance and repaid the guaranteed debt, the guarantee would cease along with the liability to the government (paragraphs 4.2, 4.24 to 4.26, Figures 16 and 17).
20 Investors in government guaranteed debt may receive a return higher than that on government gilts even though the credit risk is equivalent but this can be reduced through financing competitions (eg auctions). Investors in guaranteed debt may seek a higher return reflecting that it is less easily tradable than gilts, reducing its attractiveness to some investors. The Treasury assumes a typical return of 0.5% above gilts, but has achieved better results in competitive pricing. Based on the use of the Scheme to date and the expected take up until it closes, the illustrative annual extra cost through using guarantees as opposed to direct lending could be between £35 million and £120 million, with and without Hinkley Point C. As the Treasury issues more guarantees, market familiarity with this product and transparency, open competition and best execution in the issue of guaranteed debt, gives the greatest potential to minimise the premium over gilts for investors. (4.27 to 4.31 and Figure 18).
Conclusion
21 The Treasury introduced the UK Guarantees scheme as a response to challenging financial market conditions for infrastructure finance. Although market conditions have improved considerably, the Scheme continues to support lending for new infrastructure projects. We recognise that the Scheme can play a role in enabling progress in some nationally significant infrastructure.
22 The lessons from the Scheme have wider relevance for the extensive range of guarantees across government. The Treasury deliberately designed the Scheme to be flexible, with few formal restrictions and no upper limit on risk. It takes a narrow view that guarantees are value for money if the fee covers the risk. It is good that the Treasury has a formal governance process and commercial specialists to help evaluate, manage and set a price for risks to the taxpayer. However, we question whether this approach, on its own, can measure long-term risks to taxpayers reliably. As market conditions improve, the Treasury should ensure that it is rigorous and objective in ensuring that guarantees for projects are genuinely needed and that the projects supported bring significant public value.

UK Guarantees scheme for infrastructure Summary 11
Recommendations
a As market conditions improve, the Treasury should ensure that its eligibility criteria for this Scheme include a rigorous and objective assessment that guarantees are needed. The Treasury should reassess the eligibility of prequalified projects, reviewing this annually to understand changes in circumstances. Across government, we expect to see objective criteria for issuing any government guarantees.
b The Treasury needs to report to Parliament on the level of risk associated with guarantees. Guarantees transfer risk to the public sector. The Treasury should report to Parliament annually, and as new guarantees are issued, on the level of risk associated with the portfolio of guarantees. The Treasury should also provide information on individual guarantees that are material to the portfolio (specifically for large, non-investment grade projects) and summary information on the measures in place to mitigate risks.
c The Treasury should develop an additional pricing methodology based on an appropriate capital charge to reflect the use of the national balance sheet and other costs associated with the Scheme. Charging for guarantees provides compensation for financial risk and it is important that fees fully cover risks, especially when market prices are low.
d The Treasury should ensure that the expertise within Infrastructure UK is complemented by expert challenge from outside Infrastructure UK and that its pricing database and techniques are reviewed in line with the recommendations of the Treasury’s 2013 Review of quality assurance of government models. We also expect the commercial disciplines and practices applied in the UK Guarantees scheme (commercial charging, risk assessment, due diligence and securing senior lender rights) to be evident in all guarantees across government.
e The Treasury should consider how it can maximise competition and transparency in the allocation of all government-guaranteed debt, to minimise the premium over government issued debt. The Treasury should then use its position at the centre of government to promote best practice across other public bodies.

12 Part One UK Guarantees scheme for infrastructure
Part One
Rationale and Scheme design
The rationale for financing guarantees
1.1 Prior to the launch of the UK Guarantee scheme (the Scheme), HM Treasury’s (the Treasury) 2011 National Infrastructure Plan (NIP) identified around 500 infrastructure projects and programmes requiring investment, worth more than £250 billion, around two-thirds of which it envisaged would be privately financed. The volume of new infrastructure identified has increased in successive updates of this Plan (Figure 2). Energy sector projects account for over three-quarters of the investment that is expected to be privately financed.
1.2 The 2011 NIP stated that the UK faced challenges in attracting private investment and that ongoing instability in financial markets could disrupt the supply of long-term bank lending for project finance.1 We previously reported on delays in procuring new trains (Thameslink and Intercity Express) partly due to the severely limited availability of private finance for infrastructure projects immediately after the global financial crisis of 2007-08 (the procurements were also paused due to the 2010 General Election and Spending Review).2
1.3 The Scheme launched in July 2012 to avoid delays to investment in UK infrastructure because of adverse credit conditions making it difficult to secure private finance. Its objectives are to:
• ensure that viable infrastructure projects were not put at risk by a shortage of long-term finance;
• stimulate growth by reducing delays in current projects that are being held up in arranging finance;
• avoid unacceptable transfer of risk onto the public sector balance sheet that would strain public finances;3
• limit distortion of infrastructure finance markets; and
• attract new sources of finance, including institutional investors.
1 HM Treasury, National Infrastructure Plan 2011, November 2011. 2 There were delays of 2.5–3 years in procuring new trains using private finance. Financial close for Intercity Express
and Thameslink was not reached until 2012 and 2013 respectively. Comptroller and Auditor General, Department for Transport, Procuring new trains, Session 2014-15, HC 531, National Audit Office, July 2014.
3 At that time, UK government debt was AAA rated, but has subsequently been downgraded to AA rated.

UK Guarantees scheme for infrastructure Part One 13
1.4 The Treasury ruled out direct lending which would immediately impact on the public sector balance sheet. However, it did launch a direct lending scheme for public-private partnership (PPP) projects alongside the guarantees Scheme. Previously it had provided direct lending schemes for infrastructure, although the scale of support through this route was very limited and the programmes are now closed.4
4 The Treasury had previously responded to restrictions in bank lending for PFI projects by creating The Infrastructure Financing Unit in 2009, to lend directly to project companies to fill any project shortfalls. This scheme provided a £120 million loan to complete a £582 million waste treatment and power generation project in Manchester but supported no other projects. We reported in 2010 that the Treasury’s decision to lend directly had helped improved market confidence. Comptroller and Auditor General, HM Treasury, Financing PFI projects in the credit crisis and the Treasury’s response, Session 2010-11, HC 287, National Audit Office, July 2010.
Figure 2New infrastructure investment identified by HM Treasury in successive National Infrastructure Plans
Amount of new investment (£m)
Other 84,946 110,614 136,085 153,029 162,635
Of which expected 172,466 199,308 240,987 230,072 303,396 to be privately financed
Total 257,412 309,922 377,072 383,101 466,031
Note
1 Other finance in 2014 includes £50 billion for HS2, which was not categorised to either public or private finance.
Source: National Audit Office analysis of HM Treasury National Infrastructure Plans 2011−2014
2011 2012 2013 July2014
Dec2014
500,000
450,000
400,000
350,000
300,000
250,000
200,000
150,000
100,000
50,000
0

14 Part One UK Guarantees scheme for infrastructure
Financial market conditions
1.5 According to Infradeals, which reports project finance deals, there was at least £44 billion of debt investment in new infrastructure projects in the UK over 2006–2014.5 However, debt financing halved from more than £6 billion in 2006 to around £3 billion by 2010, recovering to more than £5 billion per year 2012–2014. In particular, project bond issuance halted between 2007–2012 and has remained significantly below 2006 volumes. The price of bank finance rose steeply, peaking at the height of the financial crisis in 2009 and remaining high until 2014.6 The decline in bank lending lags behind the timing of the financial crisis and may also be influenced by the 2010 Spending Review, which put a number of infrastructure projects on hold (Figure 3).
1.6 Between the time the Treasury announced the Scheme in July 2012 and the first guarantee in April 2013, financial markets remained fragile. Although bank lending had shown signs of recovery, project bond financing was largely unavailable and banks faced new regulatory requirements to hold more capital, which may constrain growth in lending.7 By 2014, however, the Treasury identified greater availability and diversity in sources of infrastructure project finance (including through this Scheme) and stated that the “government expects the infrastructure investment market to remain buoyant in facilitating future projects”.8
1.7 Although there were more lenders active over 2011–2014 than prior to the crisis in 2006 (Figure 4 on page 16), bank lending was concentrated in a few large projects (Figures 3 and 4): many new lenders only provided finance for 1 large transaction, where they had a particular interest (for example, a client relationship). Some institutional investors, such as Allianz and Aviva, invest directly. International banks from France, Germany and Japan are regularly in the league-tables and some of the major UK banks, such as RBS and Lloyds, are less prominent than before the crisis. There has also been a sustained growth in state lending via development banks. In 2014, the top 3 lenders (according to Infradeals) were the European Investment Bank, HM Treasury (with £827 million in guarantee-backed finance) and the Japan Bank for International Cooperation, respectively. The European Investment Bank doubled its annual lending to UK infrastructure projects and related companies from £2.3 billion in 2006 to £4.9 billion in 2013.9
5 Source: Infradeals. Data includes debt but not equity finance or investment by utility companies, which is not reported as ‘project’ investment. Infrastructure project investment which includes equity finance amounts to £63 billion.
6 Measured on a selection of European infrastructure projects, as a spread above LIBOR.7 The European Central Bank has been carrying out a financial health check of 130 banks in the euro area. Following the
findings, banks will have to submit plans detailing how shortfalls in capital will be covered.8 HM Treasury, National Infrastructure Plan Finance Update, March 2014.9 The UK has a contingent financial commitment to the European Investment Bank of up to £30 billion.

UK Guarantees scheme for infrastructure Part One 15
Figure 3Lending to new UK infrastructure projects 2006–2014
Capital market finance 3.51 1.20 0.00 0.00 0.00 0.00 0.00 0.86 0.61 (bond issues) (LHS)
Bank lending equal to or 0.00 0.00 2.20 2.07 0.73 0.74 3.77 2.22 2.21 greater than £500m (LHS)
Bank lending where debt is 3.12 4.33 1.87 2.63 2.13 2.37 1.66 3.05 3.25 less than £500m, (LHS)
Price of bank finance at 0.84 1.00 3.81 2.78 3.33 3.43 3.48 2.42 maturity of loan (RHS)
Price of bank finance at 0.75 0.85 2.94 2.07 2.71 2.62 2.43 1.73 financial close (RHS)
The figure shows trends in the levels of bank and capital market (bond) finance for new UK infrastructure projects, alongsidetrends in the price of bank finance
Volume of bank and bond financing (£bn) Price of bank finance (% over LIBOR)
4.5
4.0
3.5
3.0
2.5
2.0
1.5
1.0
0.5
0
7.0
6.0
5.0
4.0
3.0
2.0
1.0
02006 2007 2008 2009 2010 2011 2012 2013 2014
Notes
1 The price of debt is measured as a margin over the London Interbank Offered Rate for the relevant currency. Margins are indicative. We calculated them by averaging the margins from 3 or 4 projects that reached financial close during the relevant year. There are a total of 27 projects, consisting of a mix of European and UK infrastructure projects.
2 The difference between the margin at financial close and the maturity of the loan is due to step-up or step-down clauses within the loan agreements that increase (or decrease) margins over the terms of the loans.
3 The 6 bonds above £200 million (and their total capital market financing) were: Allenby/Connaught (Aspire Defence) (£1,464 million), Barts and the London NHS Trust-Hospital Redevelopment (£1,020 million), South Lanarkshire Schools PPP (£352 million), Birmingham New Hospitals PFI (£344 million), Greater Gabbard Wind Farm Transmission Link (£305 million) and Pinderfields and Pontefract Hospitals Development Project (£221 million).
4 The projects with bank debt exceeding £500 million are as follows (year of financial close, bank debt): Intercity Express Programme Phase 2 (2014, £2,210 million), Thameslink Rolling Stock (2013, £1,596 million), Drax Biomass Conversion Project (2013, £625 million), Intercity Express Programme Phase 1 (2012, £2,437 million), Lincs Offshore Wind Farm (2012, £1,333 million), London Gateway Port (2011, £740 million), North Bristol Hospital (Southmead) (2010, £727 million), M25 Widening Scheme (2009, £1,520 million), Greater Manchester Waste Management Project (2009, £547 million) and Future Strategic Tanker Aircraft (2008, £2,198 million).
Source: National Audit Office analysis of data from Infradeals (volume of bank and bond finance); Credit Agricole (bank price)

16 Part One UK Guarantees scheme for infrastructure
Figure 4Trends in diversity of bank lending
Number of lenders
The number of banks lending to new infrastructure projects and the proportion of lending provided by the top 5 banks in each year
Proportion of lending by top 5 lenders (%)
Source: National Audit Office analysis of Infradeals data
0
10
20
30
40
50
60
70
0
5
10
15
20
25
30
35
40
45
2006 2007 2008 2009 2010 2011 2012 2013 2014
Number of lenders of bank or 5 10 12 11 6 24 17 24 12 bank-like debt, providers with only 1 deal (LHS)
Number of lenders of bank or 12 15 8 14 14 15 13 18 18 bank-like debt, providers with more than 1 deal (LHS)
Proportion of lending provided 64% 55% 53% 58% 51% 36% 51% 43% 57% by top 5 lenders (RHS)

UK Guarantees scheme for infrastructure Part One 17
1.8 Prior to the financial crisis project bonds represented a choice of finance for some large infrastructure projects. These were routinely issued with a guarantee provided by one of the ‘monoline’ insurance companies and were bought by pension funds and life insurance companies.10 Project bond issuance halted during the crisis, as 4 of the 6 monoline insurers either went out of business or saw their credit ratings collapse. Following the crisis, only Assured Guaranty remained. Bank debt remained the main source of finance until project bond issuance resumed in 2013 with 4 project bond financings each guaranteed by Assured Guaranty and the Greater Gabbard OFTO (an operational asset) issued a bond supported by the European Investment Bank.11
1.9 The Treasury guaranteed bonds issued as part of the financing for the Mersey Gateway Bridge and INEOS Grangemouth ethane facility, using the same concept as monoline insurance. Investors in these bonds benefit from a stronger level of creditor protection than is available from commercial guarantors (in return for a smaller margin) because it is backed by the UK sovereign credit strength. The Treasury estimates that more than 50 institutional investors have financed infrastructure projects as a result of the Scheme. Outside of the protection of guarantees there is currently very limited lending to new infrastructure by institutional investors.
Scheme extension to 2016
1.10 The Treasury originally intended the Scheme to be a temporary intervention until December 2014. In June 2013, although financial markets had improved, the Treasury concluded that it was necessary to provide a long-term commitment to the energy market by extending the application deadline to December 2016.
1.11 Energy generation, transmission or distribution projects account for 25 out of 39 projects pre-qualified for support (and the vast majority by value), and the Treasury estimated in March 2014 that there were up to £52 billion of project finance opportunities before 2020 (around £8.7 billion annually), largely in the energy sector.12
1.12 New offshore wind projects in the UK will require new construction techniques to generate energy from locations that are further from the shore and in deeper waters. The availability of finance for such technologies is largely untested. To date, the largest amount of unguaranteed (senior) debt on an offshore wind project is €844 million on the 600 megawatt Project Gemini,13 and there are projects in the pipeline requiring finance of at least this order of magnitude: according to the Crown Estate, there are 7 projects above 600 megawatt with planning consent, and a further 4 in planning.
10 EPEC, Capital Markets in PPP Financing: Where we were and where are we going?, November 2010.11 As part of the pilot project bond credit enhancement initiative.12 Historically, most electricity-generation projects have been financed on balance sheet by large utility companies.
However, the Treasury considers that the scale of investment required in future may test the ability or willingness of utility companies to continue to finance all projects on balance sheet.
13 This project also had guarantees provided by export credit agencies and the European Investment Bank. The total debt raised was €2 billion.

18 Part One UK Guarantees scheme for infrastructure
How the Scheme works
1.13 The Scheme enables the Treasury to provide an unconditional and irrevocable guarantee to lenders to infrastructure projects. The Treasury charges each infrastructure project company (the borrower) a market-oriented fee to comply with European State Aid guidance.14
1.14 Although the Treasury intends the Scheme to respond to financing required by new projects, the Infrastructure (Financial Assistance) Act 2012 allows the government to issue guarantees to projects at all stages of their life (for example, the Treasury told us it was approached by project sponsors, XLT, to consider using the Scheme to guarantee debt refinancing on the Thameslink project).
1.15 The Treasury is using the strength of the government balance sheet to facilitate investment. Lenders and investors providing guaranteed debt benefit from the quality of the UK sovereign credit risk rating. Their credit risk is equivalent to investing in government gilts, except where the Treasury has explicitly restricted its guarantee to specific risks.15
1.16 If a project fails to pay scheduled interest or principal, the Treasury will pay the lender all amounts due (according to the original schedule) under the lending agreement by the fourth business day following a notice of demand.16 The Scheme creates a class of priority creditors that have a direct claim against the Treasury in the event of default by a project.17
UK Guarantees Scheme in an international context
1.17 State guarantees for infrastructure finance are under active consideration around the world (such as by the European Commission).18 The diversity of international schemes demonstrates features which affect the attractiveness of the guarantee to projects and lenders and the level of risk to public funds.19 A number of European member states provide credit enhancement schemes: partial guarantees that aim to reduce, but not completely eliminate, the level of project credit risk.
14 Under section 3.2 of Commission Notice on the application of Articles 87 and 88 of the EC Treaty to State Aid in the form of guarantees; Official Journal of the European Union, 2008. Available at: http://eur-lex.europa.eu/legal-content/EN/TXT/PDF/?uri=CELEX:52008XC0620(02)&from=EN
15 The ratings agencies have confirmed that these lenders are effectively taking on the UK government credit rating. 16 Calls under a guarantee must be reported to Parliament via a Written Ministerial Statement.17 We have defined the term ‘priority creditors’ to refer to the holders of guaranteed debt instruments. These may be investors
that have purchased guaranteed bonds during a book-building process, in the open market or via privately negotiated lending arrangements.
18 Understanding the challenges for infrastructure finance, Bank for International Settlements, August 2014; European Commission, An investment plan for Europe, EC, November 2014.
19 For example, the European PPP Expertise Centre highlights that state guarantees can reduce private sector incentives to perform detailed project appraisals European PPP Expertise Centre, State Guarantees in PPPs, May 2011. The Bank for International Settlements, while recognising the need for guarantees to ensure a sustainable cost of infrastructure finance, has also indicated that comprehensive public guarantees are counter-productive, Bank for International Settlements, Working paper no. 454. Understanding the challenges for infrastructure finance, August 2014).

UK Guarantees scheme for infrastructure Part One 19
The European Investment Bank’s (EIB) pilot Project Bond Initiative also launched in 2012 and runs until 2016, and aims to facilitate investment by institutional investors in project bonds. The EIB takes ‘first loss’ in the event of default, but only for up to 20% of senior project bonds: this does not reduce the cost of borrowing as much as a comprehensive guarantee backed by the EIB’s AAA credit rating (that is, full credit substitution). The EIB scheme has supported 1 deal in the UK to date (financing of the operational Greater Gabbard OFTO).20
1.18 Other European state schemes provide support that is more limited than the UK Scheme in terms of the:
• value and proportion of project debt that can be supported on any one project (EIB Project Bond Initiative, French Fonds Commun de Titrisation);
• scale of support available (French Fonds Commun de Titrisation); or
• period during which the guarantee applies (all guaranteed minimum service charge schemes, EIB loan guarantee instrument).
1.19 The UK Scheme is the most lender-friendly scheme we have identified. In contrast to partial guarantees, the Scheme is designed to provide full credit substitution, like the monoline insurance model. However, because the Scheme provides a sovereign guarantee, it gives maximum protection to lenders. In return for this insurance, lenders demand less interest since they take on risk commensurate with government gilts (discussed further in Part Four).21 There is one commercial insurance company, Assured Guaranty, currently providing credit substitution guarantees but with limits on the type of projects and level of risk that can be guaranteed (non-investment grade is not permitted) and Assured Guaranty does not carry the UK’s sovereign credit rating.22
20 The European Investment Bank can provide subordinated loans or contingent credit for up to 20% of the level of senior project bonds. This enhances the credit quality of those bonds but does not extend the EIB’s AAA credit rating to the bonds.
21 To remain State Aid-compliant, the implication is that the borrower is charged a higher fee by HM Treasury in order that the overall cost of borrowing remains market-oriented.
22 Guarantee schemes we reviewed included Assured Guaranty, the EIB Project Bond Initiative and Loan Guarantee Instrument for Trans-European Transport Network Projects, the French Fonds Commun de Titrisation and Cession de Créances schemes and the German Forfaitierungsmodell scheme.

20 Part Two UK Guarantees scheme for infrastructure
Part Two
Implementation
2.1 Having announced the UK Guarantees scheme (the Scheme) in July 2012, HM Treasury (the Treasury) put in place governance processes, engaged legal advisors to draft standardised documentation and recruited a team of commercial specialists to administer guarantees. This Part reviews the process by which the Treasury pre-qualifies projects as eligible for guarantees and how the Treasury considers value for money. Before guarantees can be issued, the Treasury also carries out risk assessment and commercial due diligence and these aspects are reviewed in Part Three.
The application process
2.2 The Treasury initially identified 50 projects that might benefit from a guarantee. It has received more than 200 enquiries from projects since the Scheme launched. The Treasury also encouraged government departments to consider the Scheme. Figure 5 shows the progress of projects under the Scheme. The Treasury makes recommendations to Ministers to pre-qualify projects, but does not record analysis against the Scheme’s eligibility criteria to support the recommendations. The Treasury told us that, in practice, many projects have not been ready for guarantees (either awaiting planning permission or government revenue subsidies). The Treasury has also turned down projects on the basis that the commercial terms are poorly structured (discussed further in Part Three), there are no relevant price benchmarks (Part Four) or because they do not meet the eligibility criteria (discussed in paragraphs 2.4 to 2.8).

UK Guarantees scheme for infrastructure Part Two 21
Summary of the first 7 guarantees
2.3 The first guarantee was signed in April 2013 and at December 2014 the Treasury had signed or approved 7 guarantees (and one standby facility) with a total value of £1.7 billion, excluding interest (Figure 6 overleaf).
Assessment of the eligibility criteria
2.4 The Treasury has set 5 criteria for projects to be eligible for a guarantee. Projects must also comply with the definition of infrastructure in the Infrastructure (Financial Assistance) Act 2012 and be consistent with European Commission guidance on state guarantees.23 We examined the extent to which the first 5 guarantees satisfied the Treasury’s criteria (Figure 7 on page 23). Criteria 4 and 5 were not precisely defined so we examined how the Treasury determined that a guarantee was needed (criterion 4) and the outcome of its initial project risk assessment (criterion 5).
23 Under the Infrastructure (Financial Assistance) Act 2012, support must meet a definition of infrastructure, which includes water, electricity, gas, telecoms, sewerage, railway facilities (including rolling stock), roads or other transport facilities, health or educational facilities, court or prison facilities and housing.
Figure 5Progress of projects considered under the Scheme
50 projects identified by HM Treasury in 2011-12 as potentially benefiting from a guarantee
More than 200 enquiries received by HM Treasury
59 projects have been pre-qualified as eligible for guarantees at some stage (including 23 of the 50 projects identified by HM Treasury)
39 projects remain pre-qualified (capital value £34 billion)
7 guarantees and 1 standby facility signed or approved to date with a value of £1.7 billion (capital value of projects worth almost £4 billion)
12 projects are going ahead without support from the Scheme
Projects going ahead
Pre-qualified projects
Potential projects
Source: National Audit Offi ce analysis of Infrastructure UK enquiries database; HM Treasury Submissions to Ministers 2011-12; and HM Treasury, National Infrastructure Plan 2014

22 Part Two UK Guarantees scheme for infrastructure
Figure 6Infrastructure supported under the Scheme
Finance supported by HM Treasury
Project name Description Region Date agreed Amount (£m)
Type Final repayment
date (duration of exposure)
Deals covered in our review
1 Drax Partial conversion of a coal fired power station to Biomass
North Yorkshire
April 2013 75 Guaranteed loan notes 2018(4.5 years)
2 SDCL EE Installation of energy saving lighting in 150 car parks
Nationwide December 2013 9 Guaranteed loan notes 2017(4 years)
3 Northern Line Extension
Extending the Northern Line to Battersea and Nine Elms as part of a regeneration project
London November 2013 750 Standby refinancing facility (not a guarantee)
n/a1 (see note)
4 Mersey Gateway Construction of a new toll bridge over the river Mersey
North West March 2014 257 Guaranteed bond 2043(29 years)
5 INEOS Grangemouth Construction of an ethane import and storage facility
Scotland August 2014 228 Guaranteed bond 2019(5 years)
Deals outside the scope of this review
6 Speyside Construction of a biomass power station in Moray Firth
Scotland August 2014 48 Guaranteed bond 2028(14 years)
7 University of Northampton
Relocation of university to new site
Midlands November 2014 292 Guaranteed bond and loans
2058 (44 years)
8 Countesswells Building of new housing in Aberdeen
Scotland August 2014 (approved but not signed)
80 Guaranteed loan
Total 1,739
Note
1 The refi nancing facility gives the Greater London Authority the ability to borrow from the Treasury under certain conditions. This facility lasts for 50 years. There is no guaranteed loan.
Source: National Audit Offi ce analysis of HM Treasury deals

UK Guarantees scheme for infrastructure Part Two 23
2.5 We found that the Treasury has guaranteed 1 project not meeting all those criteria that were clearly defined: SDCL EE was not included in the National Infrastructure Plan (NIP) and its small scale (£8.8 million) means that in our view it cannot be reasonably described as meeting the nationally significant test (criterion 1), nor did this project have any unguaranteed equity finance (criterion 3), although the project did take a variety of performance risks.
2.6 Criterion 4 requires that projects should be “dependent on a guarantee to proceed and not otherwise financeable within a reasonable timeframe”. The Treasury does not apply an objective test to satisfy this criterion. For instance, on the INEOS deal, the Treasury assessed that INEOS was unable to borrow commercially to finance its new ethane import facility because of its existing level of borrowing. Moody’s rating agency had raised a warning in November 2013 over INEOS Group’s exposure to the loss-making Grangemouth plant.24 On the Drax deal, Drax was raising corporate debt towards its biomass conversion programme, and the Treasury was able to use the price of bank debt in benchmarking its price for the guarantee (discussed further in Part Four).
24 Moody’s commentary INEOS Group’s Credit Exposure to Grangemouth Petrochemical, 11 November 2013.
Figure 7Application of eligibility criteria
HM Treasury’s eligibility criteria What the National Audit Office examined Results
1 Nationally significant, as identified in the Government’s National Infrastructure Plan 2011 as updated from time to time1
Whether projects are identified in the National Infrastructure Plan
Yes: 4 projectsNo: 1 project (SDCL EE)
2 Ready to start construction within 12 months from a guarantee being given and having obtained (or about to obtain) necessary planning and other required consents
Ready to start construction within 12 months of guarantee being awarded
Yes: 4 projectsNo: 1 project (Northern Line Extension)
3 Financially credible, with equity finance committed and project sponsors willing to accept appropriate restructuring of the project to limit any risk to the taxpayer
Whether equity finance was committed at time of guarantee
Yes: 3 projectsNo: 1 project (SDCL EE)Not applicable: (Northern Line Extension)
4 Dependent on guarantee to proceed and not otherwise financeable within a reasonable timeframe
Why the Treasury considered a guarantee was needed
Price: 1 (Drax) Availability: 2 (SDCL EE, INEOS)Tenor: 2 (Northern Line Extension, Mersey Gateway)
5 Good value to the taxpayer, assessed by the Treasury to have acceptable credit quality, not present unacceptable fiscal or economic risks and to make a positive impact on economic growth
Whether projects are investment-grade credit quality2
Investment-grade: 2Non-investment grade: 3 (Drax, SDCL EE, INEOS)
Notes
1 The government will also consider other projects of national or economic signifi cance on a case by case basis, such as university or healthcare facilities.
2 HM Treasury did not defi ne acceptable credit quality, we have therefore tested whether projects were non-investment grade, a standard categorisationused in the industry to denote higher-risk projects.
Source: National Audit Offi ce analysis of deal eligibility

24 Part Two UK Guarantees scheme for infrastructure
2.7 Criterion 5 includes a requirement that projects should have an ‘acceptable credit quality’. Although the Treasury did not define this precisely, in practice we note that 3 out of the first 5 guarantees were assessed by the Treasury to represent non-investment grade risk. In practice, the Treasury considers many infrastructure projects with construction risk are likely to be non-investment grade.
2.8 Treasury considers that criteria 4 and 5 are matters of discretion and told us that: “the decision not to define criterion 4 objectively was deliberate because the point of the Scheme was to avoid delays to infrastructure, and introducing an objective test here would actually have introduced delays if a project needed to present, for example, a formal rejection letter from other commercial financial institutions before a project could come to government for support. It is important to see this in the context of the recognised constrained financial environment”.
Value-for-money considerations
2.9 The Treasury considers that value for money is demonstrated within the Scheme if the guarantee fee reflects the market price for the risk borne by the taxpayer at the point the deal is agreed (see Parts Three and Four of this report). Infrastructure UK typically becomes involved at the end of the project process and does not consider the overall value for money of the underlying project or evaluate the relative economic impact of alternative projects. Instead, it takes the value-for-money case as a given and focuses on getting projects delivered, provided they are consistent with existing government policy. This contrasts with the Treasury’s Managing Public Money guidance, which requires consideration of the overall impact on public resources, defining value for money as “good value judged for the public sector as a whole, not just for the accounting officer’s organisation”.25 It is important that the Treasury ensures guaranteed projects are good value for money for the public sector overall.
2.10 There was considerable wider public sector involvement in the first 5 deals supported by the Treasury, 2 of which are considered ‘on-balance sheet’ for national accounts purposes (Figure 8). We note that, for example, both the Treasury and the Green Investment Bank supported finance for the Drax project, but there was no government overview of whether it was better value for money to guarantee finance or provide direct lending, or to provide support in conjunction (as was the case).
25 HM Treasury, Managing Public Money, July 2013.

UK Guarantees scheme for infrastructure Part Two 25
2.11 The Treasury itself played a wider role in 2 projects:
• The Northern Line Extension is an intra-government arrangement. The support for the Battersea regeneration project was negotiated between the Treasury and the Greater London Authority.
• The Mersey Gateway Bridge. The Treasury’s analysis stated: “no additional value for money (VfM) test is necessary for the UK guarantee facility beyond the one that has already been carried out by Halton Borough Council for the project as a whole”. The Treasury also provided a letter of comfort for the Department for Transport’s separate guarantee of toll revenues.26
26 We previously reported on the decision to use PFI for the Mersey Gateway Bridge in: Comptroller and Auditor General, Review of the VfM assessment process for PFI, Briefing for House of Commons Treasury Select Committee, October 2013. Further information on the revenue guarantees can be found in the Department for Transport Annual Report and Accounts (2013-14).
Figure 8Wider public sector involvement in supported projects
Scheme [ONS classification] Other government activity
1 Drax [off balance sheet]
The Green Investment Bank is lending £50 million
Department of Energy and Climate Change incentives for renewable energy, for example Renewable Obligation Certificates, Contracts for Difference
2 SDCL EE [off balance sheet]
The Green Investment Bank is an investor in the SDCL EE fund
3 Northern Line Extension [on balance sheet]
The Greater London Authority is borrowing a portion of the funds from the Public Works Loan Board, part of the Debt Management Office, an executive agency of the Treasury
The Treasury granted the Greater London Authority (GLA) a 25-year enterprise zone, as part of the regeneration project, with an option to extend by 5 years if revenues are insufficient to allow the GLA to meet its repayments
4 Mersey Gateway [on balance sheet]
This is a public-private partnership project sponsored by Halton Borough Council, originally approved by the Department for Transport
The Department for Transport is providing a grant in support of the project, and a separate guarantee in support of the revenues from the toll bridge, which the Treasury confirmed its support for
5 INEOS Grangemouth [off balance sheet]
Scottish Enterprise has provided £9 million of Regional Selective Assistance funding, the purpose of which is to help create and safeguard jobs
Source: National Audit Offi ce analysis

26 Part Three UK Guarantees scheme for infrastructure
Part Three
Risk
3.1 This section looks at how the HM Treasury (the Treasury) measures and manages risks at 3 levels: the projects receiving guarantees, the Scheme as a whole and how the risks are reflected in government accounts.
Project-level risk
3.2 The Treasury has developed a bespoke internal approvals process to ensure that guarantees receive appropriate and proportionate scrutiny and challenge. The Treasury has assembled a team of 12 commercial specialists with backgrounds in infrastructure finance to measure and manage project-related risks. The approvals process includes challenge and scrutiny by a risk officer independent of the guarantees team, before a guarantee is submitted to the Accounting Officer and then Ministers for final approval. For each new project, the Treasury conducts an assessment of initial project risk in-house based on due diligence and other techniques used by project finance banks and credit rating agencies methodologies. Risks are assessed on a scale similar to that used by credit rating agencies. The initial project risk ratings on the first 5 projects were:
• Drax biomass 11
• SDCL EE 14
• Northern Line Extension 3
• Mersey Gateway 9
• INEOS Grangemouth 14
3.3 Figure 9 on pages 27 and 28 provides a summary of credit rating methodology and presents data on historic default rates for different ratings. None of the non-investment grade guarantees the Treasury has provided are longer than 5 years. It is important to note that a default does not necessarily lead to complete loss. In fact, the rating agencies’ own publications note that signfiicant recovery levels are achievable in the infrastructure asset class.

UK Guarantees scheme for infrastructure Part Three 27
Figure 9Credit rating methodology
A credit rating is an assessment of the credit worthiness of a borrower on the basis of detailed financial and legal information. This assessment requires substantive quantitative and qualitative analysis and professional judgement. Credit rating agencies publish methodologies for various industries. The rating is summarised by a lettering system which corresponds to the expected probability of default for loans in each ratings band derived from statistical analysis of historical defaults (AAA denotes the lowest risk of default). The Treasury’s commercial specialists employ a similar ratings scale to the rating agencies.
Lowest risk Highest risk
Investment grade Non-investment grade
S&P AAA AA+ AA AA- A+ A A- BBB+ BBB BBB- BB+ BB BB- B+ B B-
Moody’s Aaa Aa1 Aa2 Aa3 A1 A2 A3 Baa1 Baa2 Baa3 Ba1 Ba2 Ba3 B1 B2 B3
Treasury guarantees rating scale
1 2 3 4 5 6 7 8 9 10 11 12 13 14 15 16
The probability of default increases as the credit rating deteriorates and the longer the risk exposure (there is no available data beyond a 10-year exposure).
Historical default rates by credit rating
Moody’s 1 year default rates1
Moody’s 5 year default rates1
Moody’s 10 year default rates1
S&P default rates over whole
project life2
S&P worst case depression-like
scenario3
Investment grade (A) 0.1%A
0.1%B1
0.8%A
0.8%B
1.0%B1
1.6%A
2.8%B1
2.6%
(51 projects)
7.1%
Low investment grade (BBB)
0.2%A
0.2%B1
0.2%C
1.5%A
1.6%B
1.9%B1
2.0%C
2.8%A
4.6%B1
4.7%C
33.3%
(334 projects)
14.8%
Non-investment grade (BB)
0.6%A
1.1%B1
1.1%C
5.5%A
8.0%B
10.1%B1
11.1%C
8.5%A
19.3%B1
20.7%C
35.9%
(114 projects)
55.4%
Non-investment grade (B)
2.7%A
3.9%B1
14.7%A
19.1%B
23.9%B1
23.1%A
40.6%B1
25.6%
(63 projects)
No data
(See note 3)

28 Part Three UK Guarantees scheme for infrastructure
Commercial due diligence
3.4 To support assessment of project risk, potential investors or guarantors commission legal, financial and technical due diligence reports and industry-specific reports.
3.5 As set out in Figure 10, the Treasury used due diligence in its risk assessment. We found that:
• due diligence reports covered standard areas for 4 of the 5 projects. For SDCL EE, the Treasury relied solely on legal due diligence (and its own assessment of National Car Parks’ (NCP) public financial statements) as it considered it was taking on a very limited risk of non-payment by NCP;
• The Treasury actively used due diligence reports, following up with detailed questions on draft reports to seek further evidence where required, and using the findings in its risk assessments; and
• The Treasury commissioned its own legal due diligence for all 5 projects, but relied on borrower-commissioned due diligence in all other respects (in common with project finance practice). The Treasury obtained letters from the consultants confirming that it could rely on their work. This assurance confirmed that the work was independently carried out in line with the original terms of reference, but the terms of reference were specified by the borrower (the Treasury told us that it always ensured it was content with the scope of work).27
27 Both the Green Investment Bank and Assured Guaranty told us they would normally seek to set or approve the terms of reference for due diligence.
Figure 9 continuedCredit ratings methodology
An event of default does not mean that the lender loses all their investment. Historical data show that recovery rates vary from around 50% to 80% depending on the type of investment (infrastructure assets tend to have higher recovery rates). Moody’s Investors Service concluded that infrastructure corporate debt ratings have been relatively more stable than other corporate debt issuers, and that rates of loss have been lower.
Notes
1 Moody’s Investors Service research: A) Moody’s Infrastructure Default and Recovery Rates 1983-2013. Exhibit 12, Corporate Infrastructure Debt Securities. Sample size not stated but includes more than 1,000 securities issued by corporate infrastructure and project fi nance entities. B) Moody’s Annual Default Study: Corporate Default and Recovery Rates 1920–2013, including fi nancial institutions, non-fi nancial corporates and regulated utilities. This report is based on a sample of more than 20,000 corporate issuers. Exhibit 27, Average 5-year letter rating migration rates 1970–2013 B1) Exhibit 33, Average Cumulative Issuer-Weighted Global Default Rates by Letter Rating, 1970–2013 C) Moody’s Default and Recovery Rates for Project Finance Bank Loans 1983–2012. This report is based on a sample of 4,425 projects. Exhibit 11a.
2 Standard and Poor’s, Lessons Learned from 20 Years of Rating Global Project Finance Debt, October 2014. Issue defaults based on an initial rating from 513 different projects rated by S&P in the past 20 years.
3 Standard and Poor’s, Methodology for Setting Capital Charges on Project Finance Transactions, September 2007, updated 2014. Standard and Poor’s assigns a worst case default frequency of 66.9% for B rated credit risk.
Source: National Audit Offi ce analysis

UK Guarantees scheme for infrastructure Part Three 29
Risk assessment process
3.6 The Treasury considers that projects with a credit rating weaker than 16, equivalent to B- (corresponding to an in-year probability of default greater than 5%), are not compatible with the European Commission’s State Aid framework, and that this effectively limits the level of risk that it will enter into. However, there are no limits on the duration over which the Treasury bears risk. The Treasury’s restriction does not amount to a clear threshold for the maximum risk of default it will tolerate over the lifetime of a guarantee.
3.7 The Treasury’s approvals process and other key aspects of the Scheme’s management are set out in a formal procedures manual which is reviewed and signed off on an annual basis by the Treasury’s Executive Management Board, amended as necessary based on lessons learned and internal audit findings in the past 12 months. It specifies:
• a deal team carries out due diligence, financial structuring and sensitivity analysis of potential deals, negotiating with the borrowers;
• the deal team produces a report summarising the evidence it has examined, and prepares the initial risk assessment;
• the Infrastructure UK risk officer (independent of the deal team), reviews deal team documentation, summarises key issues, and prepares a second opinion;
Figure 10Due diligence analysis, and who commissioned the analysis
Deal Legal Technical Financial/ Model Audit Other
1 Drax Allen & Overy (HM Treasury)
Parsons Binkerhoff Power (Drax)
PKF LLP (Drax) PwC report on biomass sustainability; Poyry report on biomass sourcing (Drax)
2 SDCL EE Pinsent Mason (HM Treasury)
None None None
3 Northern Line Extension
Freshfields(HM Treasury)
EC Harris (GLA) PwC (GLA) BNP Paribas Real Estate and KPMG advice on revenues (GLA)
4 Mersey Gateway Freshfields(HM Treasury)
Sweett Limited (Project) BDO (Project) Insurance report – (Project)
5 INEOS Ashurst(HM Treasury)
Nexant (INEOS) PwC (INEOS) Nexant petrochemicals market study and Environmental Resource Management (INEOS)
Source: National Audit Offi ce document review and interviews with HM Treasury

30 Part Three UK Guarantees scheme for infrastructure
• The Treasury’s risk committee reviews these reports and confirms the risk rating and may propose changes to terms;28 and
• a summary recommendation is presented to the Accounting Officer, along with the risk committee report. From the Mersey Gateway deal onwards, the risk officer’s second opinion has also been shared with the Accounting Officer.
3.8 There is no record of discussion of risk committee meetings, limiting transparency if there is not consensus over the terms of a deal. An internal audit report in April 2014 found that this is because management considered it necessary to “demonstrate full support and approval from the risk committee” and that if areas of concern or disagreements were documented there is a risk that if made public this “could potentially be used to challenge the guarantee and call into question the decision to approve, possibly resulting in reputational risk to the government”.
Intervention rights and performance information
3.9 It is customary for a lender (or guarantor) to protect itself by securing certain rights to information to identify risks early so that remedial action can be taken if necessary. The Treasury secures the rights to step into the shoes of the lender to control assets and recover monies in the event of default, with the degree of control the Treasury considers acceptable based on the circumstances involved in that project. For example, the Treasury has usually secured standard senior lender rights, where appropriate, in the first 5 deals we reviewed.29 We reviewed the rights the Treasury secured in the first 5 projects against industry standard practice and the Treasury’s own internal guidance (Figure 11).30
3.10 We found that in 3 of 5 projects the Treasury secured most of the standard rights. It decided not to require monthly construction reports or financial forecasts for Drax (in common with other lenders) and we consider that this information could improve risk monitoring. For the other 2 projects:
• On SDCL EE, the Treasury is exposed to non-payment risk by NCP, but does not have rights to review NCP’s future financial projections, so cannot anticipate the likelihood of its guarantee being called. The Treasury does not have direct recourse to NCP in the event of default, but can direct SDCL EE to recover monies.
• On the Northern Line Extension, the Treasury did not secure standard rights because it is a refinancing facility involving another public sector body.31 The Treasury has recourse to the Greater London Authority in the event any loan is not repaid.
28 The risk committee members are: the Chief Executive of Infrastructure UK (the Chair), the risk officer, the Treasury finance director and the director of public spending. There are no commercial specialists independent of Infrastructure UK.
29 This includes security over shares and other assets, information on project progress, financial covenants, trigger events, events of default and other clauses that are standard for senior lenders in project financing.
30 Based on the requirements put in place by Assured Guaranty.31 In the event that local enterprise zone revenues are insufficient for the GLA to repay its loans, the GLA will be entitled to
borrow additional funds from the Treasury (up to 75% of the project value).

UK Guarantees scheme for infrastructure Part Three 31
Ongoing monitoring and remedial action
3.11 Given the long life of some guarantee commitments (the Northampton guarantee exposes the Treasury to risks for 44 years), ongoing monitoring and surveillance must be capable of surviving staff turnover. We reviewed the arrangements in relation to:
• Handover notes. Details of arrangements for collecting fees and monitoring performance had been prepared for all of the 5 signed guarantees.
• Monitoring. The Treasury has recruited a Head of Portfolio Management to undertake day-to-day oversight of guarantees, including early-warning monitoring and planning mitigating action.
• Paying creditors in the event of default. The Treasury carried out a dry-run exercise of the arrangements for responding to a notice of demand from a lender to pay out on a guarantee. This resulted in an agreed procedure with other Treasury teams to make payments by the fourth business day following any demand. The Treasury team has not carried out its annual review of this procedure due in October 2014.
Figure 11Rights secured by HM Treasury on projects
Project Monthly reports on progress during construction
Rights to visit and discuss progress with management team
Updated financial projections during operations
Confirmation of compliance with financial covenants
Ability to withhold debt drawdowns
Rights to lock up dividends to sponsors
Rights to ‘step-in’, in place of the borrower
1 Drax No Yes1 If corporate risk rating falls below a threshold
Yes n/a (fully drawn at start)
Yes Yes
2 SDCL EE Yes No2 No2 n/a (there are no covenants)
n/a n/a Partial
3 Northern Line Extension
No No No n/a No n/a Partial3
4 Mersey Gateway Yes Yes4 Yes Yes Yes Yes Yes
5 INEOS Grangemouth
Yes Yes1 Upon request Yes Yes Yes Yes
Notes
1 Semi-annual.
2 HM Treasury has rights to discuss progress with SDCL EE management and receives fi nancial statements and progress reports. However, it does not have access to NCP management or NCP future fi nancial projections.
3 If the standby fi nancing facility is used, the Treasury has general recourse to the GLA.
4 Via the lenders’ technical advisor.
Source: National Audit Offi ce analysis of HM Treasury deals

32 Part Three UK Guarantees scheme for infrastructure
• Intervening to protect taxpayers if a project runs into financial difficulty. Although the Treasury has obtained certain rights to intervene if guaranteed deals experience difficulty, the exercise of such rights can require careful planning, and their use by government is untested within this Scheme.32 There has been no equivalent dry-run exercise to test such rights, but the Treasury relies on the significant commercial experience that exists within the team.
Scheme-level risk
3.12 The Treasury has set an overall limit of £40 billion of guaranteed debt, although this excludes interest payments, which can be significant. For example, on the 29-year £257 million Mersey Gateway bond, the total cash interest is £241 million (before taking account of recovery). Although the Treasury only plans to enter into commitments after a considerable degree of due diligence, its cautious planning assumption is that with a portfolio of this size and complexity, and given the nature of infrastructure investments, projects could encounter serious difficulties before they are completed.
3.13 The individual guarantees do not constitute a diversified portfolio of risks and are not intended to be. There are no limits for the level of risk exposure from the Scheme as a whole and no specific targets for the amount of support the Treasury aims to provide for an individual project or for the proportion of debt financing within an individual project (for example, the Treasury was prepared to guarantee 100% of the debt finance on the Mersey Gateway project).33 Guarantees currently range in size from £8.8 million to £750 million and around two-thirds of the financial exposure is to investment-grade credit risk. The maximum exposure is highly dependent on whether support for the Hinkley Point C nuclear power plant is confirmed, for which the Treasury has indicated it may guarantee up to £17 billion of project debt (see Figure 12).
3.14 Once the Treasury enters into a guarantee agreement it is exposed to a risk of default until all the guaranteed finance is repaid. This risk cannot be sold or transferred to another party. The length of exposure varies from 4 to 44 years.
3.15 Infrastructure UK has an operational objective to be self-financing. Guarantee fees are counted towards this objective, providing an incentive to issue guarantees (subject to satisfactory governance procedures). Internal financial schedules indicate that the Treasury’s estimated income from guarantee fees in 2014-15 (£12.3 million) exceeds expenditure on staff costs for the Scheme (£1.8 million) and for Infrastructure UK as a whole (£8.1 million). However, this methodology does not include consideration for risk to the government’s balance sheet (for example, via a capital charge) or for administrative overheads (discussed in paragraph 4.24).
32 Examples of typical protections include blocking dividends to equity, replacing subcontractors, refinancing, rights to ‘step-in’ to key project agreements in place of the borrower (Allianz Global, Investors update, July 2013).
33 The project sponsor, Halton Borough Council, turned this offer down on the basis that it preferred to make sure that 50% of the debt finance came from private sector sources, whose funds would be at risk, with the aim of bringing greater commercial discipline to the project.

UK Guarantees scheme for infrastructure Part Three 33
3.16 The UK Financial Reporting Council now expects directors of a company to assess long-term financial viability and to state whether they have a reasonable expectation of being able to continue operation and meet future liabilities. It recommends stress and sensitivity analysis to simulate overall resilience to risks including in severe but plausible scenarios.34 Global financial service firms typically report a range of measures of portfolio credit risk based on a variety of different methods for estimating potential losses.35
Guarantees and contingent liabilities in government
3.17 The public sector is exposed to a large number of guarantees and other contingent liabilities. The latest Whole of Government Accounts (2012-13) identifies £173 billion in contingent liabilities across the public sector (Figure 13 overleaf). There are other contingent liabilities that are not included in the accounts, or are included, but remain unquantified.
34 Financial Reporting Council, Guidance on Risk Management, Internal Control and Related Financial and Business Reporting, September 2014.
35 Methods may include actuarial and statistical models, providing detailed reporting on probability of default, loss given default and exposure at default.
1.7
0
5
10
15
20
25
30
35
40
45
Total value of financial support issued
(at December 2014)
Potential future totalfinancial support, based
on current HM Treasury pipeline (at October 2014)
Limit to the size of the
UK GuaranteesScheme
10.4
13.7
Estimate of total financial support based on HM Treasury’s probability of doing deals
Total value of financial support that may be issued based on current HM Treasury pipeline
24.1
40.0
Figure 12Current and potential future liability to the taxpayer (excluding interest)
£ billion
Financial support issued to date is £1.7 billion, while a total of £24.1 billion, may be issued in the future based on the current pipeline
Source: National Audit Office analysis of HM Treasury estimates of value of support to prequalified projects and probability

34 Part Three UK Guarantees scheme for infrastructure
3.18 Guarantees for infrastructure projects have been subject to calls in the past, although the terms of government support were different and are not directly comparable to this Scheme. We reported that the Department of Transport (DfT) guarantees for High Speed 1 meant that it was exposed to shortfalls in Eurostar revenue.36 In 2009 DfT assumed responsibility for servicing and repaying the debt, valued at £4.8 billion. We also reported on the failure of Metronet, which went into administration in July 2007. Transport for London guaranteed 95% of Metronet’s borrowing. DfT made a £1.7 billion payment to meet the guarantee.37
36 Comptroller and Auditor General, Department for Transport, Lessons from major rail infrastructure programmes, Session 2014-15, HC 267, National Audit Office, October 2014
37 Comptroller and Auditor General, Department for Transport, The failure of Metronet, Session 2008-09, HC 512, National Audit Office, June 2009.
Figure 13Guarantees and contingent liabilities across the public sector
£1.7 billion guarantees issued under this Scheme to date2
Notes
1 Diagram not to scale.
2 £1.7 billion not refl ected at time of Whole of Government Accounts for year ended 31 March 2013.
3 The £80 billion of potential new guarantees is lower than the sum of the scheme limits because part of these limits have already been used.
Source: National Audit Offi ce analysis
Whole of public sector: £173 billion of guarantees and other contingent liabilities reported, including:
• Network Rail (£34.4 billion)
• European Investment Bank – callable capital subscription (£30.2 billion)
• HM Revenue and Customs legal and other disputes (£14.5 billion)
• Export guarantees and insurance policies (£12.7 billion)
• Financial guarantees issued to certain depositors with public sector banks (£11.9 billion)
Source: Whole of Government Accounts for year ended 31 March 2013
Whole of public sector£173 billion
Around £80 billion potential future guarantees
Plus in addition around £80 billion of potential new guarantees not yet committed or recognised in the accounts, based on:
• Infrastructure Guarantees scheme (£40 billion limit)
• Help to buy (£12 billion limit)
• UK Export Finance (£50 billion limit on guarantees)
Source: National Audit Office analysis of Budget 2014 and Autumn Statement 2013
UK Guarantees scheme for infrastructure Part Three 35
3.19 The government has also provided substantial support to the banking sector. In December 2010 we reported on the support schemes for UK banks during the financial crisis.38 This identified £850 billion of support packages including guarantees, loans and purchase of bank shares, although a large portion of this has subsequently unwound (and is therefore not shown on Figure 13).
Reporting guarantee commitments
3.20 International best practice suggests that all government guarantees, their beneficiaries, the gross exposure created by them, and their probability of being called, are published at least annually.39 The Treasury reports to Parliament on the Scheme under the Infrastructure (Financial Assistance) Act 2012, and through its annual report and accounts.40 Government accounts disclose partial information on the level of risk exposure from guarantees and contingent liabilities. The Treasury’s accounts and report to Parliament on the Scheme give the names and duration of individual guarantees, the aggregate value of debt guaranteed (disclosed in the accounts under remote contingent liabilities) and the annual fees (separately disclosed in part 5 of the annual report).41 The Treasury does not publicly disclose its assessment of the risk rating and probability of default of guarantees, or the fee income on individual deals.42 Although the accounts state the maximum potential liability under the Scheme, the Treasury does not report the amount of interest guaranteed or the likely rate of recovery in the event of a call under the guarantee.
38 Comptroller and Auditor General, HM Treasury, Maintaining the financial stability of UK banks: update on the support schemes, Session 2010-11, HC 676, National Audit Office, December 2010.
39 International Monetary Fund, Update on the Fiscal Transparency Initiative, August 2014.40 Available at: www.gov.uk/government/publications/report-to-parliament-under-the-infrastructure-financial-assistance-
act-2012-for-the-period-1-april-2013-to-31-march-2014. The Infrastructure (Financial Assistance) Act 2012 requires the Treasury to report annually to Parliament on the guarantees entered into by the Treasury; any expenditure incurred; sums received by the Treasury (including fees); the current amount of the actual or contingent liabilities.
41 For each project, the liability is set equal to the net present value of fee income receivable (disclosed in the balance sheet statement as an asset) representing its assessment of the fair value of the risk of each transaction. Fair value represents what the Treasury would have to pay someone in the market to take the liability.
42 Accounting standards require that the Treasury makes a provision if it estimates the probability of default in a given year exceeds 50%. If the probability of default is judged to be below this threshold, the Treasury lists the maximum potential liability as either a contingent liability (if the probability of default is between 5% and 50%) or a remote contingent liability (if the probability of default is under 5%). Beyond these categories there is no indication of the specific level of risk. For example, a 5-year commitment with a 4% annual probability of default presents a far lower risk than a 30-year commitment with a 4% annual probability of default, yet both are disclosed as remote contingent liabilities in the accounts. Potentially, the Treasury may make an annual fair value assessment of what price a market buyer would charge to take on the liability. However, the Treasury is not required to disclose this value unless it considers it is materially different from the liability shown in the balance sheet.

36 Part Four UK Guarantees scheme for infrastructure
Part Four
Price
4.1 This part of the report considers the data and methods the HM Treasury (the Treasury) uses to price guarantees to adequately reflect the risk to the taxpayer. We also consider the level of returns to investors in guaranteed debt.
4.2 The price of a guarantee is the fee that the Treasury charges the borrower (the infrastructure project) to compensate the taxpayer for the risk that the project is unable to repay debt and interest and that the Treasury will be required to pay. The fee is paid over the life of the loan; however, once the guarantee has been issued the fee cannot change (this gives projects certainty over the cost of finance and is common practice in project financing). Lenders to a project are not affected by the guarantee fee: they do not pay it. If a project could obtain cheaper sources of finance and repaid the guaranteed debt, the guarantee would cease along with the liability to the government.
How the Treasury derives the guarantee price
4.3 Guarantees are not intended to provide subsidised lending. To comply with European State Aid guidance for guarantees, the Treasury sets fees for each project that ensure the borrower pays a market-oriented cost for its debt finance and therefore does not receive State Aid.43 Treasury’s commercial specialists use their risk assessment to identify appropriate price benchmarks from the financial markets and conduct negotiations with project companies and their advisors.
4.4 Proposed fees are reviewed by the Treasury’s risk committee. The committee sets a range within which the fee must fall, allowing the fee to be adjusted up or down at financial close of the project to reflect the latest market conditions. Guarantee fees are typically a few percentage points of the face value of the loan or bond that is guaranteed. The Treasury told us that its guarantee fees are commercially sensitive and should not be publicly disclosed.
43 European Commission, Notice on State Aid in the form of guarantees, 2008. The price paid must be at least as high as the corresponding guarantee premium benchmark that can be found on the financial markets. If no corresponding benchmark can be found on the financial markets, the total cost of the guaranteed loan, including the interest rate of the loan and the guarantee premium has to be compared with the market price of a similar non-guaranteed loan (European law also prohibits providing guarantees to borrowers in financial difficulty). This approach differs from the Treasury pricing of the Credit Guarantee Scheme, where the Treasury did not charge the ruling market rate. We reported on this previously, see: Comptroller and Auditor General, HM Treasury, Maintaining the financial stability of UK banks: update on the support schemes, Session 2010-11, HC 676, National Audit Office, December 2010.

UK Guarantees scheme for infrastructure Part Four 37
4.5 The Treasury has produced a pricing practice note setting out how to choose price benchmarks that have a similar risk rating and duration to the project under consideration. It recommends using a combination of the following possible methods:
• Method 1: Market price of commercial guarantees;
• Method 2: Bank debt in the same or similar transaction as that under consideration;
• Method 3: Market prices for corporate and project bond prices; and
• Method 4: Market prices for credit default swaps.
4.6 These pricing approaches require the appropriate professional judgement, for which the Treasury relies on its team of 12 commercial specialists. Their judgements are subject to negotiation with the projects (who have an incentive to minimise fees) and at times challenge by the credit rating agencies and the European Commission (who seek to ensure the fee is sufficient to avoid State Aid).
4.7 Commercial insurance companies such as Assured Guaranty are required to set aside minimum risk capital to maintain their credit ratings. European Commission guidance also expects government guarantee schemes to set fees that cover risk, administration costs and a cost of capital.44 We have therefore also considered an alternative approach:
• Method 5: Minimum capital charges.
Review of price-setting for the first 5 guarantees
4.8 Figure 14 overleaf shows the approaches used by the Treasury to price the first 5 projects. The Treasury used market reference points in all but 1 case (Northern Line Extension),45 although a combination of approaches was only used on the INEOS Grangemouth and Drax transactions.
44 The Treasury sets prices for guarantees under section 3.2 (individual guarantees) of the Commission notice on guarantees. Section 3.4 (on guarantee schemes) includes guidance on setting minimum fees using a minimum capital charge approach.
45 The Northern Line Extension is a notable exception – as a transaction between 2 public sector bodies, there was no requirement to set a market price, and the Treasury set the price equal to the discount that the Greater London Authority (GLA) was receiving on its cost of borrowing from the Public Works Loan Board. For this reason, this particular transaction is not considered further in this part.
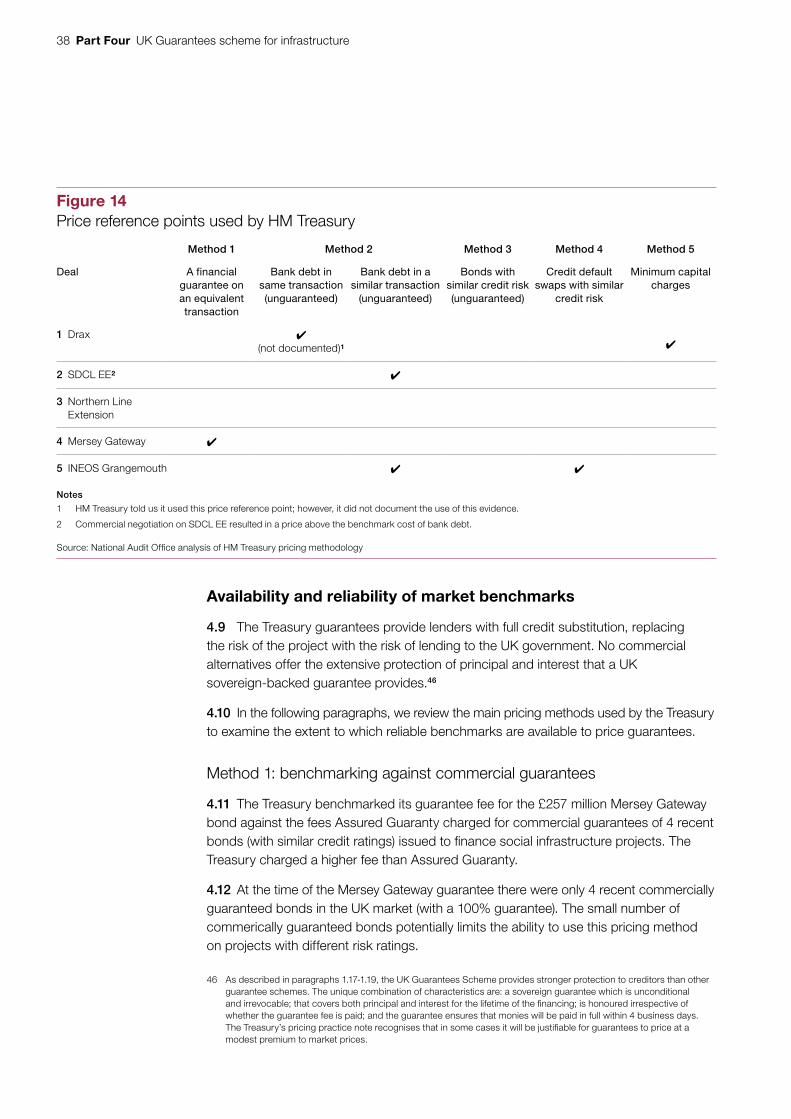
38 Part Four UK Guarantees scheme for infrastructure
Availability and reliability of market benchmarks
4.9 The Treasury guarantees provide lenders with full credit substitution, replacing the risk of the project with the risk of lending to the UK government. No commercial alternatives offer the extensive protection of principal and interest that a UK sovereign-backed guarantee provides.46
4.10 In the following paragraphs, we review the main pricing methods used by the Treasury to examine the extent to which reliable benchmarks are available to price guarantees.
Method 1: benchmarking against commercial guarantees
4.11 The Treasury benchmarked its guarantee fee for the £257 million Mersey Gateway bond against the fees Assured Guaranty charged for commercial guarantees of 4 recent bonds (with similar credit ratings) issued to finance social infrastructure projects. The Treasury charged a higher fee than Assured Guaranty.
4.12 At the time of the Mersey Gateway guarantee there were only 4 recent commercially guaranteed bonds in the UK market (with a 100% guarantee). The small number of commerically guaranteed bonds potentially limits the ability to use this pricing method on projects with different risk ratings.
46 As described in paragraphs 1.17-1.19, the UK Guarantees Scheme provides stronger protection to creditors than other guarantee schemes. The unique combination of characteristics are: a sovereign guarantee which is unconditional and irrevocable; that covers both principal and interest for the lifetime of the financing; is honoured irrespective of whether the guarantee fee is paid; and the guarantee ensures that monies will be paid in full within 4 business days. The Treasury’s pricing practice note recognises that in some cases it will be justifiable for guarantees to price at a modest premium to market prices.
Figure 14Price reference points used by HM Treasury
Method 1 Method 2 Method 3 Method 4 Method 5
Deal A financial guarantee on an equivalent transaction
Bank debt in same transaction (unguaranteed)
Bank debt in a similar transaction
(unguaranteed)
Bonds with similar credit risk (unguaranteed)
Credit default swaps with similar
credit risk
Minimum capital charges
1 Drax (not documented)1
2 SDCL EE2
3 Northern Line Extension
4 Mersey Gateway
5 INEOS Grangemouth
Notes
1 HM Treasury told us it used this price reference point; however, it did not document the use of this evidence.
2 Commercial negotiation on SDCL EE resulted in a price above the benchmark cost of bank debt.
Source: National Audit Offi ce analysis of HM Treasury pricing methodology

UK Guarantees scheme for infrastructure Part Four 39
Method 2: benchmarking against bank debt
4.13 For methods 2, 3 and 4, the Treasury sets fees so that the combined cost of the guaranteed fee and the interest on the guaranteed loan represents a market price of debt. The Treasury used bank loan prices as benchmarks for the price for 3 guarantees:
• On Drax, the Treasury considered the terms of a revolving credit facility (that is, commercial debt without a guarantee).
• In relation to SDCL EE, the Treasury used the price of bank lending to NCP.
• For INEOS, the Treasury used corporate lending rates to the INEOS Group.
4.14 Drax is the only guarantee we reviewed where the Treasury was able to benchmark against the price of existing bank debt in the same transaction, which means that the unguaranteed bank finance was exposed to equivalent risks as the Treasury’s guarantee. In theory, this should provide a good benchmark for the market price of risk for the guarantee. This may have limited applicability to other projects requiring guarantees, as difficulties in securing commercial finance is one of the key reasons why guarantees are needed.
4.15 On SDCL EE and INEOS, the Treasury benchmarked against the bank lending that was outside of the project company to which the Treasury issued the guarantees. This means that the bank lending was exposed to risks relevant, but not identical, to those borne by the Treasury.
4.16 There is very little publicly available price data for bank debt, in contrast with publicly traded bonds. Lenders and project sponsors routinely enter non-disclosure agreements in relation to commercial terms. About one third of infrastructure projects disclose pricing information and prices of individual bank debt tranches are published for only 10–20% of deals. Although public bodies have access to bank pricing on PFI deals when they are agreed, and if they are refinanced, the Treasury does not hold this information centrally.
Methods 3 and 4: benchmarking against bond prices and credit default swaps
4.17 To help set prices for guarantees on a market oriented basis, the Treasury has developed and maintains a large database of prices for a broad variety of publicly traded corporate bonds and credit default swaps. This pricing database has not been subject to third-party review to validate the reliability of the data (for example, we identified a number of duplicate bonds), such as in line with the recommendations of the 2013 HM Treasury Review of quality assurance of government models.47 The Treasury disagrees with the National Audit Office and considers the pricing database is not a model since it only includes a single calculation which is used to create a simple average and is not within the scope of the review. It also considers that a third-party review of this database would not be proportionate.
47 HM Treasury, Review of quality assurance of government models, March 2013.

40 Part Four UK Guarantees scheme for infrastructure
4.18 Credit default swaps (CDS) are a form of insurance on the risk of default of debt issued by a company, and the Treasury and the European Commission consider this can represent a useful benchmark for the price of a guarantee.48 The Treasury’s database contains prices for more than 500 single-name CDS and includes iTraxx indices (a widely recognised source of CDS prices published by Markit). Figure 15 summarises the number of price benchmarks in the database by type, in 4 quadrants based on risk (investment grade; or non-investment) and tenor (less than 10 years; more than 10 years). The Treasury told us that the lack of data for non-investment grade risk exceeding 10 years effectively limits the level and duration of risk exposure it is willing to enter into, since appropriate price benchmarks are needed to comply with European State Aid.
48 This is tradable, and unrelated to the actual ownership of the security. In a typical credit default swap contract, the credit default swap seller guarantees to purchase from the buyer a given notional value of securities issued by an underlying reference entity on the occurrence of a credit event (usually bankruptcy or a debt service default). In return, the buyer pays a regular premium.
Figure 15Content of HM Treasury’s pricing database
33 utility and infrastructure bonds
472 CDS
4 utility and infrastructure bonds
39 CDS
111 High-yield corporate bonds
128 utility and infrastructure bonds
0 CDS
0 utility and infrastructure bonds
0 CDS
18 High-yield corporate bonds
Note
1 None of the 27 bonds used to compile the market data in Figure 3 are included in HM Treasury’s pricing database because most had guarantees or credit enhancements.
Source: HM Treasury pricing paper and database
There are limited data with which to benchmark higher-risk, longer-tenor guarantees
Less than 10 years
Investment grade
Non-investment grade
More than 10 years

UK Guarantees scheme for infrastructure Part Four 41
4.19 The Treasury used its database to price the guarantee to INEOS (as well as using data on the price of bank lending to the INEOS Group, see paragraphs 4.13 and 4.15), the Treasury set the price of the INEOS Grangemouth guarantee equal to the average price of the 9 single-name CDS that had matching risk ratings and duration (further details in Figure 17). However, the Treasury did not use the price of INEOS Group bonds or associated CDS because these relate to subordinated debt, which the Treasury considers is not reflective of the risk it is taking (as a provider of senior debt). The Treasury considered the most recent price of bank lending to the INEOS Group as the most appropriate benchmark to senior debt risk. We disagree with the Treasury and consider these would have been relevant benchmarks as the Infrastructure UK risk officer noted that the Grangemouth operation was so integrally tied up with the INEOS international business that the risk of the Group effectively underpins most of the trading and credit risk at Grangemouth. If the Treasury had priced against the INEOS Group CDS, as well as the basket of 9 other CDS, this could have resulted in a fee higher than that charged by the Treasury. Appendix One provides further details on the theory behind the pricing of bond financing.
4.20 Most of the utility and infrastructure bonds in the Treasury’s database are corporate issues. By contrast, there are relatively few project bonds in the Treasury’s database, as the Treasury only includes unwrapped (unguaranteed) bonds, of which there are very few. The corporate bonds in the database have market prices, indicating that they are more widely traded. In general, corporate bonds are issued by companies with an established track-record and this may not necessarily reflect the uncertainty associated with the early stages of project financing, such as construction risk. The number of reference points for individual risk rating bands and tenors is low so the nearest matches may be for companies that operate in a variety of industries and countries.49 It is also the case that CDS are typically not in similar sectors, for example, the Treasury used 9 CDS to benchmark INEOS (see Figure 17), 2 of which are UK-based retailers. The other 7 are from a range of different European industries.
4.21 The market prices of bonds and CDS are volatile. Appendix One shows that:
• the price of corporate bonds and CDS has varied considerably over time;
• there is considerable divergence in prices in the Treasury’s database for bonds and CDS of the same risk level and tenor;
• volatility and divergence is greater for non-investment grade bond prices; and
• the use of CDS prices to derive a guarantee can result in a wide range of outcomes. The average price of the 9 CDS used to price INEOS was approximately 10 times more volatile than the iTraxx index of European CDS prices.
49 The closest comparator bonds in the Treasury’s database (based on the same credit rating and tenor) for Drax, SDCL EE, Mersey Gateway and INEOS projects, are as follows (sector, country, year of issue): LBG Capital No.1 PLC (Banks, UK, Dec 2009), Finmeccanica Finance (Aerospace/Defence, Luxembourg, Apr 2009), Telecom Italia SPA (Telecommunications, Italy, Jun 2004), Commerzbank AG (Banks, Germany, Aug 1999), GKN Holdings PLC (Auto Parts and Equipment, UK, Oct 1999), Gala Group Finance PLC (Entertainment, UK, May 2011), Voyage Care Bondo PLC (Healthcare Services, UK, Jan 2013), ABP Finance PLC (Diversified Financial Services, UK, Oct 2013), Thames Water Kemble Finance (Water, UK, Oct 2011), Cable and Wireless (Telecommunications, Netherlands, Jun 1994), Cabot Financial Lux SA (Diversified Financial Services, Luxembourg, Sep 2012), Elli Finance UK PLC (Healthcare, UK, Jun 2012).

42 Part Four UK Guarantees scheme for infrastructure
Fairness and transparency of markets
4.22 The market indicators derived from debt markets may be affected by a wide range of factors that may not necessarily be observable. In November 2013 the Bank of England published a financial stability paper concerning the structure and dynamics of the UK CDS market.50 This states that more than 90% of CDS are traded in euros rather than sterling and a quarter of the CDS market provides insurance for debt issued by banks, while only 5% relates to utilities (the closest sector to infrastructure). The paper also noted that the UK CDS market suffers from opacity; trading is generally infrequent and varies significantly between individual CDS, and dealing volume is highly concentrated around the main dealers.
4.23 The Fair and Effective Markets Review was established by the Chancellor in June 2014, to conduct a comprehensive and forward-looking assessment of the way wholesale financial markets operate, help to restore trust in those markets in the wake of a number of recent high-profile abuses, and influence the international debate on trading practices. The review published a consultation document in October 2014 seeking views about the fairness and effectiveness of the fixed income, foreign exchange and commodities markets.51
Alternative approach: minimum capital charges
4.24 Market prices and underlying project risks may vary independently of each other, therefore market prices do not necessarily reflect the financial risk from guarantees. An alternative approach to calculate guarantee fees is to set a minimum capital charge. This is widely applied in the insurance sector to comply with prudential regulatory issues, which do not apply to governments. The Treasury follows the market-oriented price approach to comply with State Aid; however, it initially planned to assess minimum guarantee fees to cross-check market prices and did this on the Drax guarantee. European Commission guidance on guarantees recommends that minimum fees should cover:
• the risk of default (based on the probability of default. Figure 9 showed there is a wide variance in this figure depending on the historic data source used);
• the administration costs; and
• the cost of capital (for commercial entities there is a regulatory requirement to set aside additional capital, based on the level of risk).
50 Bank of England, The structure and dynamics of the UK credit default swap market, November 2013.51 Bank of England, HM Treasury and Financial Conduct Authority, Fair and Effective Markets Review consultation,
October 2014.

UK Guarantees scheme for infrastructure Part Four 43
4.25 We used this approach to cross-check 4 of the first 5 deals that the Treasury entered into, using an upper and lower estimate of the minimum capital charge needed to cover the Treasury’s costs.52 The fees charged by the Treasury exceeded, or were in line with, this range on 3 of the 4 deals, but on the INEOS Grangemouth guarantee the fees charged by the Treasury were lower than the minimum capital charge approach would suggest (Figure 16).
52 We excluded the Northern Line Extension because it is a standby facility. The range estimate is based on the Treasury’s submission to the European Commission and a capital charge set by Standard & Poor’s and used by Assured Guaranty.
Figure 16Fees charged by HM Treasury compared with illustrative minimum capital charge approach
Annual fee as a percentage of the guaranteed amount (%)
On 3 of 4 deals, the fee set by the Treasury was in line with or exceeded a minimum capital charge. On the INEOS deal, the Treasury’s fee was lower
Notes
1 Annual fee axis labels have been removed due to commercial sensitivity.
2 The range for fees under the minimum capital charge approach is calculated as the risk of default (project specific) plus administration charges (assessed by the Treasury as 0.1%), plus a capital charge element. The capital charge is calculated as either 0.32% (based on a formula in European Commission State Aid guidance on guarantee schemes, paragraph 3.4), or as the default frequency multiplied by loss (30%) under a worst-case scenario (see Standard & Poor’s methodology for setting the capital charge on project finance transactions, default frequencies are shown in Figure 9). The range estimate reflects the difference in the 2 approaches used to calculate the capital charge.
3 HM Treasury guarantee fee for Drax, SDCL EE and Mersey Gateway does not include upfront fees, which were also charged on these transactions. There was no upfront fee on the INEOS Grangemouth transaction.
Source: National Audit Office analysis of HM Treasury pricing
Treasury guarantee fee
Range of capital charge fees: maximum–minimum
Drax SDCL EE Mersey Gateway INEOS

44 Part Four UK Guarantees scheme for infrastructure
4.26 When market benchmark prices decline, as they have recently, and for lower investment grade credit risk, the Treasury may find itself setting prices for guarantees that do not cover a minimum capital charge. For example, between July 2012 and October 2014 the average price of the 9 CDS used in pricing the INEOS guarantee fell by around 5 percentage points to less than half the price in July 2012. During the period July 2012 to September 2013 the CDS benchmarking method would result in a higher price than an alternative method using capital charges, whereas between September 2013 and December 2014 the CDS approach results in a lower price (Figure 17).
Returns to investors
4.27 Investors in government guaranteed debt receive a higher return than that on government gilts even though the credit risk is equivalent. This premium above gilts on government-backed bonds is sometimes referred to as an illiquidity premium, reflecting that guaranteed debt is less easily traded than gilts (since gilts are issued much more regularly, in much larger volumes).
4.28 The Bank of England estimated that illiquidity premia on corporate bonds was 0.4% on average between 1997 and 2007.53 The Treasury assumes a typical return of 0.5% above gilts. Based on the use of the Scheme to date and the expected take-up until it closes, the illustrative extra cost through using guarantees as opposed to direct lending could be between £35 million and £120 million, with and without Hinkley Point C (the Treasury considers that this counterfactual of direct government lending would be a different policy with different financial and policy consequences to the current guarantee programme).
4.29 Both the Mersey Gateway and INEOS bonds were publicly issued, meaning that the spread above gilts at issue (and since) is publicly reported. The Mersey Gateway bonds were issued with an interest rate of 3.842%. This meant that investors who were allocated bonds in the auction earned a premium of 0.42% above the closest equivalent government UK gilt.54 This is comparable or better than a variety of other bonds with similar government guarantees (the Mersey Gateway bond also resulted in a lower cost of debt, even after including the guarantee fee).
4.30 Minimising the interest rate that guaranteed lenders receive is beneficial to the Treasury since the Treasury guarantees interest payments, but the fee is charged as a percentage of the principal. On one project (SDCL EE) the Treasury guaranteed a double-digit return against counterparty credit risk. We are unable to judge whether or not this is a reasonable rate of return since the Treasury was not guaranteeing all risks (preventing a comparison with the risk-free rate).
53 Bank of England Quarterly Bulletin, Decomposing Corporate Bond Spreads, October 2007.54 The Mersey Gateway bond was marketed to institutional investors only, in minimum tranches of £100,000. HSBC was
the bond arranger. It is listed on the Irish Stock Exchange.

UK Guarantees scheme for infrastructure Part Four 45
Figure 17Comparing minimum capital charge pricing with benchmarking against credit default swaps on INEOS Grangemouth
This figure shows the range of the 9 CDS used to price INEOS, alongside a minimum capital charge approach
Jul0
Sep Nov Jan Mar May Jul Sep Nov Jan Mar May Jul Sep Nov Dec
2012 2013 2014
Notes
1 Price axis labels have been removed due to commercial sensitivity.
2 The basis for calculating minimum capital charge fees is shown in Figure 16.
3 The details of CDS included within the dataset above are as follows (Sector, Country, Year): Construction, Italy, 2014; Retail, UK, 2006; Paper and pulp, Finland, 2006; Retail, UK, 2013; Telecommunications, Finland, 2006; Automotive, France, 2006; Electronics, Germany, 2013; Electronics, Germany, 2013; Media, Poland, 2014. The names of the individual issuers have been removed for commercial confidentiality reasons.
4 The Depository Trust Clearing Corporation publishes trading data for the top 1,000 most actively traded CDS. Out of the 9 CDS used by HM Treasury to price the INEOS guarantee 8 feature in the top 1,000, with an average of 2 daily trades in the period June to September 2014. Available at: www.dtcc.com/repository-otc-data/top-1000-single-names-06-20-2014-through-09-21-2014.aspx
5 The average of the 9 CDS was obtained from Bloomberg using CMAN price figures.
Source: National Audit Office analysis of CDS price data, taken from Bloomberg
Mean average price of the 9 CDS used to price the INEOS guarantee
Minimum capital charge fee (upper estimate)
Minimum capital charge fee (lower estimate)
Infrastructure UK − issued guarantee covering INEOS debt
Annual fee as a percentage of guaranteed debt

46 Part Four UK Guarantees scheme for infrastructure
4.31 In practice, it is difficult to distinguish between a spread above gilts that reflects genuine illiquidity and other factors. Other factors may include confidence in the strength of a guarantee; the extent to which there is full credit substitution or simply credit enhancement; the level of competition for the bonds at issue and subsequently trade; or could constitute a risk-free arbitrage. Effective auctions for quoted bonds, which demonstrate best execution, can reduce premia relative to gilts but this option is not available for bank debt which is not publicly auctioned or traded, is confidential and priced against LIBOR.
4.32 Figure 18 shows variation in the spread above gilts on different bonds. For example:
• The 4 bonds the Treasury benchmarked its Mersey Gateway fee against have premia between 1.5 and 2.5 percentage points above reference gilts. These bonds benefited from a guarantee issued by a commercial guarantor (Assured Guaranty), which investors will regard as different from a full UK sovereign guarantee: the current illiquidity premium for commercially guaranteed bonds is around 4 times higher than for UK government-backed debt.
• The 2013 Greater Gabbard project bonds were issued with a European Investment Bank ‘credit enhancement’, at a premium around 1.3% above the reference gilt.55 The credit enhancement is not a comprehensive guarantee, and debt issued by the European Investment Bank itself, based on its own credit rating, trades at a lower premium (under 0.5%).
4.33 As bonds trade, their prices may change and this results in changes to the spread over gilts resulting in gains or losses for the initial investors. This may reflect multiple factors including changes in market demand, confidence over the strength of the guarantee, or the extent of competition for the original bond issue. For example, the premia on monoline insured bonds issued in 2007 or earlier is now much higher than at original issue because of changes in the ratings of the insurers (who were providing credit substitution). Market data indicate that the spread over gilts for the Mersey Bond and INEOS narrowed slightly in subsequent trading.56
55 The credit enhancement letter provides a £45.7 million subordinated facility that can be drawn down to protect bond investors. As a result, Moody’s has rated this bond A3.
56 Transparency around the allocation process for syndicated bonds has been questioned in The Fair and Effective Markets Review consultation document (HM Treasury, Bank of England and Financial Conduct Authority, October 2014). The Comptroller and Auditor General report on The Privatisation of Royal Mail, (Session 2013-14, HC 1182, National Audit Office, April 2014), also commented on allocation principles for share issues.
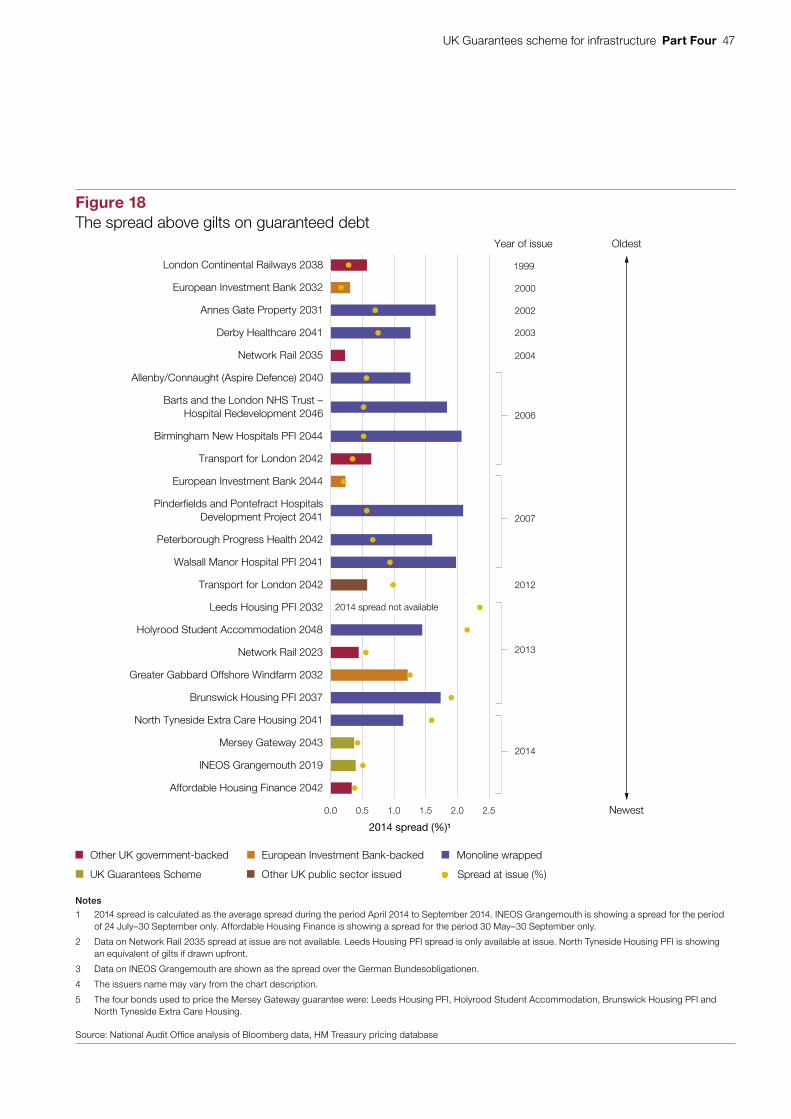
UK Guarantees scheme for infrastructure Part Four 47
Newest
Oldest
2000
2002
2003
2004
2006
2007
2012
2013
2014
London Continental Railways 2038
European Investment Bank 2032
Network Rail 2035
Transport for London 2042
European Investment Bank 2044
Pinderfields and Pontefract HospitalsDevelopment Project 2041
Peterborough Progress Health 2042
Walsall Manor Hospital PFI 2041
Transport for London 2042
Leeds Housing PFI 2032
Network Rail 2023
Brunswick Housing PFI 2037
North Tyneside Extra Care Housing 2041
Mersey Gateway 2043
0.0 0.5 1.0 1.5 2.0 2.5
Greater Gabbard Offshore Windfarm 2032
Holyrood Student Accommodation 2048
Birmingham New Hospitals PFI 2044
Barts and the London NHS Trust –Hospital Redevelopment 2046
Allenby/Connaught (Aspire Defence) 2040
Derby Healthcare 2041
Annes Gate Property 2031
INEOS Grangemouth 2019
Affordable Housing Finance 2042
2014 spread not available
Figure 18The spread above gilts on guaranteed debt
2014 spread (%)1
Notes
1 2014 spread is calculated as the average spread during the period April 2014 to September 2014. INEOS Grangemouth is showing a spread for the period of 24 July–30 September only. Affordable Housing Finance is showing a spread for the period 30 May–30 September only.
2 Data on Network Rail 2035 spread at issue are not available. Leeds Housing PFI spread is only available at issue. North Tyneside Housing PFI is showing an equivalent of gilts if drawn upfront.
3 Data on INEOS Grangemouth are shown as the spread over the German Bundesobligationen.
4 The issuers name may vary from the chart description.
5 The four bonds used to price the Mersey Gateway guarantee were: Leeds Housing PFI, Holyrood Student Accommodation, Brunswick Housing PFI and North Tyneside Extra Care Housing.
Source: National Audit Office analysis of Bloomberg data, HM Treasury pricing database
1999
Other UK public sector issued Spread at issue (%)
Other UK government-backed European Investment Bank-backed Monoline wrapped
UK Guarantees Scheme
Year of issue

48 Appendix One UK Guarantees scheme for infrastructure
Appendix One
Pricing theory and market data
Pricing a guarantee using bank and bond prices: the theory
Summary of HM Treasury’s guarantee pricing methodology
The Treasury’s approach is to:
• identify the relevant market price (for equivalent unguaranteed debt); and
• calculate the price by subtracting the risk-free rate (the UK gilt rate) and any liquidity premium that investors expect.
The price should then reflect the risk premium that the market would charge for credit risk on equivalent debt.
The Treasury considers there is justification to set the fee slightly higher than this level to reflect that investors in a guaranteed security are completely protected, including all interest payments.
This methodology is comparable to ‘bond decomposition theory’, which is explained further in research published by the Bank of England.1 According to this theory, a market price on a corporate bond can be decomposed into 3 main elements:
• a risk-free rate (the cost of lending to the UK government for a similar duration);
• a premium to reflect the risk related to the creditworthiness of the asset; and
• compensation for a number of non-credit factors, including an ‘illiquidity premium’.
This approach can also be applied to bank loans, but it is much more difficult to quantify the discrete components because bank loans are generally priced with reference to interest rates and may be combined with LIBOR rates (which are variable) rather than UK government gilts and interest rate swaps, to achieve a fixed interest rate for the borrower. It is also more difficult to establish the underlying funding costs for a bank as it varies by lender.
Note
1 Bank of England Quarterly Bulletin, Decomposing Corporate Bond Spreads, October 2007.

UK Guarantees scheme for infrastructure Appendix One 49
The total cost of the guaranteed finance is set equal to a market benchmark
Notes
1 Diagram is illustrative only and not to scale.
2 HM Treasury estimates the swap fee to convert a floating rate bank loan to a fixed rate is between 0.25% and 0.30%.
Bank debt Bonds Guaranteed finance
Swap feeRisk allowance liquidity premium and other non-credit factors
HM Treasury fee
Liquidity premium
Risk-free rate(cost of UK gilts)Risk-free rate
Other charges
Margin over LIBOR
LIBOR
Interestearnedby lender
Volatility of market prices
Spread over gilts (%)
iBoxx GBP Non-financials A 15+
iBoxx GBP Non-financials BBB 15+
Average spread of BBB rated bonds in HM Treasury’s pricing database on various dates: a) Sep 2009: 1.9% b) Sep 2012: 2.5% c) Sep 2014: 1.5%
0
1
2
3
4
5
The spread of corporate bonds over gilts has varied considerably over time
20062 2007 2008 2009 2010 2011 2012 2013 20142
b
c
Notes
1 The average spread of the BBB rated bonds in HM Treasury’s pricing database is based on 14 bonds.
2 2006 starts with August and 2014 ends with November.
Source: National Audit Office analysis of iBoxx and HM Treasury pricing database
a

50 Appendix One UK Guarantees scheme for infrastructure
Volatility of bonds in HM Treasury’s pricing database
The HM Treasury pricing database contains 128 investment-grade bonds with tenors exceeding 10 years which were in issue throughout the period September 2009 – September 2014. The spreads of these bonds moved less than the price obtained from a corporate bond index for an equivalent risk rating (BBB, iBoxx above).
Long-term investment-grade bonds
Rating of bond
Sample size
Average spread as at Sep 2009(%)
Average spread as at Sep 2012(%)
Average spread as at Sep 2014(%)
A 1 2.1 2.1 1.1
A- 21 1.6 1.4 1.3
BBB+ 10 1.3 1.6 1.3
BBB 14 1.9 2.5 1.5
BBB- 5 2.2 1.9 1.6
Total 51
Dataset consists of the latest version of HM Treasury’s pricing database (as of 3 September 2014), whereby the list of all bonds was filtered out to include only those that were issued prior to September 2009, had a tenor of 16+ years as at September 2009, and were of investment grade as of September 2014. This list was then used to obtain the average spreads historically, as of September 2009, September 2012 and September 2014.
The price of 50 non-investment grade bonds with tenors below 10 years had changed substantially in a 4-month period.
Short-term non-investment grade bonds
Rating Sample size Jun 2014 Oct 2014 Change over time period
BB+ 5
Average spread
(%)
Range (%)
Average spread
(%)
Range (%)
(Percentage points)
1.8Max 2.5
2.6Max 3.5
0.8
Min 0.9 Min 1.4
BB 4 3.4Max 3.9
6.1Max 6.9
2.7
Min 2.8 Min 5.4
BB- 5 2.4Max 3.6
3.8Max 4.4
1.4
Min 1.9 Min 3.1
B+ 9 1.4Max 5.0
5.8Max 10.9
4.4
Min -6.0 Min 3.2
B 15 2.7Max 4.1
5.0Max 6.1
2.4
Min 0.1 Min 3.6
B- 12 4.1Max 5.3
7.2Max 9.9
3.1
Min 1.9 Min 5.6
Total 50
Dataset consists of two versions of HM Treasury’s pricing database: first as of 11 June 2014, and a second version of the database as of 3 September 2014. We used the data in the first version of the pricing database. We updated the second version with the latest prices as of 23 October 2014, automatically on opening. These data were then filtered down to show the non-investment grade, short-term (4–5 years) bonds.
Sources: National Audit Offi ce analysis of HM Treasury pricing database and Bloomberg data

UK Guarantees scheme for infrastructure Appendix One 51
0.0
5.0
10.0
15.0
20.0
25.0
20063 2007 2008 2009 2010 2011 2012 2013 20143
Average of the 9 credit default swaps (LHS)
iTraxx Europe Index (RHS)
0.0
0.5
1.0
1.5
2.0
2.5
Price (%)
Volatility of credit default swaps
Price (%)
CDS were one of the data sources used (alongside bank pricing) on INEOS Grangemouth. The chart shows the CDS used by HM Treasury (red line) compared with iTraxx CDS index of a large number of CDS across a full range of risks (yellow line)
Notes
1 The list of CDS included within the dataset above (red line) is as follows (Sector, Country, Year): Construction, Italy, 2014; Retail, UK, 2006; Paper and pulp, Finland, 2006; Retail, UK, 2013; Telecommunications, Finland, 2006; Automotive, France, 2006; Electronics, Germany, 2013; Electronics, Germany, 2013; Media, Poland, 2014.
2 The average of the 9 CDS was obtained from Bloomberg using CMAN bid price figures.
3 2006 starts with March and 2014 ends with December.
Source: National Audit Office analysis of HM Treasury pricing database, iTraxx index
52 Appendix Two UK Guarantees scheme for infrastructure
Appendix Two
Our audit approach
1 This study examines the risks to value for money associated with guarantees for infrastructure projects, and how HM Treasury (the Treasury) manages taxpayers’ exposure to the risk. We reviewed:
• The rationale and evidence for the Treasury’s design of the UK Guarantees Scheme (the Scheme).
• The Treasury’s process for selecting schemes for support, its eligibility criteria and how it has implemented the Scheme to date.
• How the Treasury assesses, manages and monitors risk.
• How the Treasury sets a price for risk.
2 We applied an analytical framework with evaluative criteria which consider what would be the key criteria in implementing an effective infrastructure guarantee scheme. We recognise that we are auditing the Scheme based on the experience of the first 5 deals and that the largest potential guarantee (Hinkley Point C) is yet to be agreed.
3 Our evidence base in described in Appendix Three.

UK Guarantees scheme for infrastructure Appendix Two 53
Our audit approach
Objective of HM Treasury
How this will be achieved
Our study
Our evaluative criteria
Our evidence
(see Appendix Three for details)
Our conclusions
We assessed the Scheme design through:
• Document review to understand the Treasury’s rationale and evidence.
• Analysing financial market data to understand the trends in availability of finance.
• Interviewing the Treasury’s officials and industry experts to understand the wider context.
• International comparators of other government support to infrastructure.
We reviewed the Treasury’s approach to risk through:
• Document review and interviews with the Treasury officials to understand its approach to managing and pricing risk.
• Case studies of 5 guarantees to understand the application of its approach.
• Review of market data and market approaches to managing and pricing risk.
The Treasury had a clear evidence base and rationale for its design of the support provided under the Scheme.
The Treasury has appropriate procedures to assess, manage and monitor risk and ensure it is compensated for that risk.
The Treasury applies appropriate criteria in providing guarantees, to promote VfM and protect taxpayers from unnecessary risk.
We reviewed the Treasury criteria through:
• Document review to understand the Treasury’s criteria.
• Case studies of 5 signed guarantees to understand how criteria were applied.
• Interviewing both the Treasury officials and the main organisations involved to understand the process and the Treasury’s approach to VfM.
HM Treasury implemented The UK Guarantees Scheme to avoid delays to investment in major UK infrastructure projects that may have stalled because of adverse credit conditions.
The Scheme was announced in July 2012 and is open for projects that are due to reach financial close by December 2016. The Treasury is able to provide a maximum of £40 billion of guarantees.
This study examined the Treasury’s approach to providing guarantees on infrastructure projects based on the experience of the first 5 deals.
The Treasury introduced the UK Guarantees Scheme as a response to challenging financial market conditions for infrastructure finance. Although market conditions have improved considerably, the Scheme continues to support lending for new infrastructure projects. We recognise that the Scheme can play a role in enabling progress in some nationally significant infrastructure.
The lessons from the Scheme have wider relevance for the extensive range of guarantees across government. The Treasury deliberately designed the Scheme to be flexible, with few formal restrictions and no upper limit on risk. It takes a narrow view that guarantees are value for money if the fee covers the risk. It is good that the Treasury has a formal governance process and commercial specialists to help evaluate, manage and set a price for risks to the taxpayer. However, we question whether this approach, on its own, can measure long-term risks to taxpayers reliably. As market conditions improve, the Treasury should ensure that it is rigorous and objective in ensuring that guarantees for projects are genuinely needed and that the projects supported bring significant public value.

54 Appendix Three UK Guarantees scheme for infrastructure
Appendix Three
Our evidence base
1 We carried out fieldwork for this study on the UK Guarantees Scheme for Infrastructure between June and December 2014. We applied an evaluative framework to assess the impact of guarantees on infrastructure projects including how the Treasury manages taxpayers’ exposure to risk. This is outlined in Appendix Two. Our main methods are outlined below:
Document review
• We reviewed policy documents and submissions to the EU Competition on the Scheme and with associated guarantees.
• To understand the monitoring arrangements in place, we reviewed the Treasury’s internal audit report and what information the Treasury has received from signed guarantees.
Case studies
• We examined 5 signed guarantees as case studies: Drax, SDCL EE, the Mersey Gateway bridge, the Northern Line Extension and INEOS Grangemouth. We examined the guarantees that had been signed between 2012 and August 2014.
Quantitative analysis of market data and HM Treasury pricing
• We undertook quantitative analysis to understand the wider market conditions for obtaining finance.
• We undertook quantitative analysis of the Treasury’s pricing of the fees it charged for its guarantees.
Interviews
• We undertook semi-structured interviews with the Treasury officials including the Head of Infrastructure Finance at Infrastructure UK. We also undertook a range of semi-structured interviews with the main parties and their advisors for each of the guarantees.
• We also held a range of semi-structured interviews with market participants, which included investment banks active in the infrastructure finance market in the UK.

UK Guarantees scheme for infrastructure Appendix Four 55
Appendix Four
Summary details of the first 5 guarantees signed by HM Treasury
Mersey Gateway
1 The Mersey Gateway Bridge is a new 6-lane toll bridge between Runcorn and Widnes with construction costs of some £470 million and is expected to open in 2017. The bridge was commissioned by Halton Borough Council to relieve congestion on the existing Silver Jubilee Crossing, which will also be tolled as part of the project. When the bridge is completed and operational, toll revenues will be collected on behalf of Halton Borough and the Council will then pay for the bridge on an availability and performance basis, subject to capped deductions for failure to maintain minimum journey times. The £600 million contract to design, build, finance and operate the bridge will run until 2044. The details of the guarantee are outlined overleaf.
2 HM Treasury guaranteed the Merseylink bond which was publicly marketed via the Irish Stock Exchange with a minimum subscription of £100,000. The auction was 2.8 times oversubscribed.

56 Appendix Four UK Guarantees scheme for infrastructure
Details of the Mersey Gateway Guarantee
Area Brief explanation
What is guaranteed £257 million of project bonds (42% of the project finance), due to be fully repaid by 2043.
The Treasury is guaranteeing both the scheduled interest and the principal on these bonds. The bonds were issued at a fixed interest rate of 3.842% a year. The interest rate has a 42 basis point premium on the benchmark long-term gilt.
Beneficiary Holders of the guaranteed bonds, 21 institutional investors, purchased the publicly listed bonds, the sale of which was organised by HSBC through the Irish Stock Exchange. The bonds can be traded and ownership of the bond can change.
HM Treasury’s risk assessment
Internal risk rating of 9; equivalent to BBB (investment grade).
In forming this view, the Treasury based its risk assessment of the project on due diligence undertaken on behalf of the senior lenders of the project finance debt (including the guaranteed bonds), and analysis of projected financial metrics. The Treasury risk assessment noted 2 main risks, which the Treasury deem to be appropriately mitigated to reflect an investment-grade risk:
• The successful construction of this civil engineering project. The Treasury established that the construction design, while new to the UK, has been used to build 4 other bridges globally.
• Long-term maintenance risk, given that the guaranteed bonds are not due to be repaid until the period 2033–2043, once all other senior debt has been repaid, and concluding 1 year before the end of the project concession in 2044. As the only senior lender that has not been repaid, the Treasury is therefore exposed to the risk around maintenance of the bridge in the last 10 years of the concession and will need to monitor this risk over an extended period of time.
Nature of the government’s security
The guaranteed bonds are treated as senior debt and have equivalent repayment status as commercial debt. However, over the period during which they will be repaid, they will be the only outstanding senior debt in the project. The bonds will rank above the subordinated debt and equity, in line with standard market practice.
Basis for fees charged by the Treasury
The Treasury benchmarked the fee against the fees Assured Guaranty charged for commercial guarantees of 4 recent bonds with similar credit ratings issued to finance social infrastructure projects. The Treasury charged a higher fee than Assured Guaranty.
Other sources of finance Total financing required, £600 million, of which unguaranteed finance:
• £55 million equity/subordinated debt (debt to be repaid 2043).
• £50 million Mezzanine debt.
• £102 million short-term loan to be repaid by 2017.
• £143 million commercial bank debt to be repaid 2032.
Other government support
If toll revenues from the bridges received by Halton Borough Council fall below the payments due to the consortium, the Department for Transport will make up the difference. The Department for Transport is also providing a grant to Halton Borough Council to support the project.

UK Guarantees scheme for infrastructure Appendix Four 57
Area Brief explanation
Public Sector Net Debt classification
Public sector project.
As the payments Halton Borough Council will receive from the tolls are more than 50% of the total cost of the bridge, it is classified as a public sector project.
Other notable features The Treasury’s assessment was that the project would generate £1.7 million of tax revenues. This is substantially lower than estimated in the original models (including a Treasury model) used to assess the case for using private finance, rather than funding the bridge publicly.
The Old Bridge will also be tolled.
The Chancellor in July 2014 announced that the UK government will provide additional funding which will enable free trips using both bridges for Halton residents.
Source: National Audit Offi ce analysis of HM Treasury documents
Details of the Mersey Gateway Guarantee continued

58 Appendix Four UK Guarantees scheme for infrastructure
Drax Biomass
3 Drax Group Plc operates the largest coal-fired power station in the UK, with capacity of 4 gigawatt, and capable of supplying up to 7% of UK electricity demand. Tightening environmental policies to reduce carbon emissions increasingly require coal-fired power stations to consider alternative forms of fuel. Drax is in the process of converting 3 of its 6 generating units to be capable of running on biomass fuel (wood pellets). The details are outlined below.
Details of the Drax Biomass Guarantee
Area Brief explanation
What is guaranteed £75 million of loan notes (borrowing by Drax), due to be repaid in 2 equal instalments in 2017 and 2018.
The Treasury is guaranteeing both the scheduled interest and the principal as they fall due on these loan notes.
Beneficiary Friends Life holds the guaranteed loan notes. They were issued to Friends Life through a competitive private placement process arranged by Barclays.
HM Treasury’s risk assessment
Internal risk rating of 11; equivalent to BB+ (non-investment grade).
Because the loan is to a company, the risk the Treasury is exposed to is Drax’s creditworthiness. In forming its view of this risk, the Treasury reviewed Drax’s investment proposition including technical reports on the unit conversion and energy and biomass market. The Treasury also took into account Standard and Poor’s BB rating of Drax, and BB+ rating for its senior secured debt. The Treasury sought additional protection by providing a guarantee with a shorter maturity (2018) than the other term lenders (Green Investment Bank and M&G) and an option to require prepayment of all guaranteed debt in 2017, at the discretion of the Treasury.
Nature of the government’s security
The guaranteed loan notes rank as senior secured debt; that is, in the event of a default, it would have equivalent repayment status to the other outstanding senior debt. Payment of fees, costs and expenses of the ‘security agent’ ranks ahead of senior debt, which is normal for enforcement of security.
Basis for fees charged by the Treasury
The Treasury benchmarked the fee against the price of bank lending to Drax and also used a minimum capital charge approach (see Part Four).
Other sources of finance Total cost of the conversion of the units is £350 million, of which the unguaranteed finance is:
• £100 million debt provided by M&G.
• £50 million debt provided by the Green Investment Bank.
The remainder of the financing requirement is to be met by Drax from cash raised from the £190 million equity subscription (placed by Drax Group Plc in October 2012). In May 2014 Drax raised a further £100 million of debt (rated BB+) from M&G to reach its target for debt.
Other government support A £50 million amortising loan from the Green Investment Bank was signed in December 2012. The Green Investment Bank facility also included an additional £50 million commitment with a significant price step-up to incentivise Drax to obtain further private sector funding. This additional facility was cancelled when Drax entered the agreement with the Treasury for a guaranteed loan.
Conversion of Drax’s coal units to biomass entitles it to receive payments under the Renewables Obligation per MWh of electricity generated. Drax may be eligible for further support under the government’s Contract for Difference scheme.
Public Sector Net Debt classification
Private sector project, as the total participation of public sector entities in the financing is below 50%.
Source: National Audit Offi ce analysis of HM Treasury documents

UK Guarantees scheme for infrastructure Appendix Four 59
Sustainable Development Capital Limited
4 The guarantee is to provide protection against counterparty credit risk to investors in an energy efficiency project. The underlying project involves the installation of energy-saving lighting in 150 car parks owned by National Car Parks (NCP) to reduce energy costs. An investment fund, UK Energy Efficiency Investments 1 LP, managed by Sustainable Development Capital Limited (SDCL EE), is lending to FES Lighting Contracts UK Ltd (a special purpose project company related to SDCL EE) who will install and maintain the lighting equipment. Sustainable Development Capital is enabling its investment by investing in loan notes issued by a special purpose vehicle EECo Car Parks No 1 Limited who then loans on the loan notes to FES Lighting Contracts UK Ltd.
5 SDCL EE sought a Treasury guarantee to cover risk (to investors in its fund) associated with failure by National Car Parks to pay under the service contract. Details of the Guarantee are outlined below.
Details of the SDCL EE Guarantee
Area Brief description
What is guaranteed £8.8 million in loan notes, due to be repaid by December 2017.
The Treasury is guaranteeing the timely payment of scheduled principal and interest on £8.8 million of loan notes, in limited circumstances (non-payment by the underlying obligor). The investors bear performance risk on the underlying project.
Beneficiary The direct beneficiaries are the investors in the loan notes issued by EECo Car Parks. The initial investors were the SDCL managed fund (in which the Green Investment Bank is an investor) and FES Lighting Finance. The loan notes are transferrable in line with market practice.
HM Treasury’s risk assessment
Internal risk rating of 14; equivalent to B+ (non-investment grade).
The Treasury is exposed to the risk that National Car Parks is unable to meet its service payments. The Treasury does not cover non-payment arising as a result of poor performance by the project company. The Treasury risk assessment took into account the credit risk of NCP, mitigated by arrangements to give investors and the Treasury rights over the project assets and remediation rights (as instructing creditor under the security structure).
Nature of the government’s security
Investors in the loan note (and hence the Treasury in the event of the guarantee being called) will have first call on 90% of the monies paid by National Car Parks under the service contract with FES Lighting Contracts UK Limited. Through the security structure, investors also have security over all the project companies and the ability to step in and control the project company and its conduct under its contract with NCP.
Basis for fees charged by the Treasury
The Treasury took into account the price of bank lending to NCP.
Other sources of finance None.
Other government support The SDCL investment fund that has invested in the loan notes has secured a commitment by the Green Investment Bank to invest up to £50 million in energy efficiency projects.1
Public Sector Net Debt classification
Private sector project (the Treasury guarantee and investment by a fund backed by the Green Investment Bank do not affect the status of National Car Parks as a private company).
Note
1 The initial commitment was made by the Department for Business, Innovation & Skills, available at: www.gov.uk/government/news/government-appoints-fund-managers-for-non-domestic-energy-effi ciency-projects
Source: National Audit Offi ce analysis of HM Treasury documents

60 Appendix Four UK Guarantees scheme for infrastructure
Northern Line Extension
6 The Northern Line Extension is part of a wider regeneration project for the Vauxhall, Nine Elms and Battersea areas of London. It will see the Northern Line extended by 3.2km with two new stations. Construction is due to start in 2015 and scheduled for completion in 2020. The project is led by Transport for London and financed by the Greater London Authority (GLA), which is borrowing up to £1 billion for the project. The amount is expected to be repaid out of local business tax receipts collected over 25 years, as well as developer contributions. Details of the refinancing facility are outlined overleaf.
7 At present the GLA expects to borrow from a range of sources including the European Investment Bank (EIB) and the capital markets.
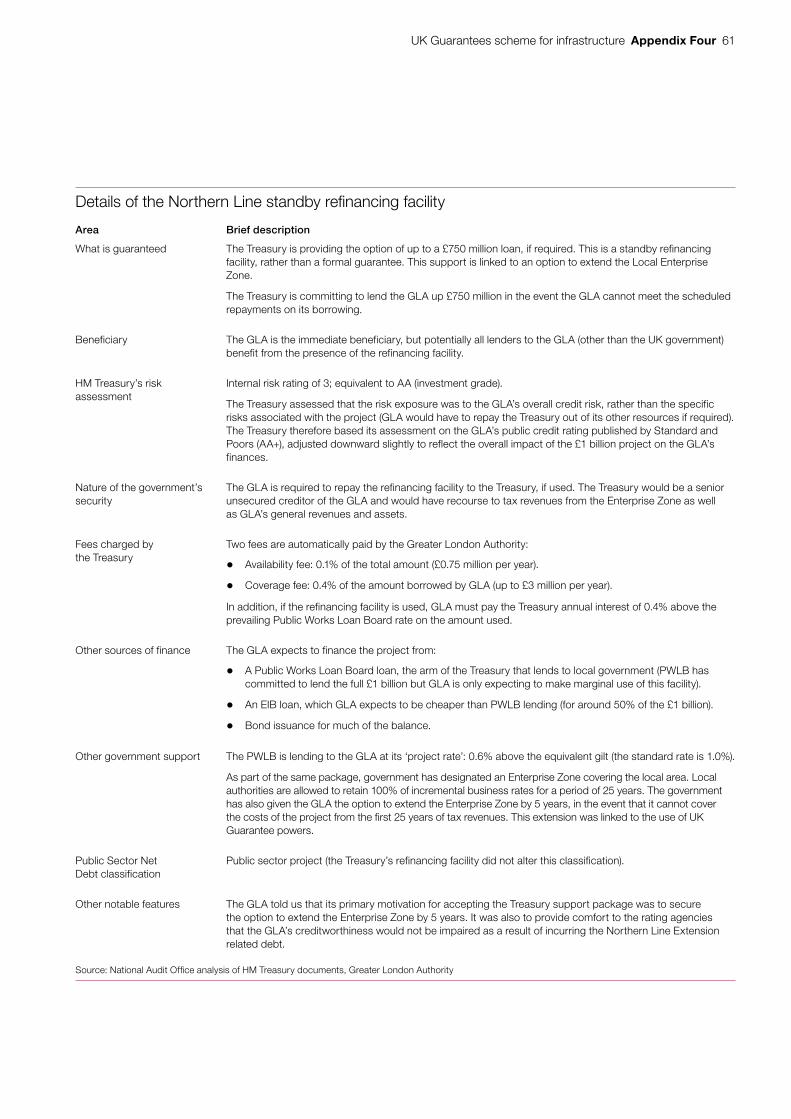
UK Guarantees scheme for infrastructure Appendix Four 61
Details of the Northern Line standby refi nancing facility
Area Brief description
What is guaranteed The Treasury is providing the option of up to a £750 million loan, if required. This is a standby refinancing facility, rather than a formal guarantee. This support is linked to an option to extend the Local Enterprise Zone.
The Treasury is committing to lend the GLA up £750 million in the event the GLA cannot meet the scheduled repayments on its borrowing.
Beneficiary The GLA is the immediate beneficiary, but potentially all lenders to the GLA (other than the UK government) benefit from the presence of the refinancing facility.
HM Treasury’s risk assessment
Internal risk rating of 3; equivalent to AA (investment grade).
The Treasury assessed that the risk exposure was to the GLA’s overall credit risk, rather than the specific risks associated with the project (GLA would have to repay the Treasury out of its other resources if required). The Treasury therefore based its assessment on the GLA’s public credit rating published by Standard and Poors (AA+), adjusted downward slightly to reflect the overall impact of the £1 billion project on the GLA’s finances.
Nature of the government’s security
The GLA is required to repay the refinancing facility to the Treasury, if used. The Treasury would be a senior unsecured creditor of the GLA and would have recourse to tax revenues from the Enterprise Zone as well as GLA’s general revenues and assets.
Fees charged by the Treasury
Two fees are automatically paid by the Greater London Authority:
• Availability fee: 0.1% of the total amount (£0.75 million per year).
• Coverage fee: 0.4% of the amount borrowed by GLA (up to £3 million per year).
In addition, if the refinancing facility is used, GLA must pay the Treasury annual interest of 0.4% above the prevailing Public Works Loan Board rate on the amount used.
Other sources of finance The GLA expects to finance the project from:
• A Public Works Loan Board loan, the arm of the Treasury that lends to local government (PWLB has committed to lend the full £1 billion but GLA is only expecting to make marginal use of this facility).
• An EIB loan, which GLA expects to be cheaper than PWLB lending (for around 50% of the £1 billion).
• Bond issuance for much of the balance.
Other government support The PWLB is lending to the GLA at its ‘project rate’: 0.6% above the equivalent gilt (the standard rate is 1.0%).
As part of the same package, government has designated an Enterprise Zone covering the local area. Local authorities are allowed to retain 100% of incremental business rates for a period of 25 years. The government has also given the GLA the option to extend the Enterprise Zone by 5 years, in the event that it cannot cover the costs of the project from the first 25 years of tax revenues. This extension was linked to the use of UK Guarantee powers.
Public Sector Net Debt classification
Public sector project (the Treasury’s refinancing facility did not alter this classification).
Other notable features The GLA told us that its primary motivation for accepting the Treasury support package was to secure the option to extend the Enterprise Zone by 5 years. It was also to provide comfort to the rating agencies that the GLA’s creditworthiness would not be impaired as a result of incurring the Northern Line Extension related debt.
Source: National Audit Offi ce analysis of HM Treasury documents, Greater London Authority

62 Appendix Four UK Guarantees scheme for infrastructure
INEOS Grangemouth
8 INEOS Grangemouth is a chemicals facility co-located with the Grangemouth oil refinery near Edinburgh, which is Scotland’s only crude oil refinery. The refinery is operated under a joint venture between INEOS and Petrochina and is not part of the ethane project. The chemicals facility is an entirely separate business from the refinery, which is owned by INEOS Grangemouth, a subsidairy of INEOS AG. The €585 million (£468 million) project to secure a long-term sustainable raw material supply for the chemicals facility by building a new terminal to import and store ethane. The project plans to import US shale gas that competitors in Europe do not have the current capacity to process, crack, and turn into useable products. The Grangemouth chemical business has been losing money and INEOS considers the project essential if the Grangemouth chemicals plant is to compete in world markets in the future. To make the most of the opportunity there is impetus to complete the project quickly, with a target completion of late 2016. The details of the Guarantee are outlined overleaf.
9 HM Treasury guaranteed the INEOS Grangemouth euro bond, which was publicly marketed in the capital markets. The bond was 2.6 times oversubscribed.

UK Guarantees scheme for infrastructure Appendix Four 63
Details of the INEOS Grangemouth guarantee
Area Brief description
What is guaranteed €285 million (£228 million)1 bonds placed with institutional investors, due to be repaid in 2019.
The Treasury is guaranteeing both the scheduled principal and fixed interest (0.814% annually) on the bond.
Beneficiary Holders of the guaranteed bonds. The bonds were issued to institutional investors following a listed public bond issue organised by Barclays and Lloyds on behalf of INEOS Grangemouth. The bonds may be traded.
HM Treasury’s risk assessment
Internal risk rating of 14; equivalent to B+ (non-investment grade).
The Treasury considered that the INEOS Group is highly leveraged, with a low but improving credit rating (B+). The Treasury applied the INEOS Group credit rating to the company raising the bond finance, although Moody’s had raised concerns over INEOS’ exposure to Grangemeouth in November 2013 in wake of the industrial action.
The Treasury risk officer assessment noted:
“It is not clear whether seeming lack of appetite from commercial funders reflects existing over-commitment to the INEOS Group or a lack of enthusiasm for Grangemouth – possibly a combination of both.”
Nature of the government’s security
Senior and first ranking security over the assets of the companies, subject to the permissible €20 million super-senior tranche. The Treasury has the ability to prevent shareholder withdrawals if certain conditions are not met.
The Treasury also has security over the assets of the company, both existing and new (once constructed, the new assets will comprise an ethane storage tank and jetties for importing).
Basis for fees charged by the Treasury
The Treasury considered 5-year credit default swaps, and existing INEOS bank loans as the direct price benchmarks.
Other sources of finance €200 million shareholder loan, provided by another subsidiary of INEOS AG.
Other government support Scottish Enterprise has provided £9 million of Regional Selective Assistance funding, the purpose of which is to help create and safeguard jobs.
Public Sector Net Debt classification
Private sector.
Other notable features The guarantee and the bond is in euros to match the revenues of the company.
The original proposal was for a 7-year guaranteed bond; however, following discussion at its risk committee, the Treasury negotiated to guarantee a 5-year bond.
Note
1 Based on an exchange rate of £1=€1.25, used by the Treasury.
Source: National Audit Offi ce analysis of HM Treasury documents

64 Glossary UK Guarantees scheme for infrastructure
Glossary
Best execution Financial Conduct Authority regulations require that, when executing orders, a firm must take all reasonable steps to obtain the best possible result for its clients taking into account the execution factors (including price, costs, speed and likelihood of execution).
Bonds A bond is a legal contract in which a borrower such as a government, company or institution issues a certificate of debt in order to raise money: a bond is essentially an IOU. Issuers of bonds include a wide range of private and public sector entities, including central governments (see gilts).
Capital charge The amount of capital (cash or assets that can be turned into cash) set aside against risk. There are regulatory requirements for commercial entities such as banks and insurance firms to set aside minimum amounts of capital to absorb potential losses from financial risks they are exposed to through their operations.
Contingent liability A potential financial claim that may be incurred depending on the outcome of future events. UK government accounts include both quantified and unquantified contingent liabilities.
Credit default swap Credit default swap contracts are similar to insurance. They allow one party to buy protection against a company or country defaulting or restructuring their debt over a certain period of time (eg 5 years).
Credit enhancement Increasing the creditworthiness of bonds.
Credit rating Credit ratings measure a borrower's creditworthiness and provide an international framework for comparing the credit quality of issuers and rated bonds.
Credit substitution Substituting the credit rating of a borrower with that of a third party, such as a guarantor. In the case of the UK Guarantees scheme, therefore, credit substitution would involve assigning a rating for guaranteed debt in line with the UK government’s credit rating.
Credit or default risk The risk that a counterparty will not settle an obligation (for example, a loan agreement) for full value, when due.
Gilts Bonds issued or guaranteed by the UK government. Also known as gilt-edged securities or British government securities.
Guarantee To assume the liability for debts of another in the event of default. A sovereign-backed guarantee is one issued by the government.

UK Guarantees scheme for infrastructure Glossary 65
Illiquidity premium A premium (an additional percentage return) that investors may demand when any given security (for example, a government-guaranteed bond) cannot be easily converted into cash, and converted at the fair market value (see liquidity).
LIBOR Stands for London Interbank Offered Rate. This is the interest rate that banks use to lend to each other in the UK.
Liquidity In this context,1 liquidity is the ability to buy or sell an asset (usually for cash) in the market without having a material effect on the asset’s price.
Market-oriented price A price for a product that is set with reference to the price of other similar products in the market.
Monoline insurance Monoline insurers offer insurance to investors against the risk of default on a bond or other security. The effect of the insurance is usually to substitute the credit rating of the bond or security with that of the monoline insurer.
Principal The total amount borrowed or invested excluding any interest, that is, the face value of a bond.
Risk-free rate The rate of return which can be earned on investments which are considered to be near-enough risk-free. For example, domestic central government debt in the UK.
Senior debt Debt which ranks ahead of other unsecured or subordinated debt in right of payment in a liquidation.
Spread The difference between two prices. A spread above gilts is the difference in price between a bond and a reference government bond, which is regarded as relatively risk-free. A spread above LIBOR is the difference in price between bank debt and the London Interbank Offered Rate (see LIBOR).
State Aid Government intervention that is considered to distort competition, within the EU.
1 Liquidity can also refer to the ability of financial institutions to fund increases in assets and meet obligations as they become due.
2 Sources: National Audit Office, drawing on the Whole of Government Accounts 2013-14 (HM Treasury, 2014), the Association of Corporate Treasurers and Reuters’ Financial Glossary, Moody’s investor service and the Fair and Effective Markets Review consultation document (HM Treasury, Bank of England, Financial Conduct Authority, 2014).

This report has been printed on Evolution Digital Satin and contains material sourced from responsibly managed and sustainable forests certified in accordance with the FSC (Forest Stewardship Council).
The wood pulp is totally recyclable and acid-free. Our printers also have full ISO 14001 environmental accreditation, which ensures that they have effective procedures in place to manage waste and practices that may affect the environment.

£10.00
9 781904 219668
ISBN 978-1-904219-66-8
Design and Production by NAO Communications DP Ref: 10543-001