uk fiscal policy before the crisis
TRANSCRIPT

© Institute for Fiscal Studies
UK fiscal policy before the crisisPaul Johnson
20/09/13

Overview
• Currently in middle of biggest fiscal consolidation since the war– Borrowing hit 11% of GDP– Debt heading from 40% to 85% of GDP– Consolidation of 9% of GDP
© Institute for Fiscal Studies

Overview
• Currently in middle of biggest fiscal consolidation since the war• UK entered recession with a large structural deficit by
international standards– But smaller than in 1996
• Period from 2001-08 saw historically big spending increases– Accompanied by some tax increases
• Fiscal rules were only partially effective• As in the 1980s the Chancellor and Treasury assumed growth
would continue unabated– Spending decisions made on that basis
• Hard to see how we could have entered recession in a qualitatively different fiscal situation
© Institute for Fiscal Studies

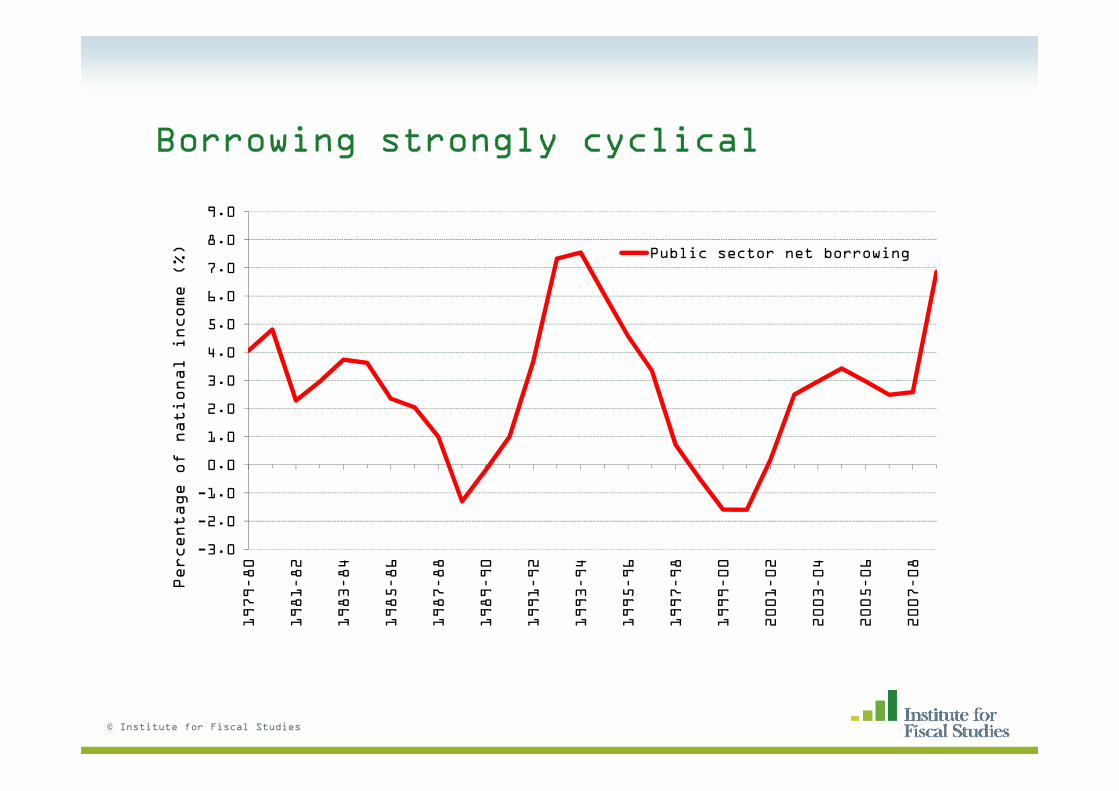
Borrowing strongly cyclical (of course)
• Rose dramatically in the early 1990s• Falling rapidly from mid 1990s• Then rising from early 2000s
© Institute for Fiscal Studies
Borrowing strongly cyclical
© Institute for Fiscal Studies
-3.0
-2.0
-1.0
0.0
1.0
2.0
3.0
4.0
5.0
6.0
7.0
8.0
9.0
1979–80
1981–82
1983–84
1985–86
1987–88
1989–90
1991–92
1993–94
1995–96
1997–98
1999–00
2001–02
2003–04
2005–06
2007–08
Percentage of national income (%) Public sector net borrowing

Borrowing strongly cyclical
© Institute for Fiscal Studies
-3.0
-2.0
-1.0
0.0
1.0
2.0
3.0
4.0
5.0
6.0
7.0
8.0
9.0
1979–80
1981–82
1983–84
1985–86
1987–88
1989–90
1991–92
1993–94
1995–96
1997–98
1999–00
2001–02
2003–04
2005–06
2007–08
Percentage of national income (%)
Public sector net borrowing
Current budget deficit
Cyclically-adjusted netborrowing

Borrowing strongly cyclical (of course)
• Rose dramatically in the early 1990s
• Falling rapidly from mid 1990s
• Then rising from early 2000s
• The period from 2001 saw significant spending increases
– But also tax increases
• With debt rising
© Institute for Fiscal Studies

With debt following a similar pattern
© Institute for Fiscal Studies
0
5
10
15
20
25
30
35
40
45
501979-80
1980-81
1981-82
1982-83
1983-84
1984-85
1985-86
1986-87
1987-88
1988-89
1989-90
1990-91
1991-92
1992-93
1993-94
1994-95
1995-96
1996-97
1997-98
1998-99
1999-00
2000-01
2001-02
2002-03
2003-04
2004-05
2005-06
2006-07
2007-08
2008-09
Percentage of national income (%)
Public sector net debt

Persistent under-estimation of change in borrowing
© Institute for Fiscal Studies
-4
-2
0
2
4
6
8
10
1978–79
1980–81
1982–83
1984–85
1986–87
1988–89
1990–91
1992–93
1994–95
1996–97
1998–99
2000–01
2002–03
2004–05
2006–07
Percentage of national income
Financial year

What was state of public finances pre crisis?
• PSNB 2.4% of GDP
• Current budget deficit 0.4%
• Structural borrowing then estimated at 2.6% of GDP
– OBR now believe it was at 3.7% of national income
• These measures were all lower than in 1996/97
• But don’t look so healthy on international comparisons
© Institute for Fiscal Studies

© Institute for Fiscal Studies
% of national income
Rankings: OECD member
countries
Pre-crisis position
(2007)
Spending
General government
spending
43.7%
Place in OECD 12th/30 highest spending
Revenues
Tax and other revenues 41.0%
Place in OECD 18th/30 highest revenues
Borrowing
General government net
borrowing
2.7%
Place in OECD 6th/30 highest borrowing
Structural borrowing 4.5%
Place in OECD 3rd/26 highest borrowing

© Institute for Fiscal Studies
% of national income
Rankings: OECD member
countries
Pre-crisis position
(2007)
Change, 1997 to
2007
(% points)
Spending
General government
spending
43.7% +3.3
Place in OECD 12th/30 highest spending 2nd/30 largest
increase
Revenues
Tax and other revenues 41.0% +2.8
Place in OECD 18th/30 highest revenues 6th/30 largest
increase
Borrowing
General government net
borrowing
2.7% +0.5
Place in OECD 6th/30 highest borrowing 4th/30 largest
increase
Structural borrowing 4.5% +2.3
Place in OECD 3rd/26 highest borrowing 6th/26 largest
increase

Fiscal rules
• Were generally unclear pre-1997
– A broad aspiration to meet budget balance in the medium term
• From 1997:
– Golden Rule: current budget balance over the cycle
– Sustainable Investment Rule: keep net debt below 40% of GDP
• For the Treasury to determine whether rules were being met
© Institute for Fiscal Studies

Sustainable Investment Rule
• In 2008 Budget Treasury was (still) expecting 2% growth
– the central forecast was for debt to hit 39.8% of GDP in 2010
• At least appeared to drive the structure of many private finance deals
– Network Rail structure allowed £18 billion of debt not to count against the rule
• “Sustainability” appeared unrelated to future commitments
© Institute for Fiscal Studies

With debt following a similar pattern
© Institute for Fiscal Studies
0
5
10
15
20
25
30
35
40
45
501979-80
1980-81
1981-82
1982-83
1983-84
1984-85
1985-86
1986-87
1987-88
1988-89
1989-90
1990-91
1991-92
1992-93
1993-94
1994-95
1995-96
1996-97
1997-98
1998-99
1999-00
2000-01
2001-02
2002-03
2003-04
2004-05
2005-06
2006-07
2007-08
2008-09
Percentage of national income (%)
Public sector net debt
Sustainable debt rule

Golden Rule
• Effectively backward looking for period after 2001
– Using up “headroom” created by early surpluses
• Required dating of the cycle
– Dating which conveniently changed in 2005 when it looked like rule might be breached
– Start of cycle redated from 1999 to 1997
© Institute for Fiscal Studies

Golden Rule
• Effectively backward looking for period after 2001
– Using up “headroom” created by early surpluses
• Required dating of the cycle
– Dating which conveniently changed in 2005 when it looked like rule might be breached
– Start of cycle redated from 1999 to 1997
• Leading my predecessor Robert Chote to suggest that it was “not so much a cycle as a stretch limo”
© Institute for Fiscal Studies

What future for fiscal rules?
• Current fiscal mandate looks better than the golden rule
– Forward looking
• And independent OBR acts as arbiter
• But depends on judgments about what is “structural” as well as a five year forecast
• And with the secondary debt rule not turning out to be binding there is no anchor
• Clearly credible fiscal policy is about much more than fiscal rules
© Institute for Fiscal Studies

Spending
• Overall tightly controlled for decade after the 1990 recession
• Rising consistently after 2001
– Contrasting with volatile year on year changes previously
• Different patterns for public services and social security
© Institute for Fiscal Studies

Annual change in public service spending
© Institute for Fiscal Studies
-6.00
-4.00
-2.00
0.00
2.00
4.00
6.00
8.00
10.00
1979-80
1980-81
1981-82
1982-83
1983-84
1984-85
1985-86
1986-87
1987-88
1988-89
1989-90
1990-91
1991-92
1992-93
1993-94
1994-95
1995-96
1996-97
1997-98
1998-99
1999-00
2000-01
2001-02
2002-03
2003-04
2004-05
2005-06
2006-07
2007-08
2008-09
2009-10
2010-11
2011-12
2012-13
2013-14
2014-15
2015-16
2016-17
2017-18
Real percentage increase (%)
Thatcher Blair
Major Brown
Cameron Output gap

Annual change in social security spending
© Institute for Fiscal Studies
-6.00
-4.00
-2.00
0.00
2.00
4.00
6.00
8.00
10.00
12.00
14.00
1979-80
1980-81
1981-82
1982-83
1983-84
1984-85
1985-86
1986-87
1987-88
1988-89
1989-90
1990-91
1991-92
1992-93
1993-94
1994-95
1995-96
1996-97
1997-98
1998-99
1999-00
2000-01
2001-02
2002-03
2003-04
2004-05
2005-06
2006-07
2007-08
2008-09
2009-10
2010-11
2011-12
2012-13
2013-14
2014-15
2015-16
2016-17
2017-18
Real percentage increase (%)
Thatcher Blair
Major Brown
Coalition Claimant count rate

Spending
• Overall tightly controlled for decade after the 1990 recession
• Rising consistently after 2001
– Contrasting with volatile year on year changes previously
• Different patterns for public services and social security
• Was adequate caution built in?
• Is the process of three year spending reviews adequate?
• Are inefficient cycles avoidable?
© Institute for Fiscal Studies

The Grand Old Duke of York
© Institute for Fiscal Studies
4.000
4.200
4.400
4.600
4.800
5.000
5.200
5.400
5.600
5.800
1999Q1
2000Q1
2001Q1
2002Q1
2003Q1
2004Q1
2005Q1
2006Q1
2007Q1
2008Q1
2009Q1
2010Q1
2011Q1
2012Q1
2013Q1
2014Q1
2015Q1
2016Q1
2017Q1
2018Q1
General government employment (million)
General government employment
Forecast general government employment

Spending cuts
• Substantial cuts in spending from 2010 will only serve to return spending as a share of GDP to its 2004 level by 2018
– But with a very different pattern of spending
• Annually managed expenditure (including debt interest) continues to rise in real terms
• Public service spending is due to fall by nearly 20% in real terms
– By a third in “unprotected” areas
© Institute for Fiscal Studies

Composition of spending has changed
• Partly driven by demographics
– Number of pensioner rose by about 1.2% a year from 1980
• With a particular increase in the share of health spending
• Also driven by increased spending on working age welfare
– Despite falls in claimant count over much of the period
• Continual move towards a welfare state
– Maintained since 2008
© Institute for Fiscal Studies

Annual real spending growth
-1
0
1
2
3
4
5
6
7
8
1979-88 1989-99 2000-07
health
other publicservices
pensionerbenefits
other benefits
© Institute for Fiscal Studies

Changing composition of spending
1980-81 2017-180%
10%
20%
30%
40%
50%
60%
70%
80%
90%
100%
other benefits
pensionerbenefits
health
other publicservices
© Institute for Fiscal Studies

Taxes
• Overall revenues respond quickly to economic activity
– So appear less cyclical than spending
© Institute for Fiscal Studies

Tax revenues over time
© Institute for Fiscal Studies
25
30
35
40
45
50
1978-79
1979-80
1980-81
1981-82
1982-83
1983-84
1984-85
1985-86
1986-87
1987-88
1988-89
1989-90
1990-91
1991-92
1992-93
1993-94
1994-95
1995-96
1996-97
1997-98
1998-99
1999-00
2000-01
2001-02
2002-03
2003-04
2004-05
2005-06
2006-07
2007-08
2008-09
2009-10
2010-11
2011-12
2012-13
2013-14
2014-15
2015-16
2016-17
2017-18
Percentage of national income
Current receipts
Forecast current receipts
Net taxes and National Insurance contributions
Forecast net taxes and National Insurance contributions

Taxes
• Overall revenues respond quickly to economic activity
– So appear less cyclical than spending
• Considerable reforms over the period
• Some, like big cuts in income tax rates in in 1980s stuck
– Even if they had to be paid for eventually by raising other taxes
• 1990s consolidation considerably more focussed on tax increases than is this one
© Institute for Fiscal Studies

Annual increases in net taxes and NICs
© Institute for Fiscal Studies
-6
-4
-2
0
2
4
6
8
-10
-5
0
5
10
15
1979-80
1980-81
1981-82
1982-83
1983-84
1984-85
1985-86
1986-87
1987-88
1988-89
1989-90
1990-91
1991-92
1992-93
1993-94
1994-95
1995-96
1996-97
1997-98
1998-99
1999-00
2000-01
2001-02
2002-03
2003-04
2004-05
2005-06
2006-07
2007-08
2008-09
2009-10
2010-11
2011-12
2012-13
2013-14
2014-15
2015-16
2016-17
2017-18
Real GDP growth (%)
Real percentage increase (%)
Thatcher Blair
Major Brown
Coalition Real GDP growth
Ratio of earnings to GDP growth

Tax policy
• Heavily influenced by the electoral cycle
– Big increases announced immediately after each election
• 1992 pre election Budget was a giveaway
– 1993 post election Budget a huge takewaway.
© Institute for Fiscal Studies

Taxes increase after elections
© Institute for Fiscal Studies
-5.3-6.7
-9.4-17.9
-9.42.43.6
-6.125.3
17.4-0.8
-8.51.3
8.15.7
-3.5-1.1-0.6-1.3
-5.20.0
12.00.90.70.40.30.60.7
3.71.12.6
0.31.3
3.12.2
5.34.9
1.36.9
-0.20.30.0
-0.70.1
-30 -20 -10 0 10 20 30
Spring 1985 BudgetSpring 1986 BudgetSpring 1987 BudgetSpring 1988 BudgetSpring 1989 BudgetSpring 1990 BudgetSpring 1991 BudgetSpring 1992 BudgetSpring 1993 BudgetAutumn 1993 BudgetAutumn 1994 BudgetAutumn 1995 BudgetAutumn 1996 BudgetSummer 1997 BudgetSpring 1998 BudgetSpring 1999 Budget
Autumn 1999 PBRSpring 2000 Budget
Autumn 2000 PBRSpring 2001 Budget
Autumn 2001 PBRSpring 2002 Budget
Autumn 2002 PBRSpring 2003 Budget
Autumn 2003 PBRSpring 2004 Budget
Autumn 2004 PBRSpring 2005 Budget
Autumn 2005 PBRSpring 2006 Budget
Autumn 2006 PBRSpring 2007 Budget
Autumn 2007 PBRSpring 2008 Budget
Autumn 2008 PBRSpring 2009 Budget
Autumn 2009 PBRSpring 2010 BudgetJune 2010 BudgetAutumn 2010 AS
Spring 2011 BudgetAutumn 2011 AS
Spring 2012 BudgetAutumn 2012 AS
£ billion (2012–13 terms)

Tax policy
• Heavily influenced by the electoral cycle
– Big increases announced immediately after each election
• 1992 pre election Budget was a giveaway
– 1993 post election Budget a huge takewaway.
• Norman Lamont:
– 1992 Budget “was not a very good Budget. But it did help us to win the 1992 election
– 1993 Budget: "helped to lose the 1997 election for the Conservatives, but it was definitely my best budget”
© Institute for Fiscal Studies

Revenue composition
• Not changed as much as spending composition
– Despite dramatic changes in rates
© Institute for Fiscal Studies

Changing composition of tax revenues
© Institute for Fiscal Studies
32.4%25.7% 27.6% 28.6%
17.5%
17.3%18.3%
19.5%
8.5%15.6%
18.5% 15.6%
17.3%13.4%
14.8%10.2%
6.1% 10.6%
6.7%
7.8%
1.0% 1.3%0.6%
1.5%2.1%2.7%
1.7%4.5%
15.2% 13.3% 11.8% 12.3%
0%
10%
20%
30%
40%
50%
60%
70%
80%
90%
100%
1978-79 1989-90 1993-94 2007-08
Percentage of total net taxes and NICs
Other
Capital taxes
North sea taxes
Onshore CT
Excise duties
VAT
NICs
Income tax

Revenue composition
• Not changed as much as spending composition
– Despite dramatic changes in rates
• In part reflecting big increases in taxable incomes
– Especially towards the top of the distribution
– Dependence on richest income tax payers has grown dramatically
• Little in the way of consistent reform
– Savings/pensions
– CGT
– Corporate tax
– VAT
• Failure to implement reform (unquantifiably) costly© Institute for Fiscal Studies

Two specific taxes
• 1980s were cushioned by massive revenues from the North Sea
– Collapse of which made the fiscal problems of 1990s much worse
© Institute for Fiscal Studies

North Sea Oil Revenues (%GDP)
© Institute for Fiscal Studies
0.0
0.5
1.0
1.5
2.0
2.5
3.0
3.5
4.0
1978-79
1979-80
1980-81
1981-82
1982-83
1983-84
1984-85
1985-86
1986-87
1987-88
1988-89
1989-90
1990-91
1991-92
1992-93
1993-94
1994-95
1995-96
1996-97
1997-98
1998-99
1999-00
2000-01
2001-02
2002-03
2003-04
2004-05
2005-06
2006-07
2007-08
2008-09
2009-10
2010-11
2011-12
2012-13
2013-14
2014-15
2015-16
2016-17
Percentage of national income (%)
Realised receipts

Two specific taxes
• 1980s were cushioned by massive revenues from the North Sea
– Collapse of which made the fiscal problems of 1990s much worse
• Onshore corporation tax is highly cyclical
– Unlike other taxes fell significantly in nominal terms after 2008
– And takes a while to recover
© Institute for Fiscal Studies

Onshore Corporation Tax revenues (%GDP)
© Institute for Fiscal Studies
0.0
0.5
1.0
1.5
2.0
2.5
3.0
3.5
4.0
4.51978-79
1979-80
1980-81
1981-82
1982-83
1983-84
1984-85
1985-86
1986-87
1987-88
1988-89
1989-90
1990-91
1991-92
1992-93
1993-94
1994-95
1995-96
1996-97
1997-98
1998-99
1999-00
2000-01
2001-02
2002-03
2003-04
2004-05
2005-06
2006-07
2007-08
2008-09
2009-10
2010-11
2011-12
2012-13
2013-14
2014-15
2015-16
2016-17
Percentage of national income (%)
Realised receipts

Conclusions
• Fiscal policy pre-crisis cannot be described as reckless
– There were tax increases as well as spending increases
– We could not have avoided a substantial tightening
• But in both 1980s and 2000s excessive optimism (at least ex post) seems to have been built in
• Spending review processes take inadequate account of long term effects
– Long term sustainability more generally plays too peripheral a role
• Pre crisis fiscal rules were inadequate
– And arguably gamed by the government that introduced them
• Too little focus on both structure and long term sustainability of the tax system
© Institute for Fiscal Studies