uk energy statistics: statistical press release - gov.uk · uk energy statistics, q3 2017 ......
TRANSCRIPT

Page 1 of 16
PRESS NOTICE
Date: 21 December 2017
STATISTICAL PRESS RELEASE
UK Energy Statistics, Q3 2017
Energy Trends and Energy Prices publications are published today 21 December 2017 by the Department for Business, Energy and Industrial Strategy. Energy Trends covers statistics on energy production and consumption, in total and by fuel, and provides an analysis of the year on year changes. Energy Prices covers prices to domestic and industrial consumers, prices of oil products and comparisons of international fuel prices. The main points for the third quarter of 2017 are:
Low carbon electricity’s share of generation accounted for a record high 54.4 per cent in the third quarter of 2017, up from 50.2 per cent in the same period of 2016, due to increased renewables generation.
Low carbon electricity’s share of generation
0%
10%
20%
30%
40%
50%
60%
Q12014
Q2 Q3 Q4 Q12015
Q2 Q3 Q4 Q12016
Q2 Q3 Q4 Q12017
Q2 Q3
Nuclear Wind & Solar Bioenergy

Page 2 of 16
Main points (continued):
UK energy production fell by 2.8 per cent in the third quarter of 2017 compared with a year earlier. Production of oil fell by 0.4 per cent, whilst production of gas fell by 10.7 per cent due to low production levels in August and September 2017 due to maintenance activity.
Primary energy consumption for energy uses rose by 1.3 per cent, however when adjusted to take of account of weather differences between the third quarter of 2016 and the third quarter of 2017, primary energy consumption rose by 0.7 per cent.
Final energy consumption (excluding non-energy use) rose by 1.7 per cent compared to the third quarter of 2016. Domestic consumption rose by 8.5 per cent reflecting the cooler weather in the quarter, service sector consumption rose by 2.7 per cent, transport consumption rose by 0.3 per cent, whilst industrial consumption fell by 0.9 per cent. On a temperature corrected basis, final energy consumption rose by 0.9 per cent.
Of electricity generated in the third quarter of 2017, gas accounted for 39.1 per cent, whilst coal accounted for 2.9 per cent. Nuclear generation accounted for 24.4 per cent, whilst the share from renewables increased to 30.0 per cent.
Provisional data for 2017 suggest that domestic energy bills increased by 1.2 per cent in current prices, though were down 0.6 per cent in real terms. For fixed consumption levels of electricity of 3,800 kWh per annum, bills increased by £33 to £619; and for fixed consumption levels of gas of 15,000 kWh per annum, bills decreased by £19 to £631. The combined average domestic bill increased by £14 from £1,236 in 2016 to £1,250 in 2017. Average bills for those using prepayment meters fell by £84 following the introduction of the price cap earlier this year.
For more detailed information on methodology, quality assurance and use of the data, please refer to the methodology notes available by energy sector on the BEIS section of the GOV.UK website at: www.gov.uk/government/organisations/department-for-business-energy-and-industrial-strategy/about/statistics
The December 2017 edition of Energy Trends also includes articles on:
Electricity generation and supply figures for Scotland, Wales, Northern Ireland and England, 2013 to 2016 (see commentary on page 15)
Physical gas flows across Europe and diversity of gas supply in 2016
Feed-in Tariff load factor analysis
Fuel Mix Disclosure – proposed methodology change for residuals
Domestic energy consumption by energy efficiency and environmental impact, 2015

Page 3 of 16
The following statistics are also published today, 21 December 2017, by the Department for Business, Energy and Industrial Strategy:
Feed-in Tariff commissioned installations, November 2017 www.gov.uk/government/statistics/monthly-small-scale-renewable-deployment
Household Energy Efficiency headline release www.gov.uk/government/statistics/household-energy-efficiency-national-statistics-headline-release-december-2017
RHI deployment, November 2017 www.gov.uk/government/statistics/rhi-deployment-data-november-2017
Solar photovoltaics deployment, November 2017 www.gov.uk/government/statistics/solar-photovoltaics-deployment
Sub-national electricity consumption, 2016 www.gov.uk/government/collections/sub-national-electricity-consumption-data
Sub-national gas consumption, 2016 www.gov.uk/government/collections/sub-national-gas-consumption-data

Page 4 of 16
TOTAL ENERGY: QUARTER 3 2017
Total Energy - Production
-6%
-4%
-2%
0%
2%
4%
6%
8%
10%
12%
14%
Q12014
Q2 Q3 Q4 Q12015
Q2 Q3 Q4 Q12016
Q2 Q3 Q4 Q12017
Q2 Q3
An
nu
al
gro
wth
ra
te
(1) Nuclear and wind, solar & natural flow hydro electricity
Total energy production in the third quarter of 2017 was 28.6 million tonnes of oil equivalent, 2.8 per cent lower than in the third quarter of 2016.
Production of oil fell by 0.4 per cent compared to the third quarter of 2016.
Production of gas fell by 10.7 per cent compared to the third quarter of 2016, as a result of low production levels in August and September 2017 due to maintenance activity.
Primary electricity output in the third quarter of 2017 was 0.3 per cent lower than in the third quarter of 2016, within which nuclear electricity output was 3.6 per cent lower, whilst output from wind, solar and natural flow hydro was 11.9 per cent higher than the same period in 2016, due to increased renewable capacity.
Production of bioenergy and waste was 24 per cent higher than in the third quarter of 2016.
In the third quarter of 2017 production of coal and other solid fuels was 30 per cent lower than the corresponding period of 2016.
Total energy quarterly tables ET 1.1 – 1.3 are available on the BEIS section of the GOV.UK website at: www.gov.uk/government/statistics/total-energy-section-1-energy-trends
2017 Q3
Million tonnes of oil equivalent
Percentage change on a year
earlier
Total production 28.6 -2.8
Oil 12.3 -0.4
Natural gas 8.5 -10.7
Primary electricity(1) 5.2 -0.3
Bioenergy & waste 2.2 +24.4
Coal 0.5 -29.8

Page 5 of 16
TOTAL ENERGY: QUARTER 3 2017
Total Energy – consumption(1)
180
185
190
195
200
205
210
Q12014
Q2 Q3 Q4 Q12015
Q2 Q3 Q4 Q12016
Q2 Q3 Q4 Q12017
Q2 Q3
Mill
ion tonne
s o
f oil
equiv
ale
nt
0
(1) Total inland consumption on a primary fuel input basis (seasonally adjusted and temperature corrected annual rates).
When examining seasonally adjusted and temperature corrected annualised rates:
Total inland consumption on a primary fuel input basis was 189.9 million tonnes of oil equivalent in the third quarter of 2017, 0.7 per cent higher than the same quarter in 2016.
Between the third quarter of 2016 and the third quarter of 2017, coal and other solid fuel consumption fell by 21 per cent driven by decreased coal use in electricity generation.
Oil consumption rose by 1.1 per cent, whilst gas consumption rose by 1.2 per cent.
Primary electricity consumption rose by 1.2 per cent, with a rise in wind, solar and hydro of 13.0 per cent but a fall in nuclear of 4.0 per cent.
Final consumption was 1.7 per cent higher in the third quarter of 2017 compared to the same quarter a year earlier. The average temperature in the third quarter of 2017 was 1.2 degrees Celsius cooler than the same period a year earlier. On a temperature corrected basis, final energy consumption was 0.9 per cent higher over the same period.
Total energy quarterly tables ET 1.1 – 1.3 are available on the BEIS section of the GOV.UK website at: www.gov.uk/government/statistics/total-energy-section-1-energy-trends
2017 Q3
Million tonnes of oil equivalent
Percentage change on a year
earlier
Total consumption Unadjusted 40.0 +1.3 Seasonally adjusted and temperature corrected – annual rate
189.9 +0.7
Final consumption: unadjusted temperature corrected
28.3 35.8
+1.7 +0.9
Page 6 of 16
COAL: QUARTER 3 2017
Coal production and imports
0
2
4
6
8
10
12
14
16
18
Q12014
Q2 Q3 Q4 Q12015
Q2 Q3 Q4 Q12016
Q2 Q3 Q4 Q12017
Q2 Q3
Mil
lio
n T
on
nes
Deep-mined Surface mining Imports
2017 Q3 Thousand tonnes
Percentage change on a year earlier
Coal Supply - Coal production
2,135 721
-17.7 -29.8
- Coal imports 1,862 +9.9 Coal demand 2,134 -17.8 - Power stations 860 -27.5 - Coke ovens & blast furnaces 744 -8.1 - Final users 464 -9.7
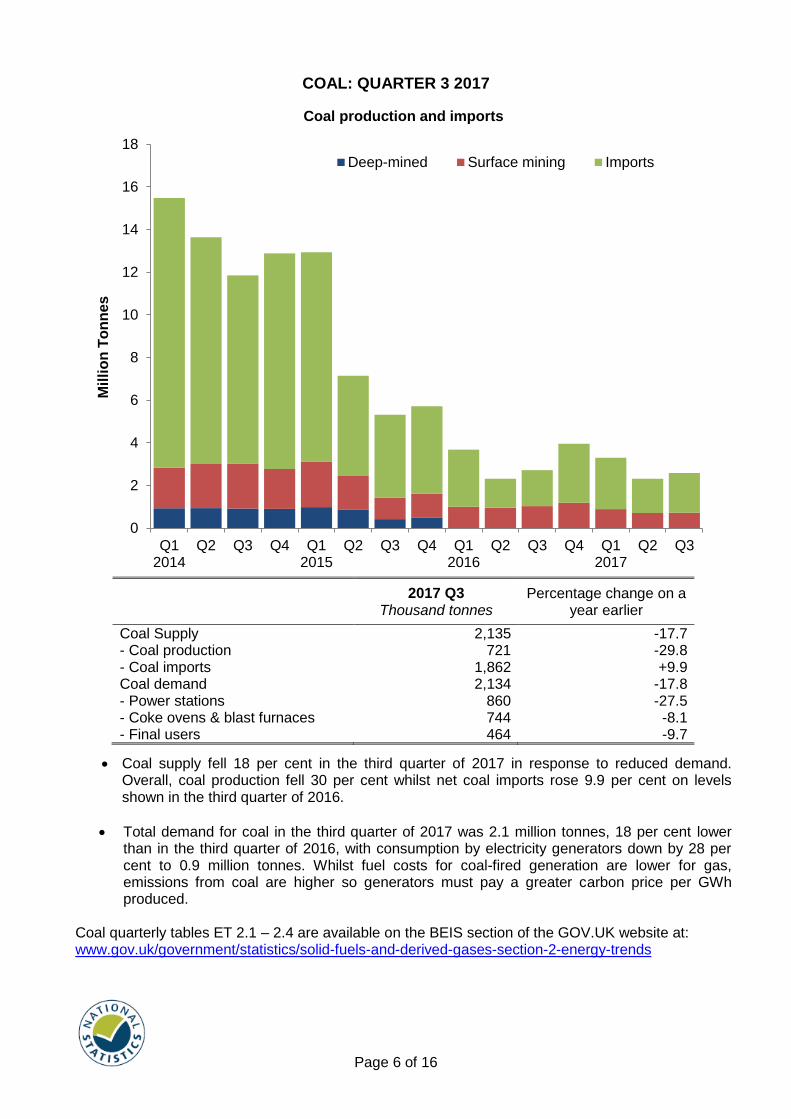
Coal supply fell 18 per cent in the third quarter of 2017 in response to reduced demand. Overall, coal production fell 30 per cent whilst net coal imports rose 9.9 per cent on levels shown in the third quarter of 2016.
Total demand for coal in the third quarter of 2017 was 2.1 million tonnes, 18 per cent lower than in the third quarter of 2016, with consumption by electricity generators down by 28 per cent to 0.9 million tonnes. Whilst fuel costs for coal-fired generation are lower for gas, emissions from coal are higher so generators must pay a greater carbon price per GWh produced.
Coal quarterly tables ET 2.1 – 2.4 are available on the BEIS section of the GOV.UK website at: www.gov.uk/government/statistics/solid-fuels-and-derived-gases-section-2-energy-trends
Page 7 of 16
OIL: QUARTER 3 2017
Demand for key transport fuels
2017 Q3 Thousand tonnes
Percentage change on a year earlier
Primary oil production 11,330 -0.4 Primary oil demand 15,437 +0.6
Net imports (primary oil) 4,347 +6.5 Net imports (oil products) 2,380 +0.9 Refinery production 15,943 +1.6
Petroleum demand 17,630 +0.9 - Motor spirit (including biofuels) 2,996 -0.6 - DERV fuel (including biofuels) 6,233 +1.1 - Aviation turbine fuel 3,359 +0.1
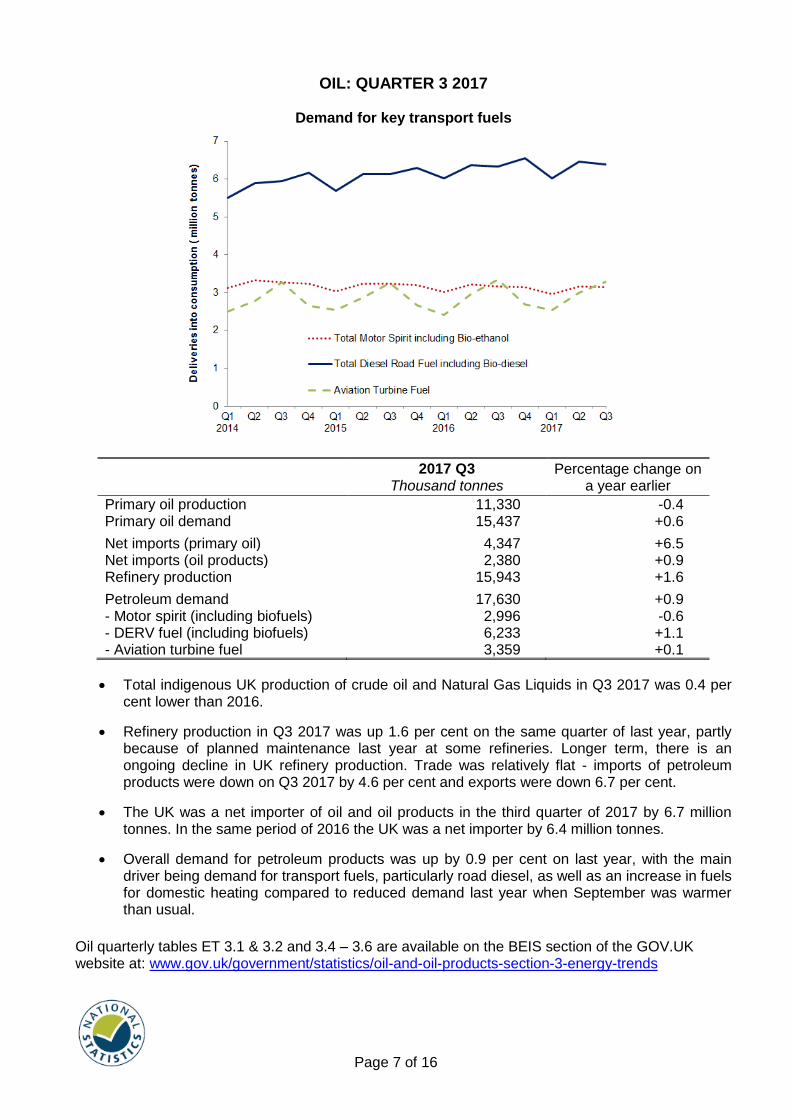
Total indigenous UK production of crude oil and Natural Gas Liquids in Q3 2017 was 0.4 per cent lower than 2016.
Refinery production in Q3 2017 was up 1.6 per cent on the same quarter of last year, partly because of planned maintenance last year at some refineries. Longer term, there is an ongoing decline in UK refinery production. Trade was relatively flat - imports of petroleum products were down on Q3 2017 by 4.6 per cent and exports were down 6.7 per cent.
The UK was a net importer of oil and oil products in the third quarter of 2017 by 6.7 million tonnes. In the same period of 2016 the UK was a net importer by 6.4 million tonnes.
Overall demand for petroleum products was up by 0.9 per cent on last year, with the main driver being demand for transport fuels, particularly road diesel, as well as an increase in fuels for domestic heating compared to reduced demand last year when September was warmer than usual.
Oil quarterly tables ET 3.1 & 3.2 and 3.4 – 3.6 are available on the BEIS section of the GOV.UK website at: www.gov.uk/government/statistics/oil-and-oil-products-section-3-energy-trends

Page 8 of 16
GAS: QUARTER 3 2017
Production of natural gas
2017 Q3
TWh Percentage change on a
year earlier
Gas production 98.6 -10.7
Gas imports 98.9 9.9
Gas exports 53.0 1.9
Gas demand 143.7 1.2
- Electricity generation 63.7 -6.7
- Domestic 26.6 15.3
Total indigenous UK production of natural gas in the third quarter of 2017 was 98.6 TWh,10.7 per cent lower than a year before.
Whilst exports remained at a similar level to Q3 2016, imports increased by 9.9 per cent. Notably, there has been a shift towards pipeline imports (up nearly 50 per cent) at the expense of imports of Liquified Natural Gas. Net imports were up over a fifth on the same period last year.
UK gas demand was up 1.2 per cent compared to Q3 2017, with demand for electricity generation down by 6.7 per cent whilst domestic useage was up 15.3 per cent due to colder weather, particularly in September.
Gas quarterly table ET 4.1 is available on the BEIS section of the GOV.UK website at: www.gov.uk/government/statistics/gas-section-4-energy-trends

Page 9 of 16
ELECTRICITY: QUARTER 3 2017
Coal 3.6%
Gas 42.9%
Nuclear 24.8%
Oil and Other 3.3%
Q3 2016
Renewables25.4%
Coal 2.9%
Gas 39.1%
Nuclear 24.4%
Oil and Other 3.6%
Q3 2017
Renewables30.0%
Low carbon generation (including renewables) accounted for 54.4 per cent of generation in Q3 2017, a record high, up from 50.2 per cent from the same period of 2016.
Fuel used by generators in the third quarter of 2017 was 1.2 per cent lower than in the third quarter of 2016.
Combined gas and coal made up a record low of 42 per cent of total generation (down 4.5pp) in Q3 2017. This reduction was mainly due to increased baseload supply (non-thermal renewable and nuclear) offsetting the need for fossil fuel generation. Gas and Coal decreased by 11 per cent, and 20 per cent respectively compared with a year earlier. Renewables generation was up 8.9 per cent, mainly due to increased wind and solar capacity.
Total electricity generated in the third quarter of 2017 was 2.2 per cent lower than a year earlier, while net imports increased by 13.7 per cent and accounted for 7.1 per cent of the electricity supply.
Final consumption of electricity was 1.9 per cent lower than in the third quarter of 2016.
Electricity quarterly tables ET 5.1, 5.2 & 5.6 are available on the BEIS section of the GOV.UK website at: www.gov.uk/government/statistics/electricity-section-5-energy-trends
2017 Q3 TWh
Percentage change on a year earlier
Electricity Generated from
Coal 2.2 -20.2 Nuclear 18.2 -3.6 Gas 29.1 -11.0 Renewables 22.3 +8.9 Total 74.4 -2.2 Supplied to Industry 22.1 -2.7 Domestic 22.1 +1.1 Other final consumers 23.9 -3.7
All 68.1 -1.9

Page 10 of 16
RENEWABLES: QUARTER 3 2017
Renewable electricity generation
0
5
10
15
20
25
30
Q12014
Q2 Q3 Q4 Q12015
Q2 Q3 Q4 Q12016
Q2 Q3 Q4 Q12017
Q2 Q3
Ge
ne
rati
on
(T
Wh
)
Shoreline wave / tidalSolar PVOffshore WindOnshore WindHydroBioenergy
Renewables’ share of electricity generation was 30.0 per cent in the third quarter of 2017, up 4.6 percentage points on the share in 2016 Q3.
Renewable electricity generation was 22.3 TWh in 2017 Q3, an increase of 15 per cent compared to 2016 Q3, though 11 per cent lower than the peak quarterly record of 25.1 TWh in 2017 Q1. In 2017 Q3, generation from bioenergy was 7.6 TWh, up 1.4 TWh (23 per cent) on a year earlier, mainly due to increased availability at Drax, following extensive outages a year earlier. Generation from both onshore and offshore wind rose by 20 per cent and 10 per cent respectively. Large increases in capacity over the year, particularly for onshore wind, more than out-weighed reduced wind speeds during the quarter. Generation from hydro rose by 8.3 per cent on a year earlier to 1.2 TWh and generation from solar photovoltaics increased by 4.2 per cent (0.2 TWh) to 3.9 TWh, due to increased capacity.
Renewable electricity capacity totalled 38.9 GW at the end of the third quarter of 2017, a rise of 13 per cent (4.4 GW) on a year earlier, with half of this increase from onshore wind.
Renewable transport: In the third quarter of 2017, liquid biofuels represented 3.1 per cent of petrol and biodiesel consumed in road transport, 0.2 percentage points lower than 2016 Q3’s share. In the third quarter of 2017, bioethanol consumption increased by 0.7 per cent on a year earlier, while biodiesel consumption decreased by 9.5 per cent.
Renewables quarterly tables ET 6.1 – 6.2 are available on the BEIS section of the GOV.UK website at: www.gov.uk/government/statistics/energy-trends-section-6-renewables
2017 Q3 TWh
Percentage change on a year earlier
Renewable electricity generation
Onshore wind 5.6 +20.3 Offshore wind 3.9 +10.1 Hydro 1.2 +8.3 Solar PV 3.9 +4.2 Bioenergy (inc. co-firing) 7.6 +22.8 All renewables 22.3 +15.4

Page 11 of 16
DOMESTIC PRICES: QUARTER 3 2017
Fuel price indices in the domestic sector in real terms
20
40
60
80
100
120
140
Q12015
Q22015
Q32015
Q42015
Q12016
Q22016
Q32016
Q42016
Q12017
Q22017
Q32017
Ind
ex 2
01
0=
10
0
Gas
Electricity
Liquid fuels
Consumer price index fuel components in real terms (1) 2010=100
2017 Q3 Percentage change on a
year earlier
Solid fuels 101.8 +0.9 Gas 109.5 -1.8 Electricity 123.8 +7.0 Liquid fuels 75.8 +12.3 Total domestic fuel 116.1 +3.2
(1) Deflated using the GDP implied deflator. The original source of the indices is ONS.
The price paid for all domestic fuels by household consumers increased by 3.2 per cent in real terms between Q3 2016 and Q3 2017, and by 1.3 per cent between Q2 and Q3 2017.
Domestic electricity prices, including VAT, in Q3 2017 were 7.0 per cent higher in real terms than in Q3 2016. Prices were 2.3 per cent higher than in Q2 2017.
The price of domestic gas, including VAT, fell by 1.8 per cent in real terms between Q3 2016 and Q3 2017 but rose by 0.4 per cent between Q2 and Q3 2017.
The price of liquid fuels rose by 12 per cent between Q3 2016 and Q3 2017 but fell by 0.3 per cent between Q2 and Q3 2017.
For the period January to June 2017, prices for medium domestic gas and electricity consumers, including tax, were the second lowest and fifth lowest in the EU15 respectively.
Switching levels
Switching rates amongst consumers rose by 33 per cent for electricity and 58 per cent for gas between Q3 2016 and Q3 2017. For both electricity and gas, these transfers in Q317 represent around 4.6 and 4.8 per cent, respectively, of each of their domestic customers.
Domestic prices tables are available on the BEIS section of the GOV.UK website at: www.gov.uk/government/collections/domestic-energy-prices

Page 12 of 16
DOMESTIC ENERGY BILLS: 2017
Average domestic gas and electricity bills (cash terms)
Average annual domestic fuel bills (1)
2016 2017 (p) Percentage change, cash terms
Percentage change, real terms (2)
Gas (3) £650 £631 -2.9 -4.6 Electricity(4) £586 £619 5.7 3.8
Total (5) £1,236 £1,250 1.2 -0.6
(1) Average annual bills for domestic customers are weighted by the proportion of customers on the different payment methods, which include standard credit, direct debit and pre-payment meter. Bills relate to the total bill received in the calendar year and are in cash terms.
(2) To estimate the percentage change in real terms, bills were deflated using the GDP (implied) deflator. (3) Gas bills are based on an annual consumption of 15,000 kWh. (4) Electricity bills are based on an annual consumption of 3,800 kWh. (5) The average total gas and electricity bill presented should be taken as broadly indicative only. It is not based on
individual customers, but is simply the sum of the averages for electricity and gas. (p) Provisional bills only – final bills will be available in the March 2018 edition of ‘Quarterly Energy Prices’.
The combined average domestic bill increased by £14 from £1,236 in 2016 to £1,250 in 2017.
The average standard electricity bill in 2017, across all payment types has increased by £33 (5.7 per cent) since 2016, from £586 to £619. However, the average 2017 gas bill across all payment types has decreased by £19 (2.9 per cent), from £650 to £631. These bills are based on standard consumptions of 3,800kWh per year for electricity and 15,000kWh per year for gas.
The average combined bill for prepayment fell by £84, from £1,334 in 2016 to £1,250 in 2017, making credit the most expensive method of payment at £1,366. Direct debit is still the cheapest method of payment, with a combined bill of £1,207, £43 cheaper than prepayment.
Domestic prices tables are available on the BEIS section of the GOV.UK website at: www.gov.uk/government/collections/domestic-energy-prices

Page 13 of 16
INDUSTRIAL PRICES: QUARTER 3 2017
Industrial fuel price indices in real terms including the Climate Change Levy
20
40
60
80
100
120
140
Q3
201
5
Q4
201
5
Q1
201
6
Q2
201
6
Q3
201
6
Q4 2
016
Q1
201
7
Q2
201
7
Q3
201
7
Ind
ex 2
01
0=
10
0
Gas
Electricity
Heavy fuel oil
Fuel prices index in real terms(1) 2010=100 2017 Q3 Percentage change
on a year earlier
Coal 96.7 +9.3 Heavy fuel oil 84.3 +14.1 Gas 89.6 +6.9 Electricity 105.5 -0.3 Total fuel 99.4 +2.6
(1) Deflated using the GDP implied deflator. Includes estimates of the average Climate Change Levy (CCL) paid.
Average industrial gas prices, including CCL, were 6.9 per cent higher in real terms in Q3 2017 compared to Q3 2016, whilst prices excluding CCL were 7.0 per cent lower.
Average industrial electricity prices were 0.3 per cent lower including CCL and 0.7 per cent lower excluding CCL, in real terms, in Q3 2017 compared to Q3 2016.
Average coal prices were 9.3 per cent higher in real terms including CCL and 10.1 per cent higher excluding CCL in Q3 2017 compared to Q3 2016.
Heavy fuel oil prices were 14 per cent higher in real terms than a year ago.
For the period January to June 2017, UK prices for industrial electricity for medium consumers including taxes were the third highest in the EU15. UK industrial gas prices for medium consumers including taxes were the second lowest in the EU15.
Industrial prices tables are available on the BEIS section of the GOV.UK website at: www.gov.uk/government/collections/industrial-energy-prices

Page 14 of 16
ROAD TRANSPORT FUEL PRICES: QUARTER 3 2017
Typical retail prices of road transport fuels
90
100
110
120
130
140
Dec-15 Mar-16 Jun-16 Sep-16 Dec-16 Mar-17 Jun-17 Sep-17 Dec-17
Pe
nce
pe
r lit
re
Diesel/ULSD
PremiumUnleaded/ULSP
(1) Prices are for ultra low sulphur versions of these fuels. (2) Prices are provisional estimates.
Following a slow downward trend in the first half of the year, crude oil prices since July have been rising steadily reaching $63/barrel in mid-December 2017 compared to $54/barrel in December 2016.
In mid-December 2017, unleaded petrol was on average 119.9 pence per litre, 5.8 pence per litre (5.1 per cent) higher than a year earlier but 15 per cent lower than the high reached in April 2012.
In mid-December 2017, diesel was on average 123.7 pence per litre, 6.5 pence per litre (5.6 per cent) higher than a year earlier but 16 per cent below the peak seen in April 2012.
Annual prices in 2017 were 8.0 per cent higher for petrol and 9.1 per cent higher for diesel than in 2016.
In November 2017, UK retail prices for petrol were the twelveth highest in the EU28, with UK diesel prices third highest in the EU28 due to higher tax rates.
Road transport fuel prices tables are available on the BEIS section of the GOV.UK website at: www.gov.uk/government/collections/road-fuel-and-other-petroleum-product-prices
Retail prices of petroleum products Mid December 2017(1)
Pence per litre Percentage change on
a year earlier
Unleaded petrol (2) 119.9 +5.1 Diesel (2) 123.7 +5.6

Page 15 of 16
ELECTRICITY GENERATION AND SUPPLY
This article updates the detailed electricity figures for Scotland, Wales, Northern Ireland and England that were provided in December 2016’s Energy Trends. The data are for 2013 to 2016 and cover generation, supply, internal and external trade and consumption. The role of renewables in each area is also shown.
Generation by country and fuel type in 2016
0
50,000
100,000
150,000
200,000
250,000
300,000
England Scotland Wales Northern Ireland
TW
h
Oil & Other Renewables
Nuclear Coal
Gas
The share of UK electricity generation from coal fell sharply in 2016 across all four nations (down 13.3 percentage points), while gas generation increased (up 12.8 pp).
Auto generators supplied a rising share of UK public electricity, at 7.2 per cent in 2016 (up 2.7 pp since 2013), particularly from non-MPP renewable sources. Auto generators provide a particularly large proportion of public electricity consumption in Scotland and Northern Ireland with shares of 12.8 per cent and 11.3 per cent respectively in 2016.
The share of renewable generation in 2016 was stable at 25 per cent (down 0.1 pp from 2015). Scotland maintained the highest share at a record high 43 per cent (up 0.5 pp), whilst England increased its share the most, to 23 per cent (up 0.6 pp). In Wales and Northern Ireland the share of generation from renewables decreased slightly in 2016 from record highs in 2015, to 12 per cent (down 1.4 pp), and 25 per cent (down 0.2 pp) respectively. These small movements were due to poor weather conditions for renewables generation despite increases in capacity.
The 2015 closure of the Wylfa nuclear power station in Wales means that England and Scotland are now the only countries generating nuclear power. However this closure did not decrease the overall share of generation from nuclear energy because outages had curtailed generation at existing English and Scottish nuclear plants in 2015.

Page 16 of 16
Issued by: Department for Business, Energy and Industrial Strategy, 1 Victoria Street, London SW1H 0ET
Contacts: Lead statistician: Warren Evans, Tel: 0300 068 5059
Press enquiries: Tel: 0207 215 8876 Statistical enquiries General enquiries: Tel 0207 215 5000
Notes to editors
1. More detailed figures of United Kingdom energy production and consumption and of energy prices, for the third quarter of 2017 are given in the December 2017 editions of ENERGY TRENDS and ENERGY PRICES respectively, the Department's statistical bulletins on energy, released on 21 December 2017. 2. Energy Trends and the Energy Prices bulletins, published quarterly, are available on the BEIS section of the GOV.UK website at: www.gov.uk/government/collections/energy-trends and www.gov.uk/government/collections/quarterly-energy-prices 3. Articles featured in Energy Trends are also available on the BEIS section of the GOV.UK website at: www.gov.uk/government/collections/energy-trends-articles 4. More detailed annual data on energy production and consumption for the years 2012 to 2016 are available in the DIGEST OF UNITED KINGDOM ENERGY STATISTICS 2017, published on 27 July 2017. All information contained in the Digest is available on the BEIS section of the GOV.UK website at: www.gov.uk/government/collections/digest-of-uk-energy-statistics-dukes