energy statistics - mospi.nic.inmospi.nic.in/sites/default/files/publication_reports/energy... ·...
TRANSCRIPT
Energy Statistics 2018
ENERGY STATISTICS
2018 (Twenty Fifth Issue)
CENTRAL STATISTICS OFFICE MINISTRY OF STATISTICS AND PROGRAMME IMPLEMENTATION
GOVERNMENT OF INDIA NEW DELHI
C E N T R A L S T A T I S T I C S O F F I C E
Energy Statistics 2018
FOREWORD Energy is one of the most important building blocks in human development, and as such, acts
as a key factor in determining the economic development of all the countries. In an effort to meet the demands of a developing nation, the energy sector has witnessed a rapid growth. It is important to note that non-renewable resources are significantly depleted by human use, whereas renewable resources are produced by ongoing processes that can sustain indefinite human exploitation.
The use of renewable resources of energy is rapidly increasing worldwide. Solar power, one of the potential energy sources, is a fast developing industry in India. The country's solar installed capacity has reached 12.28 GW in year 2016-17 as compared to 6.76 GW during the year 2015-16. India has expanded its solar generation capacity by 5.52 GW during last one year which has led to downward trend in the cost and has increased usage. It clearly signifies that proper integration of policy interventions holds the key to achieve the sustainable development goals.
This publication, 25th in the series is an annual publication of CSO and is a continued effort to provide a comprehensive picture of Energy Sector in India. Energy Statistics is an integrated and updated database of reserves, installed capacity, production, consumption, import, export and whole sale prices of different sources viz. coal, crude petroleum, natural gas and electricity. Energy Balance and Sankey Diagram (Energy flow diagram) adds analytic value and thus increases its utility.
Energy indicators are being brought out by CSO as part of Energy Statistics for the use of policy makers as well as for comprehensive reporting. Indicators play a vital role by turning data into information for policy makers and help in decision-making. Keeping in view the importance of Energy Goal no 7 of Sustainable Development Goals, “Double the global rate of improvement in energy efficiency” has been accounted in the form of an indicator i.e. “Energy intensity measured in terms of primary energy and GDP”. Disaggregation of the indicator i.e. energy Intensity at sectoral level i.e. Industry, agriculture and transport is also available in the publication.
Identification of list of indicators depends on various factors as transparency, scientific validity, robustness, sensitivity and the extent to which they are linkable to each other. However no single factor can decide all indicators and all situations since each indicator needs different data sets. The indicators are selected on the guidelines/approach followed by IAEA in their publication “Energy Indicators for Sustainable Development: Guidelines and Methodologies”, which was brought out in corporation with United Nations Department of Economic and Social Affairs (UNDESA), International Energy Agency (IEA), Eurostat and European Environmental Agency (EEA).
The data in the publication has been sourced from the subject Ministries of the Government of India. The co-operation and support provided by these Ministries/Departments in compiling this publication is appreciated. I also appreciate the efforts of the officers of Economic Statistics Division, Central Statistics Office in bringing out this publication in a time bound manner. I hope the publication will prove to be useful to the policy makers, planners and researchers working in field of Energy. It shall be CSO’s endeavour to continuously improve the publication both in content and design with the help of user feedback and data source agencies.
March 2018 M.V.S Ranganadham New Delhi DIRECTOR GENERAL, CSO
C E N T R A L S T A T I S T I C S O F F I C E
Energy Statistics 2018
CONTENTS
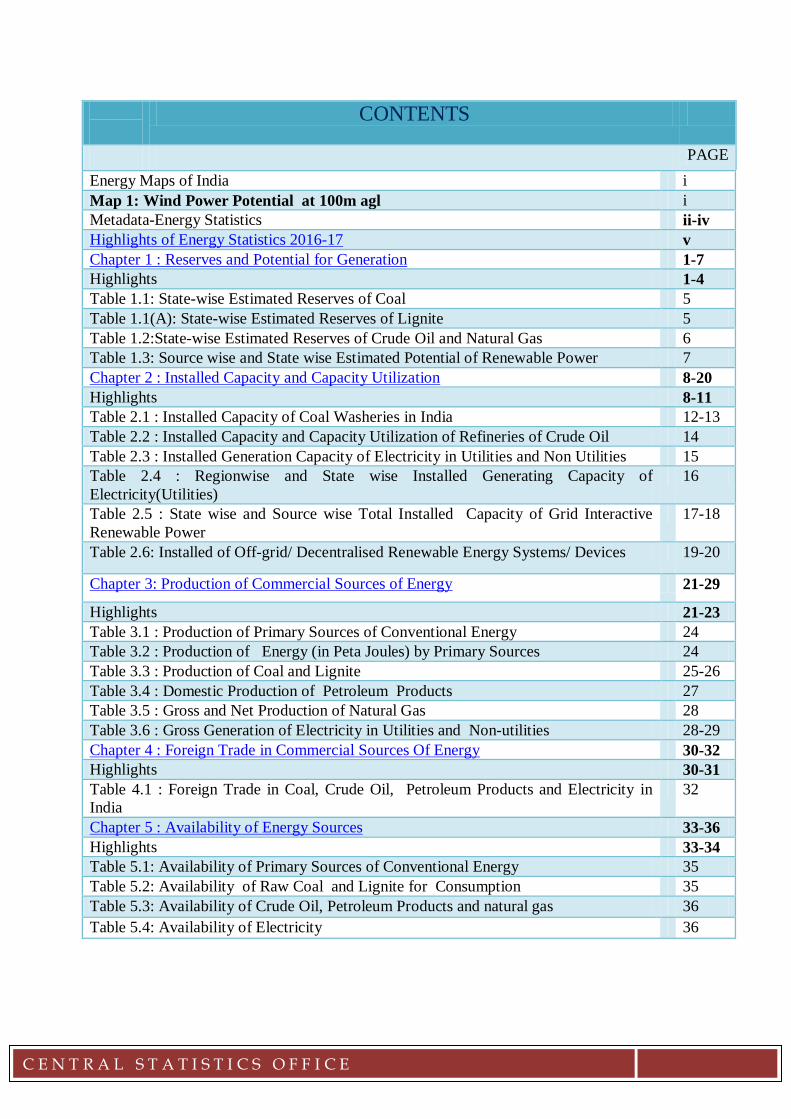
PAGE Energy Maps of India i Map 1: Wind Power Potential at 100m agl i Metadata-Energy Statistics ii-iv Highlights of Energy Statistics 2016-17 v Chapter 1 : Reserves and Potential for Generation 1-7 Highlights 1-4 Table 1.1: State-wise Estimated Reserves of Coal 5 Table 1.1(A): State-wise Estimated Reserves of Lignite 5 Table 1.2:State-wise Estimated Reserves of Crude Oil and Natural Gas 6 Table 1.3: Source wise and State wise Estimated Potential of Renewable Power 7 Chapter 2 : Installed Capacity and Capacity Utilization 8-20 Highlights 8-11 Table 2.1 : Installed Capacity of Coal Washeries in India 12-13 Table 2.2 : Installed Capacity and Capacity Utilization of Refineries of Crude Oil 14 Table 2.3 : Installed Generation Capacity of Electricity in Utilities and Non Utilities 15 Table 2.4 : Regionwise and State wise Installed Generating Capacity of Electricity(Utilities)
16
Table 2.5 : State wise and Source wise Total Installed Capacity of Grid Interactive Renewable Power
17-18
Table 2.6: Installed of Off-grid/ Decentralised Renewable Energy Systems/ Devices 19-20
Chapter 3: Production of Commercial Sources of Energy 21-29
Highlights 21-23 Table 3.1 : Production of Primary Sources of Conventional Energy 24 Table 3.2 : Production of Energy (in Peta Joules) by Primary Sources 24 Table 3.3 : Production of Coal and Lignite 25-26 Table 3.4 : Domestic Production of Petroleum Products 27 Table 3.5 : Gross and Net Production of Natural Gas 28 Table 3.6 : Gross Generation of Electricity in Utilities and Non-utilities 28-29 Chapter 4 : Foreign Trade in Commercial Sources Of Energy 30-32 Highlights 30-31 Table 4.1 : Foreign Trade in Coal, Crude Oil, Petroleum Products and Electricity in India
32
Chapter 5 : Availability of Energy Sources 33-36 Highlights 33-34 Table 5.1: Availability of Primary Sources of Conventional Energy 35 Table 5.2: Availability of Raw Coal and Lignite for Consumption 35 Table 5.3: Availability of Crude Oil, Petroleum Products and natural gas 36 Table 5.4: Availability of Electricity 36
C E N T R A L S T A T I S T I C S O F F I C E
Energy Statistics 2018
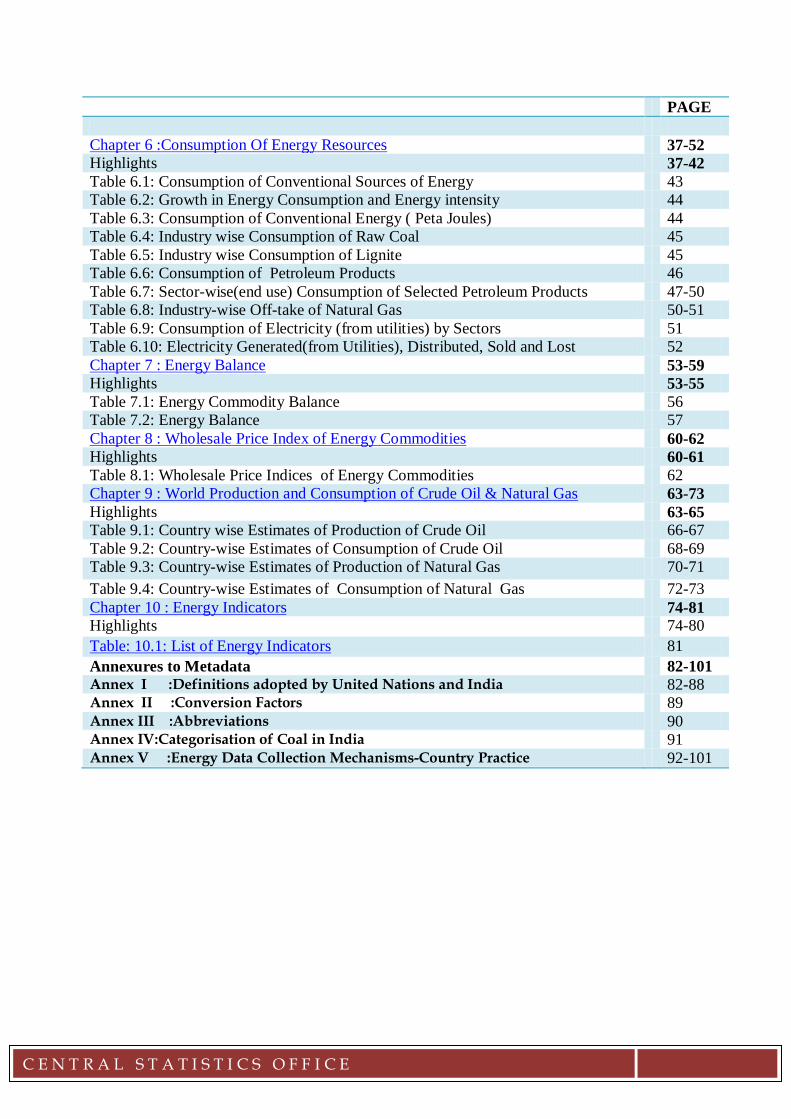
PAGE Chapter 6 :Consumption Of Energy Resources 37-52 Highlights 37-42 Table 6.1: Consumption of Conventional Sources of Energy 43 Table 6.2: Growth in Energy Consumption and Energy intensity 44 Table 6.3: Consumption of Conventional Energy ( Peta Joules) 44 Table 6.4: Industry wise Consumption of Raw Coal 45 Table 6.5: Industry wise Consumption of Lignite 45 Table 6.6: Consumption of Petroleum Products 46 Table 6.7: Sector-wise(end use) Consumption of Selected Petroleum Products 47-50 Table 6.8: Industry-wise Off-take of Natural Gas 50-51 Table 6.9: Consumption of Electricity (from utilities) by Sectors 51 Table 6.10: Electricity Generated(from Utilities), Distributed, Sold and Lost 52 Chapter 7 : Energy Balance 53-59 Highlights 53-55 Table 7.1: Energy Commodity Balance 56 Table 7.2: Energy Balance 57 Chapter 8 : Wholesale Price Index of Energy Commodities 60-62 Highlights 60-61 Table 8.1: Wholesale Price Indices of Energy Commodities 62 Chapter 9 : World Production and Consumption of Crude Oil & Natural Gas 63-73 Highlights 63-65 Table 9.1: Country wise Estimates of Production of Crude Oil 66-67 Table 9.2: Country-wise Estimates of Consumption of Crude Oil 68-69 Table 9.3: Country-wise Estimates of Production of Natural Gas 70-71 Table 9.4: Country-wise Estimates of Consumption of Natural Gas 72-73 Chapter 10 : Energy Indicators 74-81 Highlights 74-80 Table: 10.1: List of Energy Indicators 81 Annexures to Metadata 82-101 Annex I :Definitions adopted by United Nations and India 82-88 Annex II :Conversion Factors 89 Annex III :Abbreviations 90 Annex IV:Categorisation of Coal in India 91 Annex V :Energy Data Collection Mechanisms-Country Practice 92-101
C E N T R A L S T A T I S T I C S O F F I C E
Energy Statistics 2018
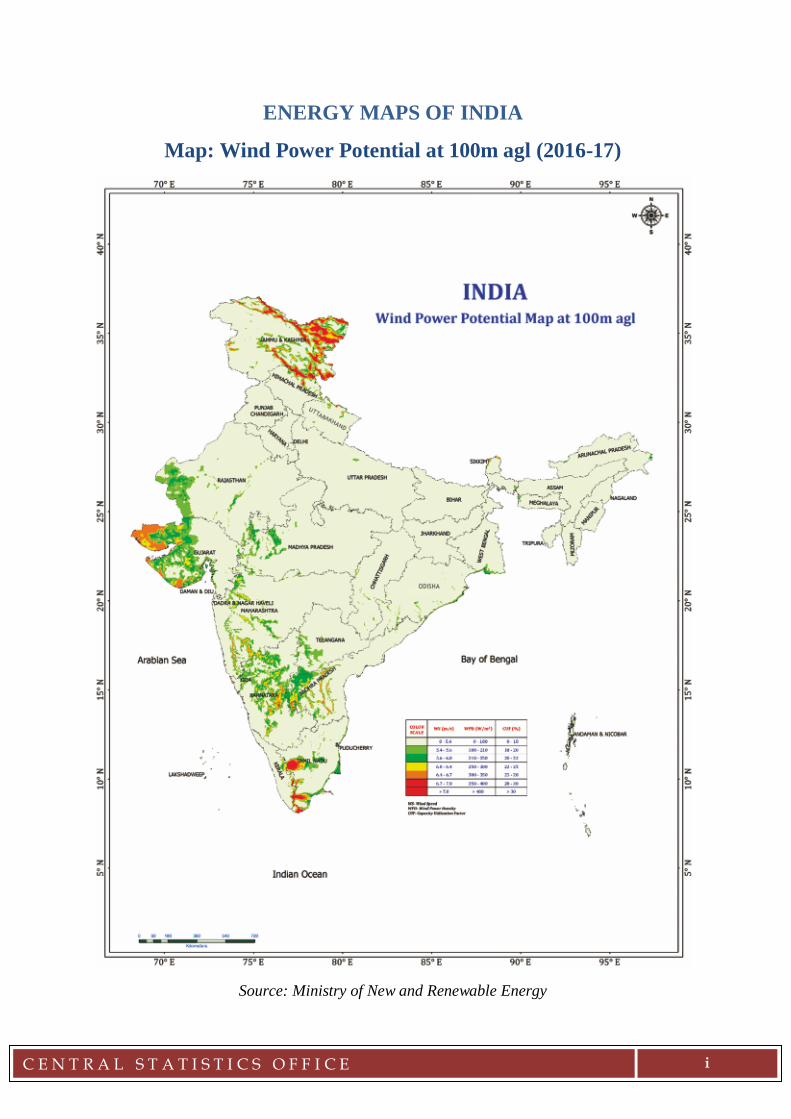
ENERGY MAPS OF INDIA
Map: Wind Power Potential at 100m agl (2016-17)
Source: Ministry of New and Renewable Energy
i C E N T R A L S T A T I S T I C S O F F I C E
i
Energy Statistics 2018
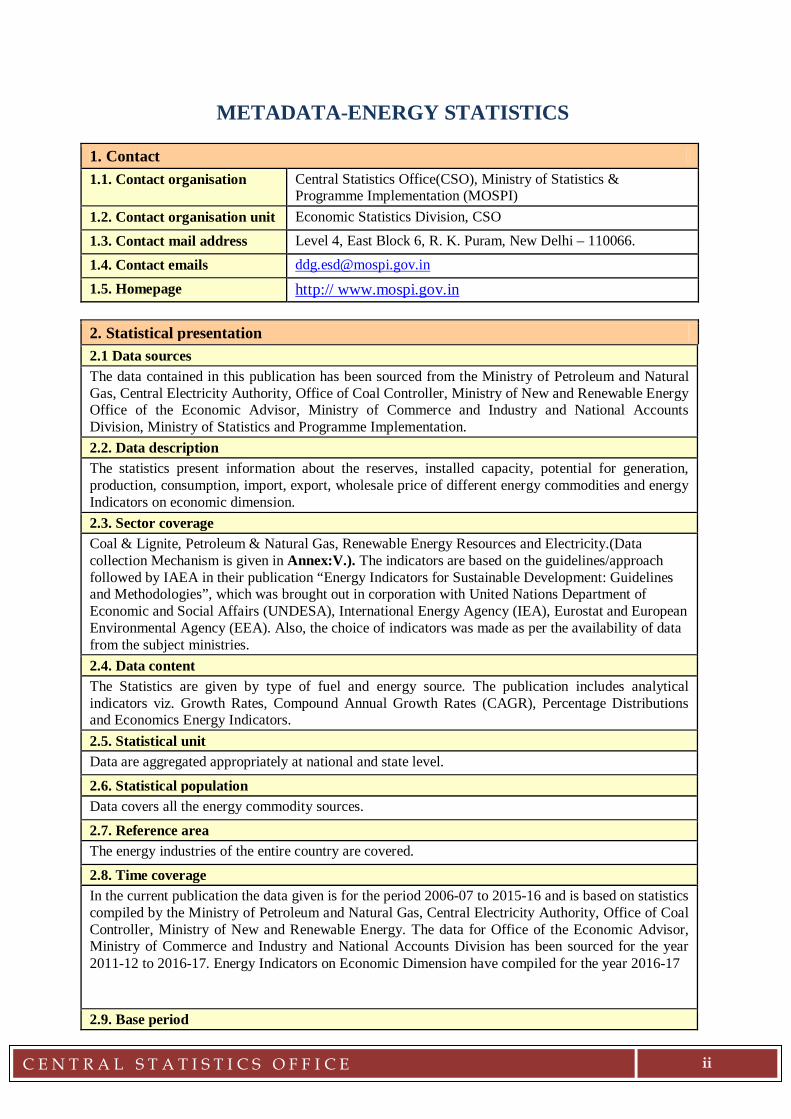
METADATA-ENERGY STATISTICS 1. Contact
1.1. Contact organisation Central Statistics Office(CSO), Ministry of Statistics & Programme Implementation (MOSPI)
1.2. Contact organisation unit Economic Statistics Division, CSO 1.3. Contact mail address Level 4, East Block 6, R. K. Puram, New Delhi – 110066. 1.4. Contact emails [email protected] 1.5. Homepage http:// www.mospi.gov.in 2. Statistical presentation
2.1 Data sources The data contained in this publication has been sourced from the Ministry of Petroleum and Natural Gas, Central Electricity Authority, Office of Coal Controller, Ministry of New and Renewable Energy Office of the Economic Advisor, Ministry of Commerce and Industry and National Accounts Division, Ministry of Statistics and Programme Implementation.
2.2. Data description The statistics present information about the reserves, installed capacity, potential for generation, production, consumption, import, export, wholesale price of different energy commodities and energy Indicators on economic dimension.
2.3. Sector coverage Coal & Lignite, Petroleum & Natural Gas, Renewable Energy Resources and Electricity.(Data collection Mechanism is given in Annex:V.). The indicators are based on the guidelines/approach followed by IAEA in their publication “Energy Indicators for Sustainable Development: Guidelines and Methodologies”, which was brought out in corporation with United Nations Department of Economic and Social Affairs (UNDESA), International Energy Agency (IEA), Eurostat and European Environmental Agency (EEA). Also, the choice of indicators was made as per the availability of data from the subject ministries.
2.4. Data content The Statistics are given by type of fuel and energy source. The publication includes analytical indicators viz. Growth Rates, Compound Annual Growth Rates (CAGR), Percentage Distributions and Economics Energy Indicators.
2.5. Statistical unit Data are aggregated appropriately at national and state level. 2.6. Statistical population Data covers all the energy commodity sources. 2.7. Reference area The energy industries of the entire country are covered. 2.8. Time coverage In the current publication the data given is for the period 2006-07 to 2015-16 and is based on statistics compiled by the Ministry of Petroleum and Natural Gas, Central Electricity Authority, Office of Coal Controller, Ministry of New and Renewable Energy. The data for Office of the Economic Advisor, Ministry of Commerce and Industry and National Accounts Division has been sourced for the year 2011-12 to 2016-17. Energy Indicators on Economic Dimension have compiled for the year 2016-17
2.9. Base period
ii C E N T R A L S T A T I S T I C S O F F I C E
ii
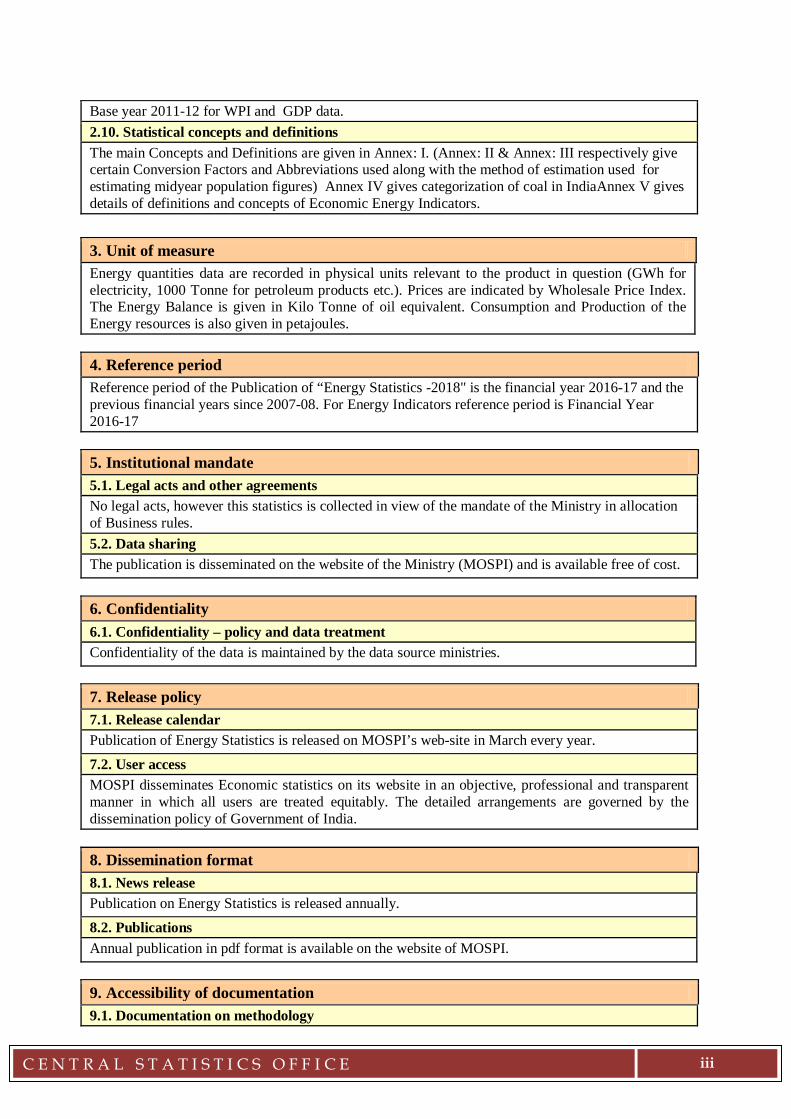
Energy Statistics 2018 Base year 2011-12 for WPI and GDP data. 2.10. Statistical concepts and definitions The main Concepts and Definitions are given in Annex: I. (Annex: II & Annex: III respectively give certain Conversion Factors and Abbreviations used along with the method of estimation used for estimating midyear population figures) Annex IV gives categorization of coal in IndiaAnnex V gives details of definitions and concepts of Economic Energy Indicators.
3. Unit of measure
Energy quantities data are recorded in physical units relevant to the product in question (GWh for electricity, 1000 Tonne for petroleum products etc.). Prices are indicated by Wholesale Price Index. The Energy Balance is given in Kilo Tonne of oil equivalent. Consumption and Production of the Energy resources is also given in petajoules.
4. Reference period
Reference period of the Publication of “Energy Statistics -2018" is the financial year 2016-17 and the previous financial years since 2007-08. For Energy Indicators reference period is Financial Year 2016-17
5. Institutional mandate
5.1. Legal acts and other agreements No legal acts, however this statistics is collected in view of the mandate of the Ministry in allocation of Business rules.
5.2. Data sharing The publication is disseminated on the website of the Ministry (MOSPI) and is available free of cost.
6. Confidentiality 6.1. Confidentiality – policy and data treatment Confidentiality of the data is maintained by the data source ministries. 7. Release policy
7.1. Release calendar Publication of Energy Statistics is released on MOSPI’s web-site in March every year.
7.2. User access MOSPI disseminates Economic statistics on its website in an objective, professional and transparent manner in which all users are treated equitably. The detailed arrangements are governed by the dissemination policy of Government of India.
8. Dissemination format
8.1. News release Publication on Energy Statistics is released annually.
8.2. Publications Annual publication in pdf format is available on the website of MOSPI. 9. Accessibility of documentation
9.1. Documentation on methodology
iii C E N T R A L S T A T I S T I C S O F F I C E
iii
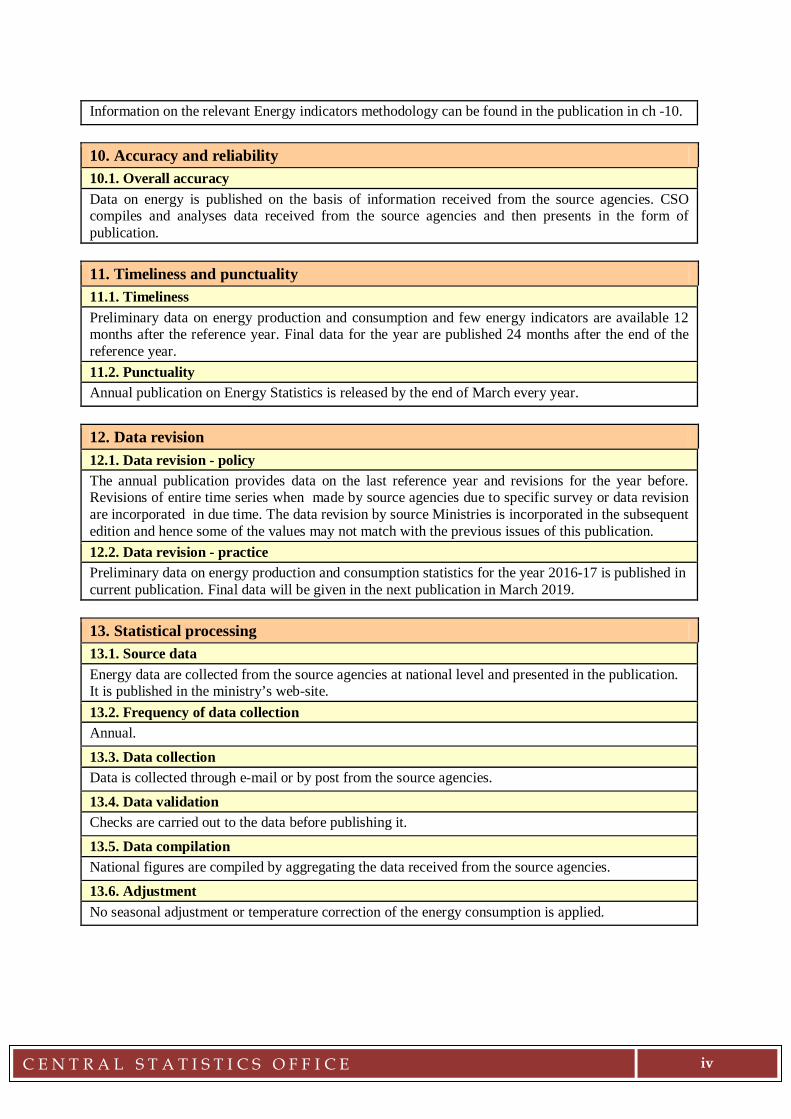
Energy Statistics 2018 Information on the relevant Energy indicators methodology can be found in the publication in ch -10. 10. Accuracy and reliability
10.1. Overall accuracy Data on energy is published on the basis of information received from the source agencies. CSO compiles and analyses data received from the source agencies and then presents in the form of publication.
11. Timeliness and punctuality
11.1. Timeliness Preliminary data on energy production and consumption and few energy indicators are available 12 months after the reference year. Final data for the year are published 24 months after the end of the reference year.
11.2. Punctuality Annual publication on Energy Statistics is released by the end of March every year.
12. Data revision
12.1. Data revision - policy The annual publication provides data on the last reference year and revisions for the year before. Revisions of entire time series when made by source agencies due to specific survey or data revision are incorporated in due time. The data revision by source Ministries is incorporated in the subsequent edition and hence some of the values may not match with the previous issues of this publication.
12.2. Data revision - practice Preliminary data on energy production and consumption statistics for the year 2016-17 is published in current publication. Final data will be given in the next publication in March 2019. 13. Statistical processing
13.1. Source data Energy data are collected from the source agencies at national level and presented in the publication. It is published in the ministry’s web-site.
13.2. Frequency of data collection Annual. 13.3. Data collection Data is collected through e-mail or by post from the source agencies. 13.4. Data validation Checks are carried out to the data before publishing it. 13.5. Data compilation National figures are compiled by aggregating the data received from the source agencies.
13.6. Adjustment No seasonal adjustment or temperature correction of the energy consumption is applied.
iv C E N T R A L S T A T I S T I C S O F F I C E
iv
Energy Statistics 2018
HIGHLIGHTS OF ENERGY SECTOR 2016-17
Production & Consumption Compound Annual Growth Rate (CAGR) of Production of Coal & Lignite in
2016-17 over 2007-08 are 3.79% & 2.9% respectively whereas their consumption grew at 5.29% and 2.22% respectively during the same period.
In case of Crude Oil and Natural Gas,during the period 2007-08 to 2016-17 the Production increased by 0.54% and (-) 0.16% whereas Consumption increased by 4.63% & (-) 2.47%.
During the aforesaid period, Generation of Electricity increased by 4.05 % and Consumption of electricity increased by 7.82%.
Imports & Exports
Exports of the Coal during 2007-08 to 2016-17 increased at a CAGR of 27.22%
against the decrease in imports by (-) 3.84%.
During the period 2007-08 to 2016-17, the imports of Natural gas and Crude Oil increased by 15.42% and 5.46% respectively.
Export of Petroleum products, increased at a CAGR of 8.22% and its import increased by 12.57%.
For electricity, the import increased at a CAGR of 7.11% whereas the export registered a CAGR of 30.29%.
Usage of Energy The maximum energy intensive sector was Industrial sector accounting about 58
% of the total energy consumption.
Per Capita Use of Energy has significantly increased with a CAGR of 3.54% during 2011-12 to 2016-17.
v C E N T R A L S T A T I S T I C S O F F I C E
v
CHAPTER 1: RESERVES AND POTENTIAL FOR GENERATION
CHAPTER 1: RESERVES AND POTENTIAL FOR
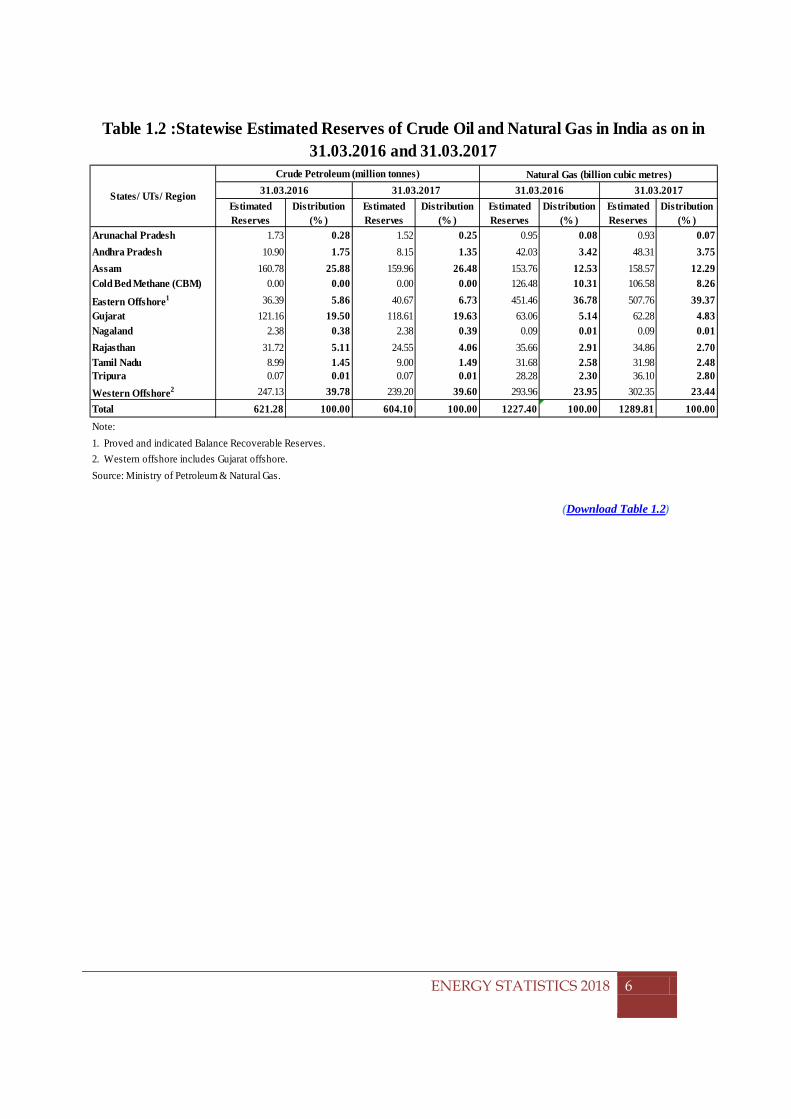
GENERATION 1.1 Coal and Lignite
Coal deposits are mainly confined to eastern and south central parts of the country.
The states of Jharkhand, Odisha, Chhattisgarh, West Bengal, Madhya Pradesh, Telangana and Maharashtra account for 98.20% of the total coal reserves in the country. The State of Jharkhand had the maximum share (26.16%) in the overall reserves of coal in the country as on 31st March 2017 followed by the State of Odisha (24.52%)(Table 1.1).
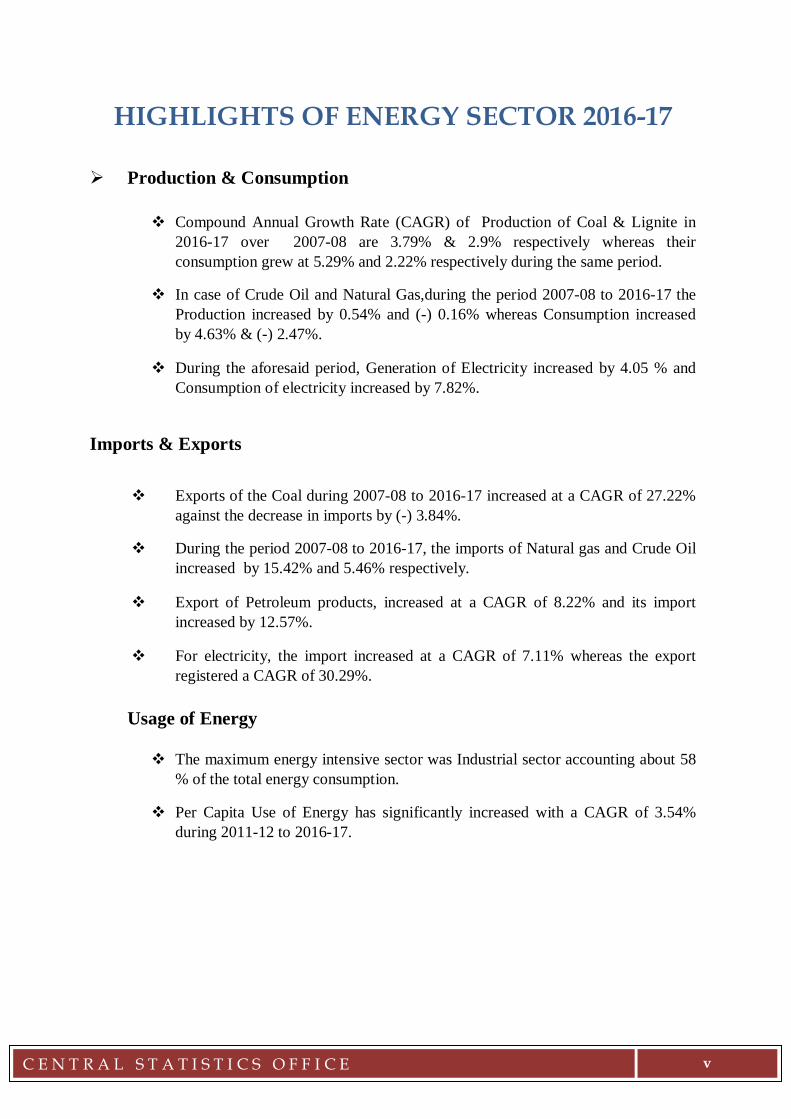
As on 31.03.17, the estimated reserves of coal were 315.14 billion tonnes, an
addition of 6.34 billion tonnes over the last year (Table 1.1). There has been an increase of 2.05% in the estimated coal reserves during the year 2016-17 with Maharashtra accounting for the maximum increase of 7.15%.
The estimated total reserves of lignite as on 31.03.17 was 44.70 billion Tonnes against 44.59 billion tonnes on 31.03.16. (Table 1.1(A)).
Proved, 45.40
Indicated, 44.20
Inferred, 10.40
Fig 1.1: Estimated Distribution of Reserves of Coal in India as on 31.03.2017
Total Reserve = 315.14 Million
ENERGY STATISTICS 2018
1
CHAPTER 1: RESERVES AND POTENTIAL FOR GENERATION
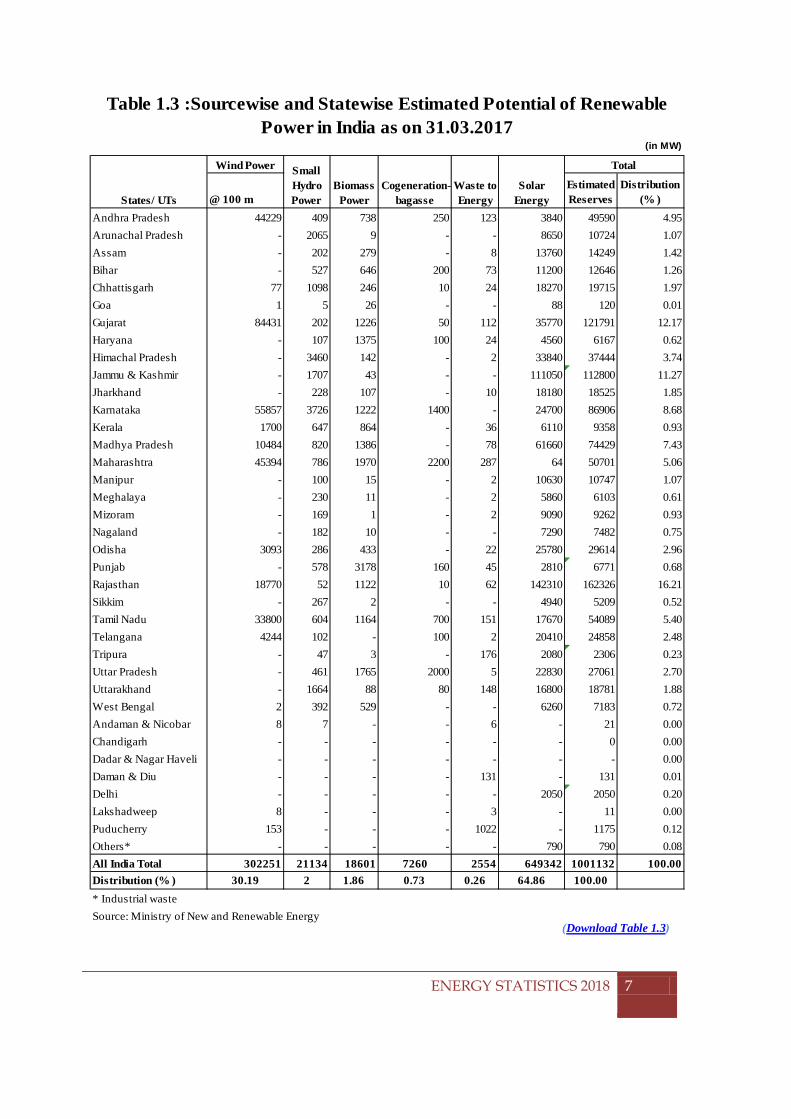
1.2 Petroleum and Natural gas
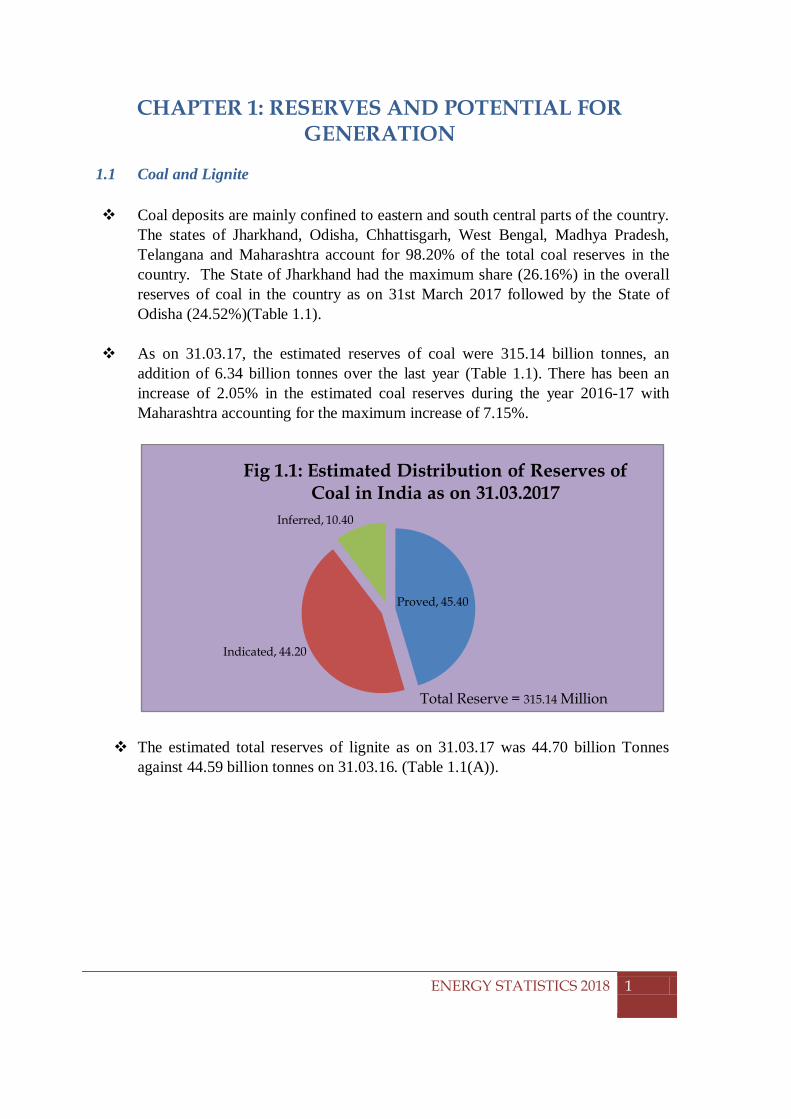
The estimated reserves of crude oil in India as on 31.03.2017 stood at 604.10 million tonnes (MT) (Table 1.2) against 621.28 million tonnes on 31.03.2016.
Geographical distribution of Crude oil indicates that the maximum reserves are in the Western Offshore (39.60%) followed by Assam (26.48%), whereas the maximum reserves of Natural Gas are in the Eastern Offshore (39.37%) followed by Western offshore (23.44%). (Table 1.2).
Proved15%
Indicated58%
Inferred27%
Fig 1.2: Estimated Distribution of Reserves of Lignite as on 31.03.2017
Total Reserve= 44.70 Billion Tonne
Andhra Pradesh1%
Assam26%
Eastern Offshore17%
Gujarat20%
Rajasthan4%
Tamil Nadu1%
Western Offshore2
40%
others0.7%
Fig 1.3: Estimated Distribution of Reserves of Crude Oil in India as on 31.03.2017
Total Estimated Reserves = 604.10 Million tonne*Others include Arunachal Pradesh, Nagaland and Tripura
ENERGY STATISTICS 2018
2
CHAPTER 1: RESERVES AND POTENTIAL FOR GENERATION
There was decrease of 2.76% in the estimated reserve of crude oil for the country
as a whole during 2016-17 as compared to the position a year ago.During the same period, estimated reserves of crude oil in Andhra Pradesh, Rajasthan, Arunachal Pradesh, Western Offshore, Gujarat and Assam decreased by 25.19, 22.60, 12.48, 3.21, 2.11 and 0.51% respectively, while the same in Eastern Offshore and Tamil Nadu increased by 11.75% and 0.04% respectively.
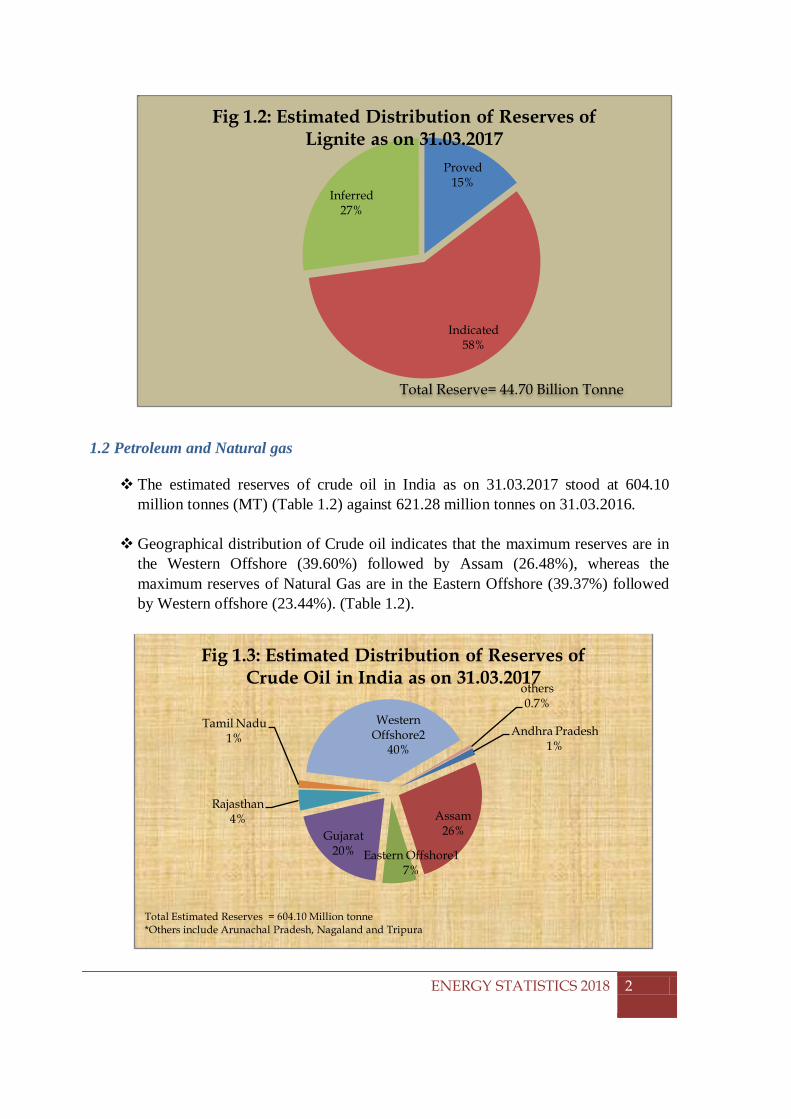
The estimated reserves of Natural Gas in India as on 31.03.2017 stood at 1289.81
Billion Cubic Meters (BCM) as against 1227.40 BCM as on 31.03.2016 (Table 1.2).
The estimated reserves of Natural Gas increased by 5.08% over the last year. The maximum contribution to this increase has been from Tripura (27.65), followed by Andhra Pradesh (14.95).
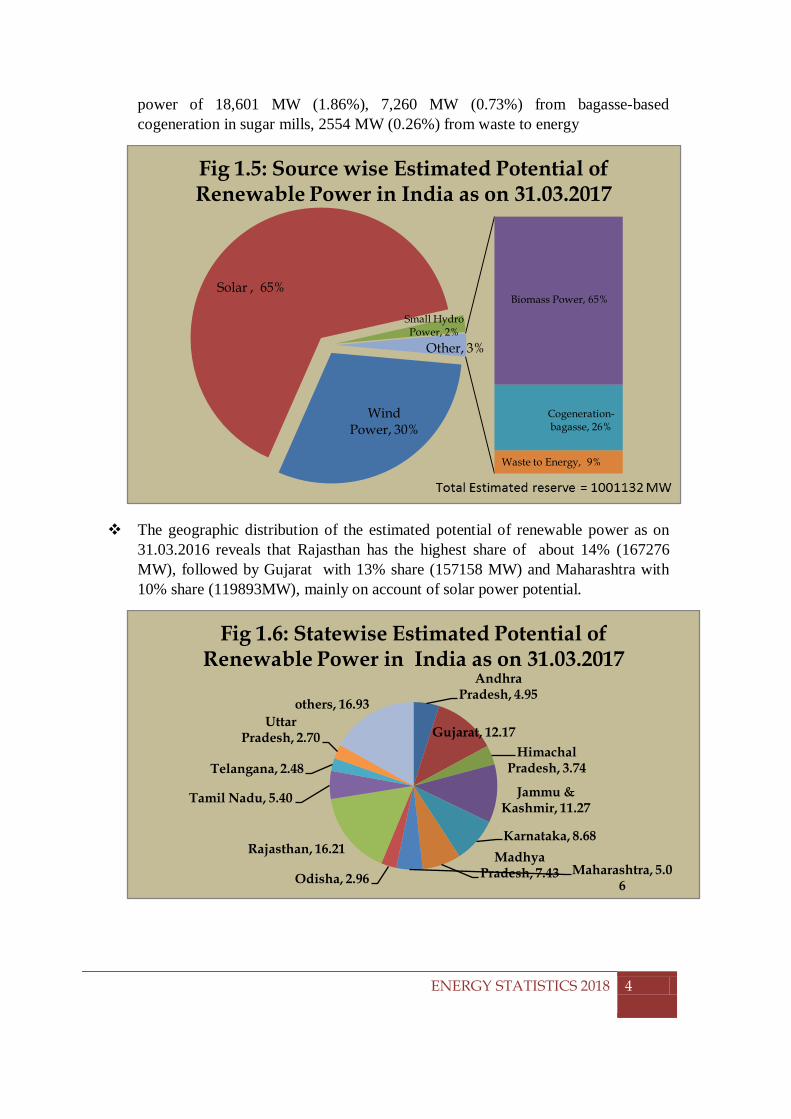
1.3 Renewable energy sources There is high potential for generation of renewable energy from various sources-
wind, solar, biomass, small hydro and cogeneration bagasse.
The total potential for renewable power generation in the country as on 31.03.17 is estimated at 10,01,132MW (Table 1.3). This includes solar power potential of 649342 MW (64.86%).wind power potential of 3,02,251 MW (30.19%) at 100 m hub height,SHP (small-hydro power) potential of 21,134 MW (2%), Biomass
Andhra Pradesh4%
Assam12%
CBM8%
Eastern Offshore39%
Gujarat5%
Rajasthan3%
Tamil Nadu*3%
Tripura3%
Western Offshore223%
Fig 1.4: Estimated Reserves of Natural Gas in India as on 31.03.2017
Total Reseves = 1289.81 Billion Cubic Meters* Reserve value of TamilNadu includes reserves of Arunachal Pradesh and Nagaland
ENERGY STATISTICS 2018
3
CHAPTER 1: RESERVES AND POTENTIAL FOR GENERATION
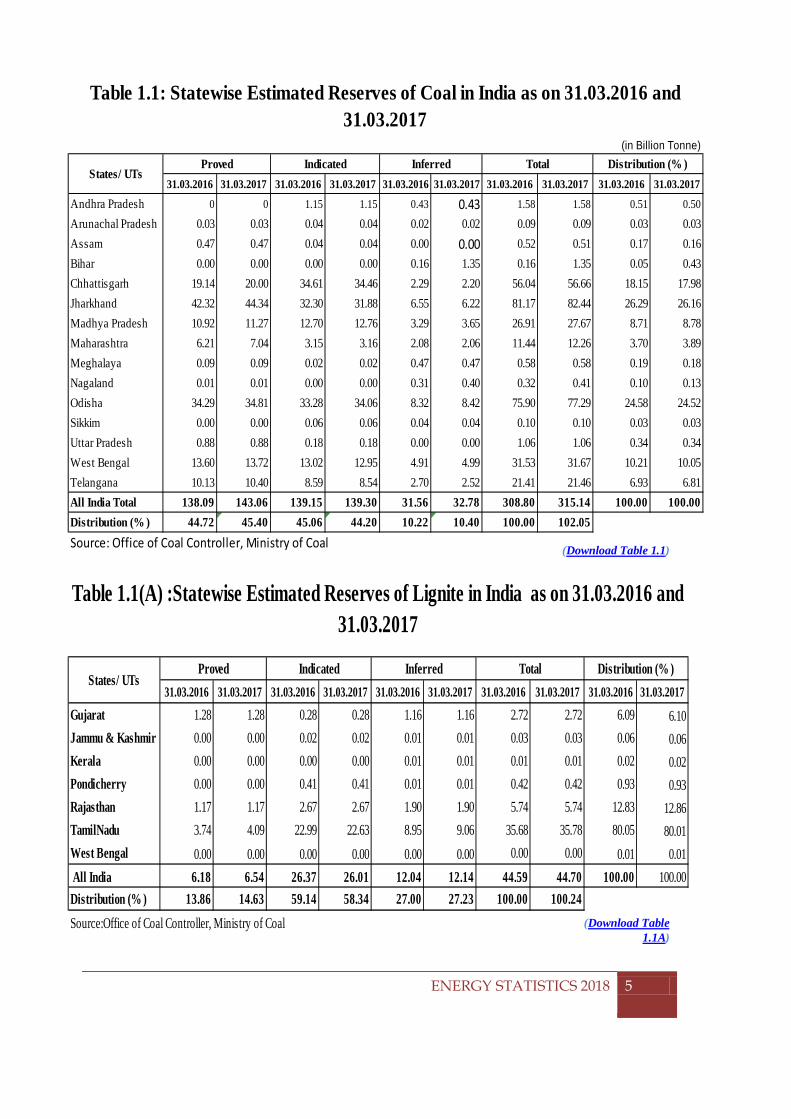
power of 18,601 MW (1.86%), 7,260 MW (0.73%) from bagasse-based cogeneration in sugar mills, 2554 MW (0.26%) from waste to energy
The geographic distribution of the estimated potential of renewable power as on 31.03.2016 reveals that Rajasthan has the highest share of about 14% (167276 MW), followed by Gujarat with 13% share (157158 MW) and Maharashtra with 10% share (119893MW), mainly on account of solar power potential.
Wind Power, 30%
Solar , 65%
Small Hydro Power, 2%
Biomass Power, 65%
Cogeneration-bagasse, 26%
Waste to Energy, 9%
Other, 3%
Fig 1.5: Source wise Estimated Potential of Renewable Power in India as on 31.03.2017
Andhra Pradesh, 4.95
Gujarat, 12.17Himachal
Pradesh, 3.74
Jammu & Kashmir, 11.27
Karnataka, 8.68Madhya
Pradesh, 7.43 Maharashtra, 5.06Odisha, 2.96
Rajasthan, 16.21
Tamil Nadu, 5.40
Telangana, 2.48
Uttar Pradesh, 2.70
others, 16.93
Fig 1.6: Statewise Estimated Potential of Renewable Power in India as on 31.03.2017
ENERGY STATISTICS 2018
4
CHAPTER 1: RESERVES AND POTENTIAL FOR GENERATION
(Download Table 1.1)
(Download Table 1.1A)
ENERGY STATISTICS 2018
5
31.03.2016 31.03.2017 31.03.2016 31.03.2017 31.03.2016 31.03.2017 31.03.2016 31.03.2017 31.03.2016 31.03.2017
Andhra Pradesh 0 0 1.15 1.15 0.43 0.43 1.58 1.58 0.51 0.50
Arunachal Pradesh 0.03 0.03 0.04 0.04 0.02 0.02 0.09 0.09 0.03 0.03Assam 0.47 0.47 0.04 0.04 0.00 0.00 0.52 0.51 0.17 0.16Bihar 0.00 0.00 0.00 0.00 0.16 1.35 0.16 1.35 0.05 0.43Chhattisgarh 19.14 20.00 34.61 34.46 2.29 2.20 56.04 56.66 18.15 17.98Jharkhand 42.32 44.34 32.30 31.88 6.55 6.22 81.17 82.44 26.29 26.16Madhya Pradesh 10.92 11.27 12.70 12.76 3.29 3.65 26.91 27.67 8.71 8.78Maharashtra 6.21 7.04 3.15 3.16 2.08 2.06 11.44 12.26 3.70 3.89Meghalaya 0.09 0.09 0.02 0.02 0.47 0.47 0.58 0.58 0.19 0.18Nagaland 0.01 0.01 0.00 0.00 0.31 0.40 0.32 0.41 0.10 0.13Odisha 34.29 34.81 33.28 34.06 8.32 8.42 75.90 77.29 24.58 24.52Sikkim 0.00 0.00 0.06 0.06 0.04 0.04 0.10 0.10 0.03 0.03Uttar Pradesh 0.88 0.88 0.18 0.18 0.00 0.00 1.06 1.06 0.34 0.34West Bengal 13.60 13.72 13.02 12.95 4.91 4.99 31.53 31.67 10.21 10.05Telangana 10.13 10.40 8.59 8.54 2.70 2.52 21.41 21.46 6.93 6.81All India Total 138.09 143.06 139.15 139.30 31.56 32.78 308.80 315.14 100.00 100.00Distribution (% ) 44.72 45.40 45.06 44.20 10.22 10.40 100.00 102.05Source: Office of Coal Controller, Ministry of Coal
Table 1.1: Statewise Estimated Reserves of Coal in India as on 31.03.2016 and 31.03.2017
(in Billion Tonne)
States/ UTsProved Indicated Inferred Total Distribution (% )
31.03.2016 31.03.2017 31.03.2016 31.03.2017 31.03.2016 31.03.2017 31.03.2016 31.03.2017 31.03.2016 31.03.2017
Gujarat 1.28 1.28 0.28 0.28 1.16 1.16 2.72 2.72 6.09 6.10Jammu & Kashmir 0.00 0.00 0.02 0.02 0.01 0.01 0.03 0.03 0.06 0.06Kerala 0.00 0.00 0.00 0.00 0.01 0.01 0.01 0.01 0.02 0.02Pondicherry 0.00 0.00 0.41 0.41 0.01 0.01 0.42 0.42 0.93 0.93Rajasthan 1.17 1.17 2.67 2.67 1.90 1.90 5.74 5.74 12.83 12.86TamilNadu 3.74 4.09 22.99 22.63 8.95 9.06 35.68 35.78 80.05 80.01West Bengal 0.00 0.00 0.00 0.00 0.00 0.00 0.00 0.00 0.01 0.01 All India 6.18 6.54 26.37 26.01 12.04 12.14 44.59 44.70 100.00 100.00Distribution (% ) 13.86 14.63 59.14 58.34 27.00 27.23 100.00 100.24Source:Office of Coal Controller, Ministry of Coal
Table 1.1(A) :Statewise Estimated Reserves of Lignite in India as on 31.03.2016 and 31.03.2017
States/ UTsProved Indicated Distribution (% )Inferred Total
CHAPTER 1: RESERVES AND POTENTIAL FOR GENERATION
(Download Table 1.2)
Arunachal Pradesh 1.73 0.28 1.52 0.25 0.95 0.08 0.93 0.07Andhra Pradesh 10.90 1.75 8.15 1.35 42.03 3.42 48.31 3.75Assam 160.78 25.88 159.96 26.48 153.76 12.53 158.57 12.29Cold Bed Methane (CBM) 0.00 0.00 0.00 0.00 126.48 10.31 106.58 8.26
Eastern Offshore1 36.39 5.86 40.67 6.73 451.46 36.78 507.76 39.37Gujarat 121.16 19.50 118.61 19.63 63.06 5.14 62.28 4.83Nagaland 2.38 0.38 2.38 0.39 0.09 0.01 0.09 0.01Rajasthan 31.72 5.11 24.55 4.06 35.66 2.91 34.86 2.70Tamil Nadu 8.99 1.45 9.00 1.49 31.68 2.58 31.98 2.48Tripura 0.07 0.01 0.07 0.01 28.28 2.30 36.10 2.80Western Offshore2 247.13 39.78 239.20 39.60 293.96 23.95 302.35 23.44Total 621.28 100.00 604.10 100.00 1227.40 100.00 1289.81 100.00Note:
Table 1.2 :Statewise Estimated Reserves of Crude Oil and Natural Gas in India as on in 31.03.2016 and 31.03.2017
States/ UTs/ Region
Crude Petroleum (million tonnes) Natural Gas (billion cubic metres)31.03.2016 31.03.2017 31.03.2016 31.03.2017
Distribution (% )
Estimated Reserves
Distribution (% )
Estimated Reserves
Distribution (% )
Source: Ministry of Petroleum & Natural Gas.
Estimated Reserves
Distribution (% )
Estimated Reserves
1. Proved and indicated Balance Recoverable Reserves.2. Western offshore includes Gujarat offshore.
ENERGY STATISTICS 2018
6
CHAPTER 1: RESERVES AND POTENTIAL FOR GENERATION
(Download Table 1.3)
ENERGY STATISTICS 2018
7
(in MW)
Wind Power
@ 100 mEstimated Reserves
Distribution (% )
Andhra Pradesh 44229 409 738 250 123 3840 49590 4.95Arunachal Pradesh - 2065 9 - - 8650 10724 1.07Assam - 202 279 - 8 13760 14249 1.42Bihar - 527 646 200 73 11200 12646 1.26Chhattisgarh 77 1098 246 10 24 18270 19715 1.97Goa 1 5 26 - - 88 120 0.01Gujarat 84431 202 1226 50 112 35770 121791 12.17Haryana - 107 1375 100 24 4560 6167 0.62Himachal Pradesh - 3460 142 - 2 33840 37444 3.74Jammu & Kashmir - 1707 43 - - 111050 112800 11.27Jharkhand - 228 107 - 10 18180 18525 1.85Karnataka 55857 3726 1222 1400 - 24700 86906 8.68Kerala 1700 647 864 - 36 6110 9358 0.93Madhya Pradesh 10484 820 1386 - 78 61660 74429 7.43Maharashtra 45394 786 1970 2200 287 64 50701 5.06Manipur - 100 15 - 2 10630 10747 1.07Meghalaya - 230 11 - 2 5860 6103 0.61Mizoram - 169 1 - 2 9090 9262 0.93Nagaland - 182 10 - - 7290 7482 0.75Odisha 3093 286 433 - 22 25780 29614 2.96Punjab - 578 3178 160 45 2810 6771 0.68Rajasthan 18770 52 1122 10 62 142310 162326 16.21Sikkim - 267 2 - - 4940 5209 0.52Tamil Nadu 33800 604 1164 700 151 17670 54089 5.40Telangana 4244 102 - 100 2 20410 24858 2.48Tripura - 47 3 - 176 2080 2306 0.23Uttar Pradesh - 461 1765 2000 5 22830 27061 2.70Uttarakhand - 1664 88 80 148 16800 18781 1.88West Bengal 2 392 529 - - 6260 7183 0.72Andaman & Nicobar 8 7 - - 6 - 21 0.00Chandigarh - - - - - - 0 0.00Dadar & Nagar Haveli - - - - - - - 0.00Daman & Diu - - - - 131 - 131 0.01Delhi - - - - - 2050 2050 0.20Lakshadweep 8 - - - 3 - 11 0.00Puducherry 153 - - - 1022 - 1175 0.12Others* - - - - - 790 790 0.08All India Total 302251 21134 18601 7260 2554 649342 1001132 100.00Distribution (% ) 30.19 2 1.86 0.73 0.26 64.86 100.00* Industrial wasteSource: Ministry of New and Renewable Energy
Table 1.3 :Sourcewise and Statewise Estimated Potential of Renewable Power in India as on 31.03.2017
States/ UTs
Small Hydro Power
Biomass Power
Cogeneration-bagasse
Waste to Energy
Total
Solar Energy
CHAPTER 2: INSTALLED CAPACITY AND CAPACITY UTILIZATION
CHAPTER 2: INSTALLED CAPACITY AND CAPACITY
UTILIZATION
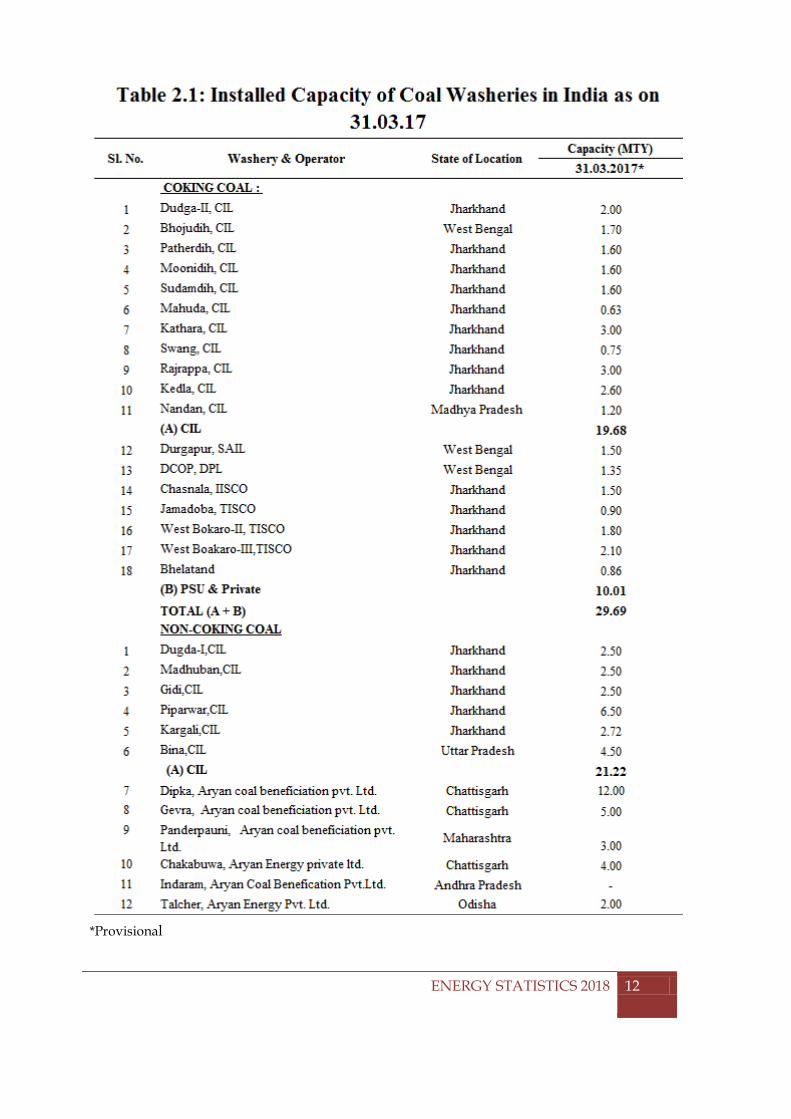
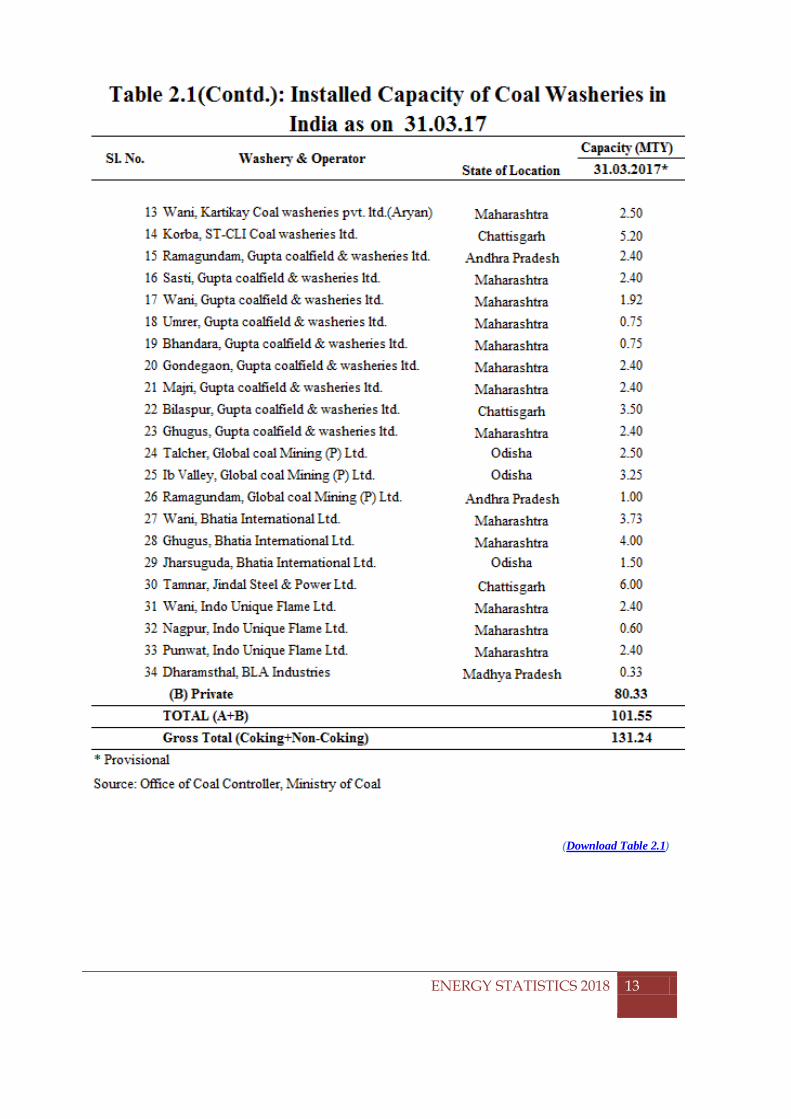
2.1 Coal Washeries Coal washing is an integral part of coal production. Raw coal coming from mines
is washed to remove the ash contents to make them fit for feeding into boilers, particularly those of steel plants. Barring a few instances, a coal washery does not form part of a coal mine in India.
Total installed capacity of washeries in the country is around 131.24 million tonne per year (MTY) as on 31.3.2017(Table 2.1). As on 31.03.17, a total of 52 washeries, both PSUs and Private, were operating in the country considering both Coking (29.69 MTY) and Non-Coking Coal (101.55 MTY).
2.2 Refineries of crude oil
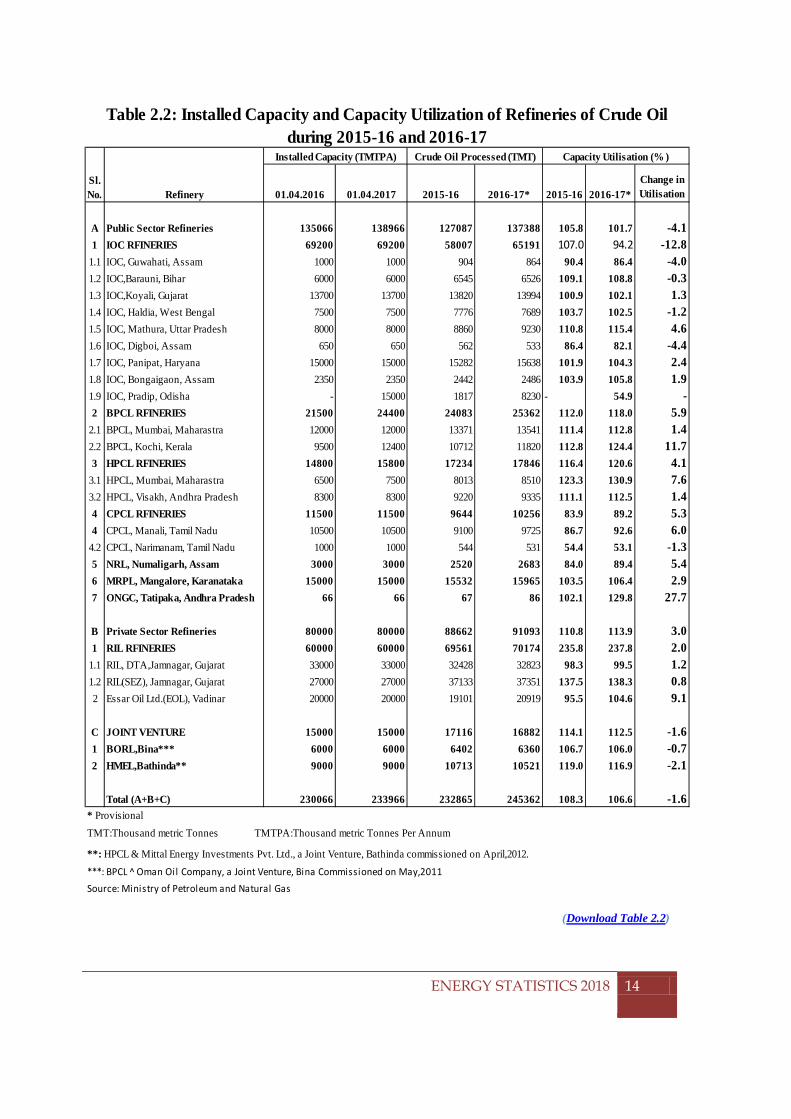
As on 31.03.17, there were a total of 23 refineries in the country (Table 2.2) – 18 in the Public Sector, 3 in the Private sector and 2 in Joint Venture.
The refining capacity of the country was 234 MMT on 31.03.2017 which is 4
MMT higher than the country’s refining capacity (230 MMT) on 31.03.2016.
The Refinery production (crude throughput) achievement was 245.362 MMT during 2016-17which marks net increase of 5.4% over 2015-16 (232.865 MMT).
Capacity utilization of the refineries was 108.3% during 2015-16 which decreased
to 106.6% during 2016-17. In the Public Sector, the maximum increase in capacity utilization (27.7%) was at ONGC, Tatipaka, Andhra Pradesh. In the Private Sector the highest increase (9.1%) in capacity utilization was at Essar Oil Ltd. (EOL), Vadinar.
Indian Oil Corporation, the state owned corporation had the highest refining
capacity of 69.2 MMTY. All units of IOC together processed 65.191 MMT during 2016-17 as compared to 58.007 MMT during 2015-16. The capacity utilization of these refineries was 101.7% during 2016-17 as against 105.8% during 2015-16.
All the private refineries taken together processed 91.093 MMT during 2016-17
which is higher than 88.662 MMT processed in 2015-16. The capacity utilization of these refineries during 2016-17 was 113.90% which is 2.8% higher than its capacity utilization (110.8%) in 2015-16.
ENERGY STATISTICS 2018
8
CHAPTER 2: INSTALLED CAPACITY AND CAPACITY UTILIZATION
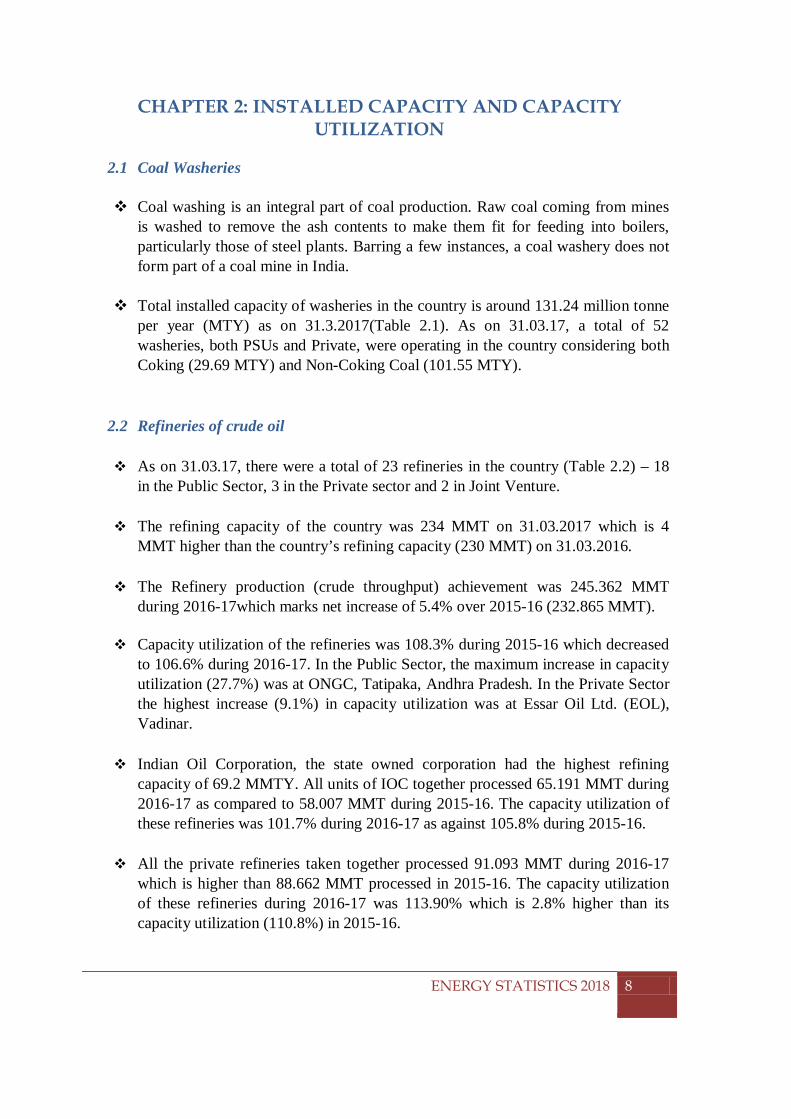
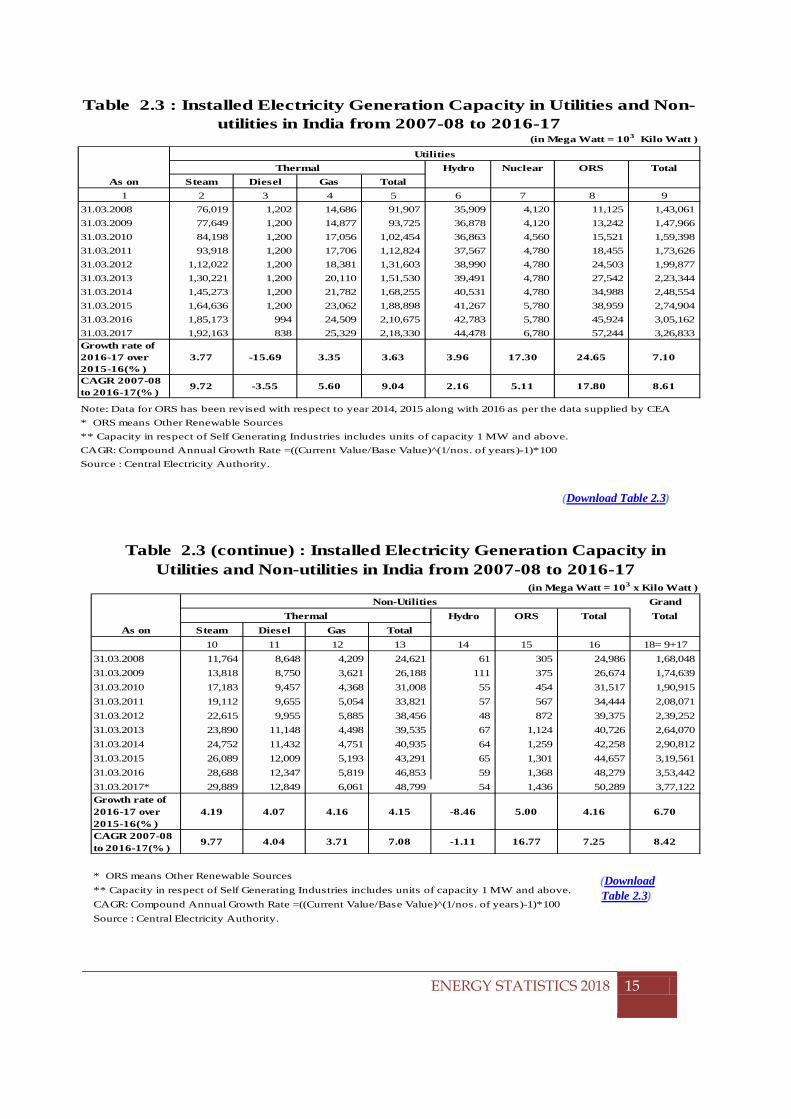
2.3 Installed electricity generating capacity The total installed capacity for electricity generation in the country has increased
from 1,68,048 MW as on 31.03.2008 to 3,77,122 MW as on 31.03.2017, registering a compound annual growth rate (CAGR) of 8.42% (Table 2.3).
Electricity generation capacity increased by 6.70% i.e. (23680 MW) from 2015-16 to 2016-17.
The highest rate of annual growth from 2015-16 to 2016-17 in installed capacity
was for Other Renewable sources (ORS) (24.08%) followed by Thermal Power (3.73%).
The total Installed capacity of power utilities in the country increased from 1,43,061 MW in 31.3.2008 to 3,26,833 MW as on 31.3.2017, with a CAGR of 8.61% over the period.
At the end of March 2017, thermal power plants accounted for an overwhelming
70.83% of the total installed capacity in the country, with an installed capacity of 267129 MW. Other renewable Sources (excluding hydro) come next with an installed capacity of 58680 MW, accounting for 15.56% of the total installed Capacity. The share of Hydro and Nuclear energy was only 11.81% and 1.80% of total installed capacity.
Non-utilities accounted for 13.34% (50,289 MW) of the total installed electricity generation capacity.
050000
100000150000200000250000300000350000400000
Inst
alle
d El
ectr
icity
Gen
erat
ion
Capa
city
in
MW
Years
Fig 2.1: Installed Electricity Generating Capacity (MW) in India during the period
2007-08 to 2016-17
Utility Non Utility
ENERGY STATISTICS 2018
9
CHAPTER 2: INSTALLED CAPACITY AND CAPACITY UTILIZATION
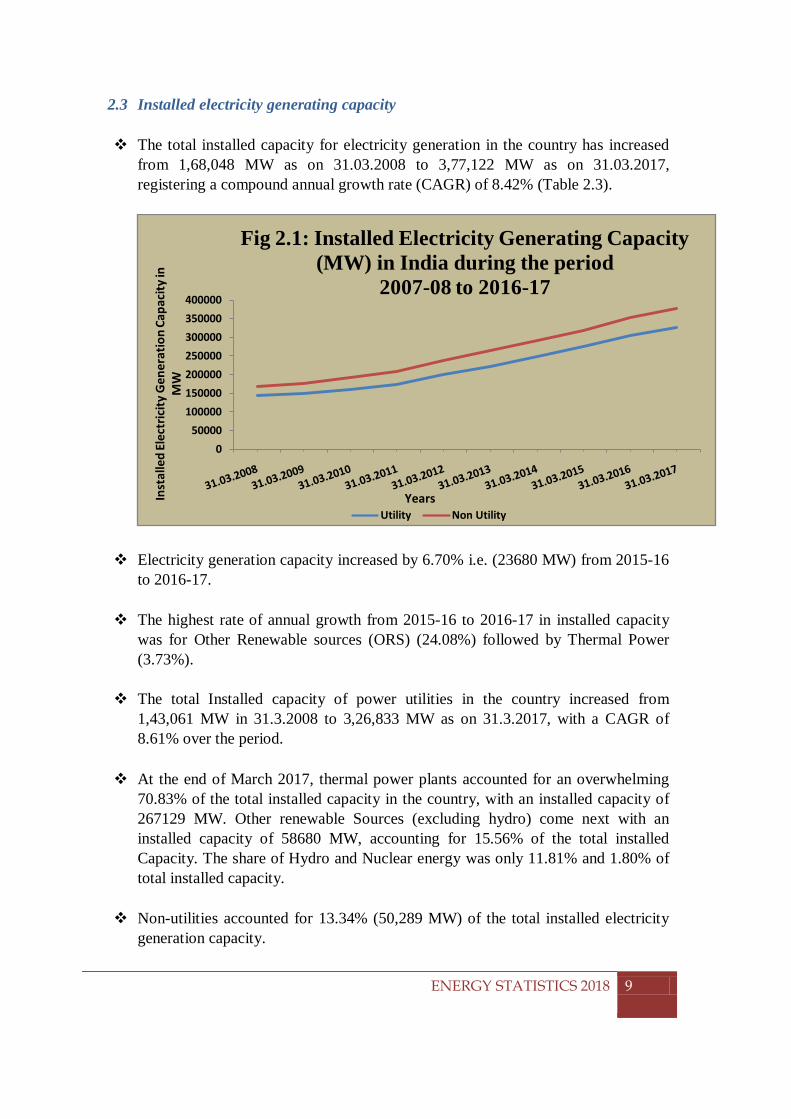
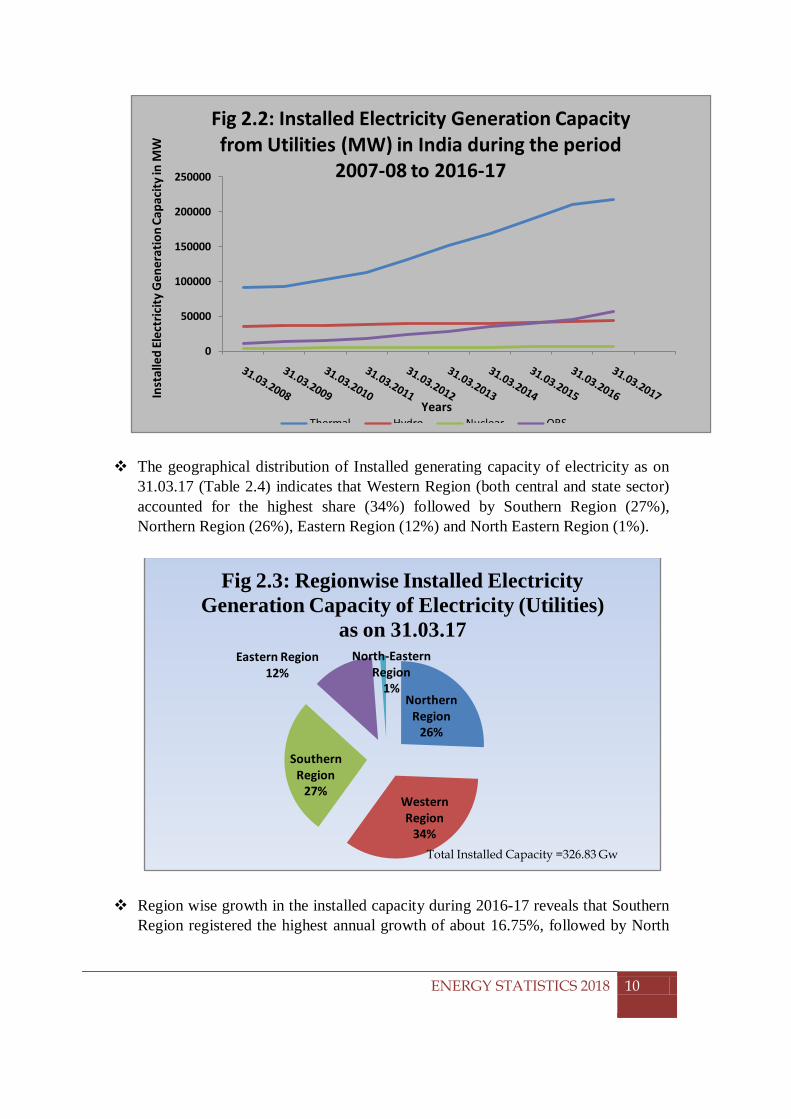
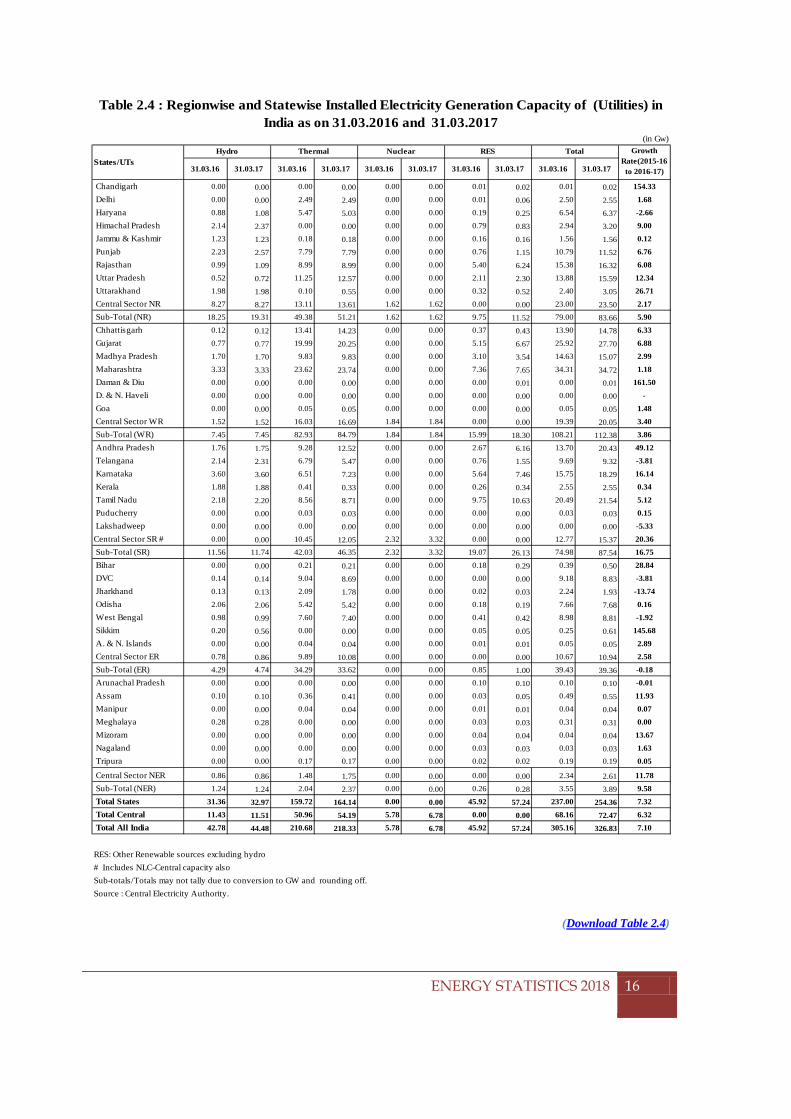
The geographical distribution of Installed generating capacity of electricity as on 31.03.17 (Table 2.4) indicates that Western Region (both central and state sector) accounted for the highest share (34%) followed by Southern Region (27%), Northern Region (26%), Eastern Region (12%) and North Eastern Region (1%).
Region wise growth in the installed capacity during 2016-17 reveals that Southern Region registered the highest annual growth of about 16.75%, followed by North
0
50000
100000
150000
200000
250000
Inst
alle
d El
ectr
icity
Gen
erat
ion
Capa
city
in M
W
Years
Fig 2.2: Installed Electricity Generation Capacity from Utilities (MW) in India during the period
2007-08 to 2016-17
Thermal Hydro Nuclear ORS
Northern Region
26%
Western Region
34%
Southern Region
27%
Eastern Region12%
North-Eastern Region
1%
Fig 2.3: Regionwise Installed Electricity Generation Capacity of Electricity (Utilities)
as on 31.03.17
Total Installed Capacity =326.83 Gw
ENERGY STATISTICS 2018
10
CHAPTER 2: INSTALLED CAPACITY AND CAPACITY UTILIZATION
Eastern Region (9.58%), Northern Region (5.90%), Western Region (3.86%), and Eastern Region (-0.18%).
Among all the states Daman & Diu registered highest annual growth (161.50%) in
the installed capacity followed by Chandigarh (154.33%) and Sikkim (145.68%).
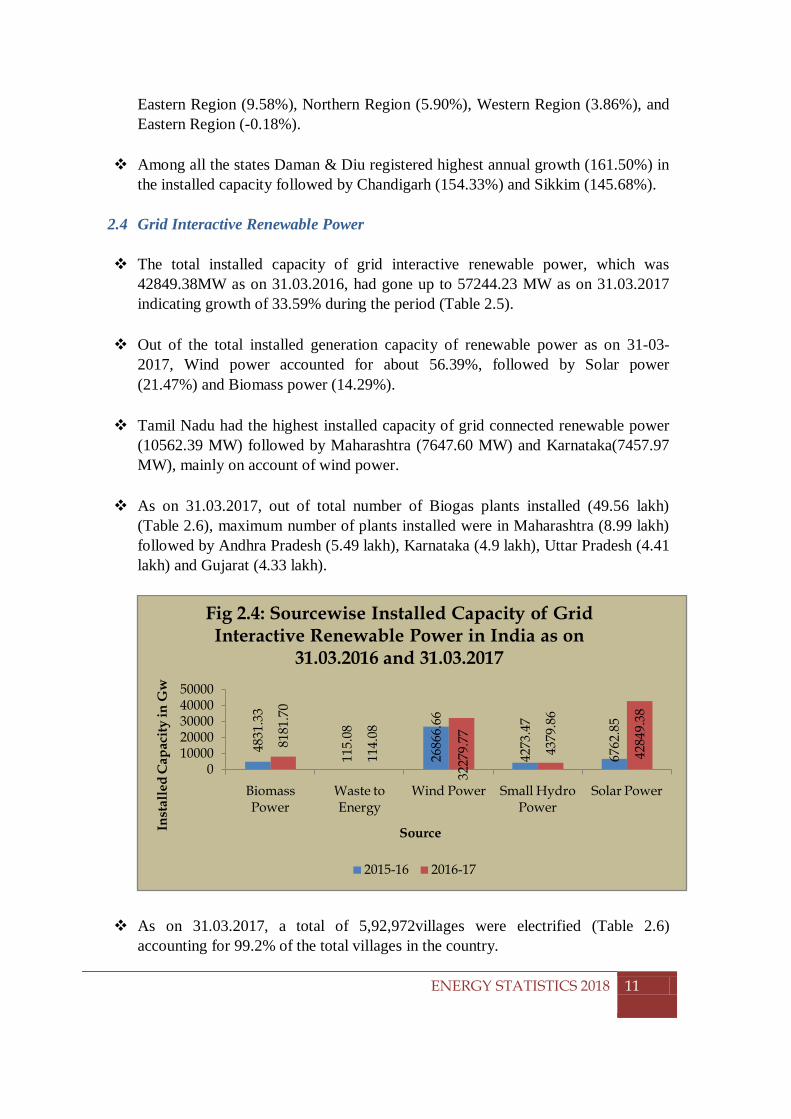
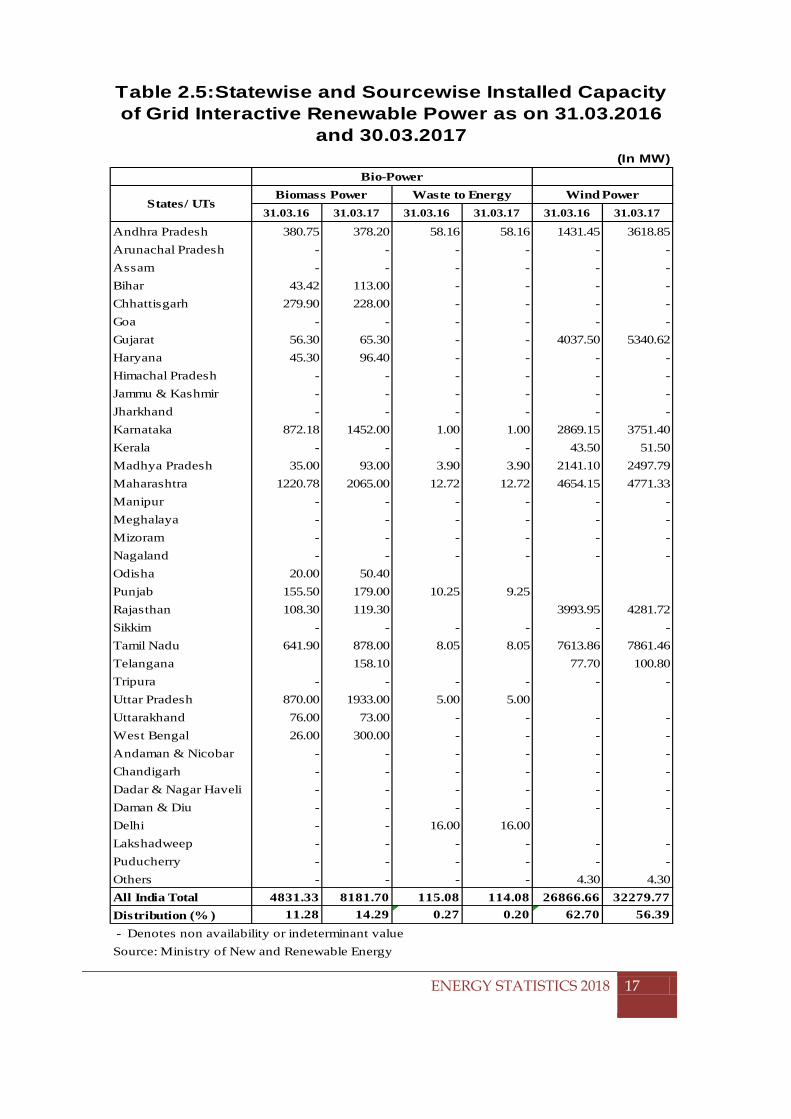
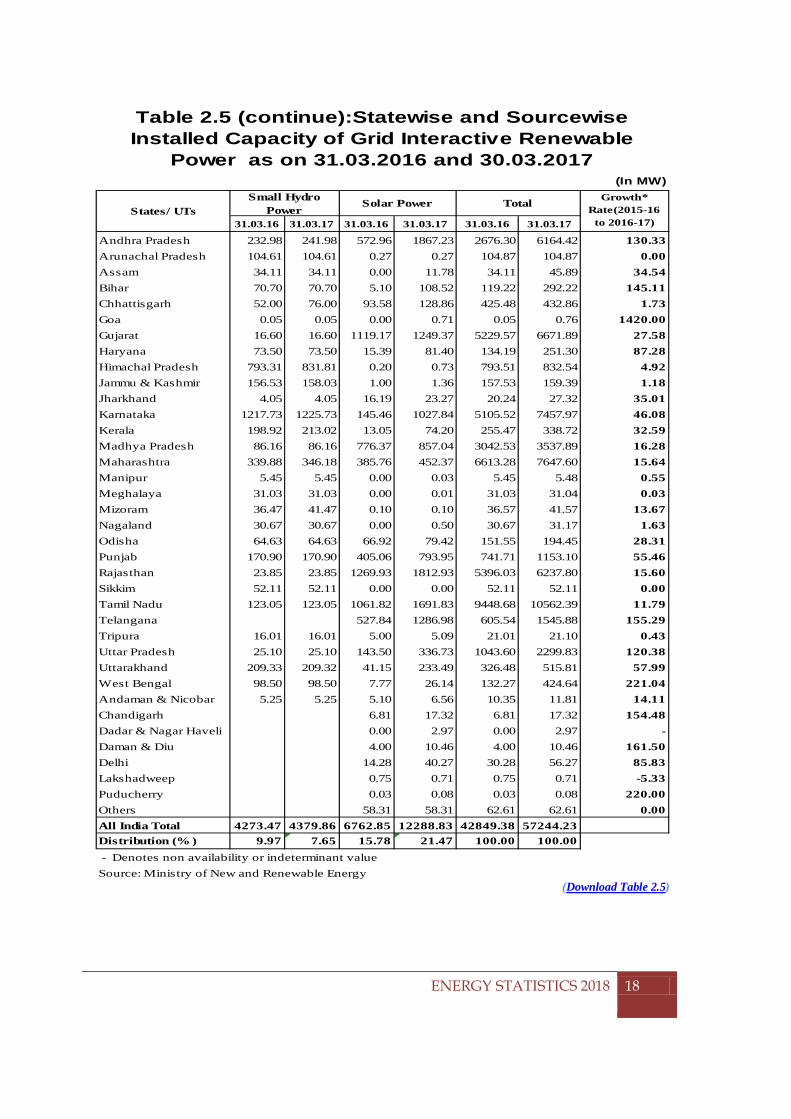
2.4 Grid Interactive Renewable Power The total installed capacity of grid interactive renewable power, which was
42849.38MW as on 31.03.2016, had gone up to 57244.23 MW as on 31.03.2017 indicating growth of 33.59% during the period (Table 2.5).
Out of the total installed generation capacity of renewable power as on 31-03-
2017, Wind power accounted for about 56.39%, followed by Solar power (21.47%) and Biomass power (14.29%).
Tamil Nadu had the highest installed capacity of grid connected renewable power
(10562.39 MW) followed by Maharashtra (7647.60 MW) and Karnataka(7457.97 MW), mainly on account of wind power.
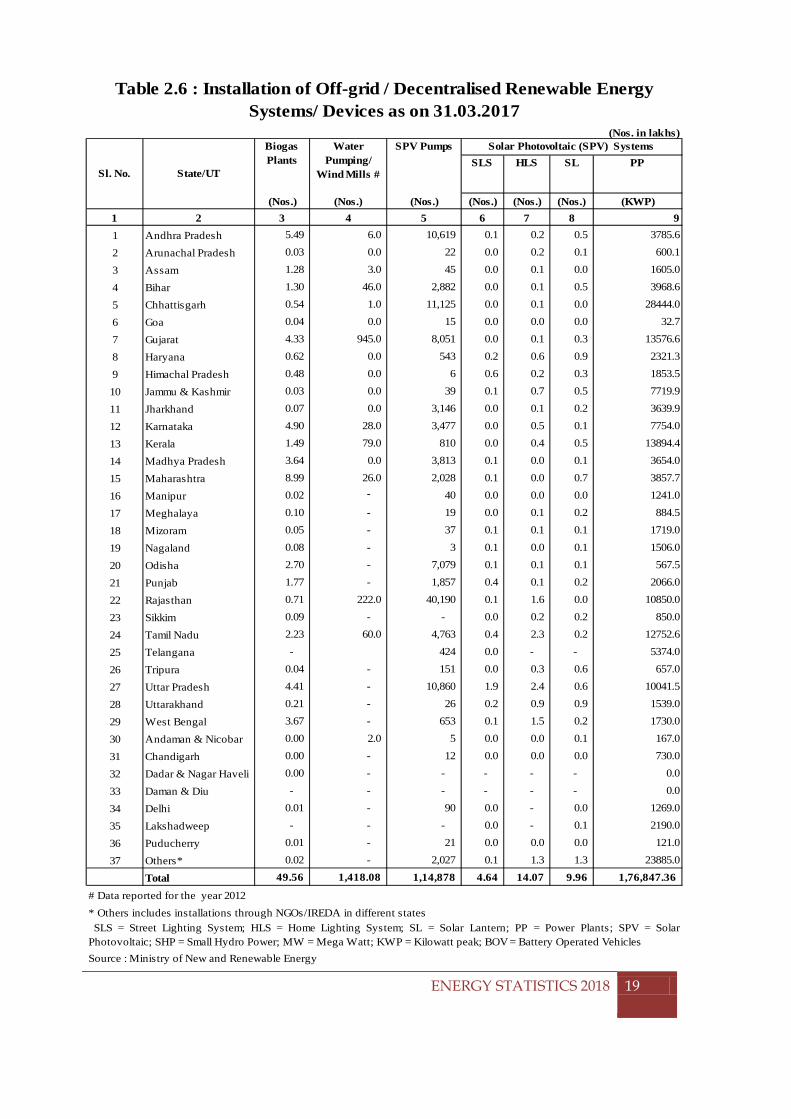
As on 31.03.2017, out of total number of Biogas plants installed (49.56 lakh)
(Table 2.6), maximum number of plants installed were in Maharashtra (8.99 lakh) followed by Andhra Pradesh (5.49 lakh), Karnataka (4.9 lakh), Uttar Pradesh (4.41 lakh) and Gujarat (4.33 lakh).
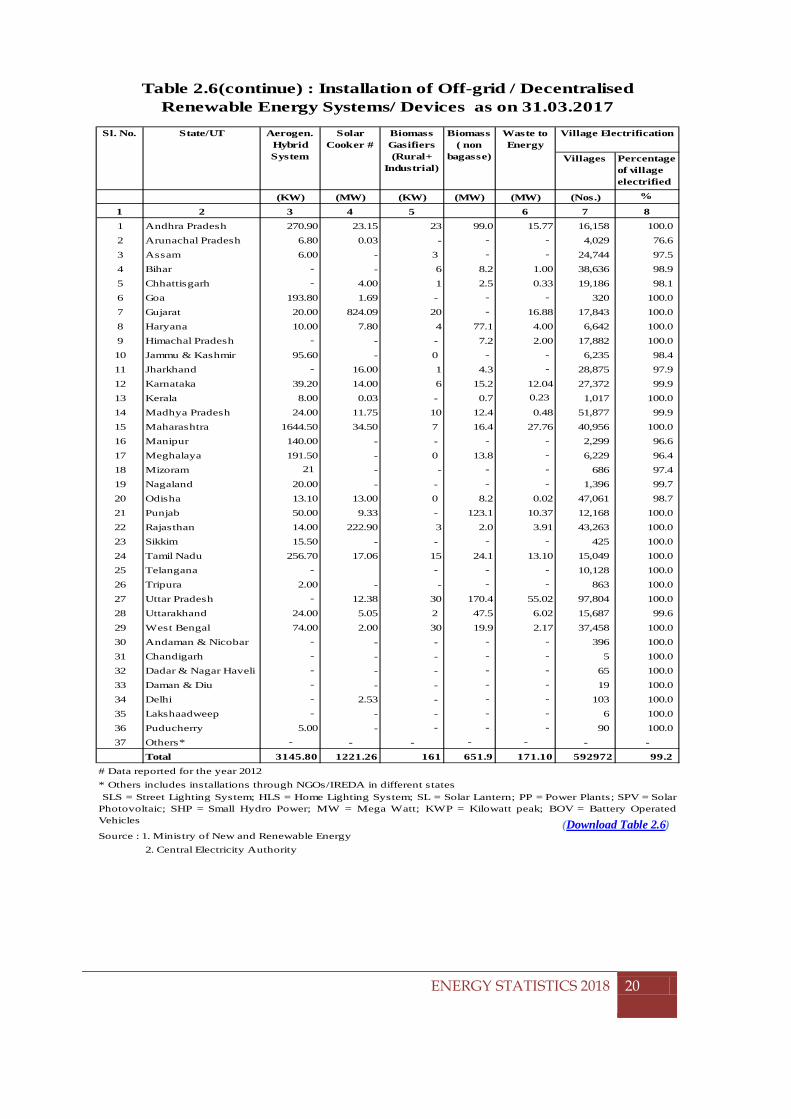
As on 31.03.2017, a total of 5,92,972villages were electrified (Table 2.6) accounting for 99.2% of the total villages in the country.
4831
.33
115.
08
2686
6.66
4273
.47
6762
.85
8181
.70
114.
08
3227
9.77
4379
.86
4284
9.38
01000020000300004000050000
Biomass Power
Waste to Energy
Wind Power Small Hydro Power
Solar Power
Inst
alle
d C
apac
ity in
Gw
Source
Fig 2.4: Sourcewise Installed Capacity of Grid Interactive Renewable Power in India as on
31.03.2016 and 31.03.2017
2015-16 2016-17
ENERGY STATISTICS 2018
11
CHAPTER 2: INSTALLED CAPACITY AND CAPACITY UTILIZATION
*Provisional
ENERGY STATISTICS 2018
12
CHAPTER 2: INSTALLED CAPACITY AND CAPACITY UTILIZATION
(Download Table 2.1)
ENERGY STATISTICS 2018
13
CHAPTER 2: INSTALLED CAPACITY AND CAPACITY UTILIZATION
(Download Table 2.2)
ENERGY STATISTICS 2018
14
01.04.2016 01.04.2017 2015-16 2016-17* 2015-16 2016-17*Change in Utilisation
A Public Sector Refineries 135066 138966 127087 137388 105.8 101.7 -4.11 IOC RFINERIES 69200 69200 58007 65191 107.0 94.2 -12.8
1.1 IOC, Guwahati, Assam 1000 1000 904 864 90.4 86.4 -4.01.2 IOC,Barauni, Bihar 6000 6000 6545 6526 109.1 108.8 -0.31.3 IOC,Koyali, Gujarat 13700 13700 13820 13994 100.9 102.1 1.31.4 IOC, Haldia, West Bengal 7500 7500 7776 7689 103.7 102.5 -1.21.5 IOC, Mathura, Uttar Pradesh 8000 8000 8860 9230 110.8 115.4 4.61.6 IOC, Digboi, Assam 650 650 562 533 86.4 82.1 -4.41.7 IOC, Panipat, Haryana 15000 15000 15282 15638 101.9 104.3 2.41.8 IOC, Bongaigaon, Assam 2350 2350 2442 2486 103.9 105.8 1.91.9 IOC, Pradip, Odisha - 15000 1817 8230 - 54.9 -2 BPCL RFINERIES 21500 24400 24083 25362 112.0 118.0 5.9
2.1 BPCL, Mumbai, Maharastra 12000 12000 13371 13541 111.4 112.8 1.42.2 BPCL, Kochi, Kerala 9500 12400 10712 11820 112.8 124.4 11.73 HPCL RFINERIES 14800 15800 17234 17846 116.4 120.6 4.1
3.1 HPCL, Mumbai, Maharastra 6500 7500 8013 8510 123.3 130.9 7.63.2 HPCL, Visakh, Andhra Pradesh 8300 8300 9220 9335 111.1 112.5 1.44 CPCL RFINERIES 11500 11500 9644 10256 83.9 89.2 5.34 CPCL, Manali, Tamil Nadu 10500 10500 9100 9725 86.7 92.6 6.0
4.2 CPCL, Narimanam, Tamil Nadu 1000 1000 544 531 54.4 53.1 -1.35 NRL, Numaligarh, Assam 3000 3000 2520 2683 84.0 89.4 5.46 MRPL, Mangalore, Karanataka 15000 15000 15532 15965 103.5 106.4 2.97 ONGC, Tatipaka, Andhra Pradesh 66 66 67 86 102.1 129.8 27.7
B Private Sector Refineries 80000 80000 88662 91093 110.8 113.9 3.01 RIL RFINERIES 60000 60000 69561 70174 235.8 237.8 2.0
1.1 RIL, DTA,Jamnagar, Gujarat 33000 33000 32428 32823 98.3 99.5 1.21.2 RIL(SEZ), Jamnagar, Gujarat 27000 27000 37133 37351 137.5 138.3 0.82 Essar Oil Ltd.(EOL), Vadinar 20000 20000 19101 20919 95.5 104.6 9.1
C JOINT VENTURE 15000 15000 17116 16882 114.1 112.5 -1.61 BORL,Bina*** 6000 6000 6402 6360 106.7 106.0 -0.72 HMEL,Bathinda** 9000 9000 10713 10521 119.0 116.9 -2.1
Total (A+B+C) 230066 233966 232865 245362 108.3 106.6 -1.6* Provisional TMT:Thousand metric Tonnes TMTPA:Thousand metric Tonnes Per Annum
**: HPCL & Mittal Energy Investments Pvt. Ltd., a Joint Venture, Bathinda commissioned on April,2012.***: BPCL ̂Oman Oil Company, a Joint Venture, Bina Commissioned on May,2011Source: Ministry of Petroleum and Natural Gas
Table 2.2: Installed Capacity and Capacity Utilization of Refineries of Crude Oil during 2015-16 and 2016-17
Sl. No. Refinery
Capacity Utilisation (% )Installed Capacity (TMTPA) Crude Oil Processed (TMT)
CHAPTER 2: INSTALLED CAPACITY AND CAPACITY UTILIZATION
(Download Table 2.3)
(Download Table 2.3)
ENERGY STATISTICS 2018
15
GrandHydro ORS Total Total
As on Steam Diesel Gas Total10 11 12 13 14 15 16 18= 9+17
31.03.2008 11,764 8,648 4,209 24,621 61 305 24,986 1,68,04831.03.2009 13,818 8,750 3,621 26,188 111 375 26,674 1,74,63931.03.2010 17,183 9,457 4,368 31,008 55 454 31,517 1,90,91531.03.2011 19,112 9,655 5,054 33,821 57 567 34,444 2,08,07131.03.2012 22,615 9,955 5,885 38,456 48 872 39,375 2,39,25231.03.2013 23,890 11,148 4,498 39,535 67 1,124 40,726 2,64,07031.03.2014 24,752 11,432 4,751 40,935 64 1,259 42,258 2,90,81231.03.2015 26,089 12,009 5,193 43,291 65 1,301 44,657 3,19,56131.03.2016 28,688 12,347 5,819 46,853 59 1,368 48,279 3,53,44231.03.2017* 29,889 12,849 6,061 48,799 54 1,436 50,289 3,77,122Growth rate of 2016-17 over 2015-16(% )
4.19 4.07 4.16 4.15 -8.46 5.00 4.16 6.70
CAGR 2007-08 to 2016-17(% )
9.77 4.04 3.71 7.08 -1.11 16.77 7.25 8.42
* ORS means Other Renewable Sources** Capacity in respect of Self Generating Industries includes units of capacity 1 MW and above.CAGR: Compound Annual Growth Rate =((Current Value/Base Value)^(1/nos. of years)-1)*100Source : Central Electricity Authority.
ThermalNon-Utilities
(in Mega Watt = 103 x Kilo Watt )
Table 2.3 (continue) : Installed Electricity Generation Capacity in Utilities and Non-utilities in India from 2007-08 to 2016-17
Hydro Nuclear ORS TotalAs on Steam Diesel Gas Total
1 2 3 4 5 6 7 8 931.03.2008 76,019 1,202 14,686 91,907 35,909 4,120 11,125 1,43,06131.03.2009 77,649 1,200 14,877 93,725 36,878 4,120 13,242 1,47,96631.03.2010 84,198 1,200 17,056 1,02,454 36,863 4,560 15,521 1,59,39831.03.2011 93,918 1,200 17,706 1,12,824 37,567 4,780 18,455 1,73,62631.03.2012 1,12,022 1,200 18,381 1,31,603 38,990 4,780 24,503 1,99,87731.03.2013 1,30,221 1,200 20,110 1,51,530 39,491 4,780 27,542 2,23,34431.03.2014 1,45,273 1,200 21,782 1,68,255 40,531 4,780 34,988 2,48,55431.03.2015 1,64,636 1,200 23,062 1,88,898 41,267 5,780 38,959 2,74,90431.03.2016 1,85,173 994 24,509 2,10,675 42,783 5,780 45,924 3,05,16231.03.2017 1,92,163 838 25,329 2,18,330 44,478 6,780 57,244 3,26,833Growth rate of 2016-17 over 2015-16(% )
3.77 -15.69 3.35 3.63 3.96 17.30 24.65 7.10
CAGR 2007-08 to 2016-17(% )
9.72 -3.55 5.60 9.04 2.16 5.11 17.80 8.61
Note: Data for ORS has been revised with respect to year 2014, 2015 along with 2016 as per the data supplied by CEA* ORS means Other Renewable Sources** Capacity in respect of Self Generating Industries includes units of capacity 1 MW and above.CAGR: Compound Annual Growth Rate =((Current Value/Base Value)^(1/nos. of years)-1)*100Source : Central Electricity Authority.
Table 2.3 : Installed Electricity Generation Capacity in Utilities and Non-utilities in India from 2007-08 to 2016-17
(in Mega Watt = 103 Kilo Watt )
UtilitiesThermal
CHAPTER 2: INSTALLED CAPACITY AND CAPACITY UTILIZATION
(Download Table 2.4)
(in Gw)
31.03.16 31.03.17 31.03.16 31.03.17 31.03.16 31.03.17 31.03.16 31.03.17 31.03.16 31.03.17
Chandigarh 0.00 0.00 0.00 0.00 0.00 0.00 0.01 0.02 0.01 0.02 154.33
Delhi 0.00 0.00 2.49 2.49 0.00 0.00 0.01 0.06 2.50 2.55 1.68
Haryana 0.88 1.08 5.47 5.03 0.00 0.00 0.19 0.25 6.54 6.37 -2.66
Himachal Pradesh 2.14 2.37 0.00 0.00 0.00 0.00 0.79 0.83 2.94 3.20 9.00
Jammu & Kashmir 1.23 1.23 0.18 0.18 0.00 0.00 0.16 0.16 1.56 1.56 0.12
Punjab 2.23 2.57 7.79 7.79 0.00 0.00 0.76 1.15 10.79 11.52 6.76
Rajasthan 0.99 1.09 8.99 8.99 0.00 0.00 5.40 6.24 15.38 16.32 6.08
Uttar Pradesh 0.52 0.72 11.25 12.57 0.00 0.00 2.11 2.30 13.88 15.59 12.34
Uttarakhand 1.98 1.98 0.10 0.55 0.00 0.00 0.32 0.52 2.40 3.05 26.71
Central Sector NR 8.27 8.27 13.11 13.61 1.62 1.62 0.00 0.00 23.00 23.50 2.17
Sub-Total (NR) 18.25 19.31 49.38 51.21 1.62 1.62 9.75 11.52 79.00 83.66 5.90
Chhattisgarh 0.12 0.12 13.41 14.23 0.00 0.00 0.37 0.43 13.90 14.78 6.33
Gujarat 0.77 0.77 19.99 20.25 0.00 0.00 5.15 6.67 25.92 27.70 6.88
Madhya Pradesh 1.70 1.70 9.83 9.83 0.00 0.00 3.10 3.54 14.63 15.07 2.99
Maharashtra 3.33 3.33 23.62 23.74 0.00 0.00 7.36 7.65 34.31 34.72 1.18
Daman & Diu 0.00 0.00 0.00 0.00 0.00 0.00 0.00 0.01 0.00 0.01 161.50
D. & N. Haveli 0.00 0.00 0.00 0.00 0.00 0.00 0.00 0.00 0.00 0.00 -
Goa 0.00 0.00 0.05 0.05 0.00 0.00 0.00 0.00 0.05 0.05 1.48
Central Sector WR 1.52 1.52 16.03 16.69 1.84 1.84 0.00 0.00 19.39 20.05 3.40
Sub-Total (WR) 7.45 7.45 82.93 84.79 1.84 1.84 15.99 18.30 108.21 112.38 3.86
Andhra Pradesh 1.76 1.75 9.28 12.52 0.00 0.00 2.67 6.16 13.70 20.43 49.12
Telangana 2.14 2.31 6.79 5.47 0.00 0.00 0.76 1.55 9.69 9.32 -3.81
Karnataka 3.60 3.60 6.51 7.23 0.00 0.00 5.64 7.46 15.75 18.29 16.14
Kerala 1.88 1.88 0.41 0.33 0.00 0.00 0.26 0.34 2.55 2.55 0.34
Tamil Nadu 2.18 2.20 8.56 8.71 0.00 0.00 9.75 10.63 20.49 21.54 5.12
Puducherry 0.00 0.00 0.03 0.03 0.00 0.00 0.00 0.00 0.03 0.03 0.15
Lakshadweep 0.00 0.00 0.00 0.00 0.00 0.00 0.00 0.00 0.00 0.00 -5.33
Central Sector SR # 0.00 0.00 10.45 12.05 2.32 3.32 0.00 0.00 12.77 15.37 20.36
Sub-Total (SR) 11.56 11.74 42.03 46.35 2.32 3.32 19.07 26.13 74.98 87.54 16.75
Bihar 0.00 0.00 0.21 0.21 0.00 0.00 0.18 0.29 0.39 0.50 28.84
DVC 0.14 0.14 9.04 8.69 0.00 0.00 0.00 0.00 9.18 8.83 -3.81
Jharkhand 0.13 0.13 2.09 1.78 0.00 0.00 0.02 0.03 2.24 1.93 -13.74
Odisha 2.06 2.06 5.42 5.42 0.00 0.00 0.18 0.19 7.66 7.68 0.16
West Bengal 0.98 0.99 7.60 7.40 0.00 0.00 0.41 0.42 8.98 8.81 -1.92
Sikkim 0.20 0.56 0.00 0.00 0.00 0.00 0.05 0.05 0.25 0.61 145.68
A. & N. Islands 0.00 0.00 0.04 0.04 0.00 0.00 0.01 0.01 0.05 0.05 2.89
Central Sector ER 0.78 0.86 9.89 10.08 0.00 0.00 0.00 0.00 10.67 10.94 2.58
Sub-Total (ER) 4.29 4.74 34.29 33.62 0.00 0.00 0.85 1.00 39.43 39.36 -0.18
Arunachal Pradesh 0.00 0.00 0.00 0.00 0.00 0.00 0.10 0.10 0.10 0.10 -0.01
Assam 0.10 0.10 0.36 0.41 0.00 0.00 0.03 0.05 0.49 0.55 11.93
Manipur 0.00 0.00 0.04 0.04 0.00 0.00 0.01 0.01 0.04 0.04 0.07
Meghalaya 0.28 0.28 0.00 0.00 0.00 0.00 0.03 0.03 0.31 0.31 0.00
Mizoram 0.00 0.00 0.00 0.00 0.00 0.00 0.04 0.04 0.04 0.04 13.67
Nagaland 0.00 0.00 0.00 0.00 0.00 0.00 0.03 0.03 0.03 0.03 1.63
Tripura 0.00 0.00 0.17 0.17 0.00 0.00 0.02 0.02 0.19 0.19 0.05
Central Sector NER 0.86 0.86 1.48 1.75 0.00 0.00 0.00 0.00 2.34 2.61 11.78
Sub-Total (NER) 1.24 1.24 2.04 2.37 0.00 0.00 0.26 0.28 3.55 3.89 9.58
Total States 31.36 32.97 159.72 164.14 0.00 0.00 45.92 57.24 237.00 254.36 7.32
Total Central 11.43 11.51 50.96 54.19 5.78 6.78 0.00 0.00 68.16 72.47 6.32
Total All India 42.78 44.48 210.68 218.33 5.78 6.78 45.92 57.24 305.16 326.83 7.10
Source : Central Electricity Authority.
RES: Other Renewable sources excluding hydro# Includes NLC-Central capacity alsoSub-totals/Totals may not tally due to conversion to GW and rounding off.
Table 2.4 : Regionwise and Statewise Installed Electricity Generation Capacity of (Utilities) in India as on 31.03.2016 and 31.03.2017
States/UTsHydro Thermal Nuclear RES Total Growth
Rate(2015-16 to 2016-17)
ENERGY STATISTICS 2018
16
CHAPTER 2: INSTALLED CAPACITY AND CAPACITY UTILIZATION
ENERGY STATISTICS 2018
17
31.03.16 31.03.17 31.03.16 31.03.17 31.03.16 31.03.17
Andhra Pradesh 380.75 378.20 58.16 58.16 1431.45 3618.85Arunachal Pradesh - - - - - -Assam - - - - - -Bihar 43.42 113.00 - - - -Chhattisgarh 279.90 228.00 - - - -Goa - - - - - -Gujarat 56.30 65.30 - - 4037.50 5340.62Haryana 45.30 96.40 - - - -Himachal Pradesh - - - - - -Jammu & Kashmir - - - - - -Jharkhand - - - - - -Karnataka 872.18 1452.00 1.00 1.00 2869.15 3751.40Kerala - - - - 43.50 51.50Madhya Pradesh 35.00 93.00 3.90 3.90 2141.10 2497.79Maharashtra 1220.78 2065.00 12.72 12.72 4654.15 4771.33Manipur - - - - - -Meghalaya - - - - - -Mizoram - - - - - -Nagaland - - - - - -Odisha 20.00 50.40Punjab 155.50 179.00 10.25 9.25Rajasthan 108.30 119.30 3993.95 4281.72Sikkim - - - - - -Tamil Nadu 641.90 878.00 8.05 8.05 7613.86 7861.46Telangana 158.10 77.70 100.80Tripura - - - - - -Uttar Pradesh 870.00 1933.00 5.00 5.00Uttarakhand 76.00 73.00 - - - -West Bengal 26.00 300.00 - - - -Andaman & Nicobar - - - - - -Chandigarh - - - - - -Dadar & Nagar Haveli - - - - - -Daman & Diu - - - - - -Delhi - - 16.00 16.00Lakshadweep - - - - - -Puducherry - - - - - -Others - - - - 4.30 4.30All India Total 4831.33 8181.70 115.08 114.08 26866.66 32279.77Distribution (% ) 11.28 14.29 0.27 0.20 62.70 56.39 - Denotes non availability or indeterminant valueSource: Ministry of New and Renewable Energy
Table 2.5:Statewise and Sourcewise Installed Capacity of Grid Interactive Renewable Power as on 31.03.2016
and 30.03.2017 (In MW)
Bio-Power
States/ UTsBiomass Power Waste to Energy Wind Power
CHAPTER 2: INSTALLED CAPACITY AND CAPACITY UTILIZATION
(Download Table 2.5)
ENERGY STATISTICS 2018
18
(In MW)
31.03.16 31.03.17 31.03.16 31.03.17 31.03.16 31.03.17
Andhra Pradesh 232.98 241.98 572.96 1867.23 2676.30 6164.42 130.33Arunachal Pradesh 104.61 104.61 0.27 0.27 104.87 104.87 0.00Assam 34.11 34.11 0.00 11.78 34.11 45.89 34.54Bihar 70.70 70.70 5.10 108.52 119.22 292.22 145.11Chhattisgarh 52.00 76.00 93.58 128.86 425.48 432.86 1.73Goa 0.05 0.05 0.00 0.71 0.05 0.76 1420.00Gujarat 16.60 16.60 1119.17 1249.37 5229.57 6671.89 27.58Haryana 73.50 73.50 15.39 81.40 134.19 251.30 87.28Himachal Pradesh 793.31 831.81 0.20 0.73 793.51 832.54 4.92Jammu & Kashmir 156.53 158.03 1.00 1.36 157.53 159.39 1.18Jharkhand 4.05 4.05 16.19 23.27 20.24 27.32 35.01Karnataka 1217.73 1225.73 145.46 1027.84 5105.52 7457.97 46.08Kerala 198.92 213.02 13.05 74.20 255.47 338.72 32.59Madhya Pradesh 86.16 86.16 776.37 857.04 3042.53 3537.89 16.28Maharashtra 339.88 346.18 385.76 452.37 6613.28 7647.60 15.64Manipur 5.45 5.45 0.00 0.03 5.45 5.48 0.55Meghalaya 31.03 31.03 0.00 0.01 31.03 31.04 0.03Mizoram 36.47 41.47 0.10 0.10 36.57 41.57 13.67Nagaland 30.67 30.67 0.00 0.50 30.67 31.17 1.63Odisha 64.63 64.63 66.92 79.42 151.55 194.45 28.31Punjab 170.90 170.90 405.06 793.95 741.71 1153.10 55.46Rajasthan 23.85 23.85 1269.93 1812.93 5396.03 6237.80 15.60Sikkim 52.11 52.11 0.00 0.00 52.11 52.11 0.00Tamil Nadu 123.05 123.05 1061.82 1691.83 9448.68 10562.39 11.79Telangana 527.84 1286.98 605.54 1545.88 155.29Tripura 16.01 16.01 5.00 5.09 21.01 21.10 0.43Uttar Pradesh 25.10 25.10 143.50 336.73 1043.60 2299.83 120.38Uttarakhand 209.33 209.32 41.15 233.49 326.48 515.81 57.99West Bengal 98.50 98.50 7.77 26.14 132.27 424.64 221.04Andaman & Nicobar 5.25 5.25 5.10 6.56 10.35 11.81 14.11Chandigarh 6.81 17.32 6.81 17.32 154.48Dadar & Nagar Haveli 0.00 2.97 0.00 2.97 -Daman & Diu 4.00 10.46 4.00 10.46 161.50Delhi 14.28 40.27 30.28 56.27 85.83Lakshadweep 0.75 0.71 0.75 0.71 -5.33Puducherry 0.03 0.08 0.03 0.08 220.00Others 58.31 58.31 62.61 62.61 0.00All India Total 4273.47 4379.86 6762.85 12288.83 42849.38 57244.23Distribution (% ) 9.97 7.65 15.78 21.47 100.00 100.00 - Denotes non availability or indeterminant valueSource: Ministry of New and Renewable Energy
Table 2.5 (continue):Statewise and Sourcewise Installed Capacity of Grid Interactive Renewable
Power as on 31.03.2016 and 30.03.2017
States/ UTsSmall Hydro
PowerSolar Power Total Growth*
Rate(2015-16 to 2016-17)
CHAPTER 2: INSTALLED CAPACITY AND CAPACITY UTILIZATION
ENERGY STATISTICS 2018
19
SLS HLS SL PP
(Nos.) (Nos.) (Nos.) (Nos.) (Nos.) (Nos.) (KWP)1 2 3 4 5 6 7 8 91 Andhra Pradesh 5.49 6.0 10,619 0.1 0.2 0.5 3785.6
2 Arunachal Pradesh 0.03 0.0 22 0.0 0.2 0.1 600.1
3 Assam 1.28 3.0 45 0.0 0.1 0.0 1605.0
4 Bihar 1.30 46.0 2,882 0.0 0.1 0.5 3968.6
5 Chhattisgarh 0.54 1.0 11,125 0.0 0.1 0.0 28444.0
6 Goa 0.04 0.0 15 0.0 0.0 0.0 32.7
7 Gujarat 4.33 945.0 8,051 0.0 0.1 0.3 13576.6
8 Haryana 0.62 0.0 543 0.2 0.6 0.9 2321.3
9 Himachal Pradesh 0.48 0.0 6 0.6 0.2 0.3 1853.5
10 Jammu & Kashmir 0.03 0.0 39 0.1 0.7 0.5 7719.9
11 Jharkhand 0.07 0.0 3,146 0.0 0.1 0.2 3639.9
12 Karnataka 4.90 28.0 3,477 0.0 0.5 0.1 7754.0
13 Kerala 1.49 79.0 810 0.0 0.4 0.5 13894.4
14 Madhya Pradesh 3.64 0.0 3,813 0.1 0.0 0.1 3654.0
15 Maharashtra 8.99 26.0 2,028 0.1 0.0 0.7 3857.7
16 Manipur 0.02 - 40 0.0 0.0 0.0 1241.0
17 Meghalaya 0.10 - 19 0.0 0.1 0.2 884.5
18 Mizoram 0.05 - 37 0.1 0.1 0.1 1719.0
19 Nagaland 0.08 - 3 0.1 0.0 0.1 1506.0
20 Odisha 2.70 - 7,079 0.1 0.1 0.1 567.5
21 Punjab 1.77 - 1,857 0.4 0.1 0.2 2066.0
22 Rajasthan 0.71 222.0 40,190 0.1 1.6 0.0 10850.0
23 Sikkim 0.09 - - 0.0 0.2 0.2 850.0
24 Tamil Nadu 2.23 60.0 4,763 0.4 2.3 0.2 12752.6
25 Telangana - 424 0.0 - - 5374.0
26 Tripura 0.04 - 151 0.0 0.3 0.6 657.0
27 Uttar Pradesh 4.41 - 10,860 1.9 2.4 0.6 10041.5
28 Uttarakhand 0.21 - 26 0.2 0.9 0.9 1539.0
29 West Bengal 3.67 - 653 0.1 1.5 0.2 1730.0
30 Andaman & Nicobar 0.00 2.0 5 0.0 0.0 0.1 167.0
31 Chandigarh 0.00 - 12 0.0 0.0 0.0 730.0
32 Dadar & Nagar Haveli 0.00 - - - - - 0.0
33 Daman & Diu - - - - - - 0.0
34 Delhi 0.01 - 90 0.0 - 0.0 1269.0
35 Lakshadweep - - - 0.0 - 0.1 2190.0
36 Puducherry 0.01 - 21 0.0 0.0 0.0 121.0
37 Others* 0.02 - 2,027 0.1 1.3 1.3 23885.0
Total 49.56 1,418.08 1,14,878 4.64 14.07 9.96 1,76,847.36
Source : Ministry of New and Renewable Energy
Water Pumping/
Wind Mills #
SPV Pumps Solar Photovoltaic (SPV) Systems
# Data reported for the year 2012* Others includes installations through NGOs/IREDA in different statesSLS = Street Lighting System; HLS = Home Lighting System; SL = Solar Lantern; PP = Power Plants; SPV = Solar
Photovoltaic; SHP = Small Hydro Power; MW = Mega Watt; KWP = Kilowatt peak; BOV = Battery Operated Vehicles
Table 2.6 : Installation of Off-grid / Decentralised Renewable Energy Systems/ Devices as on 31.03.2017
(Nos. in lakhs)
Sl. No. State/UT
Biogas Plants
CHAPTER 2: INSTALLED CAPACITY AND CAPACITY UTILIZATION
(Download Table 2.6)
ENERGY STATISTICS 2018
20
Sl. No. State/UT
Villages Percentage of village electrified
(KW) (MW) (KW) (MW) (MW) (Nos.) %
1 2 3 4 5 6 7 81 Andhra Pradesh 270.90 23.15 23 99.0 15.77 16,158 100.0 2 Arunachal Pradesh 6.80 0.03 - - - 4,029 76.6 3 Assam 6.00 - 3 - - 24,744 97.5 4 Bihar - - 6 8.2 1.00 38,636 98.9 5 Chhattisgarh - 4.00 1 2.5 0.33 19,186 98.1 6 Goa 193.80 1.69 - - - 320 100.0 7 Gujarat 20.00 824.09 20 - 16.88 17,843 100.0 8 Haryana 10.00 7.80 4 77.1 4.00 6,642 100.0 9 Himachal Pradesh - - - 7.2 2.00 17,882 100.0 10 Jammu & Kashmir 95.60 - 0 - - 6,235 98.4 11 Jharkhand - 16.00 1 4.3 - 28,875 97.9 12 Karnataka 39.20 14.00 6 15.2 12.04 27,372 99.9 13 Kerala 8.00 0.03 - 0.7 0.23 1,017 100.0 14 Madhya Pradesh 24.00 11.75 10 12.4 0.48 51,877 99.9 15 Maharashtra 1644.50 34.50 7 16.4 27.76 40,956 100.0 16 Manipur 140.00 - - - - 2,299 96.6 17 Meghalaya 191.50 - 0 13.8 - 6,229 96.4 18 Mizoram 21 - - - - 686 97.4 19 Nagaland 20.00 - - - - 1,396 99.7 20 Odisha 13.10 13.00 0 8.2 0.02 47,061 98.7 21 Punjab 50.00 9.33 - 123.1 10.37 12,168 100.0 22 Rajasthan 14.00 222.90 3 2.0 3.91 43,263 100.0 23 Sikkim 15.50 - - - - 425 100.0 24 Tamil Nadu 256.70 17.06 15 24.1 13.10 15,049 100.0 25 Telangana - - - - 10,128 100.0 26 Tripura 2.00 - - - - 863 100.0 27 Uttar Pradesh - 12.38 30 170.4 55.02 97,804 100.0 28 Uttarakhand 24.00 5.05 2 47.5 6.02 15,687 99.6 29 West Bengal 74.00 2.00 30 19.9 2.17 37,458 100.0 30 Andaman & Nicobar - - - - - 396 100.0 31 Chandigarh - - - - - 5 100.0 32 Dadar & Nagar Haveli - - - - - 65 100.0 33 Daman & Diu - - - - - 19 100.0 34 Delhi - 2.53 - - - 103 100.0 35 Lakshaadweep - - - - - 6 100.0 36 Puducherry 5.00 - - - - 90 100.0 37 Others* - - - - - - -
Total 3145.80 1221.26 161 651.9 171.10 592972 99.2
Source : 1. Ministry of New and Renewable Energy2. Central Electricity Authority
# Data reported for the year 2012* Others includes installations through NGOs/IREDA in different statesSLS = Street Lighting System; HLS = Home Lighting System; SL = Solar Lantern; PP = Power Plants; SPV = Solar
Photovoltaic; SHP = Small Hydro Power; MW = Mega Watt; KWP = Kilowatt peak; BOV = Battery OperatedVehicles
Table 2.6(continue) : Installation of Off-grid / Decentralised Renewable Energy Systems/ Devices as on 31.03.2017
Aerogen. Hybrid System
Solar Cooker #
Biomass Gasifiers (Rural+
Industrial)
Biomass ( non
bagasse)
Waste to Energy
Village Electrification
CHAPTER 3: PRODUCTION OF COMMERCIAL SOURCES OF ENERGY
CHAPTER 3: PRODUCTION OF COMMERCIAL SOURCES OF
ENERGY
3.1 Production of Coal, lignite, crude petroleum, natural gas& electricity
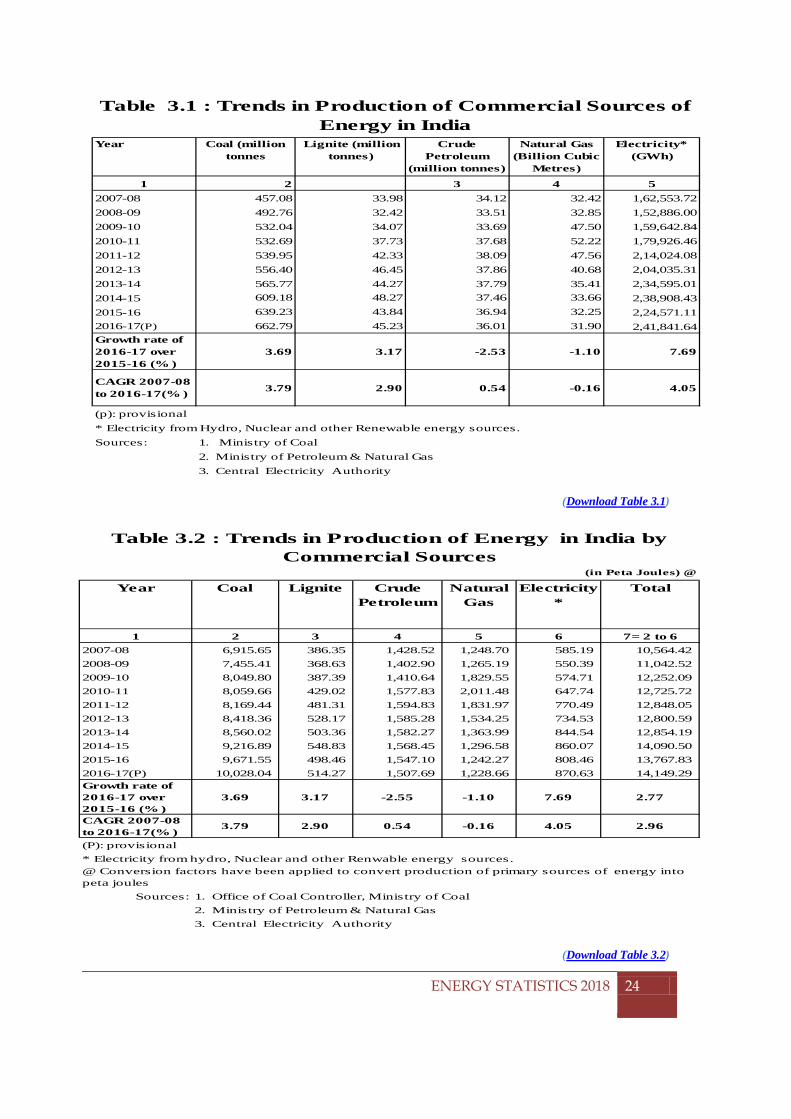
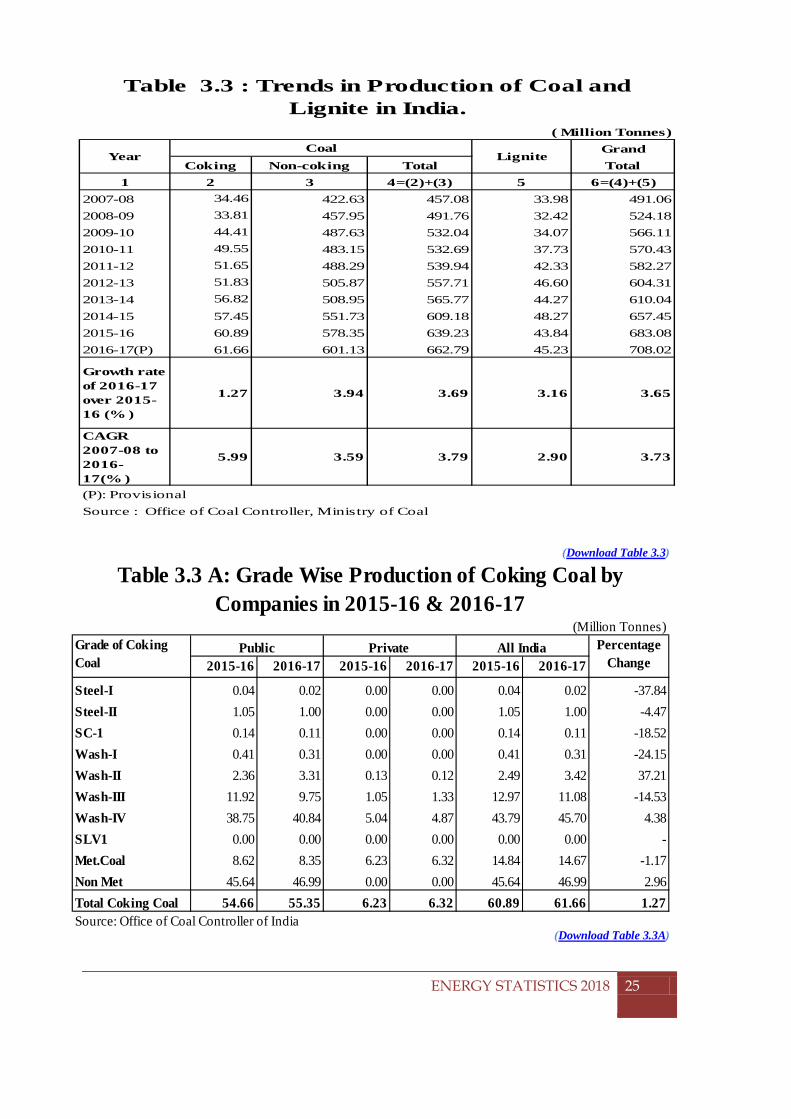
Coal production in the country during the year 2016-17 was 662.79 million tonne(MTs) as compared to 639.23 MTs during 2015-16, registering a growth of 3.69% (Table 3.1).
The Lignite production during 2016-17 was 45.23 million tonnes which is 3.17% higher than the production during 2015-16 (43.84 million tonnes).
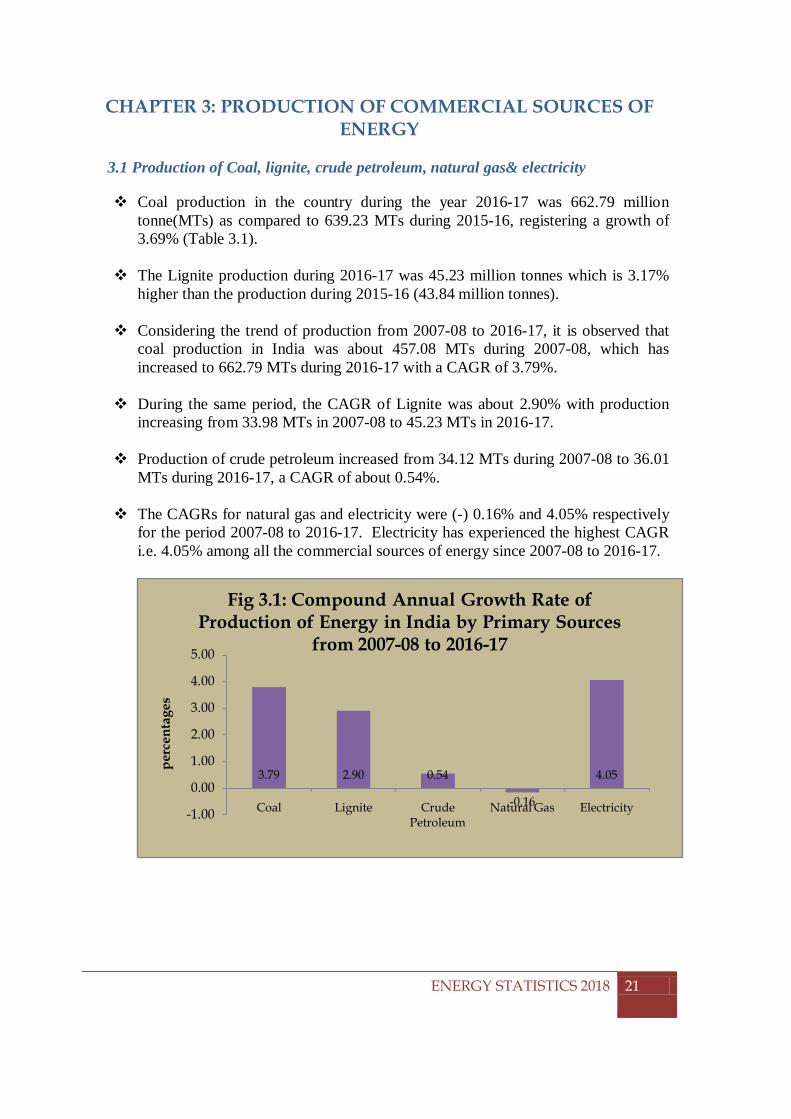
Considering the trend of production from 2007-08 to 2016-17, it is observed that coal production in India was about 457.08 MTs during 2007-08, which has increased to 662.79 MTs during 2016-17 with a CAGR of 3.79%.
During the same period, the CAGR of Lignite was about 2.90% with production increasing from 33.98 MTs in 2007-08 to 45.23 MTs in 2016-17.
Production of crude petroleum increased from 34.12 MTs during 2007-08 to 36.01 MTs during 2016-17, a CAGR of about 0.54%.
The CAGRs for natural gas and electricity were (-) 0.16% and 4.05% respectively for the period 2007-08 to 2016-17. Electricity has experienced the highest CAGR i.e. 4.05% among all the commercial sources of energy since 2007-08 to 2016-17.
3.79 2.90 0.54
-0.16
4.05
-1.00
0.00
1.00
2.00
3.00
4.00
5.00
Coal Lignite Crude Petroleum
Natural Gas Electricity
perc
enta
ges
Fig 3.1: Compound Annual Growth Rate of Production of Energy in India by Primary Sources
from 2007-08 to 2016-17
ENERGY STATISTICS 2018
21
CHAPTER 3: PRODUCTION OF COMMERCIAL SOURCES OF ENERGY
For more meaningful comparison in the trends and patterns of growth of different
energy resources, it is desirable to convert all the resources to their energy equivalents by applying appropriate conversion factors and express them in energy units(Joules/ Peta Joules/Terra Joules).
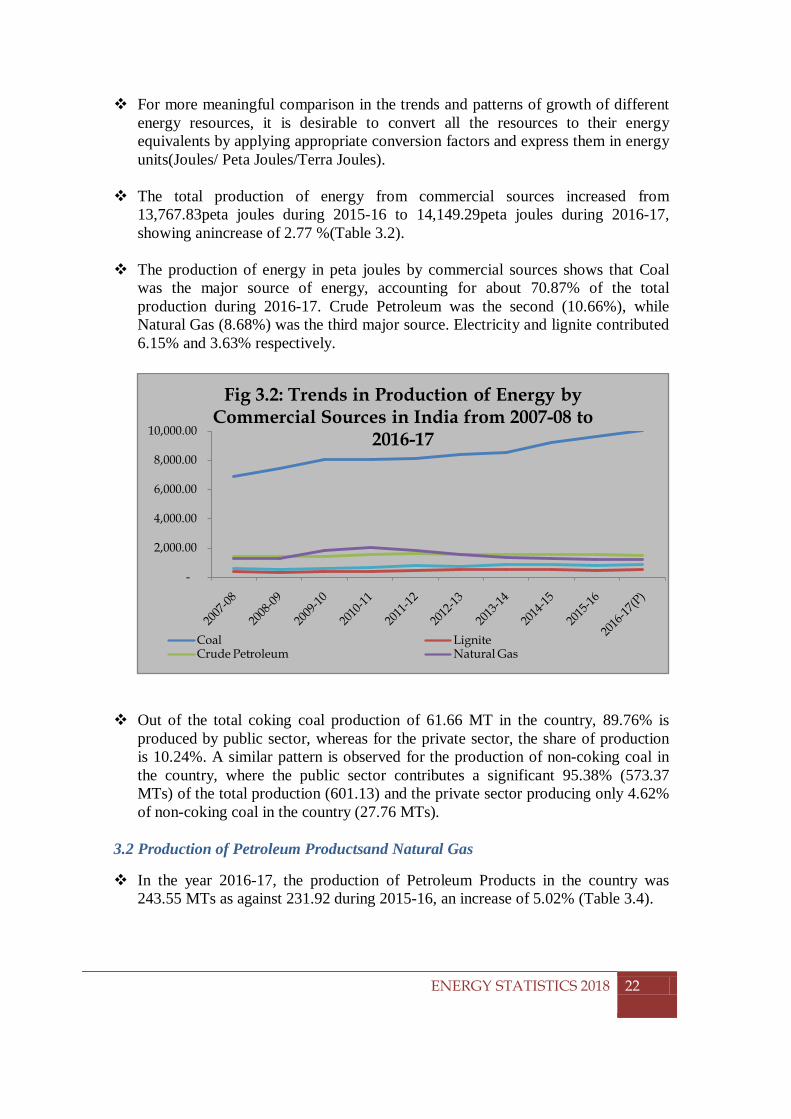
The total production of energy from commercial sources increased from 13,767.83peta joules during 2015-16 to 14,149.29peta joules during 2016-17, showing anincrease of 2.77 %(Table 3.2).
The production of energy in peta joules by commercial sources shows that Coal was the major source of energy, accounting for about 70.87% of the total production during 2016-17. Crude Petroleum was the second (10.66%), while Natural Gas (8.68%) was the third major source. Electricity and lignite contributed 6.15% and 3.63% respectively.
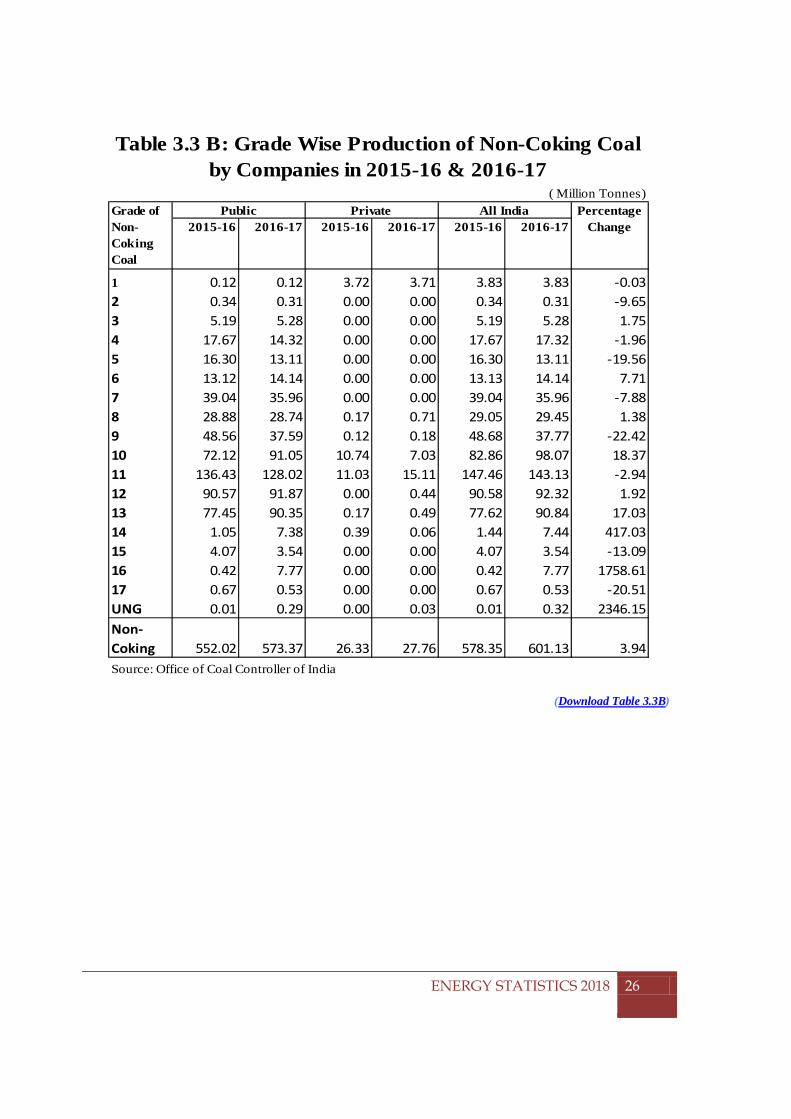
Out of the total coking coal production of 61.66 MT in the country, 89.76% is produced by public sector, whereas for the private sector, the share of production is 10.24%. A similar pattern is observed for the production of non-coking coal in the country, where the public sector contributes a significant 95.38% (573.37 MTs) of the total production (601.13) and the private sector producing only 4.62% of non-coking coal in the country (27.76 MTs).
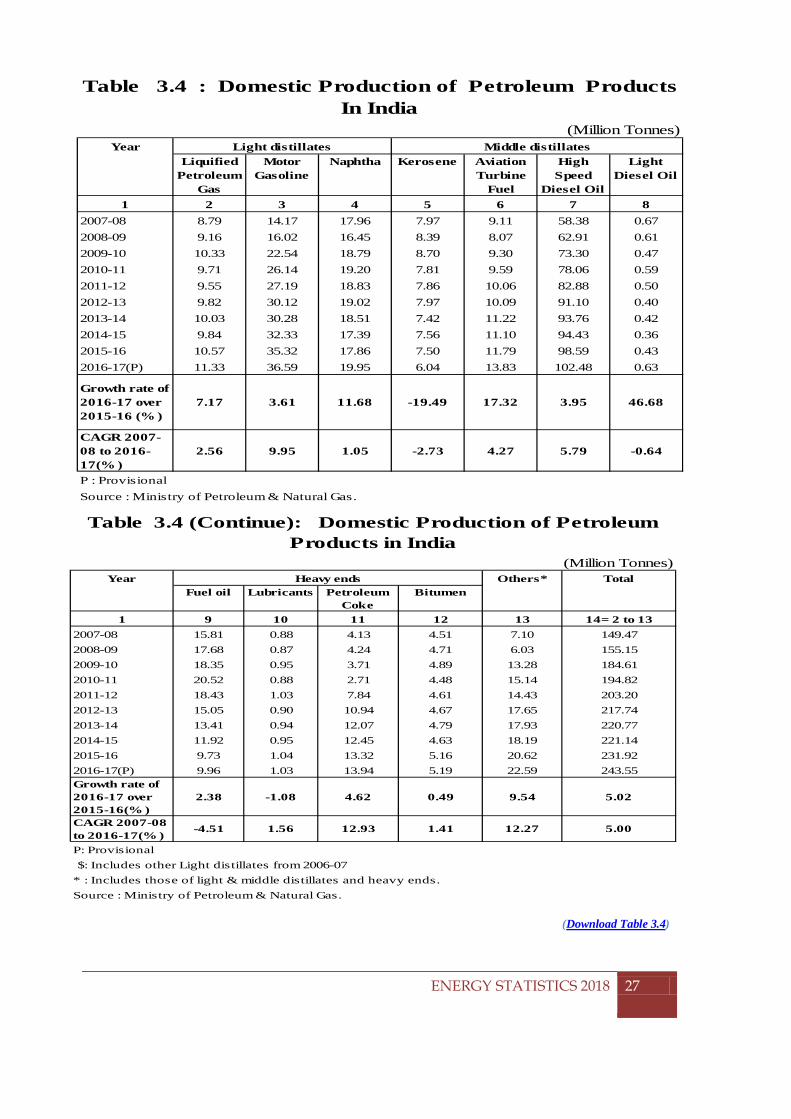
3.2 Production of Petroleum Productsand Natural Gas
In the year 2016-17, the production of Petroleum Products in the country was 243.55 MTs as against 231.92 during 2015-16, an increase of 5.02% (Table 3.4).
-
2,000.00
4,000.00
6,000.00
8,000.00
10,000.00
Fig 3.2: Trends in Production of Energy by Commercial Sources in India from 2007-08 to
2016-17
Coal LigniteCrude Petroleum Natural Gas
ENERGY STATISTICS 2018
22
CHAPTER 3: PRODUCTION OF COMMERCIAL SOURCES OF ENERGY
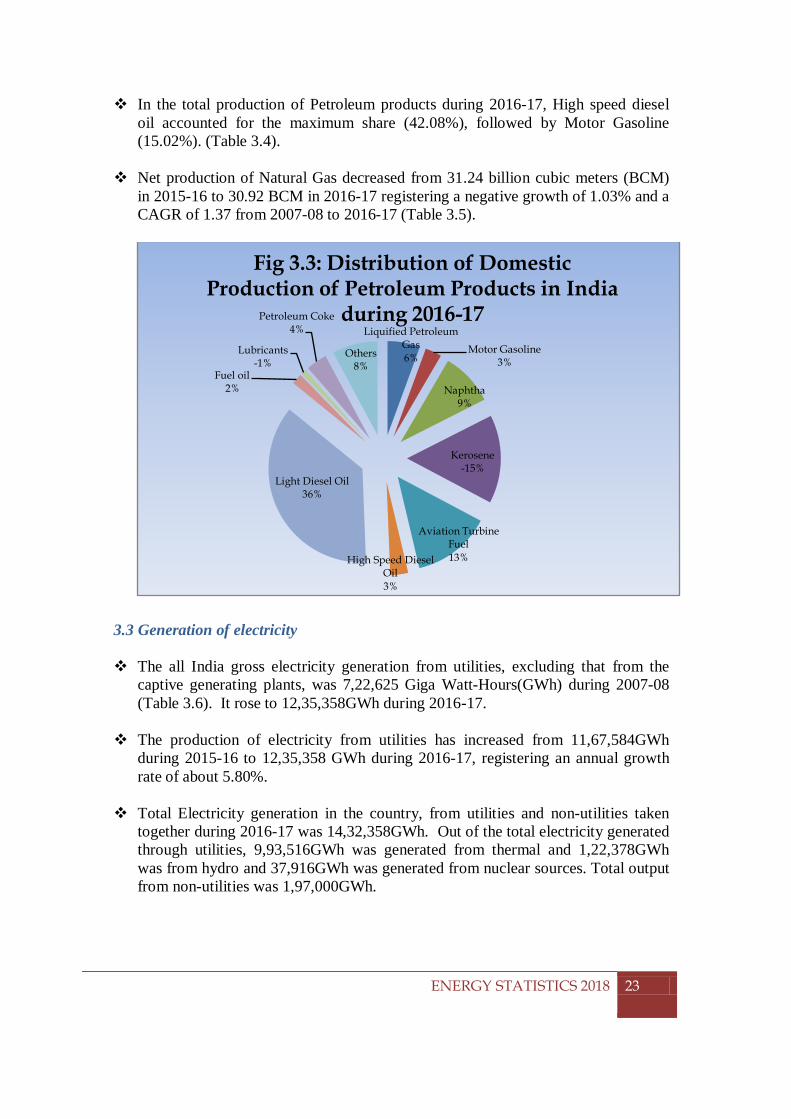
In the total production of Petroleum products during 2016-17, High speed diesel
oil accounted for the maximum share (42.08%), followed by Motor Gasoline (15.02%). (Table 3.4).
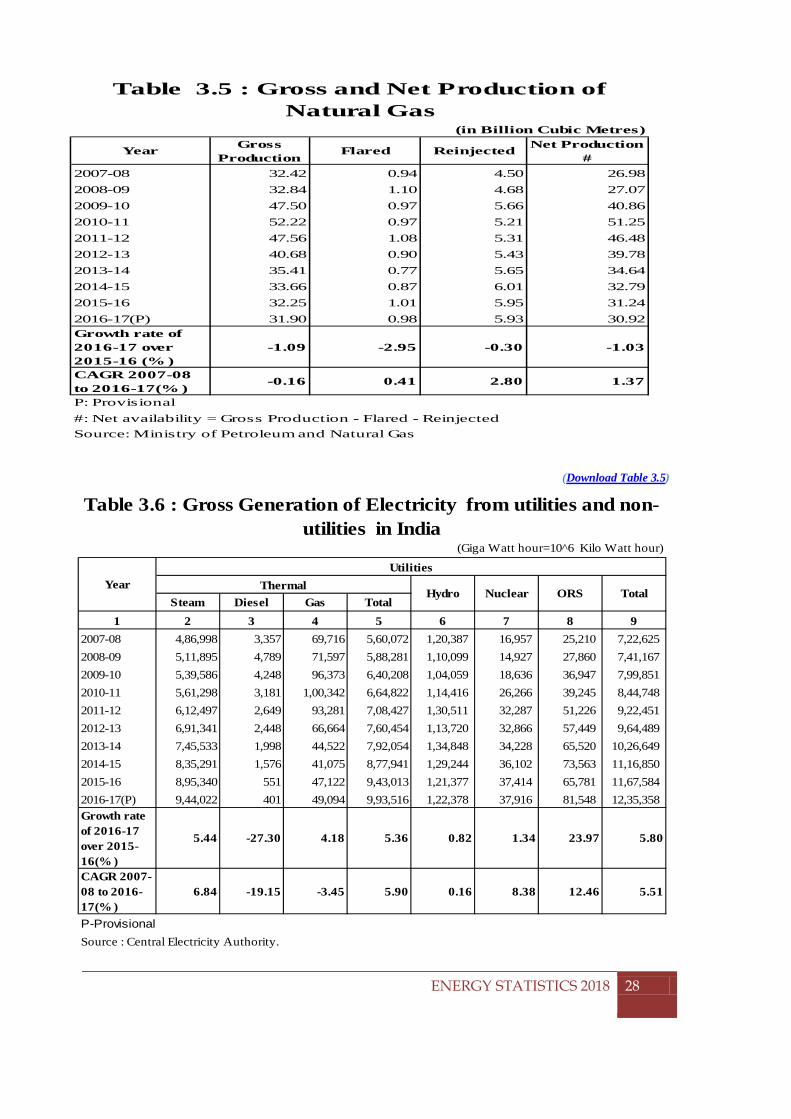
Net production of Natural Gas decreased from 31.24 billion cubic meters (BCM) in 2015-16 to 30.92 BCM in 2016-17 registering a negative growth of 1.03% and a CAGR of 1.37 from 2007-08 to 2016-17 (Table 3.5).
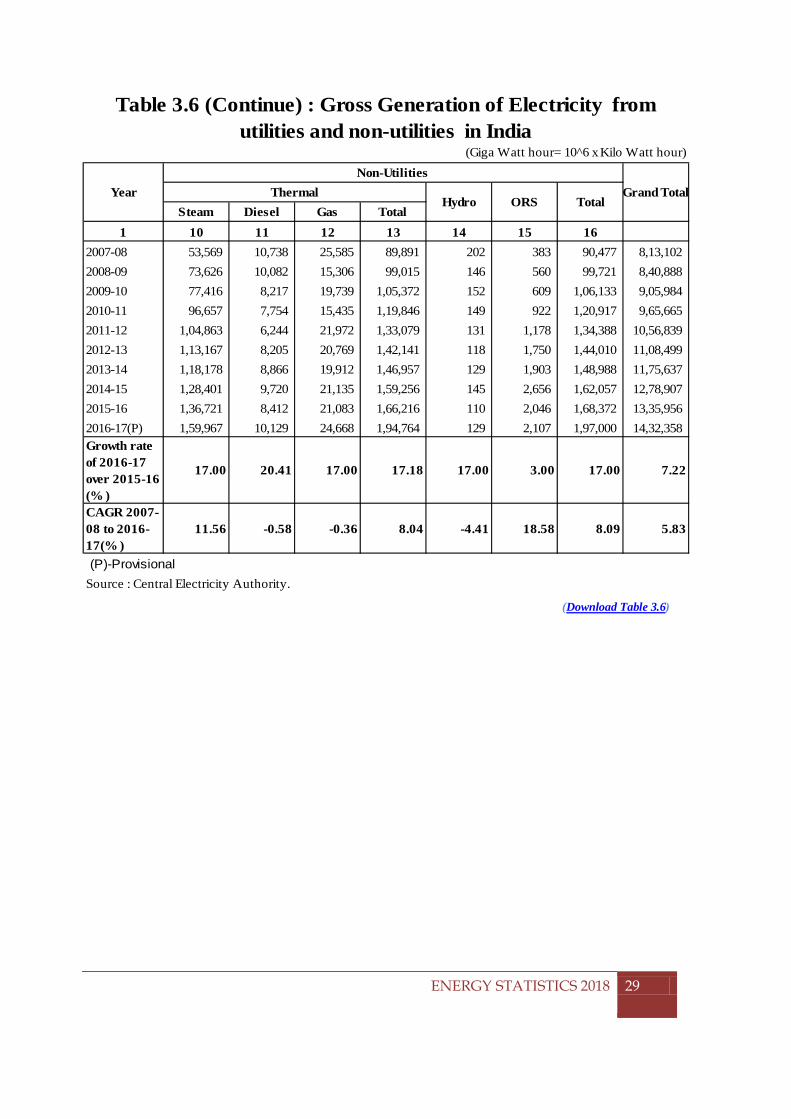
3.3 Generation of electricity The all India gross electricity generation from utilities, excluding that from the
captive generating plants, was 7,22,625 Giga Watt-Hours(GWh) during 2007-08 (Table 3.6). It rose to 12,35,358GWh during 2016-17.
The production of electricity from utilities has increased from 11,67,584GWh during 2015-16 to 12,35,358 GWh during 2016-17, registering an annual growth rate of about 5.80%.
Total Electricity generation in the country, from utilities and non-utilities taken together during 2016-17 was 14,32,358GWh. Out of the total electricity generated through utilities, 9,93,516GWh was generated from thermal and 1,22,378GWh was from hydro and 37,916GWh was generated from nuclear sources. Total output from non-utilities was 1,97,000GWh.
Liquified Petroleum Gas 6%
Motor Gasoline3%
Naphtha9%
Kerosene -15%
Aviation Turbine Fuel13%High Speed Diesel
Oil3%
Light Diesel Oil36%
Fuel oil2%
Lubricants-1%
Petroleum Coke4%
Others8%
Fig 3.3: Distribution of Domestic Production of Petroleum Products in India
during 2016-17
ENERGY STATISTICS 2018
23
CHAPTER 3: PRODUCTION OF COMMERCIAL SOURCES OF ENERGY
(Download Table 3.1)
(Download Table 3.2)
Year Coal (million tonnes
Lignite (million tonnes)
Crude Petroleum
(million tonnes)
Natural Gas (Billion Cubic
Metres)
Electricity* (GWh)
1 2 3 4 52007-08 457.08 33.98 34.12 32.42 1,62,553.722008-09 492.76 32.42 33.51 32.85 1,52,886.002009-10 532.04 34.07 33.69 47.50 1,59,642.842010-11 532.69 37.73 37.68 52.22 1,79,926.462011-12 539.95 42.33 38.09 47.56 2,14,024.082012-13 556.40 46.45 37.86 40.68 2,04,035.312013-14 565.77 44.27 37.79 35.41 2,34,595.012014-15 609.18 48.27 37.46 33.66 2,38,908.432015-16 639.23 43.84 36.94 32.25 2,24,571.112016-17(P) 662.79 45.23 36.01 31.90 2,41,841.64Growth rate of 2016-17 over 2015-16 (% )
3.69 3.17 -2.53 -1.10 7.69
CAGR 2007-08 to 2016-17(% ) 3.79 2.90 0.54 -0.16 4.05
(p): provisional* Electricity from Hydro, Nuclear and other Renewable energy sources.Sources: 1. Ministry of Coal
2. Ministry of Petroleum & Natural Gas3. Central Electricity Authority
Table 3.1 : Trends in Production of Commercial Sources of Energy in India
ENERGY STATISTICS 2018
24
1 2 3 4 5 6 7= 2 to 62007-08 6,915.65 386.35 1,428.52 1,248.70 585.19 10,564.42 2008-09 7,455.41 368.63 1,402.90 1,265.19 550.39 11,042.52 2009-10 8,049.80 387.39 1,410.64 1,829.55 574.71 12,252.09 2010-11 8,059.66 429.02 1,577.83 2,011.48 647.74 12,725.72 2011-12 8,169.44 481.31 1,594.83 1,831.97 770.49 12,848.05 2012-13 8,418.36 528.17 1,585.28 1,534.25 734.53 12,800.59 2013-14 8,560.02 503.36 1,582.27 1,363.99 844.54 12,854.19 2014-15 9,216.89 548.83 1,568.45 1,296.58 860.07 14,090.50 2015-16 9,671.55 498.46 1,547.10 1,242.27 808.46 13,767.83 2016-17(P) 10,028.04 514.27 1,507.69 1,228.66 870.63 14,149.29 Growth rate of 2016-17 over 2015-16 (% )
3.69 3.17 -2.55 -1.10 7.69 2.77
CAGR 2007-08 to 2016-17(% )
3.79 2.90 0.54 -0.16 4.05 2.96
(P): provisional* Electricity from hydro, Nuclear and other Renwable energy sources.
Sources: 1. Office of Coal Controller, Ministry of Coal2. Ministry of Petroleum & Natural Gas3. Central Electricity Authority
@ Conversion factors have been applied to convert production of primary sources of energy into peta joules
Table 3.2 : Trends in Production of Energy in India by Commercial Sources
(in Peta Joules) @
Year Lignite Crude Petroleum
Natural Gas
Electricity *
TotalCoal
CHAPTER 3: PRODUCTION OF COMMERCIAL SOURCES OF ENERGY
(Download Table 3.3)
(Download Table 3.3A)
ENERGY STATISTICS 2018
25
2015-16 2016-17 2015-16 2016-17 2015-16 2016-17
Steel-I 0.04 0.02 0.00 0.00 0.04 0.02 -37.84Steel-II 1.05 1.00 0.00 0.00 1.05 1.00 -4.47SC-1 0.14 0.11 0.00 0.00 0.14 0.11 -18.52Wash-I 0.41 0.31 0.00 0.00 0.41 0.31 -24.15Wash-II 2.36 3.31 0.13 0.12 2.49 3.42 37.21Wash-III 11.92 9.75 1.05 1.33 12.97 11.08 -14.53Wash-IV 38.75 40.84 5.04 4.87 43.79 45.70 4.38SLV1 0.00 0.00 0.00 0.00 0.00 0.00 -Met.Coal 8.62 8.35 6.23 6.32 14.84 14.67 -1.17Non Met 45.64 46.99 0.00 0.00 45.64 46.99 2.96Total Coking Coal 54.66 55.35 6.23 6.32 60.89 61.66 1.27Source: Office of Coal Controller of India
Table 3.3 A: Grade Wise Production of Coking Coal by Companies in 2015-16 & 2016-17
(Million Tonnes)Public Private All India Percentage
ChangeGrade of Coking Coal
( Million Tonnes)Grand
Coking Non-coking Total Total1 2 3 4=(2)+(3) 5 6=(4)+(5)
2007-08 34.46 422.63 457.08 33.98 491.062008-09 33.81 457.95 491.76 32.42 524.182009-10 44.41 487.63 532.04 34.07 566.112010-11 49.55 483.15 532.69 37.73 570.432011-12 51.65 488.29 539.94 42.33 582.272012-13 51.83 505.87 557.71 46.60 604.312013-14 56.82 508.95 565.77 44.27 610.042014-15 57.45 551.73 609.18 48.27 657.452015-16 60.89 578.35 639.23 43.84 683.082016-17(P) 61.66 601.13 662.79 45.23 708.02
Growth rate of 2016-17 over 2015-16 (% )
1.27 3.94 3.69 3.16 3.65
CAGR 2007-08 to 2016-17(% )
5.99 3.59 3.79 2.90 3.73
(P): ProvisionalSource : Office of Coal Controller, Ministry of Coal
Table 3.3 : Trends in Production of Coal and Lignite in India.
YearCoal
Lignite
CHAPTER 3: PRODUCTION OF COMMERCIAL SOURCES OF ENERGY
(Download Table 3.3B)
2015-16 2016-17 2015-16 2016-17 2015-16 2016-17
1 0.12 0.12 3.72 3.71 3.83 3.83 -0.032 0.34 0.31 0.00 0.00 0.34 0.31 -9.653 5.19 5.28 0.00 0.00 5.19 5.28 1.754 17.67 14.32 0.00 0.00 17.67 17.32 -1.965 16.30 13.11 0.00 0.00 16.30 13.11 -19.566 13.12 14.14 0.00 0.00 13.13 14.14 7.717 39.04 35.96 0.00 0.00 39.04 35.96 -7.888 28.88 28.74 0.17 0.71 29.05 29.45 1.389 48.56 37.59 0.12 0.18 48.68 37.77 -22.4210 72.12 91.05 10.74 7.03 82.86 98.07 18.3711 136.43 128.02 11.03 15.11 147.46 143.13 -2.9412 90.57 91.87 0.00 0.44 90.58 92.32 1.9213 77.45 90.35 0.17 0.49 77.62 90.84 17.0314 1.05 7.38 0.39 0.06 1.44 7.44 417.0315 4.07 3.54 0.00 0.00 4.07 3.54 -13.0916 0.42 7.77 0.00 0.00 0.42 7.77 1758.6117 0.67 0.53 0.00 0.00 0.67 0.53 -20.51UNG 0.01 0.29 0.00 0.03 0.01 0.32 2346.15 Non-Coking 552.02 573.37 26.33 27.76 578.35 601.13 3.94Source: Office of Coal Controller of India
( Million Tonnes)
Table 3.3 B: Grade Wise Production of Non-Coking Coal by Companies in 2015-16 & 2016-17
Grade of Non-Coking Coal
Public Private All India Percentage Change
ENERGY STATISTICS 2018
26
CHAPTER 3: PRODUCTION OF COMMERCIAL SOURCES OF ENERGY
(Download Table 3.4)
ENERGY STATISTICS 2018
27
(Million Tonnes)Year
Liquified Petroleum
Gas
Motor Gasoline
Naphtha Kerosene Aviation Turbine
Fuel
High Speed
Diesel Oil
Light Diesel Oil
1 2 3 4 5 6 7 82007-08 8.79 14.17 17.96 7.97 9.11 58.38 0.672008-09 9.16 16.02 16.45 8.39 8.07 62.91 0.612009-10 10.33 22.54 18.79 8.70 9.30 73.30 0.472010-11 9.71 26.14 19.20 7.81 9.59 78.06 0.592011-12 9.55 27.19 18.83 7.86 10.06 82.88 0.502012-13 9.82 30.12 19.02 7.97 10.09 91.10 0.402013-14 10.03 30.28 18.51 7.42 11.22 93.76 0.422014-15 9.84 32.33 17.39 7.56 11.10 94.43 0.362015-16 10.57 35.32 17.86 7.50 11.79 98.59 0.432016-17(P) 11.33 36.59 19.95 6.04 13.83 102.48 0.63
Growth rate of 2016-17 over 2015-16 (% )
7.17 3.61 11.68 -19.49 17.32 3.95 46.68
CAGR 2007-08 to 2016-17(% )
2.56 9.95 1.05 -2.73 4.27 5.79 -0.64
P : ProvisionalSource : Ministry of Petroleum & Natural Gas.
Table 3.4 : Domestic Production of Petroleum Products In India
Light distillates Middle distillates
(Million Tonnes)Year Others* Total
Fuel oil Lubricants Petroleum Coke
Bitumen
1 9 10 11 12 13 14= 2 to 132007-08 15.81 0.88 4.13 4.51 7.10 149.472008-09 17.68 0.87 4.24 4.71 6.03 155.152009-10 18.35 0.95 3.71 4.89 13.28 184.612010-11 20.52 0.88 2.71 4.48 15.14 194.822011-12 18.43 1.03 7.84 4.61 14.43 203.202012-13 15.05 0.90 10.94 4.67 17.65 217.742013-14 13.41 0.94 12.07 4.79 17.93 220.772014-15 11.92 0.95 12.45 4.63 18.19 221.142015-16 9.73 1.04 13.32 5.16 20.62 231.922016-17(P) 9.96 1.03 13.94 5.19 22.59 243.55Growth rate of 2016-17 over 2015-16(% )
2.38 -1.08 4.62 0.49 9.54 5.02
CAGR 2007-08 to 2016-17(% )
-4.51 1.56 12.93 1.41 12.27 5.00
P: Provisional
* : Includes those of light & middle distillates and heavy ends.Source : Ministry of Petroleum & Natural Gas.
Table 3.4 (Continue): Domestic Production of Petroleum Products in India
Heavy ends
$: Includes other Light distillates from 2006-07
CHAPTER 3: PRODUCTION OF COMMERCIAL SOURCES OF ENERGY
(Download Table 3.5)
ENERGY STATISTICS 2018
28
Year Gross Production
Flared Reinjected Net Production #
2007-08 32.42 0.94 4.50 26.982008-09 32.84 1.10 4.68 27.072009-10 47.50 0.97 5.66 40.862010-11 52.22 0.97 5.21 51.252011-12 47.56 1.08 5.31 46.482012-13 40.68 0.90 5.43 39.782013-14 35.41 0.77 5.65 34.642014-15 33.66 0.87 6.01 32.792015-16 32.25 1.01 5.95 31.242016-17(P) 31.90 0.98 5.93 30.92Growth rate of 2016-17 over 2015-16 (% )
-1.09 -2.95 -0.30 -1.03
CAGR 2007-08 to 2016-17(% )
-0.16 0.41 2.80 1.37
P: Provisional#: Net availability = Gross Production - Flared - ReinjectedSource: Ministry of Petroleum and Natural Gas
Table 3.5 : Gross and Net Production of Natural Gas
(in Billion Cubic Metres)
Steam Diesel Gas Total1 2 3 4 5 6 7 8 9
2007-08 4,86,998 3,357 69,716 5,60,072 1,20,387 16,957 25,210 7,22,625 2008-09 5,11,895 4,789 71,597 5,88,281 1,10,099 14,927 27,860 7,41,167 2009-10 5,39,586 4,248 96,373 6,40,208 1,04,059 18,636 36,947 7,99,851 2010-11 5,61,298 3,181 1,00,342 6,64,822 1,14,416 26,266 39,245 8,44,748 2011-12 6,12,497 2,649 93,281 7,08,427 1,30,511 32,287 51,226 9,22,451 2012-13 6,91,341 2,448 66,664 7,60,454 1,13,720 32,866 57,449 9,64,489 2013-14 7,45,533 1,998 44,522 7,92,054 1,34,848 34,228 65,520 10,26,649 2014-15 8,35,291 1,576 41,075 8,77,941 1,29,244 36,102 73,563 11,16,850 2015-16 8,95,340 551 47,122 9,43,013 1,21,377 37,414 65,781 11,67,584 2016-17(P) 9,44,022 401 49,094 9,93,516 1,22,378 37,916 81,548 12,35,358 Growth rate of 2016-17 over 2015-16(% )
5.44 -27.30 4.18 5.36 0.82 1.34 23.97 5.80
CAGR 2007-08 to 2016-17(% )
6.84 -19.15 -3.45 5.90 0.16 8.38 12.46 5.51
Source : Central Electricity Authority.
ORS
P-Provisional
Total
Table 3.6 : Gross Generation of Electricity from utilities and non-utilities in India
(Giga Watt hour=10^6 Kilo Watt hour)
YearUtilities
ThermalHydro Nuclear
CHAPTER 3: PRODUCTION OF COMMERCIAL SOURCES OF ENERGY
(Download Table 3.6)
ENERGY STATISTICS 2018
29
Steam Diesel Gas Total1 10 11 12 13 14 15 16
2007-08 53,569 10,738 25,585 89,891 202 383 90,477 8,13,102 2008-09 73,626 10,082 15,306 99,015 146 560 99,721 8,40,888 2009-10 77,416 8,217 19,739 1,05,372 152 609 1,06,133 9,05,984 2010-11 96,657 7,754 15,435 1,19,846 149 922 1,20,917 9,65,665 2011-12 1,04,863 6,244 21,972 1,33,079 131 1,178 1,34,388 10,56,839 2012-13 1,13,167 8,205 20,769 1,42,141 118 1,750 1,44,010 11,08,499 2013-14 1,18,178 8,866 19,912 1,46,957 129 1,903 1,48,988 11,75,637 2014-15 1,28,401 9,720 21,135 1,59,256 145 2,656 1,62,057 12,78,907 2015-16 1,36,721 8,412 21,083 1,66,216 110 2,046 1,68,372 13,35,956 2016-17(P) 1,59,967 10,129 24,668 1,94,764 129 2,107 1,97,000 14,32,358 Growth rate of 2016-17 over 2015-16 (% )
17.00 20.41 17.00 17.18 17.00 3.00 17.00 7.22
CAGR 2007-08 to 2016-17(% )
11.56 -0.58 -0.36 8.04 -4.41 18.58 8.09 5.83
Source : Central Electricity Authority.
ThermalHydro ORS Total
(P)-Provisional
(Giga Watt hour= 10^6 x Kilo Watt hour)
Year
Table 3.6 (Continue) : Gross Generation of Electricity from utilities and non-utilities in India
Non-UtilitiesGrand Total
CHAPTER 4: FOREIGN TRADE IN COMMERCIAL SOURCES OF ENERGY
CHAPTER 4: FOREIGN TRADE IN COMMERCIAL SOURCES OF
ENERGY
4.1 Import and export of coal
The average quality of the Indian coal is not very high and this necessitates the import of high quality coal to meet the requirements of steel plants. There has been an increasing trend in the import of coal.
Import of coal has steadily increased from 49.79 MTs during 2007-08 to 190.95
MTs during 2016-17 (Table 4.1). During this period, the quantum of coal exported increased from 1.63 MTs during 2007-08 to 2.44 MT during 2012-13 and then decreased to 1.77 MTs during 2016-17.
The gross import decreased at 3.84% and net Import of coal decreased at 4.03% in
2016-17 over the previous year.However there was an increase of 27.22% in export of coal during the same period.
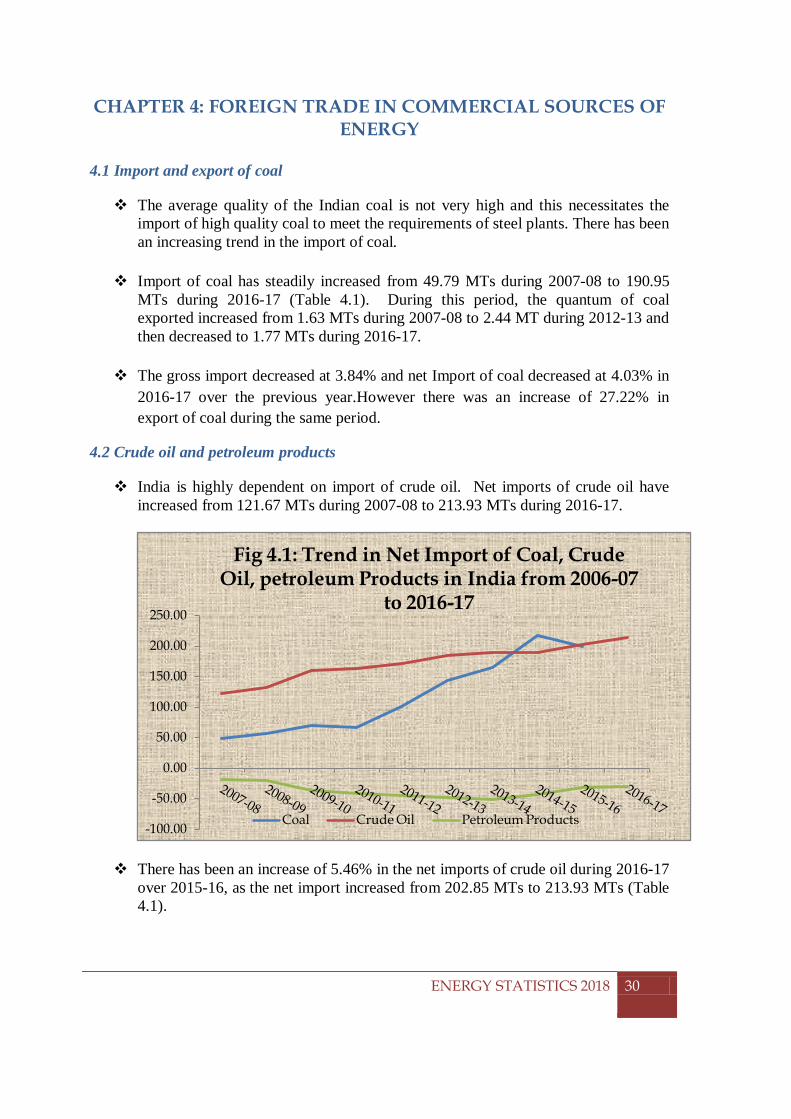
4.2 Crude oil and petroleum products
India is highly dependent on import of crude oil. Net imports of crude oil have increased from 121.67 MTs during 2007-08 to 213.93 MTs during 2016-17.
There has been an increase of 5.46% in the net imports of crude oil during 2016-17 over 2015-16, as the net import increased from 202.85 MTs to 213.93 MTs (Table 4.1).
-100.00
-50.00
0.00
50.00
100.00
150.00
200.00
250.00
Fig 4.1: Trend in Net Import of Coal, Crude Oil, petroleum Products in India from 2006-07
to 2016-17
Coal Crude Oil Petroleum Products
ENERGY STATISTICS 2018
30
CHAPTER 4: FOREIGN TRADE IN COMMERCIAL SOURCES OF ENERGY
The export of petroleum product has increased from40.75 MT during 2007-08 to
65.51 MTs during 2016-17. During 2016-17, exports recorded a increase of 8.22% from previous year (Table 4.1).
The import of petroleum products has increased from 22.46 MT in 2007-08 to
36.29 MT during 2016-17, although there are some fluctuations in the trend (Table 4.1). There is growth rate of 12.57% in import of petroleum products over the previous year.
4.3Natural Gas The gross import of natural gas has increased from 8.32 BCM in 2007-08 to 18.63
BCM in 2016-17, recording a CAGR of 8.40%.
4.4 Electricity The gross import of electricity has increased with a CAGR 0.72% during the
period 2007-08 (5230 GWh) to 2016-17 (5617 GWh). Similarly, the export of electricity has increased from 290 GWh in 2007-08 to 6710 GWh in 2016-17.
There was decrease in net import of electricity during 2007-08 to 2016-17 and percentage decrease in 2016-17 with respect to 2015-16 is (-) 1263.76%.
ENERGY STATISTICS 2018
31
CHAPTER 4: FOREIGN TRADE IN COMMERCIAL SOURCES OF ENERGY
(Download Table 4.1)
ENERGY STATISTICS 2018
32
YearGross Exports Net Gross Exports Net Gross Exports Net
Imports Imports Imports Imports Imports Imports1 2 3 4=(2)-(3) 5 6 7=(5)-(6) 8 9 10=(8)-(9)
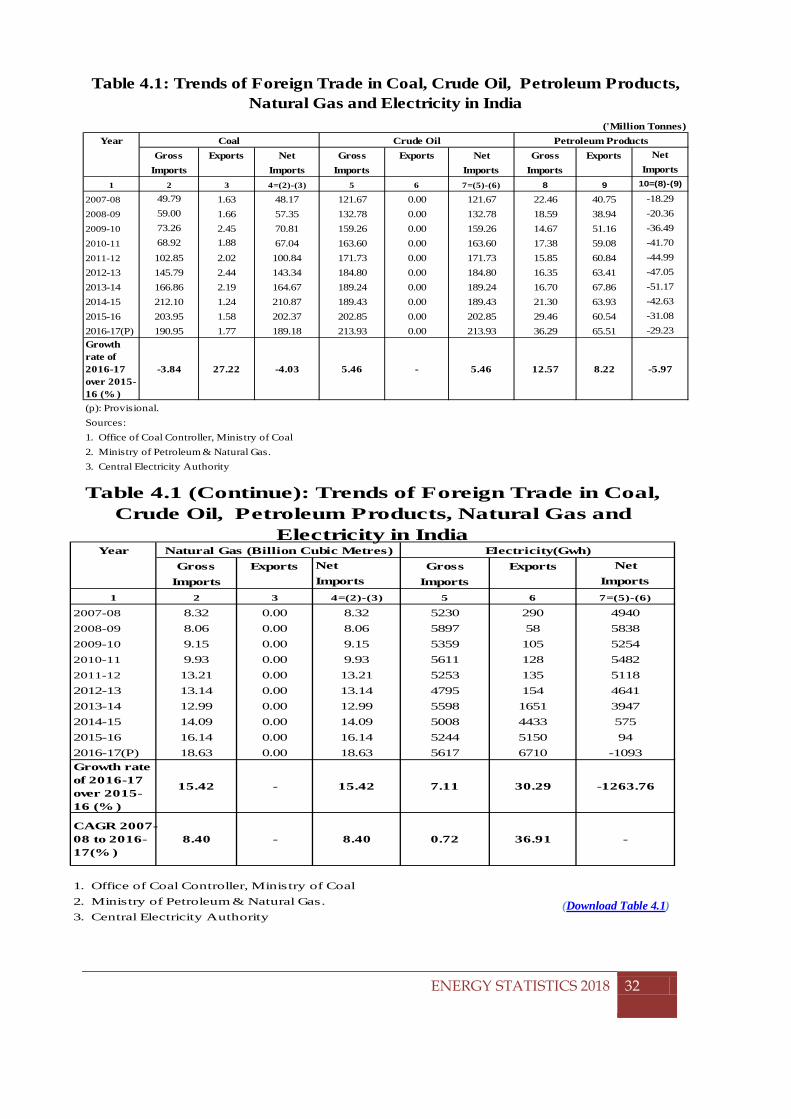
2007-08 49.79 1.63 48.17 121.67 0.00 121.67 22.46 40.75 -18.292008-09 59.00 1.66 57.35 132.78 0.00 132.78 18.59 38.94 -20.362009-10 73.26 2.45 70.81 159.26 0.00 159.26 14.67 51.16 -36.492010-11 68.92 1.88 67.04 163.60 0.00 163.60 17.38 59.08 -41.702011-12 102.85 2.02 100.84 171.73 0.00 171.73 15.85 60.84 -44.992012-13 145.79 2.44 143.34 184.80 0.00 184.80 16.35 63.41 -47.052013-14 166.86 2.19 164.67 189.24 0.00 189.24 16.70 67.86 -51.172014-15 212.10 1.24 210.87 189.43 0.00 189.43 21.30 63.93 -42.632015-16 203.95 1.58 202.37 202.85 0.00 202.85 29.46 60.54 -31.082016-17(P) 190.95 1.77 189.18 213.93 0.00 213.93 36.29 65.51 -29.23Growth rate of 2016-17 over 2015-16 (% )
-3.84 27.22 -4.03 5.46 - 5.46 12.57 8.22 -5.97
(p): Provisional.Sources:1. Office of Coal Controller, Ministry of Coal 2. Ministry of Petroleum & Natural Gas.3. Central Electricity Authority
Table 4.1: Trends of Foreign Trade in Coal, Crude Oil, Petroleum Products, Natural Gas and Electricity in India
('Million Tonnes)Coal Crude Oil Petroleum Products
YearGross Exports Net Gross Exports Net
Imports Imports Imports Imports1 2 3 4=(2)-(3) 5 6 7=(5)-(6)
2007-08 8.32 0.00 8.32 5230 290 49402008-09 8.06 0.00 8.06 5897 58 58382009-10 9.15 0.00 9.15 5359 105 52542010-11 9.93 0.00 9.93 5611 128 54822011-12 13.21 0.00 13.21 5253 135 51182012-13 13.14 0.00 13.14 4795 154 46412013-14 12.99 0.00 12.99 5598 1651 39472014-15 14.09 0.00 14.09 5008 4433 5752015-16 16.14 0.00 16.14 5244 5150 942016-17(P) 18.63 0.00 18.63 5617 6710 -1093Growth rate of 2016-17 over 2015-16 (% )
15.42 - 15.42 7.11 30.29 -1263.76
CAGR 2007-08 to 2016-17(% )
8.40 - 8.40 0.72 36.91 -
1. Office of Coal Controller, Ministry of Coal 2. Ministry of Petroleum & Natural Gas.3. Central Electricity Authority
Electricity(Gwh)
Table 4.1 (Continue): Trends of Foreign Trade in Coal, Crude Oil, Petroleum Products, Natural Gas and
Electricity in IndiaNatural Gas (Billion Cubic Metres)
CHAPTER 5: AVAILABILITY OF ENERGY SOURCES
CHAPTER 5: AVAILABILITY OF ENERGY SOURCES
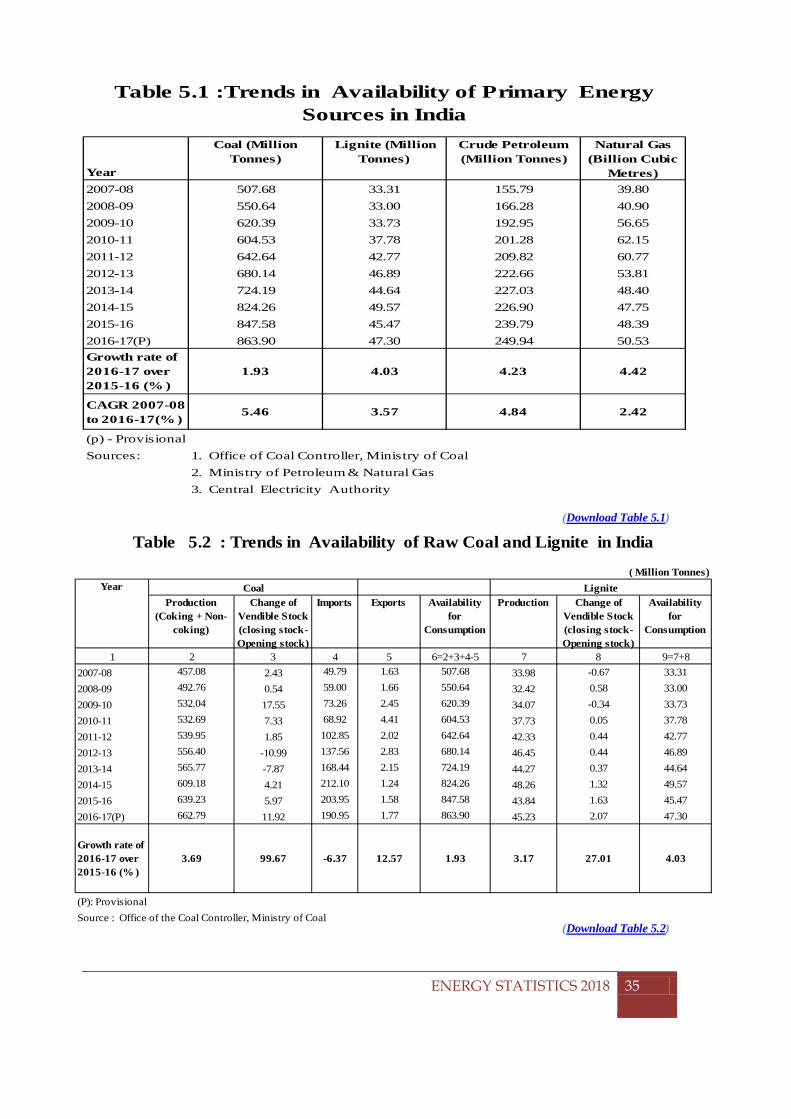
5.1 Availability of Coal and Lignite The total availability of raw coal in India in 2016-17 stood at 863.90 MTs and that
of lignite at 47.30 MTs (Table 5.1). The availability of coal in the year 2016-17 increased by 1.93% compared to 2015-
16. The availability of lignite increased by 4.03% during the same period. The availability of coal has increased at a CAGR of about 5.46% during the period
from 2007-08 to 2016-17. This increased availability might be attributed to the increase in the coal production (507.68 MTs during 2007-08 to 863.90 MTs during 2016-17) supplemented by imports (Table 5.2).
The availability of lignite has increased at a CAGR of about 4.03% during the period from 2007-08 to 2016-17 (Table 5.1).
5.2 Availability of Natural Gas
The availability of natural gas has steadily increased from a mere 39.80 BCM during 2007-08 to 50.53 BCM during 2016-17, registering a CAGR of 2.42%. Most of this increase in the indigenous production is due to discovery of new reserves.Table 5.1).
5.3 Availability of Crude Oil and Petroleum Products
The availability of crude oil in the country increased from 155.79 MTs in 2007-08
to 249.94 MTs during 2016-17 (Table 5.3). During this period, crude oil production increased from 34.12 MTs to 36.01 MTs
and the net import increased from 121.67 MTs to 213.93 MTs between 2007-08 and 2016-17. There was increase of 5.46% in availability of crude oil during 2016-17 over 2015-16.
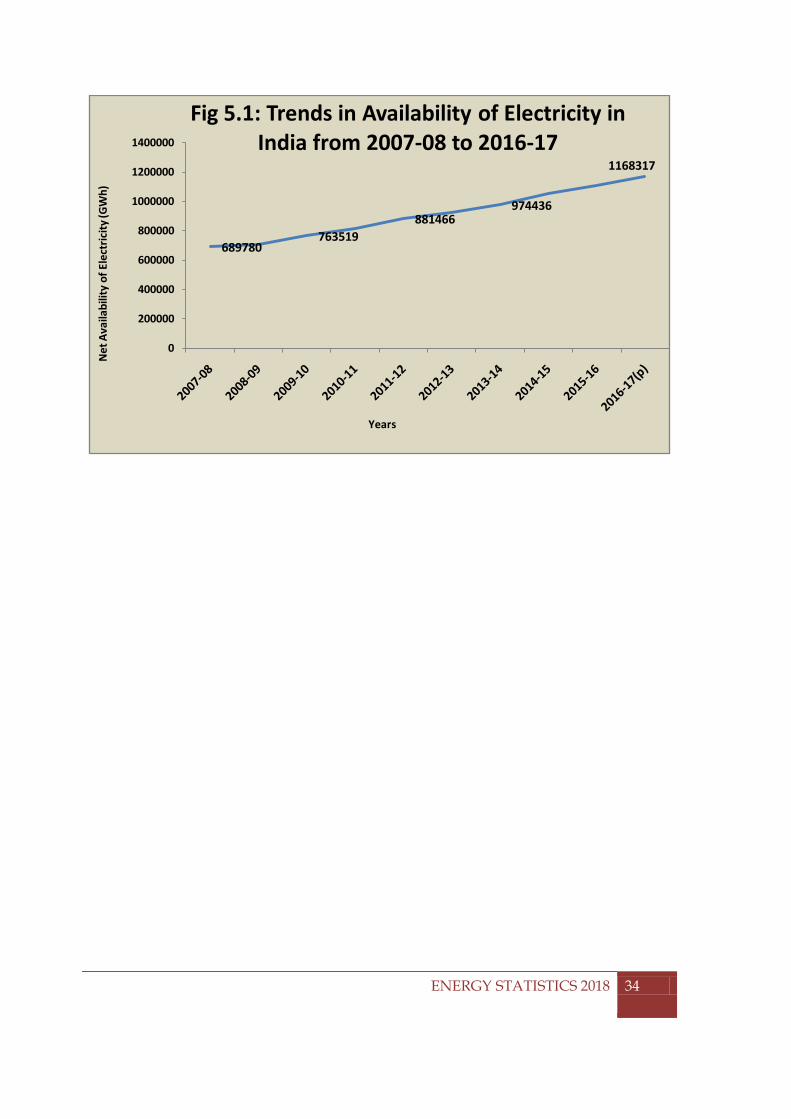
5.4 Availability of Electricity Electricity available for supply increased from 6,89,780Gwh in 2007-08 to
11,68,317 Gwh in 2016-17, thus recording a CAGR of 5.41% during this period. The availability of electricity increased at 5.80% in 2016-17 over its value in 2015-16.
ENERGY STATISTICS 2018
33
CHAPTER 5: AVAILABILITY OF ENERGY SOURCES
689780763519
881466974436
1168317
0
200000
400000
600000
800000
1000000
1200000
1400000
Net
Ava
ilabi
lity
of E
lect
ricity
(GW
h)
Years
Fig 5.1: Trends in Availability of Electricity in India from 2007-08 to 2016-17
ENERGY STATISTICS 2018
34
CHAPTER 5: AVAILABILITY OF ENERGY SOURCES
(Download Table 5.1)
(Download Table 5.2)
ENERGY STATISTICS 2018
35
Year
Coal (Million Tonnes)
Lignite (Million Tonnes)
Crude Petroleum (Million Tonnes)
Natural Gas (Billion Cubic
Metres)2007-08 507.68 33.31 155.79 39.802008-09 550.64 33.00 166.28 40.902009-10 620.39 33.73 192.95 56.652010-11 604.53 37.78 201.28 62.152011-12 642.64 42.77 209.82 60.772012-13 680.14 46.89 222.66 53.812013-14 724.19 44.64 227.03 48.402014-15 824.26 49.57 226.90 47.752015-16 847.58 45.47 239.79 48.392016-17(P) 863.90 47.30 249.94 50.53Growth rate of 2016-17 over 2015-16 (% )
1.93 4.03 4.23 4.42
CAGR 2007-08 to 2016-17(% )
5.46 3.57 4.84 2.42
Sources:2. Ministry of Petroleum & Natural Gas3. Central Electricity Authority
Table 5.1 :Trends in Availability of Primary Energy Sources in India
(p) - Provisional 1. Office of Coal Controller, Ministry of Coal
( Million Tonnes)
Production (Coking + Non-
coking)
Change of Vendible Stock (closing stock-Opening stock)
Imports Exports Availability for
Consumption
Production Change of Vendible Stock (closing stock-Opening stock)
Availability for
Consumption
1 2 3 4 5 6=2+3+4-5 7 8 9=7+82007-08 457.08 2.43 49.79 1.63 507.68 33.98 -0.67 33.312008-09 492.76 0.54 59.00 1.66 550.64 32.42 0.58 33.002009-10 532.04 17.55 73.26 2.45 620.39 34.07 -0.34 33.732010-11 532.69 7.33 68.92 4.41 604.53 37.73 0.05 37.782011-12 539.95 1.85 102.85 2.02 642.64 42.33 0.44 42.772012-13 556.40 -10.99 137.56 2.83 680.14 46.45 0.44 46.892013-14 565.77 -7.87 168.44 2.15 724.19 44.27 0.37 44.642014-15 609.18 4.21 212.10 1.24 824.26 48.26 1.32 49.572015-16 639.23 5.97 203.95 1.58 847.58 43.84 1.63 45.472016-17(P) 662.79 11.92 190.95 1.77 863.90 45.23 2.07 47.30
Growth rate of 2016-17 over 2015-16 (% )
3.69 99.67 -6.37 12.57 1.93 3.17 27.01 4.03
(P): ProvisionalSource : Office of the Coal Controller, Ministry of Coal
Table 5.2 : Trends in Availability of Raw Coal and Lignite in India
Year LigniteCoal
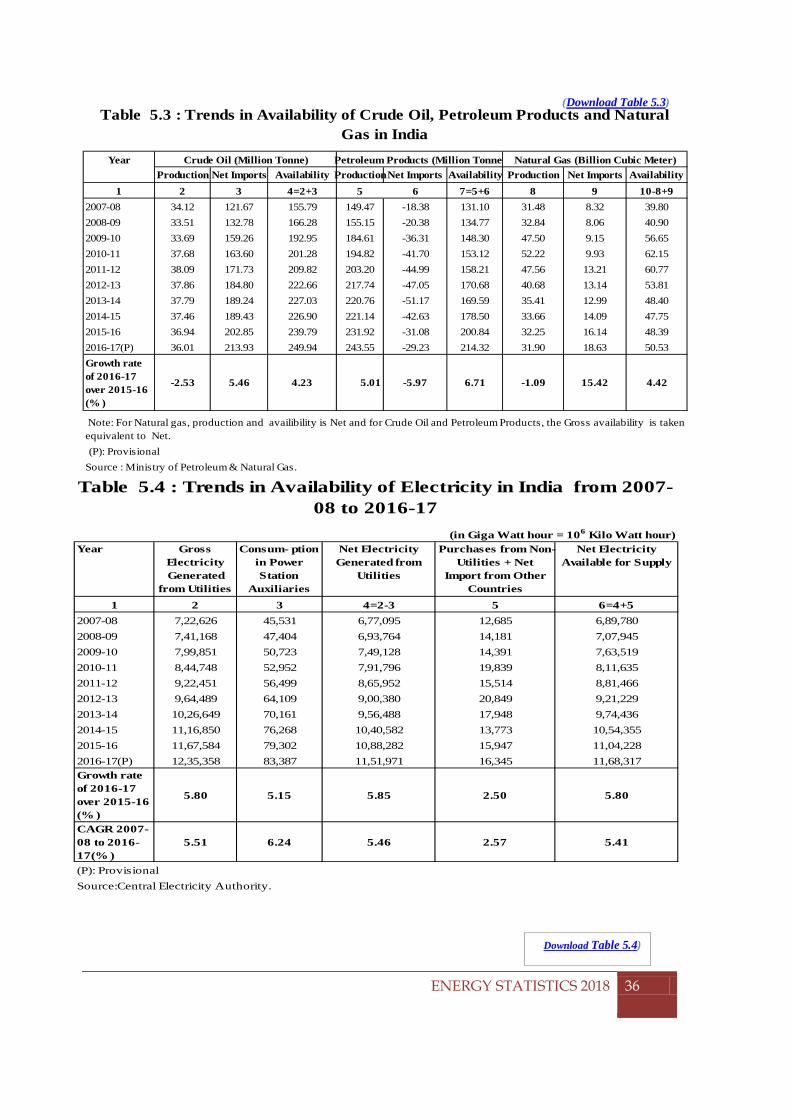
CHAPTER 5: AVAILABILITY OF ENERGY SOURCES
(Download Table 5.3)
Download Table 5.4)
ENERGY STATISTICS 2018
36
YearProduction Net Imports Availability ProductionNet Imports Availability Production Net Imports Availability
1 2 3 4=2+3 5 6 7=5+6 8 9 10-8+92007-08 34.12 121.67 155.79 149.47 -18.38 131.10 31.48 8.32 39.802008-09 33.51 132.78 166.28 155.15 -20.38 134.77 32.84 8.06 40.902009-10 33.69 159.26 192.95 184.61 -36.31 148.30 47.50 9.15 56.652010-11 37.68 163.60 201.28 194.82 -41.70 153.12 52.22 9.93 62.152011-12 38.09 171.73 209.82 203.20 -44.99 158.21 47.56 13.21 60.772012-13 37.86 184.80 222.66 217.74 -47.05 170.68 40.68 13.14 53.812013-14 37.79 189.24 227.03 220.76 -51.17 169.59 35.41 12.99 48.402014-15 37.46 189.43 226.90 221.14 -42.63 178.50 33.66 14.09 47.752015-16 36.94 202.85 239.79 231.92 -31.08 200.84 32.25 16.14 48.392016-17(P) 36.01 213.93 249.94 243.55 -29.23 214.32 31.90 18.63 50.53Growth rate of 2016-17 over 2015-16 (% )
-2.53 5.46 4.23 5.01 -5.97 6.71 -1.09 15.42 4.42
(P): ProvisionalSource : Ministry of Petroleum & Natural Gas.
Petroleum Products (Million Tonne
Note: For Natural gas, production and availibility is Net and for Crude Oil and Petroleum Products, the Gross availability is taken equivalent to Net.
Table 5.3 : Trends in Availability of Crude Oil, Petroleum Products and Natural Gas in India
Crude Oil (Million Tonne) Natural Gas (Billion Cubic Meter)
Year Gross Electricity Generated
from Utilities
Consum- ption in Power Station
Auxiliaries
Net Electricity Generated from
Utilities
Purchases from Non-Utilities + Net
Import from Other Countries
Net Electricity Available for Supply
1 2 3 4=2-3 5 6=4+52007-08 7,22,626 45,531 6,77,095 12,685 6,89,7802008-09 7,41,168 47,404 6,93,764 14,181 7,07,9452009-10 7,99,851 50,723 7,49,128 14,391 7,63,5192010-11 8,44,748 52,952 7,91,796 19,839 8,11,6352011-12 9,22,451 56,499 8,65,952 15,514 8,81,4662012-13 9,64,489 64,109 9,00,380 20,849 9,21,2292013-14 10,26,649 70,161 9,56,488 17,948 9,74,4362014-15 11,16,850 76,268 10,40,582 13,773 10,54,3552015-16 11,67,584 79,302 10,88,282 15,947 11,04,2282016-17(P) 12,35,358 83,387 11,51,971 16,345 11,68,317Growth rate of 2016-17 over 2015-16 (% )
5.80 5.15 5.85 2.50 5.80
CAGR 2007-08 to 2016-17(% )
5.51 6.24 5.46 2.57 5.41
(P): ProvisionalSource:Central Electricity Authority.
Table 5.4 : Trends in Availability of Electricity in India from 2007-08 to 2016-17
(in Giga Watt hour = 106 Kilo Watt hour)
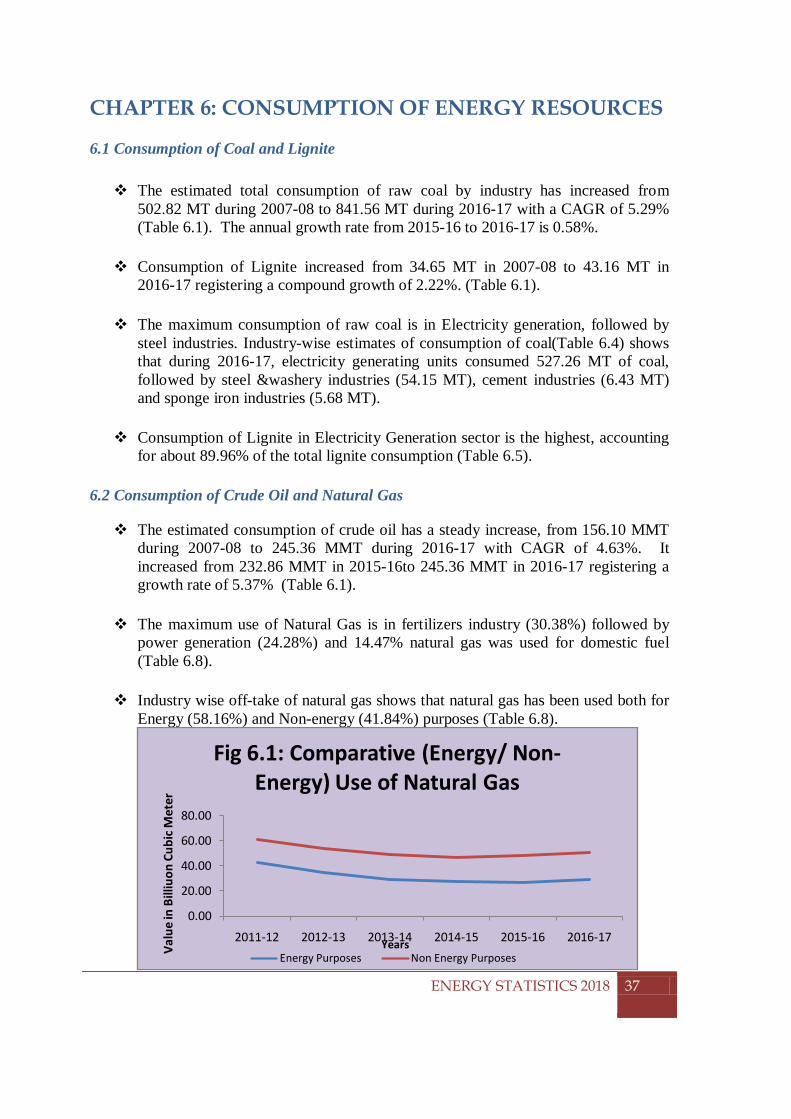
CHAPTER 6: CONSUMPTION OF ENERGY RESOURCES
CHAPTER 6: CONSUMPTION OF ENERGY RESOURCES 6.1 Consumption of Coal and Lignite
The estimated total consumption of raw coal by industry has increased from
502.82 MT during 2007-08 to 841.56 MT during 2016-17 with a CAGR of 5.29% (Table 6.1). The annual growth rate from 2015-16 to 2016-17 is 0.58%.
Consumption of Lignite increased from 34.65 MT in 2007-08 to 43.16 MT in
2016-17 registering a compound growth of 2.22%. (Table 6.1). The maximum consumption of raw coal is in Electricity generation, followed by
steel industries. Industry-wise estimates of consumption of coal(Table 6.4) shows that during 2016-17, electricity generating units consumed 527.26 MT of coal, followed by steel &washery industries (54.15 MT), cement industries (6.43 MT) and sponge iron industries (5.68 MT).
Consumption of Lignite in Electricity Generation sector is the highest, accounting for about 89.96% of the total lignite consumption (Table 6.5).
6.2 Consumption of Crude Oil and Natural Gas
The estimated consumption of crude oil has a steady increase, from 156.10 MMT during 2007-08 to 245.36 MMT during 2016-17 with CAGR of 4.63%. It increased from 232.86 MMT in 2015-16to 245.36 MMT in 2016-17 registering a growth rate of 5.37% (Table 6.1).
The maximum use of Natural Gas is in fertilizers industry (30.38%) followed by
power generation (24.28%) and 14.47% natural gas was used for domestic fuel (Table 6.8).
Industry wise off-take of natural gas shows that natural gas has been used both for Energy (58.16%) and Non-energy (41.84%) purposes (Table 6.8).
0.00
20.00
40.00
60.00
80.00
2011-12 2012-13 2013-14 2014-15 2015-16 2016-17
Valu
e in
Bill
iuon
Cub
ic M
eter
Years
Fig 6.1: Comparative (Energy/ Non-Energy) Use of Natural Gas
Energy Purposes Non Energy Purposes
ENERGY STATISTICS 2018
37
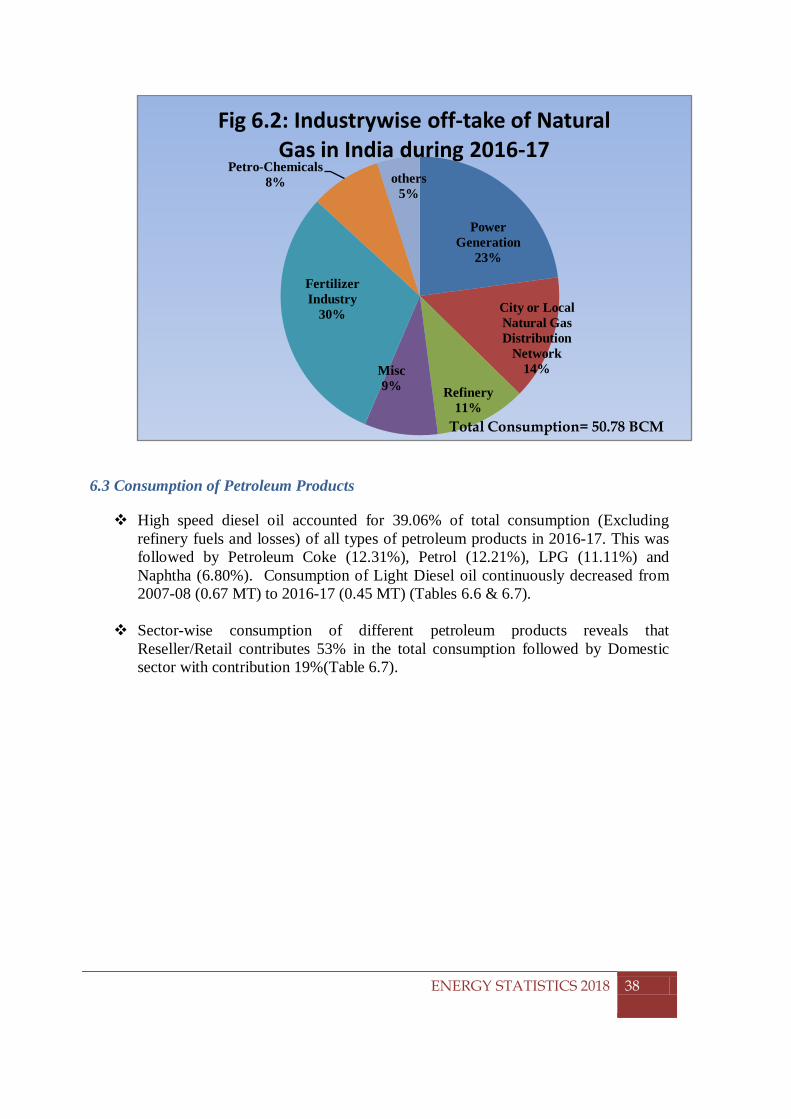
CHAPTER 6: CONSUMPTION OF ENERGY RESOURCES
6.3 Consumption of Petroleum Products
High speed diesel oil accounted for 39.06% of total consumption (Excluding refinery fuels and losses) of all types of petroleum products in 2016-17. This was followed by Petroleum Coke (12.31%), Petrol (12.21%), LPG (11.11%) and Naphtha (6.80%). Consumption of Light Diesel oil continuously decreased from 2007-08 (0.67 MT) to 2016-17 (0.45 MT) (Tables 6.6 & 6.7).
Sector-wise consumption of different petroleum products reveals that Reseller/Retail contributes 53% in the total consumption followed by Domestic sector with contribution 19%(Table 6.7).
Power Generation
23%
City or Local Natural Gas Distribution
Network14%
Refinery11%
Misc9%
Fertilizer Industry
30%
Petro-Chemicals8% others
5%
Fig 6.2: Industrywise off-take of Natural Gas in India during 2016-17
Total Consumption= 50.78 BCM
ENERGY STATISTICS 2018
38
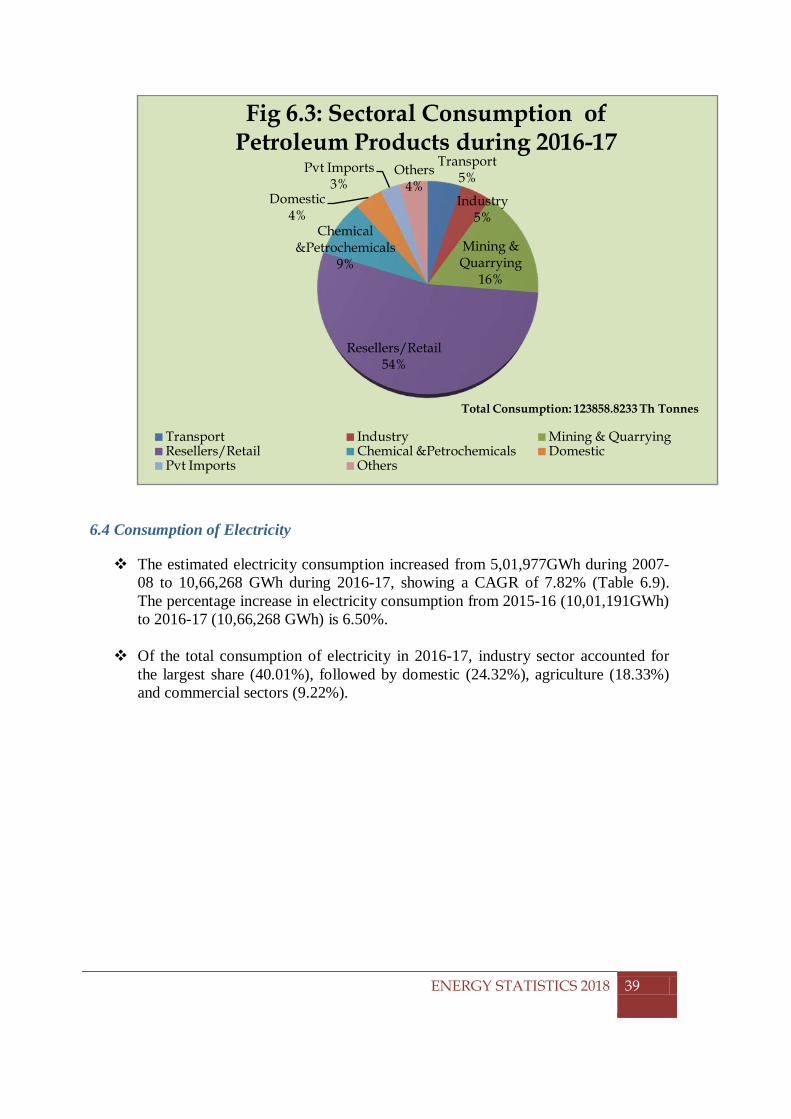
CHAPTER 6: CONSUMPTION OF ENERGY RESOURCES
6.4 Consumption of Electricity
The estimated electricity consumption increased from 5,01,977GWh during 2007-08 to 10,66,268 GWh during 2016-17, showing a CAGR of 7.82% (Table 6.9). The percentage increase in electricity consumption from 2015-16 (10,01,191GWh) to 2016-17 (10,66,268 GWh) is 6.50%.
Of the total consumption of electricity in 2016-17, industry sector accounted for the largest share (40.01%), followed by domestic (24.32%), agriculture (18.33%) and commercial sectors (9.22%).
Transport5%
Industry5%
Mining & Quarrying
16%
Resellers/Retail54%
Chemical &Petrochemicals
9%
Domestic4%
Pvt Imports3%
Others4%
Fig 6.3: Sectoral Consumption of Petroleum Products during 2016-17
Transport Industry Mining & QuarryingResellers/Retail Chemical &Petrochemicals DomesticPvt Imports Others
Total Consumption: 123858.8233 Th Tonnes
ENERGY STATISTICS 2018
39
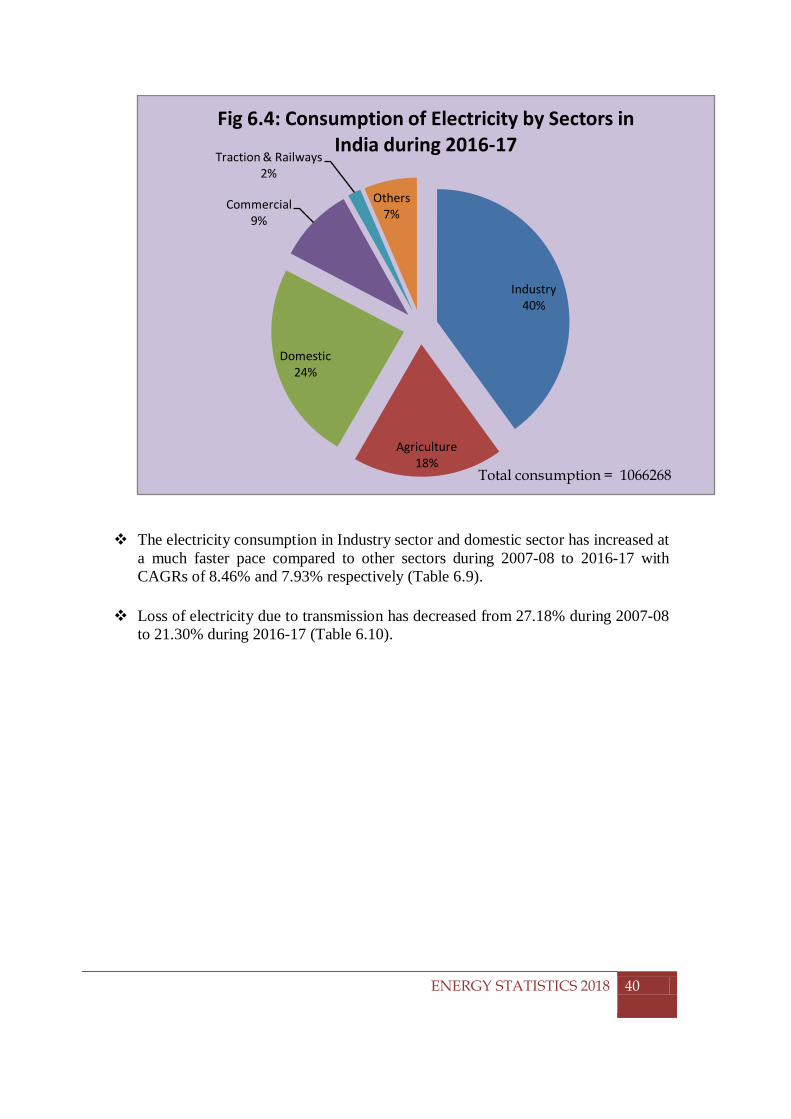
CHAPTER 6: CONSUMPTION OF ENERGY RESOURCES
The electricity consumption in Industry sector and domestic sector has increased at
a much faster pace compared to other sectors during 2007-08 to 2016-17 with CAGRs of 8.46% and 7.93% respectively (Table 6.9).
Loss of electricity due to transmission has decreased from 27.18% during 2007-08
to 21.30% during 2016-17 (Table 6.10).
Industry40%
Agriculture18%
Domestic24%
Commercial9%
Traction & Railways2%
Others7%
Fig 6.4: Consumption of Electricity by Sectors in India during 2016-17
Total consumption = 1066268
ENERGY STATISTICS 2018
40
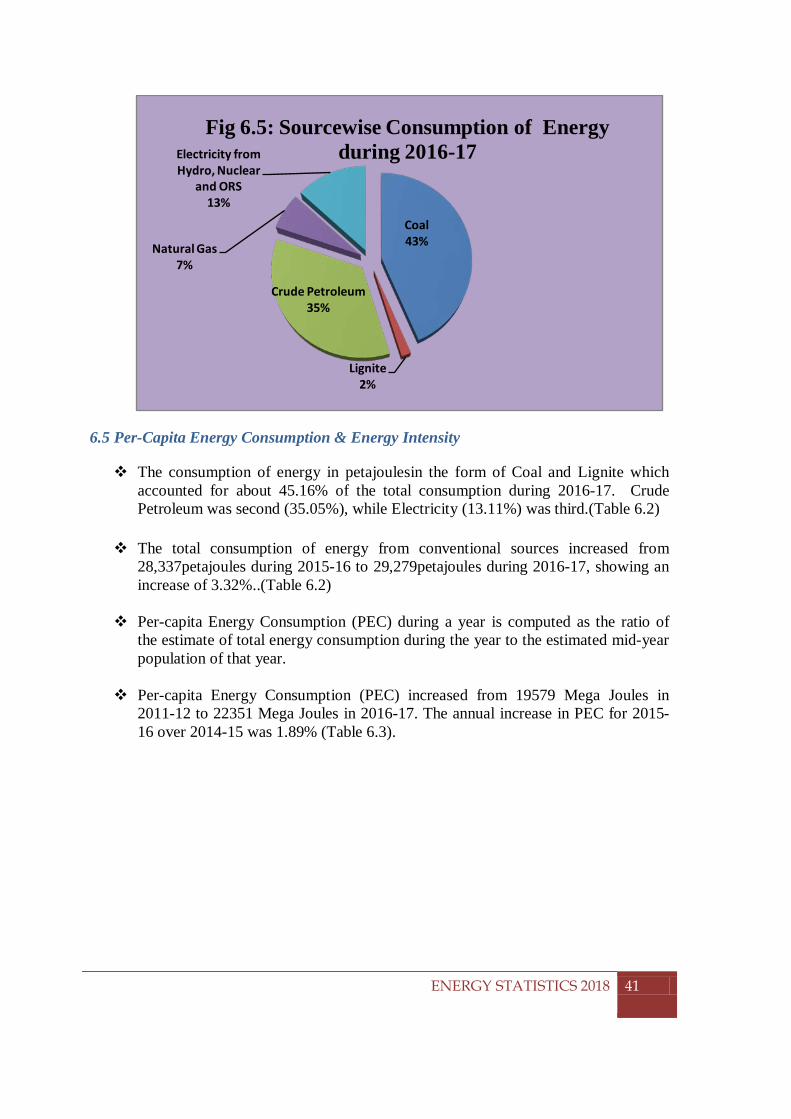
CHAPTER 6: CONSUMPTION OF ENERGY RESOURCES
6.5 Per-Capita Energy Consumption & Energy Intensity
The consumption of energy in petajoulesin the form of Coal and Lignite which accounted for about 45.16% of the total consumption during 2016-17. Crude Petroleum was second (35.05%), while Electricity (13.11%) was third.(Table 6.2)
The total consumption of energy from conventional sources increased from
28,337petajoules during 2015-16 to 29,279petajoules during 2016-17, showing an increase of 3.32%..(Table 6.2)
Per-capita Energy Consumption (PEC) during a year is computed as the ratio of the estimate of total energy consumption during the year to the estimated mid-year population of that year.
Per-capita Energy Consumption (PEC) increased from 19579 Mega Joules in 2011-12 to 22351 Mega Joules in 2016-17. The annual increase in PEC for 2015-16 over 2014-15 was 1.89% (Table 6.3).
Coal 43%
Lignite2%
Crude Petroleum35%
Natural Gas7%
Electricity from Hydro, Nuclear
and ORS13%
Fig 6.5: Sourcewise Consumption of Energy during 2016-17
ENERGY STATISTICS 2018
41
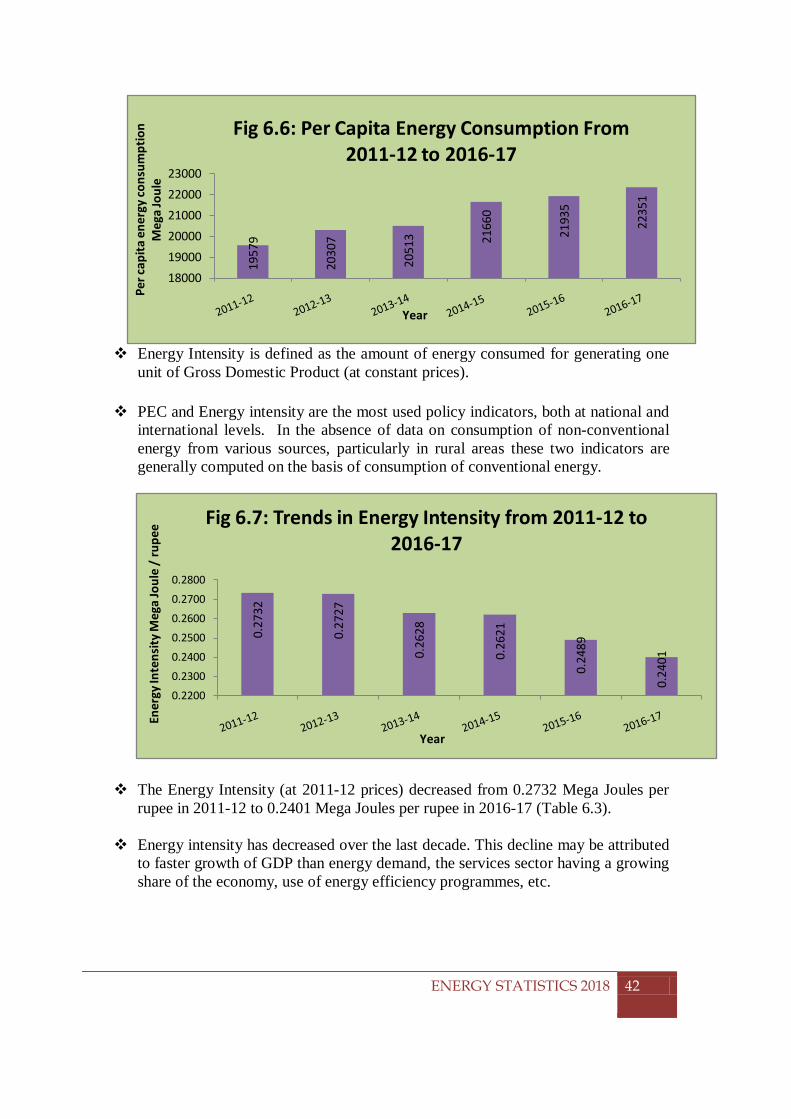
CHAPTER 6: CONSUMPTION OF ENERGY RESOURCES
Energy Intensity is defined as the amount of energy consumed for generating one
unit of Gross Domestic Product (at constant prices).
PEC and Energy intensity are the most used policy indicators, both at national and international levels. In the absence of data on consumption of non-conventional energy from various sources, particularly in rural areas these two indicators are generally computed on the basis of consumption of conventional energy.
The Energy Intensity (at 2011-12 prices) decreased from 0.2732 Mega Joules per rupee in 2011-12 to 0.2401 Mega Joules per rupee in 2016-17 (Table 6.3).
Energy intensity has decreased over the last decade. This decline may be attributed to faster growth of GDP than energy demand, the services sector having a growing share of the economy, use of energy efficiency programmes, etc.
1957
9
2030
7
2051
3 2166
0
2193
5
2235
1
180001900020000210002200023000
Per c
apita
ene
rgy
cons
umpt
ion
Meg
a Jo
ule
Year
Fig 6.6: Per Capita Energy Consumption From 2011-12 to 2016-17
0.27
32
0.27
27
0.26
28
0.26
21
0.24
89
0.24
01
0.2200
0.2300
0.2400
0.2500
0.2600
0.2700
0.2800
Ener
gy In
tens
ity M
ega
Joul
e /
rupe
e
Year
Fig 6.7: Trends in Energy Intensity from 2011-12 to 2016-17
ENERGY STATISTICS 2018
42
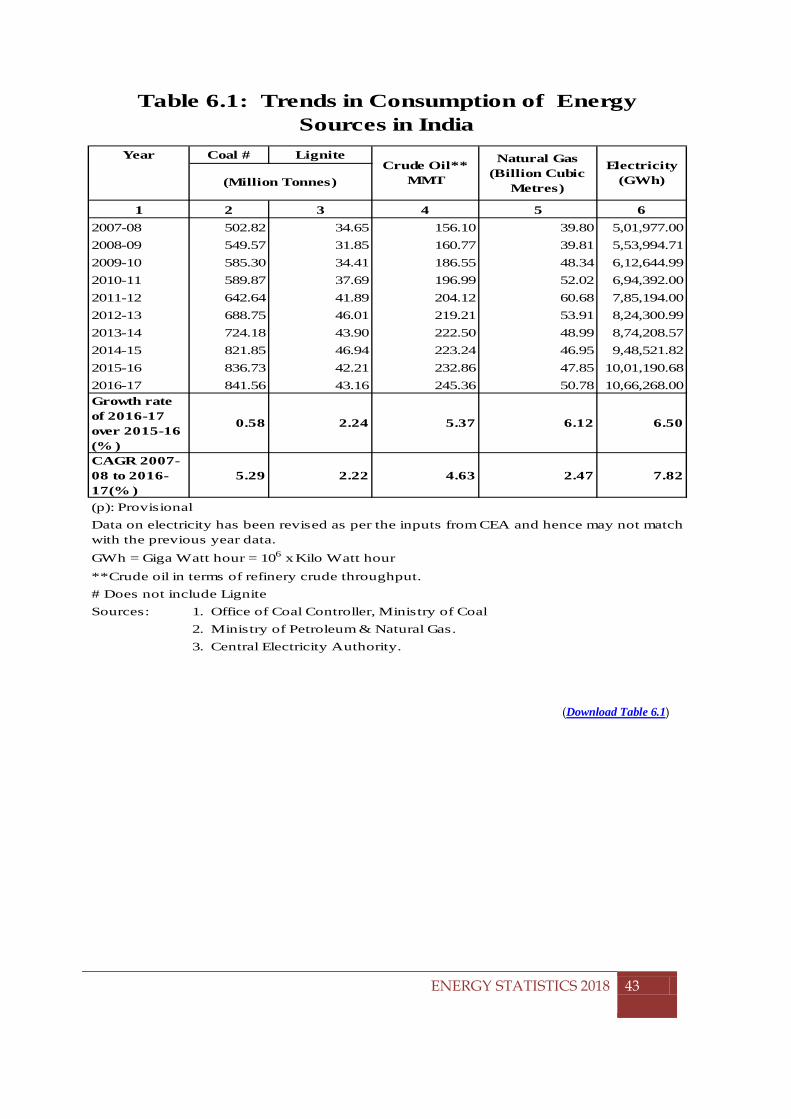
CHAPTER 6: CONSUMPTION OF ENERGY RESOURCES
(Download Table 6.1)
ENERGY STATISTICS 2018
43
Year Coal # Lignite
1 2 3 4 5 62007-08 502.82 34.65 156.10 39.80 5,01,977.002008-09 549.57 31.85 160.77 39.81 5,53,994.712009-10 585.30 34.41 186.55 48.34 6,12,644.992010-11 589.87 37.69 196.99 52.02 6,94,392.002011-12 642.64 41.89 204.12 60.68 7,85,194.002012-13 688.75 46.01 219.21 53.91 8,24,300.992013-14 724.18 43.90 222.50 48.99 8,74,208.572014-15 821.85 46.94 223.24 46.95 9,48,521.822015-16 836.73 42.21 232.86 47.85 10,01,190.682016-17 841.56 43.16 245.36 50.78 10,66,268.00Growth rate of 2016-17 over 2015-16 (% )
0.58 2.24 5.37 6.12 6.50
CAGR 2007-08 to 2016-17(% )
5.29 2.22 4.63 2.47 7.82
(p): Provisional
GWh = Giga Watt hour = 106 x Kilo Watt hour**Crude oil in terms of refinery crude throughput.# Does not include Lignite Sources: 1. Office of Coal Controller, Ministry of Coal
2. Ministry of Petroleum & Natural Gas.3. Central Electricity Authority.
Data on electricity has been revised as per the inputs from CEA and hence may not match with the previous year data.
Table 6.1: Trends in Consumption of Energy Sources in India
Natural Gas (Billion Cubic
Metres)
Electricity (GWh)(Million Tonnes)
Crude Oil** MMT
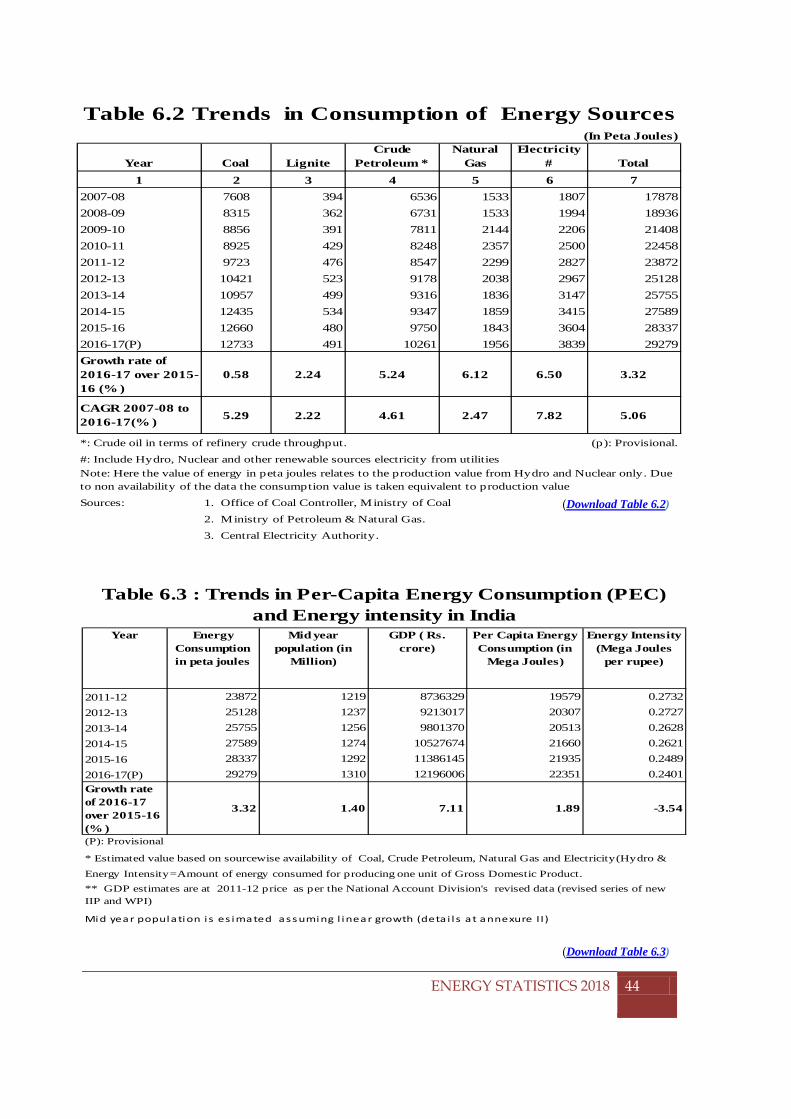
CHAPTER 6: CONSUMPTION OF ENERGY RESOURCES
(Download Table 6.2)
(Download Table 6.3)
ENERGY STATISTICS 2018
44
(In Peta Joules)
Year Coal LigniteCrude
Petroleum *Natural
GasElectricity
# Total1 2 3 4 5 6 7
2007-08 7608 394 6536 1533 1807 178782008-09 8315 362 6731 1533 1994 189362009-10 8856 391 7811 2144 2206 214082010-11 8925 429 8248 2357 2500 224582011-12 9723 476 8547 2299 2827 238722012-13 10421 523 9178 2038 2967 251282013-14 10957 499 9316 1836 3147 257552014-15 12435 534 9347 1859 3415 275892015-16 12660 480 9750 1843 3604 283372016-17(P) 12733 491 10261 1956 3839 29279Growth rate of 2016-17 over 2015-16 (% )
0.58 2.24 5.24 6.12 6.50 3.32
CAGR 2007-08 to 2016-17(% ) 5.29 2.22 4.61 2.47 7.82 5.06
*: Crude oil in terms of refinery crude throughput. (p): Provisional.
#: Include Hydro, Nuclear and other renewable sources electricity from utilities
Sources:
Table 6.2 Trends in Consumption of Energy Sources
Note: Here the value of energy in peta joules relates to the production value from Hydro and Nuclear only. Due to non availability of the data the consumption value is taken equivalent to production value
1. Office of Coal Controller, Ministry of Coal
2. Ministry of Petroleum & Natural Gas.
3. Central Electricity Authority.
Year Energy Consumption in peta joules
Mid year population (in
Million)
GDP ( Rs. crore)
Per Capita Energy Consumption (in
Mega Joules)
Energy Intensity (Mega Joules
per rupee)
2011-12 23872 1219 8736329 19579 0.27322012-13 25128 1237 9213017 20307 0.27272013-14 25755 1256 9801370 20513 0.26282014-15 27589 1274 10527674 21660 0.26212015-16 28337 1292 11386145 21935 0.24892016-17(P) 29279 1310 12196006 22351 0.2401Growth rate of 2016-17 over 2015-16 (% )
3.32 1.40 7.11 1.89 -3.54
Table 6.3 : Trends in Per-Capita Energy Consumption (PEC) and Energy intensity in India
* Estimated value based on sourcewise availability of Coal, Crude Petroleum, Natural Gas and Electricity(Hydro & Energy Intensity=Amount of energy consumed for producing one unit of Gross Domestic Product.
** GDP estimates are at 2011-12 price as per the National Account Division's revised data (revised series of new IIP and WPI)
(P): Provisional
Mid year population i s es imated assuming l inear growth (deta i l s at annexure II)
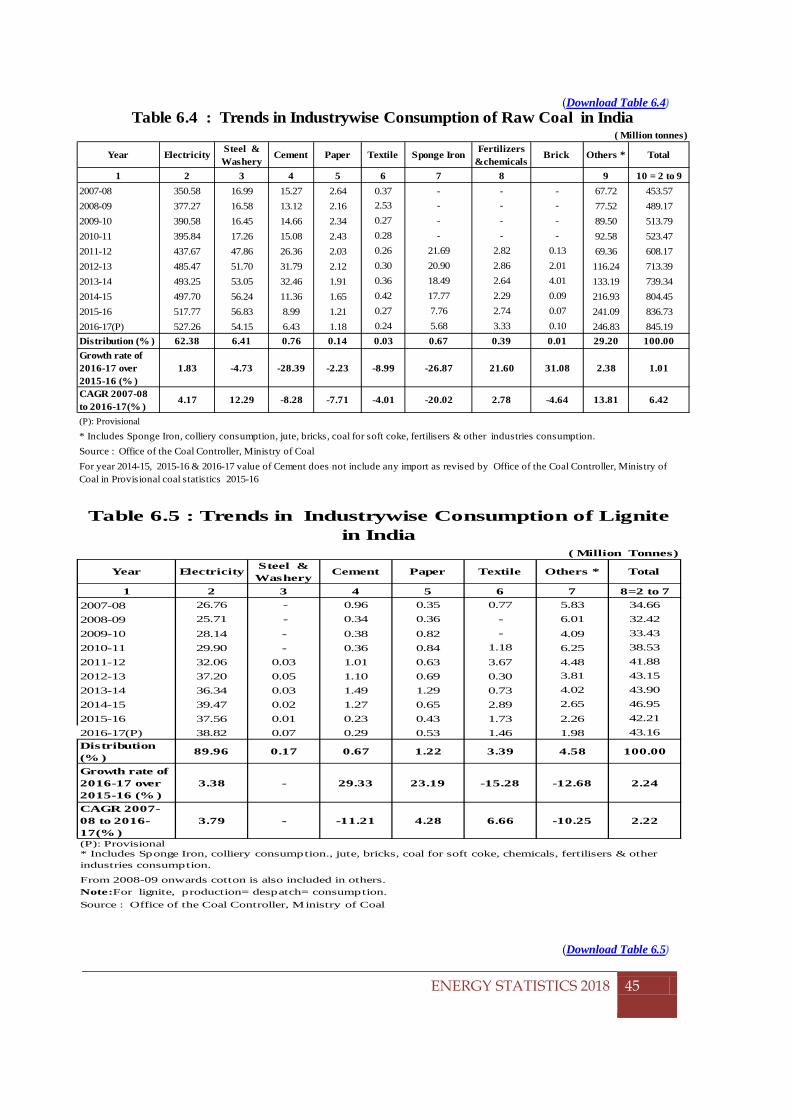
CHAPTER 6: CONSUMPTION OF ENERGY RESOURCES
(Download Table 6.4)
(Download Table 6.5)
ENERGY STATISTICS 2018
45
( Million tonnes)
Year Electricity Steel & Washery
Cement Paper Textile Sponge Iron Fertilizers &chemicals
Brick Others * Total
1 2 3 4 5 6 7 8 9 10 = 2 to 92007-08 350.58 16.99 15.27 2.64 0.37 - - - 67.72 453.572008-09 377.27 16.58 13.12 2.16 2.53 - - - 77.52 489.172009-10 390.58 16.45 14.66 2.34 0.27 - - - 89.50 513.792010-11 395.84 17.26 15.08 2.43 0.28 - - - 92.58 523.472011-12 437.67 47.86 26.36 2.03 0.26 21.69 2.82 0.13 69.36 608.172012-13 485.47 51.70 31.79 2.12 0.30 20.90 2.86 2.01 116.24 713.392013-14 493.25 53.05 32.46 1.91 0.36 18.49 2.64 4.01 133.19 739.342014-15 497.70 56.24 11.36 1.65 0.42 17.77 2.29 0.09 216.93 804.452015-16 517.77 56.83 8.99 1.21 0.27 7.76 2.74 0.07 241.09 836.732016-17(P) 527.26 54.15 6.43 1.18 0.24 5.68 3.33 0.10 246.83 845.19Distribution (% ) 62.38 6.41 0.76 0.14 0.03 0.67 0.39 0.01 29.20 100.00Growth rate of 2016-17 over 2015-16 (% )
1.83 -4.73 -28.39 -2.23 -8.99 -26.87 21.60 31.08 2.38 1.01
CAGR 2007-08 to 2016-17(% )
4.17 12.29 -8.28 -7.71 -4.01 -20.02 2.78 -4.64 13.81 6.42
(P): Provisional
* Includes Sponge Iron, colliery consumption, jute, bricks, coal for soft coke, fertilisers & other industries consumption.Source : Office of the Coal Controller, Ministry of Coal
Table 6.4 : Trends in Industrywise Consumption of Raw Coal in India
For year 2014-15, 2015-16 & 2016-17 value of Cement does not include any import as revised by Office of the Coal Controller, Ministry of Coal in Provisional coal statistics 2015-16
( Million Tonnes)
Year Electricity Steel & Washery
Cement Paper Textile Others * Total
1 2 3 4 5 6 7 8=2 to 72007-08 26.76 - 0.96 0.35 0.77 5.83 34.662008-09 25.71 - 0.34 0.36 - 6.01 32.422009-10 28.14 - 0.38 0.82 - 4.09 33.432010-11 29.90 - 0.36 0.84 1.18 6.25 38.532011-12 32.06 0.03 1.01 0.63 3.67 4.48 41.882012-13 37.20 0.05 1.10 0.69 0.30 3.81 43.152013-14 36.34 0.03 1.49 1.29 0.73 4.02 43.902014-15 39.47 0.02 1.27 0.65 2.89 2.65 46.952015-16 37.56 0.01 0.23 0.43 1.73 2.26 42.212016-17(P) 38.82 0.07 0.29 0.53 1.46 1.98 43.16Distribution (% )
89.96 0.17 0.67 1.22 3.39 4.58 100.00
Growth rate of 2016-17 over 2015-16 (% )
3.38 - 29.33 23.19 -15.28 -12.68 2.24
CAGR 2007-08 to 2016-17(% )
3.79 - -11.21 4.28 6.66 -10.25 2.22
From 2008-09 onwards cotton is also included in others.
Source : Office of the Coal Controller, Ministry of Coal
Table 6.5 : Trends in Industrywise Consumption of Lignite in India
* Includes Sponge Iron, colliery consumption., jute, bricks, coal for soft coke, chemicals, fertilisers & other industries consumption.
Note:For lignite, production= despatch= consumption.
(P): Provisional
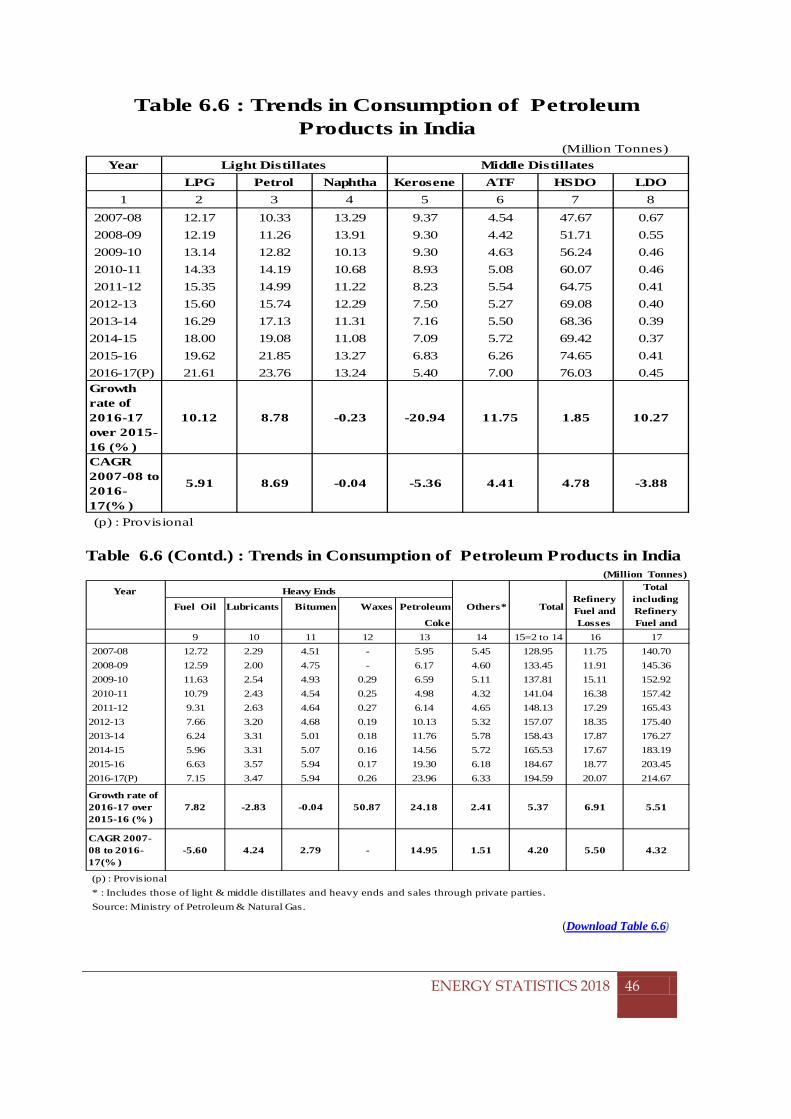
CHAPTER 6: CONSUMPTION OF ENERGY RESOURCES
(Download Table 6.6)
ENERGY STATISTICS 2018
46
(Million Tonnes)Year
LPG Petrol Naphtha Kerosene ATF HSDO LDO1 2 3 4 5 6 7 8
2007-08 12.17 10.33 13.29 9.37 4.54 47.67 0.672008-09 12.19 11.26 13.91 9.30 4.42 51.71 0.552009-10 13.14 12.82 10.13 9.30 4.63 56.24 0.462010-11 14.33 14.19 10.68 8.93 5.08 60.07 0.462011-12 15.35 14.99 11.22 8.23 5.54 64.75 0.41
2012-13 15.60 15.74 12.29 7.50 5.27 69.08 0.402013-14 16.29 17.13 11.31 7.16 5.50 68.36 0.392014-15 18.00 19.08 11.08 7.09 5.72 69.42 0.372015-16 19.62 21.85 13.27 6.83 6.26 74.65 0.412016-17(P) 21.61 23.76 13.24 5.40 7.00 76.03 0.45Growth rate of 2016-17 over 2015-16 (% )
10.12 8.78 -0.23 -20.94 11.75 1.85 10.27
CAGR 2007-08 to 2016-17(% )
5.91 8.69 -0.04 -5.36 4.41 4.78 -3.88
(p) : Provisional
Table 6.6 : Trends in Consumption of Petroleum Products in India
Light Distillates Middle Distillates
Year
Fuel Oil Lubricants Bitumen Waxes Petroleum Others* Total
Coke9 10 11 12 13 14 15=2 to 14 16 17
2007-08 12.72 2.29 4.51 - 5.95 5.45 128.95 11.75 140.702008-09 12.59 2.00 4.75 - 6.17 4.60 133.45 11.91 145.362009-10 11.63 2.54 4.93 0.29 6.59 5.11 137.81 15.11 152.922010-11 10.79 2.43 4.54 0.25 4.98 4.32 141.04 16.38 157.422011-12 9.31 2.63 4.64 0.27 6.14 4.65 148.13 17.29 165.43
2012-13 7.66 3.20 4.68 0.19 10.13 5.32 157.07 18.35 175.402013-14 6.24 3.31 5.01 0.18 11.76 5.78 158.43 17.87 176.272014-15 5.96 3.31 5.07 0.16 14.56 5.72 165.53 17.67 183.192015-16 6.63 3.57 5.94 0.17 19.30 6.18 184.67 18.77 203.452016-17(P) 7.15 3.47 5.94 0.26 23.96 6.33 194.59 20.07 214.67
Growth rate of 2016-17 over 2015-16 (% )
7.82 -2.83 -0.04 50.87 24.18 2.41 5.37 6.91 5.51
CAGR 2007-08 to 2016-17(% )
-5.60 4.24 2.79 - 14.95 1.51 4.20 5.50 4.32
(p) : Provisional* : Includes those of light & middle distillates and heavy ends and sales through private parties.Source: Ministry of Petroleum & Natural Gas.
Heavy EndsRefinery Fuel and Losses
Total including Refinery Fuel and
(Million Tonnes)
Table 6.6 (Contd.) : Trends in Consumption of Petroleum Products in India
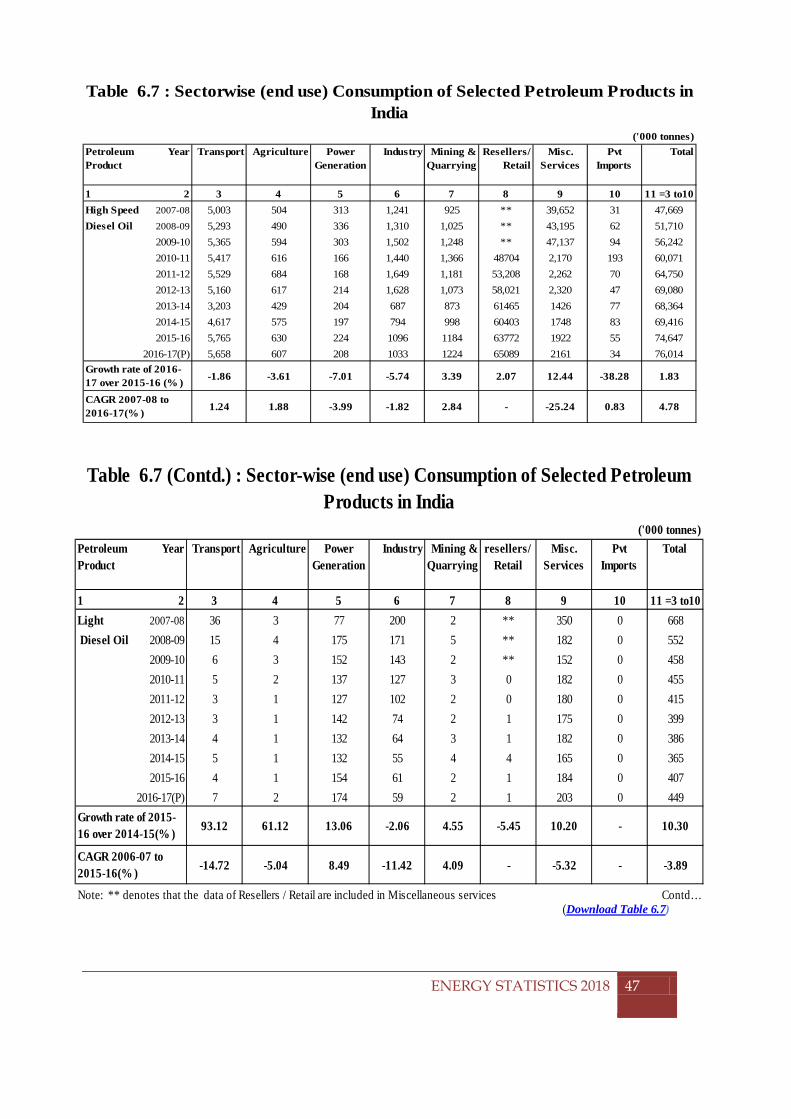
CHAPTER 6: CONSUMPTION OF ENERGY RESOURCES
(Download Table 6.7)
ENERGY STATISTICS 2018
47
('000 tonnes)Petroleum Product
Year Transport Agriculture Power Generation
Industry Mining & Quarrying
Resellers/Retail
Misc. Services
Pvt Imports
Total
1 2 3 4 5 6 7 8 9 10 11 =3 to10High Speed 2007-08 5,003 504 313 1,241 925 ** 39,652 31 47,669Diesel Oil 2008-09 5,293 490 336 1,310 1,025 ** 43,195 62 51,710
2009-10 5,365 594 303 1,502 1,248 ** 47,137 94 56,2422010-11 5,417 616 166 1,440 1,366 48704 2,170 193 60,0712011-12 5,529 684 168 1,649 1,181 53,208 2,262 70 64,7502012-13 5,160 617 214 1,628 1,073 58,021 2,320 47 69,0802013-14 3,203 429 204 687 873 61465 1426 77 68,3642014-15 4,617 575 197 794 998 60403 1748 83 69,4162015-16 5,765 630 224 1096 1184 63772 1922 55 74,647
2016-17(P) 5,658 607 208 1033 1224 65089 2161 34 76,014
-1.86 -3.61 -7.01 -5.74 3.39 2.07 12.44 -38.28 1.83
1.24 1.88 -3.99 -1.82 2.84 - -25.24 0.83 4.78
Table 6.7 : Sectorwise (end use) Consumption of Selected Petroleum Products in India
Growth rate of 2016-17 over 2015-16 (% )CAGR 2007-08 to 2016-17(% )
('000 tonnes)Petroleum Product
Year Transport Agriculture Power Generation
Industry Mining & Quarrying
resellers/Retail
Misc. Services
Pvt Imports
Total
1 2 3 4 5 6 7 8 9 10 11 =3 to10Light 2007-08 36 3 77 200 2 ** 350 0 668 Diesel Oil 2008-09 15 4 175 171 5 ** 182 0 552
2009-10 6 3 152 143 2 ** 152 0 4582010-11 5 2 137 127 3 0 182 0 4552011-12 3 1 127 102 2 0 180 0 4152012-13 3 1 142 74 2 1 175 0 3992013-14 4 1 132 64 3 1 182 0 3862014-15 5 1 132 55 4 4 165 0 3652015-16 4 1 154 61 2 1 184 0 407
2016-17(P) 7 2 174 59 2 1 203 0 449
93.12 61.12 13.06 -2.06 4.55 -5.45 10.20 - 10.30
-14.72 -5.04 8.49 -11.42 4.09 - -5.32 - -3.89
Note: ** denotes that the data of Resellers / Retail are included in Miscellaneous services Contd…
Growth rate of 2015-16 over 2014-15(% )
CAGR 2006-07 to 2015-16(% )
Table 6.7 (Contd.) : Sector-wise (end use) Consumption of Selected Petroleum Products in India
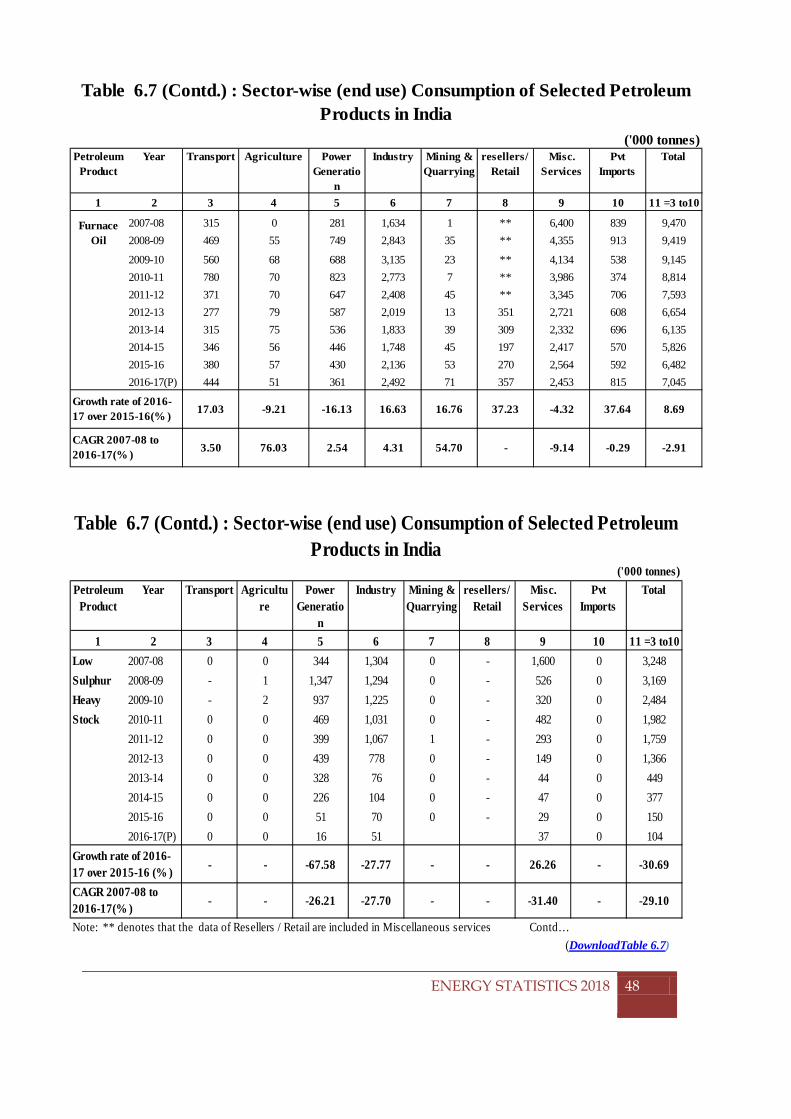
CHAPTER 6: CONSUMPTION OF ENERGY RESOURCES
(DownloadTable 6.7)
ENERGY STATISTICS 2018
48
('000 tonnes)Petroleum
ProductYear Transport Agricultu
rePower
Generation
Industry Mining & Quarrying
resellers/Retail
Misc. Services
Pvt Imports
Total
1 2 3 4 5 6 7 8 9 10 11 =3 to10Low 2007-08 0 0 344 1,304 0 - 1,600 0 3,248Sulphur 2008-09 - 1 1,347 1,294 0 - 526 0 3,169Heavy 2009-10 - 2 937 1,225 0 - 320 0 2,484Stock 2010-11 0 0 469 1,031 0 - 482 0 1,982
2011-12 0 0 399 1,067 1 - 293 0 1,7592012-13 0 0 439 778 0 - 149 0 1,3662013-14 0 0 328 76 0 - 44 0 4492014-15 0 0 226 104 0 - 47 0 3772015-16 0 0 51 70 0 - 29 0 1502016-17(P) 0 0 16 51 37 0 104
- - -67.58 -27.77 - - 26.26 - -30.69
- - -26.21 -27.70 - - -31.40 - -29.10
Note: ** denotes that the data of Resellers / Retail are included in Miscellaneous services Contd…
Growth rate of 2016-17 over 2015-16 (% )CAGR 2007-08 to 2016-17(% )
Table 6.7 (Contd.) : Sector-wise (end use) Consumption of Selected Petroleum Products in India
('000 tonnes)Petroleum
ProductYear Transport Agriculture Power
Generation
Industry Mining & Quarrying
resellers/Retail
Misc. Services
Pvt Imports
Total
1 2 3 4 5 6 7 8 9 10 11 =3 to10
2007-08 315 0 281 1,634 1 ** 6,400 839 9,4702008-09 469 55 749 2,843 35 ** 4,355 913 9,419
2009-10 560 68 688 3,135 23 ** 4,134 538 9,1452010-11 780 70 823 2,773 7 ** 3,986 374 8,8142011-12 371 70 647 2,408 45 ** 3,345 706 7,5932012-13 277 79 587 2,019 13 351 2,721 608 6,6542013-14 315 75 536 1,833 39 309 2,332 696 6,1352014-15 346 56 446 1,748 45 197 2,417 570 5,8262015-16 380 57 430 2,136 53 270 2,564 592 6,4822016-17(P) 444 51 361 2,492 71 357 2,453 815 7,045
17.03 -9.21 -16.13 16.63 16.76 37.23 -4.32 37.64 8.69
3.50 76.03 2.54 4.31 54.70 - -9.14 -0.29 -2.91
Table 6.7 (Contd.) : Sector-wise (end use) Consumption of Selected Petroleum Products in India
Growth rate of 2016-17 over 2015-16(% )
CAGR 2007-08 to 2016-17(% )
Furnace Oil
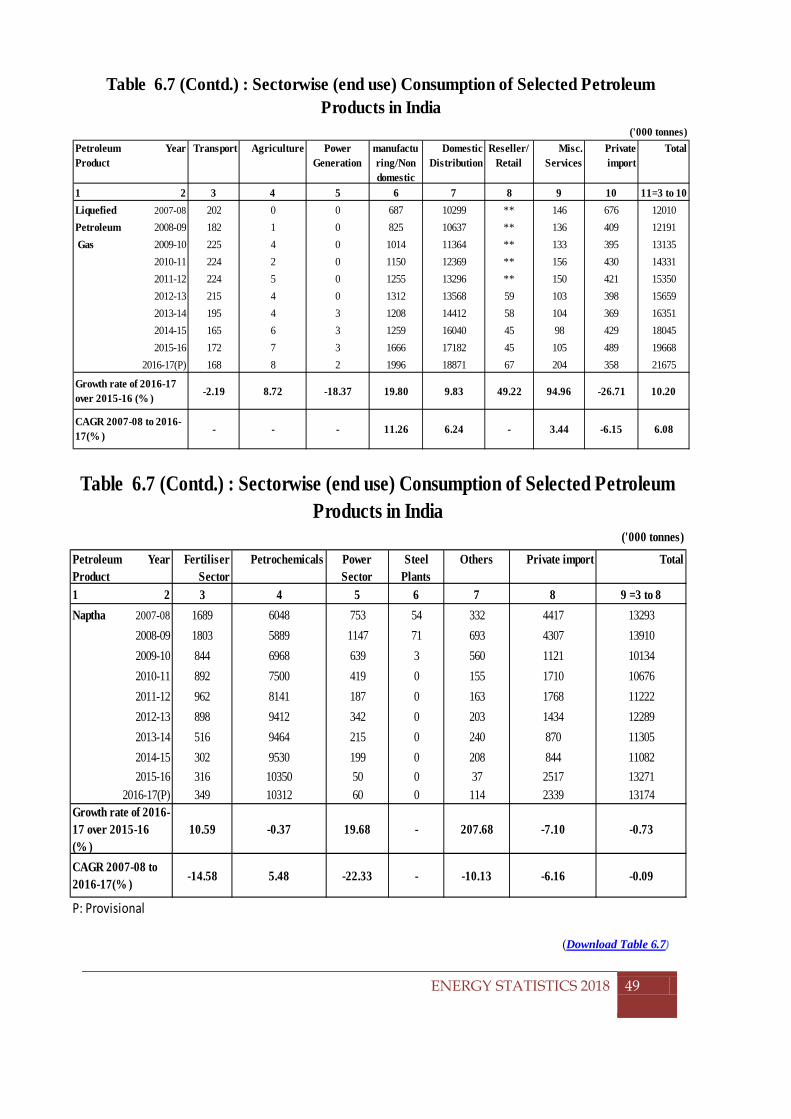
CHAPTER 6: CONSUMPTION OF ENERGY RESOURCES
(Download Table 6.7)
ENERGY STATISTICS 2018
49
('000 tonnes)
Petroleum Product
Year Fertiliser Sector
Petrochemicals Power Sector
Steel Plants
Others Private import Total
1 2 3 4 5 6 7 8 9 =3 to 8Naptha 2007-08 1689 6048 753 54 332 4417 13293
2008-09 1803 5889 1147 71 693 4307 139102009-10 844 6968 639 3 560 1121 101342010-11 892 7500 419 0 155 1710 106762011-12 962 8141 187 0 163 1768 112222012-13 898 9412 342 0 203 1434 122892013-14 516 9464 215 0 240 870 113052014-15 302 9530 199 0 208 844 110822015-16 316 10350 50 0 37 2517 13271
2016-17(P) 349 10312 60 0 114 2339 13174
10.59 -0.37 19.68 - 207.68 -7.10 -0.73
-14.58 5.48 -22.33 - -10.13 -6.16 -0.09
P: Provisional
Table 6.7 (Contd.) : Sectorwise (end use) Consumption of Selected Petroleum Products in India
Growth rate of 2016-17 over 2015-16 (% )CAGR 2007-08 to 2016-17(% )
('000 tonnes)Petroleum Product
Year Transport Agriculture Power Generation
manufacturing/Non domestic
Domestic Distribution
Reseller/Retail
Misc. Services
Private import
Total
1 2 3 4 5 6 7 8 9 10 11=3 to 10Liquefied 2007-08 202 0 0 687 10299 ** 146 676 12010Petroleum 2008-09 182 1 0 825 10637 ** 136 409 12191 Gas 2009-10 225 4 0 1014 11364 ** 133 395 13135
2010-11 224 2 0 1150 12369 ** 156 430 143312011-12 224 5 0 1255 13296 ** 150 421 153502012-13 215 4 0 1312 13568 59 103 398 156592013-14 195 4 3 1208 14412 58 104 369 163512014-15 165 6 3 1259 16040 45 98 429 180452015-16 172 7 3 1666 17182 45 105 489 19668
2016-17(P) 168 8 2 1996 18871 67 204 358 21675
-2.19 8.72 -18.37 19.80 9.83 49.22 94.96 -26.71 10.20
- - - 11.26 6.24 - 3.44 -6.15 6.08
Table 6.7 (Contd.) : Sectorwise (end use) Consumption of Selected Petroleum Products in India
Growth rate of 2016-17 over 2015-16 (% )
CAGR 2007-08 to 2016-17(% )
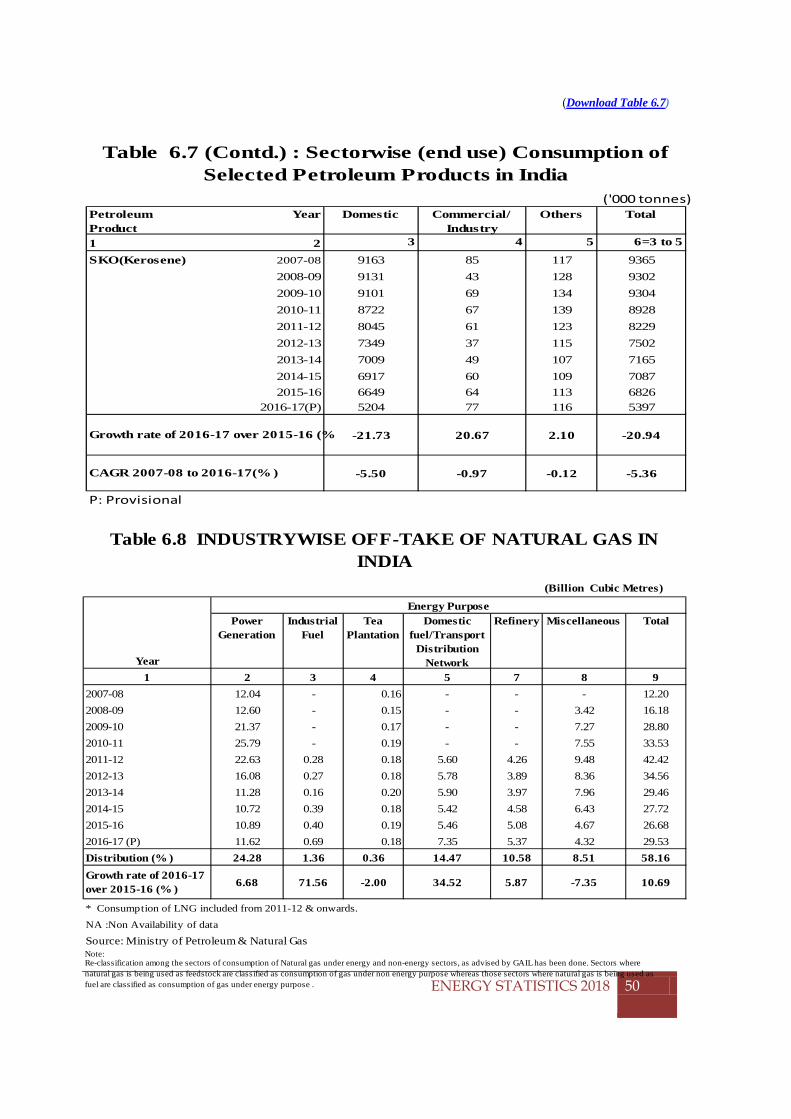
CHAPTER 6: CONSUMPTION OF ENERGY RESOURCES
(Download Table 6.7)
ENERGY STATISTICS 2018
50
('000 tonnes)Petroleum Product
Year Domestic Commercial/ Industry
Others Total
1 2 3 4 5 6=3 to 5
SKO(Kerosene) 2007-08 9163 85 117 93652008-09 9131 43 128 93022009-10 9101 69 134 93042010-11 8722 67 139 89282011-12 8045 61 123 82292012-13 7349 37 115 75022013-14 7009 49 107 71652014-15 6917 60 109 70872015-16 6649 64 113 6826
2016-17(P) 5204 77 116 5397
-21.73 20.67 2.10 -20.94
-5.50 -0.97 -0.12 -5.36
P: Provisional
Growth rate of 2016-17 over 2015-16 (%
CAGR 2007-08 to 2016-17(% )
Table 6.7 (Contd.) : Sectorwise (end use) Consumption of Selected Petroleum Products in India
(Billion Cubic Metres)
Power Generation
Industrial Fuel
Tea Plantation
Domestic fuel/Transport
Distribution Network
Refinery Miscellaneous Total
1 2 3 4 5 7 8 92007-08 12.04 - 0.16 - - - 12.202008-09 12.60 - 0.15 - - 3.42 16.182009-10 21.37 - 0.17 - - 7.27 28.802010-11 25.79 - 0.19 - - 7.55 33.532011-12 22.63 0.28 0.18 5.60 4.26 9.48 42.422012-13 16.08 0.27 0.18 5.78 3.89 8.36 34.562013-14 11.28 0.16 0.20 5.90 3.97 7.96 29.462014-15 10.72 0.39 0.18 5.42 4.58 6.43 27.722015-16 10.89 0.40 0.19 5.46 5.08 4.67 26.682016-17 (P) 11.62 0.69 0.18 7.35 5.37 4.32 29.53Distribution (% ) 24.28 1.36 0.36 14.47 10.58 8.51 58.16Growth rate of 2016-17 over 2015-16 (% ) 6.68 71.56 -2.00 34.52 5.87 -7.35 10.69
* Consumption of LNG included from 2011-12 & onwards.
NA :Non Availability of data
Table 6.8 INDUSTRYWISE OFF-TAKE OF NATURAL GAS IN INDIA
Source: Ministry of Petroleum & Natural Gas
Year
Energy Purpose
Note:Re-classification among the sectors of consumption of Natural gas under energy and non-energy sectors, as advised by GAIL has been done. Sectors where natural gas is being used as feedstock are classified as consumption of gas under non energy purpose whereas those sectors where natural gas is being used as fuel are classified as consumption of gas under energy purpose .
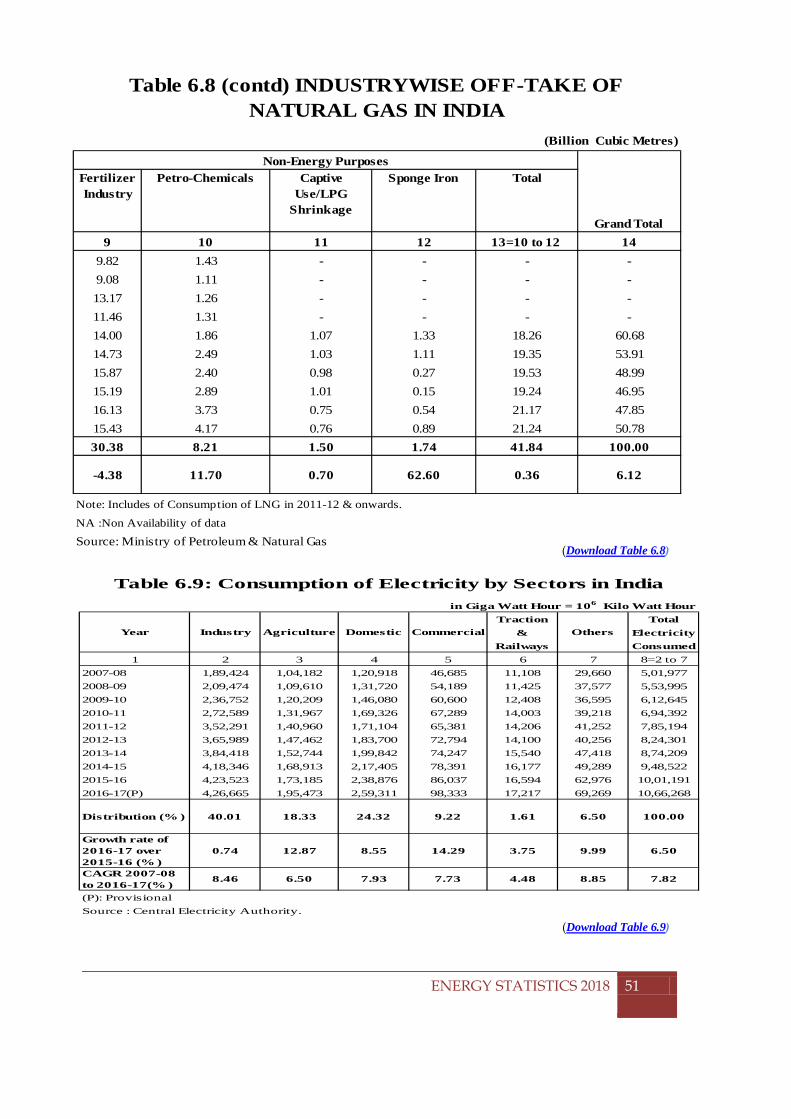
CHAPTER 6: CONSUMPTION OF ENERGY RESOURCES
(Download Table 6.8)
(Download Table 6.9)
ENERGY STATISTICS 2018
51
Fertilizer Industry
Petro-Chemicals Captive Use/LPG
Shrinkage
Sponge Iron Total
9 10 11 12 13=10 to 12 149.82 1.43 - - - -9.08 1.11 - - - -13.17 1.26 - - - -11.46 1.31 - - - -14.00 1.86 1.07 1.33 18.26 60.6814.73 2.49 1.03 1.11 19.35 53.9115.87 2.40 0.98 0.27 19.53 48.9915.19 2.89 1.01 0.15 19.24 46.9516.13 3.73 0.75 0.54 21.17 47.8515.43 4.17 0.76 0.89 21.24 50.7830.38 8.21 1.50 1.74 41.84 100.00
-4.38 11.70 0.70 62.60 0.36 6.12
Note: Includes of Consumption of LNG in 2011-12 & onwards.
NA :Non Availability of data
Grand Total
Table 6.8 (contd) INDUSTRYWISE OFF-TAKE OF NATURAL GAS IN INDIA
(Billion Cubic Metres)
Source: Ministry of Petroleum & Natural Gas
Non-Energy Purposes
Traction Total& Electricity
Railways Consumed1 2 3 4 5 6 7 8=2 to 7
2007-08 1,89,424 1,04,182 1,20,918 46,685 11,108 29,660 5,01,9772008-09 2,09,474 1,09,610 1,31,720 54,189 11,425 37,577 5,53,9952009-10 2,36,752 1,20,209 1,46,080 60,600 12,408 36,595 6,12,6452010-11 2,72,589 1,31,967 1,69,326 67,289 14,003 39,218 6,94,3922011-12 3,52,291 1,40,960 1,71,104 65,381 14,206 41,252 7,85,1942012-13 3,65,989 1,47,462 1,83,700 72,794 14,100 40,256 8,24,3012013-14 3,84,418 1,52,744 1,99,842 74,247 15,540 47,418 8,74,2092014-15 4,18,346 1,68,913 2,17,405 78,391 16,177 49,289 9,48,5222015-16 4,23,523 1,73,185 2,38,876 86,037 16,594 62,976 10,01,1912016-17(P) 4,26,665 1,95,473 2,59,311 98,333 17,217 69,269 10,66,268
Distribution (% ) 40.01 18.33 24.32 9.22 1.61 6.50 100.00
Growth rate of 2016-17 over 2015-16 (% )
0.74 12.87 8.55 14.29 3.75 9.99 6.50
CAGR 2007-08 to 2016-17(% )
8.46 6.50 7.93 7.73 4.48 8.85 7.82
(P): ProvisionalSource : Central Electricity Authority.
Table 6.9: Consumption of Electricity by Sectors in India in Giga Watt Hour = 106 Kilo Watt Hour
Year Industry Agriculture Domestic Commercial Others
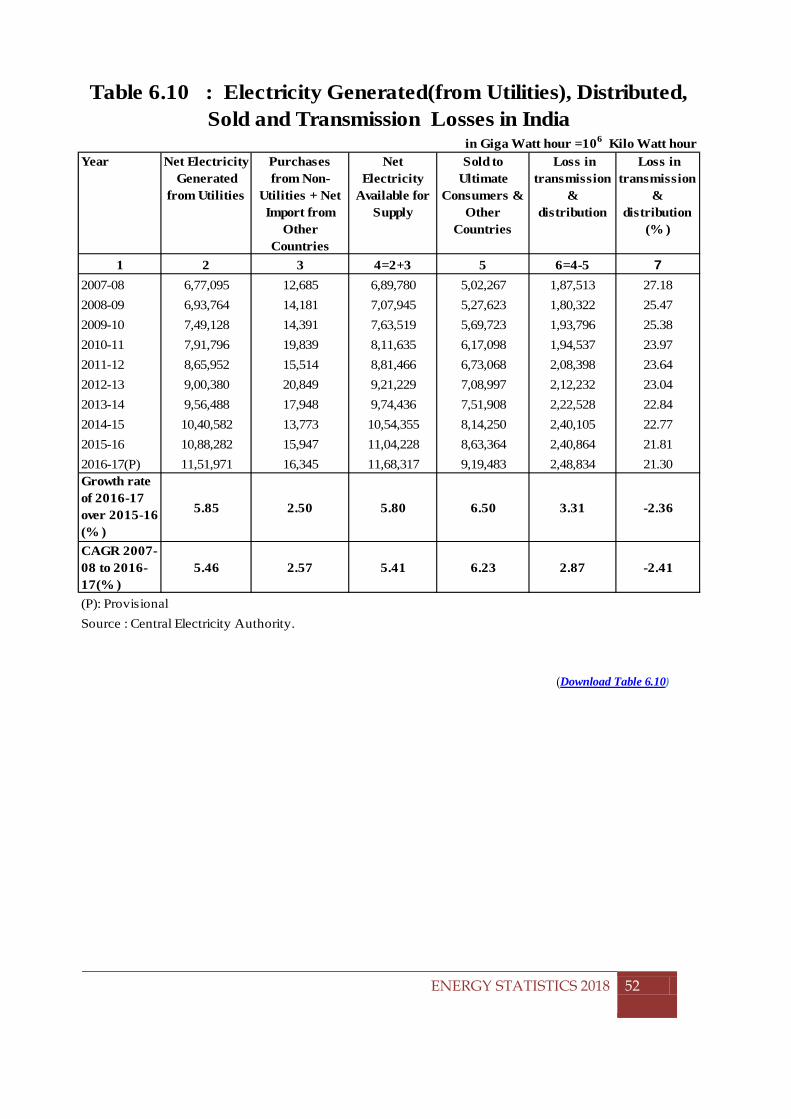
CHAPTER 6: CONSUMPTION OF ENERGY RESOURCES
(Download Table 6.10)
ENERGY STATISTICS 2018
52
Year Net Electricity Generated
from Utilities
Purchases from Non-
Utilities + Net Import from
Other Countries
Net Electricity
Available for Supply
Sold to Ultimate
Consumers & Other
Countries
Loss in transmission
& distribution
Loss in transmission
& distribution
(% )
1 2 3 4=2+3 5 6=4-5 72007-08 6,77,095 12,685 6,89,780 5,02,267 1,87,513 27.182008-09 6,93,764 14,181 7,07,945 5,27,623 1,80,322 25.472009-10 7,49,128 14,391 7,63,519 5,69,723 1,93,796 25.382010-11 7,91,796 19,839 8,11,635 6,17,098 1,94,537 23.972011-12 8,65,952 15,514 8,81,466 6,73,068 2,08,398 23.642012-13 9,00,380 20,849 9,21,229 7,08,997 2,12,232 23.042013-14 9,56,488 17,948 9,74,436 7,51,908 2,22,528 22.842014-15 10,40,582 13,773 10,54,355 8,14,250 2,40,105 22.772015-16 10,88,282 15,947 11,04,228 8,63,364 2,40,864 21.812016-17(P) 11,51,971 16,345 11,68,317 9,19,483 2,48,834 21.30Growth rate of 2016-17 over 2015-16 (% )
5.85 2.50 5.80 6.50 3.31 -2.36
CAGR 2007-08 to 2016-17(% )
5.46 2.57 5.41 6.23 2.87 -2.41
(P): ProvisionalSource : Central Electricity Authority.
Table 6.10 : Electricity Generated(from Utilities), Distributed, Sold and Transmission Losses in India
in Giga Watt hour =106 Kilo Watt hour
CHAPTER 7: ENERGY BALANCE
CHAPTER 7: ENERGY BALANCE
7.1 Definition Commodity balance: The purpose of commodity balance is to show the sources
of supply and various uses of particular energy product with reference to national territory of the compiling country. The balance is compiled for any energy commodity provided that the commodity remains homogeneous at each point in the balance.
International Recommendations on Energy Statistics (IRES) recommends that the format of energy balance and all applicable concepts are consistently used in the compilation of a commodity balance to ensure data consistency. The major sources for commercial energy in India are coal, oil products, natural gas and electricity. Non-energy producing sectors derive energy from the resources available in primary form such as coal, crude oil, natural gas, hydro-power and nuclear power. Some of the energy resources are converted into other (final) energy products that are used for purposes other than energy generation.
Coal is also used as a final product or intermediate for power generation. Similarly, natural gas is also used directly or as an intermediate in power generation. Many petroleum products, such as HSDO, Naphtha etc. are used as a final product by the non-energy producing sectors and also used for power generation.This indicates that the same energy source can be used in various forms at various stages of consumption. This creates a possibility of over-estimation or under-estimation of energy consumption in totality as well as for different sources.
Energy Balance: An energy balance is a framework to complete data on all energy products entering, existing and used within a given country during a reference periods (e.g. a year). It expresses all data in common energy units, which makes it possible to define a “total” product.
The purpose of compiling an energy balance starting from the various commodity balances are numerous; they are to: Provide a comprehensive overview of the energy profile of a country, to
monitor energy security, energy markets, relevant policy goals and to formulate adequate energy policies;
Provide the basis for aggregate socio-economic indicators, as well as for estimates of CO2 emissions;
Compare data of different reference periods and different countries; Provide a tool to ensure completeness, consistency and comparability of
basic statistics; Calculate efficiencies of transformation processes, as well as relative
shares of different sectors or products in the country’s total supply or consumption
ENERGY STATISTICS 2018
53
CHAPTER 7: ENERGY BALANCE
An energy balance generally takes the form of a matrix of products and flows,
with varying levels of disaggregation, although graphical formats also exist (e.g. sankey diagram).
Two major components of the energy balance statistics are Total Primary Energy Supply and Total Final Consumption of energy commodity.
Within a balance, the total final consumption is disaggregated into sectors, like industry, transport, residential, services and others. However, the level of disaggregation of such energy data is not enough to monitor energy efficiency, as no information is availablefor example on the residential or services end uses, nor on the transport vehicle types or segments. The energy balance will therefore be useful to assess the largest consuming sectors within a country where the energy saving potential will have more impact, before starting more detailed collection programmes on data for energy efficiency indicators.
7.2 Methodology used for Energy Balance
Energy (in KToe) = Quantity of Commodity * Conversion factor
1Toe = 41868 MJ
Conversion factor = Net Calorific Value (NCV) Mega joules per ton of oil equivalent where NCV is in kj per kg
Net Calorific Value(NCV) = Gross calorific value (GCV) – (% Moisture Content) [1NCV = 0.9 GCV]
• The difference between net and gross calorific values are typically about 5% to 6% of the gross value of solid and liquid fuels and about 10% for Natural gas.
• Net Calorific Values are, as recommended by IEA for all commodities. 7.3 Highlights of Energy Balance:
In 2016-17, Primary Energy Supply added up to 8,17,370.21 Kilo Tonne of Oil
equivalent (ktoe). The share of Coal accounted for 64.17% and the contribution of Crude Oil was 31.25%. (Table 7.2).
In 2016-17, National Energy Consumption was 5,40,931.75ktoe. The industrial sector used 57.71 % of the total final energy consumption (table 7.2).
ENERGY STATISTICS 2018
54
CHAPTER 7: ENERGY BALANCE
Within the industry sector, the most energy intensive industries were iron and
steel, which accounted for 13.36 % of the industrial energy use followed by Chemicals and petrochemicals4.67 % and construction1.70 % (Table 7.2).
The transport sector accounted for 8.44% of Total Final Consumption. The consumption of the residential,agriculture/forestry, commercial and public sectors represented 13.90%. (Table 7.2).
Efforts are being made to reduce the statistical difference, by incorporating more data.
7.3 Sankey Diagram (2016-17): Theconcept of data visualization in the digital age has revived interest in a style of
chart called a Sankey diagram. This style of diagram makes it easy to see the dominant flows within a system and highlights where losses occur.
The Sankey diagram is very useful tool to represent an entire input and output energy flow in energy system after carrying out energy balance calculation. The thicker the line, the greater the amount of energy involved.
The data of Energy Balance (Table 7.2) is used to construct the Sankey diagram, in which flows of energy are traced from energy sources to end-use consumption. The resulting diagram provides a convenient and clear snapshot of existing energy transformations in India which can usefully be compared with a similar global analysis. It gives a basis for examining and communicating future energy scenarios.
ENERGY STATISTICS 2018
55
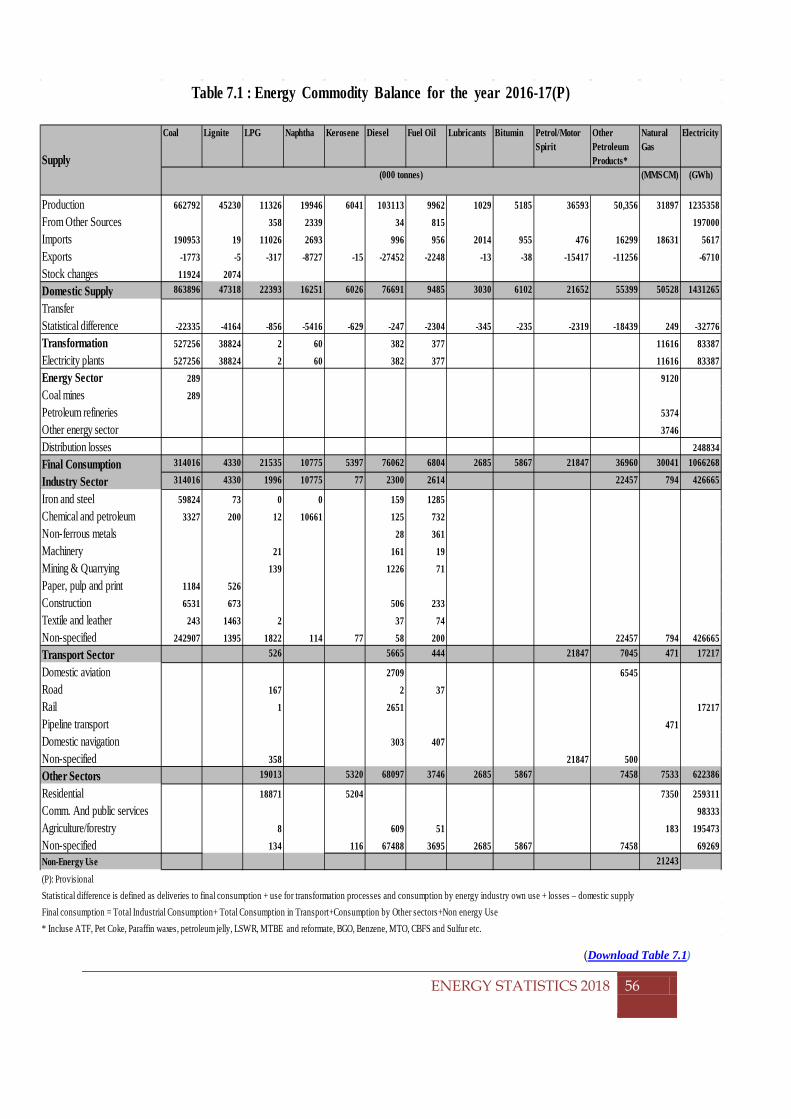
CHAPTER 7: ENERGY BALANCE
(Download Table 7.1)
ENERGY STATISTICS 2018
56
Coal Lignite LPG Naphtha Kerosene Diesel Fuel Oil Lubricants Bitumin Petrol/Motor Spirit
Other Petroleum Products*
Natural Gas
Electricity
(MMSCM) (GWh)
Production 662792 45230 11326 19946 6041 103113 9962 1029 5185 36593 50,356 31897 1235358From Other Sources 358 2339 34 815 197000Imports 190953 19 11026 2693 996 956 2014 955 476 16299 18631 5617Exports -1773 -5 -317 -8727 -15 -27452 -2248 -13 -38 -15417 -11256 -6710Stock changes 11924 2074Domestic Supply 863896 47318 22393 16251 6026 76691 9485 3030 6102 21652 55399 50528 1431265
TransferStatistical difference -22335 -4164 -856 -5416 -629 -247 -2304 -345 -235 -2319 -18439 249 -32776Transformation 527256 38824 2 60 382 377 11616 83387Electricity plants 527256 38824 2 60 382 377 11616 83387Energy Sector 289 9120Coal mines 289Petroleum refineries 5374Other energy sector 3746Distribution losses 248834Final Consumption 314016 4330 21535 10775 5397 76062 6804 2685 5867 21847 36960 30041 1066268
Industry Sector 314016 4330 1996 10775 77 2300 2614 22457 794 426665
Iron and steel 59824 73 0 0 159 1285Chemical and petroleum 3327 200 12 10661 125 732Non-ferrous metals 28 361Machinery 21 161 19Mining & Quarrying 139 1226 71Paper, pulp and print 1184 526Construction 6531 673 506 233Textile and leather 243 1463 2 37 74Non-specified 242907 1395 1822 114 77 58 200 22457 794 426665Transport Sector 526 5665 444 21847 7045 471 17217
Domestic aviation 2709 6545Road 167 2 37Rail 1 2651 17217Pipeline transport 471Domestic navigation 303 407Non-specified 358 21847 500Other Sectors 19013 5320 68097 3746 2685 5867 7458 7533 622386
Residential 18871 5204 7350 259311Comm. And public services 98333Agriculture/forestry 8 609 51 183 195473Non-specified 134 116 67488 3695 2685 5867 7458 69269Non-Energy Use 21243
(P): Provisional
* Incluse ATF, Pet Coke, Paraffin waxes, petroleum jelly, LSWR, MTBE and reformate, BGO, Benzene, MTO, CBFS and Sulfur etc.
Table 7.1 : Energy Commodity Balance for the year 2016-17(P)
Supply (000 tonnes)
Final consumption = Total Industrial Consumption+ Total Consumption in Transport+Consumption by Other sectors+Non energy UseStatistical difference is defined as deliveries to final consumption + use for transformation processes and consumption by energy industry own use + losses – domestic supply
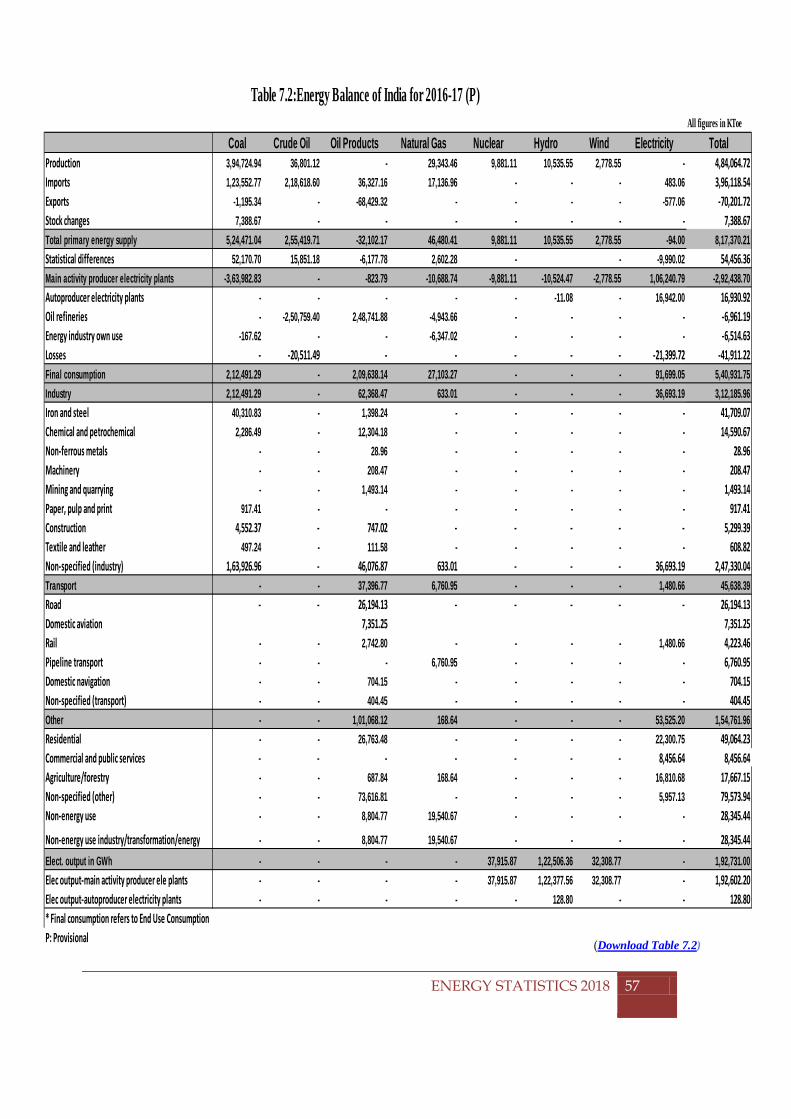
CHAPTER 7: ENERGY BALANCE
(Download Table 7.2)
ENERGY STATISTICS 2018
57
All figures in KToe
Coal Crude Oil Oil Products Natural Gas Nuclear Hydro Wind Electricity TotalProduction 3,94,724.94 36,801.12 - 29,343.46 9,881.11 10,535.55 2,778.55 - 4,84,064.72Imports 1,23,552.77 2,18,618.60 36,327.16 17,136.96 - - - 483.06 3,96,118.54Exports -1,195.34 - -68,429.32 - - - - -577.06 -70,201.72Stock changes 7,388.67 - - - - - - - 7,388.67Total primary energy supply 5,24,471.04 2,55,419.71 -32,102.17 46,480.41 9,881.11 10,535.55 2,778.55 -94.00 8,17,370.21Statistical differences 52,170.70 15,851.18 -6,177.78 2,602.28 - - -9,990.02 54,456.36Main activity producer electricity plants -3,63,982.83 - -823.79 -10,688.74 -9,881.11 -10,524.47 -2,778.55 1,06,240.79 -2,92,438.70Autoproducer electricity plants - - - - - -11.08 - 16,942.00 16,930.92Oil refineries - -2,50,759.40 2,48,741.88 -4,943.66 - - - - -6,961.19Energy industry own use -167.62 - - -6,347.02 - - - - -6,514.63Losses - -20,511.49 - - - - - -21,399.72 -41,911.22Final consumption 2,12,491.29 - 2,09,638.14 27,103.27 - - - 91,699.05 5,40,931.75Industry 2,12,491.29 - 62,368.47 633.01 - - - 36,693.19 3,12,185.96Iron and steel 40,310.83 - 1,398.24 - - - - - 41,709.07Chemical and petrochemical 2,286.49 - 12,304.18 - - - - - 14,590.67Non-ferrous metals - - 28.96 - - - - - 28.96Machinery - - 208.47 - - - - - 208.47Mining and quarrying - - 1,493.14 - - - - - 1,493.14Paper, pulp and print 917.41 - - - - - - - 917.41Construction 4,552.37 - 747.02 - - - - - 5,299.39Textile and leather 497.24 - 111.58 - - - - - 608.82Non-specified (industry) 1,63,926.96 - 46,076.87 633.01 - - - 36,693.19 2,47,330.04Transport - - 37,396.77 6,760.95 - - - 1,480.66 45,638.39Road - - 26,194.13 - - - - - 26,194.13Domestic aviation 7,351.25 7,351.25Rail - - 2,742.80 - - - - 1,480.66 4,223.46Pipeline transport - - - 6,760.95 - - - - 6,760.95Domestic navigation - - 704.15 - - - - - 704.15Non-specified (transport) - - 404.45 - - - - - 404.45Other - - 1,01,068.12 168.64 - - - 53,525.20 1,54,761.96Residential - - 26,763.48 - - - - 22,300.75 49,064.23Commercial and public services - - - - - - - 8,456.64 8,456.64Agriculture/forestry - - 687.84 168.64 - - - 16,810.68 17,667.15Non-specified (other) - - 73,616.81 - - - - 5,957.13 79,573.94Non-energy use - - 8,804.77 19,540.67 - - - - 28,345.44
Non-energy use industry/transformation/energy - - 8,804.77 19,540.67 - - - - 28,345.44Elect. output in GWh - - - - 37,915.87 1,22,506.36 32,308.77 - 1,92,731.00Elec output-main activity producer ele plants - - - - 37,915.87 1,22,377.56 32,308.77 - 1,92,602.20Elec output-autoproducer electricity plants - - - - - 128.80 - - 128.80* Final consumption refers to End Use Consumption P: Provisional
Table 7.2:Energy Balance of India for 2016-17 (P)
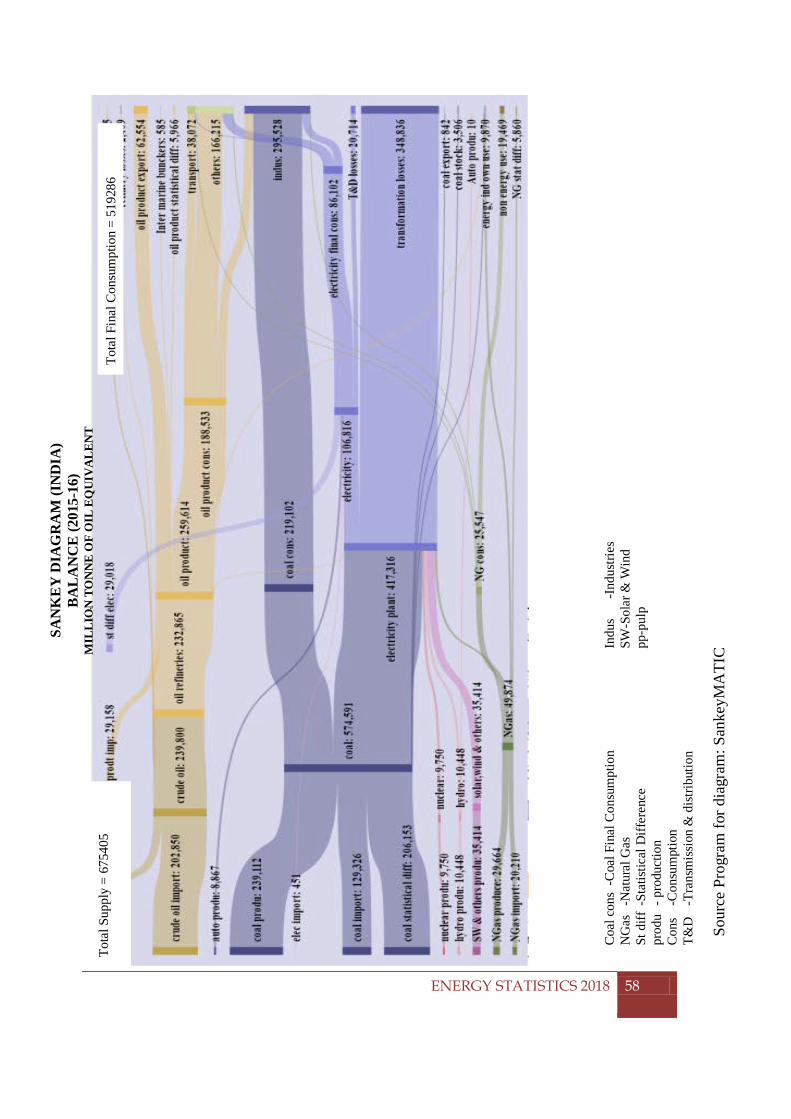
CHAPTER 7: ENERGY BALANCE
Sour
ce P
rogr
am fo
r dia
gram
: San
keyM
ATI
C
SAN
KE
Y D
IAG
RA
M (I
ND
IA)
BA
LA
NC
E (2
015-
16)
MIL
LIO
N T
ON
NE
OF
OIL
EQ
UIV
ALE
NT
Tota
l Sup
ply
= 67
5405
To
tal F
inal
Con
sum
ptio
n =
5192
86
Coa
l con
s -C
oal F
inal
Con
sum
ptio
n
Indu
s -I
ndus
tries
N
Gas
-N
atur
al G
as
SW
-Sol
ar &
Win
d St
diff
-St
atis
tical
Diff
eren
ce
pp
-pul
p pr
odu
- pro
duct
ion
Con
s -C
onsu
mpt
ion
T&D
-T
rans
mis
sion
& d
istri
butio
n
ENERGY STATISTICS 2018
58
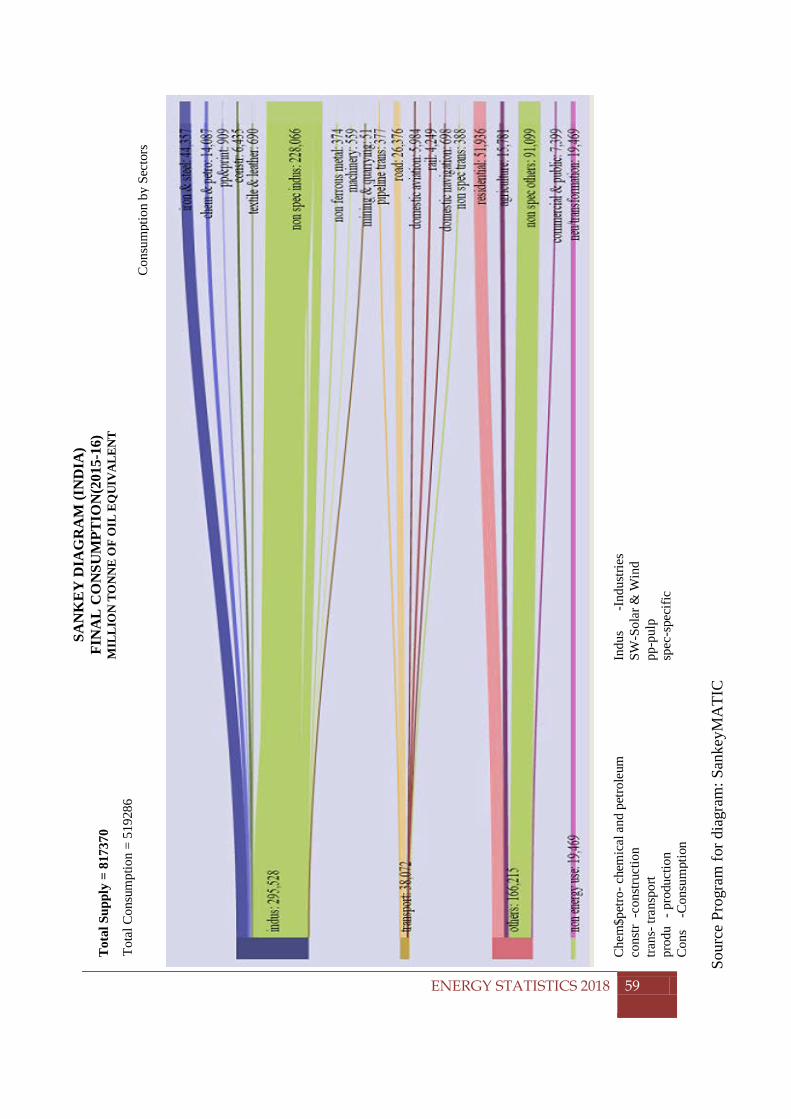
CHAPTER 7: ENERGY BALANCE
Tot
al S
uppl
y =
8173
70
Tot
al C
onsu
mpt
ion
= 54
0932
SAN
KE
Y D
IAG
RA
M (I
ND
IA)
FIN
AL
CO
NSU
MPT
ION
(201
5-16
) M
ILLI
ON
TO
NN
E O
F O
IL E
QU
IVA
LEN
T To
tal C
onsu
mpt
ion
= 51
9286
C
onsu
mpt
ion
by S
ecto
rs
Sour
ce P
rogr
am fo
r dia
gram
: San
keyM
ATI
C
Che
m$p
etro
- che
mic
al a
nd p
etro
leum
Indu
s -I
ndus
tries
co
nstr
-con
stru
ctio
n
SW-S
olar
& W
ind
trans
- tra
nspo
rt
pp-p
ulp
prod
u - p
rodu
ctio
n
spec
-spe
cific
C
ons
-Con
sum
ptio
n
ENERGY STATISTICS 2018
59
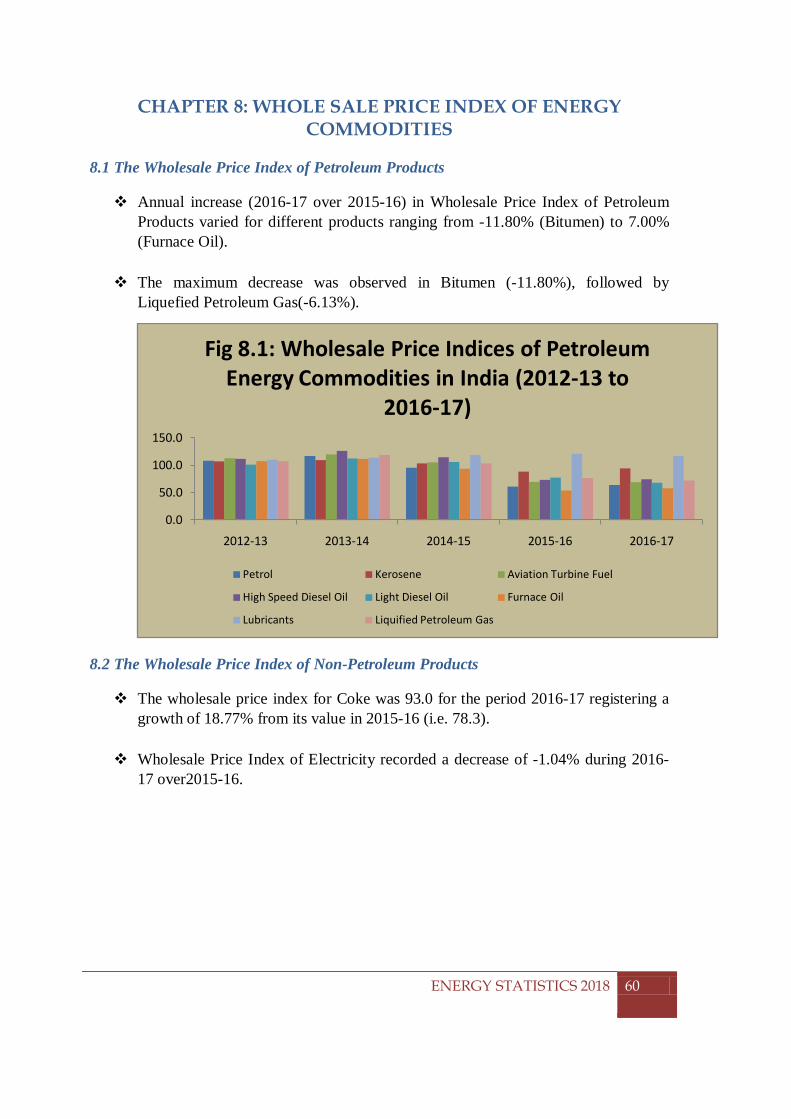
CHAPTER 8: WHOLE SALE PRICE INDEX OF ENERGY COMMODITIES
CHAPTER 8: WHOLE SALE PRICE INDEX OF ENERGY
COMMODITIES 8.1 The Wholesale Price Index of Petroleum Products
Annual increase (2016-17 over 2015-16) in Wholesale Price Index of Petroleum Products varied for different products ranging from -11.80% (Bitumen) to 7.00% (Furnace Oil).
The maximum decrease was observed in Bitumen (-11.80%), followed by
Liquefied Petroleum Gas(-6.13%).
8.2 The Wholesale Price Index of Non-Petroleum Products
The wholesale price index for Coke was 93.0 for the period 2016-17 registering a growth of 18.77% from its value in 2015-16 (i.e. 78.3).
Wholesale Price Index of Electricity recorded a decrease of -1.04% during 2016-
17 over2015-16.
0.0
50.0
100.0
150.0
2012-13 2013-14 2014-15 2015-16 2016-17
Fig 8.1: Wholesale Price Indices of Petroleum Energy Commodities in India (2012-13 to
2016-17)
Petrol Kerosene Aviation Turbine Fuel
High Speed Diesel Oil Light Diesel Oil Furnace Oil
Lubricants Liquified Petroleum Gas
ENERGY STATISTICS 2018
60
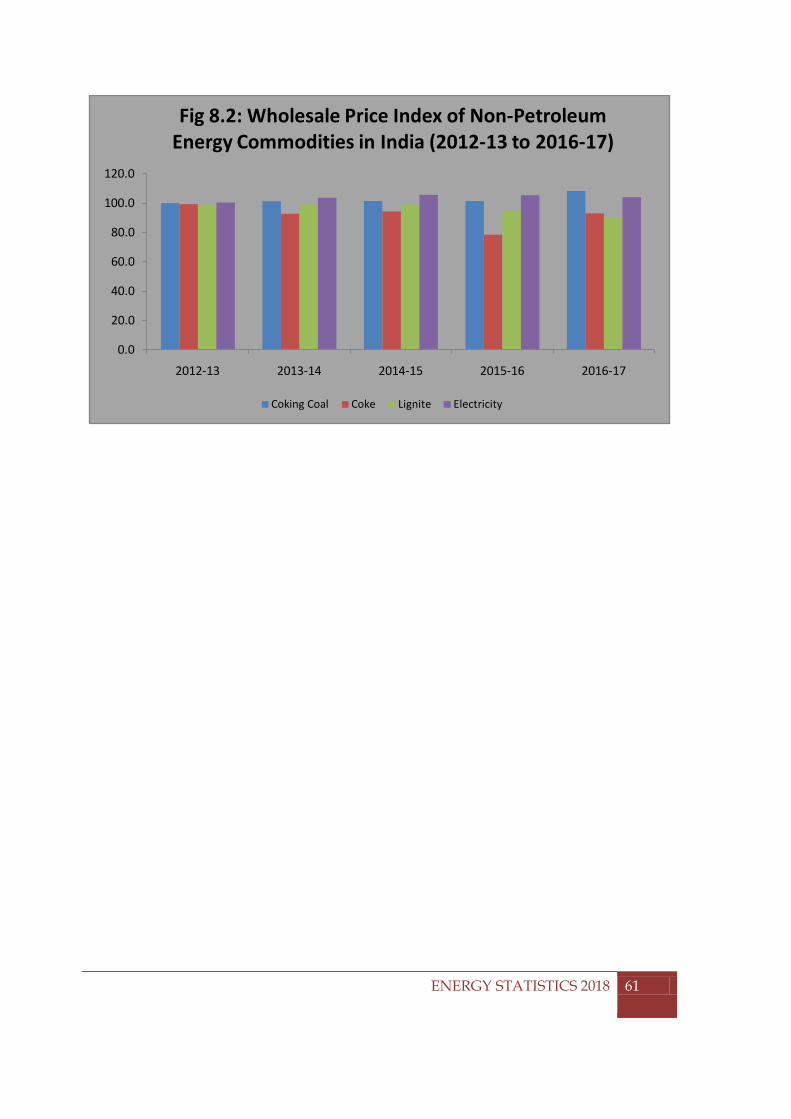
CHAPTER 8: WHOLE SALE PRICE INDEX OF ENERGY COMMODITIES
0.0
20.0
40.0
60.0
80.0
100.0
120.0
2012-13 2013-14 2014-15 2015-16 2016-17
Fig 8.2: Wholesale Price Index of Non-Petroleum Energy Commodities in India (2012-13 to 2016-17)
Coking Coal Coke Lignite Electricity
ENERGY STATISTICS 2018
61
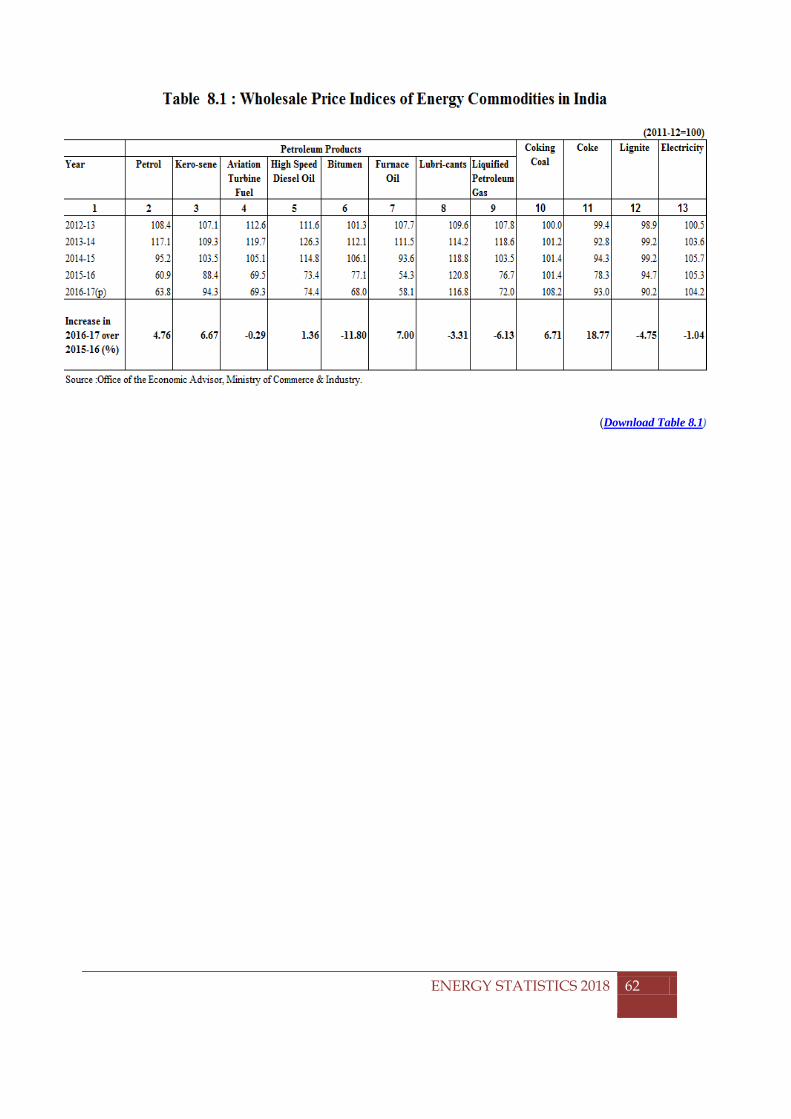
CHAPTER 8: WHOLE SALE PRICE INDEX OF ENERGY COMMODITIES
(Download Table 8.1)
ENERGY STATISTICS 2018
62
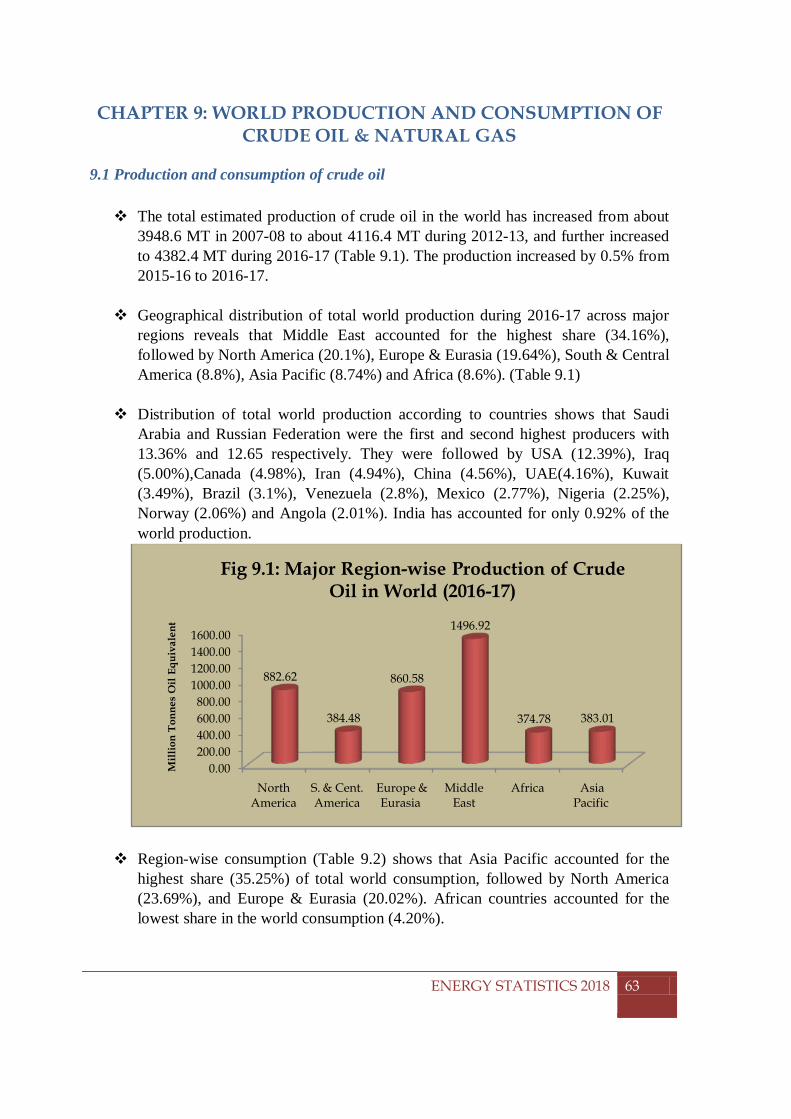
CHAPTER 9: WORLD PRODUCTION AND CONSUMPTION OF CRUDE OIL & NATURAL GAS
CHAPTER 9: WORLD PRODUCTION AND CONSUMPTION OF
CRUDE OIL & NATURAL GAS 9.1 Production and consumption of crude oil The total estimated production of crude oil in the world has increased from about
3948.6 MT in 2007-08 to about 4116.4 MT during 2012-13, and further increased to 4382.4 MT during 2016-17 (Table 9.1). The production increased by 0.5% from 2015-16 to 2016-17.
Geographical distribution of total world production during 2016-17 across major regions reveals that Middle East accounted for the highest share (34.16%), followed by North America (20.1%), Europe & Eurasia (19.64%), South & Central America (8.8%), Asia Pacific (8.74%) and Africa (8.6%). (Table 9.1)
Distribution of total world production according to countries shows that Saudi Arabia and Russian Federation were the first and second highest producers with 13.36% and 12.65 respectively. They were followed by USA (12.39%), Iraq (5.00%),Canada (4.98%), Iran (4.94%), China (4.56%), UAE(4.16%), Kuwait (3.49%), Brazil (3.1%), Venezuela (2.8%), Mexico (2.77%), Nigeria (2.25%), Norway (2.06%) and Angola (2.01%). India has accounted for only 0.92% of the world production.
Region-wise consumption (Table 9.2) shows that Asia Pacific accounted for the highest share (35.25%) of total world consumption, followed by North America (23.69%), and Europe & Eurasia (20.02%). African countries accounted for the lowest share in the world consumption (4.20%).
0.00200.00400.00600.00800.00
1000.001200.001400.001600.00
North America
S. & Cent. America
Europe & Eurasia
Middle East
Africa Asia Pacific
882.62
384.48
860.58
1496.92
374.78 383.01
Mill
ion
Tonn
es O
il Eq
uiva
lent
Fig 9.1: Major Region-wise Production of Crude Oil in World (2016-17)
ENERGY STATISTICS 2018
63
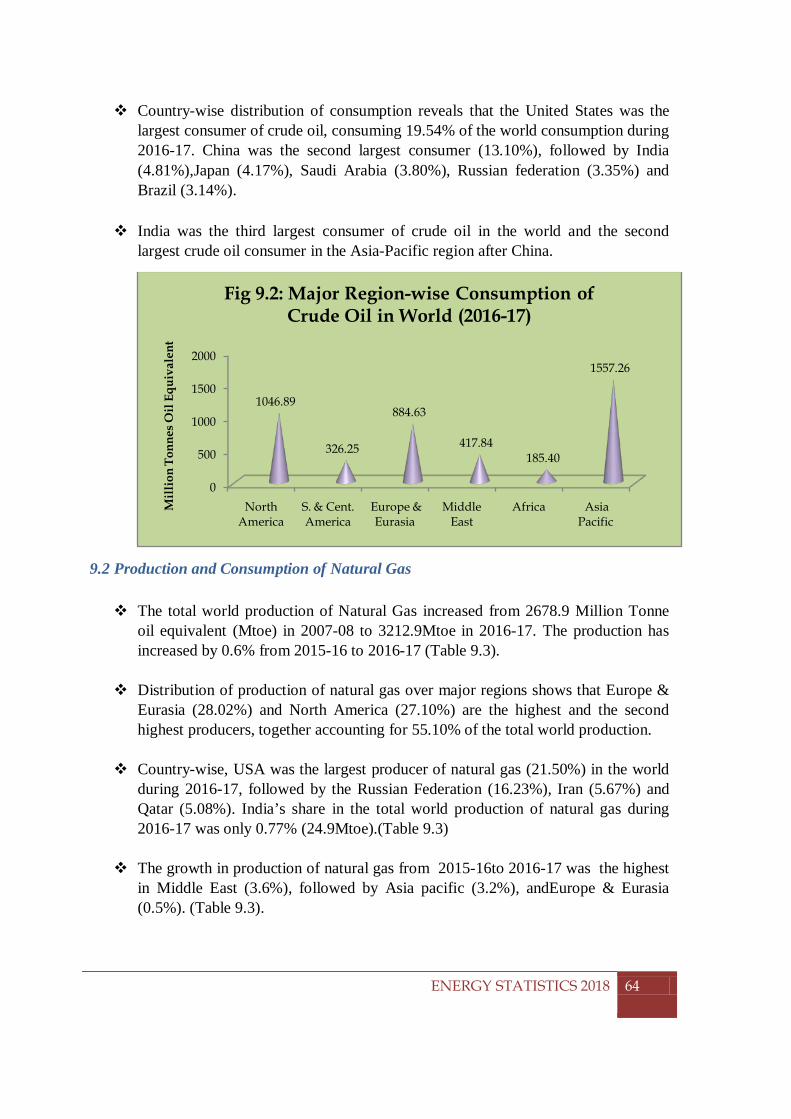
CHAPTER 9: WORLD PRODUCTION AND CONSUMPTION OF CRUDE OIL & NATURAL GAS
Country-wise distribution of consumption reveals that the United States was the
largest consumer of crude oil, consuming 19.54% of the world consumption during 2016-17. China was the second largest consumer (13.10%), followed by India (4.81%),Japan (4.17%), Saudi Arabia (3.80%), Russian federation (3.35%) and Brazil (3.14%).
India was the third largest consumer of crude oil in the world and the second
largest crude oil consumer in the Asia-Pacific region after China.
9.2 Production and Consumption of Natural Gas The total world production of Natural Gas increased from 2678.9 Million Tonne
oil equivalent (Mtoe) in 2007-08 to 3212.9Mtoe in 2016-17. The production has increased by 0.6% from 2015-16 to 2016-17 (Table 9.3).
Distribution of production of natural gas over major regions shows that Europe & Eurasia (28.02%) and North America (27.10%) are the highest and the second highest producers, together accounting for 55.10% of the total world production.
Country-wise, USA was the largest producer of natural gas (21.50%) in the world during 2016-17, followed by the Russian Federation (16.23%), Iran (5.67%) and Qatar (5.08%). India’s share in the total world production of natural gas during 2016-17 was only 0.77% (24.9Mtoe).(Table 9.3)
The growth in production of natural gas from 2015-16to 2016-17 was the highest in Middle East (3.6%), followed by Asia pacific (3.2%), andEurope & Eurasia (0.5%). (Table 9.3).
0
500
1000
1500
2000
North America
S. & Cent. America
Europe & Eurasia
Middle East
Africa Asia Pacific
1046.89
326.25
884.63
417.84185.40
1557.26
Mil
lion
Ton
nes O
il E
quiv
alen
t
Fig 9.2: Major Region-wise Consumption of Crude Oil in World (2016-17)
ENERGY STATISTICS 2018
64
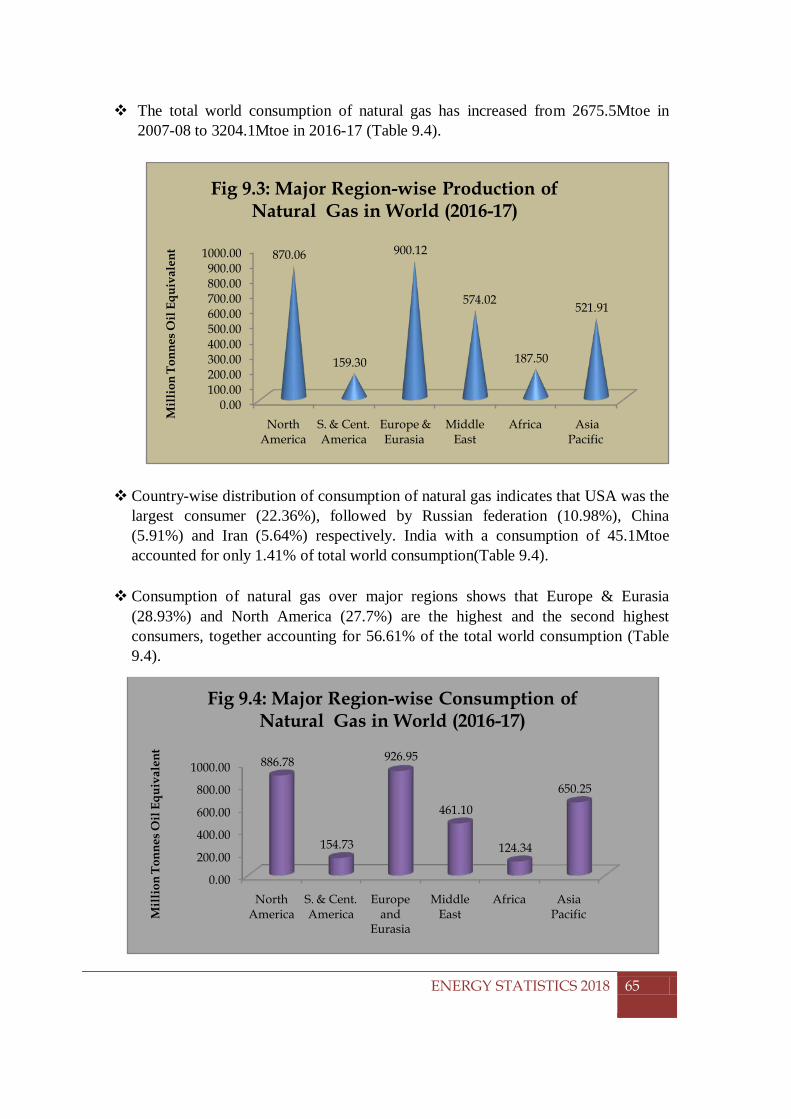
CHAPTER 9: WORLD PRODUCTION AND CONSUMPTION OF CRUDE OIL & NATURAL GAS
The total world consumption of natural gas has increased from 2675.5Mtoe in
2007-08 to 3204.1Mtoe in 2016-17 (Table 9.4).
Country-wise distribution of consumption of natural gas indicates that USA was the largest consumer (22.36%), followed by Russian federation (10.98%), China (5.91%) and Iran (5.64%) respectively. India with a consumption of 45.1Mtoe accounted for only 1.41% of total world consumption(Table 9.4).
Consumption of natural gas over major regions shows that Europe & Eurasia
(28.93%) and North America (27.7%) are the highest and the second highest consumers, together accounting for 56.61% of the total world consumption (Table 9.4).
0.00100.00200.00300.00400.00500.00600.00700.00800.00900.00
1000.00
North America
S. & Cent. America
Europe & Eurasia
Middle East
Africa Asia Pacific
870.06
159.30
900.12
574.02
187.50
521.91
Mil
lion
Ton
nes O
il E
quiv
alen
t
Fig 9.3: Major Region-wise Production of Natural Gas in World (2016-17)
0.00
200.00
400.00
600.00
800.00
1000.00
North America
S. & Cent. America
Europe and
Eurasia
Middle East
Africa Asia Pacific
886.78
154.73
926.95
461.10
124.34
650.25
Mil
lion
Ton
nes O
il E
quiv
alen
t
Fig 9.4: Major Region-wise Consumption of Natural Gas in World (2016-17)
ENERGY STATISTICS 2018
65
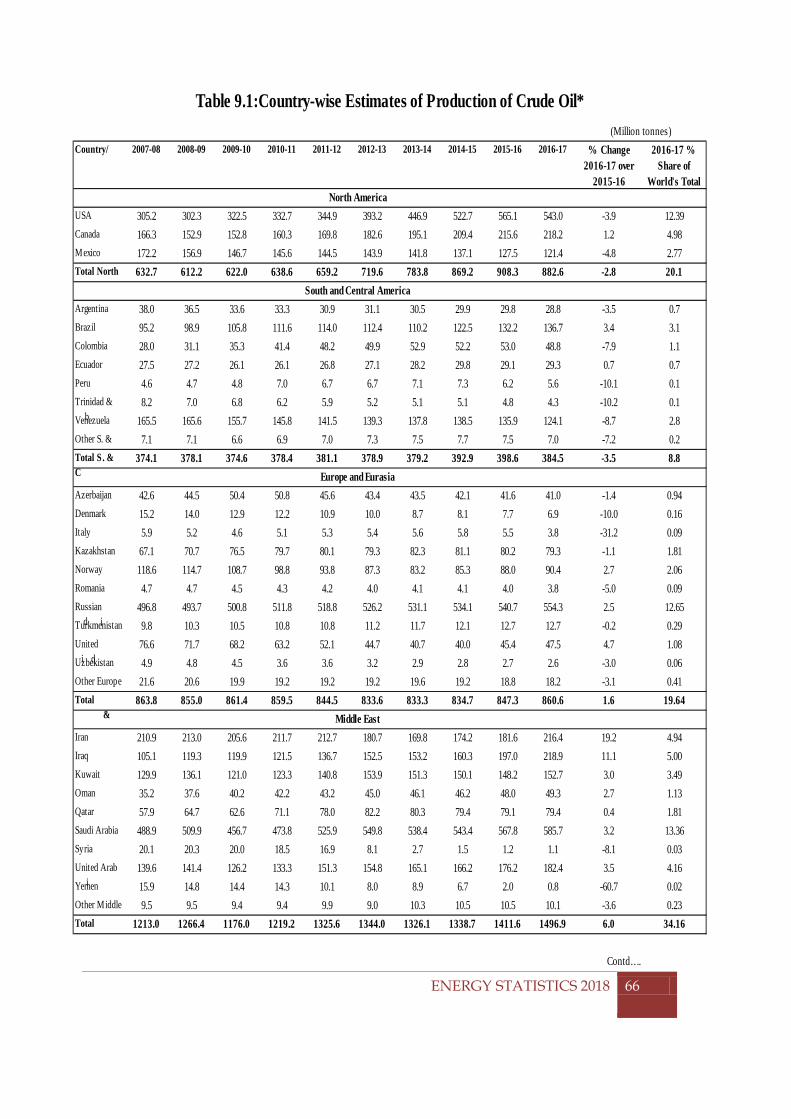
CHAPTER 9: WORLD PRODUCTION AND CONSUMPTION OF CRUDE OIL & NATURAL GAS
ENERGY STATISTICS 2018
66
Country/ 2007-08 2008-09 2009-10 2010-11 2011-12 2012-13 2013-14 2014-15 2015-16 2016-17
USA 305.2 302.3 322.5 332.7 344.9 393.2 446.9 522.7 565.1 543.0 -3.9 12.39Canada 166.3 152.9 152.8 160.3 169.8 182.6 195.1 209.4 215.6 218.2 1.2 4.98Mexico 172.2 156.9 146.7 145.6 144.5 143.9 141.8 137.1 127.5 121.4 -4.8 2.77Total North 632.7 612.2 622.0 638.6 659.2 719.6 783.8 869.2 908.3 882.6 -2.8 20.1
Argentina 38.0 36.5 33.6 33.3 30.9 31.1 30.5 29.9 29.8 28.8 -3.5 0.7Brazil 95.2 98.9 105.8 111.6 114.0 112.4 110.2 122.5 132.2 136.7 3.4 3.1Colombia 28.0 31.1 35.3 41.4 48.2 49.9 52.9 52.2 53.0 48.8 -7.9 1.1Ecuador 27.5 27.2 26.1 26.1 26.8 27.1 28.2 29.8 29.1 29.3 0.7 0.7Peru 4.6 4.7 4.8 7.0 6.7 6.7 7.1 7.3 6.2 5.6 -10.1 0.1Trinidad &
b8.2 7.0 6.8 6.2 5.9 5.2 5.1 5.1 4.8 4.3 -10.2 0.1
Venezuela 165.5 165.6 155.7 145.8 141.5 139.3 137.8 138.5 135.9 124.1 -8.7 2.8Other S. &
7.1 7.1 6.6 6.9 7.0 7.3 7.5 7.7 7.5 7.0 -7.2 0.2
Total S . & C
374.1 378.1 374.6 378.4 381.1 378.9 379.2 392.9 398.6 384.5 -3.5 8.8
Azerbaijan 42.6 44.5 50.4 50.8 45.6 43.4 43.5 42.1 41.6 41.0 -1.4 0.94Denmark 15.2 14.0 12.9 12.2 10.9 10.0 8.7 8.1 7.7 6.9 -10.0 0.16Italy 5.9 5.2 4.6 5.1 5.3 5.4 5.6 5.8 5.5 3.8 -31.2 0.09Kazakhstan 67.1 70.7 76.5 79.7 80.1 79.3 82.3 81.1 80.2 79.3 -1.1 1.81Norway 118.6 114.7 108.7 98.8 93.8 87.3 83.2 85.3 88.0 90.4 2.7 2.06Romania 4.7 4.7 4.5 4.3 4.2 4.0 4.1 4.1 4.0 3.8 -5.0 0.09Russian
d i496.8 493.7 500.8 511.8 518.8 526.2 531.1 534.1 540.7 554.3 2.5 12.65
Turkmenistan 9.8 10.3 10.5 10.8 10.8 11.2 11.7 12.1 12.7 12.7 -0.2 0.29United
i d76.6 71.7 68.2 63.2 52.1 44.7 40.7 40.0 45.4 47.5 4.7 1.08
Uzbekistan 4.9 4.8 4.5 3.6 3.6 3.2 2.9 2.8 2.7 2.6 -3.0 0.06Other Europe
21.6 20.6 19.9 19.2 19.2 19.2 19.6 19.2 18.8 18.2 -3.1 0.41
Total &
863.8 855.0 861.4 859.5 844.5 833.6 833.3 834.7 847.3 860.6 1.6 19.64
Iran 210.9 213.0 205.6 211.7 212.7 180.7 169.8 174.2 181.6 216.4 19.2 4.94Iraq 105.1 119.3 119.9 121.5 136.7 152.5 153.2 160.3 197.0 218.9 11.1 5.00Kuwait 129.9 136.1 121.0 123.3 140.8 153.9 151.3 150.1 148.2 152.7 3.0 3.49Oman 35.2 37.6 40.2 42.2 43.2 45.0 46.1 46.2 48.0 49.3 2.7 1.13Qatar 57.9 64.7 62.6 71.1 78.0 82.2 80.3 79.4 79.1 79.4 0.4 1.81Saudi Arabia 488.9 509.9 456.7 473.8 525.9 549.8 538.4 543.4 567.8 585.7 3.2 13.36Syria 20.1 20.3 20.0 18.5 16.9 8.1 2.7 1.5 1.2 1.1 -8.1 0.03United Arab
i139.6 141.4 126.2 133.3 151.3 154.8 165.1 166.2 176.2 182.4 3.5 4.16
Yemen 15.9 14.8 14.4 14.3 10.1 8.0 8.9 6.7 2.0 0.8 -60.7 0.02Other Middle 9.5 9.5 9.4 9.4 9.9 9.0 10.3 10.5 10.5 10.1 -3.6 0.23Total
1213.0 1266.4 1176.0 1219.2 1325.6 1344.0 1326.1 1338.7 1411.6 1496.9 6.0 34.16
Contd….
Europe and Eurasia
Middle East
Table 9.1:Country-wise Estimates of Production of Crude Oil*(Million tonnes)
% Change 2016-17 over
2015-16
2016-17 % Share of
World's Total North America
South and Central America
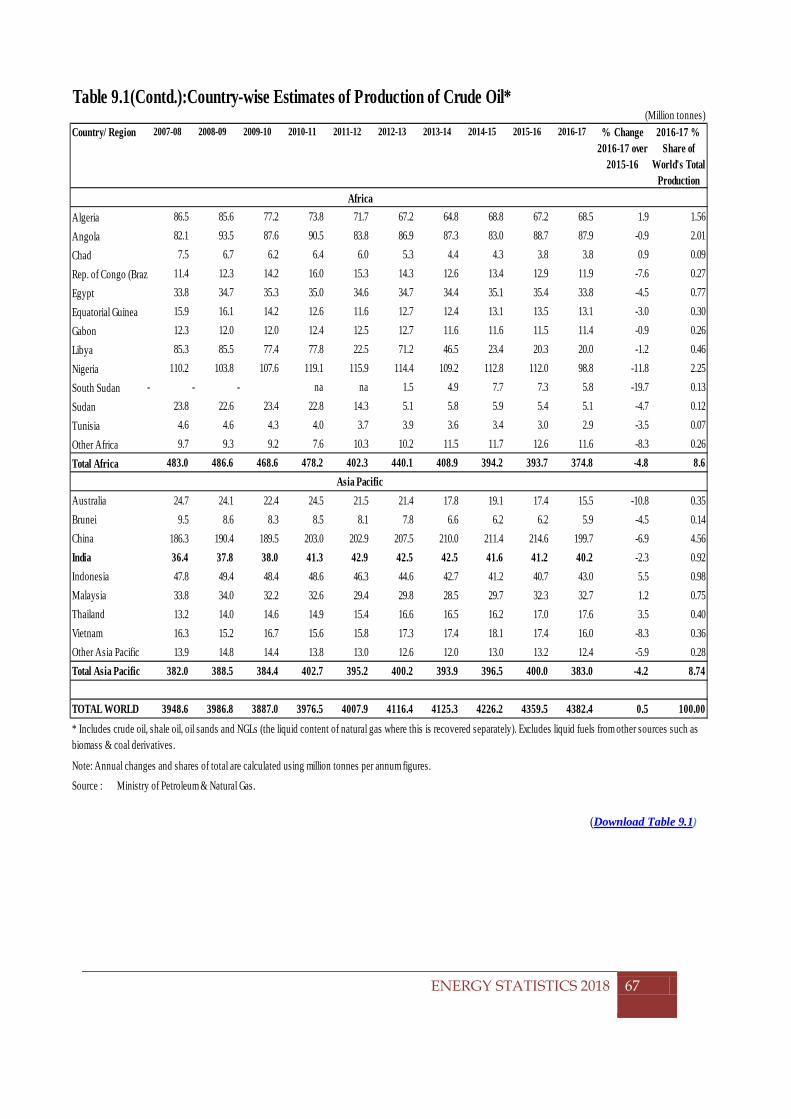
CHAPTER 9: WORLD PRODUCTION AND CONSUMPTION OF CRUDE OIL & NATURAL GAS
(Download Table 9.1)
ENERGY STATISTICS 2018
67
Table 9.1(Contd.):Country-wise Estimates of Production of Crude Oil*
Country/ Region 2007-08 2008-09 2009-10 2010-11 2011-12 2012-13 2013-14 2014-15 2015-16 2016-17
Algeria 86.5 85.6 77.2 73.8 71.7 67.2 64.8 68.8 67.2 68.5 1.9 1.56Angola 82.1 93.5 87.6 90.5 83.8 86.9 87.3 83.0 88.7 87.9 -0.9 2.01Chad 7.5 6.7 6.2 6.4 6.0 5.3 4.4 4.3 3.8 3.8 0.9 0.09Rep. of Congo (Braz 11.4 12.3 14.2 16.0 15.3 14.3 12.6 13.4 12.9 11.9 -7.6 0.27Egypt 33.8 34.7 35.3 35.0 34.6 34.7 34.4 35.1 35.4 33.8 -4.5 0.77Equatorial Guinea 15.9 16.1 14.2 12.6 11.6 12.7 12.4 13.1 13.5 13.1 -3.0 0.30Gabon 12.3 12.0 12.0 12.4 12.5 12.7 11.6 11.6 11.5 11.4 -0.9 0.26Libya 85.3 85.5 77.4 77.8 22.5 71.2 46.5 23.4 20.3 20.0 -1.2 0.46Nigeria 110.2 103.8 107.6 119.1 115.9 114.4 109.2 112.8 112.0 98.8 -11.8 2.25South Sudan - - - na na 1.5 4.9 7.7 7.3 5.8 -19.7 0.13Sudan 23.8 22.6 23.4 22.8 14.3 5.1 5.8 5.9 5.4 5.1 -4.7 0.12Tunisia 4.6 4.6 4.3 4.0 3.7 3.9 3.6 3.4 3.0 2.9 -3.5 0.07Other Africa 9.7 9.3 9.2 7.6 10.3 10.2 11.5 11.7 12.6 11.6 -8.3 0.26Total Africa 483.0 486.6 468.6 478.2 402.3 440.1 408.9 394.2 393.7 374.8 -4.8 8.6
Australia 24.7 24.1 22.4 24.5 21.5 21.4 17.8 19.1 17.4 15.5 -10.8 0.35Brunei 9.5 8.6 8.3 8.5 8.1 7.8 6.6 6.2 6.2 5.9 -4.5 0.14China 186.3 190.4 189.5 203.0 202.9 207.5 210.0 211.4 214.6 199.7 -6.9 4.56India 36.4 37.8 38.0 41.3 42.9 42.5 42.5 41.6 41.2 40.2 -2.3 0.92Indonesia 47.8 49.4 48.4 48.6 46.3 44.6 42.7 41.2 40.7 43.0 5.5 0.98Malaysia 33.8 34.0 32.2 32.6 29.4 29.8 28.5 29.7 32.3 32.7 1.2 0.75Thailand 13.2 14.0 14.6 14.9 15.4 16.6 16.5 16.2 17.0 17.6 3.5 0.40Vietnam 16.3 15.2 16.7 15.6 15.8 17.3 17.4 18.1 17.4 16.0 -8.3 0.36Other Asia Pacific 13.9 14.8 14.4 13.8 13.0 12.6 12.0 13.0 13.2 12.4 -5.9 0.28Total Asia Pacific 382.0 388.5 384.4 402.7 395.2 400.2 393.9 396.5 400.0 383.0 -4.2 8.74
TOTAL WORLD 3948.6 3986.8 3887.0 3976.5 4007.9 4116.4 4125.3 4226.2 4359.5 4382.4 0.5 100.00
Note: Annual changes and shares of total are calculated using million tonnes per annum figures.Source : Ministry of Petroleum & Natural Gas.
(Million tonnes)% Change
2016-17 over 2015-16
2016-17 % Share of
World's Total Production
Africa
Asia Pacific
* Includes crude oil, shale oil, oil sands and NGLs (the liquid content of natural gas where this is recovered separately). Excludes liquid fuels from other sources such as biomass & coal derivatives.
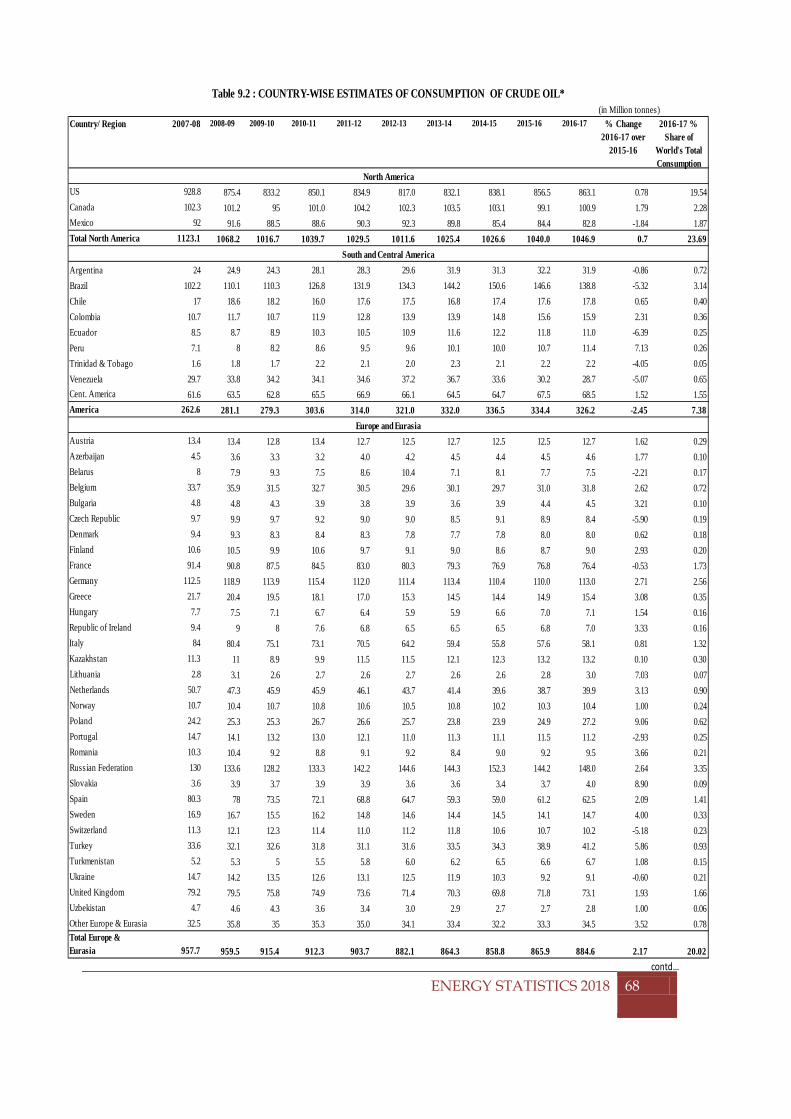
CHAPTER 9: WORLD PRODUCTION AND CONSUMPTION OF CRUDE OIL & NATURAL GAS
ENERGY STATISTICS 2018
68
(in Million tonnes)Country/ Region 2007-08 2008-09 2009-10 2010-11 2011-12 2012-13 2013-14 2014-15 2015-16 2016-17 % Change
2016-17 over 2015-16
2016-17 % Share of
World's Total Consumption
US 928.8 875.4 833.2 850.1 834.9 817.0 832.1 838.1 856.5 863.1 0.78 19.54Canada 102.3 101.2 95 101.0 104.2 102.3 103.5 103.1 99.1 100.9 1.79 2.28Mexico 92 91.6 88.5 88.6 90.3 92.3 89.8 85.4 84.4 82.8 -1.84 1.87Total North America 1123.1 1068.2 1016.7 1039.7 1029.5 1011.6 1025.4 1026.6 1040.0 1046.9 0.7 23.69
Argentina 24 24.9 24.3 28.1 28.3 29.6 31.9 31.3 32.2 31.9 -0.86 0.72Brazil 102.2 110.1 110.3 126.8 131.9 134.3 144.2 150.6 146.6 138.8 -5.32 3.14Chile 17 18.6 18.2 16.0 17.6 17.5 16.8 17.4 17.6 17.8 0.65 0.40Colombia 10.7 11.7 10.7 11.9 12.8 13.9 13.9 14.8 15.6 15.9 2.31 0.36Ecuador 8.5 8.7 8.9 10.3 10.5 10.9 11.6 12.2 11.8 11.0 -6.39 0.25Peru 7.1 8 8.2 8.6 9.5 9.6 10.1 10.0 10.7 11.4 7.13 0.26Trinidad & Tobago 1.6 1.8 1.7 2.2 2.1 2.0 2.3 2.1 2.2 2.2 -4.05 0.05Venezuela 29.7 33.8 34.2 34.1 34.6 37.2 36.7 33.6 30.2 28.7 -5.07 0.65 Cent. America 61.6 63.5 62.8 65.5 66.9 66.1 64.5 64.7 67.5 68.5 1.52 1.55 America 262.6 281.1 279.3 303.6 314.0 321.0 332.0 336.5 334.4 326.2 -2.45 7.38
Austria 13.4 13.4 12.8 13.4 12.7 12.5 12.7 12.5 12.5 12.7 1.62 0.29Azerbaijan 4.5 3.6 3.3 3.2 4.0 4.2 4.5 4.4 4.5 4.6 1.77 0.10Belarus 8 7.9 9.3 7.5 8.6 10.4 7.1 8.1 7.7 7.5 -2.21 0.17Belgium 33.7 35.9 31.5 32.7 30.5 29.6 30.1 29.7 31.0 31.8 2.62 0.72Bulgaria 4.8 4.8 4.3 3.9 3.8 3.9 3.6 3.9 4.4 4.5 3.21 0.10Czech Republic 9.7 9.9 9.7 9.2 9.0 9.0 8.5 9.1 8.9 8.4 -5.90 0.19Denmark 9.4 9.3 8.3 8.4 8.3 7.8 7.7 7.8 8.0 8.0 0.62 0.18Finland 10.6 10.5 9.9 10.6 9.7 9.1 9.0 8.6 8.7 9.0 2.93 0.20France 91.4 90.8 87.5 84.5 83.0 80.3 79.3 76.9 76.8 76.4 -0.53 1.73Germany 112.5 118.9 113.9 115.4 112.0 111.4 113.4 110.4 110.0 113.0 2.71 2.56Greece 21.7 20.4 19.5 18.1 17.0 15.3 14.5 14.4 14.9 15.4 3.08 0.35Hungary 7.7 7.5 7.1 6.7 6.4 5.9 5.9 6.6 7.0 7.1 1.54 0.16Republic of Ireland 9.4 9 8 7.6 6.8 6.5 6.5 6.5 6.8 7.0 3.33 0.16Italy 84 80.4 75.1 73.1 70.5 64.2 59.4 55.8 57.6 58.1 0.81 1.32Kazakhstan 11.3 11 8.9 9.9 11.5 11.5 12.1 12.3 13.2 13.2 0.10 0.30Lithuania 2.8 3.1 2.6 2.7 2.6 2.7 2.6 2.6 2.8 3.0 7.03 0.07Netherlands 50.7 47.3 45.9 45.9 46.1 43.7 41.4 39.6 38.7 39.9 3.13 0.90Norway 10.7 10.4 10.7 10.8 10.6 10.5 10.8 10.2 10.3 10.4 1.00 0.24Poland 24.2 25.3 25.3 26.7 26.6 25.7 23.8 23.9 24.9 27.2 9.06 0.62Portugal 14.7 14.1 13.2 13.0 12.1 11.0 11.3 11.1 11.5 11.2 -2.93 0.25Romania 10.3 10.4 9.2 8.8 9.1 9.2 8.4 9.0 9.2 9.5 3.66 0.21Russian Federation 130 133.6 128.2 133.3 142.2 144.6 144.3 152.3 144.2 148.0 2.64 3.35Slovakia 3.6 3.9 3.7 3.9 3.9 3.6 3.6 3.4 3.7 4.0 8.90 0.09Spain 80.3 78 73.5 72.1 68.8 64.7 59.3 59.0 61.2 62.5 2.09 1.41Sweden 16.9 16.7 15.5 16.2 14.8 14.6 14.4 14.5 14.1 14.7 4.00 0.33Switzerland 11.3 12.1 12.3 11.4 11.0 11.2 11.8 10.6 10.7 10.2 -5.18 0.23Turkey 33.6 32.1 32.6 31.8 31.1 31.6 33.5 34.3 38.9 41.2 5.86 0.93Turkmenistan 5.2 5.3 5 5.5 5.8 6.0 6.2 6.5 6.6 6.7 1.08 0.15Ukraine 14.7 14.2 13.5 12.6 13.1 12.5 11.9 10.3 9.2 9.1 -0.60 0.21United Kingdom 79.2 79.5 75.8 74.9 73.6 71.4 70.3 69.8 71.8 73.1 1.93 1.66Uzbekistan 4.7 4.6 4.3 3.6 3.4 3.0 2.9 2.7 2.7 2.8 1.00 0.06Other Europe & Eurasia 32.5 35.8 35 35.3 35.0 34.1 33.4 32.2 33.3 34.5 3.52 0.78Total Europe & Eurasia 957.7 959.5 915.4 912.3 903.7 882.1 864.3 858.8 865.9 884.6 2.17 20.02
contd…
Table 9.2 : COUNTRY-WISE ESTIMATES OF CONSUMPTION OF CRUDE OIL*
North America
South and Central America
Europe and Eurasia
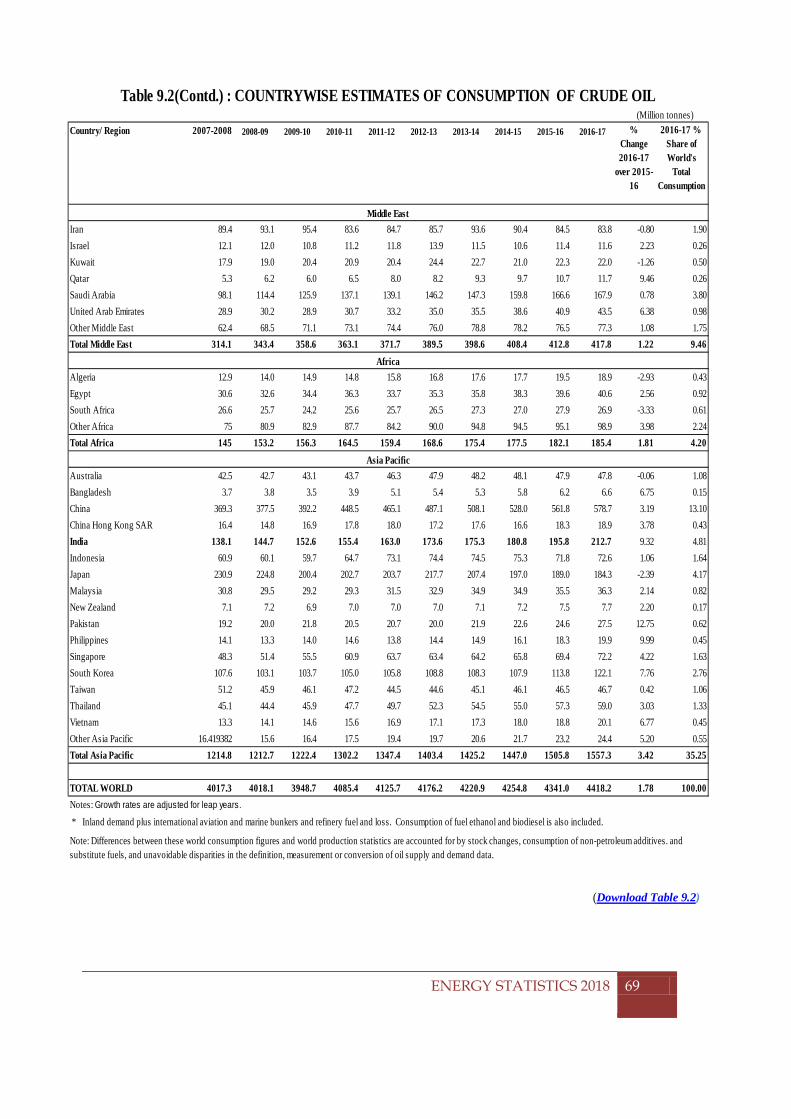
CHAPTER 9: WORLD PRODUCTION AND CONSUMPTION OF CRUDE OIL & NATURAL GAS
(Download Table 9.2)
ENERGY STATISTICS 2018
69
Country/ Region 2007-2008 2008-09 2009-10 2010-11 2011-12 2012-13 2013-14 2014-15 2015-16 2016-17
Iran 89.4 93.1 95.4 83.6 84.7 85.7 93.6 90.4 84.5 83.8 -0.80 1.90Israel 12.1 12.0 10.8 11.2 11.8 13.9 11.5 10.6 11.4 11.6 2.23 0.26Kuwait 17.9 19.0 20.4 20.9 20.4 24.4 22.7 21.0 22.3 22.0 -1.26 0.50Qatar 5.3 6.2 6.0 6.5 8.0 8.2 9.3 9.7 10.7 11.7 9.46 0.26Saudi Arabia 98.1 114.4 125.9 137.1 139.1 146.2 147.3 159.8 166.6 167.9 0.78 3.80United Arab Emirates 28.9 30.2 28.9 30.7 33.2 35.0 35.5 38.6 40.9 43.5 6.38 0.98Other Middle East 62.4 68.5 71.1 73.1 74.4 76.0 78.8 78.2 76.5 77.3 1.08 1.75Total Middle East 314.1 343.4 358.6 363.1 371.7 389.5 398.6 408.4 412.8 417.8 1.22 9.46
Algeria 12.9 14.0 14.9 14.8 15.8 16.8 17.6 17.7 19.5 18.9 -2.93 0.43Egypt 30.6 32.6 34.4 36.3 33.7 35.3 35.8 38.3 39.6 40.6 2.56 0.92South Africa 26.6 25.7 24.2 25.6 25.7 26.5 27.3 27.0 27.9 26.9 -3.33 0.61Other Africa 75 80.9 82.9 87.7 84.2 90.0 94.8 94.5 95.1 98.9 3.98 2.24Total Africa 145 153.2 156.3 164.5 159.4 168.6 175.4 177.5 182.1 185.4 1.81 4.20
Australia 42.5 42.7 43.1 43.7 46.3 47.9 48.2 48.1 47.9 47.8 -0.06 1.08Bangladesh 3.7 3.8 3.5 3.9 5.1 5.4 5.3 5.8 6.2 6.6 6.75 0.15China 369.3 377.5 392.2 448.5 465.1 487.1 508.1 528.0 561.8 578.7 3.19 13.10China Hong Kong SAR 16.4 14.8 16.9 17.8 18.0 17.2 17.6 16.6 18.3 18.9 3.78 0.43India 138.1 144.7 152.6 155.4 163.0 173.6 175.3 180.8 195.8 212.7 9.32 4.81Indonesia 60.9 60.1 59.7 64.7 73.1 74.4 74.5 75.3 71.8 72.6 1.06 1.64Japan 230.9 224.8 200.4 202.7 203.7 217.7 207.4 197.0 189.0 184.3 -2.39 4.17Malaysia 30.8 29.5 29.2 29.3 31.5 32.9 34.9 34.9 35.5 36.3 2.14 0.82New Zealand 7.1 7.2 6.9 7.0 7.0 7.0 7.1 7.2 7.5 7.7 2.20 0.17Pakistan 19.2 20.0 21.8 20.5 20.7 20.0 21.9 22.6 24.6 27.5 12.75 0.62Philippines 14.1 13.3 14.0 14.6 13.8 14.4 14.9 16.1 18.3 19.9 9.99 0.45Singapore 48.3 51.4 55.5 60.9 63.7 63.4 64.2 65.8 69.4 72.2 4.22 1.63South Korea 107.6 103.1 103.7 105.0 105.8 108.8 108.3 107.9 113.8 122.1 7.76 2.76Taiwan 51.2 45.9 46.1 47.2 44.5 44.6 45.1 46.1 46.5 46.7 0.42 1.06Thailand 45.1 44.4 45.9 47.7 49.7 52.3 54.5 55.0 57.3 59.0 3.03 1.33Vietnam 13.3 14.1 14.6 15.6 16.9 17.1 17.3 18.0 18.8 20.1 6.77 0.45Other Asia Pacific 16.419382 15.6 16.4 17.5 19.4 19.7 20.6 21.7 23.2 24.4 5.20 0.55Total Asia Pacific 1214.8 1212.7 1222.4 1302.2 1347.4 1403.4 1425.2 1447.0 1505.8 1557.3 3.42 35.25
TOTAL WORLD 4017.3 4018.1 3948.7 4085.4 4125.7 4176.2 4220.9 4254.8 4341.0 4418.2 1.78 100.00Notes: Growth rates are adjusted for leap years.
* Inland demand plus international aviation and marine bunkers and refinery fuel and loss. Consumption of fuel ethanol and biodiesel is also included.
Note: Differences between these world consumption figures and world production statistics are accounted for by stock changes, consumption of non-petroleum additives. and substitute fuels, and unavoidable disparities in the definition, measurement or conversion of oil supply and demand data.
Asia Pacific
Table 9.2(Contd.) : COUNTRYWISE ESTIMATES OF CONSUMPTION OF CRUDE OIL (Million tonnes)%
Change 2016-17
over 2015-16
2016-17 % Share of World's
Total Consumption
Middle East
Africa
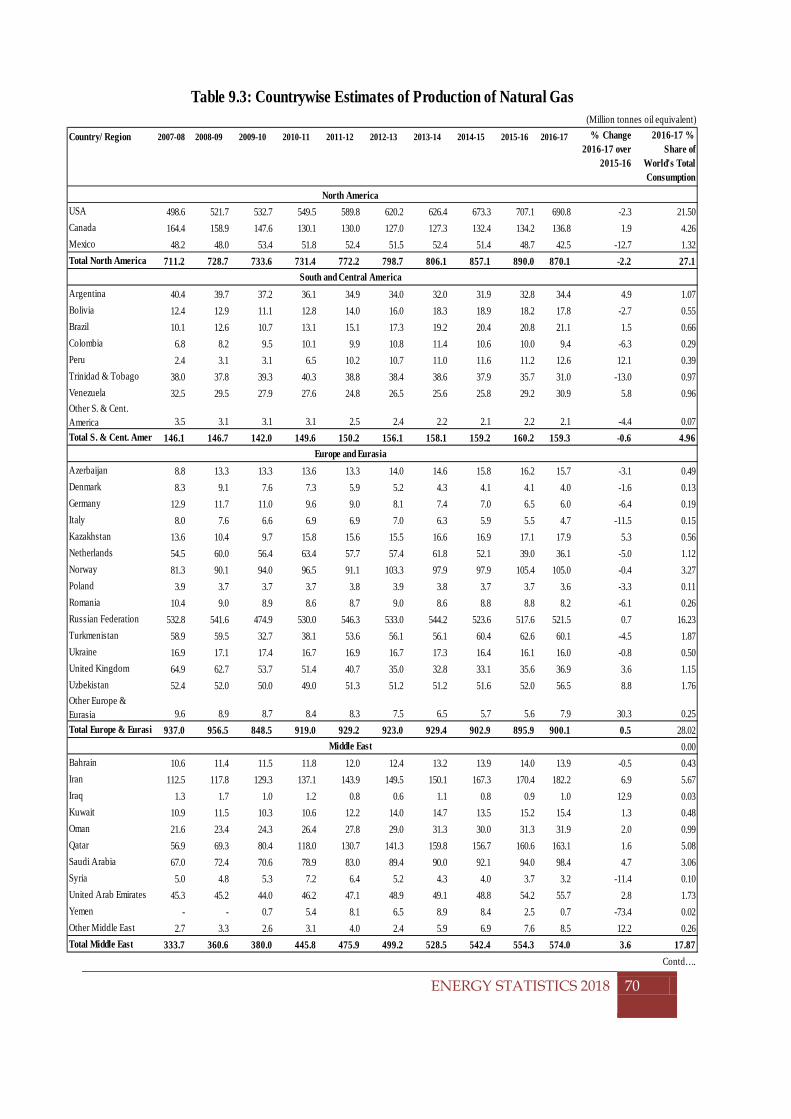
CHAPTER 9: WORLD PRODUCTION AND CONSUMPTION OF CRUDE OIL & NATURAL GAS
ENERGY STATISTICS 2018
70
Country/ Region 2007-08 2008-09 2009-10 2010-11 2011-12 2012-13 2013-14 2014-15 2015-16 2016-17
USA 498.6 521.7 532.7 549.5 589.8 620.2 626.4 673.3 707.1 690.8 -2.3 21.50Canada 164.4 158.9 147.6 130.1 130.0 127.0 127.3 132.4 134.2 136.8 1.9 4.26Mexico 48.2 48.0 53.4 51.8 52.4 51.5 52.4 51.4 48.7 42.5 -12.7 1.32Total North America 711.2 728.7 733.6 731.4 772.2 798.7 806.1 857.1 890.0 870.1 -2.2 27.1
Argentina 40.4 39.7 37.2 36.1 34.9 34.0 32.0 31.9 32.8 34.4 4.9 1.07Bolivia 12.4 12.9 11.1 12.8 14.0 16.0 18.3 18.9 18.2 17.8 -2.7 0.55Brazil 10.1 12.6 10.7 13.1 15.1 17.3 19.2 20.4 20.8 21.1 1.5 0.66Colombia 6.8 8.2 9.5 10.1 9.9 10.8 11.4 10.6 10.0 9.4 -6.3 0.29Peru 2.4 3.1 3.1 6.5 10.2 10.7 11.0 11.6 11.2 12.6 12.1 0.39Trinidad & Tobago 38.0 37.8 39.3 40.3 38.8 38.4 38.6 37.9 35.7 31.0 -13.0 0.97Venezuela 32.5 29.5 27.9 27.6 24.8 26.5 25.6 25.8 29.2 30.9 5.8 0.96Other S. & Cent. America 3.5 3.1 3.1 3.1 2.5 2.4 2.2 2.1 2.2 2.1 -4.4 0.07Total S. & Cent. Amer 146.1 146.7 142.0 149.6 150.2 156.1 158.1 159.2 160.2 159.3 -0.6 4.96
Azerbaijan 8.8 13.3 13.3 13.6 13.3 14.0 14.6 15.8 16.2 15.7 -3.1 0.49Denmark 8.3 9.1 7.6 7.3 5.9 5.2 4.3 4.1 4.1 4.0 -1.6 0.13Germany 12.9 11.7 11.0 9.6 9.0 8.1 7.4 7.0 6.5 6.0 -6.4 0.19Italy 8.0 7.6 6.6 6.9 6.9 7.0 6.3 5.9 5.5 4.7 -11.5 0.15Kazakhstan 13.6 10.4 9.7 15.8 15.6 15.5 16.6 16.9 17.1 17.9 5.3 0.56Netherlands 54.5 60.0 56.4 63.4 57.7 57.4 61.8 52.1 39.0 36.1 -5.0 1.12Norway 81.3 90.1 94.0 96.5 91.1 103.3 97.9 97.9 105.4 105.0 -0.4 3.27Poland 3.9 3.7 3.7 3.7 3.8 3.9 3.8 3.7 3.7 3.6 -3.3 0.11Romania 10.4 9.0 8.9 8.6 8.7 9.0 8.6 8.8 8.8 8.2 -6.1 0.26Russian Federation 532.8 541.6 474.9 530.0 546.3 533.0 544.2 523.6 517.6 521.5 0.7 16.23Turkmenistan 58.9 59.5 32.7 38.1 53.6 56.1 56.1 60.4 62.6 60.1 -4.5 1.87Ukraine 16.9 17.1 17.4 16.7 16.9 16.7 17.3 16.4 16.1 16.0 -0.8 0.50United Kingdom 64.9 62.7 53.7 51.4 40.7 35.0 32.8 33.1 35.6 36.9 3.6 1.15Uzbekistan 52.4 52.0 50.0 49.0 51.3 51.2 51.2 51.6 52.0 56.5 8.8 1.76Other Europe & Eurasia 9.6 8.9 8.7 8.4 8.3 7.5 6.5 5.7 5.6 7.9 30.3 0.25Total Europe & Eurasi 937.0 956.5 848.5 919.0 929.2 923.0 929.4 902.9 895.9 900.1 0.5 28.02
0.00Bahrain 10.6 11.4 11.5 11.8 12.0 12.4 13.2 13.9 14.0 13.9 -0.5 0.43Iran 112.5 117.8 129.3 137.1 143.9 149.5 150.1 167.3 170.4 182.2 6.9 5.67Iraq 1.3 1.7 1.0 1.2 0.8 0.6 1.1 0.8 0.9 1.0 12.9 0.03Kuwait 10.9 11.5 10.3 10.6 12.2 14.0 14.7 13.5 15.2 15.4 1.3 0.48Oman 21.6 23.4 24.3 26.4 27.8 29.0 31.3 30.0 31.3 31.9 2.0 0.99Qatar 56.9 69.3 80.4 118.0 130.7 141.3 159.8 156.7 160.6 163.1 1.6 5.08Saudi Arabia 67.0 72.4 70.6 78.9 83.0 89.4 90.0 92.1 94.0 98.4 4.7 3.06Syria 5.0 4.8 5.3 7.2 6.4 5.2 4.3 4.0 3.7 3.2 -11.4 0.10United Arab Emirates 45.3 45.2 44.0 46.2 47.1 48.9 49.1 48.8 54.2 55.7 2.8 1.73Yemen - - 0.7 5.4 8.1 6.5 8.9 8.4 2.5 0.7 -73.4 0.02Other Middle East 2.7 3.3 2.6 3.1 4.0 2.4 5.9 6.9 7.6 8.5 12.2 0.26Total Middle East 333.7 360.6 380.0 445.8 475.9 499.2 528.5 542.4 554.3 574.0 3.6 17.87
Contd….
Middle East
Table 9.3: Countrywise Estimates of Production of Natural Gas
% Change 2016-17 over
2015-16
2016-17 % Share of
World's Total Consumption
North America
South and Central America
Europe and Eurasia
(Million tonnes oil equivalent)
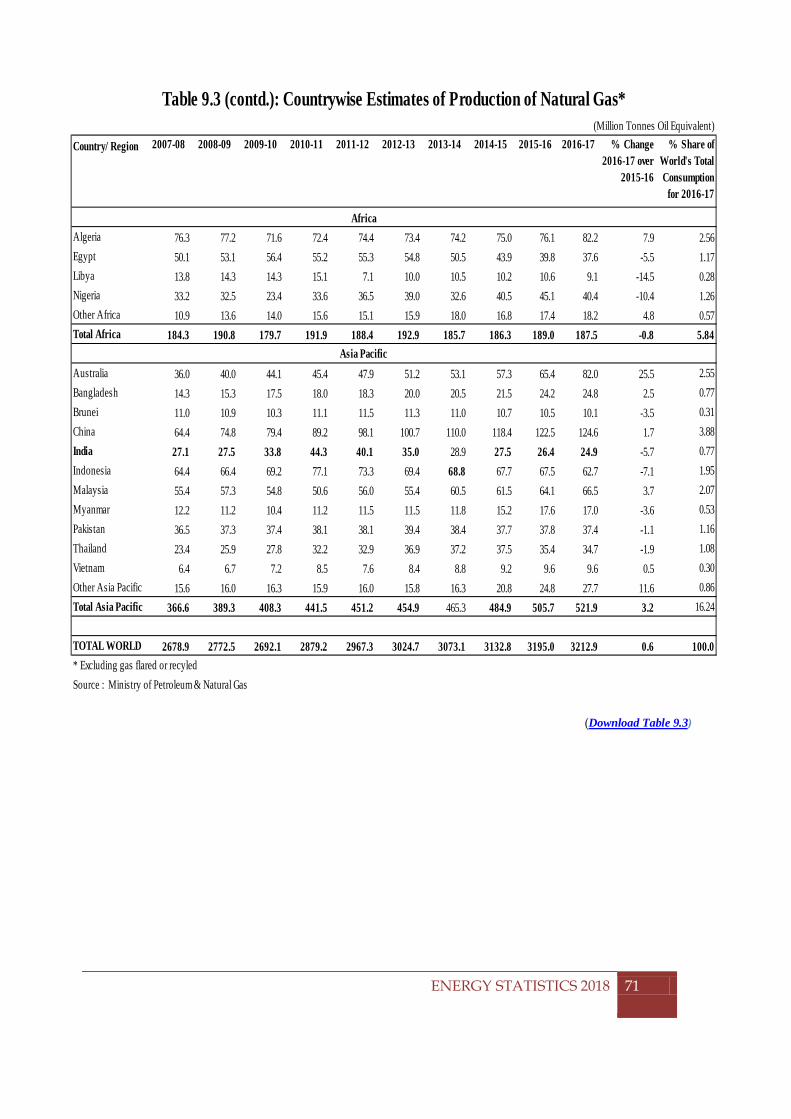
CHAPTER 9: WORLD PRODUCTION AND CONSUMPTION OF CRUDE OIL & NATURAL GAS
(Download Table 9.3)
ENERGY STATISTICS 2018
71
Country/ Region 2007-08 2008-09 2009-10 2010-11 2011-12 2012-13 2013-14 2014-15 2015-16 2016-17
Algeria 76.3 77.2 71.6 72.4 74.4 73.4 74.2 75.0 76.1 82.2 7.9 2.56Egypt 50.1 53.1 56.4 55.2 55.3 54.8 50.5 43.9 39.8 37.6 -5.5 1.17Libya 13.8 14.3 14.3 15.1 7.1 10.0 10.5 10.2 10.6 9.1 -14.5 0.28Nigeria 33.2 32.5 23.4 33.6 36.5 39.0 32.6 40.5 45.1 40.4 -10.4 1.26Other Africa 10.9 13.6 14.0 15.6 15.1 15.9 18.0 16.8 17.4 18.2 4.8 0.57Total Africa 184.3 190.8 179.7 191.9 188.4 192.9 185.7 186.3 189.0 187.5 -0.8 5.84
Australia 36.0 40.0 44.1 45.4 47.9 51.2 53.1 57.3 65.4 82.0 25.5 2.55Bangladesh 14.3 15.3 17.5 18.0 18.3 20.0 20.5 21.5 24.2 24.8 2.5 0.77Brunei 11.0 10.9 10.3 11.1 11.5 11.3 11.0 10.7 10.5 10.1 -3.5 0.31China 64.4 74.8 79.4 89.2 98.1 100.7 110.0 118.4 122.5 124.6 1.7 3.88India 27.1 27.5 33.8 44.3 40.1 35.0 28.9 27.5 26.4 24.9 -5.7 0.77Indonesia 64.4 66.4 69.2 77.1 73.3 69.4 68.8 67.7 67.5 62.7 -7.1 1.95Malaysia 55.4 57.3 54.8 50.6 56.0 55.4 60.5 61.5 64.1 66.5 3.7 2.07Myanmar 12.2 11.2 10.4 11.2 11.5 11.5 11.8 15.2 17.6 17.0 -3.6 0.53Pakistan 36.5 37.3 37.4 38.1 38.1 39.4 38.4 37.7 37.8 37.4 -1.1 1.16Thailand 23.4 25.9 27.8 32.2 32.9 36.9 37.2 37.5 35.4 34.7 -1.9 1.08Vietnam 6.4 6.7 7.2 8.5 7.6 8.4 8.8 9.2 9.6 9.6 0.5 0.30Other Asia Pacific 15.6 16.0 16.3 15.9 16.0 15.8 16.3 20.8 24.8 27.7 11.6 0.86Total Asia Pacific 366.6 389.3 408.3 441.5 451.2 454.9 465.3 484.9 505.7 521.9 3.2 16.24
TOTAL WORLD 2678.9 2772.5 2692.1 2879.2 2967.3 3024.7 3073.1 3132.8 3195.0 3212.9 0.6 100.0* Excluding gas flared or recyledSource : Ministry of Petroleum & Natural Gas
Asia Pacific
Table 9.3 (contd.): Countrywise Estimates of Production of Natural Gas* (Million Tonnes Oil Equivalent)
% Change 2016-17 over
2015-16
% Share of World's Total Consumption
for 2016-17
Africa
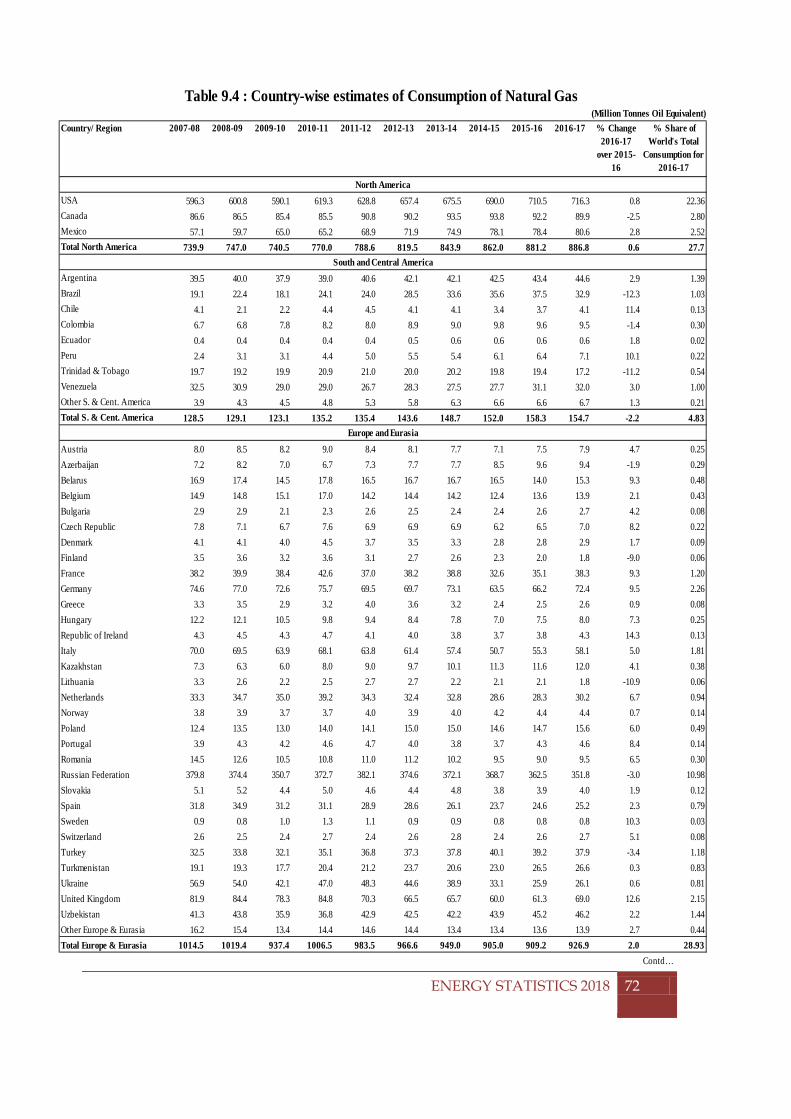
CHAPTER 9: WORLD PRODUCTION AND CONSUMPTION OF CRUDE OIL & NATURAL GAS
ENERGY STATISTICS 2018
72
Country/ Region 2007-08 2008-09 2009-10 2010-11 2011-12 2012-13 2013-14 2014-15 2015-16 2016-17
USA 596.3 600.8 590.1 619.3 628.8 657.4 675.5 690.0 710.5 716.3 0.8 22.36Canada 86.6 86.5 85.4 85.5 90.8 90.2 93.5 93.8 92.2 89.9 -2.5 2.80Mexico 57.1 59.7 65.0 65.2 68.9 71.9 74.9 78.1 78.4 80.6 2.8 2.52Total North America 739.9 747.0 740.5 770.0 788.6 819.5 843.9 862.0 881.2 886.8 0.6 27.7
Argentina 39.5 40.0 37.9 39.0 40.6 42.1 42.1 42.5 43.4 44.6 2.9 1.39Brazil 19.1 22.4 18.1 24.1 24.0 28.5 33.6 35.6 37.5 32.9 -12.3 1.03Chile 4.1 2.1 2.2 4.4 4.5 4.1 4.1 3.4 3.7 4.1 11.4 0.13Colombia 6.7 6.8 7.8 8.2 8.0 8.9 9.0 9.8 9.6 9.5 -1.4 0.30Ecuador 0.4 0.4 0.4 0.4 0.4 0.5 0.6 0.6 0.6 0.6 1.8 0.02Peru 2.4 3.1 3.1 4.4 5.0 5.5 5.4 6.1 6.4 7.1 10.1 0.22Trinidad & Tobago 19.7 19.2 19.9 20.9 21.0 20.0 20.2 19.8 19.4 17.2 -11.2 0.54Venezuela 32.5 30.9 29.0 29.0 26.7 28.3 27.5 27.7 31.1 32.0 3.0 1.00Other S. & Cent. America 3.9 4.3 4.5 4.8 5.3 5.8 6.3 6.6 6.6 6.7 1.3 0.21Total S. & Cent. America 128.5 129.1 123.1 135.2 135.4 143.6 148.7 152.0 158.3 154.7 -2.2 4.83
Austria 8.0 8.5 8.2 9.0 8.4 8.1 7.7 7.1 7.5 7.9 4.7 0.25Azerbaijan 7.2 8.2 7.0 6.7 7.3 7.7 7.7 8.5 9.6 9.4 -1.9 0.29Belarus 16.9 17.4 14.5 17.8 16.5 16.7 16.7 16.5 14.0 15.3 9.3 0.48Belgium 14.9 14.8 15.1 17.0 14.2 14.4 14.2 12.4 13.6 13.9 2.1 0.43Bulgaria 2.9 2.9 2.1 2.3 2.6 2.5 2.4 2.4 2.6 2.7 4.2 0.08Czech Republic 7.8 7.1 6.7 7.6 6.9 6.9 6.9 6.2 6.5 7.0 8.2 0.22Denmark 4.1 4.1 4.0 4.5 3.7 3.5 3.3 2.8 2.8 2.9 1.7 0.09Finland 3.5 3.6 3.2 3.6 3.1 2.7 2.6 2.3 2.0 1.8 -9.0 0.06France 38.2 39.9 38.4 42.6 37.0 38.2 38.8 32.6 35.1 38.3 9.3 1.20Germany 74.6 77.0 72.6 75.7 69.5 69.7 73.1 63.5 66.2 72.4 9.5 2.26Greece 3.3 3.5 2.9 3.2 4.0 3.6 3.2 2.4 2.5 2.6 0.9 0.08Hungary 12.2 12.1 10.5 9.8 9.4 8.4 7.8 7.0 7.5 8.0 7.3 0.25Republic of Ireland 4.3 4.5 4.3 4.7 4.1 4.0 3.8 3.7 3.8 4.3 14.3 0.13Italy 70.0 69.5 63.9 68.1 63.8 61.4 57.4 50.7 55.3 58.1 5.0 1.81Kazakhstan 7.3 6.3 6.0 8.0 9.0 9.7 10.1 11.3 11.6 12.0 4.1 0.38Lithuania 3.3 2.6 2.2 2.5 2.7 2.7 2.2 2.1 2.1 1.8 -10.9 0.06Netherlands 33.3 34.7 35.0 39.2 34.3 32.4 32.8 28.6 28.3 30.2 6.7 0.94Norway 3.8 3.9 3.7 3.7 4.0 3.9 4.0 4.2 4.4 4.4 0.7 0.14Poland 12.4 13.5 13.0 14.0 14.1 15.0 15.0 14.6 14.7 15.6 6.0 0.49Portugal 3.9 4.3 4.2 4.6 4.7 4.0 3.8 3.7 4.3 4.6 8.4 0.14Romania 14.5 12.6 10.5 10.8 11.0 11.2 10.2 9.5 9.0 9.5 6.5 0.30Russian Federation 379.8 374.4 350.7 372.7 382.1 374.6 372.1 368.7 362.5 351.8 -3.0 10.98Slovakia 5.1 5.2 4.4 5.0 4.6 4.4 4.8 3.8 3.9 4.0 1.9 0.12Spain 31.8 34.9 31.2 31.1 28.9 28.6 26.1 23.7 24.6 25.2 2.3 0.79Sweden 0.9 0.8 1.0 1.3 1.1 0.9 0.9 0.8 0.8 0.8 10.3 0.03Switzerland 2.6 2.5 2.4 2.7 2.4 2.6 2.8 2.4 2.6 2.7 5.1 0.08Turkey 32.5 33.8 32.1 35.1 36.8 37.3 37.8 40.1 39.2 37.9 -3.4 1.18Turkmenistan 19.1 19.3 17.7 20.4 21.2 23.7 20.6 23.0 26.5 26.6 0.3 0.83Ukraine 56.9 54.0 42.1 47.0 48.3 44.6 38.9 33.1 25.9 26.1 0.6 0.81United Kingdom 81.9 84.4 78.3 84.8 70.3 66.5 65.7 60.0 61.3 69.0 12.6 2.15Uzbekistan 41.3 43.8 35.9 36.8 42.9 42.5 42.2 43.9 45.2 46.2 2.2 1.44Other Europe & Eurasia 16.2 15.4 13.4 14.4 14.6 14.4 13.4 13.4 13.6 13.9 2.7 0.44Total Europe & Eurasia 1014.5 1019.4 937.4 1006.5 983.5 966.6 949.0 905.0 909.2 926.9 2.0 28.93
Contd…
Table 9.4 : Country-wise estimates of Consumption of Natural Gas (Million Tonnes Oil Equivalent)
Europe and Eurasia
% Change 2016-17
over 2015-16
% Share of World's Total
Consumption for 2016-17
North America
South and Central America
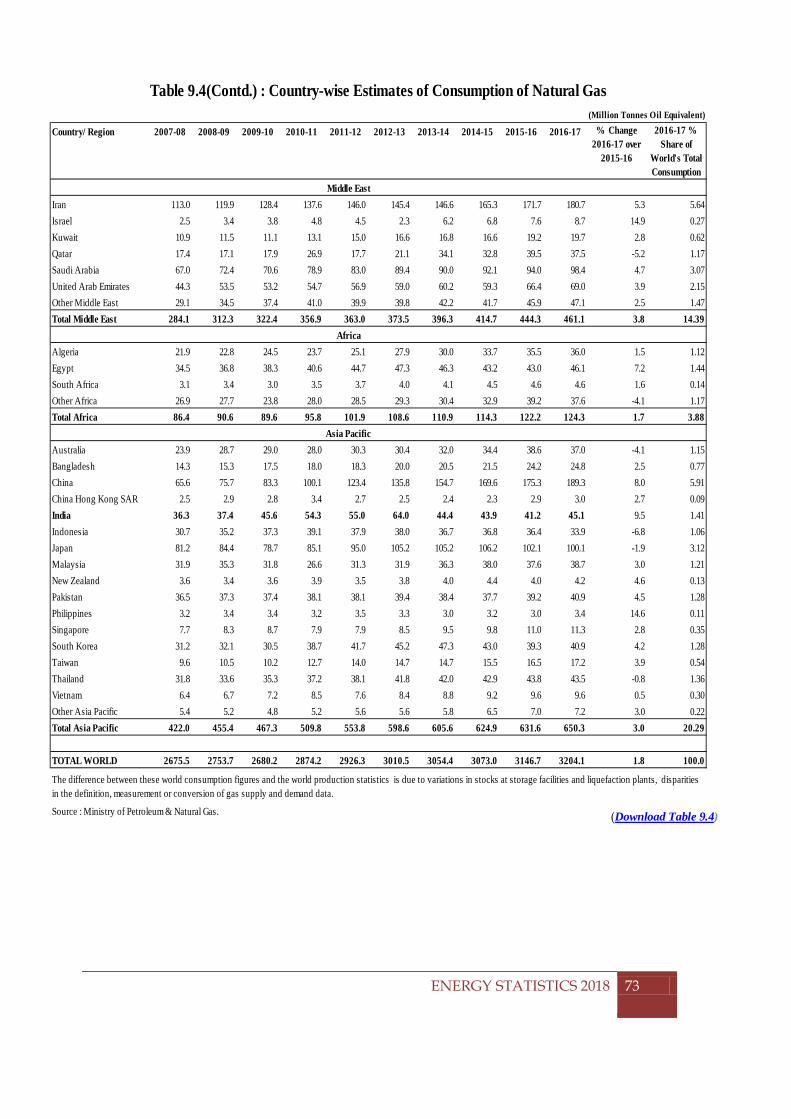
CHAPTER 9: WORLD PRODUCTION AND CONSUMPTION OF CRUDE OIL & NATURAL GAS
(Download Table 9.4)
ENERGY STATISTICS 2018
73
(Million Tonnes Oil Equivalent)
Country/ Region 2007-08 2008-09 2009-10 2010-11 2011-12 2012-13 2013-14 2014-15 2015-16 2016-17
Iran 113.0 119.9 128.4 137.6 146.0 145.4 146.6 165.3 171.7 180.7 5.3 5.64Israel 2.5 3.4 3.8 4.8 4.5 2.3 6.2 6.8 7.6 8.7 14.9 0.27Kuwait 10.9 11.5 11.1 13.1 15.0 16.6 16.8 16.6 19.2 19.7 2.8 0.62Qatar 17.4 17.1 17.9 26.9 17.7 21.1 34.1 32.8 39.5 37.5 -5.2 1.17Saudi Arabia 67.0 72.4 70.6 78.9 83.0 89.4 90.0 92.1 94.0 98.4 4.7 3.07United Arab Emirates 44.3 53.5 53.2 54.7 56.9 59.0 60.2 59.3 66.4 69.0 3.9 2.15Other Middle East 29.1 34.5 37.4 41.0 39.9 39.8 42.2 41.7 45.9 47.1 2.5 1.47Total Middle East 284.1 312.3 322.4 356.9 363.0 373.5 396.3 414.7 444.3 461.1 3.8 14.39
Algeria 21.9 22.8 24.5 23.7 25.1 27.9 30.0 33.7 35.5 36.0 1.5 1.12Egypt 34.5 36.8 38.3 40.6 44.7 47.3 46.3 43.2 43.0 46.1 7.2 1.44South Africa 3.1 3.4 3.0 3.5 3.7 4.0 4.1 4.5 4.6 4.6 1.6 0.14Other Africa 26.9 27.7 23.8 28.0 28.5 29.3 30.4 32.9 39.2 37.6 -4.1 1.17Total Africa 86.4 90.6 89.6 95.8 101.9 108.6 110.9 114.3 122.2 124.3 1.7 3.88
Australia 23.9 28.7 29.0 28.0 30.3 30.4 32.0 34.4 38.6 37.0 -4.1 1.15Bangladesh 14.3 15.3 17.5 18.0 18.3 20.0 20.5 21.5 24.2 24.8 2.5 0.77China 65.6 75.7 83.3 100.1 123.4 135.8 154.7 169.6 175.3 189.3 8.0 5.91China Hong Kong SAR 2.5 2.9 2.8 3.4 2.7 2.5 2.4 2.3 2.9 3.0 2.7 0.09India 36.3 37.4 45.6 54.3 55.0 64.0 44.4 43.9 41.2 45.1 9.5 1.41Indonesia 30.7 35.2 37.3 39.1 37.9 38.0 36.7 36.8 36.4 33.9 -6.8 1.06Japan 81.2 84.4 78.7 85.1 95.0 105.2 105.2 106.2 102.1 100.1 -1.9 3.12Malaysia 31.9 35.3 31.8 26.6 31.3 31.9 36.3 38.0 37.6 38.7 3.0 1.21New Zealand 3.6 3.4 3.6 3.9 3.5 3.8 4.0 4.4 4.0 4.2 4.6 0.13Pakistan 36.5 37.3 37.4 38.1 38.1 39.4 38.4 37.7 39.2 40.9 4.5 1.28Philippines 3.2 3.4 3.4 3.2 3.5 3.3 3.0 3.2 3.0 3.4 14.6 0.11Singapore 7.7 8.3 8.7 7.9 7.9 8.5 9.5 9.8 11.0 11.3 2.8 0.35South Korea 31.2 32.1 30.5 38.7 41.7 45.2 47.3 43.0 39.3 40.9 4.2 1.28Taiwan 9.6 10.5 10.2 12.7 14.0 14.7 14.7 15.5 16.5 17.2 3.9 0.54Thailand 31.8 33.6 35.3 37.2 38.1 41.8 42.0 42.9 43.8 43.5 -0.8 1.36Vietnam 6.4 6.7 7.2 8.5 7.6 8.4 8.8 9.2 9.6 9.6 0.5 0.30Other Asia Pacific 5.4 5.2 4.8 5.2 5.6 5.6 5.8 6.5 7.0 7.2 3.0 0.22Total Asia Pacific 422.0 455.4 467.3 509.8 553.8 598.6 605.6 624.9 631.6 650.3 3.0 20.29
TOTAL WORLD 2675.5 2753.7 2680.2 2874.2 2926.3 3010.5 3054.4 3073.0 3146.7 3204.1 1.8 100.0
Source : Ministry of Petroleum & Natural Gas.
The difference between these world consumption figures and the world production statistics is due to variations in stocks at storage facilities and liquefaction plants, disparities in the definition, measurement or conversion of gas supply and demand data.
Asia Pacific
Table 9.4(Contd.) : Country-wise Estimates of Consumption of Natural Gas
% Change 2016-17 over
2015-16
2016-17 % Share of
World's Total Consumption
Middle East
Africa
CHAPTER 10: ENERGY INDICATORS
CHAPTER 10: ENERGY INDICATORS
The availability of resources and the reliability of their supply are essential for a sustainable economic growth. All sectors of the economy including residential, commercial, transportation, service and agricultural sectors depend on secure, sufficient and efficient energy services. Job availability, industrial productivity, urban and rural development and all major economic activities are strongly affected by energy input. The most important form of energy, viz. electricity is an important and sometimes irreplaceable input to modern productive activities, communication, dissemination of information and other service industries.
10.1 ENERGY INDICATORS
Energy indicators are the medium to provide a snap shot of the energy scenario of the country. They help to understand the various aspects of energy and are capable of detecting the grey areas in the complete chain of energy flow. Energy and energy efficiency indicators are indispensable tools for identifying and understanding the key drivers of trends, and for prioritizing interventions to control energy consumption growth. Indicators are also effective in quantifying the potential impact and benefits of interventions. While defining and constructing energy indicators is rather flexible, their accuracy strongly depends on the quality and detail of available energy end-use data.
As per “Energy Indicators for Sustainable Development: Guidelines and Methodology” the list of indicators includes indicators on Social, Economic and Environment. While the importance of these various indicators is recognized and since Social and Environmental indicators require additional levels of detail than that are presented in Energy Statistics his report is restricted to the economic dimension only due to non-availability of data or Energy Balance and therefore only Economic Indicators are presented in this publication.
Yet, choosing and developing appropriate indicators to support the development of policies is not straightforward. This publication should enable energy analysts and policy makers to: Identify priority areas for the development of energy sector and develop a strategy to advance policy development through the improved use of indicators to track progress of energy policies. No set of energy indicators can be final and definitive. To be useful, indicators must evolve over time to fit country-specific conditions, priorities and capabilities. The information inherent in these indicators is not only meaningful for internal management, but also of interest for external users.
ENERGY STATISTICS 2018
74
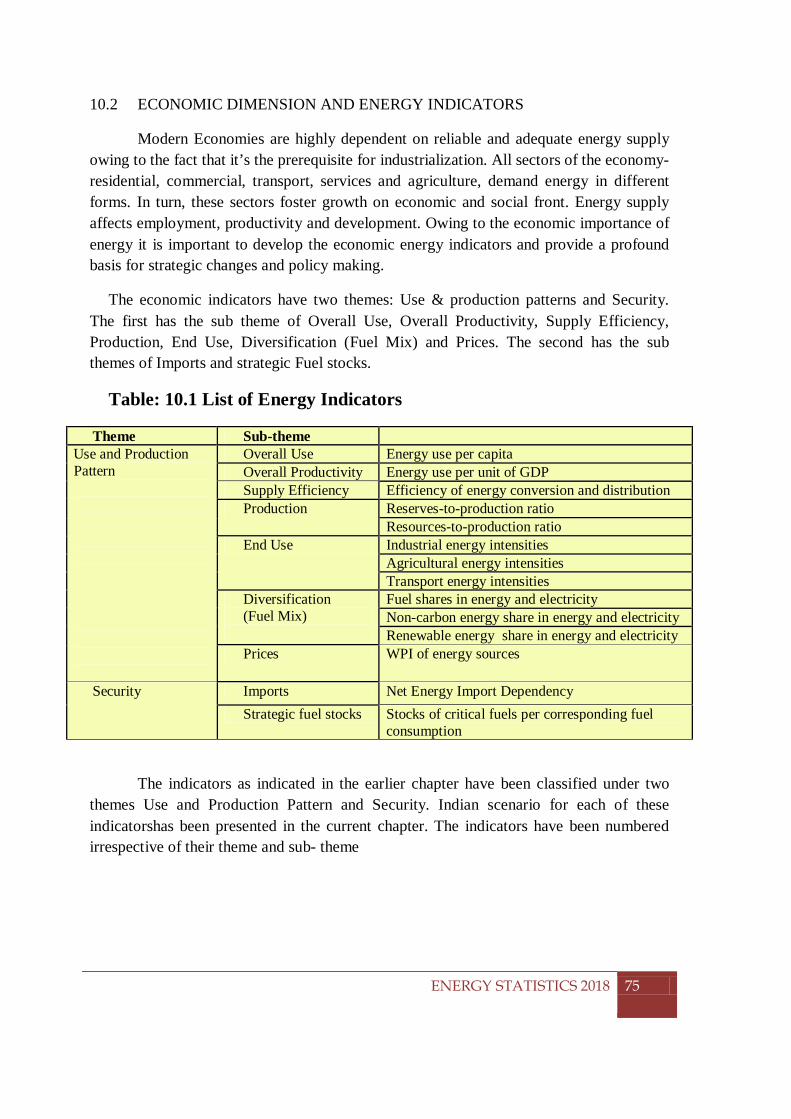
CHAPTER 10: ENERGY INDICATORS
10.2 ECONOMIC DIMENSION AND ENERGY INDICATORS
Modern Economies are highly dependent on reliable and adequate energy supply owing to the fact that it’s the prerequisite for industrialization. All sectors of the economy- residential, commercial, transport, services and agriculture, demand energy in different forms. In turn, these sectors foster growth on economic and social front. Energy supply affects employment, productivity and development. Owing to the economic importance of energy it is important to develop the economic energy indicators and provide a profound basis for strategic changes and policy making.
The economic indicators have two themes: Use & production patterns and Security. The first has the sub theme of Overall Use, Overall Productivity, Supply Efficiency, Production, End Use, Diversification (Fuel Mix) and Prices. The second has the sub themes of Imports and strategic Fuel stocks.
Table: 10.1 List of Energy Indicators
Theme Sub-theme Use and Production Pattern
Overall Use Energy use per capita Overall Productivity Energy use per unit of GDP Supply Efficiency Efficiency of energy conversion and distribution Production Reserves-to-production ratio
Resources-to-production ratio End Use Industrial energy intensities
Agricultural energy intensities Transport energy intensities
Diversification (Fuel Mix)
Fuel shares in energy and electricity Non-carbon energy share in energy and electricity Renewable energy share in energy and electricity
Prices WPI of energy sources
Security Imports Net Energy Import Dependency Strategic fuel stocks Stocks of critical fuels per corresponding fuel
consumption
The indicators as indicated in the earlier chapter have been classified under two themes Use and Production Pattern and Security. Indian scenario for each of these indicatorshas been presented in the current chapter. The indicators have been numbered irrespective of their theme and sub- theme
ENERGY STATISTICS 2018
75
CHAPTER 10: ENERGY INDICATORS
10.3. THEME: USE AND PRODUCTION PATTERN
This theme is further sub classified into sub themes as Overall Use, Overall Productivity, Supply Efficiency, Production, End Use, Diversification (Fuel Mix) and Prices.
SUB THEME: OVERALL USE
10.3.1. Energy Indicator: Energy Use per Capita-
Purpose and Measurement method: This indicator measures the level of energy use on per capita basis and reflects the energy-use patterns and aggregate energy intensity of a society. It is calculated as the ratio of the total annual use of energy to the mid-year population. It may be further classified as follows:
a) Total Primary energy supply per capita b) Total Final consumption of energy per capita c) Electricity use per capita
SUB THEME: OVERALL PRODUCTIVITY
10.3.2. Energy Indicator: Energy Use Per Unit of GDP
Purpose and Measurement method: This indicator reflects the trends in overall energy use relative to GDP, indicating the general relationship of energy use to economic development. This indicator is calculated as the ratio of energy use to economic output. Here Energy Use indicates Total Primary Energy Supply (TPES), Total Final Consumption (TFC) and final electricity consumption and Output is taken as GDP measured in thousand INR. It may be further classified as follows:
a) Total Primary energy supply per 000’ rupees b) Total Final consumption of energy per 000’rupees c) Electricity Use per 000’ rupees
SUB THEME: PRODUCTION 10.3.3. Energy Indicator:
I. Reserve-to-Production Ratio
Purpose and Measurement method: – The purpose of this indicator is to
measure the availability of national energy reserves with respect to corresponding fuel production. Reserves are generally defined as identified
ENERGY STATISTICS 2018
76
CHAPTER 10: ENERGY INDICATORS
(demonstrated and inferred) resources that are economically recoverable at the time of assessment. The indicator provides a basis for estimating future energy supplies in years with respect to current availability of energy reserves and levels of production.
It is computed by dividing the proven energy reserves of a commodity at the end of a year by the total production of that commodity in that year.
II. Resources To Production Ratio
Purpose and Measurement method: – The purpose of this indicator is to
measure the availability of national energy resources with respect to corresponding fuel production. Total resources include reserves, and hypothetical and speculative undiscovered resources. It provides a relative measure of the length of time that resources would last if production were to continue at current levels.
The lifetime of fuel resources in terms of years by using resources-to-production ratio is computed by dividing the total energy resources of a commodity at the end of a year by the total production of that commodity in that year.
SUB THEME: END USE 10.3.4. Energy Indicator:End Use Energy Intensities
I. Industrial Energy Intensities- Purpose and Measurement method: – This set of indicators measures the
aggregate energy use of the industrial sector and selected energy intensive industries per corresponding value added. Intensities provide information about the relative energy use per thousand units of output. The set is used to analyze trends in energy efficiency and evaluating trends in technological improvements. It is measured as Energy Use per thousand units of value added by industrial sector and by selected energy intensive industries.
II. Agricultural Energy Intensities
Purpose and Measurement method: – This indicator is a measure of
aggregate energy intensity in the agricultural sector that can be used for analyzing trends, particularly in renewables and non-commercial energy use. It is measured as Energy Use per thousand units of value added by Agriculture sector.
ENERGY STATISTICS 2018
77
CHAPTER 10: ENERGY INDICATORS
III. Transport Energy Intensities
Purpose and Measurement method: – This indicator is used to monitor
trends in energy use in the Transport sector. It is measured as Energy Use per thousand units of value added by Transport sector. The transport indicators measure how much energy is used for moving both goods and people. Transport is a major user of energy, mostly in the form of oil products, which makes transport the most important driver behind growth in global oil demand.
It is evident from the value of the indicator that industrial sector and transport sector are energy intensive. It must be noted that changes in the aggregate indicator can also be due to change in relative output of the sector. Hence we can say that the difference seen across the time development do not necessarily reflect differences in energy efficiency.
SUB THEME: DIVERSIFICATION
10.3.5. Energy Indicator: Fuel share in energy and electricity I. Fuel Share In Energy
II. Fuel Share Inelectricity
Purpose and Measurement method: – This indicator provides the share of fuels in TPES, TFC and electricity generation. This indicator is computed by calculating the ratio of consumption or production of the specific energy fuels identified above to total energy use or production with respect to:
i. TPES, ii. TFC and
iii. Electricity generation
10.3.6. Energy Indicator: Non carbon energy share in energy and electricity I. Non Carbon Energy Share In Energy
II. Non Carbon Energy Share In Electricity
Purpose and Measurement method: – This indicator measures the share of non-carbon energy sources in TPES and electricity generation. Share of non- carbon energy in TPES is computed by calculating the ratio of primary supply of non-carbon energy to TPES. The share of non-carbon in electricity generation is the total electricity generated from non-carbon energy sources divided by total electricity generated.
10.3.7. Energy Indicator: Renewable energy share in energy and electricity
I. Renewable Energy Share In TPES II. Renewable Energy Share In TFC
III. Renewable Energy Share In Electricity ENERGY STATISTICS 2018
78
CHAPTER 10: ENERGY INDICATORS
Purpose and Measurement method: – This indicator measures the share of Renewable energy in TPES, TFC and electricity generation. This indicator is computed by calculating the ratio of the consumption and production of renewables to total final energy supply and production. The share of renewables in electricity is the electricity generated from renewables divided by total electricity generated.
SUB THEME: PRICES 10.3.8. Energy Indicator: WPI Of Energy Sources
Purpose and Measurement method: – This is a price indicator of energy
sources and reflects the price change with respect to base year 2004-05. It is to be noted that energy prices are driving forces for incentive or conservation, or efficiency improvements. Also, it shows affordability and therefore is one of the factors responsible for fuel diversification.
SUB THEME: SUPPLY EFFICIENCY
10.3.9. Energy Indicator: Efficiency of energy conversion and distribution
Purpose and Measurement method: – This indicator measures the efficiency
of energy conversion and distribution systems in various energy supply chains including losses occurring during electricity transmission and distribution, and gas transportation and distribution. Due to constraint of data availability only the losses in transmission of electricity are used. The indicator is calculated as ratio of losses in transmission of electricity to electricity generated.
10.4 THEME: SECURITY
SUB THEME: STRATEGIC FUEL STOCKS
10.4.1 Energy Indicator: Stock Of Critical Fuels perCorresponding Fuel consumption
Purpose and Measurement method: – The purpose of this indicator is to measure the availability of national stocks of critical fuels, such as oil, with respect to corresponding fuel consumption. Many countries maintain stocks of oil in anticipation of disruptions in oil supply. For some countries, the critical fuel might be natural gas or other types of fuel. In Indian context we have taken coal as critical fuel. The indicator provides a relative measure of the length of time that stocks would last if supply were disrupted and fuel use were to continue at current levels. This indicator is defined by dividing the stocks of the critical fuels maintained by countries by the corresponding annual fuel consumption.
ENERGY STATISTICS 2018
79
SUB THEME: IMPORTS
10.4.2 Energy Indicator: Net energy import dependency
Purpose and Measurement method: – This indicator measures the extent to which a country relies on imports to meet its energy requirements. This indicator is computed by calculating the ratio of net imports to consumption. Petroleum products are excluded as India is net exporter of them and have taken into account only the import value of different energy sources to calculate the indicator.
ENERGY STATISTICS 2018
80
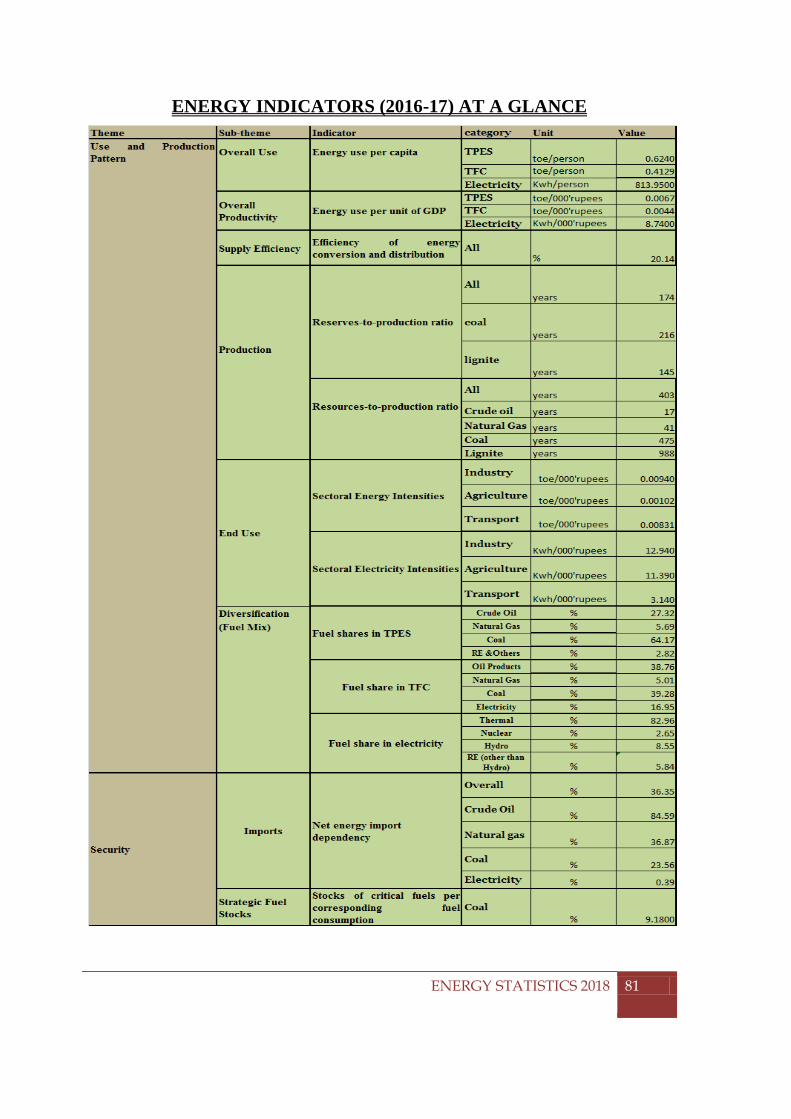
/ENERGY INDICATORS (2016-17) AT A GLANCE
ENERGY INDICATORS (2016-17) AT A GLANCE
ENERGY STATISTICS 2018
81
DEFINITIONS OF ENERGY PRODUCTS
ANNEX- I
DEFINITIONS OF ENERGY PRODUCTS 1. Solid fuels
i. Hard Coal: Coals with a gross calorific value (moist, ash-free basis) which is not less than 24 MJ/kg or which is less than 24 MJ/kg provided that the coal has a vitrinite mean random reflectancegreater than or equal to 0.6 per cent. Hard coal comprises anthracite and bituminous coals.
ii. Lignite: Brown coal with a gross calorific value (moist, ash-free basis) less than
20 MJ/kg. iii. Coke: Products derived directly or indirectly from the various classes of coal by
carbonisation or pyrolysis processes, or by the aggregation of finely divided coal or by chemical reactions with oxidising agents, including water.
iv. Proved Reserves:A ‘Proven Mineral Reserve’ is the economically mineable part of a Measured Mineral Resource demonstrated by at least a Preliminary Feasibility Study. This Study must include adequate information on mining, processing, metallurgical, economic, and other relevant factors that demonstrate, at the time of reporting, that economic extraction is justified.
v. Indicated Reserves: An ‘Indicated Mineral Resource’ is that part of a Mineral Resource for which quantity, grade or quality, densities, shape and physical characteristics can be estimated with a level of confidence sufficient to allow the appropriate application of technical and economic parameters, to support mine planning and evaluation of the economic viability of the deposit. The estimate is based on detailed and reliable exploration and testing information gathered through appropriate techniques from locations such as outcrops, trenches, pits, workings and drill holes that are spaced closely enough for geological and grade continuity to be reasonably assumed.
vi. Inferred Reserves: An ‘Inferred Mineral Resource’ is that part of a Mineral Resource for which quantity and grade or quality can be estimated on the basis of geological evidence and limited sampling and reasonably assumed, but not verified, geological and grade continuity. The estimate is based on limited information and sampling gathered through appropriate techniques from locations such as outcrops, trenches, pits, workings and drill holes. Due to the uncertainty that may be attached to Inferred Mineral Resources, it cannot be assumed that all or any part of an Inferred Mineral Resource will be upgraded to an Indicated or Measured Mineral Resource as a result of continued exploration. Confidence in the estimate is insufficient to allow the meaningful application of technical and economic parameters or to enable an evaluation of economic viability worthy of
ENERGY STATISTICS 2018
82
DEFINITIONS OF ENERGY PRODUCTS
public disclosure. Inferred Mineral Resources must be excluded from estimates forming the basis of feasibility or other economic studies
2. Liquid fuels
i. Crude petroleumA mineral oil of fossil origin extracted by conventional means from underground reservoirs, and comprises liquid or near-liquid hydrocarbons and associated impurities such as sulphur and metals. Remark: Conventional crude oil exists in the liquid phase under normal surface temperature and pressure, and usually flows to the surface under the pressure of the reservoir. This is termed “conventional” extraction. Crude oil includes condensate from condensate fields, and “field” or “lease” condensate extracted with the crude oil. The various crude oils may be classified according to their sulphur content (“sweet” or“sour”) and API gravity (“heavy” or “light”). There are no rigorous specifications for the classifications but a heavy crude oil may be assumed to have an API gravity of less than 20º and a sweet crude oil may be assumed to have less than 0.5% sulphur content.
ii. Liquefied petroleum LPG refers to liquefied propane (C3H8) and butane (C4H10)
or mixtures of both. Commercial grades are usually mixtures of the gases with small amounts of propylene, butylene, isobutene and isobutylene stored under pressure in containers. Remark: The mixture of propane and butane used varies according to purpose and season of the year. The gases may be extracted from natural gas at gas separation plants or at plants re-gasifying imported liquefied natural gas. They are also obtained during the refining of crude oil. LPG may be used for heating and as a vehicle fuel. Certain oil field practices also use the term LPG to describe the high vapour pressure components of natural gas liquids.
iii. Motor gasoline A mixture of some aromatics (e.g., benzene and toluene) and aliphatic hydrocarbons in the C5 to C12 range. The distillation range is 25ºC to 220ºC. Remark: Additives are blended to improve octane rating, improve combustion performance, reduce oxidation during storage, maintain cleanliness of the engine and improve capture of pollutants by catalytic converters in the exhaust system. Motor gasoline may also contain bio-gasoline products.
iv. Naphtha Light or medium oils distilling between 30ºC and 210ºC which do not meet thespecification for motor gasoline. Remark: Different naphthas are distinguished by their density and the content of paraffins, isoparaffins, olefins, naphthenes and aromatics. The main uses for
ENERGY STATISTICS 2018
83
DEFINITIONS OF ENERGY PRODUCTS
naphthas are as feedstock for high octane gasolines and the manufacture of olefins in the petrochemical industry.
v. Kerosene Mixtures of hydrocarbons in the range C9 to C16 and distilling over the temperature interval 145ºC to 300°C, but not usually above 250ºC and with a flash point above 38ºC. Remark: The chemical compositions of kerosenes depend on the nature of the crude oils from which they are derived and the refinery processes that they have undergone. Kerosenes obtained from crude oil by atmospheric distillation are known as straight-run kerosenes. Such streams may be treated by a variety of processes to produce kerosenes that are acceptable for blending as jet fuels. Kerosenes are primarily used as jet fuels. They are also used as domestic heating and cooking fuels, and as solvents. Kerosenes may include components or additives derived from biomass.
vi. Gasoline-type Jet fuels Light hydrocarbons for use in aviation turbine power
units, distilling between 100ºC and 250ºC. They are obtained by blending kerosene and gasoline or naphtha in such a way that the aromatic content does not exceed 25 per cent in volume, and the vapour pressure is between 13.7 kPa and 20.6 kPa. Remark: Gasoline-type jet fuel is also known as “aviation turbine fuel”.
vii. Gas oil / Diesel oil Gas oils are middle distillates, predominantly of carbon number range C11 to C25 and with a distillation range of 160ºC to 420°C. Remark: The principal marketed products are fuels for diesel engines (diesel oil), heating oils and marine fuel. Gas oils are also used as middle distillate feedstock for the petrochemical industry and as solvents.
viii. Fuel oil Comprises residual fuel oil and heavy fuel oil. Residual fuel oils have a distillation range of 350ºC to 650ºC and a kinematic viscosity in the range 6 to 55 cSt at 100ºC. Their flash point is always above 60ºC and their specific gravity is above 0.95. Heavy fuel oil is a general term describing a blended product based on the residues from various refineryprocesses. Remark: Other names commonly used to describe fuel oil include: bunker fuel, bunker C, fuel oil No. 6, industrial fuel oil, marine fuel oil and black oil. Residual and heavy fuel oil are used in medium to large industrial plants, marine applications and power stations in combustion equipment such as boilers, furnaces and diesel engines. Residual fuel oil is also used as fuel within the refinery.
ix. Lubricants Oils, produced from crude oil, for which the principal use is to reduce
friction between sliding surfaces and during metal cutting operations. Remark: Lubricant base stocks are obtained from vacuum distillates which result from further distillation of the residue from atmospheric distillation of crude oil.
ENERGY STATISTICS 2018
84
DEFINITIONS OF ENERGY PRODUCTS
The lubricant base stocks are then further processed to produce lubricants with the desired properties.
x. Petroleum coke Petroleum coke is a black solid obtained mainly by cracking and
carbonizing heavy hydrocarbon oils, tars and pitches. It consists mainly of carbon (90 to 95 per cent) and has a low ash content.The two most important categories are "green coke" and "calcined coke".
xi. Green coke (raw coke) is the primary solid carbonization product from high boiling hydrocarbon fractions obtained at temperatures below 630ºC. It contains 4-15 per cent by weight of matter that can be released as volatiles during subsequent heat treatment at temperatures up to approximately 1330ºC. Calcined coke is a petroleum coke or coal-derived pitch coke obtained by heat treatment of green coke to about 1330ºC. It will normally have a hydrogen content of less than 0.1 percent by weight. Remark: In many catalytic operations (e.g., catalytic cracking) carbon or catalytic coke is deposited on the catalyst, thus deactivating it. The catalyst is reactivated by burning off the coke which is used as a fuel in the refining process. The coke is not recoverable in a concentrated form
xii. Bitumen (Asphalt) A solid, semi-solid or viscous hydrocarbon with a colloidal structure, being brown to black in color. Remark: It is obtained as a residue in the distillation of crude oil and by vacuum distillation of oil residues from atmospheric distillation. It should not be confused with the nonconventional primary extra heavy oils which may also be referred to as bitumen. In addition to its major use for road pavements, bitumen is also used as an adhesive, a waterproofing agent for roof coverings and as a binder in the manufacture of patent fuel. It may also be used for electricity generation in specially designed power plants. Bitumen is also known in some countries as asphalt but in others asphalt describes the mixture of bitumen and stone aggregate used for road pavements.
xiii. Refinery gas is a non-condensable gas collected in petroleum refineries (it is also known as still gas).
3. Gaseous fuels
i. Natural Gas: A mixture of gaseous hydrocarbons, primarily methane, but generally also including ethane, propane and higher hydrocarbons in much smaller amounts and some noncombustible gases such as nitrogen and carbon dioxide. Remark: The majority of natural gas is separated from both "non-associated" gas originating from fields producing hydrocarbons only in gaseous form, and "associated" gas produced in association with crude oil. The separation process produces natural gas by removing or reducing the hydrocarbons other than
ENERGY STATISTICS 2018
85
DEFINITIONS OF ENERGY PRODUCTS
methane to levels which are acceptable in the marketable gas. The natural gas the natural gasliquids (NGL) removed in the process are distributed separately.
ii. Coke-oven gas:A gas produced from coke ovens during the manufacture of coke oven coke.
iii. Biogases: Gases arising from the anaerobic fermentation of biomass and the
gasification of solid biomass (including biomass in wastes). Remark: The biogases from anaerobic fermentation are composed principally of methane and carbon dioxide and comprise landfill gas, sewage sludge gas and other biogases from anaerobic fermentation.Biogases can also be produced from thermal processes (by gasification or pyrolysis) of biomass and are mixtures containing hydrogen and carbon monoxide (usually known as syngas) along with other components. These gases may be further processed to modify their composition and can be further processed to produce substitute natural gas. The gases are divided into two groups according to their production: biogases from anaerobic fermentation and biogases from thermal processes. They are used mainly as a fuel but can be used as a chemical feedstock.
4. Electricity
i. Installed capacity: The net capacity measured at the terminals of the stations, i.e., after deduction of the power absorbed by the auxiliary installations and the losses in the station transformers.
ii. Utilities: undertakings of which the essential purpose is the production,
transmission and distribution of electric energy. These may be private companies, cooperative organisations, local or regional authorities, nationalised undertakings or governmental organisations.
iii. Non-Utilities:An Independent Power Producer which is not a public utility, but which owns facilities to generate electric power for sale to utilities and end users. They may be privately held facilities, corporations, cooperatives such as rural solar or wind energy producers, and non-energy industrial concerns capable of feeding excess energy into the system
iv. Hydro Electricity: refers to electricity produced from devices driven by fresh,
flowing or falling water.
v. Thermal Electricity comprises conventional thermal plants of all types, whether or not equipped for the combined generation of heat and electric energy. Accordingly, they include steam-operated generating plants, with condensation (with or without extraction) or with back-pressure turbines, and plants using internal combustion engines or gas turbines whether or not these are equipped for heat recovery.
ENERGY STATISTICS 2018
86
DEFINITIONS OF ENERGY PRODUCTS
vi. Nuclear Electricity is defined as the heat released by the reactors during the
accounting period and is obtained by dividing the generation of nuclear electricity by average efficiency of all nuclear power stations.
vii. Productionis defined as the capture, extraction or manufacture of fuels or energy
in forms which are ready for general use. In energy statistics, two types of production are distinguished, primary and secondary. Primary production is the capture or extraction of fuels or energy from natural energy flows, the biosphere and natural reserves of fossil fuels within the national territory in a form suitable for use. Inert matter removed from the extracted fuels and quantities reinjected flared or vented are not included. The resulting products are referred to as “primary” products. Secondary production is the manufacture of energy products through the process of transformation of primary fuels or energy. The quantities of secondary fuels reported as production include quantities lost through venting and flaring during and after production. In this manner, the mass, energy and carbon within the primary source(s) from which the fuels are manufactured may be balanced against the secondary fuels produced. Fuels, electricity and heat produced are usually sold but may be partly or entirely consumed by the producer. comprises gross production, i.e. the amount of electric energy produced, including that consumed by station auxiliaries and any losses in the transformers that are considered integral parts of the station. Included is the total production of electric energy produced by pump storage installations.
viii. Imports of energy products comprise all fuel and other energy products entering
the national territory. Goods simply being transported through a country (goods in transit) and goods temporarily admitted are excluded but re-imports, which are domestic goods exported but subsequently readmitted, are included. The bunkering of fuel outside the reference territory by national merchant ships and civil aircraft engaged in international travel is excluded from imports. Fuels delivered to national merchant ships and civil aircraft which are outside of the national territory and are engaged in international travel should be classified as “International Marine” or “Aviation Bunkers”, respectively, in the country where such bunkering is carried out (see paragraph 5.12). Note that the “country of origin” of energy products should be recorded as a country from which goods were imported.
ix. Exports of energy products comprise all fuel and other energy products leaving the national territory with the exception that exports exclude quantities of fuels delivered for use by merchant (including passenger) ships and civil aircraft, of all nationalities, during international transport of goods and passengers. Goods simply being transported through a country (goods in transit) and goods temporarily withdrawn are excluded but re-exports, foreign goods exported in the same state as previously imported, are included. Fuels delivered to foreign merchant ships and civil aircraft engaged in international travel are classified as “International Marine” or “Aviation Bunkers”, respectively. Note that “country of destination” of energy products (that is country of the last known destination as it is known at the time of exportation) should be recorded as a country to which these products are exported to.
ENERGY STATISTICS 2018
87
Conversion Factors
x. Losses refer to losses during the transmission, distribution and transport of fuels, heat and electricity. Losses also include venting and flaring of manufactured gases, losses of geothermal heat after production and pilferage of fuels or electricity. Production of secondary gases includes quantities subsequently vented or flared. This ensures that a balance can be constructed between the use of the primary fuels from which the gases are derived and the production of the gases.
xi. Energy Industries Own Use refers to consumption of fuels and energy for the direct support of the production, and preparation for use of fuels and energy. Quantities of fuels which are transformed into other fuels or energy are not included here but within the transformation use. Neither are quantities which are used within parts of the energy industry not directly involved in the activities listed in the definition. These quantities are reported within final consumption.
5. Non-commercial Energy Sources
i. Fuelwood, wood residues and by-products: Fuelwood or firewood (in log, brushwood, pellet or chip form) obtained from natural or managed forests or isolated trees. Also included are wood residues used as fuel and in which the original composition of wood is retained. Remark: Charcoal and black liquor are excluded.
ii. Charcoal The solid residue from the carbonisation of wood or other vegetal matter through slow pyrolysis.
iii. Bagasse The fuel obtained from the fiber which remains after juice extraction in sugar cane processing.
6. Other important definitions: i. GrossDomesticProduct (GDP) is the broadest quantitative measure of a nation's total economic activity. More specifically, GDP represents the monetary value of all goods and services produced within a nation's geographic borders over a specified period of time. ii. EnergyUse indicates Total Primary Energy Supply (TPES), Total Final Consumption (TFC) and final electricity consumption.
iii. Transformation/Conversion Losses:When one form of energy is converted into another form, the amount of losses are referred as transformation/conversion losses.
ENERGY STATISTICS 2018
88
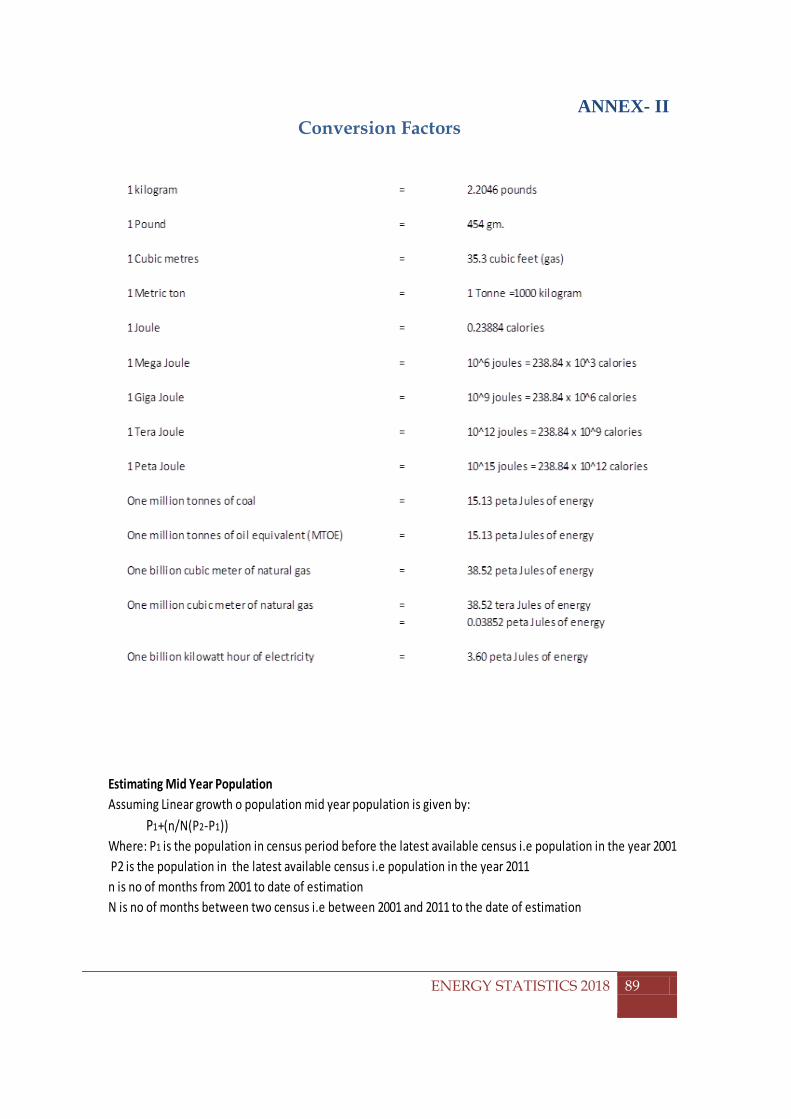
Conversion Factors
ANNEX- II
Conversion Factors
ABBREVIATIONS
ENERGY STATISTICS 2018
89
P2 is the population in the latest available census i.e population in the year 2011
N is no of months between two census i.e between 2001 and 2011 to the date of estimation
Assuming Linear growth o population mid year population is given by:P1+(n/N(P2-P1))
Estimating Mid Year Population
Where: P1 is the population in census period before the latest available census i.e population in the year 2001
n is no of months from 2001 to date of estimation
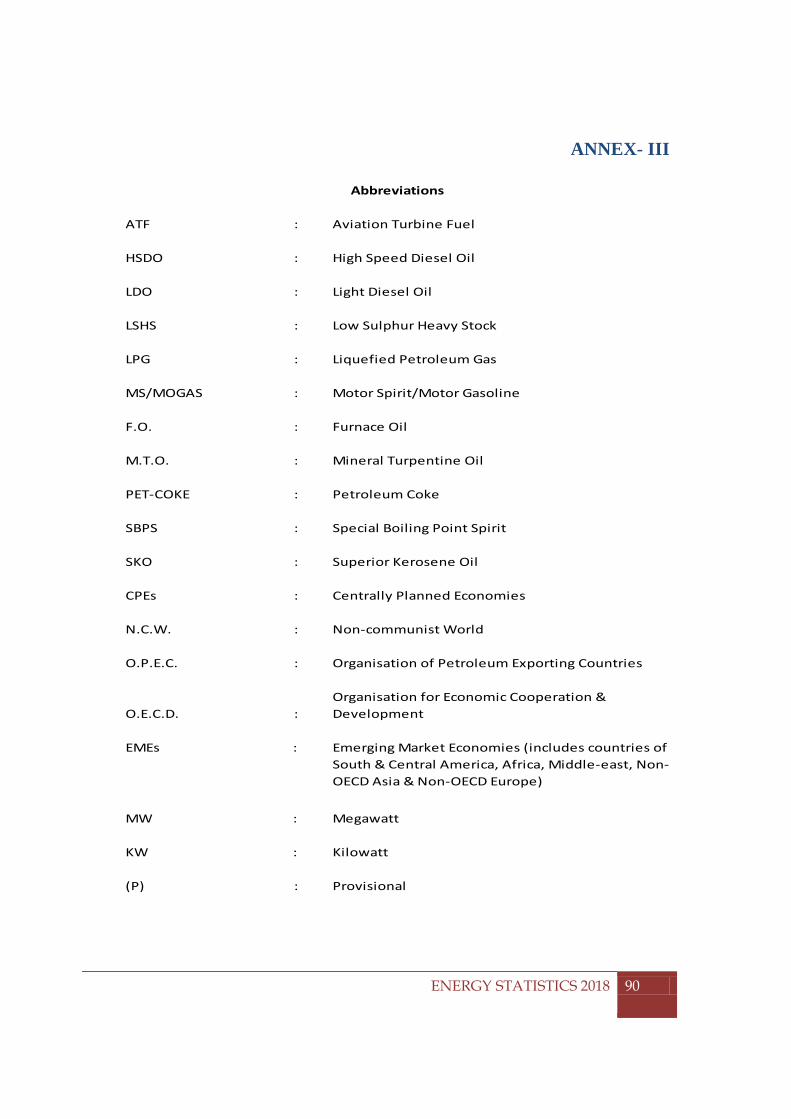
Conversion Factors
ANNEX- III
ATF : Aviation Turbine Fuel
HSDO : High Speed Diesel Oil
LDO : Light Diesel Oil
LSHS : Low Sulphur Heavy Stock
LPG : Liquefied Petroleum Gas
MS/MOGAS : Motor Spirit/Motor Gasoline
F.O. : Furnace Oil
M.T.O. : Mineral Turpentine Oil
PET-COKE : Petroleum Coke
SBPS : Special Boiling Point Spirit
SKO : Superior Kerosene Oil
CPEs : Centrally Planned Economies
N.C.W. : Non-communist World
O.P.E.C. : Organisation of Petroleum Exporting Countries
O.E.C.D. :Organisation for Economic Cooperation & Development
EMEs : Emerging Market Economies (includes countries of South & Central America, Africa, Middle-east, Non-OECD Asia & Non-OECD Europe)
MW : Megawatt
KW : Kilowatt
(P) : Provisional
Abbreviations
ENERGY STATISTICS 2018
90
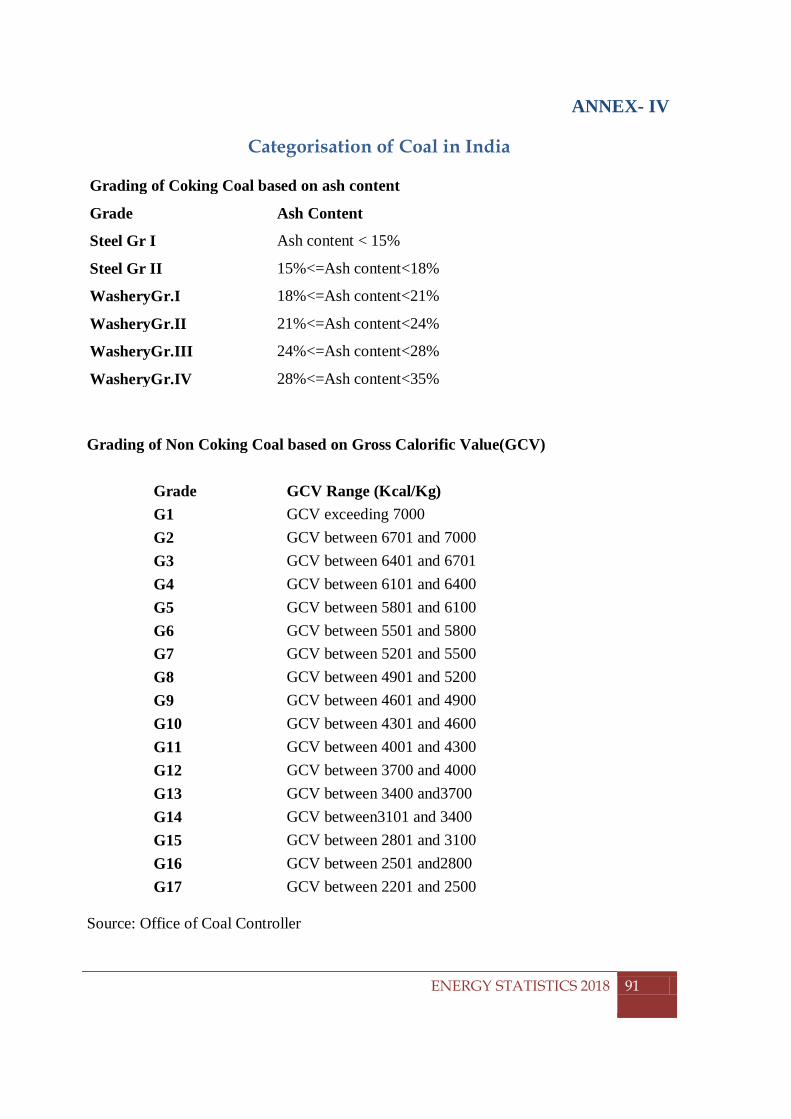
Categorisation of Coal in India
ANNEX- IV
Categorisation of Coal in India
Grading of Coking Coal based on ash content
Grade Ash Content
Steel Gr I Ash content < 15%
Steel Gr II 15%<=Ash content<18%
WasheryGr.I 18%<=Ash content<21%
WasheryGr.II 21%<=Ash content<24%
WasheryGr.III 24%<=Ash content<28%
WasheryGr.IV 28%<=Ash content<35%
Grading of Non Coking Coal based on Gross Calorific Value(GCV)
Grade GCV Range (Kcal/Kg)
G1 GCV exceeding 7000
G2 GCV between 6701 and 7000
G3 GCV between 6401 and 6701
G4 GCV between 6101 and 6400
G5 GCV between 5801 and 6100
G6 GCV between 5501 and 5800
G7 GCV between 5201 and 5500
G8 GCV between 4901 and 5200
G9 GCV between 4601 and 4900
G10 GCV between 4301 and 4600
G11 GCV between 4001 and 4300
G12 GCV between 3700 and 4000
G13 GCV between 3400 and3700
G14 GCV between3101 and 3400
G15 GCV between 2801 and 3100
G16 GCV between 2501 and2800
G17 GCV between 2201 and 2500
Source: Office of Coal Controller
ENERGY STATISTICS 2018
91
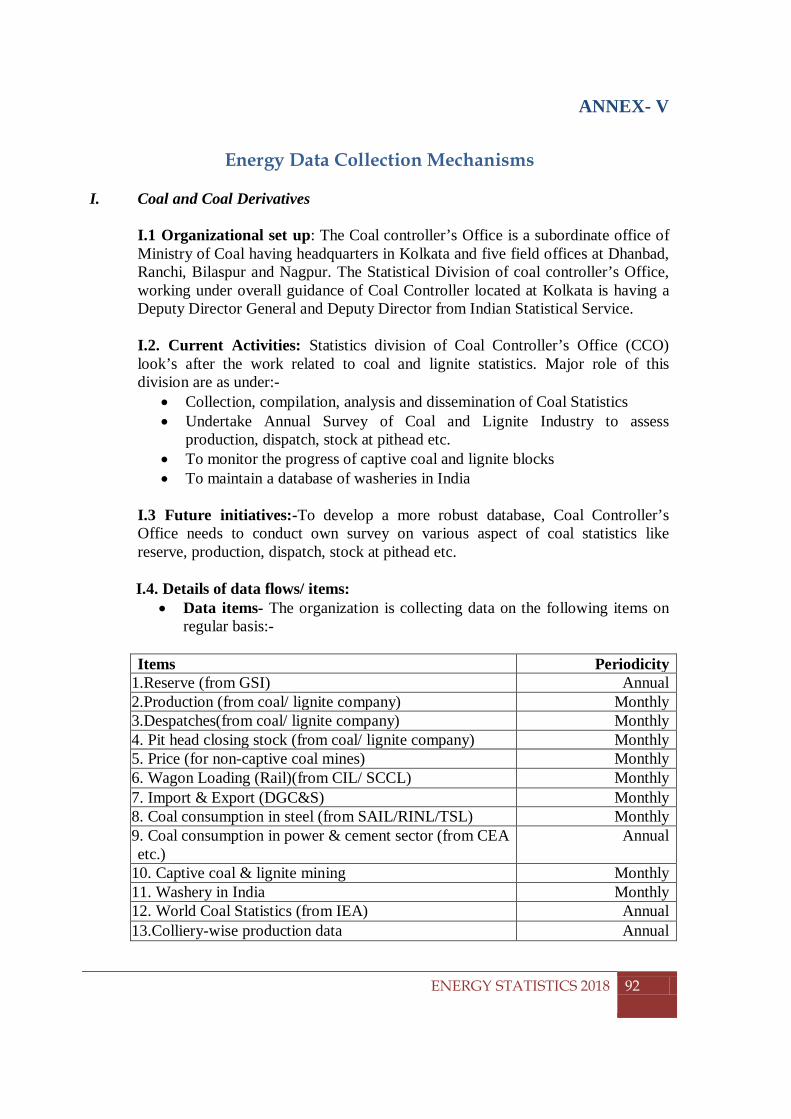
Energy Data Collection Mechanisms
ANNEX- V
Energy Data Collection Mechanisms I. Coal and Coal Derivatives
I.1 Organizational set up: The Coal controller’s Office is a subordinate office of Ministry of Coal having headquarters in Kolkata and five field offices at Dhanbad, Ranchi, Bilaspur and Nagpur. The Statistical Division of coal controller’s Office, working under overall guidance of Coal Controller located at Kolkata is having a Deputy Director General and Deputy Director from Indian Statistical Service.
I.2. Current Activities: Statistics division of Coal Controller’s Office (CCO) look’s after the work related to coal and lignite statistics. Major role of this division are as under:-
• Collection, compilation, analysis and dissemination of Coal Statistics • Undertake Annual Survey of Coal and Lignite Industry to assess
production, dispatch, stock at pithead etc. • To monitor the progress of captive coal and lignite blocks • To maintain a database of washeries in India
I.3 Future initiatives:-To develop a more robust database, Coal Controller’s Office needs to conduct own survey on various aspect of coal statistics like reserve, production, dispatch, stock at pithead etc.
I.4. Details of data flows/ items:
• Data items- The organization is collecting data on the following items on regular basis:-
Items Periodicity
1.Reserve (from GSI) Annual 2.Production (from coal/ lignite company) Monthly 3.Despatches(from coal/ lignite company) Monthly 4. Pit head closing stock (from coal/ lignite company) Monthly 5. Price (for non-captive coal mines) Monthly 6. Wagon Loading (Rail)(from CIL/ SCCL) Monthly 7. Import & Export (DGC&S) Monthly 8. Coal consumption in steel (from SAIL/RINL/TSL) Monthly 9. Coal consumption in power & cement sector (from CEA etc.)
Annual
10. Captive coal & lignite mining Monthly 11. Washery in India Monthly 12. World Coal Statistics (from IEA) Annual 13.Colliery-wise production data Annual
ENERGY STATISTICS 2018
92
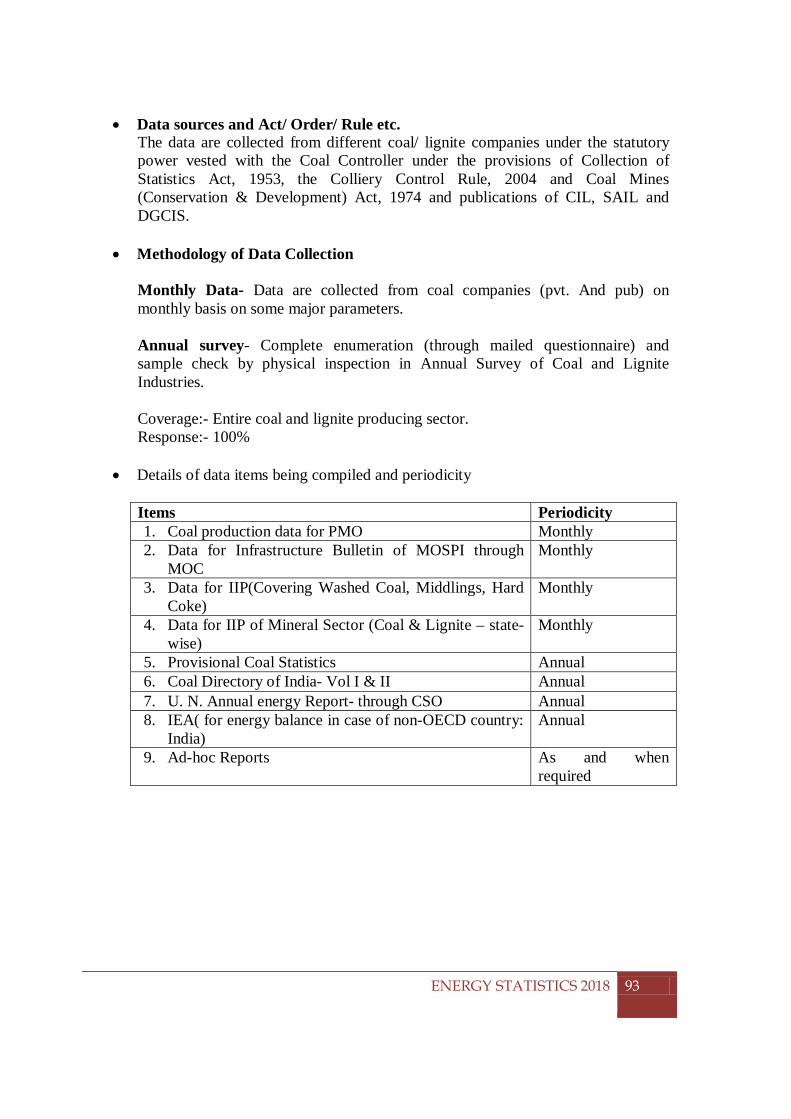
Energy Data Collection Mechanisms
• Data sources and Act/ Order/ Rule etc. The data are collected from different coal/ lignite companies under the statutory power vested with the Coal Controller under the provisions of Collection of Statistics Act, 1953, the Colliery Control Rule, 2004 and Coal Mines (Conservation & Development) Act, 1974 and publications of CIL, SAIL and DGCIS.
• Methodology of Data Collection Monthly Data- Data are collected from coal companies (pvt. And pub) on monthly basis on some major parameters. Annual survey- Complete enumeration (through mailed questionnaire) and sample check by physical inspection in Annual Survey of Coal and Lignite Industries. Coverage:- Entire coal and lignite producing sector. Response:- 100%
• Details of data items being compiled and periodicity Items Periodicity 1. Coal production data for PMO Monthly 2. Data for Infrastructure Bulletin of MOSPI through
MOC Monthly
3. Data for IIP(Covering Washed Coal, Middlings, Hard Coke)
Monthly
4. Data for IIP of Mineral Sector (Coal & Lignite – state-wise)
Monthly
5. Provisional Coal Statistics Annual 6. Coal Directory of India- Vol I & II Annual 7. U. N. Annual energy Report- through CSO Annual 8. IEA( for energy balance in case of non-OECD country:
India) Annual
9. Ad-hoc Reports As and when required
ENERGY STATISTICS 2018
93
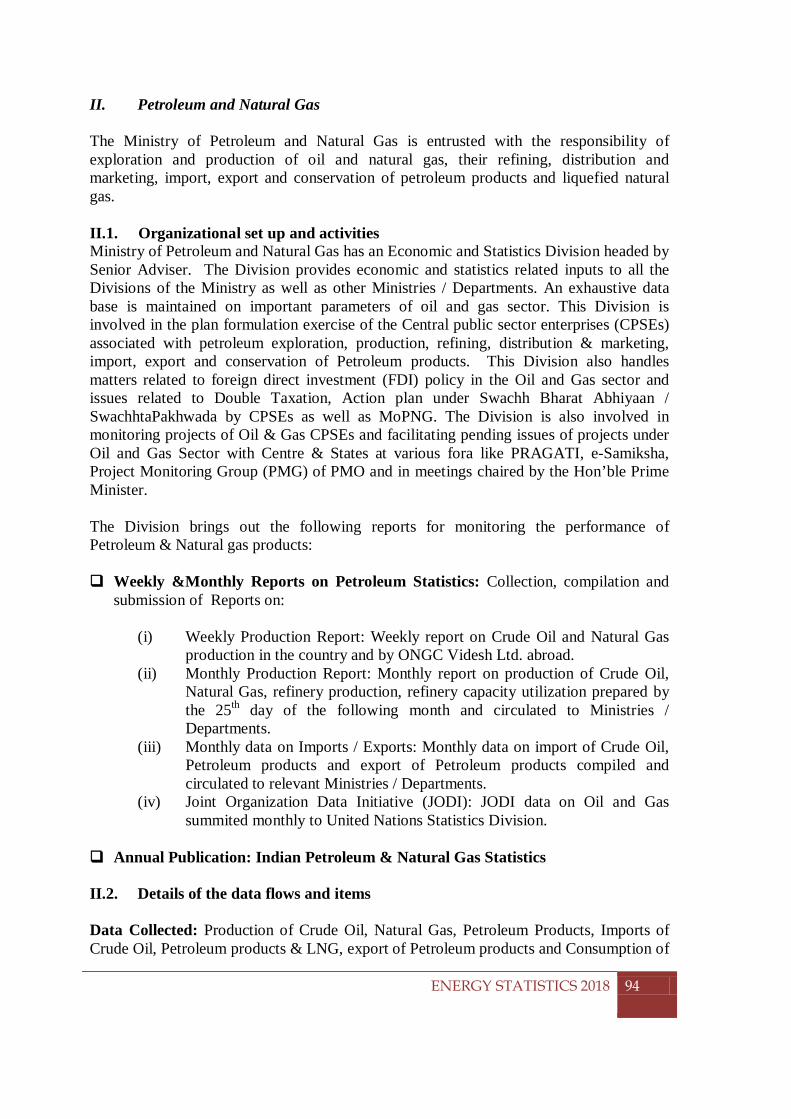
Energy Data Collection Mechanisms
II. Petroleum and Natural Gas The Ministry of Petroleum and Natural Gas is entrusted with the responsibility of exploration and production of oil and natural gas, their refining, distribution and marketing, import, export and conservation of petroleum products and liquefied natural gas. II.1. Organizational set up and activities Ministry of Petroleum and Natural Gas has an Economic and Statistics Division headed by Senior Adviser. The Division provides economic and statistics related inputs to all the Divisions of the Ministry as well as other Ministries / Departments. An exhaustive data base is maintained on important parameters of oil and gas sector. This Division is involved in the plan formulation exercise of the Central public sector enterprises (CPSEs) associated with petroleum exploration, production, refining, distribution & marketing, import, export and conservation of Petroleum products. This Division also handles matters related to foreign direct investment (FDI) policy in the Oil and Gas sector and issues related to Double Taxation, Action plan under Swachh Bharat Abhiyaan / SwachhtaPakhwada by CPSEs as well as MoPNG. The Division is also involved in monitoring projects of Oil & Gas CPSEs and facilitating pending issues of projects under Oil and Gas Sector with Centre & States at various fora like PRAGATI, e-Samiksha, Project Monitoring Group (PMG) of PMO and in meetings chaired by the Hon’ble Prime Minister. The Division brings out the following reports for monitoring the performance of Petroleum & Natural gas products: Weekly &Monthly Reports on Petroleum Statistics: Collection, compilation and
submission of Reports on:
(i) Weekly Production Report: Weekly report on Crude Oil and Natural Gas production in the country and by ONGC Videsh Ltd. abroad.
(ii) Monthly Production Report: Monthly report on production of Crude Oil, Natural Gas, refinery production, refinery capacity utilization prepared by the 25th day of the following month and circulated to Ministries / Departments.
(iii) Monthly data on Imports / Exports: Monthly data on import of Crude Oil, Petroleum products and export of Petroleum products compiled and circulated to relevant Ministries / Departments.
(iv) Joint Organization Data Initiative (JODI): JODI data on Oil and Gas summited monthly to United Nations Statistics Division.
Annual Publication: Indian Petroleum & Natural Gas Statistics II.2. Details of the data flows and items Data Collected: Production of Crude Oil, Natural Gas, Petroleum Products, Imports of Crude Oil, Petroleum products & LNG, export of Petroleum products and Consumption of
ENERGY STATISTICS 2018
94
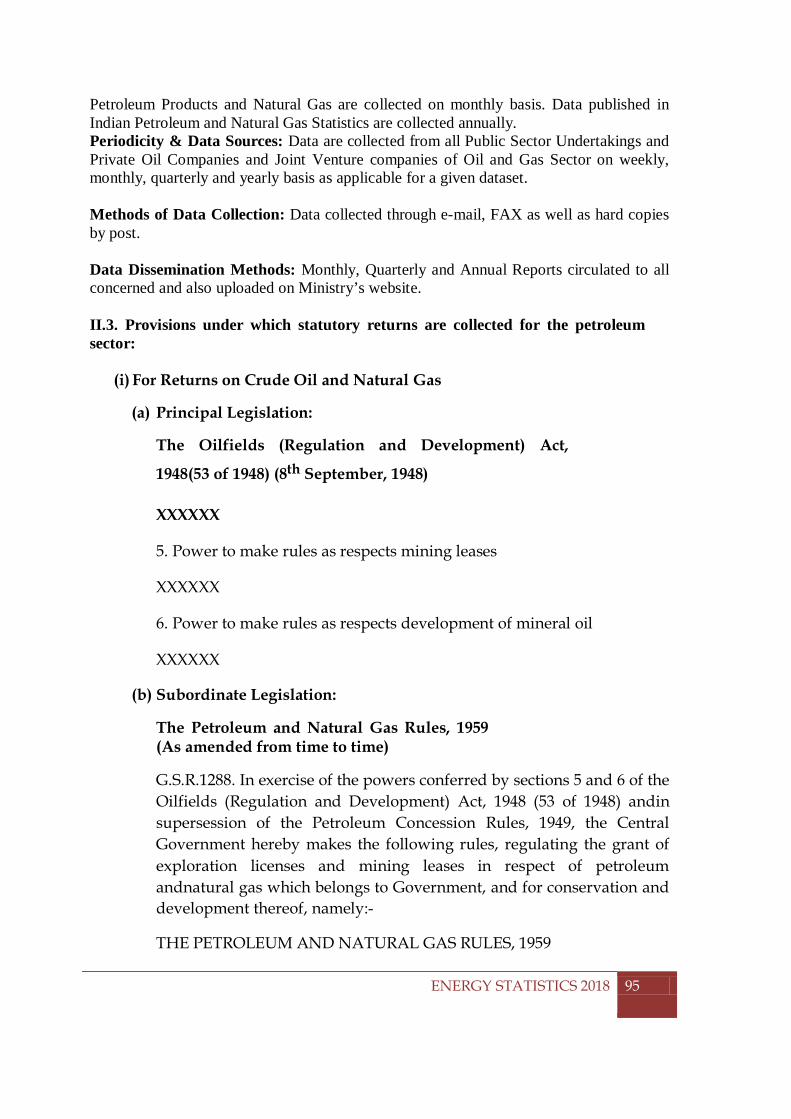
Energy Data Collection Mechanisms
Petroleum Products and Natural Gas are collected on monthly basis. Data published in Indian Petroleum and Natural Gas Statistics are collected annually. Periodicity & Data Sources: Data are collected from all Public Sector Undertakings and Private Oil Companies and Joint Venture companies of Oil and Gas Sector on weekly, monthly, quarterly and yearly basis as applicable for a given dataset. Methods of Data Collection: Data collected through e-mail, FAX as well as hard copies by post. Data Dissemination Methods: Monthly, Quarterly and Annual Reports circulated to all concerned and also uploaded on Ministry’s website. II.3. Provisions under which statutory returns are collected for the petroleum sector:
(i) For Returns on Crude Oil and Natural Gas
(a) Principal Legislation:
The Oilfields (Regulation and Development) Act,
1948(53 of 1948) (8th September, 1948)
XXXXXX
5. Power to make rules as respects mining leases
XXXXXX
6. Power to make rules as respects development of mineral oil
XXXXXX
(b) Subordinate Legislation:
The Petroleum and Natural Gas Rules, 1959 (As amended from time to time)
G.S.R.1288. In exercise of the powers conferred by sections 5 and 6 of the Oilfields (Regulation and Development) Act, 1948 (53 of 1948) andin supersession of the Petroleum Concession Rules, 1949, the Central Government hereby makes the following rules, regulating the grant of exploration licenses and mining leases in respect of petroleum andnatural gas which belongs to Government, and for conservation and development thereof, namely:-
THE PETROLEUM AND NATURAL GAS RULES, 1959
ENERGY STATISTICS 2018
95
Energy Data Collection Mechanisms
XXXXXX
14. Royalty on petroleum and furnishing of returns and particulars:
XXXXXX
(2) The lessee shall, within the first seven days of every month or within such further time as the Central Government or the State Government as the case may be, may allow, furnish or cause to be furnished to the Central Government or the State Government as the case may be a full and proper return showing the quality of all crude oil, casing head condensate and natural gas obtained during the preceding month from mining operations conducted pursuant to the lease. The monthly returns required to be furnished shall be, asnearly as may be, in the form specified in the schedule annexed to these rules.
(ii) For returns on refinery output
(a) Principal Legislation: The Industries (Development and Regulation) Act, 1951, (Act No. 65 of 1951)
30. Power to make rules: (1) The Central Government may, subjectto the condition of previous publication, make rules for carrying out the purposes of this Act. (2) In particular, and without prejudice to the generality of the foregoing power, such rules may provide for all or any of the following matters, namely:-
XXXXXX
(g) the collection of any information or statistics in respect of any scheduled industry;
XXXXXX
XXXXXX
2. Fuels:
XXXXXX
(2) Mineral oil (crude oil), motor and aviation spirit, diesel oil, kerosene oil, fuel oil, diverse hydrocarbon oils and their blends including synthetic fuels, lubricating oils and the like.
ENERGY STATISTICS 2018
96
Energy Data Collection Mechanisms
(3) Fuel gases-(coal gas, natural gas and the like)
(b) Subordinate Legislation:
Scheduled Industries (Submission of Production Returns) Rules, 1979.
8. (1) However, collection of data is also governed by the Gazette of India (Extraordinary) Part II-Section 3- Sub Section (i) order No. G.S.R. 272 (E) dated 16.04.1999 wherein clause 8 states that “Every oil refining company shall furnish to the Central Government or an agency nominated by Central Government any and every information that may be asked for in regard to the procurement, stocking, movements (onshore or offshore), transfers, imports, exports and sales of crude oil and or all products at such period, in such manner and from such of the sources, as may be specified from time to time”.
8. (2) “Every marketing company shall furnish to the Central Government or an agency nominated by Central Government any and every information that may be asked for in regard to the refinery, stocking, movements (onshore or offshore), transfers, imports, exports and sales of crude and or all products, refined there from, at such period, in such manner and from such of the sources, as may specified from time to time”.
ENERGY STATISTICS 2018
97
Energy Data Collection Mechanisms
III. Electricity III.1 Organisational Setup The Central Electricity Authority (CEA) is the nodal authority for supply of electricity data. It is a statutory organization under M/o Power. constituted under Section 3 of the repealed Electricity (Supply) Act, 1948. It was established as a part-time body in the year 1951 and made a full-time body in the year 1975. With the objective of reforming the Power sector, the Electricity Act, 2003 (No. 36 of 2003) has been enacted and the provisions of this Act have been brought into force with effect from 10th June, 2003. III.2 Functions As per section 73 of the Electricity Act, 2003, the Central Electricity Authority shall perform such functions and duties as the Central Government may prescribe or direct, and in particular to -
a) advise the Central Government on the matters relating to the national electricity policy, formulate short-term and perspective plans for development of the electricity system and coordinate the activities of the planning agencies for the optimal utilization of resources to sub serve the interests of the national economy and to provide reliable and affordable electricity to all consumers;
b) Specify the technical standards for construction of electrical plants, electric lines and connectivity to the grid;
c) Specify the safety requirements for construction, operation and maintenance of electrical plants and electric lines;
d) Specify the Grid Standards for operation and maintenance of transmission lines; e) Specify the conditions for installation of meters for transmission and supply of
electricity; f) Promote and assist in the timely completion of schemes and projects for
improving and augmenting the electricity system; g) Promote measures for advancing the skills of persons engaged in electricity
industry; h) advise Central Government on any matter on which its advice is sought or make
recommendation to that Government on any matter if, in the opinion of the Authority, the recommendation would help in improving the generation, transmission, trading, distribution and utilization of electricity;
i) collect and record the data concerning the generation, transmission, trading, distribution and utilization of electricity and carry out studies relating to cost, efficiency, competitiveness and such like matters;
j) Make public from time to time the information secured under this Act, and provide for the publication of reports and investigations;
k) Promote research in matters affecting the generation, transmission, distribution and trading of electricity;
l) Carry out, or cause to be carried out, any investigation for the purpose of generating or transmitting or distributing electricity;
m) Advise any State Government, licensees or the generating companies on such matters which shall enable them to operate and maintain the electricity system
ENERGY STATISTICS 2018
98
Energy Data Collection Mechanisms
under their ownership or control in an improved manner and where necessary, in coordination with any other Government, licensee or the generating company owning or having the control of another electricity system;
n) Advise the Appropriate Government and the Appropriate Commission on all technical matters relating to generation, transmission and distribution of electricity; and
o) Discharge such other functions as may be provided under this Act.
III.3.Details of the data Flows/ Items In exercise of the powers conferred by section 177, read with section 74 and clause (i) of section 73 of the Electricity Act, 2003, the Central Electricity Authority published the regulations vide Extra Ordinary Gazette notification dated 19th April 2007, namely:- Central Electricity Authority ( Furnishing of Statistics, Returns and Information) Regulations,2007
(a) Sources of Statistics, Returns and Information All licensees, generating companies and person(s) mentioned below, but not limited to, shall furnish to the Authority such statistics, returns or other information relating to generation, transmission, distribution, trading and utilization of electricity at such times and in such form and manner as specified under these regulations- Licensees (i) Transmission Licensees; (ii) Distribution Licensees;
(iii) Trading Licensees; (iv) Central Transmission Utility; (v) State Transmission Utilities; (vi) Appropriate Governments who are responsible for transmitting,
distributing or trading of electricity; (vii) Damodar Valley Corporation established under sub-section (1) of section 3
of the Damodar Valley Corporation Act, 1948 (14 of 1948); (viii) Any person engaged in the business of transmission or supply of electricity
under the provisions of the repealed laws or any act specified in the Schedule;
(ix) Any person who intends to generate and distribute electricity in a rural area as notified by the State Government;
(x) State Electricity Boards; (xi) Local authorities including Cantonment Boards; (xii) Deemed licensees and entities exempted from license. (xiii) Bhakra Beas Management Board.
Generating companies
(i) Generating companies established by appropriate Governments; (ii) Independent Power Producers;
ENERGY STATISTICS 2018
99
Energy Data Collection Mechanisms
(iii) Appropriate Governments responsible for generating electricity; (iv) Bhakra Beas Management Board; (v) Any person engaged in the business of generating electricity under the
provisions of the repealed laws or any act specified in the Schedule; (vi) Damodar Valley Corporation.
Person(s) generating electricity for own use: (i) All captive power producers;
(ii) Any other person including Co-operative Society, Association of persons, body of individuals, etc. engaged in generating electricity for its or his own use.
Other entities
(i) National Load Despatch Centre; (ii) Regional Load Despatch Centre(s); (iii) State Load Despatch Centre(s); (iv) Regional Power Committee(s); (v) High voltage or extra high voltage consumers of electricity.
(b) Formats for furnishing of statistics, returns or information – The entities shall furnish the statistics, returns and information as per the formats
annexed to these regulations titled “List of formats, frequency(ies) and target date(s)”. These formats can also be obtained from the website of the Central Electricity Authority. (Website www.cea.nic.in)
(c) Time schedule for furnishing of statistics, returns or information –
The time schedule or targets for furnishing of statistics, returns or information is specified by the Authority on its prescribed formats.
(d) Frequency of submission of statistics, returns or information –
The frequency of submission i.e. daily, weekly, monthly, quarterly or annually is specified by the Authority in its prescribed formats.
(e) Manner of furnishing the statistics, returns or information –
The statistics, returns or information in the prescribed formats shall be furnished to the Authority preferably electronically or by post or courier or fax.
III.4 Data collection problems
The Central Electricity Authority is receiving data from various Public and Private Entities/ Utilities / Organizations/Industries. Though, it is mandatory to these
ENERGY STATISTICS 2018
100
Energy Data Collection Mechanisms
organizations to furnish the correct, complete data in time, yet the following problems are being faced in collection of data.
i. Delay in furnishing data. ii. Furnishing incomplete/ incorrect data.
iii. Non submission of data. For smooth collection of the electricity data, CEA is installing electronic data collection system titled as Information Management System (IMS), where all the returns of electricity data can be directly furnished by concerned party (licensees, generating companies, entities etc.)
IV. New and Renewable Energy IV.1. Nodal ministry Ministry of New and Renewable Energy (MNRE) is the nodal Ministry of the Government of India at the National level for all matters relating to new and renewable energy. The Ministry has been facilitating the implementation of broad spectrum programmes including harnessing renewable power, renewable energy to rural areas for lighting, cooking and motive power, use of renewable energy in urban, industrial and commercial applications and development of alternate fuels and applications. In addition, it supports research, design and development of new and renewable energy technologies, products and services.
IV.2. Organisational setup It is broadly organized into eight Groups dealing with ‘Bio-Energy, Research & Development and TIFAD(Technology Information Forecasting, Assessment and Databank ), Solar Energy’, and Remote Village Electrification’, Biomass and Wind Power’, ‘Energy for Urban, Industrial & Commercial Applications’, ‘Small Hydro and Information & Public Awareness’, ‘Hydrogen Energy’ and ‘Administration and Coordination’. In addition, the Ministry has an Integrated Finance Division, which is functioning under the Special Secretary and Financial Adviser. The Ministry is classified as a Scientific Ministry. IV.3. Current responsibilities Formulating policies and programmes for the development of new and renewable sources of energy;
(a) Coordinating and intensifying research and development activities in new and renewable sources of energy;
(b) Ensuring implementing of Government’s policies in regard to all matters concerning new and renewable sources of energy.
IV.4.Data flows The basic data being compiled includes year wise and month wise no. of systems installed, their capacities, locations, etc. and is obtained from various stakeholders i.e. State Government Departments/Nodal Agencies, NGOs, Private Entrepreneurs, etc. Annual statistical information regarding achievements under different programmes/schemes is being included in the yearly Annual Report of the Ministry.
ENERGY STATISTICS 2018
101