ui design and information visualization -...
TRANSCRIPT

UI Design and Information Visualization
- Chaitra Chandrasekhar

Presentation 1
Friday, 25th February 2005

Agenda
1. Motivation1. Motivation
2. Role of User2. Role of User
3. User Capabilities 3. User Capabilities
4. Data Perspective4. Data Perspective
5. UI Design5. UI Design
Motivation: User-Centric View• Human-Computer Interfaces satisfying the
needs and requirements of the end-user

Motivation: User-Centric View• Human-Computer Interfaces satisfying the
needs and requirements of the end-user• User Interface definition drives lower layers
– Data storage process – Data access process– Collection of events
Motivation: User-Centric View• Human-Computer Interfaces satisfying the
needs and requirements of the end-user• User Interface definition drives lower layers
– Data storage process – Data access process– Collection of events
• Lack of attention to UI design can lead to loss of man-hours, ideas and data interpretation
Role of the User
• Representation of a relationship between a kind of user and a system, characterized by those users’ needs, interests, expectations, behaviors and responsibilities

User Capabilities
• Simplification through symbols, icons and color
• Limitation on the number of components and elements per visual screen
• Hierarchy of Data: Number of levels drilled down
• Interaction of the user with interface– Similar to familiar systems
User Classification
• Goals: business, operation of part, technical working
• Skills/experience in Domain: Novice, Intermediate, Expert– Young vs. old– Skilled vs. unskilled
• Experience with system• Needs:

User Metrics
• Possible metrics– Retention of system-related skills (over time)– Time to learn– Time to complete task– Amount of assistance– Number of touchpoints (eg. Clicks)– Number of widgets on the screen– User satisfaction (Frustrating Fun)
• Measurements made across user level (novice, occasional, expert)

Usability Metrics
Error handling Spent on correcting errors
Of errors corrected
Error Tolerance
"ease of learning"
To learn criterion
Of functions learned
Learnability
Satisfaction To complete a task
Of goals achieved
Suitability
Satisfaction: Rating scales
Efficiency: Time
Effectiveness: Percentage
Usability objective

Rules of UI Design
• Support: Support not hinder user’s work• Context: Suitable for environment of use• Access: Be usable w/out instruction to
domain expert new to the system• Efficacy: Not impede use by system expert• Progression: Facilitate novice -> expert

Principles• Metaphor: Use behavior from familiar systems• Feature exposure: See clearly what features are
available without overwhelming• Coherence: Internal and external consistency• State visualization:• Shortcuts: Concrete and abstract ways – useful for
expert user• Focus: Animated vs. static• Help: Goal-oriented, descriptive, procedural,
navigational

Users in the Supply Chain World
• Suppliers – Different tiers– Tier-1 Supplier = Raw material supplier– Tier-2 Supplier = Parts supplier– Manufacturer/Assembler– Packager
• Distributor• Retailer• Logistics Provider• Consumer• Recycle or waste manager

Functions in SCM
• Management of various systems• Sourcing and procurement • Production scheduling• Order processing• Inventory management• Warehouse management• Customer service• After-market disposal of packaging and
materials

Data Perspective
• Analysis of the kind of data present• Format that it is available in • Usage of collected data
Data in the AutoID world
• Entity (individual or batched) flow – Temporal – Location – Environment (ambient)
User Interface
• Dynamic Interface
• Usage of the interface• Effectives of the interface

Presentation 2
Friday, 11th March 2005
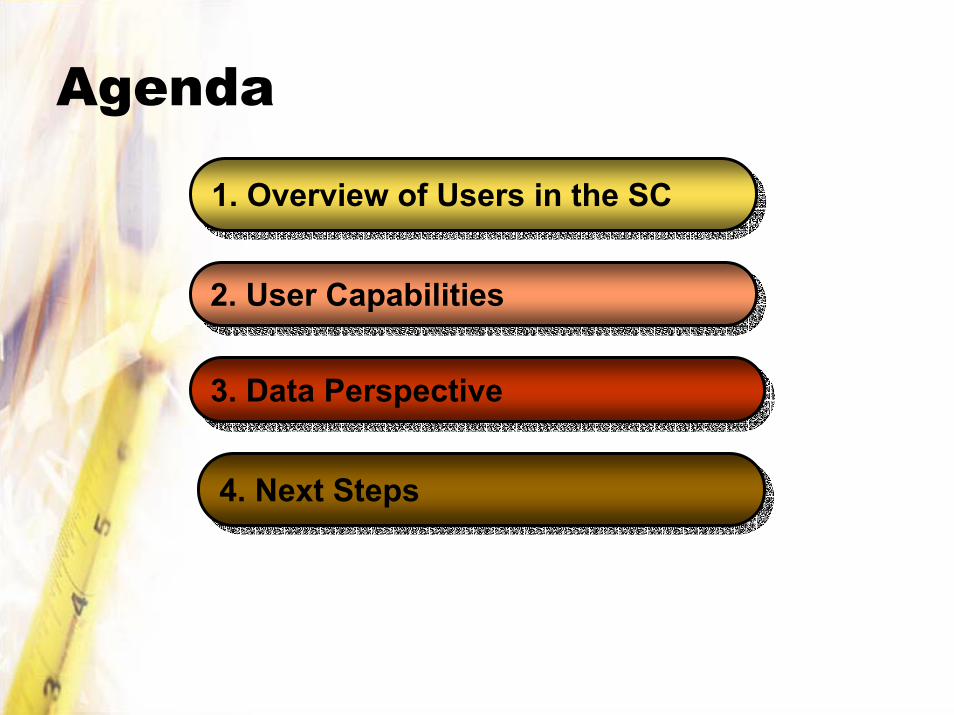
Agenda
1. Overview of Users in the SC1. Overview of Users in the SC
2. User Capabilities2. User Capabilities
3. Data Perspective 3. Data Perspective
4. Next Steps4. Next Steps

Players in the Supply Chain
• Supplier• Distributor• Retailer• Consumer• Recycle/Waste Manager• Third Parties
– Government [through its agencies]– Logistics Providers [3PL]

Private: 3PL
Distributor
Recycle/Waste Manager
Supplier
Retailer
Consumer
Government
EPA
IRS
Customs
Works through agencies:
Taxes for all parties
Environmental Protection Agency
Cross-border details
Supply Chain: Players

‘Cognitive’ Fit Hypothesis
• Vessey – relationship b/w viewer, task characteristics and representation format
• “a cost-benefit characteristic that suggests that, for most effective and efficient problem solving to occur, the problem representation and any tools or aids employed should all support the strategies (methods or processes) required to perform the task”

Visualization and Cognition
• Visualization -> Perceptualization• Short-term vs. Long-term memory
– Short-term: 7 (+/- 1 or 2 items)– Long-term: interference between similar
functions/programs/representations• Anchoring: Preference to work with familiar
representations– Decision analysis: Decisions based on initial
value than exploration of entire range of alternatives

Types of Users
• Users use different representation formats• Decision makers
– Day-to-day interaction [usually real-time]– Higher level management [final results]
• Type of problem– Mathematical/scientific view– Problem-solving view

Dimensional Representations
• Text: Linear representation• Tabular representation: 2D +• Graphics: 2D representation• Volume visualization: 3D effect• Animation: movement either in 2D or 3D

Graphics: Color vs. Shape
• Color is generally superior to shape to search for a given item
• Number of colors– Limited < 10 – In line with 7 (+- 2) short term memory limit
• Color models– Tri-stimulus model (RGB, CMY, HLS)
Relationships between Objects
• Gestalt Psychology– Interrelationships among objects in an image– Principles
• Foreground vs. background• Grouping items with similar characteristics• Grouping according to proximity• Continuity [eg. completing non-existent edges]
Alternate Approaches
• Bertin– Separation of information into “components”
• Analogous to dimensions in mathematics• Eg. Time, plant locations, products, etc.
– Type of the component or “level”• Qualitative, ordered, quantitative
– Translate into graphical variables• Size, value, texture, orientation, shape, color
Alternate Approach 2
• Tufte– Use graphics only for large quantities of data– Integrate text with graphics– Use different levels of detail for complex
information– Do not distort
Other Modes
• Sound • Touch• Hypermedia• Virtual Reality
Traditional SCM Data
• Order information and processing• Inventory information• Information about containers and other
collections of items

Data in the AutoID world
• Characteristics– Quantitative – Dimensions
• Identity• Time• Location• Value
– Item-level
• Types – EPC information
• What• When • Where
– State information from sensors
• Temperature• Pressure• Vibrations• etc
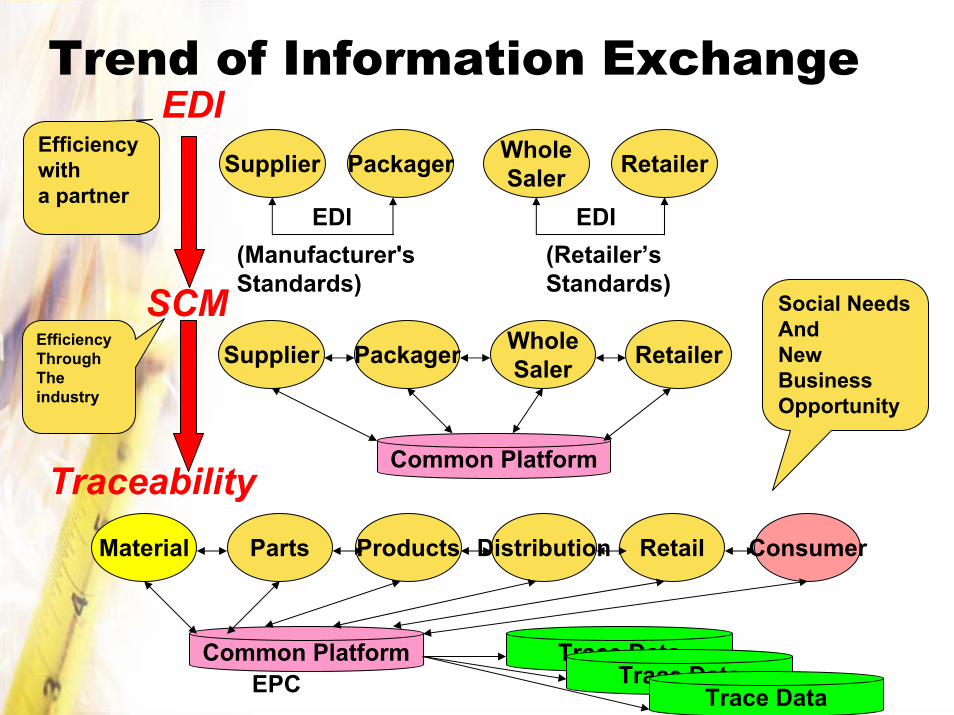
EDI
(Manufacturer's Standards)
(Retailer’s Standards)
Efficiency with a partner
Supplier Packager WholeSaler Retailer
Common Platform
SCMEfficiencyThroughThe industry
Parts Products Distribution RetailMaterial Consumer
Common Platform Trace DataTrace Data
Trace Data
Traceability
EPC
Social NeedsAnd New Business Opportunity
Trend of Information ExchangeWholeSalerSupplier Packager Retailer
EDI EDI

Business Processes
Core componentsAnalysis
Businessinformation entities: acc.
to context
Common elements of orders placed at all levels
Order Information Order Information GeneralizationGeneralization ContextualizationContextualization
Next Steps
• User analysis– Survey of existing SC users for representation
types at different levels– Survey of existing SCM software: IBM Global
Services, Accenture, Atos Origin, Unisys, T-Systems, SeeBeyond
• Data Analysis– Look at case study: Samsung SC