improved new product forecasting though visualization of...
TRANSCRIPT

The Data Center
Improved New Product Forecasting though Visualization of Spatial Diffusion Edmund W. Schuster, Ching-Huei Tsou,* and John R. Williams† The Data Center, Massachusetts Institute of Technology, Building 35, Room 234, Cambridge, MA 02139-4307, USA ABSTRACT Forecasting demand for a new product is a particularly difficult task. Part of the reason that new product forecasting is such a challenging problem involves the way consumers adopt a product within a defined space. Early studies have noted customer adoption is not spatially uniform. Clusters of adopters tend to form and grow or contract with time. This article discusses the spatial diffusion process in the context of introducing new products into markets. Advances in technology including visualization, along with innovative digital mapping technology and new ways of interoperating mathematical models give improved ways to track spatial diffusion resulting in better forecasting and supply chain coordination.
* Funding for this work came from the MIT Intelligent Engineering Systems Laboratory, Engineering Systems Division † Professor John R. Williams made a presentation to The MIT Data Center in March 2005 outlining new technology involving digital maps. This article builds on ideas from his initial presentation.

Published on July 25, 2005 2
ABOUT THE AUTHORS Edmund W. Schuster has held the appointment of Director, Affiliates Program in Logistics at the MIT Center for Transportation and Logistics and is currently working at The Data Center as Co-Director - Administration and researcher. His interests are the application of models to logistical and planning problems experienced in industry. He has a bachelor of science from The Ohio State University and a master in public administration from Gannon University with an emphasis in management science. Ed also attended the executive development program for physical distribution managers at the University of Tennessee and holds several professional certifications. Ed can be reached at [email protected] Ching-Huei Tsou is currently a PhD candidate in the Intelligent Engineering Systems Lab of the Civil and Environment Engineering Department at MIT. His research area focuses on machine learning, context-aware computing, knowledge management, distributed computing, and integration for large-scale computation systems. He is also an experienced software developer proficient in C#, Java, XML Web Services, and other W3C standards. He holds a MS in structural engineering from National Taiwan University and an M.Eng in information technology from MIT. Ching-Huei can be reached at [email protected] John R. Williams is Professor of Information Engineering, Department of Civil and Environmental Engineering, and Engineering Systems Division, MIT. He also holds the position of Director, MIT Auto-ID Laboratory. Dr. Williams holds a MA in physics from Oxford University, a MS in physics from UCLA and a Ph.D. from Swansea University. His area of specialty is large-scale computer analysis applied to both physical systems and to information. He has authored two books and over 100 publications. For the past eight years, his research has focused on design of large-scale distributed simulation systems. He teaches graduate courses on Modern Software Development and on Web System Architecting. John can be reached at [email protected]
The Data Center MIT-DATACENTER-WH-006 Copyright © 2005 Massachusetts Institute of Technology

Published on July 25, 2005 3
1.0 INTRODUCTION The launch of a new product is a challenging task that every consumer goods firm must face. With individual stores now carrying up to 100,000 different items (Ball 2004), the ongoing reality of marketing is that the average customer encounters over 1 million different stock keeping units (SKUs) across all channels of distribution. Yet the typical family gets 85% of their needs from only 150 SKUs (Roberts 2003). Given these conditions, manufactures and retailers need to focus on innovative ways to advertise and track new products and to target potential customers. Future success will depend on using technologies that create opportunities for detailed analysis, and the ability to optimize advertisement expenditures during critical new product rollouts. One of the most important factors influencing new product rollouts involves the geographic forces that affect adoption by individual customers. Commonly called spatial diffusion, this area studies the rate and pattern of adoption for a geographical area based on the frequency and type of advertising, demographics, and distance to retail outlets, along with other elements of the market mix such as pricing, promotion, and tactical product positioning versus competitors. Besides the general goal of describing and understanding customer behavior, the study of spatial diffusion also seeks to build mathematical models of the adoption process through time. This model building approach has practical value for retailers and manufacturers in providing general guidelines about how consumers adopt new products. Future trends in information technology will allow these models to exist in a network with the prospect of rapid linkage to data for real-time analysis (Brock et al. 2005). Marketing managers and academic researchers realize the importance of studying spatial diffusion. A recent paper on the subject notes, “Managers who understand the geography of the processes by which consumers change their behaviors can be much more successful in launching new initiatives and can make much better use of their resources while doing so (Allaway, Berkowitz, and Giles 2003, p. 137).” Achieving rapid market penetration in select areas of the US is vital in gaining profitability and forestalling competitor response, especially since national rollouts are costly, characterized by historical risk of failure, and seldom done in practice (Bronnenberg and Mela 2004). Focus in marketing leads to results. While the development of marketing research in the US economy has been a fundamental reason for the growth and sophistication of the consumer goods industry, the introduction of new products into select markets continues to represent an area of great inefficiency in terms of logistics and advertisement costs. In examining the entire new product introduction process from initial conceptualization to successful launch, only 1 in 58 are successful (Skarra 2004). Every year, retailers and manufacturers introduce thousands of new products into the US market.
The Data Center MIT-DATACENTER-WH-006 Copyright © 2005 Massachusetts Institute of Technology

Published on July 25, 2005 4
Assuming a new product is properly developed and is reasonably matched to customer needs, a significant reason for failure lies in the amount, quality, level of aggregation, and timeliness of data available to managers concerning the rate of geographic customer adoption. In a typical product launch, the only sources of near real-time data are point estimates of aggregate demand and consumer feedback from various types of interviews. Both of these data sources do not include the detailed geographical data needed for observation and modeling of spatial diffusion. In many cases, important geographical links do exist in the data although these links must be culled from daily purchase transactions. Other technologies such as Auto-ID also offer the future prospect of obtaining real-time geographical data on spatial diffusion within a market. Further, there currently is a lack of efficient ways to visualize and organize the data needed to make spatial diffusion a management tool suitable for daily decision-making. There are no open computing systems capable of matching mathematical models describing spatial diffusion to geographic location data obtained from such sources as loyalty cards, and other future means that might include virtual private networks. While history-based methods such as share and distribution analysis are valuable market research tools, spatial diffusion through its focus on the dynamics of customer behavior along and real-time analysis of data offers much more potential to gain insight into the success or failure of a new product. Recent advances in three dimensional geographic visualization of urban areas and improved ability to manage different types of digital maps through browsers, open a range of possibilities for the wide spread application of spatial diffusion modeling in practice. This article examines several examples of how information technology can advance the practice of using spatial diffusion as a marketing decision-making tool. Preceding the examples, the next two sections analyze the details and value of spatial diffusion along with a more detailed discussion of data. 2.0 SPATIAL DIFFUSION IN MARKETS The modern history of spatial diffusion in marketing begins with research conducted by Whyte (1954). In this study, aerial photographs of urban Philadelphia were used to identify homes that had window mounted air conditioning units, an innovative home appliance that gained popularity in the immediate post WWII era. After compiling the data, Whyte observed that city blocks of equal size and demographics had sharply different rates of market penetration. For example, some city blocks had 18 air conditioners while others, located in the same general area, had only three. This study provided the first evidence that adoption of a new product, like an air conditioner, occurs in clusters and is not homogeneous over a geographical area. 2.1 Three Important Stages Since the Whyte study, there has been a great deal of research about spatial diffusion in the context of geography, sociology, urban planning, and environmental science, however, little research has related to the introduction of new products and services to consumers in
The Data Center MIT-DATACENTER-WH-006 Copyright © 2005 Massachusetts Institute of Technology

Published on July 25, 2005 5
a defined geographical area. In theory, spatial diffusion for consumer products comprises three relatively predictable stages: 1) lead adopters, 2) neighborhood effects, and 3) consolidation of adoption (Allaway, Berkowitz, and Giles 2003). As a generalization, the outcome of the three stages is an S-shaped curve of cumulative adoptions through time. The main driver of each stage is the rate of information dissemination to consumers within a market. Temporal aspects of spatial diffusion have particular importance in analyzing dynamic customer behavior, an under researched area of marketing. When a new product is introduced into a market, no information about it exists. Leading adopters peaked by curiosity will likely be the first to make a purchase. The geographical pattern of these lead adopters is random. Since there are relatively few lead adopters in any market, the random pattern is characterized by significant physical distance between purchasers. If experience with the product is positive, there tends to be local communication by lead adopters, which influences others within close proximity to consider purchasing the product. In addition, advertisement often provides an impersonal means of communicating information about a new product across a wide geographical area. Because of both advertising and word-of-mouth from lead adopters, there tends to develop a neighborhood effect where clusters of adopters begin to form within a geographical area. These clusters continue to consolidate as more information about the product is diffused within the neighborhood network. Finally, the overall market reaches a saturation of information about the new product. Lag adopters, who are inherently cautious in taking risks, begin to make purchases. Clusters of adopters tend to merge forming a pattern of complete market penetration. Figure 1 shows a classic case of spatial diffusion for a successful new product introduction through time. Figure 2 shows a different situation where spatial diffusion never advances from state 1 to stage 2. The result is a failure of the new product introduction. Figure 1 – Successful Introduction Figure 2 – Unsuccessful Introduction
Source – (Garber et al. 2004)
The Data Center MIT-DATACENTER-WH-006 Copyright © 2005 Massachusetts Institute of Technology

Published on July 25, 2005 6
2.2 Implications for Marketing Managers The characteristics of spatial diffusion raise a number of implications for marketing managers. First, the rate of diffusion is very important in determining the overall success of a new product. Keeping in mind that lead adopters tend to be randomly distributed within a geographical area, understanding their spatial pattern gives some insight into the future rate of diffusion. This is important because the formation of clusters (stage 2) is partially rooted in communication between lead adopters and others in close proximity. Any management effort designed increase the rate of diffusion from stage 1 to stage 2 reduces the chances that competitors will dislodge a new product introduction. Once consolidation takes place in stage 3, competitors must confront the cost of getting a customer to switch in order to increase market penetration. This presents a barrier to gains in competitor market share. Rate of diffusion also has another important implication. If a slow pattern emerges, as indicated in Figure 2, this might be an advanced indication of new product introduction failure. If lead adopters are dissatisfied, neighborhood effects will not take place and clusters of adopters characterized by stage 2, will never properly form. Without this base, advance to stage 3 saturation becomes nearly impossible. Some advocate using spatial diffusion for predicting the overall success of a new product during the initial stages of the launch. A recent research paper develops indicators that can quickly show management the probability of success, and highlight opportunities to change marketing strategies such as advertisement, in-store promotion, and pricing to increase the rate of diffusion for a new product that is lagging (Garber et al. 2004). This work has important implications regarding demand forecasting for a new product introduction into a specific market. Time series forecasting methods frequently used in retailing and consumer goods manufacturing have little connection to predicting the spatial diffusion process because growth in demand is non-linear and dependent on external variables such as advertising. As a result, common forecasting techniques used in practice are ineffective when determining future demand for new products through time. Improvements in new product demand forecasting have important implications for optimizing logistical costs and customer service. If a new product introduction is successful, spatial diffusion will move quickly from stage 1 to stage 2 and demand will increase sharply for a specific market. If logistics managers are unprepared to handle this increase because of an inaccurate forecast, significant stockouts at the retail level will occur. According to a recent study, nearly 23% of consumers leave a store immediately in response to an out-of-stock (Zinn and Liu 2001). This is devastating to new product success. Many new products have not progressed from stage 1 to stage 2 solely because poor customer service caused discontent in the mind of the consumer. A final application of spatial diffusion involves optimization of spending on advertisement. Marketers have a number of mass media options to deliver a message to customers. Determining the optimal pattern and level of spending on advertisement represents a challenging problem in optimization. Because of the complexity of the problem, and the difficulty in obtaining real-time spatial data, historical demand trends often become the
The Data Center MIT-DATACENTER-WH-006 Copyright © 2005 Massachusetts Institute of Technology

Published on July 25, 2005 7
basic means to make media purchasing decisions. This represents an aggregation approach that simplifies the problem. However, point estimates of demand commonly used in share and distribution analysis give few indications concerning the stage of spatial diffusion for a particular marketing area. This uncertainty leads to sub-optimal decisions concerning advertisement spending. For example, a common opportunity for improvement involves the rate of advertising spending once a market has reached stage 2 in the spatial diffusion process. Some believe that further advertising upon reaching stage 2 accounts for lower marginal gains in sales at best (Allaway, Berkowitz, and Giles 2003, p. 137). By the time a market reaches stage 2, there is enough adoption, cluster formation, and momentum that further advertising has much less effect in overall sales. Reducing media spending, just as overall sales for a marketing area are beginning to accelerate, appears counterintuitive if marketing managers have no understanding of spatial diffusion, or real-time geographical data to measure patterns of geographical adoption. Spatial diffusion offers deeper insights that allow marketing managers to make better decisions. 3.0 DATA To initiate spatial diffusion studies, data for a new product must contain some aspect of time and location for a specific geographical area. The most effective level of data is at the household level of detail. Obtaining large volumes of this type of data has been a historical limitation in conducting spatial diffusion studies. Improved technology and changes in retailing are creating new opportunities to overcome this limitation. Five-digit zip code data obtained from sales transactions (credit/debit/loyalty card) provides an effective means to gather geographical, time, and location data. However, other more advanced technologies that use street addresses converted to earth coordinates can provide the detailed needed for spatial diffusion studies and use of digital maps. For example, one research study used data obtained from loyalty card information (Allaway, Berkowitz, and Giles 2003). The purpose of this study was to understand the rate of spatial diffusion of loyalty card adoption; hence, the address for each adopter and the time of enrollment became the data needed to conduct the spatial diffusion study. With the loyalty card example, each enrollment results in a data element consisting of time and location within a geographical area. For consumer goods sold at retailers, this type of data is generally not available for new products. It is true that loyalty cards allow the ability to record individual customer transactions, giving data concerning a new product’s sales history. However, since those customers that hold a loyalty card represent a subset of all customers for a particular retail outlet and geographical area, the data obtained from loyalty cards is subject to sampling statistics. Since lag adopters are likely to hold a loyalty card in fewer numbers, no direct inference can be drawn unless a high
The Data Center MIT-DATACENTER-WH-006 Copyright © 2005 Massachusetts Institute of Technology

Published on July 25, 2005 8
percentage of total customers visiting the store hold loyalty cards and use them regularly to make purchases. The same is true for credit and debit card transactions to purchase consumer goods. Only a subset of customers used these means of payment. All data originating from these sources must be considered a sample of the total population visiting a store each day. In contrast to data obtained from loyalty, credit, and debit cards, the gradual trend toward online sales does offer the prospect of gaining the data needed to conduct spatial diffusion studies. When a customer purchases a product, it is shipped to a specific location at a specific time. Since online retailers capture all of these transactions, detailed geographical, time, and location data exists for conducting spatial diffusion studies. This is also true for durable consumer goods such as electronics and home appliances sold through traditional retailers. Usually the purchase size is one unit and means of payment most likely include credit or debit card, or personal check. In these cases, the correct data exists for conducting spatial diffusion studies. As a concluding note, the rise of Auto-ID technology allows the capability to obtain detailed time and location data through home scanning devices. While there are significant privacy concerns and continuing technological hurdles to overcome, Auto-ID must be considered a long-term method to gain data needed for spatial diffusion studies. 4.0 VISUALIZING SPATIAL DIFFUSION Digital mapping technology has been in use since the early 1980’s. ERSI was an early leader in the field. However, most applications of digital maps involve proprietary systems and are stand-alone projects. Likewise, the ability to combine data sets together for input into mapping software has also been dominated by proprietary systems that take the form of software packages. In these situations, there is no capability to link data to mathematical models for improved analysis. This lack of an open system, Internet based approach has slowed the progress of mapping and graphics applications use in day-to-day decision-making. With advances in Web Services (XML and SOAP) along with the advent of browser based open systems this situation is changing. In addition, advances in Auto-ID technology provide another means of obtaining consumer data with a geographical component. The read event for an electronic product code (EPC), which contains “what,” “when,” and “where,” represents a parallel steam of data, as compared to loyalty and credit/debt cards (see Figure 3). However, as the costs of the technology decrease, it is probable that this form of data collection will surpass financial transactions and loyalty cards as a means of gaining geographic specific data. In any case, the use of standard protocols to move data across application interfaces will enable improved analysis. Combining this approach with visualization is essential in helping managers make quick decisions.
The Data Center MIT-DATACENTER-WH-006 Copyright © 2005 Massachusetts Institute of Technology

Published on July 25, 2005 9
Figure 3 – Gathering Data for Spatial Diffusion Analysis
4.1 Important Developments in Digital Mapping Technology The City of Philadelphia announced in February 2005 an interesting project to build a 3D model of the downtown area (Eisenberg 2005). Using aerial photographs and ground imaging, the representation provides stunning detail of buildings and shops even to the level of mailboxes and shrubbery. This physical representation can be combined with other data such as office rental vacancies to provide a virtual world accessible from any computer. In a similar effort, Yahoo is offering a new service that provides maps of traffic conditions for more than 70 metropolitan areas based on real-time data from embedded road sensors, traffic cameras, police scanners and traffic helicopters (Auchard 2004). Google has also entered the digital mapping market with the purchase of Keyhole in October 2004 (www.maps.google.com). The Google technology uses aerial photographs at different resolutions along with an existing browser technology collectively termed Ajax (Asynchronous Javascript and XML). This allows users to zoom in through aerial maps at different resolutions to street level images that show details of buildings and urban areas. The Ajax technology uses Javascript, dynamic HTML and XMLHTTP (Gomes 2005). These set of technologies allow for speed and responsiveness in viewing digital maps. The major advantage of using Ajax is that it allows asynchronous data transmission between clients and server, so users can interact with the program without waiting for the “postback” which occurs every time when you click a button on the traditional web page. All of this technology is open source, allowing programmers to write applications quickly.
The Data Center MIT-DATACENTER-WH-006 Copyright © 2005 Massachusetts Institute of Technology

Published on July 25, 2005 10
Google even provides for local map search capabilities, allowing users to locate individual businesses. Plans include linking local search to potential advertisements about the business. According to a national survey of 99 firms conducted by Forrester Research, 85% plan to increase online advertising spending (Delaney 2005). Taking digital mapping a step further, several emerging businesses extend the mapping technology developed by Google and others to plot real estate for sale on maps along with overlays of schools, access to main roads, restaurants, medical offices, and coffee shops within the vicinity. With a single look, potential buyers can determine if a particular home or apartment meets their needs in terms of convenience and life style. An example can be found at www.housingmaps.com (Dash 2005). With these emerging technologies, there exist a number of opportunities to integrate digital maps, spatial data, and mathematical models into entirely new tools for analysis. In the next section, several examples are provided to highlight the potential of using digital mapping technology as a tool for analyzing spatial diffusion. 4.2 Using Aerial Images in World Wind Of the few spatial diffusion studies of practical use, the most common means of plotting data involves paper maps. Figure 4 is an example of a paper map used to show spatial diffusion differentiated by innovators, adopters, and non-adopters.
Figure 4 – Mapping Spatial Diffusion
(Allaway, Berkowitz, and Giles 2003)
Though this means of visualization is effective, various types of three-dimensional digital
The Data Center MIT-DATACENTER-WH-006 Copyright © 2005 Massachusetts Institute of Technology
maps carry more information about the geographical area under study. For example, Figure 5 shows an aerial map of the MIT campus viewed through World Wind, an opensource application developed by NASA and written in C# (Microsoft .Net) and ManagedDirect X (http://worldwind.arc.nasa.gov/). The application uses aerial photographs from

Published on July 25, 2005 11
the US Geological Survey in addition to topographic maps from USGS and satellite images from NASA Landsat 7. At some time in the future, real-time satellite images mbe available.
ight
Figure 5 – Arial Picture of MIT
orld Wind is one possible user interface. It is open sourced, and has a user-friendly
ecause this imaging technology is open source, the code can be adjusted to overlay data
This
1. Geocode from the US Census Bureau termed Topologically Integrated
Winterface and serves as a good example for this paper. A lightweight application or a web-based application can also be made. Busing Web Services interfaces to various data sources. As long as a data source is exposed through web service, the application (World Wind) can consume the data. adds additional value to the map. Some sources for additional data overlays might include:
Geographic Encoding and Referencing (TIGER). http://www.census.gov/geo/www/tiger/ The information about spatial objects is organized in records files. The
ain
. Conversion between mailing addresses and longitude, latitude.
2004 TIGER/Line data consists of 19 record types that collectively contattributes like address ranges and ZIP codes, street names, latitude and longitude coordinates and so on. 2
The Data Center MIT-DATACENTER-WH-006 Copyright © 2005 Massachusetts Institute of Technology

Published on July 25, 2005 12
TIGER/Line data is publicly available. It is in text file format. By storing the data within a database and exposing through web service, TIGER allows for mapping between mailing addresses and longitude/latitude. http://pdait1.mit.edu/Geocoding/lookup.asmx 3. Zip Code Tabulation Areas This provides the boundary (lat, long coordinates) for each Zip code area. http://www.census.gov/geo/ZCTA/zcta.html
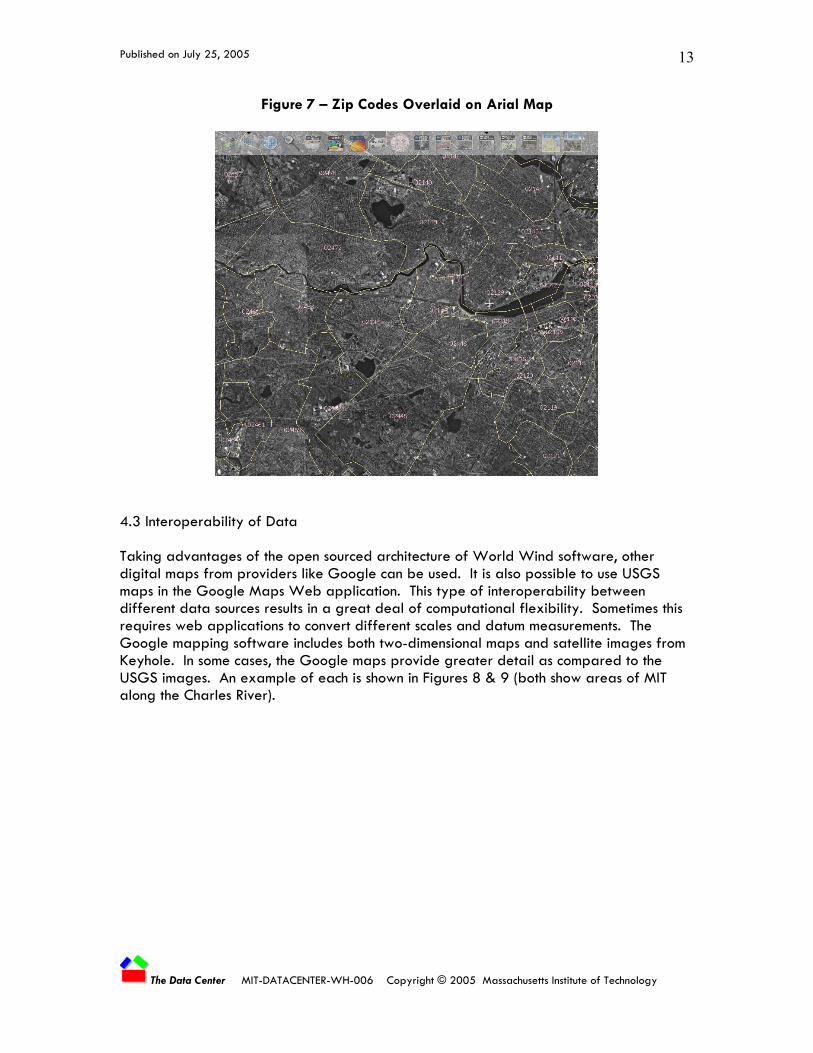
Utilizing these resources, such things as zip code boundaries can be added to digital maps (Figure 6). The approach can also be used for aerial maps (Figure 7). With the aerial maps, the user has the ability to zoom into a particular area and see details such as the type of buildings and transportation network for an urban area.
Figure 6 – Zip Code Boundaries for Massachusetts
The Data Center MIT-DATACENTER-WH-006 Copyright © 2005 Massachusetts Institute of Technology
Published on July 25, 2005 13
Figure 7 – Zip Codes Overlaid on Arial Map 4.3 Interoperability of Data Taking advantages of the open sourced architecture of World Wind software, other digital maps from providers like Google can be used. It is also possible to use USGS maps in the Google Maps Web application. This type of interoperability between different data sources results in a great deal of computational flexibility. Sometimes this requires web applications to convert different scales and datum measurements. The Google mapping software includes both two-dimensional maps and satellite images from Keyhole. In some cases, the Google maps provide greater detail as compared to the USGS images. An example of each is shown in Figures 8 & 9 (both show areas of MIT along the Charles River).
The Data Center MIT-DATACENTER-WH-006 Copyright © 2005 Massachusetts Institute of Technology

Published on July 25, 2005 14
Figure 8 – Google Two Dimensional Maps
Figure 9 – Google Arial Map o MIT
The Data Center MIT-DATACENTER-WH-006 Copyright © 2005 Massachusetts Institute of Technology

Published on July 25, 2005 15
4.4 Spatial Diffusion Another example of this digital mapping technology involves the visualization of spatial diffusion for a particular product. The interesting aspect of this example is that diffusion can be animated to show changes through time using different types of maps and at different resolutions. If street address information is available, adopters can be plotted automatically as part of the animation. As an alternative, if only zip code data exists animation of spatial diffusion can still take place, although at a lower level of resolution. Even animations with low-level resolution through time have value if correlated with aggregate demographics for a particular area (Figure 10 & 11).
Figure 10 – Spatial Diffusion, Arial Map
The Data Center MIT-DATACENTER-WH-006 Copyright © 2005 Massachusetts Institute of Technology

Published on July 25, 2005 16
Figure 11 – Spatial Diffusion, Two Dimensional Map
4.5 Tracking Shipments Beyond spatial diffusion, there are other innovative applications of this mapping technology. With many delivery trucks having global positioning systems, real time information about delivery location becomes possible. Figure 12 shows a map that includes an image of a Federal Express truck that traces the actual position of a particular shipment on the truck and the planed deliveries.
The Data Center MIT-DATACENTER-WH-006 Copyright © 2005 Massachusetts Institute of Technology

Published on July 25, 2005 17
Figure 12 – Tracking Shipments This type of animation is a powerful tool for customer service. Assuming inbound trucks have GPS, all the inbound shipments for an individual distribution center could be visualized through a single image. This type of visual information offers a way for managers to monitor inbound load for a particular warehouse in real time. Concerning outbound shipments, the ability to know the exact delivery location for internet based sales means that the e-commerce fulfillment process can also be an effective data source for spatial diffusion studies. 5.0 CONCLUSION With improved digital mapping technology, open source systems (Waters 2005), and data and model interoperability, detailed studies of spatial diffusion are possible at the street address level for new product launches. Assuming privacy concerns can be overcome, spatial diffusion will become an important tool in new product demand forecasting and optimizing advertising expenditures during an initial launch. Making this tool a part of everyday management decision-making in logistics and marketing will require continuing integration of data, digital maps, and mathematical models. The information technology infrastructure is in place to accomplish this integration with the long-term prospect of improved new product launches in terms of logistical efficiency, cost, and success.
The Data Center MIT-DATACENTER-WH-006 Copyright © 2005 Massachusetts Institute of Technology
Published on July 25, 2005 18
REFERENCES Allaway, Arthur W., David Berkowitz and Giles D’Souza (2003), ”Spatial Diffusion of a New Loyalty Program Through a Retail Market,” Journal of Retailing, Vol. 79, pp 137 – 151. Auchard, Eric (2004), “Yahoo Maps Offer Live US Traffic Conditions,” Reuters, December 16. BALL, Deborah (2004), “Consumer-Goods Firms Duel for Shelf Space,” The Wall Street Journal, October 22, pp B2. Brock, David L., Edmund W. Schuster, Stuart J. Allen and Pinaki Kar (2005), “An Introduction to Semantic Modeling for Logistical Systems,“ Journal of Business Logistics, forthcoming. Bronnenberg, Bart J. and Carl F. Mela (2004), “Market Roll-Out and Retailer Adoption for New Brands,” Marketing Science, Vol. 23, No. 4, pp. 500 – 518. Dash, Eric (2005), “A Web Site Maps Home Searches,” The New York Times, May 1. Delaney, Kevin J. (2005), “Internet Ads Click with Firms; Some Shift Budgets,” The Wall Street Journal, May 3, pp. B8.
Eisenberg, Anne (2005), “What’s Next; A 3-D View of the City, Block by Block,” The New York Times, February 17.
Garber, Tal, Jacob Goldenberg, Barak Libai, and Eitan Muller (2004), “From Density to Destiny: Using Spatial Dimension of Sales Data for Early Prediction of New Product Success,” Marketing Science, Vol. 23, No. 3, pp. 419-428. Gomes, Lee (2005), “Google Pioneers Use Old Microsoft Tools in New Web Programs,” The Wall Street Journal, March 14. Roberts, William A. (2003), “2001 New Products Conference: Take a Chance,” Prepared Foods, November 21. Skarra, Leslie (2004), “Rollout Roulette,” Prepared Foods, May 9. Waters, Richard (2005), “Plugging Together Software May Soon be Painless,” Financial Times, May 3. Whyte, William H., Jr. (1954), “The Web Word of Mouth,” Fortune, November, pp. 140. Zinn, Walter and Peter C. Liu (2001), “Consumer Response to Retail Stockouts,” Journal of Business Logistics, Vol. 22, No. 1, pp. 49-71.
The Data Center MIT-DATACENTER-WH-006 Copyright © 2005 Massachusetts Institute of Technology

Published on July 25, 2005
The Data Center MIT-DATACENTER-WH-006 Copyright © 2005 Massachusetts Institute of Technology
19
NOTES