uc sustainable agriculture research and education...
TRANSCRIPT

AGRICULTURAL WORKER TIME AND ACTIVITY STUDY: CANEBERRY SECTOR, CENTRAL COAST, CALIFORNIA April 15, 2015 Gail Feenstra Food Systems Coordinator Sustainable Agriculture Research & Education Program (SAREP) Agricultural Sustainability Institute (ASI) UC Davis [email protected] Ron Strochlic Research Specialist Nutrition Policy Institute University of California, Division of Agriculture and Natural Resources [email protected] Supported by: California Department of Pesticide Regulation
UC SAREP Is a program of the Agricultural Sustainability Institute at UC Davis and the UC Division of Agriculture
and Natural Resources
UC Sustainable Agriculture Research and Education Program Food and Society

2
AGRICULTURAL WORKER TIME AND ACTIVITY STUDY: CANEBERRY SECTOR, CENTRAL COAST, CALIFORNIA
Gail Feenstra and Ron Strochlic
UC Sustainable Agriculture Research and Education Program
April 15, 2015 EXECUTIVE SUMMARY The California Department of Pesticide Regulation (DPR) contracted with the UC Sustainable Agriculture Research and Education Program (SAREP) to conduct a time and activity assessment among field workers in California’s caneberry sector. The assessment sought to answer several questions, principally the number of hours worked per day and activities field workers engaged in during the course of the year. Methods included (1) on-‐farm observations on two farms on the Central Coast during the period May-‐November 2014; (2) a survey of 151 farmworkers employed in the caneberry sector; (3) an analysis of electronic labor tracking data for all hourly and piece rate workers on one farm during calendar year 2014; and (4) a comparison of observation and pesticide application dates for one farm. Principal findings include the following: Observation Data • Workers spent a mean of 8.69 hours per day on the farms, with a mean of 7.89 hours
per day engaged in work-‐related activities and a mean of 0.80 hours per day on lunch and breaks.
• There were significant variations with respect to hours per day between the two farms at which observations were conducted (9.40 vs. 7.64; p < .001), indicating a need to conduct observations on a larger number of farms to obtain more accurate data.
• The principal activity in which workers were engaged was harvesting, with a mean of 5.72 hours per day across both farms.
• Workers ate lunch in the field 97.3% of the times they were observed. They ate off the ground (seated in chairs or standing) 70.3% of the time and ate sitting on the ground 27.0% of the time.
• Workers washed hands with soap and water prior to eating lunch 73.0% of the time. They rinsed with water only 17.6% of the time and did not wash with soap or water prior to eating 6.8% of the time.
Labor Tracking Data • We analyzed electronic labor tracking data for all hourly and piece rate workers on one
farm for calendar year 2014. • The dataset consisted of 34,044 observations for 994 workers on 302 acres. • The data indicate a total of 3,670 hours of labor per acre. Harvest activities accounted
for 2,934 hours per acre, representing 79% of hours worked.
3
Pesticide Application Data • A comparison of pesticide application data and observation dates indicates a minimum of
three days between pesticide application and harvest activities.
Farmworker Survey • Survey respondents reported a mean of 208 days of employment in agriculture during
the preceding year, a mean of 27 days of non-‐agricultural employment and a mean of 130 days of unemployment.
• 127 (84%) respondents reported zero days of non-‐agricultural employment during the preceding year.
• Respondents reported a mean of 181 days of employment in caneberries during the preceding year and a mean of 26 days of employment in other crops.
• Other crops include apples, blueberries, broccoli, carrots, celery, cauliflower, corn, flowers, grapes and strawberries.
• 125 (83%) respondents reported agricultural employment only in the caneberry sector, while 26 (17%) reported employment in additional crops.
• 42 (27.8%) respondents reported employment on farms using organic production practices. Respondents with employment on organic farms reported working a mean of 179 days on those farms.
• Respondents reported living and working in California (including non-‐agricultural jobs and unemployment) a mean of 348 days over the course of the year, 9.5 days in other US states and 7.6 days in Mexico. 23.2% of respondents reporting migrating more than 75 miles during the course of the year.

4
INTRODUCTION The California Department of Pesticide Regulation (DPR) regulates the sale and use of pesticides in California. DPR uses scientifically generated data to assess worker exposure to pesticides and identify and test mitigation measures. Pesticide exposure assessments make assumptions about frequency and duration of fieldwork tasks that can result in pesticide exposure. Current assessments are based on a default 8-‐hour workday for all tasks, with the assumption that workers perform each task daily throughout the entire period that the task is performed (e.g., that all workers harvest daily throughout the harvest season). DPR seeks more accurate information about task durations as well as the frequency with which individual farmworkers perform specific tasks, information that is currently not available. DPR also seeks information about the other jobs farmworkers perform, to obtain a more accurate assessment of total exposure. DPR contracted with the UC Sustainable Agriculture Research and Education Program (SAREP) to conduct a pilot time and activity study among workers employed in the California caneberry sector. This sector was chosen for a number of reasons, including high use of manual labor and limited data on worker time and activities. The assessment sought to answer the following questions: § How many hours per day do workers on caneberry farms work? § In which specific tasks do they engage? § What is the duration of each task, in terms of number of hours per day? § How many hours per day are workers engaged in tasks involving direct contact with
plants or fruit? § How many hours per day are workers on the farm, but not engaged with tasks involving
direct contact with plants or fruit? § When are tasks performed with respect to pesticide applications? § Do caneberry workers eat lunch and take breaks in or away from the fields? § To what extent do they wash hands before eating? § What type of clothing do caneberry workers wear? § What are general work patterns over the course of the year?
o Which other tasks and crops are caneberry workers engaged in? o How many days per year are caneberry workers employed in other crops? o In which crops do they work? o In which tasks do they engage? o What percent of workers work on farms using organic production practices?
How many days per year do they work on organic farms? o How many days per year are caneberry workers employed in non-‐
agricultural work? o How many days per year are caneberry workers unemployed? o Where do caneberry workers live and work over the course of the year? o What percent of caneberry workers migrate during the course of the year?

5
o To what extent are caneberry workers able to shower after work? To what extent are caneberry workers able to wear freshly laundered clothing to work?
BACKGROUND: CALIFORNIA’S CANEBERRY SECTOR • California’s principal caneberry producing regions are in Ventura, Santa Cruz and
Monterey Counties. • Crop report data from those three counties indicate that there were 8,451 acres of
raspberries and blackberries in California in 2013. • Ventura is California’s top producing caneberry-‐producing county, with 4,286 acres in
2013, followed by Santa Cruz (3,423 acres) and Monterey (742 acres) Counties.1 2 3 • Caneberry acreage in California has been steadily increasing in recent years, from 2,755
acres in 2002 to 8,451 acres in 2013, representing a 207% increase.4 5 6 RESEARCH METHODS
Answers to the research questions were obtained via a multi-‐method design consisting of the following components: (a) on-‐farm worker observations; (b) a survey of workers employed in the caneberry sector; (c) an analysis of electronic labor tracking data for all hourly and piece rate workers on one caneberry farm; and (d) a comparison of pesticide application dates based on spray reports and field observation dates for one farm. The research methods and data collection tools were approved by the UC Davis Institutional Review Board. All grower and worker observation data were confidential while farmworker surveys were anonymous. Worker Observations • Observations were conducted on two caneberry farms that agreed to participate in the
research. • The observed farms were located in Salinas and Watsonville, on California’s Central
Coast. • The farms were identified in collaboration with a large berry supplier that helped the
research team gain access to growers with whom they contract.
1 County of Ventura. Ventura County’s Crop & Livestock Report 2013. Camarillo, CA: Office of the Agricultural Commissioner. 2 County of Santa Cruz. Santa Cruz County 2013 Crop Report. Watsonville: CA. Office of the Agricultural Commissioner. 3 County of Monterey. Monterey County Crop Report 2103. Salinas: CA. Office of the Agricultural Commissioner. 4 County of Ventura. Annual Crop 2002. Santa Paula, CA: Office of the Agricultural Commissioner. 5 County of Santa Cruz. 2002 Santa Cruz County Agricultural Crop and Livestock Report. Watsonville: CA. Office of the Agricultural Commissioner. 6 County of Monterey. Monterey County Crop Report 2002. Salinas: CA. Office of the Agricultural Commissioner.
6
• The farms were offered a $1,000 honorarium to defray costs associated with participation in the research. (One farm accepted the honorarium while the other declined.)
• Foremen on each farm received a $500 honorarium as a means of thanking them for helping to identify workers and other forms of assistance with the research.
• Sample fields in Year 1 of production were identified on each farm. • Sets of two workers working in adjacent rows were identified for observation on each
farm. (Due to the height of caneberry plants, it was not possible to observe more than two workers at the same time.)
• The workers were selected based on voluntarily agreement to participate and provided informed consent.
• Participating workers received a $20 gift card for each month of participation in the research.
• Only workers engaged in harvest activities were observed. • Observations were conducted on each farm once per week. With some exceptions,
observations were conducted on the same day of the week on each farm. • Each set of workers was observed on alternating weeks, in order to observe a larger
number of workers. • A total of 74 observations were conducted – 44 on Farm A (Salinas) and 30 on Farm B
(Watsonville). • Observations were conducted on 40 distinct days, from May 21, 2014 through the end
of the harvest on November 18, 2014.7 • A total of 14 workers were observed (10 on Farm A and 4 on Farm B). Observed
workers included 4 men and 10 women, ranging in age from 18 to 70, with an average age of 35.
• Participating workers were replaced with new participants when they left the farm or were transferred to another part of the farm. This sometimes resulted in observing only one worker until a replacement could be identified.
• Observations were conducted over the course of the entire workday, beginning at the start of each workday and lasting until workers left for the day.
• Observations consisted of recording start and stop times for each activity workers engaged in. Activities included picking, packing, weighing and inspecting berries, as well as vine maintenance and other related tasks. Additional times recorded included lunch, rest breaks, bathroom breaks, and time spent walking to and from fields. (See Appendix A for a copy of the observation form.)
• In addition to work-‐related activities, additional information gathered included: (a) type of clothing and/or protective equipment; (b) location of breaks and lunch (in or away from fields); (c) seating arrangements during breaks and lunch (seated in chairs, seated on the ground, standing); and (d) whether workers washed or sanitized hands before eating.
7 We had hoped to conduct observations throughout the entire harvest period, but were unable to do so due to delays in identifying farms willing to participate in the research.

7
Farmworker Survey • An interviewer-‐administered survey of 151 agricultural workers reporting employment
in the caneberry sector during the previous 12 months was conducted during the period June 25, 2014 – October 1, 2014. (See Appendix B for a copy of the survey instrument.)
• The survey consisted of a work history, which gathered information on employment and related activities for the previous 12-‐months. Information gathered included type of work (agricultural, non-‐agricultural), crop or sector, principal tasks, dates of employment, location and whether the farm used organic production practices.
• The survey also elicited information regarding bathing and laundering as well as respondent demographic characteristics.
• Recruitment was based on a convenience sample of workers identified at a range of locations in Santa Cruz and Monterey Counties, including caneberry farms, a migrant labor camp, an apartment complex, farmers markets, flea markets, supermarkets and other retail locations, parks, laundromats and other public places.
• Selection criteria included 18 years of age or older and one or more days of employment in the caneberry sector during the previous 12-‐months.
• Survey respondents provided informed consent. • All respondents received a $10 gift card. Analysis of Electronic Labor Tracking Data • The two farms where observations were conducted use digital technology to track
labor. • Workers scan a card with a chip or magnetic stripe, which digitally records activities
and associated times or numbers of trays picked. • One of the participating farms agreed to share labor-‐tracking data for all hourly and
piece rate workers employed on the farm during calendar year 2014. • The data included the amount of time spent on harvest and other activities, as well as
piece rate counts of the number of trays picked by each worker. Comparison of Observation and Spray Report Dates • The same farm that shared labor-‐tracking data also shared spray reports for the fields
where observations occurred. • Pesticide application dates were compared with dates when workers were observed. STUDY LIMITATIONS There are several limitations to this study: • Observations were conducted on two farms only. Production practices and labor
requirements may vary significantly from farm to farm.

8
• Only two workers were observed per visit (with the exception of three days when three workers engaging in vine maintenance activities were observed).
• Observations were conducted on farms in Santa Cruz and Monterey Counties. Production practices on the Central Coast may differ those in other regions.
• Labor tracking and pesticide application data are from one farm only. • Observation data are for Year 1 of production only. Labor requirements are different for
establishment and Year 2 production activities.
9
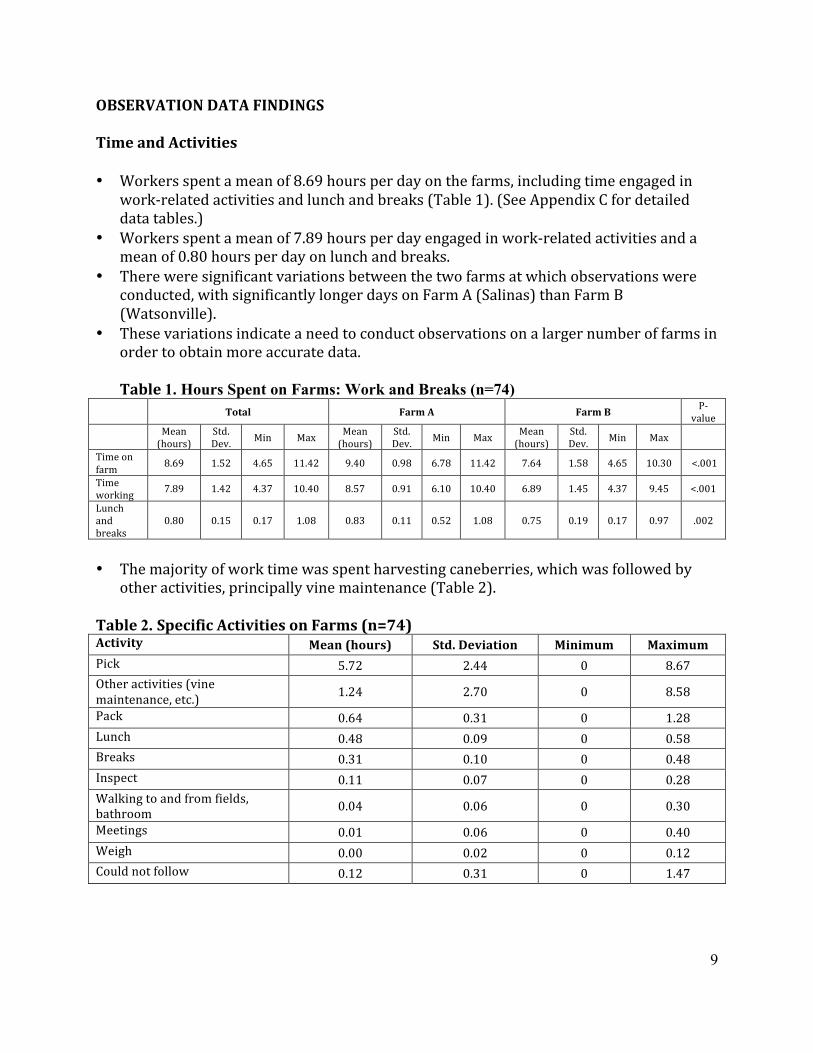
OBSERVATION DATA FINDINGS Time and Activities • Workers spent a mean of 8.69 hours per day on the farms, including time engaged in
work-‐related activities and lunch and breaks (Table 1). (See Appendix C for detailed data tables.)
• Workers spent a mean of 7.89 hours per day engaged in work-‐related activities and a mean of 0.80 hours per day on lunch and breaks.
• There were significant variations between the two farms at which observations were conducted, with significantly longer days on Farm A (Salinas) than Farm B (Watsonville).
• These variations indicate a need to conduct observations on a larger number of farms in order to obtain more accurate data.
Table 1. Hours Spent on Farms: Work and Breaks (n=74)
Total Farm A Farm B P-‐value
Mean (hours)
Std. Dev. Min Max Mean
(hours) Std. Dev. Min Max Mean
(hours) Std. Dev. Min Max
Time on farm 8.69 1.52 4.65 11.42 9.40 0.98 6.78 11.42 7.64 1.58 4.65 10.30 <.001
Time working 7.89 1.42 4.37 10.40 8.57 0.91 6.10 10.40 6.89 1.45 4.37 9.45 <.001
Lunch and breaks
0.80 0.15 0.17 1.08 0.83 0.11 0.52 1.08 0.75 0.19 0.17 0.97 .002
• The majority of work time was spent harvesting caneberries, which was followed by
other activities, principally vine maintenance (Table 2). Table 2. Specific Activities on Farms (n=74) Activity Mean (hours) Std. Deviation Minimum Maximum Pick 5.72 2.44 0 8.67 Other activities (vine maintenance, etc.) 1.24 2.70 0 8.58
Pack 0.64 0.31 0 1.28 Lunch 0.48 0.09 0 0.58 Breaks 0.31 0.10 0 0.48 Inspect 0.11 0.07 0 0.28 Walking to and from fields, bathroom 0.04 0.06 0 0.30
Meetings 0.01 0.06 0 0.40 Weigh 0.00 0.02 0 0.12 Could not follow 0.12 0.31 0 1.47
10
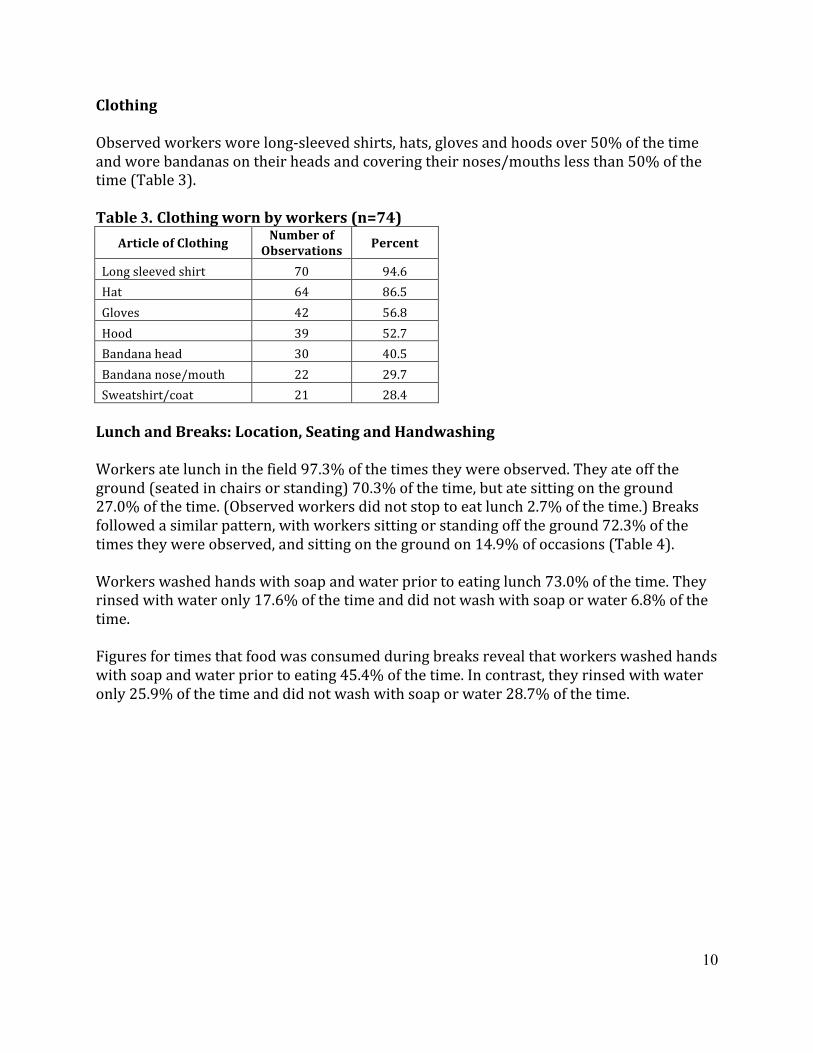
Clothing Observed workers wore long-‐sleeved shirts, hats, gloves and hoods over 50% of the time and wore bandanas on their heads and covering their noses/mouths less than 50% of the time (Table 3). Table 3. Clothing worn by workers (n=74)
Article of Clothing Number of Observations Percent
Long sleeved shirt 70 94.6 Hat 64 86.5 Gloves 42 56.8 Hood 39 52.7 Bandana head 30 40.5 Bandana nose/mouth 22 29.7 Sweatshirt/coat 21 28.4 Lunch and Breaks: Location, Seating and Handwashing Workers ate lunch in the field 97.3% of the times they were observed. They ate off the ground (seated in chairs or standing) 70.3% of the time, but ate sitting on the ground 27.0% of the time. (Observed workers did not stop to eat lunch 2.7% of the time.) Breaks followed a similar pattern, with workers sitting or standing off the ground 72.3% of the times they were observed, and sitting on the ground on 14.9% of occasions (Table 4). Workers washed hands with soap and water prior to eating lunch 73.0% of the time. They rinsed with water only 17.6% of the time and did not wash with soap or water 6.8% of the time. Figures for times that food was consumed during breaks reveal that workers washed hands with soap and water prior to eating 45.4% of the time. In contrast, they rinsed with water only 25.9% of the time and did not wash with soap or water 28.7% of the time.

11
Table 4. Lunch and Breaks on Farms: Location, Seating and Handwashing Lunch Breaks Where seated N % N* % Field, on ground 20 27.0 18 12.2 Field, off ground (chair, standing) 52 70.3 107 72.3 Away from field, on ground -‐ -‐ 4 2.7 NA-‐did not stop for lunch/break 2 2.7 19 12.8 Total 74 100 148 100 Handwashing
Water only 13 17.6 28 18.9 Soap and water 54 73.0 49 33.1 Did not wash hands 5 6.8 31 20.9 NA – did not eat 2 2.7 40 27.0 Total 74 100 148 100
* The number of breaks observed is greater than 74 because multiple breaks were combined for purposes of the analysis. ANALYSIS OF LABOR TRACKING DATA One of the participating farms provided electronic labor tracking data for all hourly and piece rate workers employed during the period January 1-‐December 31, 2104. The dataset consisted of 34,044 observations for 994 workers on 302 acres. Each observation provided information including task, number of hours and number of trays picked. The number of observations per worker was variable, and ranged from a minimum of one to a maximum of 133 (mean=34.25, s.d.=27.67). Since the dataset did not include a field for date, it was not possible to calculate hours per day for individual employees. Nonetheless, the data do provide a useful indication regarding the number of hours workers are engaged in different tasks on caneberry farms on a per acre basis. There are several limitations to this dataset and findings should be interpreted with caution. The dataset includes information for hourly and piece rate workers only, but does not provide information for salaried employees, including field staff. The dataset provides information for hourly and piece rate workers employed for any length of time during calendar year 2014. Some employees may have been employed as little as one day, and the dataset does not provide information regarding their activities during the rest of the year. The dataset includes information for raspberries and blackberries produced under organic and conventional methods.
12
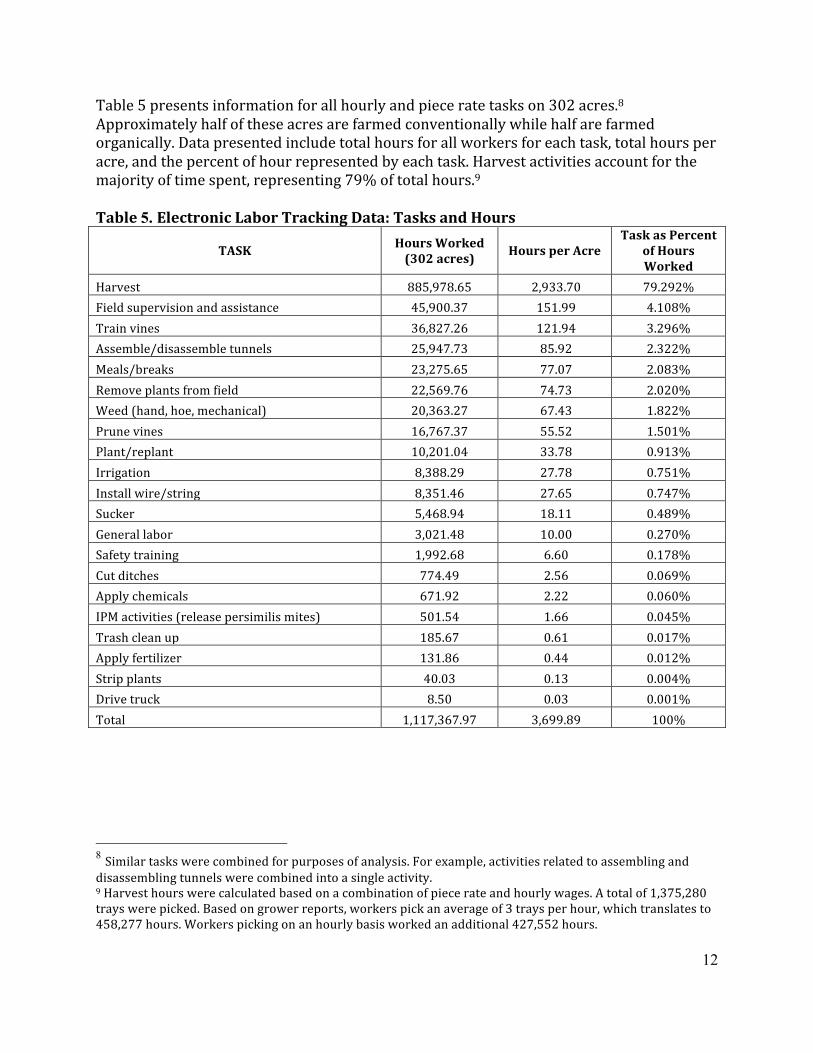
Table 5 presents information for all hourly and piece rate tasks on 302 acres.8 Approximately half of these acres are farmed conventionally while half are farmed organically. Data presented include total hours for all workers for each task, total hours per acre, and the percent of hour represented by each task. Harvest activities account for the majority of time spent, representing 79% of total hours.9 Table 5. Electronic Labor Tracking Data: Tasks and Hours
TASK Hours Worked (302 acres) Hours per Acre
Task as Percent of Hours Worked
Harvest 885,978.65 2,933.70 79.292% Field supervision and assistance 45,900.37 151.99 4.108% Train vines 36,827.26 121.94 3.296% Assemble/disassemble tunnels 25,947.73 85.92 2.322% Meal s/breaks 23,275.65 77.07 2.083% Remove plants from field 22,569.76 74.73 2.020% Weed (hand, hoe, mechanical) 20,363.27 67.43 1.822% Prune vines 16,767.37 55.52 1.501% Plant/replant 10,201.04 33.78 0.913% Irrigation 8,388.29 27.78 0.751% Install wire /string 8,351.46 27.65 0.747% Sucker 5,468.94 18.11 0.489% General labor 3,021.48 10.00 0.270% Safety training 1,992.68 6.60 0.178% Cut ditches 774.49 2.56 0.069% Apply chemicals 671.92 2.22 0.060% IPM activities (release persimilis mites) 501.54 1.66 0.045% Trash clean up 185.67 0.61 0.017% Apply fertilizer 131.86 0.44 0.012% Strip plants 40.03 0.13 0.004% Drive truck 8.50 0.03 0.001% Total 1,117,367.97 3,699.89 100%
8 Similar tasks were combined for purposes of analysis. For example, activities related to assembling and disassembling tunnels were combined into a single activity. 9 Harvest hours were calculated based on a combination of piece rate and hourly wages. A total of 1,375,280 trays were picked. Based on grower reports, workers pick an average of 3 trays per hour, which translates to 458,277 hours. Workers picking on an hourly basis worked an additional 427,552 hours.

13
PESTICIDE APPLICATION AND OBSERVATION DATES One of the participating farms provided information regarding pesticide applications, including application dates and products applied. Table 6 provides an overview of pesticide application and observation dates on that farm. (Highlighted sections represent overlap between pesticide application and observation dates.) The data reveal a minimum of three days between pesticide applications and harvest activities. These data should be interpreted with caution, as observations were conducted once a week or less. Additionally, the application date refers to the date on which all spraying was completed. It is possible that spraying was completed one or more days earlier than the observation date in the field observed, or that applications took place after workers had left for the day. Table 6. Observation and Pesticide Application Dates
Month Observation Date
Application Date
Interval Application/Obser
vation
Event Type
January 2014
1/17/14 Ground, LIME-SULFUR SOLUTION, 12 Gal/200 Gal, REI: 48 Hours Pesticide
1/24/14 Ground, ROUNDUP POWERMAX, 36.864 Oz/Treated Ac, PHI=14 days (02/07/2014), REI: 4 Hours
Pesticide
February 2014
2/12/14 Ground, SHARK EW, 1 oz/Treated Ac, PHI=15 days (02/27/2014), REI: 12 Hours Pesticide
2/12/14 Ground, POINT BLANK, 1 oz/100 Gal, REI: Not Specified Pesticide
2/12/14 Ground, INDUCE, 64 Oz/100 Gal, REI: Not Specified Pesticide
March 2014
3/11/14 Ground, SHARK EW, 6.4 Oz/Treated Ac, PHI=15 days (03/26/2014), REI: 12 Hours Pesticide
3/11/14 Ground, SELECT MAX, 12 Oz/Treated Ac, PHl=7 days (03/18/2014), REI: 24 Hours Pesticide
3/11/14 Ground, POINT BLANK, 1 oz/100 Gal, REI: Not Specified Pesticide
3/11/14 Ground, SILWET L-77 SURFACTANT, 4 Oz/100 Gal, REI: Not Specified Pesticide
April 2014
4/3/14 Ground, CONFIRM 2F INSECTICIDE, 12 Oz/Treated Ac, PHI=14 days (04/17/2014), REI: 4 Hours
Pesticide
4/3/14 Ground, RALLY 40WSP FUNGICIDE, 3 Oz/Treated Ac, REI: 24 Hours Pesticide
4/3/14 Ground, INDUCE, 16 Oz/200 Gal,REI: Not Specified Pesticide
4/3/14 Ground, DIPEL DF INSECTICIDE, 1.5 Lb/Treated Ac, REI: 4 Hours Pesticide
4/10/14 Ground, POINT BLANK, 1 oz/100 Gal, REI: Not Specified Pesticide

14
Month Observation Date
Application Date
Interval Application/Obser
vation
Event Type
4/10/14 Ground, SHARK EW, 5 Oz/Treated Ac, PHI=15 days (04/25/2014), REI: 12 Hours Pesticide
4/10/14 Ground, WIDESPREAD MAX, 5 Oz/100 Gal, REI: Not Specified Pesticide
4/23/14 Ground, PRISTINE FUNGICIDE, 20 Oz/Treated Ac, REI: 12 Hours Pesticide
4/23/14 Ground, SUCCESS, 4.5 Oz/Treated Ac, PHI=l days (04/24/2014), REI: 4 Hours Pesticide
4/23/14 Ground, INDUCE, 16 Oz/200 Gal, REI: Not Specified Pesticide
May 2014
5/10/14 Ground, RALLY 40WSP FUNGICIDE, 3 Oz/Treated Ac, REI: 24 Hours Pesticide
5/10/14 Ground, XENTARI DF INSECTICIDE, 1.5 Lb/Treated Ac, REI: 4 Hours Pesticide
5/10/14 Ground, INDUCE, 8 Oz/100 Gal, REI: Not Specified Pesticide
5/16/14 Ground, ABOUND, 12 Oz/Treated Ac, REI: 4 Hours Pesticide
5/16/14 Ground, DIPEL DF INSECTICIDE, 2 Lb/Treated Ac, REI: 4 Hours Pesticide
5/26/14 5/16/14 10 days Ground, INDUCE, 16 Oz/200 Gal,REI: Not Specified Pesticide
5/27/14 5/31/14 11 days Ground, DEVRINOL 50-DF HERBICIDE, 4.36364 Lb/Treated Ac, REI: 24 Hours Pesticide
June 2014
6/16/14 6/17/14 16 days Ground, MUSTANG INSECTICIDE, 4.3 Oz/Treated Ac, PHI=l days (06/18/2014), REI: 12 Hours
Pesticide
6/24/14 6/28/14 7 days Ground, PRISTINE FUNGICIDE, 20 Oz/Treated Ac, REI: 12 Hours Pesticide
6/28/14 Ground, MUSTANG INSECTICIDE, 4.3 Oz/Treated Ac, PHl=l days (06/29/2014), REI: 12 Hours
Pesticide
6/28/14 Ground,WIDESPREAD MAX, 4 Oz/100 Gal, REI: Not Specified Pesticide
July 2014 7/22/14 25 days 7/31/14
8/2/14 3 days Ground,SWITCH 62.5 WG, 12 Oz/Treated Ac, REI: 12 Hours Pesticide
8/5/14 8/2/14 24 days Ground, WIDESPREAD MAX, 4 Oz/100 Gal, REI: Not Specified Pesticide
8/26/14 8/2/14 Ground, MUSTANG INSECTICIDE,4.3 Oz/Treated Ac, PHl=l days (08/03/2014), REI: 12 Hours
Pesticide
8/30/14 10 days Ground, MUSTANG INSECTICIDE, 4.3 Oz/Treated Ac, PHl=l days (08/31/2014), REI: 12 Hours
Pesticide

15
Month Observation Date
Application Date
Interval Application/Obser
vation
Event Type
September 2014
9/9/14 Ground, MUSTANG INSECTICIDE, 4.3 Oz/Treated Ac, PHI=l days (09/24/2014), REI: 12 Hours
Pesticide
9/12/14 23 days
9/22/14 9/23/14 9 days
October 2014
10/2/14 10/14/14 10/24/14
November 2014
11/4/14 11/17/14 11/18/14
16
SURVEY FINDINGS A survey of 151 farmworkers working in caneberries during the 12-‐month period preceding the survey was conducted between June-‐October 2014. Principal findings are presented below. Demographic Characteristics • Age: Respondents reported a mean age of 38.7, with a minimum of 18 and a maximum
of 71. Approximately one-‐fourth (28%) of respondents were between the ages of 18 and 29, 42% were in the 30-‐44 year age range, and 30% reported ages between 45 and 71.
• Gender: Approximately 43% of the sample consisted of men, while 56% of respondents were women. One respondent (0.7%) reported transgender (male to female) status.
• Years working in agriculture: The respondents reported a mean of 10.4 years working in agriculture in the U.S., with a minimum of 0 and maximum of 40 years.
• Indigenous status: Identifying indigenous status of immigrants from Mexico and Central America can be challenging, given varying self-‐perceptions of ethnic identity and stigmas associated with being indigenous. Respondents were asked about languages spoken as a proxy for indigenous status. Only 12 (7.9%) respondents reported speaking an indigenous Mexican language. Languages reported include Mixteco (n=9), Nahuatl (n=1), Yaqui (n=1) and Zapoteco (n=1).
Employment Patterns • Survey respondents reported a mean of 208 days of employment in agriculture during
the preceding year, with a minimum of 8 and a maximum of 365 days. (See Appendix D for detailed survey responses.)
• Respondents reported a mean of 27 days of non-‐agricultural employment during the preceding year, with a minimum of 0 and a maximum of 355 days. • 127 (84%) respondents reported zero days of non-‐agricultural employment during
the preceding year. • The respondents reported a mean of 130 days of unemployment, with a minimum of 0
and a maximum of 357 days. • 30 (20%) respondents reported zero days of unemployment.
• The respondents reported a mean of 3.4 jobs over the course of the previous year, with a minimum of 2 and a maximum of 11. Most respondents (58.3%) reported three different jobs over the course of the year. (Note: Leaving and returning to the same place of employment was counted as two jobs.)
Principal Crops • Respondents reported a mean of 181 days of employment in caneberries during the
preceding year, with a minimum of 8 days and a maximum of 365.

17
• Respondents reported a mean of 26 days of employment in other crops, with a minimum of 0 days and a maximum of 305. • Other crops reported include apples, blueberries, broccoli, carrots, celery,
cauliflower, corn, flowers, grapes and strawberries. • 125 (83%) respondents reported agricultural employment only in the caneberry sector,
while 26 (17%) reported employment in additional crops. Principal Tasks and Duration For each period of employment, respondents were asked about the principal crop they worked on and up to three main tasks. The most commonly reported activities across all crops were picking, assembling and dismantling tunnels, pruning, weeding and packing (Table 7). (Note: Percentages are based on the 378 activities reported by respondents in the sample.) Agricultural tasks were categorized as activities involving contact with plants and fruit and those not involving contact. • Respondents reported engaging in activities involving contact with plants and fruit an
average of 189 days per year, with a minimum of 0 days and a maximum of 365. • Respondents reported engaging in activities not involving contact with plants and fruit
an average of 19 days per year, with a minimum of 0 days and maximum of 342. Table 7. Principal Agricultural Activities: All Crops
Activity Frequency with which task mentioned
Percent
Picking 136 36.0% Tunnels (assembling/dismantling) 37 9.8% Pruning 29 7.7% Weeding 29 7.7% Packing 28 7.4% Trellising 27 7.1% Training vines 22 5.8% Administrative tasks (in-‐field) 16 4.2% Transplanting 11 2.9% Planting 10 2.6% General maintenance 9 2.4% Irrigation 9 2.4% Flower shop activities 5 1.3% Spraying 5 1.3% Tractor driver 3 0.8% Truck driver 2 0.5% Total 378 100%

18
Employment on Organic Farms For each distinct period of agricultural employment, respondents were asked whether the farm used organic production practices. • 42 (27.8%) respondents reported employment on farms using organic production
practices during the course of the previous year. • Respondents with employment on organic farms reported working a mean of 179 days
on those farms, with a minimum of 33 days and a maximum of 365. • Note: A number of respondents reporting employment on farms utilizing organic and
conventional production practices. For purposes of the analysis, days worked on those farms was counted as employment on organic farms.
Geographic Location and Migratory Patterns The work history elicited information regarding the location of each activity (agricultural employment, non-‐agricultural employment, unemployment). • Respondents reported living and working in California (including non-‐agricultural jobs
and unemployment) a mean of 348 days over the course of the year, with a minimum of 39 days and a maximum of 365.
• Respondents reported a mean of 9.5 days working in other US states, with a minimum of 0 days and a maximum of 326.
• Respondents reported a mean of 7.6 days in Mexico, with a minimum of 0 days and a maximum of 200.
• The overwhelming majority of locations reported by respondents are on the Central Coast (91.3%) (Table 8).
Table 8. Geographic Location: Agricultural Employment and Other Activities Location Frequency Percent Central Coast 475 91.3% Mexico 13 2.5% Southern CA 13 2.5% Out of state 8 1.5% San Joaquin Valley, CA 7 1.3% Northern CA 4 0.8% Total 520 100% The U.S. Department of Labor’s National Agricultural Workers Survey (NAWS) defines a migrant farmworker as “a worker who traveled a distance of more than 75 miles between two farm jobs or between a farm job and a usual residence during the past year.”10 Since the survey did not gather detailed geographic information, farmworkers were considered migratory if they reported living or working in two or more of the regions listed in Table 8
10 The National Agricultural Workers Survey. http://www.doleta.gov/agworker/naws.cfm. Retrieved April 1, 2015.

19
during the course of the year, with the assumption that distances between regions are 75 miles or more. Based on that, 35 respondents (23.2%) were considered migratory, while 116 respondents (76.8%) reported living and working in the Central Coast region during the entire year. (Note: While some respondents reported working in different cities on the Central Coast during the year (e.g. Watsonville and Salinas), they were not considered migratory, given the short distances.) Bathing and Laundering The survey included questions regarding bathing and laundering. All respondents reported they were able to bathe or shower after the last time they had engaged in agricultural work. Additionally, 92.1% of respondents reported wearing freshly laundered clothes the last time they had engaged in fieldwork, while 7.9% reported that they had not. CONCLUSIONS Findings from this pilot assessment indicate that fieldworkers engaged in harvest activities on two caneberry farms on California’s Central Coast spend an average of 8.7 hours per day on the farm, of which 7.8 hours are spent engaged in work-‐related activities. Given the small number of farms observed and the significant variations in hours between these two farms, findings should be used with caution.

20
Acknowledgements We wish to thank the farmers, farm managers, foremen and farmworkers who generously agreed to collaborate with us on this study; none of this would be possible without them. We also wish to thank Yovanna Bravo, who spent many hours in the fields observing activity patterns and conducting surveys; Celeste Enriquez and Jorge Contreras, who conducted farmworker surveys and entered detailed data. Celeste Enriquez also provided invaluable help with data analysis. We are very grateful to the Department of Pesticide Regulation for funding this research; particularly Sheryl Beauvais, who made working with a large government organization as smooth and seamless as possible.
21
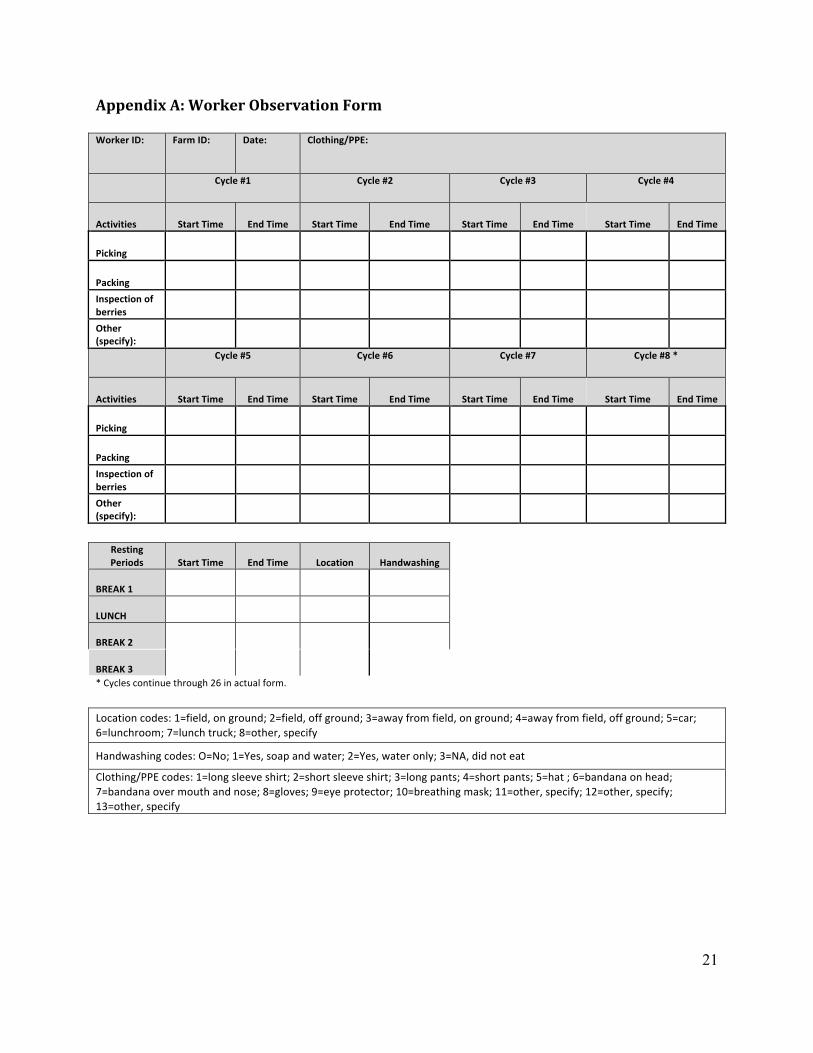
Appendix A: Worker Observation Form Worker ID: Farm ID: Date: Clothing/PPE:
Cycle #1 Cycle #2 Cycle #3 Cycle #4
Activities Start Time End Time Start Time End Time Start Time End Time Start Time End Time
Picking
Packing Inspection of berries Other (specify): Cycle #5 Cycle #6 Cycle #7 Cycle #8 *
Activities Start Time End Time Start Time End Time Start Time End Time Start Time End Time
Picking
Packing Inspection of berries Other (specify):
Resting Periods Start Time End Time Location Handwashing
BREAK 1
LUNCH
BREAK 2
BREAK 3
* Cycles continue through 26 in actual form.
Location codes: 1=field, on ground; 2=field, off ground; 3=away from field, on ground; 4=away from field, off ground; 5=car; 6=lunchroom; 7=lunch truck; 8=other, specify
Handwashing codes: O=No; 1=Yes, soap and water; 2=Yes, water only; 3=NA, did not eat
Clothing/PPE codes: 1=long sleeve shirt; 2=short sleeve shirt; 3=long pants; 4=short pants; 5=hat ; 6=bandana on head; 7=bandana over mouth and nose; 8=gloves; 9=eye protector; 10=breathing mask; 11=other, specify; 12=other, specify; 13=other, specify

22
Appendix B: Farmworker Survey
FARMWORKER TIME AND ACTIVITY SURVEY SCREENER QUESTIONS A. Have you worked in raspberries or blackberries during the past 12 months? □ Yes □ No □ Don’t Know/Refuse
àIF “NO” OR “DON’T KNOW/REFUSE” END HERE B. Are you 18 years old or older? □ Yes □ No □ Don’t Know/Refuse
àIF “NO” OR “DON’T KNOW/REFUSE” END HERE àIF “YES” TO “A” AND “B” OBTAIN INFORMED CONSENT AND ADMINISTER
SURVEY
23
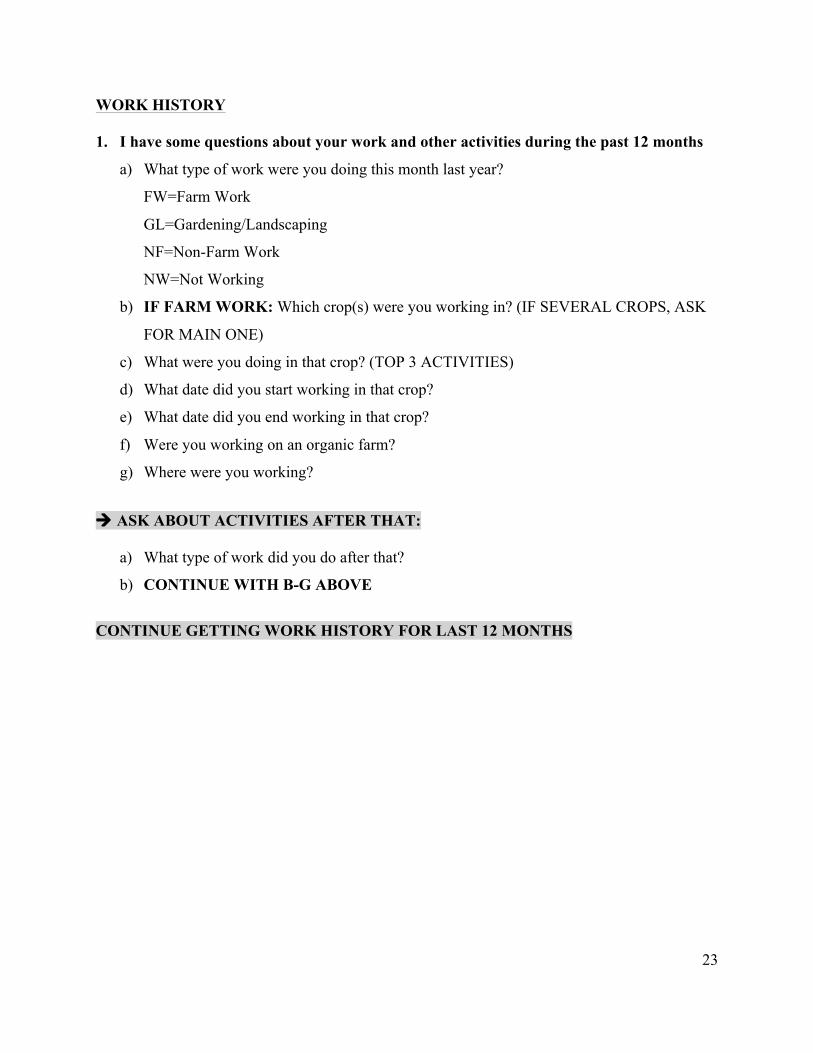
WORK HISTORY 1. I have some questions about your work and other activities during the past 12 months
a) What type of work were you doing this month last year?
FW=Farm Work
GL=Gardening/Landscaping
NF=Non-Farm Work
NW=Not Working
b) IF FARM WORK: Which crop(s) were you working in? (IF SEVERAL CROPS, ASK
FOR MAIN ONE)
c) What were you doing in that crop? (TOP 3 ACTIVITIES)
d) What date did you start working in that crop?
e) What date did you end working in that crop?
f) Were you working on an organic farm?
g) Where were you working?
à ASK ABOUT ACTIVITIES AFTER THAT:
a) What type of work did you do after that?
b) CONTINUE WITH B-G ABOVE
CONTINUE GETTING WORK HISTORY FOR LAST 12 MONTHS