uc riverside foundationfoundation.ucr.edu/uc riverside foundation fye17 audited financial... · uc...
TRANSCRIPT

UC Riverside Foundation Financial Statements June 30, 2017 and 2016

UC Riverside Foundation Index June 30, 2017 and 2016
Page(s)
Report of Independent Auditors ........................................................................................................ 1–2
Management’s Discussion and Analysis (Unaudited) ............................................................................... 3–7
Basic Financial Statements
Statements of Net Position ............................................................................................................................. 8
Statements of Revenue, Expenses, and Changes in Net Position .................................................................. 9
Statements of Cash Flows ............................................................................................................................. 10
Notes to Financial Statements .................................................................................................................11–23

PricewaterhouseCoopers LLP, 601 South Figueroa, Los Angeles, CA 90017 T: (213) 356 6000, F: (813) 637 4444, www.pwc.com/us
Report of Independent Auditors
To the Board of Trustees of the UC Riverside Foundation
We have audited the accompanying financial statements of UC Riverside Foundation (the “Foundation”), a component unit of the University of California, which comprise the statements of net position as of June 30, 2017 and 2016, and the related statements of revenue, expenses, and changes in net position and of cash flows for the years then ended.
Management’s Responsibility for the Financial Statements
Management is responsible for the preparation and fair presentation of the financial statements in accordance with accounting principles generally accepted in the United States of America; this includes the design, implementation, and maintenance of internal control relevant to the preparation and fair presentation of financial statements that are free from material misstatement, whether due to fraud or error.
Auditors’ Responsibility
Our responsibility is to express an opinion on the financial statements based on our audits. We conducted our audits in accordance with auditing standards generally accepted in the United States of America. Those standards require that we plan and perform the audit to obtain reasonable assurance about whether the financial statements are free from material misstatement.
An audit involves performing procedures to obtain audit evidence about the amounts and disclosures in the financial statements. The procedures selected depend on our judgment, including the assessment of the risks of material misstatement of the financial statements, whether due to fraud or error. In making those risk assessments, we consider internal control relevant to the Foundation’s preparation and fair presentation of the financial statements in order to design audit procedures that are appropriate in the circumstances, but not for the purpose of expressing an opinion on the effectiveness of the Foundation’s internal control. Accordingly, we express no such opinion. An audit also includes evaluating the appropriateness of accounting policies used and the reasonableness of significant accounting estimates made by management, as well as evaluating the overall presentation of the financial statements. We believe that the audit evidence we have obtained is sufficient and appropriate to provide a basis for our audit opinion.
Opinion
In our opinion, the financial statements referred to above present fairly, in all material respects, the financial position of the Foundation as of June 30, 2017 and 2016, respectively, and the changes in its financial position and its cash flows for the years then ended in accordance with accounting principles generally accepted in the United States of America.

2
Other Matters
Required Supplementary Information
The accompanying management’s discussion and analysis on pages 3-7 are required by accounting principles generally accepted in the United States of America to supplement the basic financial statements. Such information, although not a part of the basic financial statements, is required by the Governmental Accounting Standards Board who considers it to be an essential part of financial reporting for placing the basic financial statements in an appropriate operational, economic, or historical context. We have applied certain limited procedures to the required supplementary information in accordance with auditing standards generally accepted in the United States of America, which consisted of inquiries of management about the methods of preparing the information and comparing the information for consistency with management's responses to our inquiries, the basic financial statements, and other knowledge we obtained during our audit of the basic financial statements. We do not express an opinion or provide any assurance on the information because the limited procedures do not provide us with sufficient evidence to express an opinion or provide any assurance.
Los Angeles, California
October 11, 2017

UC Riverside Foundation Management's Discussion and Analysis (Unaudited) June 30, 2017 and 2016
3
The following section of the annual financial report of the UC Riverside Foundation (the “Foundation”) includes an overview and analysis of the Foundation’s financial position and activities for the years ended June 30, 2017 and 2016. This discussion and analysis, as well as the basic financial statements, which it accompanies, are the responsibility of the management of the Foundation.
Introduction to the Basic Financial Statements This annual report consists of a series of financial statements prepared in accordance with pronouncements issued by the Governmental Accounting Standards Board using the economic resources measurement focus and the accrual basis of accounting. The basic financial statements include statements of net position; statements of revenue, expenses, and changes in net position; and statements of cash flows. Notes to the basic financial statements support these statements. All sections must be considered together to obtain a complete understanding of the financial position and changes in financial position of the Foundation.
Statements of Net Position The statements of net position include all assets and liabilities of the Foundation, with the difference between the two reported as net position. Assets and liabilities are categorized as current or noncurrent, as of June 30, 2017 and 2016. These statements also identify major categories of restrictions on the net position of the Foundation. The Foundation’s net position (the difference between assets and liabilities) is one indicator of the Foundation’s financial health, when considered in combination with other nonfinancial information.
Statements of Revenue, Expenses, and Changes in Net Position The statements of revenue, expenses, and changes in net position present the revenue earned and expenses incurred by the Foundation during the years ended June 30, 2017 and 2016, on an accrual basis. Revenue and expenses on these statements are classified as operating or nonoperating. Incoming gifts and grants made to the campus are reported as operating revenue and expense, respectively, and investment results are reported as nonoperating income or loss.
Statements of Cash Flows The statements of cash flows present the changes in the Foundation’s cash for the years ended June 30, 2017 and 2016, summarized by operating, noncapital financing, and investing activities. The statements are prepared using the direct method of cash flows and, therefore, present gross rather than net amounts for each year’s activities.
Financial Highlights The following discussion highlights management’s understanding of the key financial aspects of the Foundation’s financial condition and activities:
During fiscal year 2017, the Foundation’s net position, which represents the excess of total assets over liabilities, increased by $27.9 million. This is compared to a decrease in net position during fiscal year 2016 of $2.0 million and a decrease during fiscal year 2015 of $3.9 million. The primary factors for the increase in net position during fiscal year 2017 were positive financial market conditions and returns on investments. The Foundation was invested primarily in marketable equity and fixed income funds and equity securities. In 2017, as compared to 2016, marketable U.S. equity and international equity funds and securities saw an increase in returns.
During 2017, overall contributions to the Foundation increased by $863,000 over that of fiscal year 2016. This was due to an increase in contributions to permanent endowments and gifts of marketable securities. Fiscal year 2016 saw an increase in contributions over fiscal 2015 due to an increase in contributions to permanent endowments and pledges.

UC Riverside Foundation Management's Discussion and Analysis (Unaudited) June 30, 2017 and 2016
4
The financial markets over the past three fiscal years have fluctuated significantly. Nonoperating gains in fiscal year 2017 were $24.9 million as compared to nonoperating losses of $7.0 million in 2016 and nonoperating gains of $650,000 in 2015. This change was primarily due to the increase of returns on marketable U.S. and international equity funds and securities.
The Foundation expects fluctuations in contribution revenue, additions to permanent endowments and investment results from year to year. The Foundation manages the endowment portfolio in accordance with established financial, investment, and spending objectives. Significant contributions, including bequests, are periodically received from donors as a result of relationships cultivated over many years. The timing of these contributions is not entirely predictable, and often will correlate with a campus initiative.
Condensed Schedule of Net Position
2017 2016 2015
AssetsCurrent assets 10,97 5,932$ 10,57 1 ,162$ 7 ,130,554$ Noncurrent assets 160,17 4,144 132,198,948 137 ,67 0,7 58
Total assets 17 1,150,07 6$ 142,7 7 0,110$ 144,801,312$
LiabilitiesCurrent liabilities 2,247 ,909$ 1 ,7 40,096$ 1 ,517 ,57 9$ Noncurrent liabilities 1 ,47 8,338 1,516,357 1 ,7 26,513
Total liabilities 3,7 26,247$ 3,256,453$ 3,244,092$
Net positionRestricted
Nonexpendable 100,685,7 22$ 91,380,216$ 84,538,057$ Expendable 66,504,910 48,033,87 2 56,920,823
Unrestricted 233,197 99,569 98,340
Total net position 167 ,423,829$ 139,513,657$ 141 ,557 ,220$
June 30
Assets Total current assets increased by $405,000 during the fiscal year ended June 30, 2017, and increased $3.4 million during the year ended June 30, 2016. The increase in current assets during year 2017 was primarily due to an increase of cash and cash equivalents offset by a decrease in pledges receivable. The increase in current assets during year 2016 was primarily due to an increase of cash and cash equivalents and pledges receivable.
Total noncurrent assets increased by $28.0 million during the fiscal year ended June 30, 2017, and decreased by $5.5 million during fiscal year June 30, 2016. The increase in noncurrent assets during year 2017 was primarily attributable to positive investment returns. The decrease in noncurrent assets during year 2016 was primarily attributable to negative investment returns, a decrease in investments held in charitable remainder trusts, a decrease in the fair value of real estate held in and for endowment funds, offset by an increase in pledges receivable.

UC Riverside Foundation Management's Discussion and Analysis (Unaudited) June 30, 2017 and 2016
5
Liabilities Current liabilities represent accrued Foundation administrative expenses, reimbursements due to the University of California, Riverside (“UC Riverside” or “UCR”) from the Foundation for expenses, and liabilities to life beneficiaries on trusts in the coming year. The noncurrent liabilities are liabilities to life beneficiaries on trusts beyond one year.
Current liabilities increased by $508,000 and noncurrent liabilities decreased by $38,000 in fiscal year 2017, due to an increase in accrued expenses offset by a decrease in liabilities to life beneficiaries at fiscal year ended June 30, 2017.
Current liabilities increased by $223,000 and noncurrent liabilities decreased by $210,000 in fiscal year 2016, due to an increase in accrued expenses offset by a decrease in liabilities to life beneficiaries at fiscal year ended June 30, 2016.
Restricted Net Position Net position of the Foundation includes funds that have donor restrictions on their use. Funds may be expendable for a specific purpose or they may be nonexpendable.
The following table summarizes, which funds are restricted, the type of restriction, and the amount:
Summary of Restricted Net Position
2017 2016 2015
NonexpendableEndowments 98,220,481$ 89,040,988$ 82,059,7 64$ Annuities and life income funds 2,465,241 2,339,228 2,47 8,293
Total nonexpendable 100,685,7 22$ 91 ,380,216$ 84,538,057$
ExpendableEndowment income and appreciation 48,949,67 9$ 31 ,859,109$ 41 ,7 18,499$ Annuities and life income funds 129,968 119,603 125,07 4Funds functioning as endowments 10,47 2,598 8,901,204 9,488,157Gifts 6,952,665 7 ,153,956 5,589,093
Total expendable 66,504,910$ 48,033,87 2$ 56,920,823$
June 30

UC Riverside Foundation Management's Discussion and Analysis (Unaudited) June 30, 2017 and 2016
6
Net position increased by $27.9 million in fiscal year 2017 and net position decreased by $2.0 million in fiscal year 2016, as reflected below:
Condensed Schedule of Revenue, Expenses, and Changes in Net Position
2017 2016 2015
Operating revenue 6,139,831$ 5,57 5,7 20$ 2,682,532$ Operating expenses 12,067 ,167 9,235,159 10,850,932
Operating loss (5,927 ,336) (3,659,439) (8,168,400)
Nonoperating income (losses) 24,856,7 39 (7 ,047 ,511) 650,066Contributions to permanent endowments 8,980,7 69 8,663,387 3,584,27 6
Change in net position 27 ,910,17 2 (2,043,563) (3,934,058)
Net positionBeginning of year 139,513,657 141,557 ,220 145,491,27 8
End of year 167 ,423,829$ 139,513,657$ 141,557 ,220$
June 30
Revenue and Expense Revenue from contributions increased $545,000 from fiscal year 2016 to 2017. This increase was mainly due an increase in outright cash contributions and gifts of marketable securities. Contributions to endowments increased this year compared to fiscal year 2016 by $317,000. This was primarily due an increase in gifts of marketable securities offset by a decrease in outright cash contributions.
Operating expense consists primarily of grants made to UC Riverside of expendable contributions and accumulated endowed payout for the many purposes intended by the donors. The timing of grants to the campus lags the timing of the incoming contribution revenue and endowed payout. In addition, endowed payout is not recognized as operating revenue, but operating expense upon the transfer of payout to the campus. Due to these factors, and similar to fiscal years 2016 and 2015, in fiscal year 2017 grants made to the campus exceeded recognized contribution revenue, resulting in an operating loss.
Nonoperating income increased by $31.9 million in comparison with the prior year substantially due to the change in investment performance. The Foundation had net investment income of $2.3 million and net appreciation in the fair value of investments of $22.6 million for the year ended June 30, 2017.
Revenue from contributions increased $2.9 million from fiscal year 2015 to 2016. The increase was mainly due to an increase in pledge and outright contributions. Contributions to endowments increased in 2016 compared to fiscal year 2015 by $5.1 million. This was primarily due to the receipt of several generous outright contributions in 2016 totaling $6.0 million.
Nonoperating income decreased in fiscal year 2016 by $7.7 million in comparison with fiscal year 2015 substantially due to change in investment performance and a decrease in investment income. The Foundation had net investment income of $3.0 million and net depreciation in the fair value of investments and real estate of approximately $10.1 million for the year ended June 30, 2016.

UC Riverside Foundation Management's Discussion and Analysis (Unaudited) June 30, 2017 and 2016
7
Factors Impacting Future Periods Factors that can significantly impact future periods include the state of the overall economy and the financial markets. Both factors impact charitable giving and the value of investments. The Board of Trustees of the Foundation monitors the status of the economy, its impact on overall giving, pledges receivable, and the investment pools.
Given the significant declines in support from the state of California over the last decade to the University of California, private support is an increasingly important resource to the University of California, Riverside. The Foundation anticipates a higher rate of use of Foundation held funds in the future, in the form of grants to the campus, as a result of decreased resources provided by the state.
Management is not aware of any factors within management’s control that would have a significant impact on future periods.

UC Riverside Foundation Statements of Net Position June 30, 2017 and 2016
The accompanying notes are an integral part of these financial statements.
8
2017 2016
AssetsCurrent assets
Cash and cash equiv alents 10,218,352$ 9,07 8,17 9$ Pledges receiv able, net 7 57 ,580 1,492,983
Total current assets 10,97 5,932 10,57 1,162
Noncurrent assetsLong-term inv estments 151,161,581 123,854,802Investments held in charitable remainder unitrusts and annuity trusts 4,497 ,557 4,399,7 98Pledges receiv able, net of current portion 1,365,006 7 94,348Real estate held in endowment funds 3,150,000 3,150,000
Total noncurrent assets 160,17 4,144 132,198,948
Total assets 17 1 ,150,07 6$ 142,7 7 0,110$
LiabilitiesCurrent liabilities
Accounts pay able and accrued expenses 1 ,823,899$ 1 ,315,485$ Liabilities to life beneficiaries 424,010 424,611
Total current liabilities 2,247 ,909 1,7 40,096
Noncurrent liabilitiesLiabilities to life beneficiaries, net of current portion 1,47 8,338 1,516,357
Total liabilities 3,7 26,247$ 3,256,453$
Net PositionRestricted
NonexpendableEndowments 98,220,481$ 89,040,988$ Annuity and life income funds 2,465,241 2,339,228
ExpendableEndowment income and appreciation 48,949,67 9 31,859,109Annuity and life income funds 129,968 119,603Funds functioning as endowments for specific departments 10,47 2,598 8,901,204Gifts 6,952,665 7 ,153,956
Unrestricted 233,197 99,569
Total net position 167 ,423,829$ 139,513,657$
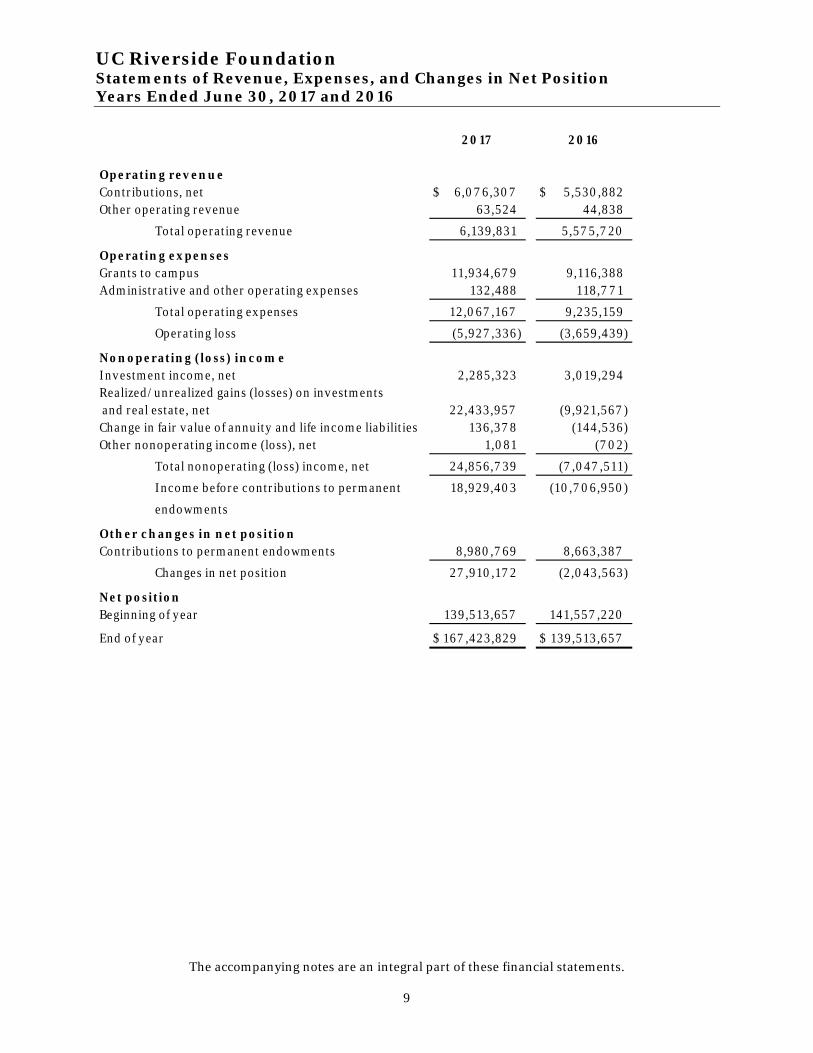
UC Riverside Foundation Statements of Revenue, Expenses, and Changes in Net Position Years Ended June 30, 2017 and 2016
The accompanying notes are an integral part of these financial statements.
9
2017 2016
Operating rev enueContributions, net 6,07 6,307$ 5,530,882$ Other operating revenue 63,524 44,838
Total operating revenue 6,139,831 5,57 5,7 20
Operating expensesGrants to campus 11,934,67 9 9,116,388Administrative and other operating expenses 132,488 118,7 7 1
Total operating expenses 12,067 ,167 9,235,159
Operating loss (5,927 ,336) (3,659,439)
Nonoperating (loss) incom eInvestment income, net 2,285,323 3,019,294Realized/unrealized gains (losses) on investments and real estate, net 22,433,957 (9,921 ,567 )Change in fair value of annuity and life income liabilities 136,37 8 (144,536)Other nonoperating income (loss), net 1 ,081 (7 02)
Total nonoperating (loss) income, net 24,856,7 39 (7 ,047 ,511)
Income before contributions to permanent 18,929,403 (10,7 06,950)
endowments
Other changes in net positionContributions to permanent endowments 8,980,7 69 8,663,387
Changes in net position 27 ,910,17 2 (2,043,563)
Net positionBeginning of y ear 139,513,657 141,557 ,220
End of y ear 167 ,423,829$ 139,513,657$

UC Riverside Foundation Statements of Cash Flows Years Ended June 30, 2017 and 2016
The accompanying notes are an integral part of these financial statements.
10
2017 2016
Cash flows from operating activitiesReceipts from contributions 6,104,441$ 4,029,469$ Pay ments to campus (11 ,429,185) (8,7 53,866)Pay ments to beneficiaries (424,310) (449,985)Pay ments for administrative or operating expenses (131,496) (206,091)Other receipts 166,080 161,7 08
Net cash used in operating activ ities (5,7 14,47 0) (5,218,7 65)
Cash flows from noncapital financing activityContributions to permanent endowments 8,205,7 26 8,496,7 50
Cash flows from inv esting activitiesProceeds from sales and maturities of investments 39,880,025 124,045,825Purchases of inv estments (43,467 ,510) (128,159,424)Investment income, net of investment expense 2,236,402 3,162,839
Net cash (used in) provided by inv esting activ ities (1 ,351,083) (950,7 60)
Net change in cash and cash equiv alents 1 ,140,17 3 2,327 ,225
Cash and cash equivalentsBeginning of year 9,07 8,17 9 6,7 50,954
End of y ear 10,218,352$ 9,07 8,17 9$
Reconciliation of operating loss incom e to net cashused in operating activ itiesOperating loss (5,927 ,336)$ (3,659,439)$ Adjustments to reconcile operating loss to net cash used in operating activ ities
Noncash gifts (41,598) (13,330)Changes in operating assets and liabilities
Pledges receiv able, net 63,87 6 (1 ,500,168)Other assets (1 ,927 ) 14,035Accounts payable 508,413 27 3,265Liabilities to life beneficiaries (315,898) (333,128)
Net cash used in operating activ ities (5,7 14,47 0)$ (5,218,7 65)$
Supplem ental noncash activ ities inform ationContributions of marketable securities – operating 41,598$ 13,330$ Contributions of marketable securities – endowment 7 7 5,042 166,637

UC Riverside Foundation Notes to Financial Statements June 30, 2017 and 2016
11
1. Organization
The UC Riverside Foundation (the “Foundation”), is governed by an independent Board of Trustees, the membership of which includes the Chancellor of the University of California, Riverside (“UCR”). It is considered a governmental not-for-profit organization, subject to financial reporting under standards promulgated by the Governmental Accounting Standards Board (“GASB”). It was formed in December 1974 for the purpose of supporting education, research and public functions, and programs of the Riverside campus of the University of California (the “University”). Upon dissolution, liquidation, or winding up of the Foundation, the assets remaining after all debts have been satisfied, shall be distributed, transferred, conveyed, delivered, and paid over to the Regents of the University of California (“The Regents”) for the benefit of UCR as provided in the Foundation’s Articles of Incorporation, provided The Regents have maintained tax-exempt status under the Internal Revenue Code and relevant California laws.
Oversight by the University of California The Foundation is subject to the policies and procedures of The Regents. All contributions to the Foundation ultimately benefit UCR. The Regents established the Policy and Administrative Guidelines for Campus Foundations, which requires that the Foundation transfer contributed expendable funds and endowment payout to UCR for ultimate expenditure in compliance with donor restrictions on gifts. Contributions that are made directly to The Regents for the benefit of UCR are not recorded by the Foundation and are not reflected in the accompanying financial statements; they are reflected in the financial statements of the University.
2. Summary of Significant Accounting Policies
Basis of Accounting The financial statements for the Foundation have been prepared using the economic resources measurement focus and the accrual basis of accounting in accordance with U.S. generally accepted accounting principles. The Foundation follows accounting principles issued by GASB.
Use of Estimates The preparation of the financial statements in conformity with US generally accepted accounting principles requires management to make certain estimates and assumptions that affect the reported amounts of assets and liabilities and the reported amounts of revenue and expenses during the reporting period. Actual results could differ from those estimates.
Upcoming Accounting Pronouncements In March 2016, the GASB issued Statement No. 81, Irrevocable Split-Interest Agreements, effective for the Foundation’s fiscal year beginning July 1, 2017. This statement addresses when irrevocable split-interest agreements constitute an asset for accounting and financial reporting purposes when the resources are administered by a third party. The Statement also provides expanded guidance for circumstances in which the government holds the assets. The Foundation is evaluating the effect that Statement No. 81 will have on its financial statements.
Classification of Current and Noncurrent Assets and Liabilities The Foundation considers assets to be current that can reasonably be expected, as part of its normal business operations, to be converted to cash and be available for liquidation of current liabilities within 12 months of the statements of net position date. Liabilities that reasonably can be expected, as part of normal Foundation business operations, to be liquidated within 12 months of the statements of net position date are considered to be current. All other assets and liabilities are considered to be noncurrent.

UC Riverside Foundation Notes to Financial Statements June 30, 2017 and 2016
12
A summary of the significant accounting policies applied in the preparation of the accompanying basic financial statements is presented below:
Cash Equivalents The Foundation considers all highly liquid investments with original maturities of three months or less to be cash equivalents. Included in the Foundation’s cash equivalents are amounts in the UC Regents Short Term Investment Pool (STIP).
Contributions and Pledges Pledges receivable are written unconditional promises to make future gifts. The Foundation recognizes a receivable and contribution revenue at the time the pledge is made by the donor if the pledge is verifiable, measurable, probable of collection, and meets all applicable eligibility requirements. These eligibility requirements require 1) the Foundation to be stated as the recipient of the pledge; 2) the pledge is considered available for use and can be sold, disbursed, consumed, or invested for a term or in perpetuity; 3) any contingencies on the pledge are met; and 4) if a reimbursement of expenses, allowable costs have been incurred.
Pledge payments scheduled for collection within the next fiscal year are recorded as current assets. Pledge payments scheduled to be collected beyond one year are discounted to recognize the present value of the expected future cash flows. In subsequent years, this discount is accreted and recorded as additional contribution revenue in accordance with donor-imposed restrictions, if any. In addition, an allowance for uncollectible pledges is recorded based on management’s assessment of the collectability of outstanding pledges.
Conditional pledges, which depend on the occurrence of uncertain or specified future events, such as matching gifts from other donors, are recognized when the condition is met.
Pledges for endowments are not recorded as revenue or a pledge receivable at the time the pledge is made, as the funds are not available to be invested in perpetuity as specified by the donor. Revenue is recognized on payments on endowed pledges when the cash is received and is recorded in contributions to permanent endowments.
Noncash contributions are recorded at the appraised value of the asset at the date of donation. Fair value is determined based on appraisals or other third-party sources. Gifts of securities are recorded based on fair value at the date of donation.
Investments Investments are measured and recorded at fair value. Securities are generally valued at the last sale price on the last business day of the fiscal year, as quoted on a recognized exchange or utilizing an industry standard pricing service, when available. In the case of commingled funds, the fair value is determined based on the number of units held in the fund multiplied by the price per unit share as quoted.
Investments also include interests in hedge funds and private equity investments for which fair value is based on Net Asset Value (“NAV”). The net asset value (NAV) is reported by the external investment managers, including general partners, in accordance with their policies as described in their respective financial statements and offering memoranda. The most recent NAV is adjusted for capital calls, distributions and significant known valuation changes, if any, of its related portfolio through June 30, 2017 and 2016, respectively, which is considered a practical expedient to fair value.
UC Riverside Foundation Notes to Financial Statements June 30, 2017 and 2016
13
These investments are not readily marketable, and the estimated fair value is subject to uncertainty and, therefore, may differ from the fair value that would be used had a ready market for such investments existed.
The Foundation exercises due diligence in assessing the external managers’ use of and adherence to fair value principles.
Investment transactions are recorded on the date the securities are purchased or sold (trade date). Realized gains or losses are recorded as the difference between the proceeds from the sale and the cost of the investment sold. Dividend and interest income is accrued as earned.
Investments Held in Charitable Remainder Unitrusts and Annuity Trusts The Foundation has been designated as the trustee for several unitrusts (the Trusts). The trust agreements require that the trustee make annual payments to the beneficiaries. Upon the death of the beneficiaries or termination of the Trusts, as defined, the remaining assets of the Trusts will become non-operating revenue to the Foundation, as stipulated in the trust agreements.
The liability for the estimated future payments to the donor or other beneficiaries changes as benefit payments are made to the donors and beneficiaries each year and as life expectancies change. Any fluctuations in the fair value of the related trust assets and any income earned on the trust assets affect this liability. These assets are administered by and invested with a third party trust administrator.
The Foundation has been named the irrevocable beneficiary for several charitable remainder trusts for which the Foundation is not the trustee. Such trusts have not met the timing requirement for revenue recognition (available to be invested) and thus will not be reported by the Foundation until cash or assets are received. Upon maturity of each trust, the remainder of the trust corpus will be transferred to the Foundation and will be reported by the Foundation as contribution revenue.
Real Estate From time to time, the Foundation receives assets other than cash from its donors. It is the Foundation’s policy to sell these assets to support campus programs or, in the case of endowment funds, to invest the proceeds from the sales in accordance with the Foundation’s investment policy. It is the Foundation’s intention to liquidate these assets as soon as is practicable. As of June 30, 2017 and 2016, the Foundation held real estate previously contributed as part of an endowment fund. This asset is reported at fair value and changes in its fair value are recorded in the statements of revenue, expenses, and changes in net position based on current appraised values.
Net Position The Foundation’s net position is classified as follows:
Restricted – Nonexpendable Assets, which are subject to externally imposed conditions, requiring the Foundation to retain them in perpetuity. Net position in this category consists of endowments held by the Foundation and funds held in annuity and life income funds that will become endowments upon termination of the trusts.
Restricted – Expendable Assets, which are subject to externally imposed conditions that can be fulfilled by the actions of the Foundation or by the passage of time. Funds functioning as endowments are contributions designated by the donor for various campus departments, which have been accumulated by those

UC Riverside Foundation Notes to Financial Statements June 30, 2017 and 2016
14
departments as quasi-endowments. Income and appreciation earned on funds functioning as endowment are expendable by the designated department. Endowment income and appreciation represents the expendable earnings on endowments. Annuity and life income funds are restricted until trusts are terminated and trust assets become available for use.
Unrestricted All other categories of net position are those that are not subject to donor-imposed restrictions. In addition, management of the Foundation may designate unrestricted net position for use.
Classification of Revenue and Expenses Operating revenue and expenses are distinguished from nonoperating items and generally result from providing services in connection with ongoing operations and stewarding of current funds. The principal operating revenue is derived from contributions and other fund-raising activities. Operating expenses consist primarily of grants to the campus and administrative expenses.
Nonoperating revenue and expenses consist of investment income, investment management services fees, realized gains (losses) on investments, change in unrealized appreciation (depreciation) in the fair value of investments, and the change in the value of annuity and life income liabilities.
Contributions for permanent endowment purposes are classified as other changes in net position.
Spending Policy of Endowments The Foundation follows the Uniform Prudent Management of Institutional Funds Act (UPMIFA) adopted by the state of California in January 2009. UPMIFA does not set specific expenditure limits; instead, a standard of prudence is prescribed, whereas a charity can spend the amount the charity deems prudent after considering the donor’s intent that the endowment continue permanently, the purpose of the fund, and relevant economic factors. The Foundation’s Board of Trustees approved a 4.0% spending rate of the endowment fund’s average unit market value for fiscal year 2017. For fiscal year 2017, the average unit market value is calculated using the closing unit market value on the last day of each of the 84 contiguous months, the last of which ended on May 31 of such fiscal year. This policy is consistent with the Endowment Investment and Spending Policy and Guidelines adopted by the Board of Trustees. Earnings in excess of the payout rate are retained in the endowments as restricted expendable.
Income Taxes The Foundation is an organization exempt from taxation under Section 501(c) (3) of the Internal Revenue Code and Section 23701d of the California Revenue and Taxation Code and is generally not subject to federal or state income taxes. However, the Foundation is subject to income taxes on any net income that is derived from a trade or business, regularly carried on, and not in furtherance of the purpose for which it is granted exemption. No income tax provision has been recorded as the net income, if any, from any unrelated trade or business, in the opinion of management, is not material to the basic financial statements taken as a whole.
Liabilities to Life Beneficiaries The Foundation uses the actuarial method of recording split interest agreements. Under this method, when a gift is received, the present value of the expected payments to beneficiaries is recorded as a liability, based on the 2012 Individual Annuity Reserving Mortality Table (IAR 2012), and the remainder is recorded as a contribution in the appropriate net position category. The investment account is credited with investment activity and is charged with payments to beneficiaries. Annually adjustments are made between the liability account and the net position

UC Riverside Foundation Notes to Financial Statements June 30, 2017 and 2016
15
account for changes in value of split interest agreements caused primarily by changes in life expectancies.
The present value of liabilities to life beneficiaries is calculated using discount rates based upon the U.S. government securities, treasury constant maturities, and nominal rate tables. The discount rates ranged from 2.73% to 8.23%.
Reclassifications Certain reclassifications have been made to the 2016 financial information to conform to the 2017 financial statement presentation.
3. Cash and Cash Equivalents
Cash and cash equivalents consist of the following:
2017 2016
Demand deposits 813,934$ 41 ,696$ Money market 1 ,7 20,484 1,7 11 ,106UC Regents Short Term Investment Pool (STIP) 7 ,683,934 7 ,325,37 7
10,218,352$ 9,07 8,17 9$
The Foundation maintains centralized management for substantially all of its cash. Cash in demand deposit accounts is minimized by sweeping available cash balances into the STIP on an as-needed basis. STIP is a money market portfolio, which serves as the Foundation’s core cash vehicle for expendable funds. The Foundation does not have any exposure to foreign currency risk in demand deposit accounts.
Cash and cash equivalents as reported on the statements of financial position comprise demand deposits maintained at the Foundation’s bank as well as amounts deposited in money market accounts and the STIP. The bank balance of demand deposits at financial institutions was $813,934 and $41,696 at June 30, 2017 and 2016, respectively. Demand deposits held at financial institutions were insured by the Federal Depository Insurance Corporation (FDIC) up to $250,000 per account at June 30, 2017. Money market accounts and funds held in STIP totaling $9,404,418 and $9,036,483 at June 30, 2017 and 2016, respectively, were not insured by either the FDIC or Securities Investor Protection Corporation and were uncollateralized.
4. Investments and Investments in Trust
At June 30, 2017 and 2016, the composition of investments and investments held in charitable remainder trusts is summarized as follows:

UC Riverside Foundation Notes to Financial Statements June 30, 2017 and 2016
16
2017 2016
Equity securities - U.S. 38,580,207$ 35,887 ,986$ Other 57 ,7 65 19,332Commingled funds
Absolute return and hedge funds 14,548,294Private equity 2,243,631 157 ,17 1Balanced funds - 2,112,127U.S. equity funds 22,512,050 20,362,004Non-U.S. equity funds 61,059,301 56,539,380U.S. bond funds 16,653,592 13,091,104Money market 4,298$ 85,496
Total investments and investments held in trusts 155,659,138$ 128,254,600$
The Foundation holds equity, fixed income, and alternative investments. The largest portion of these investments relates to the Foundation’s endowment. The investments are managed by the Finance and Investment Committee with Board approval. The Foundation uses several University of California charitable asset management (CAM) commingled funds (UC pooled funds), offered to the campus foundations by the Office of the Chief Investment Officer of the Regents (OCIO), for its charitable remainder unitrust investments. Investment Performance The components of realized/unrealized gains and losses on investments and real estate are as follows:
2017 2016
Unrealized gains (losses) on investments 19,447 ,353$ (10,017 ,623)$ Unrealized (loss) gains on real estate - (195,000)Realized gains on investments, net 2,986,604 291,056
Net realized/unrealized gains (losses) on investments and real estate 22,433,957$ (9,921,567 )$
Investment Risk Factors There are many factors that can affect the value of investments. Some, such as custodial credit risk, concentration of credit risk, and foreign currency risk may affect both equity and fixed-income securities. Equity securities respond to such factors as economic conditions, individual company earnings performance, and market liquidity, while fixed-income securities are particularly sensitive to credit risks and changes in interest rates.
Credit Risk Fixed-income securities are subject to credit risk, which is the chance that a bond issuer will fail to pay interest or principal in a timely manner or that negative perceptions of the issuer’s ability to make these payments will cause security prices to decline. The circumstances may arise due to a variety of factors such as financial weakness, bankruptcy, litigation, and/or adverse political developments. Certain fixed-income securities, including obligations of the U.S. government or those explicitly guaranteed by the U.S. government, are not considered to have credit risk.

UC Riverside Foundation Notes to Financial Statements June 30, 2017 and 2016
17
A bond’s credit quality is an assessment of the issuer’s ability to pay interest on the bond, and ultimately, to pay the principal. Credit quality is evaluated by one of the independent bond-rating agencies, for example, Moody’s Investors Service (Moody’s) or Standard and Poor’s (S&P). The lower the rating, the greater the chance in the rating agency’s opinion that the bond issuer will default or fail to meet its payment obligations. Generally, the lower a bond’s credit rating, the higher its yield should be to compensate for the additional risk. The Foundation’s policy is to invest in individual fixed-income securities, comingled fixed-income mutual funds, exchange traded funds and University of California CAM commingled fixed-income funds (UC pooled funds).
The credit risk profile for the Foundation’s fixed-income securities at June 30, 2017 and 2016 is as follows:
2017 2016
Com m ingled fundsU.S. bond funds – not rated 16,653,592$ 13,091,104$ Money market– not rated 4,298 85,496
16,657 ,890$ 13,17 6,600$
Custodial Credit Risk Custodial credit risk is the risk that in the event of the failure of the custodian, the Foundation’s investments may not be returned. Substantially all of the Foundation’s investments are issued, registered or held in the name of the Foundation by its master custodian, as agent for the Foundation. Other types of investments represent ownership interests that do not exist in physical or book-entry form. As a result, custodial risk is considered to be remote.
Concentration of Credit Risk Concentration of credit risk is the risk associated with a lack of diversification, such as having substantial investments in a few individual issuers, thereby exposing the organization to greater risks resulting from adverse economic, political, regulatory, geographic, or credit developments. Concentration of credit risk associated with the Foundation’s investments must be disclosed if investments in any one issuer represent 5% or more of total investments. Investments issued or explicitly guaranteed by the U.S. government and investments in mutual funds, external investment pools, and other pooled investments are excluded from this requirement.
At June 30, 2017 and 2016, the Foundation did not hold qualifying investments that were greater than 5% of the investment portfolio.
Interest Rate Risk Interest rate risk is the risk that the value of fixed-income securities will decline because of changing interest rates. The prices of fixed-income securities with a longer time to maturity, measured by effective duration, tend to be more sensitive to changes in interest rates and, therefore, more volatile than those with shorter durations. Effective duration is the approximate change in price of a security resulting from a 100 basis point (1% point) change in the level of interest rates. It is not a measure of time.
The effective duration for the Foundation’s fixed-income securities at June 30, 2017 and 2016 is as follows:

UC Riverside Foundation Notes to Financial Statements June 30, 2017 and 2016
18
2017 2016
Com m ingled fundsU.S. bond funds 2.4 y ears 2.6 y ears
The Foundation considers the effective duration to be zero for money market accounts because they are designed to have a constant $1 share value due to the short term, liquid nature of the underlying securities.
Foreign Currency Risk Foreign currency risk is the possibility that changes in exchange rates between the U.S. dollar and foreign currencies could adversely affect a deposit or investment’s fair value. The Foundation’s endowment and charitable remainder trust asset allocation policies include allocations to non-U.S. securities. This exposure is obtained through investment in non-U.S. equity mutual and ETF funds, and a University of California CAM commingled non-U.S. equity fund. These funds may hold foreign currency denominated investments. The Foundation’s investment policy with respect to foreign currency risk restricts investments to U.S. dollar-denominated securities.
At June 30, 2017 and 2016, the U.S. dollar balances of investments that carry foreign currency risk type are as follows:
2017 2016
Commingled fundsNon-U.S. equity funds 61,059,301$ 56,539,380$
61 ,059,301$ 56,539,380$
Alternative Investment Risks Alternative investments include ownership interests in a wide variety of partnership and fund structures that may be domestic, off-shore or foreign. Generally there is little or no regulation of these investments by the Securities and Exchange Commission or U.S. state attorneys general. These investments employ a wide variety of strategies including absolute return, hedge, venture capital, private equity and other strategies. Investments in this category may employ leverage to enhance the investment return. Underlying investments can include financial assets such as marketable securities, non-marketable securities, derivatives, and synthetic and structured instruments; real assets; tangible and intangible assets; and other funds and partnerships. Generally, these investments do not have a ready market or may not be traded without approval of the general partner or fund management.

UC Riverside Foundation Notes to Financial Statements June 30, 2017 and 2016
19
5. Fair Value
Fair value is defined in the accounting standards as the price that would be received to sell an asset or paid to transfer a liability in an orderly transaction between market participants at the measurement date. Assets and liabilities reported at fair value are organized into a hierarchy based on the levels of inputs observable in the marketplace that are used to measure fair value. Inputs are used in applying the various valuation techniques and take into account the assumptions that market participants use to make valuation decisions. Inputs may include price information, credit data, liquidity statistics, and other factors specific to the financial instrument. Observable inputs reflect market data obtained from independent sources. In contrast, unobservable inputs reflect the entity’s assumptions about how market participants would value the financial instrument.
A financial instrument’s level within the fair value hierarchy is based on the lowest level of any input that is significant to the fair value measurement. The following describes the hierarchy of inputs used to measure fair value and the primary valuation methodologies used for financial instruments measured at fair value on a recurring basis:
Level 1 Prices based on unadjusted quoted prices in active markets that are accessible for identical assets or liabilities are classified as Level 1. Level 1 investments include equity securities and other publicly traded securities.
Level 2 Quoted prices in the markets that are not considered to be active, dealer quotations, or alternative pricing sources for similar assets or liabilities for which all significant inputs are observable, either directly or indirectly are classified as Level 2. Level 2 investments include fixed- or variable-income securities, commingled funds, certain derivatives and other assets that are valued using market information.
Level 3 Investments classified as Level 3 have significant unobservable inputs, as they trade infrequently or not at all. The inputs into the determination of fair value of these investments are based upon the best information in the circumstance and may require significant management judgment. Level 3 investments may include private equity investments.
Net Asset Value (NAV) – Investments whose fair value is measured at NAV, which is considered a practical expedient to fair value, are excluded from the fair value hierarchy. Investments in non-governmental entities that do not have a readily determinable fair value may be valued at NAV. Investments measured at NAV include hedge funds, private equity investments, and commingled funds.
Not Leveled – Cash and cash equivalents are not measured at fair value and, thus, are not subject to the fair value disclosure requirements.
The following table summarizes the investments and other assets reported at fair value within the fair value hierarchy as of June 30, 2017:

UC Riverside Foundation Notes to Financial Statements June 30, 2017 and 2016
20
QuotedPrices in Other
Active Observable Unobservable Net Asset NotMarkets Inputs Inputs Value Leveled Total(Level 1) (Level 2) (Level 3) (NAV)
Equity securities 38,580,207$ -$ -$ -$ -$ 38,580,207$ Commingled funds 95,7 40,528 21 ,27 6,339 1 1 7 ,01 6,867Money market funds - - - - 4,299 4,299Other 57 ,7 65 57 ,7 65
1 34,320,7 35$ -$ -$ 21 ,27 6,339$ 62,064$ 1 55,659,1 38$
Total investments and investments held in trusts
The following table summarizes the investments and other assets reported at fair value within the fair value hierarchy as of June 30, 2016:
Quoted
Prices in Other
Active Observable Unobservable Net Asset Not
Markets Inputs Inputs Value Leveled Total(Level 1) (Level 2) (Level 3) (NAV)
Equity securities 35,887 ,986$ -$ -$ -$ -$ 35,887 ,986$ Commingled funds 92,1 04,61 5 - - 1 57 ,1 7 1 - 92,261 ,7 86Money market funds - - - - 85,496 85,496Other 1 9,332 1 9,332
1 27 ,992,601$ -$ -$ 1 57 ,1 7 1$ 1 04,828$ 1 28,254,600$
Total investments and investments held in trusts
The Foundation addresses the nature and risks of the investments and whether the investments are probable of being sold at amounts different from the NAV per share (or its equivalent).
Investment Related Commitments The Foundation has contractual commitments to make additional investments in private equity and other privately structured investment vehicles reported at NAV. The following table presents significant terms of such agreements, including unfunded commitments, redemption frequency and redemption notice period, for the Foundation’s alternative investments measured at NAV as of June 30, 2017.

UC Riverside Foundation Notes to Financial Statements June 30, 2017 and 2016
21
RedemptionUnfunded Redemption Notice
Net Asset Value Commitments Frequency Period
Investment Type
Commingled funds
Absolute return and hedge funds 1 4,548,294$ -$ Quarterly 30 - 65 day s
U.S. equity 2,261 ,660 - Monthlybefore end of month
Non-U.S. equity 688,07 1 - Monthlybefore end of month
U.S. bond funds 1 ,534,683 - Monthlybefore end of month
Priv ate equity 2,243,631 1 2,864,500Not eligible for redemption n/a
Total investments measured at NAV 21,276,339$ 12,864,500$
6. Pledges Receivable
Pledges receivable represent unconditional promises of contributions to be collected in future periods. Included in pledges receivable at June 30, 2017 and 2016, are pledges made by trustees of the Foundation, with the net amount of such receivables totaling $729,719 and $78,896, respectively.
Management evaluates the collectability of its receivables and records an allowance for estimated uncollectible amounts. Pledges due beyond one year are discounted using rates ranging from 2.4% to 1.2% as of June 30, 2017 and 2016. The discount rates will be established upon receipt of the pledge and applied for the life of the respective pledges. Pledges recorded during fiscal years 2017 and 2016 were discounted at 1.2% and 1.2%, respectively. This discount rate is the average rate of the STIP for these respective years. In subsequent years, this discount is accreted and recorded as additional contribution revenue in accordance with donor-imposed restrictions, if any.

UC Riverside Foundation Notes to Financial Statements June 30, 2017 and 2016
22
Pledges receivable consist of the following at June 30:
2017 2016
Pledges receivable due in one y ear or less 7 57 ,580$ 1 ,492,983$ Pledges receivable due between one and five y ears 1 ,406,921 820,932Less: Discount for future pay ments (41 ,915) (26,584)
Net pledges receivable 2,122,586$ 2,287 ,331$
Current pledges receivable, net 7 57 ,580$ 1 ,492,983$ Noncurrent pledges receivable, net 1 ,365,006 7 94,348
2,122,586$ 2,287 ,331$
7. Liabilities to Life Beneficiaries
At June 30, 2017 and 2016, the Foundation was the remainderman and trustee of $4,497,557 and $4,399,798, respectively, of trust assets from charitable remainder trusts. The trust assets were recorded at fair value as of the date at which the Foundation became the trustee of the trust. The trusts make periodic annuity or income payments to designated individuals or beneficiaries over their lifetimes. The difference between the liability to the life beneficiaries and the fair value of the trust assets at the time of donation is recorded as contribution revenue. Liabilities to life beneficiaries of $1,902,348 and $1,940,968 at June 30, 2017 and 2016, respectively, represent the actuarially determined present value of payments over the expected lives of the beneficiaries discounted to their expected present value using rates ranging from 2.73% to 8.23%.
Changes in liabilities to life beneficiaries during the current fiscal year are summarized as follows:
Ba la n ce a t Ba la n ce a tJu n e 30 , 20 16 A ddit ion s Decrea ses Ju n e 30 , 20 17
Lia bilit ies to life ben eficia r ies 1 ,9 4 0,9 6 8$ -$ (3 8 ,6 2 0)$ 1 ,9 0 2 ,3 4 8$
Changes in liabilities to life beneficiaries during the previous fiscal year are summarized as follows:
Balance at Balance atJune 30, 2015 Additions Decreases June 30, 2016
Liabilities to life beneficiaries 2,201 ,87 2$ -$ (260,904)$ 1 ,940,968$
8. Transactions With UC Riverside
UC Riverside provides the facilities, personnel, and operating budget for the Foundation. All pension and postretirement benefit expenses and liabilities related to these personnel provided, are recorded on the financial statements of UC Riverside.

UC Riverside Foundation Notes to Financial Statements June 30, 2017 and 2016
23
Per UC Riverside campus policies, the Foundation remits a gift fee of 5% on each gift, as well as the short-term interest and dividend earnings on its expendable gift and accumulated endowment payout balances to the campus. These fees become a resource of the Chancellor to help support costs of the campus and in particular those related to Advancement. In addition, per campus policy and as permitted by law, an endowment cost recovery fee is assessed annually on the endowment and endowment-related funds to offset the campus costs of administering and carrying out the terms of the endowment and endowment-related funds. For the years ended June 30, 2017 and 2016, the gift fee, interest and dividend earnings, and the cost recovery fees amounted to $1,280,136 and $1,124,114, respectively, and are reflected within grants to campus on the statements of revenue, expenses, and changes in net position.
9. Related-Party Transactions
During the years ended June 30, 2017 and 2016, $281,389 and $435,205, respectively, were received in contributions from trustees of the Board.
10. Subsequent Events
The Foundation has evaluated subsequent events from the net position date through October 11, 2017 the date which the financial statements were available to be issued, and determined there are no items to disclose.