u. s. department of the interior - usbr.gov · pdf fileu. s. department of the interior - ......
TRANSCRIPT

October 1981
Engineering and Research Center
U. S. Department of the Interior -
Bureau of Reclamation

73090 (4-81) Bureau of Reclamation TECHNICAL REPORT STANDARD T I T L E PAGE
- 1
I
1
I - 1
-
Analog Model and Evaluation of the Fountain Valley Rate-of-Flow Control Station
7. AUTHORIS) 8. P E R F O R M I N G O R G A N I Z A T I O N R E P O R T NO.
D. A. Skiles W. B. Gish REC-ERC-82-10
I
9. P E R F O R M I N G O R G A N I Z A T I O N N A M E A N D ADDRESS 10. WORK U N I T NO.
Bureau of Reclamation 11. C O N T R A C T OR G R A N T NO. Engineering and Research Center Denver, Colorado 80225
13. T Y P E O F R E P O R T A N D P E R I O D C O V E R E D
2 . S P O N S O R I N G A G E N C Y NAME A N D ADDRESS
Same 14. SPONSORING A G E N C Y C O D E
DlBR 5. S U P P L E M E N T A R Y N O T E S
Microfiche andlor hard copy available at the Engineering and Research Center, Denver, Colo- rado Editor- JMT
6. A B S T R A C T
The Fountsin Valley Conduit is a 45-mile pipeline constructed by the Bureau of Reclamation t o deliver water from Pueblo Dam near Pueblo, Colorado north to the cities of Colorado Springs, Stratmoor Hills, Fountain, and Widefield, Colorado. A computer based supervisory control system will control 5 pumping plants along the pipeline and a RFCS (rate-of-flow con- trol station) to regulate waterflow. An analog computer model was designed to represent the RFCS and evaluated t o determine system performance. This report details the conduit system, the analog model, and control performance criteria.
7. K E Y WORDS A N D D O C U M E N T ANALYSIS
3 . DESCRIPTORS-. 1 automatic control1 process control1 analog computers1 rate-of-flow control1 water conduits1 remote valve controls1 pumping plants1 rate-of-flow control structure1
J . ID EN TI F IE RS- - I Fountain Valley Conduit1 Fryingpan-Arkansas Project, Colorado1 Lower Missouri Region
:. C O S A T l F i e l d / G r o u p OgC, 13K COWRR: 0900 SRIM:
2 1 . N O . O F PAGE!
54 2 2 . P R I C E
8. D I S T R I B U T I O N S T A T E M E N T
A v a i l a b l e from t h e N a t i o n a l T e c h n i c a l In format ion S e r v ~ c e . Opera t ions D i v i s i o n . 5285 P o r t R o y a l Road. Spr ingf ie ld, V i r g i n i a 22161.
Microfiche andlor hard copy available from NTlS
19. S E C U R I T Y CLASS ( T H I S REPORT)
U N C L A S S I F I E D 20. S E C U R I T Y CLASS
ITHIS P A G E ) U N C L A S S I F I E D
REC-ERC-82-10
ANALOG MODEL AND EVALUATION
OF THE FOUNTAIN VALLEY
RA TE-OF-FLOW CONTROL STATION
by
D. A. Skiles
W. B. Gish
October 1981
Power and Instrumentation BranchDivision of ResearchEngineering and Research CenterDenver, Colorado
UNITED STATES DEPARTMENT OF THE INTERIOR * BUREAU OF RECLAMATION

As the Nation's principal conservation agency, the Department of theInterior has responsibility for most of our nationally owned publiclands and natural resources. This includes fostering the wisest use ofour land and water resources, protecting our fish and wildlife, preser-ving the environmental and cultural values of our national parks andhistorical places, and providing for the enjoyment of life through out-door recreation. The Department assesses our energy and mineralresources and works to assure that their development is in the bestinterests of all our people. The Department also has a major respon-sibility for American Indian reservation communities and for peoplewho live in Island Territories under U.S. Administration.
The information contained in this report regarding commercial productsor firms may not be used for advertising or promotional purposes and isnot to be construed as an endorsement of any product or firm by theBureau of Reclamation.
The information contained in this report was developed for the Bureauof Reclamation; no warranty as to the accuracy, usefulness, or complete-ness is expressed or implied.
ii

CONTENTS
PageIntroduction. . . . . . . . . . . . . . . . . . . . . . . . . . . . . . . . . . . . . . . . . . . . . . . . . 1Conclusions. . . . . . . . . . . . . . . . . . . . . . . . . . . . . . . . . . . . . . . . . . . . . . . . . 1Physicaldescription of FountainValleysystem. . . . . . . . . . . . . . . . . . . . . . . . . . 1Modeldescription. . . . . . . . . . . . . . . . . . . . . . . . . . . . . . . . . . . . . . . . . . . . . . 2Controlphilosophy. . . . . . . . . . . . . . . . . . . . . . . . . . . . . . . . . . . . . . . . . . . . . 3Controlparameters. . . . . . . . . . . . . . . . . . . . . . . . . . . . . . . . . . . . . . . . . . . . . 3Modeltest data. . . . . . . . . . . . . . . . . . . . . . . . . . . . . . . . . . . . . . . . . . . . . . . 4
Systemfrequencyresponse. . . . . . . . . . . . . . . . . . . . . . . . . . . . . . . . . . . . . 4
S Rangestep response. . . . . . . . . . . . . . . . . . . . . . . . . . . . . . . . . . . . . . . . 5
Ki Rangestep response. . . . . . . . . . . . . . . . . . . . . . . . . . . . . . . . . . . . . . . . 5System step response. . . . . . . . . . . . . . . . . . . . . . . . . . . . . . . . . . . . . . . . . 5
References. . . . . . . . . . . . . . . . . . . . . . . . . . . . . . . . . . . . . . . . . . . . . . . . . . 5Appendixes. . . . . . . . . . . . . . . . . . . . . . . . . . . . . . . . . . . . . . . . . . . . . . . . . 23
A - Modeltest data. . . . . . . . . . . . . . . . . . . . . . . . . . . . . . . . . . . . . . . . . 25B- System analong coefficient listing. . . . . . . . . . . . . . . . . . . . . . . . . . . . . 51
Figure
FIGURES
1 General location map. . . . . . . . . . . . . . . . . . . . . . . . . . . . . . . . . . . . . . . . 72 ,Schematic diagram for operation of Fountain Valleyconduit and
lateral. . . . . . . . . . . . . . . . . . . . . . . . . . . . . . . . . . . . . . . . . . . . . . . . . 8Simplified diagram of the tank level regulating system. . . . . . . . . . . . . . . . . 9Modeled valve manifold system. . . . . . . . . . . . . . . . . . . . . . . . . . . . . . . . 10Site layout. . . . . . . . . . . . . . . . . . . . . . . . . . . . . . . . . . . . . . . . . . . . . . 11Details of the Fountain terminal tank. . . . . . . . . . . . . . . . . . . . . . . . . . . . 12Details ofthe Widefield regulating tank. . . . . . . . . . . . . . . . . . . . . . . . . . . 13Valve control flow diagram. . . . . . . . . . . . . . . . . . . . . . . . . . . . . . . . . . . 15Valve control block diagrams. . . . . . . . . . . . . . . . . . . . . . . . . . . . . . . . . . 17RFCS dual valve analog model. . . . . . . . . . . . . . . . . . . . . . . . . . . . . . . . . 19Valve control span and alarm levels. . . . . . . . . . . . . . . . . . . . . . . . . . . .21Position-to-flow transfer curves. . . . . . . . . . . . . . . . . . . . . . . . . . . . . . . 22
3456789
101112
Appendix A
A1A2A3A4
System frequency response - graphical data. . . . . . . . . . . . . . . . . . . . . .26~p Range step response - graph.icaldata. . . . . . . . . . . . . . . . . . . . . . . . . 29Ki Range step response - graphicaldata. . . . . . . . . . . . . . . . . . . . . . . . .40System step response - graphicaldata. . . . . . . . . . . . . . . . . . . . . . . . . .47
Hi


Variable Range Initial value
~0.0 to 1.0 0.50.0 to 0.1 0.01I
INTRODUCTION
Delivery of domestic water supplies from reser-voirs to municipal consumers demands a systemof pipes, valves, and tanks comparable to theplumbing found in each user's residence. Just asthere must be a faucet to control tap water flow,there must also be valves in the reservoir con-duit delivery network to regulate water supply.Similarly, water tanks and conduits are neces-sary to regulate and transport water through thesystem for consumer use.
This report studied the reaction of the water de-livery system to changes in flow introduced byregulating valves. The Fountain Valley areasoutheast of Colorado Springs, Colorado re-ceives domestic water through a 3-mile long,24-inch diameter pipe known as the FountainValley lateral. Water from the lateral servesconsumer needs in the Fountain Valley and ad-joining areas. To effectively regulate water sup-ply using computer-controlled valves is an im-portant engineering inquiry related to the con-struction of the Fountain Valley water supplysystem.
The work described originates from a request toevaluate the performance characteristics of aRFCS (rate-of-flow control station) located in theFountain Valley lateral, Municipal WaterSystem, Fryingpan-Arkansas Project, Colorado.The general location of the system's com-ponents are identified on figure 1 . Details of theproject are found in the Physical Description ofthe Fountain Valley System section.
The remote control of pipe valves was studied toensure the system's operation would not rupturethe pipes. If the valves close too fast, theresulting rise in pressure would burst the pipe.This water-hammer limitation places difficult re-quirements on the valve controllers. Because thestorage tank cannot hold all the water in thepipe, the controller must ensure the tank will notoverflow. These requirements occasionally re-quire conflicting control functions. Therefore, athorough study of the control was made. Thevalve control system should be stable. Addi-tionally, speed of response should be reasonablyfast without excessive response error orpressure surge. This study was made to ensurethe method of water flow control meets all con-trol requirements.
The primary objective was to identify the restric-tions in behavior of a sequential, dual valve,tank-level regulating, subsystem specified forthe Fountain Valley lateral. The method of eval-uation was an analog computer model. Themodel simulates terminal tank level, wateredconduit, microprocessor control, external valvecontrollers, and valve behavior characteristics.The level control system modeled represents thedesign approach for regulation of water levels atthe Fountain and Widefield terminal tanks withsource water from the Widefield regulating tank.
CONCLUSIONS
1. The specified method of regulating terminaltank level, using a remote terminal unit actuatedRFCS is expected to perform adequately.
2. System response to transient pipe behavioris slow and substantially attenuated by largesystem energy transfer capacities.
3. Proportional-integral values are critical toflow-path-control stability. Recommendedranges and initial values are indicated below:
4. The model evaluation provides a simulatedapproximation of actual physical behavior of theRFCS. Variations in system components or oper-ational failures were not considered in thisstudy. Any change in equipment or firmware orfailure therein is beyond the study limitations.
PHYSICAL DESCRIPTION OFTHE FOUNTAIN VALLEY SYSTEM
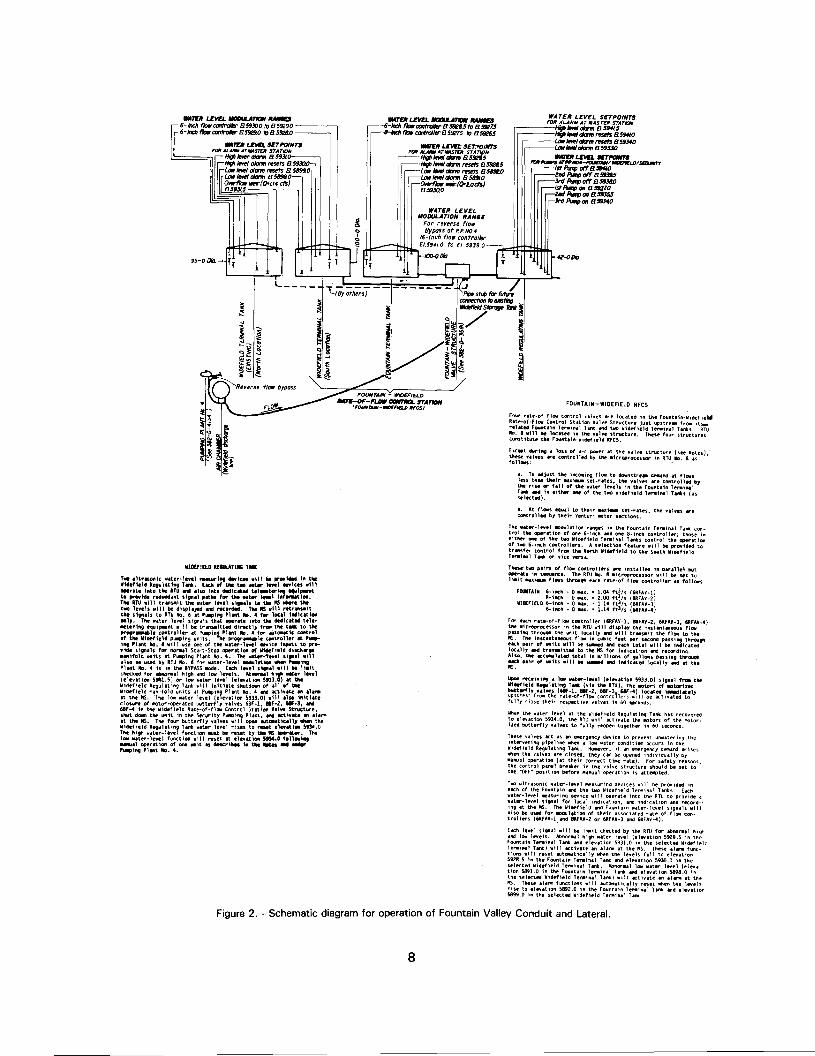
The Fountain Valley system studied is shown onfigure 2 and shows the operational diagrams forthe Widefield regulating tank, Fountain-Wide-field RFCS, Fountain terminal tank, and Wide-field terminal tanks. Figure 2 also describes theFountain-Widefield RFCS and the Widefield reg-ulating tank.
The symmetry of the Fountain and Widefieldtank level controls invites selection of one of the

two systems for modeling purposes. The flowfrom the Widefield regulating tank to Fountainterminal tank stream was chosen to evaluatevalve control characteristics. Indicated on fig-ure 2 are the valve sizes, water level modulationranges and set points, flow capacities, and ele-vation differences from which the dynamic flowof the system may be determined. A diagram ofthe simplified tank level regulating systemadopted for the analog computer simulation isdepicted on figure 3.
The 24-inch pipe from the Widefield regulatingtank and the RFCS valve manifold are depictedon figure 4. The selected valve manifold systemfor the model is the lower manifold sectionwhich contains 6- and 8-inch motor-operatedbutterfly valves. Flow in and out of the modelsystem manifold is evaluated for a 12-inchconduit.
The site layout for the Widefield regulating tank,the RFCS, and the Fountain terminal tank areshown on figure 5. In subsequent velocity andflow computations, the distance across theRFCS was neglected and assumed small in com-parison with total distances from the regulatingtank to the terminal tank.
Dimensions of Fountain Valley terminal tank andWidefield regulating tank are shown on figures 6and 7, respectively. The Widefield regulatingtank supplies water to the Fountain terminaltank through the RFCS valve manifold.
MODEL DESCRIPTION
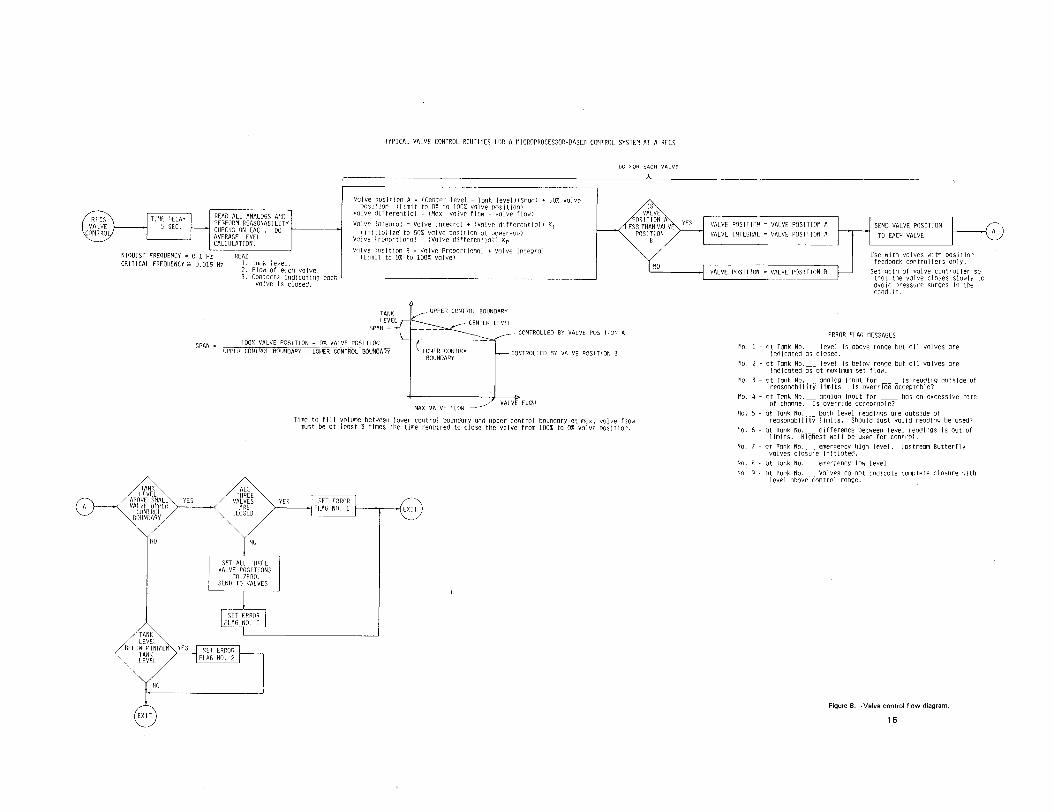
The valve control flow diagram depicted onfigure 8 was the specified method of performingcontrol of the valves at the RFCS. A tank levelspan is determined through which each valve(6-inch designated small valve and 8-inch desig-nated medium valve) is opened and closed se-quentially to maintain tank level. The water levelmodulation ranges for both the small andmedium valves are shown on figure 2.
The final number of controlled valves was two.Figure 8, prepared prior to Solicitation DS-7422,anticipated that three valves might be employedin the RFCS. The model study considered con-tains the two-valve system which retains thesmall and medium vlave designations, and ex-cludes the large third valve.
Valve positions are controlled by a microproc-essor-based RTU (remote terminal unit) whichreceives and compares the valve flow and tanklevel status. The RTU sends valve request posi-tions to the valve controller corresponding to theflow requirements of the terminal tank.
A second block diagram developed for the valvecontrol system is depicted on figure 9. Repre-sented in the diagram is a system analog to theexpected microprocessor control. Model varia-bles and control parameters are specified on thediagram.
The model employs two alternating valve con-trol signals which change valve position andconsequent flow into the terminal tank. In thecontrol loop, present valve position is comparedwith resulting valve flow, and the smaller signalestablishes the valve request position for thevalve controllers.
Control variables are defined on. the righthandside of figure 9. Those variables which may beassumed to have negligible variance withrespect to time are assigned constant values.Value assignment is based on computationswhich appear in the section on Control Param-eters.
Implementation of the model system on theanalog computer is given on figure 10. Depictedare counterpart, interactive' models for bothvalves. These contributions are labeled S (small)and M (medium) throughout the model.
Valve control resulting from comparator selectedrequest position appears on the lower section ofthe diagram. Position of the valve is translated tostatic flow by function generators and propor-tioned by the fractional contribution of the valveto total flow. A closed pipe water modeltransfers static flow to a conduit-simulated flowinto the terminal tank.
Both valve position and flow control loop signalsindicated at the top and center of figure 10 are afunction of relative tank flow. In the positionloop, the difference between flow in and out ofthe tank is integrated to produce a simulatedtank level capacity. The time variant tank level issummed with the valve range center level andmultiplied by the position-to-Ievel differenceratio. The resulting signal is the individual valvespan indicated on figure 9. Valve span is
2
summed with the center position of the valveand the valve position signal transferred to its re-spective control loop comparator. The flow looptranslates water into the tank to a dynamic flowfor each valve. Dynamic flow is summed withmaximum desired flow contribution for eachvalve (setpoint) producing the actuating errorsignal for a P-I (proportional plus integral) flowtransfer. Output for the P-I control is propor-tional to the sum of the dynamic flow error andthe integral of the flow error with respect totime. As the flow error becomes small, sufficientintegration time provides enough controller out-put to drive the flow loop to the setpoint.
The dual-valve RFCS model performs a sequen-tial alternation of flow versus position control ofthe valves as tank level is changed by down-stream flow demand. Tank fill operations simu-lated initially open the small valve, and if flowdemand exceeds the capacity of the small valve,open the medium valve until the required tanklevel is stabilized. For decreased flow out of thetank, the process is reversed and medium valveclosure responds to decreased demand withsmall valve closure following as flow out of thetank decreases.
Given that the simulated tank is full and thatsome constant flow out step response is intro-duced to the system, both valves will demandflow control until each one reaches its flow ca-pacity for a given request position. At flow perposition capacity, a new position request is in-itiated based on contribution requirements of thevalve toward meeting dynamic tank level needs.Flow increases or decreases corresponding tovalve position requested.
The complete model is scaled to a one pu (perunit) magnitude for all signals and a rate ofoperation of 1000 times the real time event se-quence rate. The time scaling magnitude is man-dated to expedite testing and data collectionsince the modeled terminal tank has a physicaltime constant of about 32 hours.
CONTROL PHILOSOPHY
The control implementation seems complexwhen studied by flowchart or modeling diagram.The complexity created by the presence of twocontrol systems in parallel must not override the
simplicity of the concept itself. The requirementis to maintain a level in a tank without overflow-ing the tank or producing pressure surges in thepipe. Further, the valves should have a maxi-mum flow somewhat less than at full open.
The tank level is controlled by a zone controllerwhere each valve is assigned a zone of levels inthe tank. As the tank fills, the smaller valve issaved for control at the top of the tank, andpressure surges are minimized. The control is in-tegral in nature and the tank volume acts as theintegrator. There is no need for proportional ordifferential control because of the large volumeof the tank and the resultant low gain.
The control then transfers to flow control whenthe level control requests maximum flow. Thecontrol chosen is P-I in nature. The derivativewas not needed because the valves have posi-tion control included as a separate control loop.This P-I controller does have the possibility of in-stability, and therefore, Kp and Ki should be keptwithin stable ranges.
CONTROL PARAMETERS
Computation of model variables prescribed bythe control block diagram (fig. 9) and imple-mented in the analog computer diagram (fig. 10)are developed from the reference drawings(figs. 2 through 7).
Time constant Ttank is the time required in sec-onds to fill the empty tank to the overflow weirat EI. 5930.00 with no flow out and total maxi-mum flow in. Tank height Ht was 44 feet frombase to overflow weir, and Dt (tank diameter)was 100 feet. Tank volume (Vt) is the product
11"(~t rHt and equal to 345,575 ft3.
The flow Q for the small valve and medium valveequals 1 .04 and 2.00 ft3/s respectively,resulting in a total maximum flow Qrnax of3.04 ft3/S. T-Tank (Ttank) equals total tankvolume Vt divided by Qmax (maximum flow) intothe tank and is 113,676 seconds or about32 hours.
Time constant TW'
representing the modeled lagin the closed pipe, is the ratio of the product of L(pipe length) from the last regulating tank and V
3

(water velocity) to the product of (g) gravity ac-celeration) and the system H (head) from the lastregulating tank, or
T = LVW
gH
Figure 5 indicates pipe length (excluding dis-tance across the RFCS) to be 265.38 feet. Ve-locity is constrained to a 12-inch diameter pipewith a 55.00-foot head between the outlet ofthe regulating tank and the inlet of the terminaltank. The flow for the 12-inch diameter pipe is47 ft3/s, and the velocity of the water is59.8 ft/s. With a gravity acceleration of32.2 ft/sec2, the water flow time lag, Tw is8.95 seconds.
The small and medium butterfly valves, whendriven at maximum speed Tvsand Tvmrespective-ly, are to close/open in 60 seconds (see fig. 2).
Water level modulation ranges designated onfigures 9 and 10 as span are specified on fig-ure 2. The Fountain terminal tank with associ-ated valve control and alarm levels is shown onfigure 11. The figure shows a 1-foot span forboth the small and medium valve. There is a35.5-foot threshold capacity from the bottom ofmedium span to the low-tank-Ievel alarm. To ex-pedite time relationships in the model, a com-pressed valve span-to-tank capacity ratio wasemployed. Tank threshold capacity below thevalve spans was taken to be a zero reference.Medium valve span center was referenced atbase plus one-third and small valve span centerwas referenced at base plus two-thirds. Full tankmodel capacity was thus zero base plus one.
Maximum flows for the small and mediumvalves are 0.33 and 0.66 ft3/s on a per unitbase, since total flow from both valves is3.04 ft3/s with the valves contributing 1.04and 2.00 ft3/s respectively.
A static valve characteristic is generated in thevalve controller simulation. A function generatorreceives per unit position from the controller andtransfers from a typical butterfly valve perform-ance curve the position to equivalent static flow.The per unit position-to-flow transfer is depictedon figure 12 and indicates incremental values.Since valve position in the model is constrainedto zero base with an upper limit of 1, valve flow
below zero is made zero and valve flow transferexceeding 1 per unit was equated to 1 per unit.Gr~phical model test data (see app. A) giveeVidence to the upper-lower limit discontinuity inthose chart recordings which indicate the flowinto the terminal tank. To the model, the endpoint change from one valve to another appearsas a time delay between the sequential openingand closing of the valves. No significant effectswere observed in system behavior due to thesimulation discontinuity. It is suspected that theactual system may exhibit a similarcharacteristic.
MODEL TEST DATA
No values were specified for the P-I controllercoefficients in the section on control param-eters. The range of values assigned to both theproportional and integral coefficients is a func-tion of complete system response. Although itwas not obvious at the outset of model con-struction and testing, only the P-I coefficientsreadily contribute to any system instability.Because the system is composed of relativelylarge energy transfer capacities, introduction ofany perturbations of a magnitude much less thanthose capacities does not produce any signifi-cant effects in the complete model system.
Total pipe flow from both valves (3.04 ft3/s) isat any instant of time about 0.000868 percentof the total terminal tank capacity. Thus, anytransient flow in or out of the tank resulting onlyfrom a rapid change in conduit flow producesnegligible effects on system performance.
System component response times are relativelylarge so that introduction of fast transientchanges in pipe flow is reflected negligibly insystem response. Again, the large system ca-pacity attenuates the transient amplitude beforesystem components can reflect a relatively slowreaction to the change.
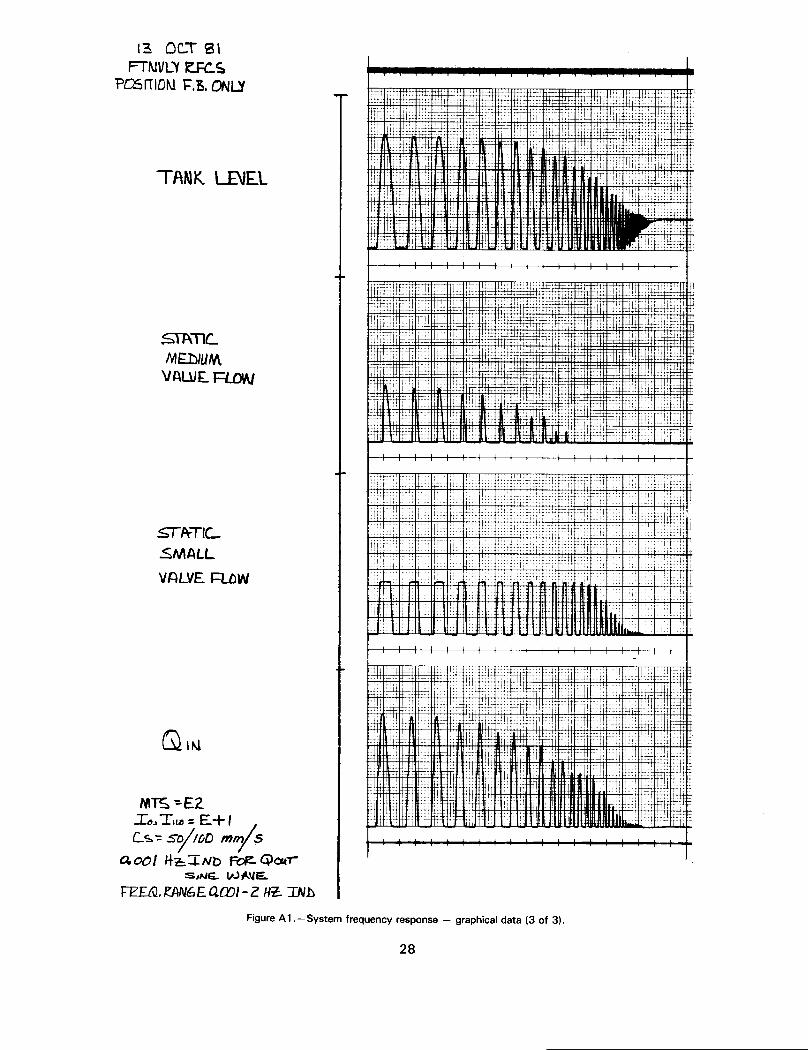
System Frequency Response
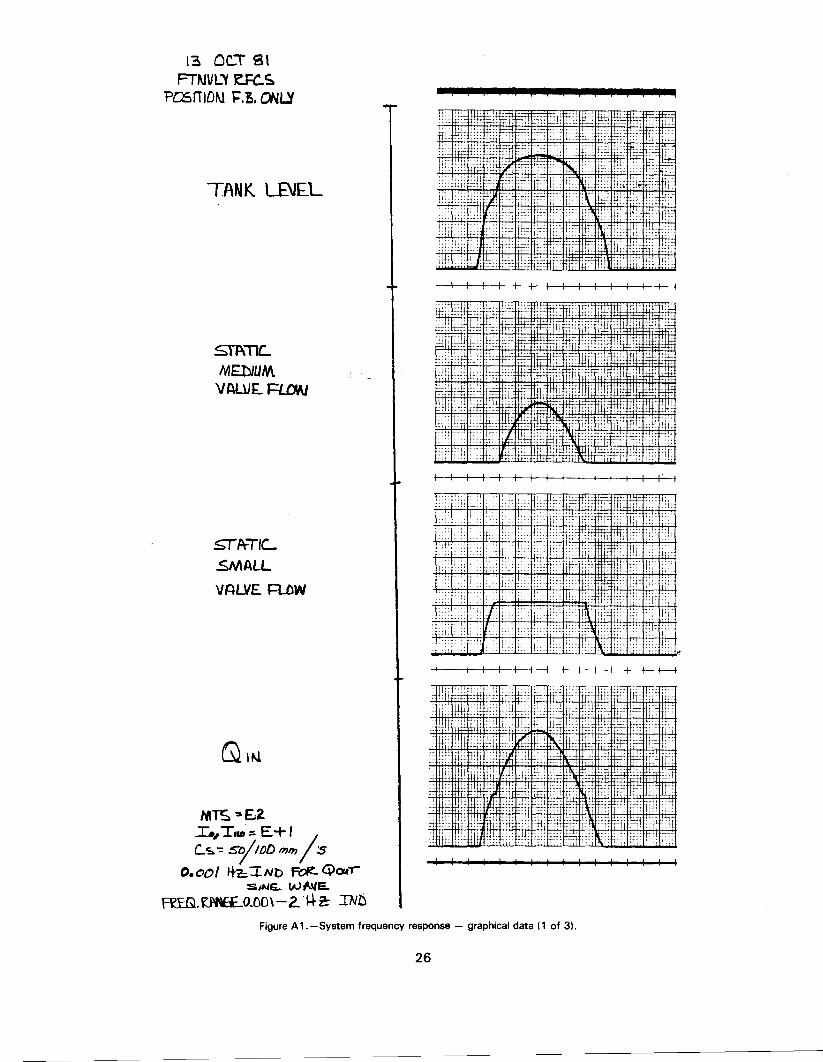
Graphical data (fig. A 1, app. A), which detail thesequence of system responses as a sine wave ofincreasing frequency, is introduced representingflow out of the tank.
Time scaled or indicated frequency is in therange 0.001 to 2.00 Hz. The indicated fre-quency is 1000 times the real-time system, and
4

thus, the actual frequency response is madeover the range 0.000001 to 0.002 Hz.
System frequency response is taken by restrict-ing closed-loop transfer to position feedbackonly. This restriction assures that the variable ofprimary interest, tank level, stays in the loop.
With sinusoidal variation of flow out of thesystem; tank level, static medium valve flow,static small valve flow, and flow into the tank aredisplayed on three successive pages (fig. A 1) forthe test frequency range. Numerical data cor-responding to the charted results indicate a 3 dBfrequency (real time) at about 0.000001 Hz,20 dB attenuation in tank level response at0.0002 Hz, and 40 dB attenuation at 0.002 Hz.The electrical behavior of the model simulates alow frequency, single-pole, low-pass filter. Withonly 90 electrical degrees of phase shiftresulting from the equivalent transfer function,the restricted system is always minimum phaseand is inherently stable.
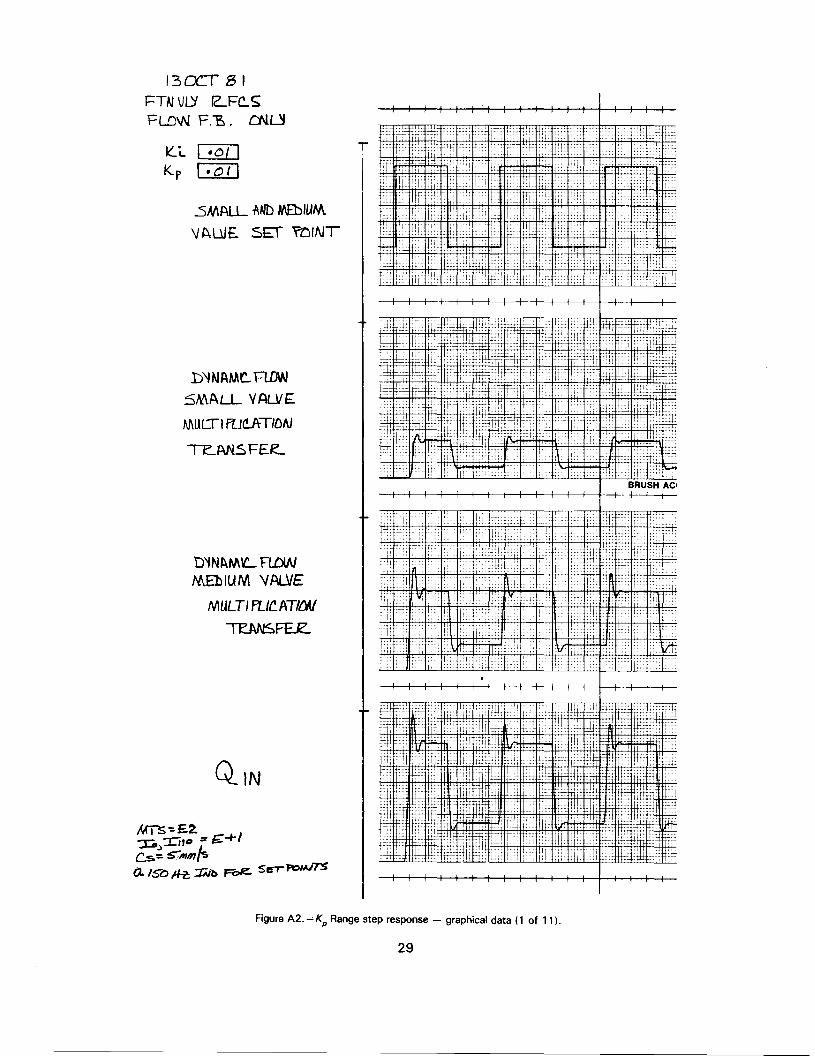
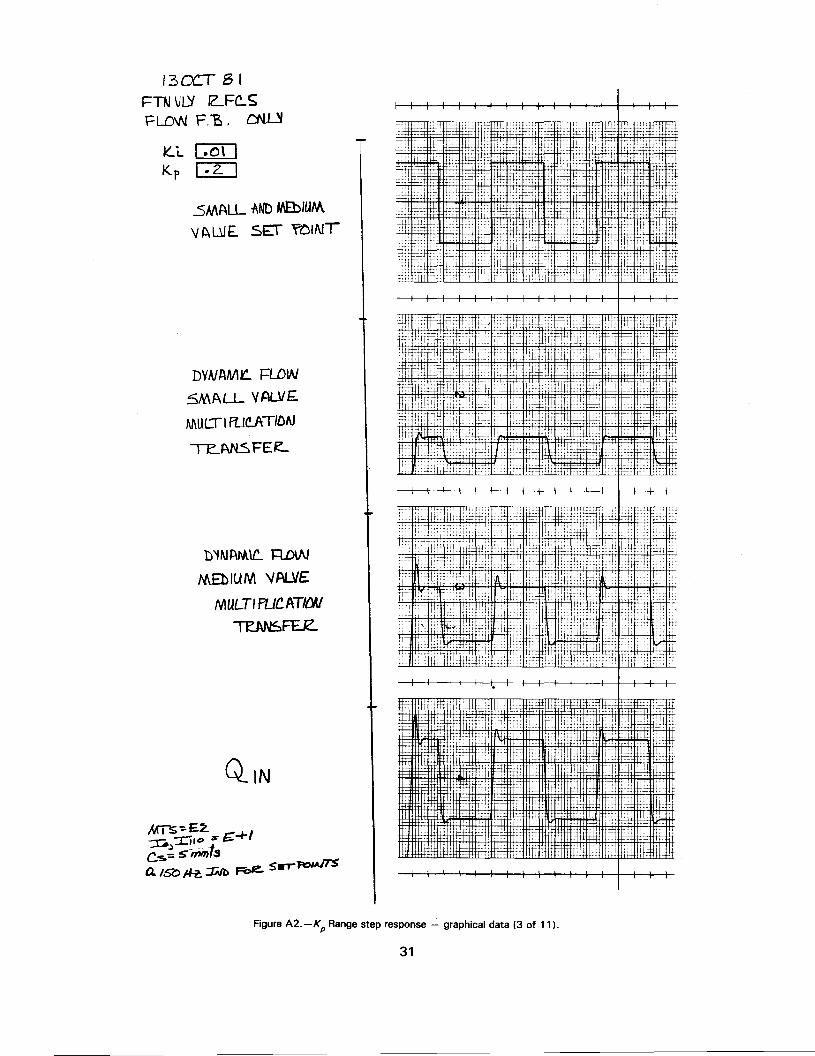
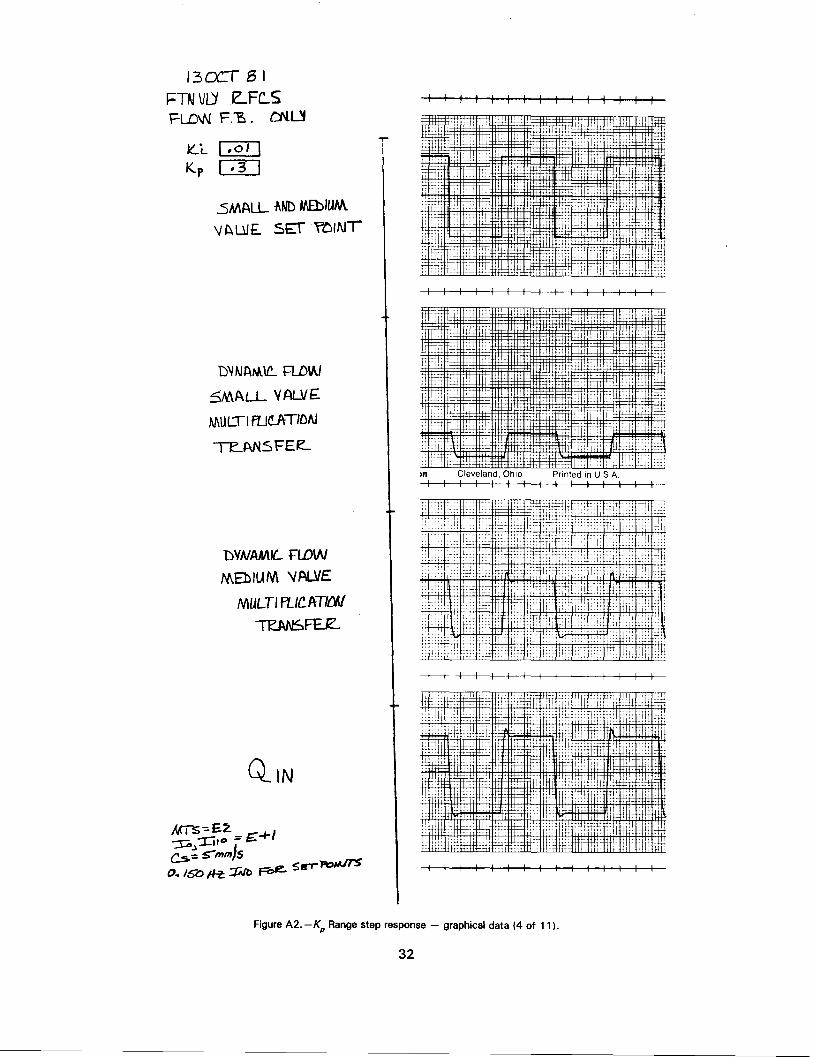
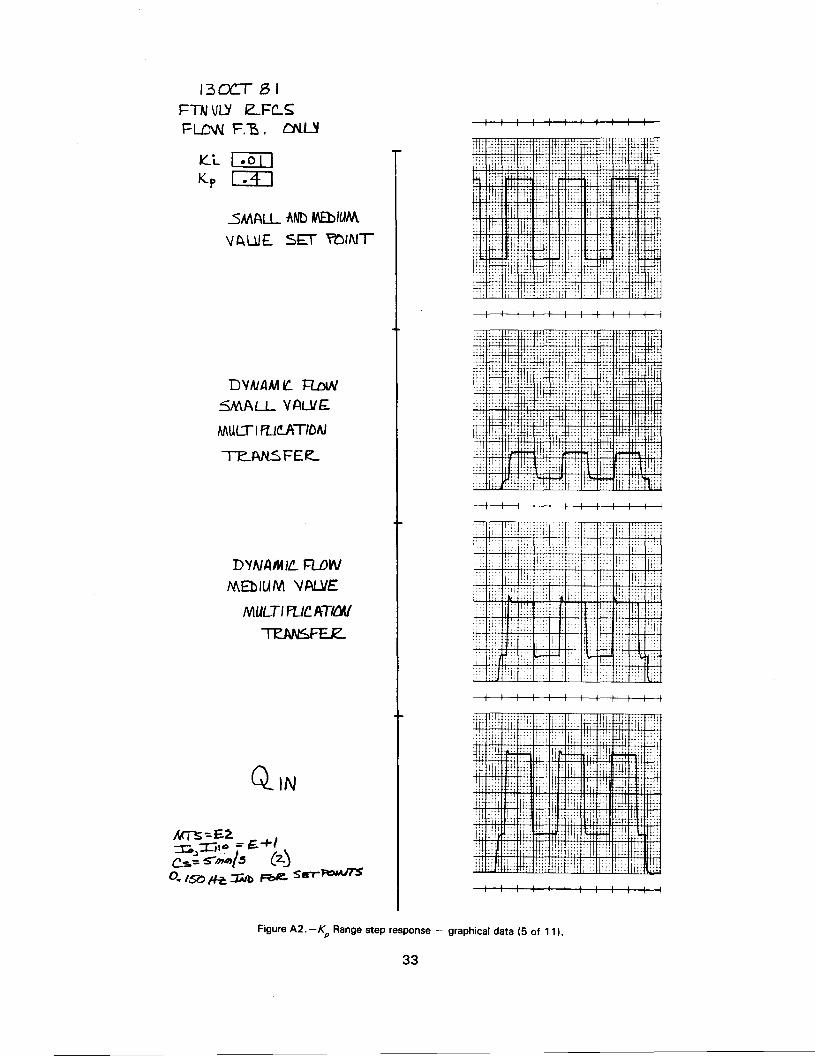
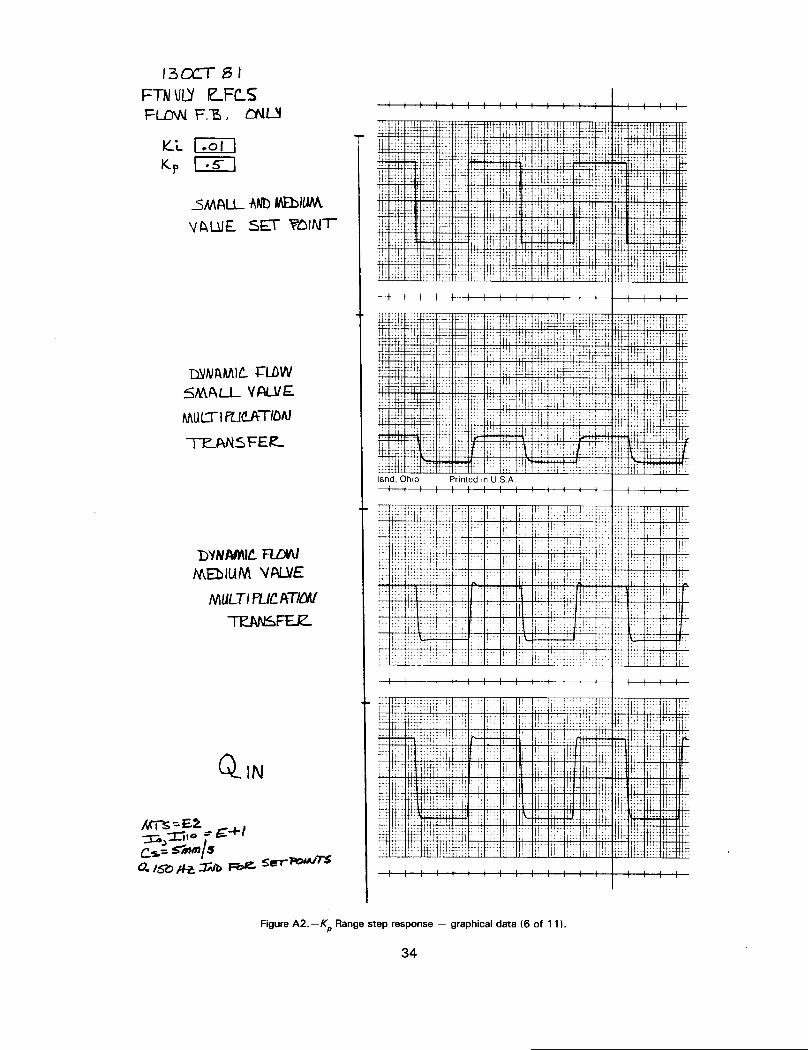
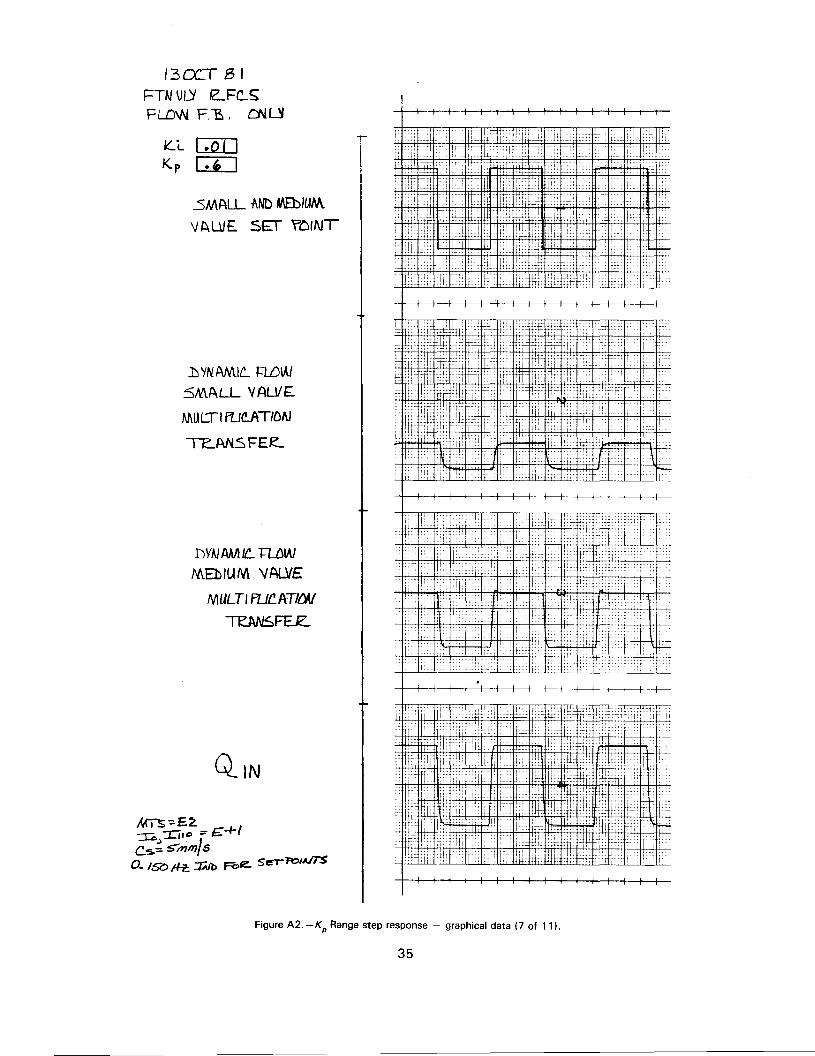
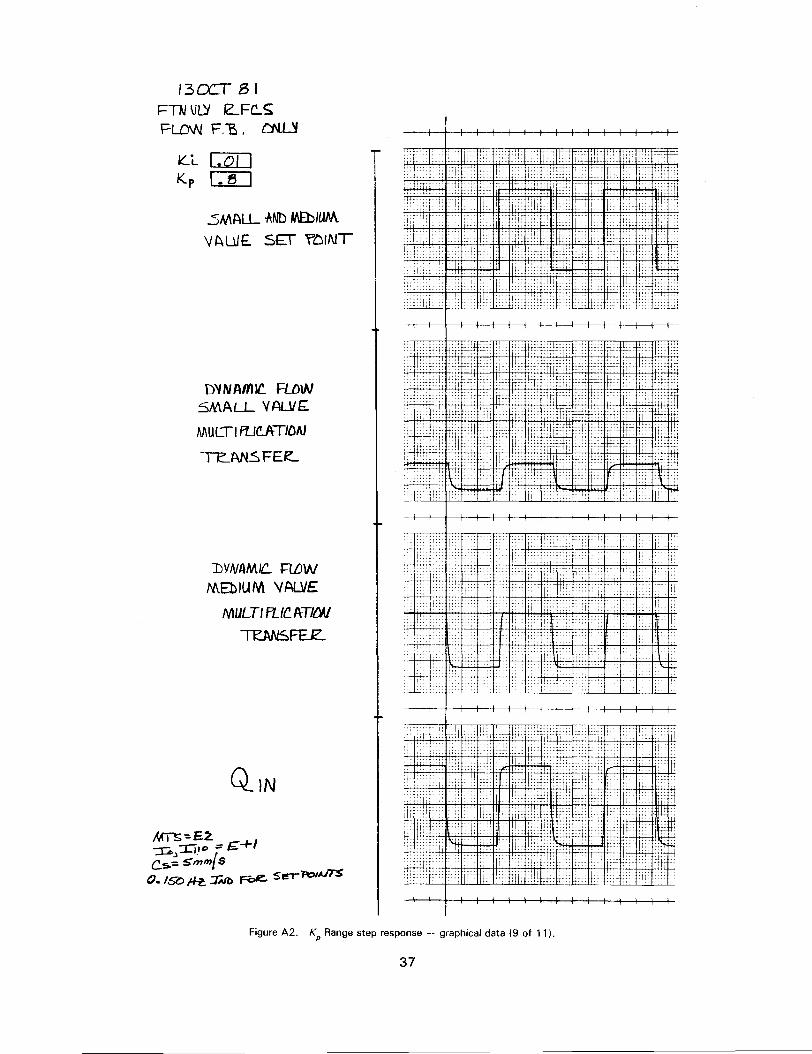
Kp Range Step Response
As previously indicated, instability can only bedetected when position path control is disabled,and flow path control only enabled with compar-ator switching inactive.
P-I coefficient Kj is set at its nominal (0.01) in-itial value and remains constant in this test. Thegraphical data (fig. A2, app. A) proceed from thevariation of coefficient Kp throughout its range(0.0 to 1.0) while introducing a low frequencysquare wave (0.00015 Hz) step variation invalve setpoint indicated as maximum desiredflow on the analog diagram (fig. 10).
Charted is the setpoint step perturbation andsystem responses in small valve dynamic flow,medium valve dynamic flow, and flow into thetank. When control stability is measured interms of the usual step response parameters(peak overshoot, rise time, etc.). it is observedthat system damping is proportional to the valueof Kp' Coefficient Kp' cannot be increasedbeyond its recommend value without (as ex-pected) increasing the delay, rise, and settlingtime accordingly. Below the initial value of Kp'peak overshoot increases appreciably causingoscillatory behavior as Kp approaches zero.
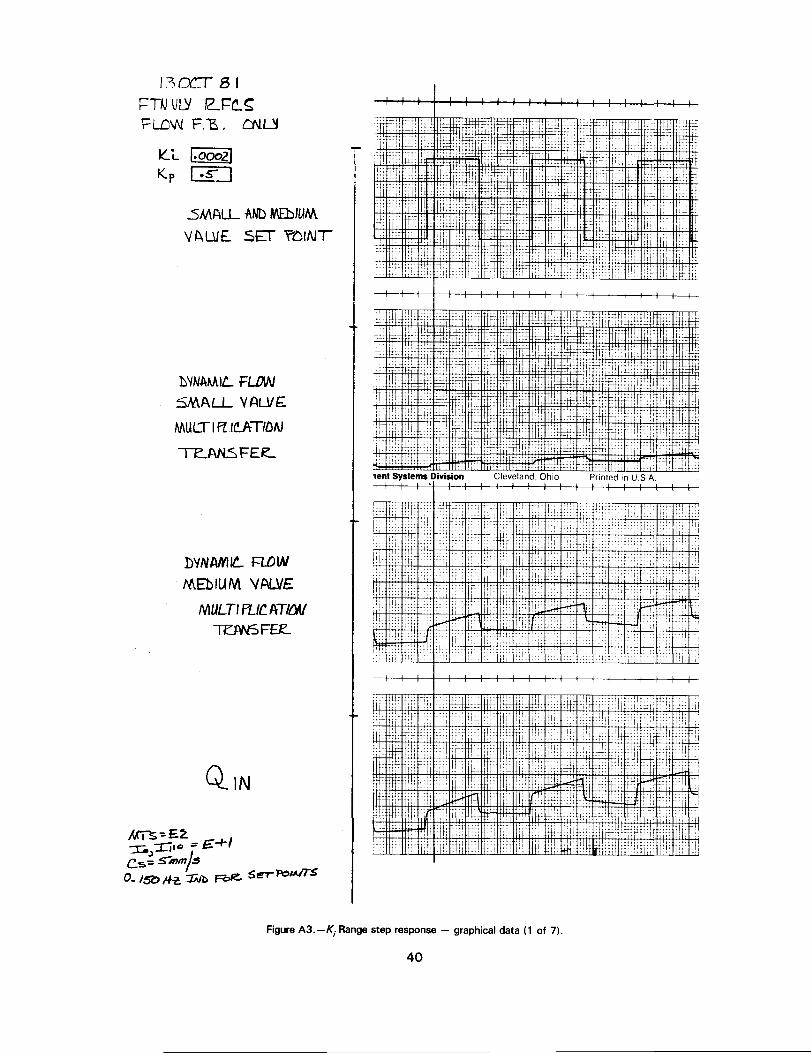
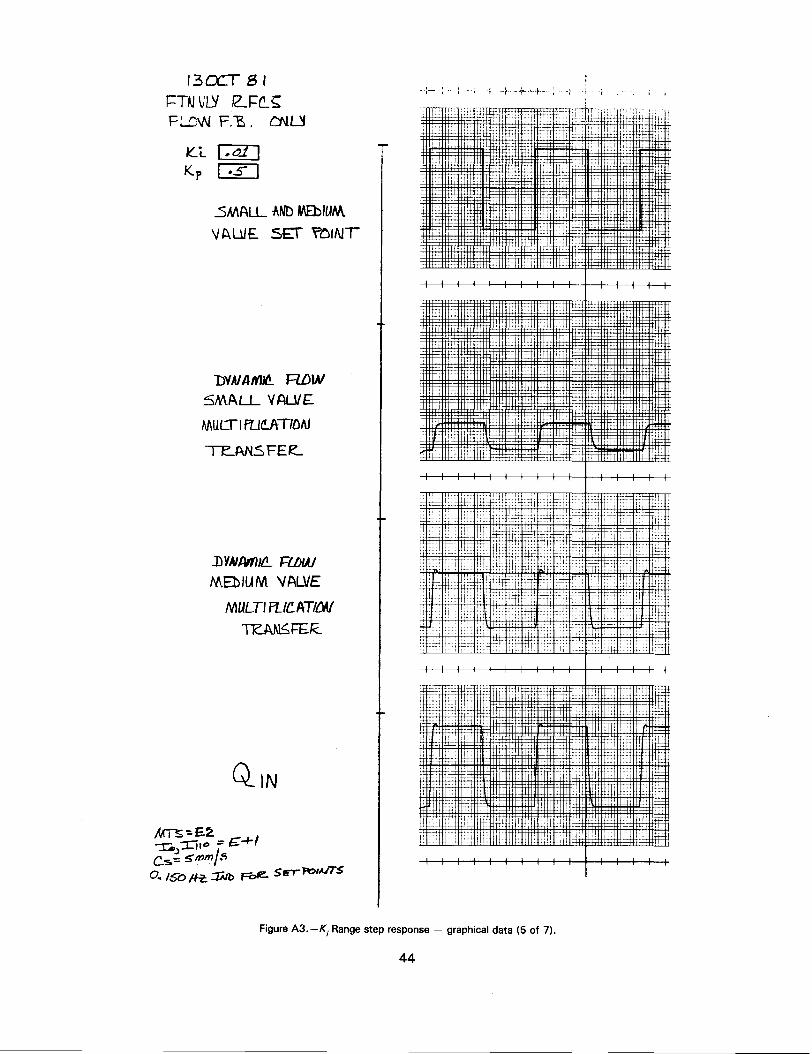
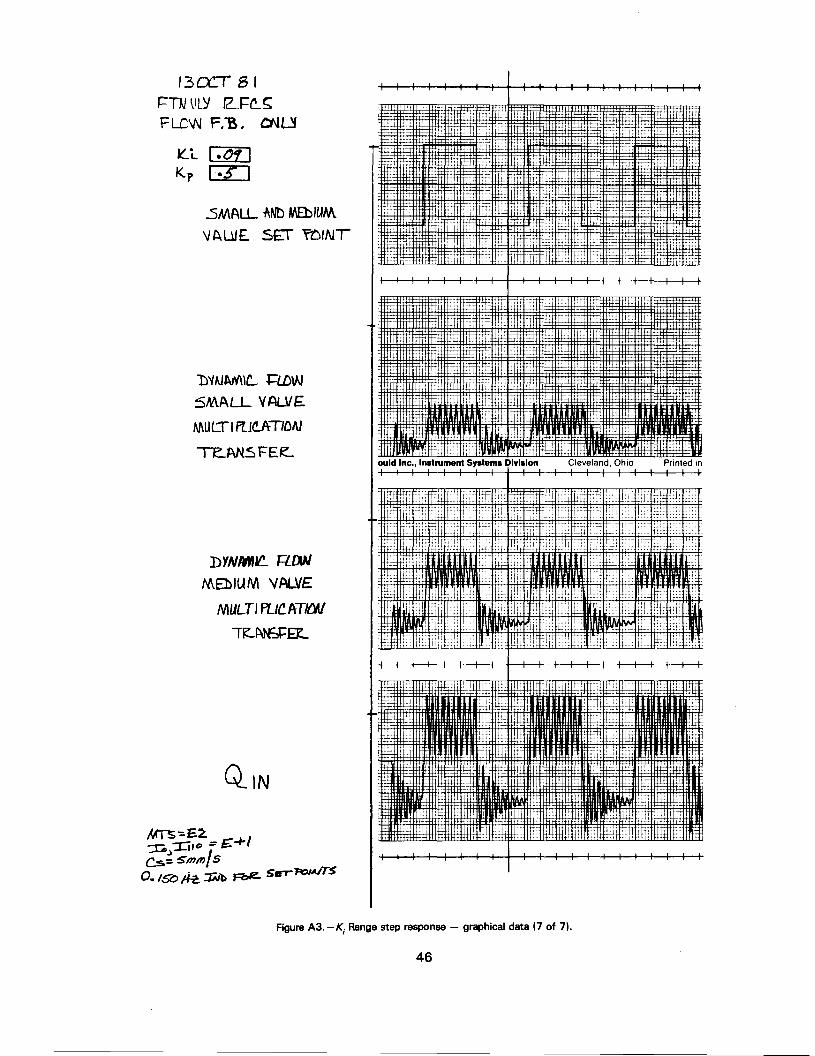
K; Range Step Response
System responses with Kp set at its initial valueof 0.5 and Kj varied in a range from near its zerolower limit to the upper recommended value(0.01) were similarly recorded (fig. A3, app. A).Coefficient Kj was increased in decade steps toincrements both above and below the nominalvalue.
Behavior of the system, again with only the flowpath enabled, was recorded for a low frequency(0.00015 Hz) square wave variation in valveflow setpoint. Responses are charted fordynamic small valve flow, dynamic mediumvalve flow, and flow into the tank.
Integral response is deficient for Kj substantiallybelow the nominal value 0.01. At Kj equal to0.01, flow exhibits a small overshoot and per-formance is that of a slightly underdampedsystem. At values of Kj exceeding the recom-mended initial value (0.01), signals indicatedbecome increasingly oscillatory toward theupper limit of the range.
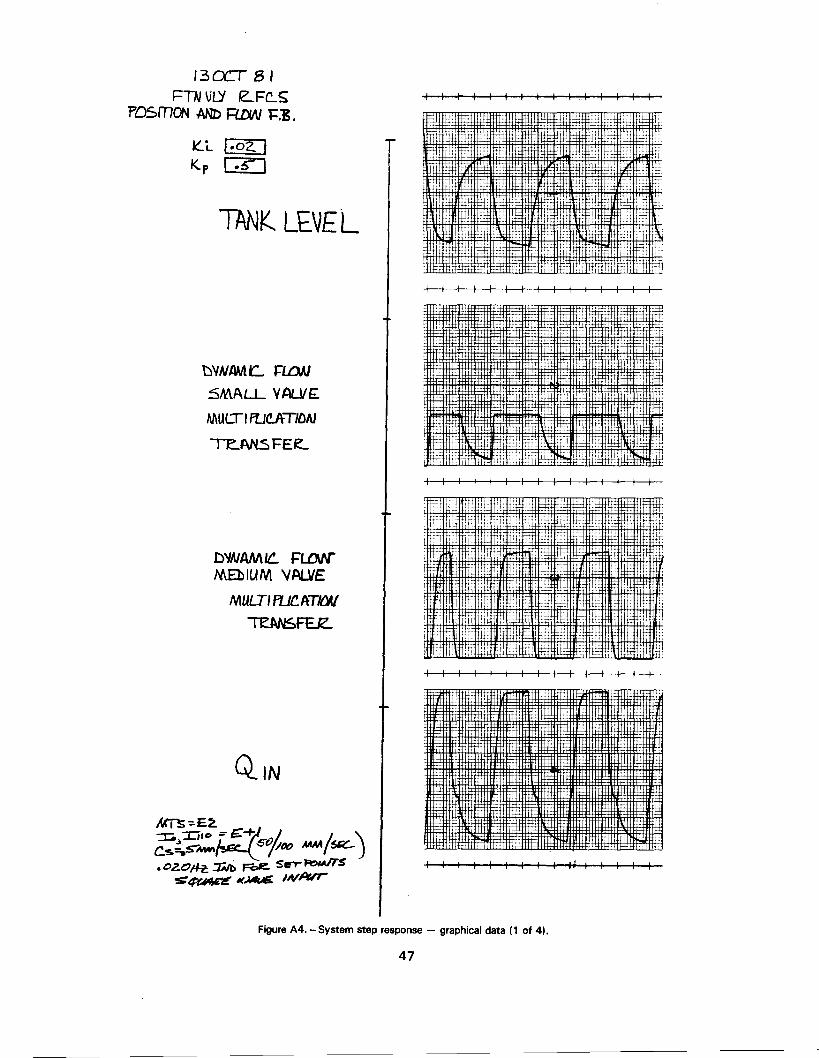
System Step Response
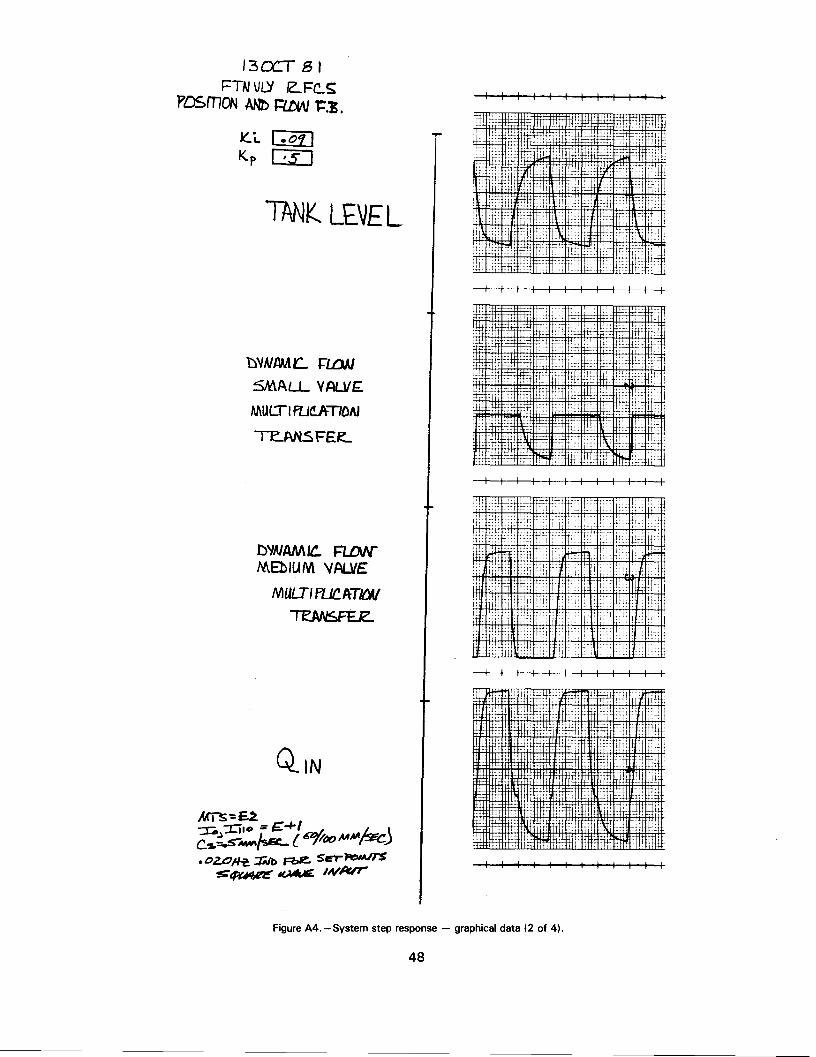
Graphical data (fig. A4, app. A) detail systemresponse with both position and flow controlpaths enabled and comparator switching active.A step response is evoked by introducing a lowfrequency square wave (0.00002 Hz) variationin valve flow setpoint located in the flow controlpath. Charted data were taken for resulting tanklevel, dynamic small valve flow, dynamicmedium valve flow, and flow into the tank.
P-I control coefficient Ke is constant at its initialvalue of 0.5 and coefticient Kj is varied fromslightly above its initial nominal value to valuesexceeding its recommended range. The only in-curred result is to drive the P-I control intosaturation, forcing perpetual position path feed-back sinr.e flow is (in error) always at a max-imum. The system remains unconditionallystable if not useful.
REFERENCES
This report relies on project specification anddesign data from the following referencedocuments:
5
. Solicitation No. DS-7422, SupervisoryControl System, Fountain Valley Conduit,Bureau of Reclamation, 1980.
. Specification 7D-C7446, FountainValley Lateral, Fryingpan Arkansas Project,Colorado, Bureau of Reclamation, 1980.
Drawings and design data were taken from theabove documents and used to evaluate the per-formance of rate-of-flow control valves associ-ated with the project.
6

I@@'0@
II
I
I
J
EXPLANATION
~
INTERSTATE HIGHWAY
STATE or FEDERAL HIGHWAY
AIRFIELD
RAILROAD~
~
Widefield Terrrinal Tank (Existing)
. WidefIeld Termlnol Tonk (This contract)
FountOln Terminal Tonk
Widefield RFCS Valve Strucfure
Wldefie!d ReQJlating Tonk
DETAILFOUNTAIN VALLEY LATERAL
(24 INCH DIAMETER)
EL PASO COUNTY
"\~''l
\" ----
oN'
PUEBLO COUNTY
-Je:.-
ll:'
~,,,~>
rI
.'~!.:I- 5- - 0- 10 15 20
v~f~"
~VSCALE IN MILES
Figure l.-Generallocation map.
7
"'IT"t.nn-.oxw-6-lnchflow ~ 1159JOO
'0859<90
r
6-1nd1fIow~
1l~0 1011592ll0
FOIf:-~T= 8£':::T$HifJI,...,. alarm II
5"'0
~HirJI~, aJorm~,.ts B.59JOlJLowIMl
0/"""rosm £158990
LowIMl oIDrm115«l8.0-_(()o1.l4 cfs)£15'Jl.5
1M7Ett.nn-.unaw-6-1nd1 flow - £1592&5101159215
IndIfIowcatrolltr£l59f275 toE15ft5
8U'EItLEw:t:S£7YOfNTSFOIf ~.::/=:: d;::il
High- """",..",.
£1592a5
I
I-~~~~-MODULATION RAN8£
For r~r~rst flowBypass ot PPNO.4
/6-lnch flo. controlltr£/.59410 to E1. 59J9.0
WATER LEVEL SETI'OINTSFORA'L.ARIIAT MASTCR~TATIOIt.
-""""115H1.5
HifII-oIDrmresmll59flOLowlMlolDrm-.1l59J40Low- oIDrmll59nO
-um.-R:It1UF$ ATI!f!ICH-1OIIITIiIIf/IIIOI!JI'JI(LD/SEIUffrY1st Ptnr> offlll1!Hl/)
2nd Ptnr> off 1159.J!5Jrd Ptnr>offll9.MOIstPtnr>QIJ a5!JJZO
IVIIp QIJ a59JMJrd PlMfpQIJ a_o
~
~
FOUNTAIN-WIDEFIELD RFCS
FOllr r.t~-of-fl<* control ~.lwes .re located in the Fount.l1n-WidefieWR.te-ot-Flow COfItrol St.tion V,he Strt,lcture just upstre.. trOll! its-relited FOUfttl1n Tenl1".1 r ~ blo Wioriield Te,.1n,l hnts. A:TUNo.8 .111 be louted
," the nlve strllCture. These four structuresconstitute the FounhifHliddield RFCS.
EJicept du,.1"9 .. loss of ,-c poIIer ,It the uhe slructklre (Sft Notes)these nhes ... controlled by the .1cr~rGCeuor in I!.TU Mo.8... .follows: .
I. To adjU1.t ttte incOlllinq flow to downstre. ~Ind It flowsless tAU Utetr NJ.~ set-rites, the Yl1ves Ire
controll'"by
the rise .. fill of tile wlter 1eveb in ttle Founhln Tm.iNlTIJIIc Md ill either one of the two Widefield
Tenli""lT"'s
(ISselected).
b. At nows @qUI~ to their Nxi- set-rites, the vlhes IrecOfltroll8d by
tl'lelr Venturi .ter sections.
The ..ter-1ewe1 IOclu11tion ringes in the Fountlin re".inll h. con-trol tile operltion of one 6-inch Ind one 8-inch control1er; those ineitlwr OM of the two Wi6efield Te".inll h.s control the opent ionof tl80 6-1ftCh controllers. A selectlon feltlll"e will be pl"ovided totrlftSfer control fr(ll the North Widefield to tAe South Widef1el(lTm.hw1 T- or ,ice veru.
WlDUI[LDHlU.An. T- These- tl80 ,Iirs of flO11' controllers II"'e instilled in plrllle1 butoper..e in sequence. The ItTU No. 8 .icroproc.essor wi II be set toIi.it MJ.'- flows throuqtl elch rlte-of-flow controller IS follows:
FCMIITAIN6-inch-
QNJ.. . 1.04 ft3ts (6RFAv-I)
8-tnch -Q . 2.00 ft3;s (8AFAV-2)
WIDEFIELD 6-inch-
Q8&JI;. -1.14 ft];s (liRfAV-3)
6-inch -Q MI.. - 1.14 ft3;s (6afAV-4)
TIG ultr.on1c w.ter-1evellHSuriftt ...ices ..111 .. prOlllWecl'ft theWidefield Reg\I1att", T_.
heh'" tM bill ..ter lewel *,,1c8\"'11
::'~~~t~~~:"~ ~:~s:.~:Of~~-=~1=r:'.=~TM RTU..ill trlllSlllt the wlter leYel st,,"h te tilt fIlS UIttwo leveh ..ill be displayed and recorded. TN N5 w111mr_;ttM si",ah to RTUNo. Ii It '1IIp1", 'lant Ia. 4 ,. 10nl ,.tcat*,onl,. The water level SigMh that operate ilrto UIt dec81cahd tele.
rt", equipllent 111111be tr"S8ttteci directly frC8 the ~ to the
~:;'~~;i~:t;~~~9':n~~i"",:1~og~~: C:~~:~ ~Oft~:'t", 'l..t Il1o.4 ..ill use one of the ..ater-lewel ..itt 1n,uts to pro--
~~f~;r~~t:O:t n:::~~t;~~it:.orr~ ~;~r1~i~~~f1a1l0 be used by RTU 180. ~ for wlter-level --hUon ... ,iftlP1Mt No. .. is in the BYPASSlIDde. [lth l..,el sip., ..ill M H.ttthecked fM 1INIo","l high and 1011'leveh. Ab l ftip IllUr lewl(eleVition 5"1.5) or low lI.ter 1.vel (eleutiOfl 5933.0) lit tMWidefield Regul.t;ng Tlnk lIill inltilte shutdCMIof .11 of U.Widefieldl'l1anTfold units It P..-p;ng Plant 10. 4 aftCIactiveu ... 11....It tn. MS. 'The low ~Ihr level (elevation 5933.0) lIIill a1so intttateclosure at IfIOtor.operatea butterfly vlhes 6B"-l, 8IF".2, ".3. ...6Bf-t if! the Widefield Rate-of-flow COfItrcl Station V.l.. Structure,sltut down the Ufltt in the Security PI;IIIIp'ingP111\t. Md Itt,... ..
a1&""It the MS. The four ~tterfly ..hes ",ill ~ Mouttnll, lIMn tl'leWidefield ltf9Uhting Tn lI.ter level rhlS to reset el.."t'.. 5114.0Ttte high water.l..,el function ..,11 be reut by tJII; tIS operlt8r. Thelow wltel"-le.el funttlon ..il1 reset. el",.tt. 5t)t.O fon.,.....,.11 operat Ion of one Wlit as 6Hcrt... ... U. ... ... .....'IIIIIpt", 'l..t 810.4.
For etch ute-of-f1~ tOlltrol1er ("'FAV-I, 88IfAY-2. 6RFAY-3, MfAV-4)tlW .1CN/9roceuor 1n tlte ItTU will disphy the instll'lt..eous flowpasSlllg through the un1t 10Cilly MIl ..ill trln5lllit the flow to tneMS. TIte inSUnhneous flow in cubic feet per second passillg throughetcn Pl1r of units will be s.-ell Md tlch total ~ill be indicltedlocllly 8d tunS8iUed to t~ fItS for indiu.tlon UId record1nCi.Also, !tile aca81hted 10111 In .illions of
'811ons p.nill, tlroucaneD ,..ir of ...its wi II be s-.ct IIIId tnd1cllted 10Cilly Md It tileOS.
UponrecehiftIJ a 10lil.WAW-I4w.1 (ele tion 59]3.0) sign. 1 frG8 the"i*,1eld ...,latH89 T- (via the RTU), the ..tors of -torized
~~~~~)'f~~¥~~e (~;~Of ~~.t=;~' l:~-~? I~~:t~t :=~:lY
f u 1Iy ~ Jose their respective va Ives in 60 l8Conds.
~:e:I;~:t~~e;9j:~~: :~ t~;u W~~~I~~i~:i~I:~":oi~~ ~;s t~t:~~~Iud butterfly vah'es to fully reopen tqgeth@f" In 60 seconds.
~hese va~Yes Itt IS ItI I!IIII!rgency deyice to preyent unlolatering the1ftteryenl119 pipeline when I low water condition occurs in theWidefield Reguhting Tink. However, if an ecr!t'rgefICY demand arises'oItIen the yahes are closed. they Cln be opened indiyidl.lal1y by.ullul operltion (,t their ,correct t1J11e rate). for ufety relsons,tile control pinel breaker 1n the valye structure should be set tothe. -Off- pos it ion before IIIanull operat ion is atteMpted.
T.u ultrasonic ~Iter-Ievel illll!asuring devites loIill be provided Ineach of the Fountlin and the t..o Widefield Tenllinal 'rInkS. E.ch
::~:;: ~:::: ~~~~;~~r or~~~ ~~~~c~~~~~e a:.;t~n~~~a~~n t:n:r~~~~d~.;n9 It the MS. The Widefield and Fountain water-level signlls wi \IIiso be used for 800u1.tion of their ISsociited rlte-of-flow con-trollers (IiRFAV-I,lnd -,1,'0'-2 or MfAV-3 Irld 6RFAV-4).
ElCh lewel si",ll will be li",n checked by the ItTU for II)no","1 hiQl1Ind 1011' levels. Abnor811 higliioliter level (elevltlon 5929.5 in tIll,fountlin Te...inal T&IIII:II'Id eleUition 5931.0 ;n the selected Widefielch".,...l h.) will activ8te an
III'" It the"'S.
These II... func-tions ..111 reset autOllltic.lly wilen the leyeh fall to elevation5928.5 1n the fount, in Tm.in,l h. IIId eleution 5930.0 in the
:~~:C~1~~d~1::': ;~'":~:~~ i;:;nl~~~':"~O:I::~~;~evs:J8~~1~.-the selectM Widef'ield Tel"8inll TiM) loIil1 activlte In 11 It the
~~e ~:e:~e:~:~n f~:~ ~gn~n w~~ :~~::~~c:~;~~ei a:e:"~:l~~::~nS899.0 in the selected Widefield hrlllin.1 hr*..
Figure 2. -Schematic diagram for operation of Fountain Valley Conduit and Lateral.
8
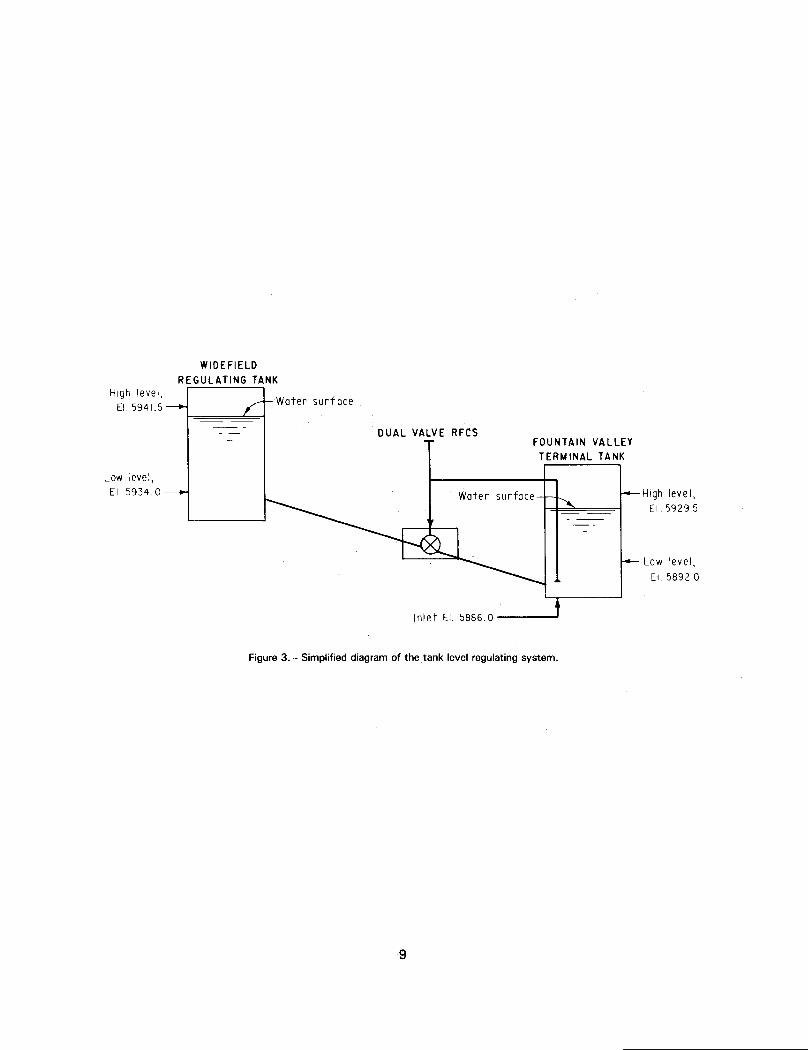
High level,EI 5941.5
Low level,EI 5934.0
WIDEFIELD
REGULATING TANK
Water surf oce
DUAL VALVE RFCS
Inlet E: 58860
FOUNTAIN VALLEY
TERMINAL TANK
Water surface
Figure 3.-Simplified diagram of thetank level regulating system.
9
High level,EI 59295
Low level,
EI 58920

..
0
04
0
0
6
,,' Pi"./0. Squar, nut op,rot,d
butterfly ~a/~,
0
..
0
.0
"0
Figure 4. - Modeled valve manifold system.
10

\
/l
Fountain Volley Lateral
Existing WidefieldTermina I T
°"11
10. Outlet pipe
~~
FO~~~:'~m'nOI~~-
,..o~.~
------
Figure 5. - Site layout.
11
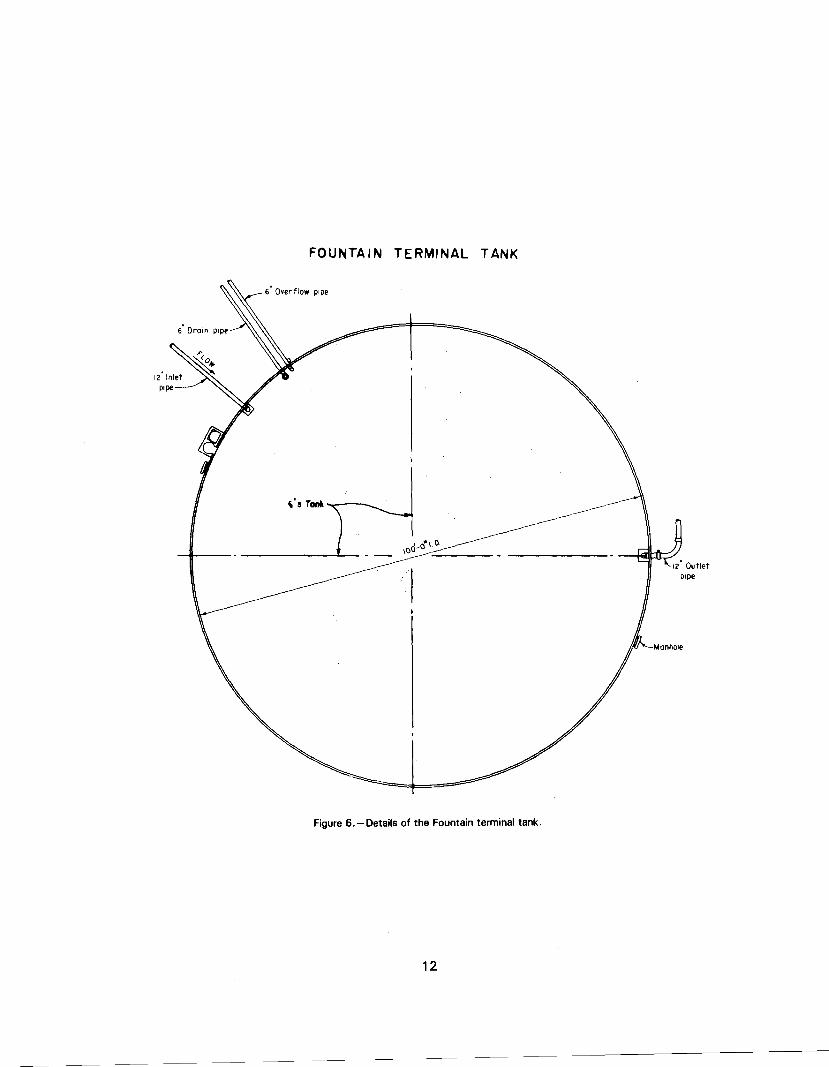
FOUNTAIN TERMINAL TANK
6" Overflow pipe
\',ToM
Manhole
Figure 5.-Details of the Fountain terminal tank.
12

WIDEFIELD REGULATING TANK
6" Drain pipe
from FountainLatera I
<t.'s\\ \.\).
\ )0
IJ.'/, .;/
"16 Drain
r: ---\L::
"24 Pipeto RFCS
Figure 7. - Details of the Widefield regulating tank.
13

TYPICAL VALVE CONTROL ROUTINES FOR A lllCROPROCESSOR-BASED COhlTPOL SYSTEP' AT A RFCS
VALVE
DO FOR EACH VALVF h
5 SET. CllECKS ON EACII. DO AVLRAGE LEVEL
NlflUlST FREflUENCY = 0 . 1 Hz READ CRIIICAL FREQIlENCr e 0.015 HZ 1. Tank l e v e l .
2. Flow o f each volve. 3 . Contocts l n d ~ c a t i n s
volve I s closed.
volve oos l t i on A = (Center level - ionk 1evel)fSoon) + n o s i t l o n l l ~ l m l t t o 0% t o 100% volve pos i t i on1
valve d i f f ~ r e t i t i o l = (Max, volve flow - volve f l ow)
Vnlve l n teo ro l = Valve l n teo ro l + fVoive d l f f e r e i l t i u l l l i n l t l o l l z e to 601 volve ~ o s l t i o n o t oower-up)
VOIve ProOort io~in l = IVoIve d l f f e r e n t l o l 1 Kp
Vnlve nos i t l on R = Volve Pronort lonol + Valve l n teo ro l f L l m l t t o 0% to 100% valve)
TANK UPPER CONTROL BOUNDARY CENTER LEVEL
CONTROLLED BY VALVE POSITION A
= 100% VALVE POSiTION - 08: VALVE POSlTtOIl UPPER COhlTROL BOUNDARY - LOLIER CONTROL BOUNDARY
BOUNDARY CONTROLLED BY VALVE POSITION 8
SEND VALVE POSlTlnN VALVE II!TEGRAL = VALVE POSITION A TO EACH VALVE A
I use w ~ t h voives w i t h oos l t l on feedbnck c o n t r o l l e r s onlv.
Set so in of volve c o n t r o l l e r so tha t the volve closes s lowly to avoid nressure surses I n the
Tlme t o f l l l voiune between lower con t ro l boundary and upcer con t ro l boundorY a t max. volve f low must be a t Ieost 3 t i nes the t ime r e w i r e d to c lose the volve f r m 100% to 0% volve pos l t l on .
THREE
LON 11R01 CLOSED
LEVEL FLAG I4O. 2
condui t
ERROR FI AG IlESSAGES
IIo. 1 - a t Tonk N o , l eve l IS above ronse but a l l vo lves a re indicated as c losed.
l lo. 2 - a t Tank No.-_ l eve l I s below ronse but o l l va lves o re lndlcated as o t moxlmm set flovr.
110. 3 - a t Tonk No.- anolos inout f o r . i s reodlng outs ide of r e o s ~ n o b l l l t ~ I l m l t s . I s ove r r l de acceDtoble?
Po. 4 - o t Tonk No.- onaloq inout f o r - has on excessive ro te o f chonse. I s ove r r l de acceptable?
llo, 5 - o t Tonk No. both l eve l readings a re outs ide of reosonob l l l t v l l m i t s . Should l o s t v o l l d reodlns be used?
Po. 6 - a t Tonk No..- d i f ference between l eve l reodtngs I s out o f I l m l t s . Hishest wIII be used f o r con t ro l .
No. 7 - o t Tonk No.. . emerqency h lqh l e v e l . Upstream B u t t e r f l y volves c losu re I n i t i a t e d .
No. 8 - a t Tnnk No. emerOencY low l e v e l . h10. 'I - n t Tonk No, volves do not i nd i ca te comclpte c l o ~ u r e w i th
l eve l above con t ro l ronge.
Figure 8.-Valve control f low diagram.
1 5

TANK
C O N D U I T A N D W A T
L 1 SllAlL VALVE POSITION SflAl L VALVE PLOUEST PO:'TION
li
S14TIC Q-n " O L Y F r L ~ C ,
STATIC
I SMALL VILYE AND CONTROLLER
llEDlUlt VALVE POSlTlOll
llEOUII V A L V E REQUESI DOSlllOFl
4 - 7 0 MA
. MLOlUll VALVE AND COllTROLLLR
I LARGE VILVE POSI l 1011 I Q L
-- LARRF YALYL REQUEST POSIIION
S T A T I C VALYt Qrn iLOL1
4-20 I r n
CONTFOLLFR EXTEPNAL VALVE COIITPOLIERC
OFAO R ~ ~ J O 1110 V A L V E S
TTINX = l lme I n seconds t o f f l l the enDty tnnk to over f low wler w l th no f low nu t ond t o t o l Oeslred moxlnurl f low In.
rw = !! w11ere I = length o f condult f ro r l l o s t regu ln t lno tonk ~h v = YEIOCI~Y o f water I n condult vhlch I s f low d lv lded
by cross sectlono1 oreo of condu l t . h = heod o f systev from l o s f regn lo t lnq tank. O = " C r C l ~ i n f l n " " f OroYl t " ~~~ -
Note Tw changer w l th f l aw.
Oil, = Sm of Q5#, OH" ond QL,, the to t01 der l red moxlnum f l o w
= 'IOXIFIIIR f low for s m l l valve, c f i .
On,, = noxlmum f low for medlum voive, c f s .
Q , ~ = ~lonlmum f low fo r laroe volve. c f r .
TV5 = Tlme for valve to c l o r i f rom f u l l ooen when c los lno o t mxlllun meed - rmo l l value.
Tvn = Tlne for va lve to close - medlin volve.
TyL = Tine f o r valve to close - loroe voive.
Q S I O , QnMo, OLno = Deslred f low I n small. nedlun ond l a roe valve
TANK FLOU AND LFVFl WART
I Kr. or - loor volve oaslttlpn $: 1 = u ~ i i r t o i - i i v i ~ i i e r o n w 1-ve1
KIL
Figure 9 . - V a l v e c o n t r o l b l o c k diagrams
17

Figure 10. R F C S dual valve analog model
19

~WATER SURFACE
{ - -
HIGH LEVEL ALARM r-- '- - ~ - - - -EI. 5929.5 I 1.0 ft
r -'0 ft-
---1- =
RFCS SPAN
-----
lSPA~- ~
MEDI UM1.0 ft VALVE
SPAN-- - - -- c----.-
HIGH LEVEL ALARM RESET AND"UPPER 6 LEVEL Et. 5928.5
LOWER 6" AND UPPER 8" LEVEL LEI.5927.5
I
-
"LOWER 8 LEVEL IEI. 5926.5 I
34.5 ft
LOW LEVEL ALARM RESET
ir-- - - - - - --
EI. 5892.01.0 ft
LOW LEVEL ALARM ~EI. 5891.0 I
FOUNTAIN VALLEY TERMINAL TANK
Figure 11. - Valve control span and alarm levels.
21

//
08/
1/07
0521)/
/v =(0.1) [(0104)(IOX)z + (0.281)(IOX)-0.156]
7/
v
7/'
?,/
OO~- 0.1 0.2 0.3 0.4 0.5 0.6 0.7 0.8 0.9 1.0
y
1.0
x
0.9
0.8
0.7
0.6
~
~ 05IL.
0.4
0.3
0.2
0.1
0
POSITION
Figure 1 2. - Position-to-flow transfer.
22

APPENDIXES
ABBREVIATIONS FOR APPENDIXES A AND B(found on figures A 1, A2, A3, and A4)
Cs = Chart speed (mm/s)
£ = Integrator rate
£ = 101 Reference integrator rate
£2 = 1 (102) Integrator rate
FB = Feedback
FTNVL Y = Fountain Valley
'0 = Integratorzero
'110 = Integrator 110
/ND = Indicated
Kj = Integral control constant
Kp = Proportional control constant
MTS = Master integrator time scale
Qjn = Flow into tank
Qout = Flow out of tank
23


APPENDIX A
MODEL TEST DATA
25
"c.,..+ ~! ,, ::if. II:
'";..J-~ ,1'-.-. -+..
,
:iE .. 1"..1'1ft¥:
--.- ]j:I :
": .. ,.-- ,
~,t.~IE
+,. f;:;;i .. 'W.. , :f ; ::f
" "Ii!i : ..
; : 11:..: , : '".. : r ~i Ii
..,. t: =::' : j--.- ,"
,'"
:
.. (, c:: ... fi! J.!::!t :ti..... ..:: ..
,.,.'" :iF'
'. Il!',.. .. ..
I'". : I:: :i: " ..
"::: ' H~ I': 'i:
, : : :::: I,: :it ii'..
".. : ,.. Iff
L " :.' II " J;;:i: ,. t:
II:: " Iii,.
1:: ..
.. : : :'.+' : ::
I::: ;..j!;! I;; ,,; ...
: ,..+ ... ;;;Hi 11fi~.1-'''+
,. p:
t I. . @...
~'H-,. : ]1, .,;.., ..
..' ..
.. i1 1i'.. .. , t. .. : 1 f~ ,fl
"
;
"
.. ..,
r ., .. ! ~i ft ijl ,. ......
,.f! 'f\f. \q:E. ... .. /-.-+
! ~H itJt: .. : +-.+ . :,, : H.~
n ff ~n1:~; ,....' l}E H~~..1 r:i- i-It .,
.t!J ~:!!~ H~,II ,..
,.1 ,ttf, 1:.. : .+' T
" iF "; inl .1tt ::: L,.H
13 Oc...T ~HFTNVL'Y ~~
f>C6I11DM ~.!. ONU , , , , , , , , , , , , , I ,
TANK LBJEL
I I I I I I I I I I I I I I I
STATIC..M8::JIUM
V AL\J£. RaN
T.
r.
Iii't, .
if:
I I I I I I I I I I I I I I I I
g-A-Tlc.....sMALL
VAt.:IE R..DW
I I I I I I I I I I I I I I I I
QnJ
MlS ~E~.r., II" :: E + ,c ~ -= SDj/OD 11'1'11/:s
0.001 1t~:INl:> ~ ~or.trSIN&. W~"E.
Rffi.. ~O.()O\ - 2.~ c INti
I I I I I I I I I I I I I I I I
Figure A 1. - System frequency response - graphical data (1 of 3),
26

+::: .:: IHI;t...I:; ..
'i..
.,..
,. :.,..
!Ii :,( j":; .,
"., ..,
:!; . ,.i:tl jf
,.'
:,i. .... :c: I..
1' ! i .' .'tr !:! : : Ii I" II:: ,II,,,
!i: I::.", :I 11 ;c' I:
I : ! I:: Ii ...': i
I.:
"'... \ ':: .., .
13 OC-T SlFTNVL"f ~s.
'PCSmDM ~.'&. ONLY
TANK LE\lEL
STA'TlC..MEI::»UM
VAUJ£. R.lJN
SIA-TIC-.sMALL
VALYE RJ:)W
QItJ
MTS~E~.I6JTul): E+IL<;' ':: Scy'IDD lJ?/TJjs
0. 00 I H-~::I Nb ~ 4>~'-SINE.. WAllE.
r~EQ, ~.OO,- 2..1.\=t.IND
. .t +".-+
';i; + .+ ~ . t
' + 'f... !I:;
H'"
._.>-+++ ...
, .1::
... ,
Ii, ;:. iF tLi.. ,t+
+ : i i.i~
t: Iii:
i I. 'i;-T ,J: ;
,, +-H.
~~. .
tl~ ~:: ~ t
d.
"
,.,
.,.
H~
II;.!Lf:"
,
l' HiUJ.. ~t:. ,II!
.:::1;. .,. ,...
I ,i .. Iii: ..
":
.1.: +:1.. i..,
,t:It t#I
,j
I:, Ii..
t~ .:~; 'j It1 ," : q TIlTI
.
" , UN t tF ,..j!~~d~~1'~ +
11
1J~
"
mlii! 11:'"
~ 11 " ilium~. ~i: ~
Figure A1.~System frequency response- graphical data (2 of 3).
27
13 Oc...T B iFTNVL'Y~~
'PCOfllDN i=.!. ONLYj,l:-t; ~
:1: :... tt -.: ++-+-i- -:" ~..
~; .tI'
~
t
TANK U\lE.L
1!I
. Ii; 1] ~: I:;..
"' I :'" . 'I"
L ~. t;; ;::: ~ IiiIt:; ;
=-.H: t : 'E~
I' i<,
:
,
,'I;j'."
.
' ""i
'I): ~;:: t. '
j, ,
.., H j1 1. 1..1,
-,
t: tH~ .~ ~
,.-, ~H.H:tt~! H- 1
-1-,+ """:-
"F
-.- ---+->.+~ -,-~~
.+-'-. +.--
+p.
-'-H- -H-+ t+ .
STATIc..
M~IUMVAUJ£.. RlJN
c~ti j
f'",'1:;:;:. 'J~h ,;::Uh .
1"'Hdl' ~'.'8 II
H:J
1m=1+t1
jf'
. ."",t~...
..-+ < +-t+-j-++ .-i1..t. 'j.
~x:...
-H
".
H-' +4-+'H . .-+ 11H
j' : l
h 'i I fir ~:.:.:. It, E" "
,
".,', ,
:;.,,:, ,,.: ::::
:1: S: j.
srPrTIC-
,SMALL
VAVIE RDW
,I..i: rIO'
.,..tit,,, ;:
I,H
t ! :::
.,,,=,il ,
I,
,
!lj' f ,I t;;'i-:; j.
II'I jj;
++
Q,~ ..
fi ,',. J ji
r~,iIii ,,',I +"'
!iII, ,
Itj
:
I..,'d,
"
0
~ ~
1
I.
MTS ':>£2.:r,,~TII"= E+ILS,-= SojlOD mm/s
a 00 / ff-~ -L N'O ~ 4)0/.('-S,NG.. W"-IlE.
r:EE&.rnN6EaCVI-Z Ht.- INb
!;
~ ,II.
Figure A 1, -System frequency response- graphical data (3 of 3).
28
u~
..,
..
;. ~_:tt+~.j
:
"
I1ihi:!H1
,1:
,ii,lli"ff':
.-1. iii
""I: 11
','
Iii!,
,
, ,
~I;,;,;, Ii::
-i::-
I
;l~ ~j
: [. ..
m c.
t: i :
:iiII:,
'~ i : :
:i' :, ..".
;r:;
:,: i ,;(;:
13a:T B IFTN VLY IZ Fc..S
FLOW F"B. [;Nlj
Ie.L GQlJKp ~
SMALL -AND mlUM.
V~UJ£ SET T"DINT
D\jNAMr.. 'RDW
SMALL YAUf E
MULrI FUUtT/DN
~ANSFER-
D'INJ\M~ fltAAJMEhIUM YALVE
MULTI fUc.ATlm
~FE£.
QIN
Mn;~E2.~ :I:iro ; ~+I
c.So; ~",,,,fs
a /SOIl:c:TAl}) ~ s~'FOMffS
.-.
rT~'
t+-l.~ .~.
-;.-j
~+~--
~j
:
..
, rij-'
11
II:
" ".,: II::
,-,~
n
::1: :
+~,.. ..
il; ;c::
Ii'..
.~ -'-~ 1t
"
I':'
.
Ii i
J'- +.:t'
-
.-~ t
1:1'
t. -.
. ;,
,.-.i I"
",
H'
,-
;;:
"iil ,I
tt:
.'
..-.---.
". L'
4i; :)
-+.: ... ..,
:.iii I :
,-,
i;:i::' I
:! , ::1': .:;
,.
.. ..
,
._"
!ii : ". ,,: :
. ,,
..
:i : Ii;i:':.. :: §
;:: ::::'7I: ~: : :: : t'!;
,
i:-:': t' ili;.+--.,,'
,.+~
..:[ if,.,
crl"H ",.
fH', ..
;'.
.. ..I: ,,,
:.: Hi,.. . L:
..
) 1:
;j ;::: ;i
BRUSH ACt,
:i.', 11j:
, , r :'i:"
,
:r:
: ii".:
i,
: :. :: -~
'I,:i ;I!li;
:': : I
:i; :
1:::.
", :i.i It,v,:' I: ;
tn:. .,.'
t'l
It; ':''2 ,".JE'!i !ii lli: j#:tj
-,~ 1 ::. rh:. ~ ~
~r
..
j:. iilq !'
. .
jP: Jt~ I :I"
.,"
..
: j! i
:!i t tf t:: t 1
Ii-: pi'
...
Ii! m.;m: f;!r :~:;:~:
H. +
it ! fffi'I'I !~~t
Figure A2.~Kp Rangestep response- graphical data (1 of 11).
29

/30Cf S IFTN Vl)' e..FC-SFLOW F."B. C;NU
k::.i. GmK p C!ZJ
,
T
,
,-,
I
,~
1~ :1 -q-:-:1: ,u
~~- ij rt,....
1:;
-~~f~h !:
,.
..
, :: :: ~::
!' Iii
,~ u
-~
~H
,~
ii: I Hi
.sMALL -ANDW))IUM
VAllJ£ SIT 'f'DrNT
Ii, I' - : :1
il,: , :-,,:, Ii, 8-
ill~.
'.. jl, u:
hIi' ,.. 'j" .
""
,11 \H.:'
i. ~.;, :: :
...
-j : :: ::;
-:.
"
:; :
~ l~j
~ I:~: ::
.
.." ::.: ,
"
,-. ~-
:11 ,:I::
'If
.. , ~
Ie
c:'1~ j'-,
, ,~
"i;,
,
~
'
. OC
UH~ :., t, A
1i :-:...:
':. '
1', I'c~
D VN AM It. FLCW
SMALL V ALJ/ £
MULTI fUUtT/DN
T""e..ANS FER:...
- ~+~.-1,,-
",
. ~
t;
: -t d -. -to:: ! -- 1 t .'"-
[I:cIHi. l~j,
~"': I' 0
:j!"'" Ih, .:;: :: : ::', 'I':
, .u: ii'
ti ' li!J
H'Itr,
'0,:
"
::li'
, i~ ,::, : I ,/! ': I'
,
':;,
I.:":!!':
Ii:l:, :i,
,1L ~ :, ::" ' I'
, i
b YNAA/ULR.DV\JMEbIUM Vp.J.jJE
MULTI PUC.AT/tW
""ITANSr=u:
:: 0:;
:~I,I'" '
':'~,
',':
. ~
,~ :::
'::: I~..
i;;, I,
::i i,l
',' '",
ii" ',:
'0 ii""
II it; "ilt 0 . ;':; !i,
!i:, ,,
~, ~1:,
"'
H'
,-,
: : :ri[lii
" '"",-
ii,Hilln.:
QIN
~J~~
1'- : ::lP-Hi
1 ,1::'1 I,; ,: !!U::: l:~i i;' l~ I::: , iii:1ji':; .,
"",i dj'::1 -,:
"~ j 1 Ii ~!!I.. j!li.. I" .
lib: r ,II 11.::. I'
": i f
,: ;,;IF"'
j
:":"~.
{ '11
P"H >! T' t11 ", fl- :-!1
f
m
ill. ' ~FjI H f P Ht nit:,t:: J:fi ., H;
H H
,
't TIt " .
H ~ ~+ IT! :: itF""tt
~:'.:
:J ~~',': .. "+ ill
,
-
,
';;: f'
:- 1mlic. -:ie' ill !J:1ii :"H 11:1
'H
j :Mn;':.E~~ :r;1e> :;:jZ+/
:.) ,I.c.s. = S- (71111t'&
0. 15"0 ~ ':1A/b F02. SI!:T'"1'OIAITS .- ,
Figure A2. -Kp Range step response - graphical data (2 of 11).
30
/3OCT S IFTN VL;! IZ..Fc...SFLDW F"B. mLj
I(.i.. GQDKp C:TI
SMALL -AND w:bIUM.
\JP.UJE. SET'" mINT
DYNANlt:. ~LDW
SMALL VAU/£
MULTI fUC!.AT/DN
TE-ANS FE~
b't NAM\t. r:LDW
MEbIUM VPJ.JIE
MULTI PUC.ATltN
TeM6FE£.
QIN
N'f"!:;-::.EL::r:;. :J:i I D
:: EZ+ IC.s; 5ri1th1sa 150 H-l:.:::Mil> ~ SI!!T 'PoMJTS
i,.~ ):1:: ,~ H.,;
il e>,;T 1 ':c:
~~+:-r d-H~1~-+
~ll L- 11-,
~ ,1 it: Jt, lift:!:;" ~o f~,~j 1:-' 1~; +""ill ~b
;~
. 1f Ht ,~[II ... .,.,. 8!., ill
.;~,. ;~- +.;: '~..t:_:;~
!It, 'fl
,
"T" :Jl1C
.. jj'ttt:] . , i,d:~,
~ ~.!:Oc+- ! ,t:
. ...
l~:-:
m
.if'
-~+-..1. +-I--t~)1;
I
I, f, ,+
14 !
.,
I, .::n:-:j ,
1;~: . ; ,-...
ti::
u;
,
H,~..
irt:::~;4 -1,..;-
..
,lj
. ,~-
1i:I
f:: ;'JFi:: +.. .,. t., ,..,
,
h' ~
'IiF
.~ I ..
."!':...p -<;
.:.1 : !i~
iliiil,. ,. ,it I.
..:W' 'I
:ji
lit.f
-I-.,
II':
..,
,
.. .j."
iII.,+"t-ttift r 1: +-
t
"
,.H~
". ..
:1:
1I
:+:.. l!.~
11m,fit, I if , ...
.:..~
.
I"W;L< :..~. if:
H t1l',:
;
"t ' -' '
+q
"
Figure A2. -Kp Range step response - graphical data (3 of 11).
31
T
,+
. ~
'''''.f..
!Ii ..I:i
Ii~:.!
11;L
lIT
<;+4
"Eij1T~
1fT . iF:t+ .X
++,-i-~
'tiI, IT!
1!f;I:i ....,.
,. ~. !~ l:iF ;il;:::
i"~
,...!~j
;il :;,
IIrt.
rr~,., ,.
,..
I; t 1
..
/3cx:r B IFTN V!.YrLFc..SFlOW F"B. CNO
~L G£DKp GD
.sMALL -AND MEhIUM.
\j14U1£ SET" mINT
D'I NAM.\f.. HDW
SMALL VAUI£
MUtT IfllUtT/DN
TE..MS FEfL
bVNAMIL HOW
MEbIUM 'IP.LJIE
MULTI FUtATICN
TeANSFE£..
QIN
Mn;o;E.L::Go -.:J:it0
::: EZ-Hc.s.;; s- "'17/Js
0./50 ~ $Jb ~srrrJ'1olAlT"S
T"I
I I I I I I I I I I I I I I I
,.
I'tit f] : .,
- +-q. . ,
"+-.+,
+H
I I I I I I I I I I I I I I I
~
'-:: +;.:. :~-+ "~
Printed in U.S.A.I I I I I I I
."
. ,
,.
,"
ij;
,,:;;; I:';
I I I I I I I I I
lic::. tr'ti::[§lgi~ 11;:::1 H;< iLl
.:
-t .. - TI-I -{++tt:::~. ~ 4-::::1 +-+:11 '-:"i 111
."+
,,,,t:\ mi' j.i.i.i If,.. ..,'; I' L Iii I
HljFe 111 If';
,.
,,' .. L:..ti It lil++L:,
V tij!' -
ill Tffiffiti1tl8,ii, Hi!':! ' j'
f "rt::f'tTIT,.
~, r'.. ,.~ g , . ;,
m ": "., Hi' 1
j jl :,l:tll:'
,j
I''::
I ;";, ~
+'rr tn-;jjj' .~r tt-t
..,:::'
'
Ii, .,: :,;L
" "- tt-r
11
#t
1" I;~ ~ '.. ti:;
"It
'!, flit[ ilt: ,lilh" t'.. q;- .t Iiit:
I I I I I I I I I I I I I I I
Figure A2.-K Range t'p s ep response - graphical data (4 of 11).
32
H
riF ~F:::if..,'
.1H"
'" ~- H ';1',: :... i
ii ! [E, gf i Uf: ' Hi:i,
":..
I' :: !E "I .. !i ' :
ii rni .. Jj; : : H i
I iiii I :j, 'l t1}!
", ,
;
": I ' +m, :
;"
,
: :I :~: :
Ii !' I'; : : : I . iI'i
':': :
I : : I::::'" Il ::; : i
: :Iiii ::
: 'I
';
ii:: i :'
I : .,'
f i : : , :: i : ;
iii :, : :' ! ,: I,
'I, : :'::"
: ;
'tF : ',
,'" T Ly :: j ! I::: ',: i ': ::
;;:: ~j; ... jlJ :E~i iii :'
Ii' if; ,!:Hi)ii !l' )~
I I:' ~,Ij:iq!p f.I- ..,
..'"
I:H if! 11 ' Iii ;:! ii; !UI j"..
'II ji }Ii' i,' I;: j:! i';f ; :r
..
ii! :1: i! i:' 'ii ii # "..,.. ... I: , ~-:
IH'
'n "'.. I
Fi ' Ii ';'" " I :.. ,11 m ...1: ;
; ~~iiiii ]:! !H' .;]'"
.. !
Iii . ;;l H: ';, jj !!!! h:I',j
/3a:T 81FTN V!.Y ILFc..SFlOW F."B. l::N.U
k:.L GillKp G!J
I I I I I I I I I I I
.sMALL -AND mlUMV~lll£ SET' T"DINT
I I I I I I I I I I I I
'if fii:;,
l;~' ,::Jilil@ 'i;:
r~,:.
f F ,ilf:i:, r!. jJ ." I iiliilll11:' "', 'ii
~. I'
;rt~H liT,
;
".1 t~: i~:
D 'IAIAM~ RJ)I}J
SMALL VAUfE.
MUITI FfJUtTIDN
TE..ANS FE~
i' '
. H++--
II.
H;.H.""
.. t..
I': ',t r..,
'1::::, :."::i Ii: ~: 'j:
... ..
I I I I I I I I I I I I
D'fNAIMIL ROW
MEbIUM VAtJlE
MULTI PUC.AT/tW
~FE.e..
I I I I I I I I I I I I
QIN
~~E~:r;. :GI"
; E.+/c.s; S"l11in/~ (2JO. IS;:; If.c 'JAIb F02- Srn-1'CMRS
I I I I I I I I I I I I
Figure A2. -Kp Range step response - graphical data (5 of 11).
33
..:;: ',y : I -"
..' ff .:~ t'"
t:~cIt!!.. .! I, ;:i:m:
""
~.' ..t+:
I" "ti: ;. Ii. tli to
"
Ti;: ':::; I:
I"~
(!
"'1:;: }
O' "I
Ie"'.
11
[1; : ..fi:
"t
.,1
..' Ii
'"il
j, Ii: j" II ii,I
:1' H::
:;: ::1:':' f !Ii
m"'
.i::j:;:;:; h": ""...,f~: ,:t! lIh
it ,. +. 1f~..i,( \' ,' :
"I '"Ii
Ii;i:i:i: ~1 F W f1: "'H
t' ! Ii II..' I
'; ~i
r' ..' HI:
"..' '1' .'
" L'. ': ;
lic I;I; '.'~ ltlt"
1f;
",I: t::' ill: t,il I I:;; ;fTll .::'1;
;It; "
.O'.., f .. 0;.
11 Ii III,'
'';1:
',;" \'" "T
land, Ohio Printed In U,SA,, ..'
Ii If 'ii
.., :': : I , : .. ", ::::IIh
Ii. :!il." : 1
':."
:,: ! I :"..
", ".., : :' !
"
::: IlJ.. , ,:,
II,:,
: I i il : '" I."
.. : ::I..,
.." i ,.' I ': : .. i
'I: I.':
"::. .:: : I: "
; : ':: "III
'f';
, .. I:f' ; ::, I '; :;, r ,,'; I
: : I
',;' I::' O' : :,:" '.: :
I '"
'"
II
" i 'c- , I,"
,:"
.,: cc-I;: ',:1 :, :.
;':"'"
:, ::':1 :: II I,:. :::; :
I I I'
,
~!.."
:: '...."
II. '!I: .,!"... ::,
: IIU+-';;1 I:; I;; I, ji,:'.... 'I
,,: : : ::I:.' ,'. '.. : ~;
:11 .:, "i"
..' !:;
'I; I' I" "
j.,...
I' .i;
tIT
.. : 14' Jt! ii '~;
ii f ' '" i'!.. , ::1 : +:: I1" 1 qj
, .. ~,
~r"
j. : '.. : : [!i; :!; !:;I
", H:"
:;: "', ':::
" ""I;: :"
'"r '
,~, ,
It< ," '\;
1 I:
fl Ii!; '.. : II:
" ",";', III: ,;1 '.,--+ Ij!i i
, ,,
13a:T 131
FTN VIJ Il..Fc..SFLDWF"B. mu
~L GQIJKp ~
.sMALL -ANDMfbIUM.
'J~Ll1£. SET" '\?DINT
TY:iN tUltlC- ~LD W
SMALL VAUlt;..
MULTI fU<!.ATfDAJ
~ANSFE~
D'f NM\lt.. f1.DIA}MEbIUM VPJJIE
MULTI PUtATltW
TeN6FE..e.
QIN
M'i:;o;.£2:.~ :I:iICO::: ~...f-I
c.~";. s""mtn/so~ ISO H-c ~ FC£.
sen-'POIAHS
....I
Figure A2.-Kp Range step response - graphical data (6 of 11).
34
- f-+-+-+-- I I I I I \ I I I I I I I
J -q H;~
; "
I .. ., ,- ,.. ...'
'-It,.
'~+ -
...'''
,
" "1I::' i:
f , _.i'"
-,... ,...
II;,.."
: ''OJ:;::: r:: ii"I: ... ,. 1T : II,. .
:: III, '", i::: i,..t
",. ...I:, ,,
1m..
ti; ::'
,,-
, :,I: I
-,,h Hi[~Ii q. 'i
..,.:::
,., ;
-,..
ili"
... q
"I, ..
: I".:: : :,-. ,.
".. I, ::,.
'. ... i ," : ..: r :,; I ..
': .:.: ';'-... q , ..
,
, /1'1q
:.: II" '"") Ijl) ,..Ii: I::: ':'.
~:,. : .. ;:I::: ;,..
q..
q
il. ,I. ;) :'q : :
ili.. ... ..
i.: :
: '":
'I::t I:.
;'"
,:::' I
':I, ,.
" :"::".'::: I::.::
il"~
,..I:
:''' !'..;..:.,,,
" : III.I:' : : '::II: ,.
;'"
.' --+--
l,; :r1:. ',Ii P~iI:. . ~+~
:r IliH"
I: ... Iii::1:
:"
,', : I.,. :1:- -1-.."
,'.. 'I
~It : U I,:
1 ,.. :~r ....
1 " H ! Ii.,
:; :
" fit .. : Iii ...
U. 1111
j .. HgI ,..
i:.. !il. :i i
h ,,8+::1 ,if I ,I "...
~.:.::liill/111 :,!! Ii: I I;:: ::-
':...
,
/3OCT E3 IFTN VLY IZ..FC-~FLOWF"'B. mo
~L C&DKp GD
SMALL -AND 1I£b1UM.
V 14LVE SIT 'f'OINT
]:) 'INAMlt. J:lL)W
SM.ALL V AU! £
MULTI FtlUtT/DN
TE.ANS FE~
bYN AM IC-n..DW
MalUM VAUfE
MULTI F'LlCATltW
TeANSFE£..
QIN
Mn;,:E~-:::u. 'Ii I C>
; ~ + Ic.s.;; S"mm/s
0./5"0 H-c. ::J;.jb FOe SrIT"~AffS
"!""
Figure A2. -Kp Range step response - graphical data (7 of 11).
35

,
-,-+-"-4.1:
iff, ~::::
p~ h,.
ii. 1 i; ~:liE.. .. .::'"
".... £~~ .~ .. , .. .. : :::...
..O'
..1-, ... ... ......'. '"
p; :... ::::'"
.:.;: ;;:
"J " f' ! j!1i 1,:
,..I) Hi .. ...
": : ::..
"+"
1: ':r .. ::'
:::.. ;;! 'F :: n :;: i:.1.!..
'g .. 1:1 ..'
: ... i""
.. .,i ~=:-11 fl~ ' !11: ::PI:
'''::: : ,. :
f! ::: Wi :::1 -r tlj ...
'Iiii..
':.;;::
:f .. :::;
10 -I.~' 1 : .::iTi
o'..
", : .. :, ..
~!::::;:.,
.'~,~ ; .. :
~:w.
~~! : ; ;.;;:
¥ ,.."-+-1- !....-
;
-~E~. -t-,-. .. .. :
;-t-. : ..' ii;;.. Ii.,~r' ~"-I-
c; ;::.. I :3.
Hi "
::.::
H:1 : : : :
it I ; I 11 ti;:::: ~~:: if ii'I : :::
.. .. : : : :,. Ii :"
::: i0, ,
if:.~.
1'1: Ii:::: :.,.
".'. .. ..
I; ,..I:;' f'i .1:::: .: .:: r I'... :: :
:i .,. Ii: ;:: Ii ::: Ii..
I" I:::i;:: i:1. .. ... .. i
, " ,,. ;;j ..
i : .' i.t' :::
.. : :
ii: I : :: :::. i: : II: i :.
I:,. : I i'.. : . :
ti.. .. y~: ,... ... ..
I::\:. .:: I:: ':.t: : I,' :::
,
J '";;li >". t.,. .._, ..
; p:" :c ...
H:.
" 1... ...j;
'j: j,ll ,..,
Ii lIi;11 ::1t. /:::
"., ..,
.. , t iL tiii,. .. . ..
+ ;lbi I: +:::
H ' '" .. ,.
t +~;;" F' II" ::;;ltH' :1 +i;.. + +:, i .i.t
; ; I "..
..."
..' H-" ...
, ~j1" !" I',i: 1::T I
'. " '1'+ (m t ,~!i in
"
@r-d : i;:
,,
13a:T S IFTN V!.Y fZ..Fc..SFLDW F."B. t:N.U
I(.t GQI]Kp GLJ
.sMALL -AND IftEhIUM.
"~UJE. SE\,mrNT
:DYNAMIL r::ww
SMALL VAUI£
MUITI FUU\-TlDfIJ
TJ:::.ANS FE~
bYNAKI/~ FWW
MEbIUM VPJ.J/E
MULTIpuc..ATlm
""T"eN6FE.£.
QIN
,.<.(j"'!;:£~::::u. :r:;IO = ~+Ic.'s.; s'mmt 5
O. ISC #r.::];./b ~ Srn-):cIAR'S
I I I I I I I I I I I I I I I 1---1
CCUCHART Gould Inc., Instrument Systems Diyi.
Figure A2. -Kp Range step response - graphical data (8 of 11).
36
/3cx:T E3IFTN VLY ILFc..s:FLOW F"B, mo
~i.. CQI]Kp g:]
-SMALL .MlDI&DIUM\j t:\llI£ SET ~D'NT
DVNAffl1l: FWWSMALL VAUI£
MLtLrI Ftlc..A-TIDN
Te...ANS FER:...
T:;YNAMIC-ruwMEbIUM YAlJIE
MULTI PUC.ATIIW
TeM6FE£..
QIN
MT'!:;~E~~ :I:i'o ::::EZ+/c.s.; S'~"'I s
o. /5l) H-r.-:];.Jb~ ser~AHS
.,...I
I I I I I I I I I I I I I I
::~ fm
.. ..j. ..>-...
i;
:
!ii
."
HI.,
",
"
"'i,; ~~
i'
..
:;:' \'::.,
+Tt.
...I::
':;;
:;
", ;:: .. ...
:::: .:. L
,..
."
,I.,
":
...
:j:
,
: .."'1
.1
I..
..'
: ,.
...
,..
.::
'I:
~::; .. ,
",: .'
H. :::i
I:'
':'
il: :
I"
-t- t: ,,,
:11
~.~;-t
":",.. .
J::
.- .~ .+-.
1,i;;
,
t!If
",
+-+.
I:: I::
.kIt.
...
II
...H ;
:.:
.. .:::,
:, '
;" I::: . .. Hi
1111 =! ';:'.
.."
Ii...
i.: I'U:
.'.: I::
II': ',I \
, I::
..'.'
ilI '!,
t. 'I
".
JI. ::
tI'"
Figure A2. -Kp Range step response -, graphical data (9 of 11).
..'... ,:
'.,:I::
... ...
'.ii;.......,
fHj
I.~.
1: IIU
~>- -+-
I".t!!t~:
';1',;:... i~~
.
::::'". ,
"Ii:
...' t::'. ..
.', ,..
:::: !!., :Iil::
;,:11'
i
'.:'..,r'.:,'
I I I I I I I I I I I I I I
:: ,.,.[il
:i .., :
~ :.'
!:
,
37
".i ,;'. ,.,
1 :t ..-
::1...
,II. . lii
.. '::
" .,....
,.i:~j
..
[Iii . ..
1:1
."
'.. HiI!
;iil'
H.:; : Ii. ':':,

t.;....j::j: 1~ 8" :r di 1'--
}-I. tii IF.: : .....: - ,- :+. : . : : :
+-<-. ~...t..+, H H : .. -fT:-
-" Hi..
i ,I .-.<.
'. t;: r;;:: t F ' t: ifr :~;; : .. ,Ilit :
" ! tt:.:::,- : ..': : : : I' -- 11'::: : It
:rc+
: : : : ,- I I::... ..t,:: -, : t :
I;;; :i : : ::: ,-
;ii :;
t+-j-+n +,1 HiI:;: ".
,~' m: it, 11
i"
-. .- : t.. IHI t'" Hi ~I
..,: H:.,... .. I , ~.t.~. .. .. ,
..t .:1h+ tr Hi :;:1
I; tt;t+. H ,-
II=: + I : Ii! Ftt
~',
,,++-,-
"~..:;: .,"'
.1 I;h ;.: r I, .."
Ji .., , +-p .. : ~Ii" : It.!t : 1. .r : "
I
: It; 1" "t. ...
I. .. I .. .. ,.
: tr 1- , +H r~~ fi',t
t" :11 ! ~~~di if: iili Hi.. ': ..-
/3CCT S I
r=TN Vt)' ILFe..SFLOW F"B. Ct-l~
JG- GQIJKp G:3:]
-SMALL -AND MfbIUM.
VA-Ul£. SET" T'tIINT
DVN4M Ie. R.DW
SM.ALL VAU! £.
MUITI FUUrTIDN
TE.ANS FE~
bYNIWI ~ ~LDKJ
MEbIUM VPJ.J/£
MULTI f'L/C.ATltW
~FE.£..
QIN
Mns~E~::u. :Li,e> ::
~""'"
C.s; 5"''';'/f/!5
a. ISO lI"'l:.:rAJb R:>2- Srn-'FCWTS
I I I I I I I I I I I I I I I I I I
I I I I I I I I I I I I I I I I I I
~ ,. tti,
'....~- n:
~IT
II',,I. :::' i.1:' f ,i:..~,I .-
~j;i; r;E .~ 'It
...
.:.1 t-tH
I I I I I I I I I I I I I I I I I I
,-
. ..
. I..j,
..,
b: : .
""
l:,I, ~.,
.Ii .
:: :
jI'i
:Fi,: I: ;, : h' ','
... ...
:', :"
I I I I I I I I I I I I I I I I I I
I I I I I I I I I I I I I I I I I I
Figure A2.-Kp Range step response - graphical data (10 of 11).
38

/3OCT S IFTN V!.Y I2...Fc..SFLOW F."'B. c:N.U
JG- ~Kp D:J
-SMALL -AND MfbIUM.
VP.ll1£ SET mINT
tNNAMIL RDW
SM.ALL VALJI£
MULTI FlJUtT/DN
~AN5 FE~
DYNAMI~r:LDW
MEbIUM VPJ.J/E
MULTI PUC.AT/tN
~FE..e.
QIN
Mn;~E~::r:;. ::r:;,CI=:~ + IC.s; ~lfImls
o. /50 #c:IAJb ~ Srrr'FcMHS
'{;1+:~1:
ti d.I; . ~ ',.
[i' H.~'Hi
I;:
I! : 1 .;; ~
~: .-q it; j':1;;
,...,
-'I;:! I::
I t::::- r-j. .
..T
' 1:,~t,
...1". t -
r', H .
1.
Figure A2.-Kp Range step response - graphical data (11 of 11).
39
.; f': 1U ...:!i ,.
"Hj
I Ii! Iji !I;, :~-:};
": 11 4ii ::I! Hi! : 1
..P' ..
,,
,,,.'.. ; I',..., ,.
Iii ' II'.:: :: ':
...1: 'j,,:.
: .."
, :..1"
,:: ,:~i "
.. ..IiI III
::;1: "
:,it I ..
",. ~; II
"p. ..
I" II !Y !i : l.,. .." t':1 ,. ,...,., ; ,
::: i I:HI: i; 1
II , , J: .,. ,
'l ~I! : :;/ 'I'
..;/i; I
I!I',, .. .:
" Ii lP '1 ill, :,'t,', ' C il '::\"
.'I'
,,
,, @ , qi III!HI .1i'1'
'i :! ... I !I~ !Ii; III , I':; ill; ,.I H: :It I 'I'
l , t -~. :"il: :"'., :ij
1:1 I'll 'i",'. I'
: ..
: :I; ~Jlfj ,,,' '!~I
,. .,.. 1.;; ,1
itl"
.. ii , ..;
iii ,t j; ::\ 1:..
",'j.
;;! .' iHt .. ~-_..".
" ,i I;
' ~':' 1;,. t: r iii +.....~,' 1Ii
"ii: i 11 f:f '
". I I: i::'li!i: : Hi ,I
13CCT S I
1=TN VLY 1Z...J::c.. ~
FLDW F"B. Lf,J.lj
~i... 1.0002)
Kp G£J
-5MALL -ANDmJUM
VAll1£ SET "rDINT
b'/NAMILFUJINSMALL VAUI£
Mil IT I FC1U,TIDN
Te...ANS FE~
DYNANlIL. fl1)W
MEbIUM VAUlt=.
MULTI PUCATltW
TE1WS~
QIN
Mn;-=-E~~ :Gte:> ::: ~+I
c.s.; s-"'m/~o. ISO Ifr. 7Aib FC:>2-S PEr "PO/AiTS
,I
, ,,
r ;t-t ";(1
.. . :-t~r" ~ .h: ,L~
!; :f.t.. I',.
!'f
'j:,1:
"::11::',', I:.I;;;
';'
I IHI ;i
.. ~!~
"
'" I; ;:
I ~ : ; t
I;::
,
l'.~
'J.jT+ "}f-t
I-
.1-"'"
, ,: ;:::: j.". It+~- .
+'I"
tF ~i:
Iii :~:,,;
,,11..
it:
"it , ~ '~:'+~, I-
'i~: ,£It
'f:!-..,.. j
'T if;:,.11
".
t"..11 t;
.. f: H:~: ~:: i~:. li~,. I::
tJ
;' I" ,II :::m. Ii',.. , ,crt
Cleveland Ohio1ent Systems Division
Figure A3.-Kj Range step response - graphical data (1 of 7).
40

I 3 O(:-J l5 iFTN VLY ILFC- S
n O'J'JF'B. CtJL'j
~L r~O(;O~Kp GLJ
-.SMAll... -AND w])/UM
\j t\ 111£ SET 'f'CJrN-r
1)'1N A~t- ROWSM.ALL YALV£
MUlTI FtIUtT/DN
re.ANS FER"
DYNAdlILrwwN\EbIUM YAlJJE
MULTI f'LIC.ATICJJ-I ~. ;\t>t~JT~
QIN
M'T"!;,:E~
::r:;. IiI D ::::E:-I-Ic.s.;; ~ """/$o. 15"0 4'i:.:;J;.Jb ~ Sf!!r"POlAlTS
+-+-
"!i..
I:,: st 'I ;~;::i!ii ;iiEili Rf,
"
, 'Hi
Um-
.-.,\. ... ir: ,..,., t+-
.-.,... ;
..' 'i' +tll .. ~f!fL:pi F:
~:::..'. ~~Hl
i'IE !
:i: i' [fi j~ Li:ti: :! I :n ii!i j
." +, tp.. ,.",. Iii: !i:: [:;,
I'n-
iii: ...!:
',..
t: ;: :::
.' Ii Ii. ifi: II: ,,:
;: :"
,,' I::: ..,:"..
r't'...
", Iij:j ;
I'
: ~~.." ~~i
.,t. i
i:i: '"..
'1o!-
..' !! P,it: I;:: H
f': .</ t t..' ,."
illI':: : !: :1~
-+-, ,, ,
ii:
":1:::' 1:li
..,.. HI!
fr;1:::g;i A~ ;.;..;~l:i:::n;: ".. 't:n:::"H-"
F:!:::] 1'1:21.,+"'".. fit)+' ..-dfifi' I', th..
....,. 111ri.': if'
j';.: r:
'.. EO
i ll~ Iii lid '" .11 . ffi:,H,I: ~"hfl im if,
,~
II'~
.
/3OLT B IFTAJVLY ILF~ s:F LDW F."B, LN.O
~i.. 1.0021Kp GTI
.sMALL -AND mlUM
VP.llI£ SET mINT
mNAMIt. FLDWSM.ALL VALJ/£
MULTI ffJ<!..AT1DN
-r-E.ANS FE~
l:NNAMIL FLDW
MEbIUM VALVE
MULTI PUC.ATltW
""TE.MlSFIT..
QIN
M'n;':.E~~~:r;IC> .=f?".-#-ICoSo=~n,mI5a.ISO ~::]i.Jb F02. SET 'Ff:'JIAffS
+-+~
f! :~
. t-,
-..'"
Ii:if . i ltL f-~~l.f
-+ ";,i W t:
'. L",.H-t
i~:- .>: +, ~-:r
13
n
Figure A3. -Ki Range step response - graphical data (3 of 7).
42

, ,, , ,
fi4+--t'$.-
ill m G~.+. '"-i.E ...
".~1 -:~::! ... : .1,+i ) -I.. f f' 'fi; i§if 11: f II t n
i~tIT
H-t it Hi 'q
";:r: i~H- i-H-t
f"; '.j,
~h i8t:
)i L\ !;
V It!! +"~ii..
". ,..
'n ',- tl-+,- p'ii; .H: ill L Iii 1+'
"t:
.IIIi II: ;tll
I Li fj 1': +'Ii; Iii He.,- ... .. t1:
,..i '
+-H '-,..
'": I I,: !!: ,.. : :
~*+H t:1 n' tf,-->-...
':14
-'.iC,
i'.'- ~.++;
md ++ 'r' T
'j
+ .. 1 +
"
M'f IihtillJ !-p
: .,fi ..,
: . :;:+1+
I"1t!:;
""!
"t' .
+,.
t Hi: L:
l' Iti1 i ~-W: ::t~j~i
+ H... .,
1 !! . H' , ,
t""'"+. .. ;
n + ;"
;
": I
t jf1,
T+.....-if: .il
,' I 1 r ;... , . ,
ii iH j
H - it+t" ,-.. + +
~! ..' fii
." ": lit
"t t ..
: ," t'; 1-, + +H, ,
/3OCT S IFTN VLY fZ..Fe.. sFLDW F"B. Cf.!l..j
~L 1.004.]Kp ~
.sMALL .AtID M8:>IUM.
'JA.1l1£. SET" mINT
DVNAtfllt. f:WN
SMALL YAUlr;.
MUITI FUc.AT/DN
TE.ANS FE~
D'fJAmIL PW WMEhIUM VALVE
MULTI PUc..ATltW
-n:..AM~FER..
QIN
Mn;-::.£~~ :r:;,c> ::: /Z+Ic.~; ~l1/mpi0.. IS(:)I+c.'$.ib r=oe SET"'POwTS
; ++i .
!;il H t-+- +:
H
+
~," f
+
',ffij:t.
+->-+
.1-:
l :: .4. '+:
-cr g+
+ +1#
,:; H,
-; +t
+:
fJ; ':rr;'~;: f: tg~ .''',
Gould 'nc., Instrument Systems Division
Figure A3.-Kj Range step response - graphical data (4 of 7).
43
/3OCT S I
I=TIJ VlY rZJ=C!..~F LDW F"B, C1\J.U
k:.i. G2lJKp GLJ
-1~-"i.,-,-: .;+-+ - t-~--; -j i- I
'"
;.1)
+
..sMALL -ANDMEbIUM
V&:\UJ£ SET mINT
. ,"
,
1J¥A1A1fJ~ FWW
SM.ALL YAU/£
MllITI fU~T/DN
TE..ANS FER:...
,.
t---+-t~too ,
,.
])YNfJdIl~ r:ww
MalUM VAtJJ£
MULTI PLIC-ATIt.W
~FEK
F-; ::-! +++'-:
n:: [".ii HI f.
['r :ii, .+.
. . . ,.,. .
ii,j",..t.:
H
'"! i~
. -~,
QIN
'"'l'.
r:} .'.
I- t"~.+,~
P
-t-i +
+ :1,
':4 t 'j.
Mn;':.E~:L :cite> =- ';:-+1C-s; !!:tnmJs
o. /60 l+r.::[;Jb ~ Ser"Po/A/TS
r-!. +t, t j-...
!
Figure A3.-K; Range step response - graphical data (5 of 7).
44

13CLT S JFTN VLY IZ..Fc..SFLDW F."B CNLj
JC.i.. 1.02.1Kp GD
.sMALL -AND mJUMV~UJ£ SIT 'f'CrNT
DVAlAdllc.. RDWSMALL VAUI£
MULTI fUc..ATIDN
~ANS FE~
'tN Nttfllt!- R.DIAl
MalUM VAUIE
MULTI PUCATICW
"Tt.Pl'6ftK.
QIN
~~E~:::I:4::r:;I 0 =- ~ + /~.I:c.s= 5"'.",/50. /5"0 lIT:.::];Jb ~ SIfT" 'Ftt>IAffS
-+-+-t I 1-+ I I I I I I +_u+.
_I'',; +t",!
j ",~! ,# ~;;-t"i ~:..
J. ,.~.~' m:.: :.:
.j.. .. --, fffin! .Cl
", m")! ; i':,j ,: 1r '~:
Jl' ~ .. l~ H +
;"t Hi d~ 'if
1.1
,.
:j-I
tJt
j !i t t iff -r n~ t+ I': h
,t ,tj ...;!
!hH
it , :::'
"t, ,11 Ii:
'",.
';1"1 !'ri,:i;; ,it -W:lID -, $: I:;: 1 ii
Ht .[1 d;itW fit.; -m
uam:: : t 'Fi;' :lj t;:
, , , ,
~t r
ill F'H. ,: ; qj #i,
4: flhri+Hi' tf:" jilt-,t-
t+ th-; t i ; ~,.
,- 1': lFA,' :,.c~
"a r:-~~n)§+f++ +
I,gj t: .4"+ t .1 "I :'~ -i--).t ! L
~.. I'-t
'T llil H-
.~
+
t-' i I. r
":
: .. j' '.~~ n:';
~:.
+ :t1 :...J-11: ,.. .L..
." "I.Tro !~ J~~.
~
, r t
t Ii, ,
: I.t ::'
1-;:-
1 tL p-,r.
..
, t:"ffi '
,
1 if'lt:; I!; b t
,
.m tii !iiii1[jj: 'j +j..,
iH iti t iii Ii Ii;: ..; i!: hi ii: 'j;; if Ii'" ,..
r i', '!,;:, ,.I It: W - '
; :: ;'ll ~I
,I,til'.
! !i,'. 'ii ~ Hill ",
i ii: ii' HI)!-!iJili! Hi j'"; I: !E \; ~ t:: 1i\i ";
: ti~ \1;". t".
'H" ii'; 1 .'1:, ii!.,' . '. ,,
"','
;
Ii; 1::;
t -; I~ '-t'.;'. t. ,H-.,iil!
pi i;i iit~ il! 1, iii H. Wi lit! n ..'
q,
f; ii:;,..
.. "ii;
11:I::
:,
,.
.... .~
;iI:
jjjd..
..111 :
.. i~ ':. . , .,
1;
..
I'i::
t iIt
'11 . 00
. ,1~f~r HfJ4-;' T f~ ili,
.
;'i
, ,I
a
": :q: Ii:'q ..';; -;-;: it;,
t ~ 1-.,
. t' 't if! .. 1);1
'" '+'-- 11'T . ,+ . 1 J'V
i: f I"', -'
"'j
III'.
I, I
t
I 11 .,
Figure A3,-Ki Range step response- graphical data (6 of 7).
45
/3a:T S Ir=T~ \.ILY 12..f=c..~FLOW F."B. CNU
~i.. G:IDKp c;n
..sMALL -ANDWJ:>IUM
Vl.\1lI£. SET mINT
1J'/IJAtflIL I=LDW
5MALL VAUI£
MUITI ftlC!.AT1OAJ
TE.ANS FER:...
DYNIdIL RI»J
MEbIU M VPLVE
MULII PL/CATltN
IR..~R
QIN
Mn;~£~-:L :rile>
:; ~-+IC.s; 5mm I5
o. 150 Ik. ~ F(:>2. Srn-1'f:»AffS
Figure A3.-Kj Range step response - graphical data (7of7).
46
," ii#. fim - ,gf =ffi ,t: m:l;-;: lis ' "+.
'I~+
" t41j.~,
n' !H: m:1:11 .:'1. .' ,- ii'lifft~tt -.)
m ,Jf tifi ;;- 1 ftf £T~t t '.'1rJiW\ 1.1'(If tq ; l 'i
',", 1;1
H-t + ,I'1 !Jt : :l t 1-'~: .J:"
J!\1 t Ht~t,i ~~:;J
:t ! ! I ! 'to...
iI; :: jil !
". ,', ;
": i if
" ' Il" i'"f
i' "
,,
t i1B#
ffi' 1r :,!...,.
Ilf1lliff. +.;- I'"
-;', iS,
H ,if illl :tt: .. ,- ; rH\
/3cx:T S IFTIJ VCi IZ..Fc...S
fosmON ANI)R.lNIJ 1=.E.
~i.. 1.02.]Kp GL3
TANK LEVEL
'DVN/Me. r:lL»J
5M.ALL VAUI£
MULTI FUt!..ATlDAl
TE.AN.S FE~
f:l'o/NAMIe.. FI1Nl"
MEblUM VPDlE
MUUI PUC.ATItN
""T"eN6FE.e.
QIN
Mn;:£~::G~:r;,O":;~+;s()1
MMI~ \C.5;=.~NIN\f'sB:-C {ltJO /' ).cZt:JIIT:.::J;.Jb ~ SFr ~
S:~4I(.J.4E:/A/Nr
I I I I I I I I I II I I I I
I I I I I I I I I I I I I I I
I I I I I I I I I I I I I I I
I I I I I I I I I I J I I I I
'I
,"
I I I I I I I I I IJ I I I I I
Figure A4.-System step response - graphicaldata (1 of 4).
47
~- 1f! :1+ 1 " t tc+t !I .. ,. H ,
Ii ~1: I."
1 II
It r:I Elt t
"i .
" ",f
; . ~.t r .,ill.
:: :
III " .. 'Jirt;. , : .., .."
*11i-i,+ ~111m ~¥.
;jf~ 1 1
: : !.1!r 'IiI-~
i' liti r t. ff !I
; ,, -+1; W tm m. Ii."
13cx:T B IFTN VLY IZ...Fe..S
F'OSmON Mb R1:MJ1=.!.
IG. GEfJKp GTI
I I I I I I I I I I I t
t::~ ;' mi,;; ,,);:":" ,Im
!.lt
:,', ,:
"m; :': '~}l : i ~..
1'.~~..: ~t: '~:L ~:T H
n..E ~~.: fijpi&ft f" ,0 m 1In 2:j,
., +::1il! i1jI
II: , ~ Hi it'
" ! ii" '
!P 11!
-.I,"1::
!I:.
TAN!( LEVE L~ ':
'r:.) i I 'i,
IW -
fi:frn m jji"j I I I I I I I I I I I
'D'INtM r: r:LCJJJ
SM.ALL VPJ.J/~
MULTI FUUrTIDN
Te...AN.S FE~
I I I I I I I I I I I I
I::NNAMlc.. FLlNVMalUM VPJ..J/E
MULTI FUc.ATItN
TeANSFE.£.
::! i
it I' l:1iii:
H'
,;~'
II
in 11 :I'
,
t"1i I
iij ::; ii:
:1i.i ~: ;: !
!i 1'll:I: ,: i:':i i
.;! i ""ii,
. : ~~ ::!
! ~:: ; L '
i.I,.
Ii, ,
,. . t
fh:: i:: Ii :<, r: !::
I I I I I I I I I I I I
QIN
Mi"'!;:£~:::r;. :I:iIO = ~+,
~ ' ~1~.-: L- { 6C I'«>MMc.s~ """"r-."z.o fIT:. 3'AIb F02. SrET"Pt:NAIT$
~~ ~ IA/NrI I I I I I I I I I I I
FigureA4.-System step response - graphical data (2 of 4).
48

Jill illlliI ; :. *tfin t~.
H~~ ,;: :crt 1 ili 'Iii;
P :H
" ht ,. ~.+-~ .!', ~"+ ,. ,
:~~i 1[; f!! !; ft 1tt m" !.: '~"
Ini t~! l~~~tttl.h ar' It ! t. fiT! .it i:
"it\r ~1 'g , f!:
,,' TI~ ;
1'1' :, 11 i..+-' rffl 't,! It II!
~I:::1" ~f ~i", IIT~,I;" "
",rm ~:::: jt' ' i:-.! hrl ~:,...
iFt'+1 :1: qr:
:" ki " Utf tH !i; l:.t W.."
.. 'I!,..,
'.. 'le T'< £[ It: fill,-I ,-
".T. j::;
~:g fiii
!f.W H,
:;t: 11;1tT,."
; ct; ::-1.
H: "r F ,,1 Ei."
+.;.
,:-H ii.: i~ E:!- t' '" i~1ii!
:f' 'r' Ei' .;;"
,,, :
: Ii; :, ~i tl tH' "
'"
j.-~'",. .H
" 't'II: : + . I ,.
::1: II [ii'~I' ji'i
: ,:I::'" "
t::;
: :tl:,, 'ii: tI:: t
"
j;' I .:0: ti:~: 1 ;
: : :
"
:;, :::..; ; t:
[~ij Ril 'H [; fii"
,I, .. ~;..
";
:, : : H : '
; H., : .. :,,,H
: ::ii lei r" :::: , ,I; ::: .
I ; ;' , : II : : 11:1Iii,.
: : I : : : c: ;'I: I , ;
!I' E"i:: 1 i
:'" in! j;
~;i .. :1-: t: : "IU
;
/3a:T S IFTN Vl:I f2..Fe.. s
rosmON AN!)RDN i=."B.
K.i. G!:JKp crJ
I I I I I I I I I I I I
TANl( LEVE L
I I I I I I I I I I I I
'D'IN AM c.. r-LLJAJ
SMALL VAU/~
MULTI FU~TIDN
~AN.S FE~
I I I I I I I I I I I I
D'INAMIC.. R..OJtrMEbIUM YPLYE:
MULTI PUC.ATItJJ
~FE..e.
I I I I I I I I I I I I
QIN
M'T'!;-;.E~-.:u :Li,o ; ~+I,,/. .1. \c.s;'S-IWtAfss:- ( 91/1)0 MNI/~..J
.cz.o~::];./b ~ SeT~!f!:~ ~ lA/NT- I I I I I I I t I I I I
Figure A4.-System step response - graphical data (3 of 4).
49

," ~_fi Hi " t,tt.t~"
<'--~' ."iF !~;'
ee:;; : :.' ..
"H.i. j"
t-.;.......,=11 t":t 111: I::~
",. j;: ! ,;: "
,::'
m
,.
"" "
;;1
"/'
1,111
; : ' ::
""
"
,: I
rf: ;v,,,di I;
". L fi;11'
"
,.
:. n ;11 :1''
T ~il
"
,.
it I-t: Ii:: ilI'" ~\:
:i':..' '.,
~j". n" "
; : ;' "
it"; :!:
I;:; ;;I::: ..:.1 t:: L ::, i1-:
"1'.'
",.+i
;1 1':; hilti! Ii
":1:
E :u Ih" ~t: :Hi; 11: ]ljf-~ ~;::t'1it; 1=tt'I ;.;+
tt~:,.
1iii lil' HEi" :or'
B J';; ' "1;::
~!-! d; ~i},Tn I, t ~.+.
H : +-,-~ Ie:'" ,:~ t1 !illC
~~t...::[ f-+~; ili ;;~J n::.. 1~1: .t-tt,r,: tH-; I:.; .Tt:~i.+.j. ~; +-'1 !l~ 11:
:f' :bi.~1-' ,"
t tq~; ,It
~~,I'- .,!
-I'" 1::HjI!I; t:. .-..,."
Ie::i
" tii: iii ' j~~ Ii"."f ". ."
I;;I'..
'"1;
""t' ii: Iii, " ,' :,I .-..
": :1:
i; :r~t'
., 1,::/ fli
:: ~E: j: (~ 'ff ti:: ;
""
!"
; : i; : iIii ii'...+ : : ;
II ".i : ; :
II !' i !i : ; "i q 1:"
i :: 'II II : I I " i!,
'Ii !
ii : : I,: i I,; ;i;:;
iit:; ;
: : ; , :; i : : : q r '; :\
" I
~~C'j
"iillltt HE"
:~:+1 .' "1'~ ."
tU rH ,. 11: H;! Hi !i;.lti~ :i~~tH #..' ,- rt;
t~f: ih H~ "! ,
" Iff: it -HiI"
H .+-;t : ~t
1:;; r1..f
~i-Hi ~t'~' "if f.; i : JL
" Utidl w. tt. t:lt ,1
~., it .,--1- Iiti ~m:i mf
,r
~.,1 ,.
"
I,
/1fitOOiI
t 1iiI .J
.1+'1 HE~m .' " +t, 11
' W. ~W t
m
i
ffi
n" "
.11ft t~ Lt L II', i : :!i: II !
':
$t
"
.. t;
iiw Ifi,... :
"
j!I I::: IP: t+ ffj t!, '-;,t, t I 1\!
rtlfffi I'
i ':nr1'l it!;;;!1 :f: m. "" ."
r I i
13cx:T 8'FTN VlJ' /Z..Fc..S
rosmON ANDr=tDN 1=.!.
I(.L GDKp G£J
TANK. LEVEL
t:NN /.'MC- ~L.OJJ
SMALL VPd.J/ r::
MULTI flJC!.A-TIDN
~AN.SFE~
D'INAMIL R.lNVMalUM "PLY£.
MUUI ff..1t!..ATItJJ
~
QIN
MT"!:;':.E~~ :Z::;,O :=~+I..J
;/::;;)C.s.;'~MNlfss:-L5D;lbD MN+/SEt:-
.Oz.&)1IT:.$Jb R:£ SeTs::~ ~ /IVNr
I I I I I'" "
I I I I I I I I
I I I I I I I I I I I I I I I I I
I I I I I I I I I I I I I I I I I
I I I I I I I I I I I I I I I I I
I I I I I I I I I I I I I I I I I
Figure A4.-System step response - graphical data (4 of 4).
50

APPENDIX BSYSTEM ANALOG COEFFICIENT LISTING
51

t='r~~',�L y RFCS lCOB1 = +0.0008lC064 = +0.0318
13 OCT 81 lC065 = -0.8758IC070 = -0.0000
r~EPORT DATA 1C071 = -0.8754IC074 = -0.0000IC075 = +0.0050
lOT ICI00 = +0.8881lCl ICI0! = -0.5000lE2 1CI02 ;: -0.51997lCOOO = +0.2258 lC103 = -0.0000lCOOl = +0.7835 lC104 = +0.0100lC002 = +0.8866 lCl05 = + 1 .00001C003 = +0.8887 lC10B = +0.8888lC004 = +0.0089 lCl07 = +0.6663lC005 = +0.0728 lCl10 = +0.8888lC006 = +0.8003 lClll = -0.8758lC007 = +0.7503 lC112 = +0.1988lC010 = -0.5002 lC113 .- +0.0000lC011 ::: +0.3331 lC114 = '-0.8888lC012 = +0.2841 lC115 = +0.0109IC013 = -0.0103 IC118 = +0.8858lC014 = +0.0001 1Cl17 = +0.3330lCOl5 = +0.0200 1C120 = +0.0000lC018 ::: +0.8994 IC121 = +0.99991C017 = -0.9999 1C122 = +0.9999lC020 = +0.9997 1C123 = + 1 .0000lC02l = +0.9999 lC124 = +0.0000IC022 = +0.9899 lC125 = +0.1800lC023 = +0.9889 lC126 ::: -,0.9999IC024 = -0.4999 1C127 = -0.0000lC025 = +0.8894 1.C 130 = +0.9999lC028 = +0.0000 lC131 = +0.9999lC027 = -0.0202 lC132 = +1.0000lC030 = +0.0000 1C133 = +0.0098lC031 = -0.9997 1C134 = -0.9997lC032 = +0.9999 lC135 = -0.12801C033 = -0.8745 1C136 = -0.0100lC034 = +0.8888 lC137 = -0.01001.C035 ::: +0.0000 1RVOO=000001C036 = +0.9889 1RVOl=308721C037 = +0.2837 1 Rl,,102=00000I C040 = +0.5000 1RI)04=000001(;041 = +0.8880 1.R l,,105 = 00000
lC044 = -0.9899 lRV06=32824lC045 = +0.8880 1.RVI0=00000lC050 = +0.9997 1RI)11 =00000iCOSl = +0.0000 lRV12=32780ICOS4 = +0.3329 lRTO=20000lCOSS :::+0.1800 lRTl=320001C080 = +0.1181 lRT2=00000
52
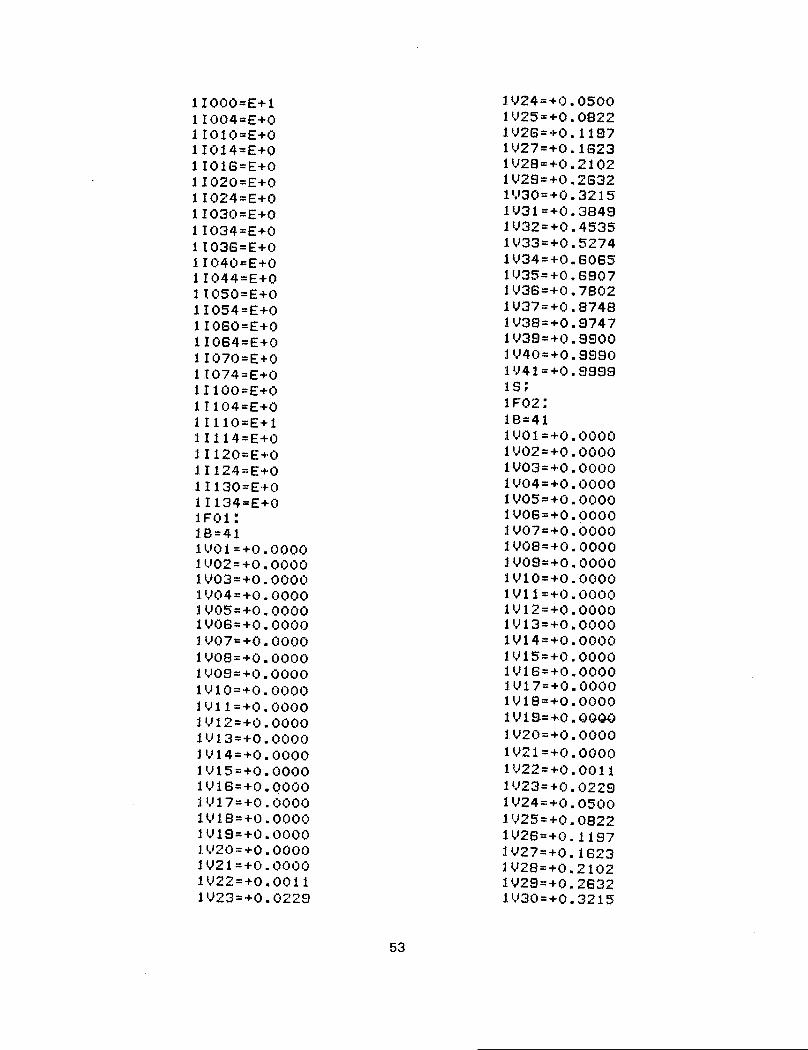
1IOOO=E+l1IOO4=E+O1IOI0=E+O1I014=E+01I016=E+O1I020=E+01 I024=E+01.I030=E+01I034=E+01I036=E+01I040=E+01I044=E+01I050=E+01I054=E+01 I060=E+01I064=E+01I070=E+01I074=E+01II00=E+01II04=E+0lI110=E+11I114=E+011120=E+011124=E+011130=E+011134=E+01F01:18=41IV01=+0.000011.'02=+0.0000
1V03=+0.00001'-,104=+0.0000
1 ~'05=+0. 0000
11)06=+0.000011,'07=+0.00001V08=+0.000011,108=+0.0000
11.110=+0.000011)11 =+0.0000
11,'12=+0.000011.113=+0.0000
11.114=+0.0000
11,'15=+0.00001I)16=+0.00001.1,'17=+0.0000
11.'18=+0.0000
11.'18=+0.00001.~120=+0. 0000
1V21=+0.00001\'22=+0.001111.123=+0.0228
11)24=+0.0500
11,125=+0.0822
11)26=+0.119711.127=+0.1623
11..128=+0.21021~128=+0. 26321..,30=+0.3215
11.131=+0.384811.132=+0.4535
1~'33=+0. 5274
11.134=+0.6065
1','35=+0.68071~136=+0. 7802
11.137=+0.8748
11.138=+0.8747
1~'38=+0. 8800
11,'40=+0.888011)41=+0.88881S;1F02:18=4111)01 =+0.0000
11,'02=+0.0000
11..'03=+0.000011)04 = +0.000011.105=+0.0000
1V06=+0.00001V07=+0.000011)08=+0.000011)08=+0.000011.,110=+0.000011.,111=+0.000011.'12=+0.00001V13=+0.000011.114=+0.0000
1')15=+0.000011.'16=+0.0000H'17=+0.000011..118=+0.0000
1 ','19:. +0 . 00.00
11.,120=+0.0000
1~121 =+0.0000
1')22=+0.0011
11)23=+0.022811.,124=+0.0500
1!.'25=+0. 0822
1V26=+0.11871\'27=+0.16231\128=+0.210211.,129=+0.263211.'30=+0.3215
53
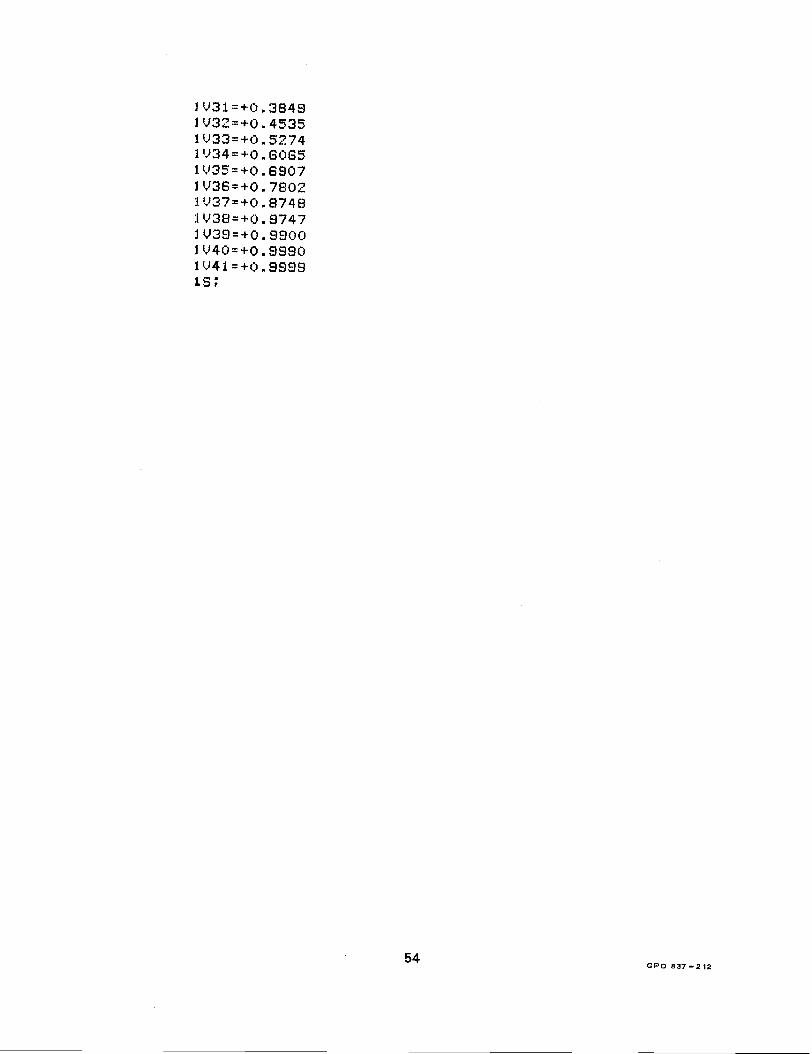
1 ')31 =+0.3848lV32=+0.453511)33=+0.52741')34=+0.606511)35=+0.68071')36=+0.78021',137=+0.87481 t)38=+O. 87471V38=+0.8800JV40=+0.88801'.141 =+0.99881S;
54GPO 837-212

Mission of the Bureau of Reclamation
The Bureau of Reclamation of the U.S. Department of the Interior is responsible for the development and conservation of the Nation's water resources in the Western United States.
The Bureau's original purpose "to provide for the reclamation of arid and semiarid lands in the West" today covers a wide range of interre- lated functions. These include providing municipal and industrial water supplies; hydroelectric power generation; irrigation water for agri- culture; water quality improvement; flood control; river navigation; river regulation and control; fish and wildlife enhancement; outdoor recreation; and research on water-related design, construction, mate- rials, atmospheric management, and wind and solar power.
Bureau programs most frequently are the result of close cooperation with the U.S. Congress, other Federal agencies, States, local govern- men ts, academic institutions, water-user organizations, and other concerned groups.
A free pamphlet i s available from the Bureau entitled, "Publications for Sale". It describes some of the technical publications currently available, their cost, and how to order them. The pamphlet can be obtained upon request from the Bureau of Reclamation, Attn D-922, P 0 Box 25007, Denver Federal Center, Denver CO 80225-0007.