water quality technical report - usbr.gov
TRANSCRIPT

Draft Water Quality Technical Report Shasta Lake Water Resources Investigation, California Prepared by: United States Department of the Interior Bureau of Reclamation Mid-Pacific Region
U.S. Department of the Interior Bureau of Reclamation June 2013


Contents
Contents Chapter 1 Affected Environment ....................................................................................... 1-1
Environmental Setting .............................................................................................................. 1-1 Overview of Water Quality Conditions ................................................................................ 1-3 Sediment ................................................................................................................................. 1-8 Temperature .........................................................................................................................1-11 Metals ...................................................................................................................................1-14 Salinity and Dissolved Solids ..............................................................................................1-17
Regulatory Framework ........................................................................................................... 1-22 Federal ..................................................................................................................................1-23 State ......................................................................................................................................1-31 Local .....................................................................................................................................1-39
Chapter 2 Model Output ..................................................................................................... 2-1
Chapter 3 References ........................................................................................................... 3-1
Tables Table 1-1. Summary of Conventional Water Quality Constituents Collected in the
Sacramento River at Red Bluff from 1996 to 1998 .................................................. 1-5 Table 1-2. EPA Section 303(d) List of Water Quality Limited Segments, Shasta Lake,
2010 ........................................................................................................................ 1-14 Table 1-3. Water Quality for Selected Stations in the Delta ...................................................... 1-19
Figures Figure 1-1. Shasta Lake Water Resources Investigation Primary Study Area, Shasta
Lake Area and Shasta Dam to Red Bluff Pumping Plant ......................................... 1-2 Figure 1-2. Concentrations of Suspended Sediment and Associated Flows in the
Sacramento River above Big Bend near Red Bluff ................................................ 1-10
i Draft – June 2013

Shasta Lake Water Resources Investigation Physical Resources Appendix—Water Quality Technical Report
Abbreviations and Acronyms °F degrees Fahrenheit µg/L micrograms per liter 2008 OCAP BA 2008 Biological Assessment on the Continued Long-Term
Operations of the CVP and SWP Basin Plan Water Quality Control Plan for the Sacramento River and
San Joaquin River Basins Bay Area San Francisco Bay Area Bay-Delta San Francisco Bay/Sacramento–San Joaquin River Delta BLM U.S. Bureau of Land Management BMP best management practice BO biological opinion CALFED CALFED Bay-Delta Program CCWD Contra Costa Water District CDEC California Data Exchange Center COSMA City of Stockton Metropolitan Area CTR California Toxics Rule CVP Central Valley Project CVRWQCB Central Valley Regional Water Quality Control Board CWA Clean Water Act D-1275 Water Right Decision 1275 D-1379 Water Right Decision 1379 D-1485 Water Right Decision 1485 D-1641 Water Right Decision 1641 DBP disinfectant byproducts DDT dichlorodiphenyl-trichloroethane DEIS Draft Environmental Impact Statement Delta Sacramento–San Joaquin River Delta District Court Eastern District of California DOC dissolved organic carbon DPH California Department of Public Health DWR California Department of Water Resources E/I export-to-inflow EC electrical conductivity EIS environmental impact statement EPA U.S. Environmental Protection Agency General Industrial Permit Industrial Storm Water General Permit
ii Draft – June 2013
Contents
JPOD joint point of diversion M&I municipal and industrial MCL maximum contaminant levels mg/L milligrams per liter MWQI Municipal Water Quality Investigation NEPA National Environmental Policy Act ng/L nanograms per liter NMFS National Marine Fisheries Service NOI Notice of Intent NPDES National Pollutant Discharge Elimination System OCAP Operations and Criteria Plan PCB polychlorinated biphenyl Porter-Cologne Act Porter-Cologne Water Quality Control Act RBPP Red Bluff Pumping Plant Reclamation U.S. Department of the Interior, Bureau of Reclamation RMP Resource Management Plan ROD Record of Decision RPA reasonable and prudent alternative RWD reports of waste discharge RWQCB regional water quality control boards SCWA Solano County Water Agency SDWA Safe Drinking Water Act SFBRWQCB San Francisco Bay Regional Water Quality Control Board STNF Shasta-Trinity National Forest STNR LRMP Shasta-Trinity National Forest Land and Resource
Management Plan SWANCC Solid Waste Agency of Northwestern Cook County SWP State Water Project SWPPP storm water pollution prevention plan SWRCB State Water Resources Control Board TCD temperature control device TDS total dissolved solids Thermal Plan Water Quality Control Plan for the Control of Temperature
in the Coastal and Interstate Waters and Enclosed Bays and Estuaries of California
THM trihalomethanes TMDL total maximum daily load TOC total organic carbon USACE U.S. Army Corps of Engineers
iii Draft – June 2013

Shasta Lake Water Resources Investigation Physical Resources Appendix—Water Quality Technical Report
USGS U.S. Geological Survey WDR waste discharge requirements WQCP Water Quality Control Plan WR Water Rights X2 estuarine habitat .
iv Draft – June 2013

Chapter 1 Affected Environment
Chapter 1 1
Affected Environment 2
This chapter describes the affected environment related to water quality for the 3 dam and reservoir modifications proposed under the Shasta Lake Water 4 Resources Investigation. 5
Environmental Setting 6
Surface water quality in the study areas is affected by multiple factors: natural 7 runoff, agricultural return flows, abandoned mines, construction, logging, 8 grazing, and operations of flow-regulating facilities, urbanization, and 9 recreation. This chapter discusses key water quality constituents of concern in 10 the study areas (i.e., temperature, sediments, and metals), the factors influencing 11 concentrations of these constituents, and the regulatory objectives associated 12 with maintaining beneficial uses. 13
For the purposes of this analysis, the study areas have been divided into a 14 primary study area and an extended study area. The primary study area is 15 located in both Shasta and Tehama counties and includes Shasta Dam and 16 Shasta Lake. All major and minor tributaries to the reservoir and a corridor 17 along the Sacramento River downstream to Red Bluff Pumping Plant (RBPP) 18 are also within the primary study area (Figure 1-1). The extended study area 19 extends from RBPP south (downstream along the Sacramento River) to the 20 Sacramento–San Joaquin River Delta (Delta). Besides the Sacramento River, it 21 also includes the San Francisco Bay/Sacramento–San Joaquin River Delta (Bay-22 Delta) area, and the facilities and the water service areas of the Central Valley 23 Project (CVP) and State Water Project (SWP). This extended study area 24 includes CVP and SWP reservoirs and the portions of tributaries that are 25 downstream from these reservoirs and that affect Sacramento River and Delta 26 flows. These reservoirs and tributaries include Lake Oroville, Folsom Lake, San 27 Luis Reservoir, New Melones Reservoir, and Trinity Lake, and portions of the 28 Trinity, Feather, American, and Stanislaus rivers. The CVP and SWP water 29 service areas include much of the Sacramento and San Joaquin valleys, and 30 substantial portions of the San Francisco Bay Area (Bay Area) and Southern 31 California. 32
1-1 Draft – June 2013

Shasta Lake Water Resources Investigation Physical Resources Appendix—Water Quality Technical Report
1 Figure 1-1. Shasta Lake Water Resources Investigation Primary Study Area, Shasta Lake 2 Area and Shasta Dam to Red Bluff Pumping Plant 3
1-2 Draft – June 2013
Chapter 1 Affected Environment
Overview of Water Quality Conditions 1 Surface water quality in the primary and extended study areas is affected by 2 natural runoff, agricultural return flows, abandoned mines, construction, 3 logging, grazing, and operations of flow-regulating facilities, urbanization, and 4 recreation. This section discusses key water quality constituents of concern (i.e., 5 temperature, sediments, and metals), the factors influencing their 6 concentrations, and the regulatory objectives associated with maintaining 7 beneficial uses. 8
The following discussion provides an overview of water quality and its 9 relationship to beneficial uses throughout the primary and extended study areas. 10 This section is followed by discussions of key water quality parameters that 11 influence beneficial uses to varying degrees within the study areas; temperature, 12 sediment and metals. 13
Shasta Lake and Vicinity 14 This section addresses water quality in the Shasta Lake and vicinity portion of 15 the primary study area. It focuses on the six arms of Shasta Lake and tributaries 16 that enter into Shasta Lake from the surrounding watersheds. 17
Water quality in this portion of the primary study area generally meets the 18 standards for beneficial uses identified in the Water Quality Control Plan for the 19 Sacramento River and San Joaquin River Basins (Basin Plan) (CVRWQCB 20 2009). The quality of surface waters in Shasta County is generally considered 21 good, although some water bodies are affected by nonpoint pollution sources 22 that influence surface water quality: high turbidity from controllable sediment 23 discharge sources (e.g., land development and roads); high concentrations of 24 nitrates and dissolved solids from range and agricultural runoff or septic tank 25 failures; contaminated street and lawn runoff from urban areas, roads, and 26 railroads; acid mine drainage and heavy metal discharges from historic mining 27 and processing operations; and warm-water discharges into cold-water streams. 28
The quality of water in underground basins and water-bearing soils is also 29 considered generally good throughout most of Shasta County. Potential hazards 30 to groundwater quality involve nitrates and dissolved solids from agricultural 31 and range practices and septic tank failures. The ability of soils in Shasta 32 County to support septic tanks and on-site wastewater treatment systems is 33 generally severely limited, particularly on older valley terrace soils and certain 34 loosely confined volcanic soils in the eastern portions of the county 35 (CVRWQCB 2009). 36
The surface water quality of streams and lakes draining Shasta-Trinity National 37 Forest (STNF) and adjacent private lands generally meets standards for 38 beneficial uses defined by the Basin Plan (CVRWQCB 2009). There are, 39 however, some areas where the water quality does not meet the standards during 40 periods of storm runoff because of past management activities, or as a result of 41 drainage from historic mining and processing operations. These water courses 42
1-3 Draft – June 2013

Shasta Lake Water Resources Investigation Physical Resources Appendix—Water Quality Technical Report
include West Squaw Creek below the Balakala Mine, lower Little Backbone 1 Creek, lower Horse Creek, and Town Creek, which are all listed by the U.S. 2 Environmental Protection Agency (EPA) as impaired water bodies under 3 Section 303(d) of the Clean Water Act (CWA) (CVRWQCB 2011). The 4 cumulative impacts of successive activities, such as road construction and 5 timber harvesting on private and National Forest lands, also contribute to the 6 degradation of water quality in STNF (USFS 1995). Within this portion of the 7 primary study area, most of the road construction and timber harvest activities 8 occur on private lands. 9
Shasta Dam and Shasta Lake constitute the “keystone of the Central Valley 10 Project.” Approximately 6.2 million acre-feet of water flows annually into 11 Shasta Lake from the Sacramento River, McCloud River, and Pit River 12 drainages. A favorable inflow-outflow relationship of 1.4 to 1 results in good 13 water quality, both in the lake and downstream (USFS 1996), although 20 acres 14 where West Squaw Creek enters Shasta Lake is listed as an impaired water 15 body on the EPA’s Section 303(d) list as impaired due to heavy metal 16 accumulations (e.g., cadmium, copper and zinc) at locations throughout the 17 reservoir (CVRWQCB 2011). Shasta Lake is listed on the EPA’s 2008 – 2010 18 Section 303(d) list as impaired by mercury throughout the lake. 19
Nutrient inputs and bacteria are not of concern in the Sacramento and McCloud 20 Arms (USFS 1998); however, they could be an issue in the Pit Arm as a result 21 of runoff from agricultural and range lands in the upper Pit River watershed. 22 Within Little Backbone Creek and West Squaw Creek, the waters are locally 23 limited by low pH and elevated concentrations of heavy metals caused by 24 drainage from abandoned mines and hence are listed as impaired on the EPA’s 25 Section 303(d) list (CVRWQCB 2003a). In addition, data suggest that sediment 26 and turbidity locally affect beneficial uses, mainly contact recreation. A recent 27 2-year study conducted by the State Water Resources Control Board (SWRCB) 28 sampled mercury accumulations in fish at a number of locations throughout 29 Shasta Lake. This study documented elevated levels of mercury in some 30 specimens (Davis et al. 2010). 31
Upper Sacramento River (Shasta Dam to Red Bluff) 32 Tributaries to the Upper Sacramento River and place names referred to in the 33 text are shown in Figure 1-1. The main sources of water in the Sacramento 34 River below Keswick Dam are rain and snowmelt that collect in upstream 35 reservoirs and are released in response to water needs or flood control. The 36 quality of surface water downstream from Keswick Dam also is influenced by 37 other human activities along the Sacramento River downstream from the dam, 38 including agricultural, historical mining, and municipal and industrial (M&I) 39 inputs. 40
The quality of water in the Sacramento River is relatively good. Only during 41 conditions of stormwater-driven runoff are water quality objectives typically not 42 met (Domagalski et al. 2000). Water quality issues within the primary study 43
1-4 Draft – June 2013

Chapter 1 Affected Environment
area of the Sacramento River include the presence of mercury, pesticides such 1 as organochlorine pesticides, trace metals, turbidity, and toxicity from unknown 2 origin (CALFED 2000a). 3
Water quality in the Sacramento River and its major tributaries above RBPP is 4 generally good (Table 1-1). Nutrients such as nitrate were found to be low 5 throughout the Sacramento River basin (Domagalski and Dileanis 2000, as cited 6 in Domagalski et al. 2000). Water temperature is a principal water quality issue 7 in the upper Sacramento River between Keswick Dam and RBPP. 8
Table 1-1. Summary of Conventional Water Quality Constituents Collected 9 in the Sacramento River at Red Bluff from 1996 to 1998 10
Constituent (unit) Water Quality Objective
Average Measurement
Conventional Physical and Chemical Constituents
Temperature < 2.5ºF a 52.7ºF
Conductivity (µS/cm) – 116
Dissolved Oxygen (mg/L) 7.0 b 10.7
Dissolved Oxygen Saturation (percent) 85 b 99
pH (standard unit) 6.5 to 8.5 c 7.8
Alkalinity (mg/L CaCO3) – 48.3
Total Hardness (mg/L CaCO3) – 46.6
Suspended Sediment (mg/L) – 38.8
Calcium (mg/L) narrative d 10.3
Magnesium (mg/L) – 5.0
Sodium (mg/L) – 5.8
Potassium (mg/L) – 1.1
Chloride (mg/L) 500 e 2.4
Sulfate (mg/L) 500 e 4.5
Silica (mg/L) – 20.5
NO2 + NO3 (mg/L N) NO3 < 10 f 0.12
Total Phosphorus (mg/L P) – 0.0477
Trace Metals Arsenic (µg/L) 50 g 1.0
Chromium (µg/L) 180 g 1.0
Copper (µg/L) 5.1 g 1.6
Mercury (µg/L) 0.050 g 0.0045
11
1-5 Draft – June 2013

Shasta Lake Water Resources Investigation Physical Resources Appendix—Water Quality Technical Report
Table 1-1. Summary of Conventional Water Quality Constituents Collected 1 in the Sacramento River at Red Bluff from 1996 to 1998 (contd.) 2
Constituent (unit) Water Quality Objective
Average Measurement
Nickel (µg/L) 52 g 1.2
Zinc (µg/L) 120 g 2.3
Organic Pesticides Molinate (ng/L) 13,000 h < 60
Simazine (ng/L) 3,400 i < 22
Carbofuran (mg/L) 40,000 e, 500 i < 31
Diazinon (mg/L) 51 j < 28
Carbaryl (ng/L) 700 k < 41
Thiobencarb (ng/L) 1,000 a < 38
Chlorpyrifos (ng/L) 14 j < 25
Methidathion (ng/L) – < 38
Source: CBDA 2005
Notes: a The Water Quality Control Plan for the Sacramento River and San Joaquin River Basins (Basin
Plan) water quality objective for allowable change from controllable factors. b Basin Plan water quality objective. c Basin Plan water quality objective; < 0.5 allowable change from controllable factors. d Basin Plan narrative objective: Water shall not contain constituent in concentrations that would
cause nuisance or adversely affect beneficial uses. e Secondary drinking water maximum contaminant level (MCL). f Primary drinking water MCL. g California Toxics Rule (CTR) aquatic life criteria for 4-day average dissolved concentration. h CTR human health maximum criteria total recoverable concentration. i California Department of Fish and Wildlife (CDFW) hazard assessment value. j CDFW aquatic life guidance value for 4-day average concentration. k U.S. Environmental Protection Agency Integrated Risk Information System reference dose for
drinking water quality.
Key: – = not applicable µg/L = micrograms per liter µS/cm = microSiemens per centimeter CaCO3 = calcium carbonate mg/L = milligrams per liter N = nitrogen ng/L = nanograms per liter NO2 = nitrate NO3 = nitrite ºF = degrees Fahrenheit P = phosphorus
Although all trace metals shown in Table 1-1 were well below their established 3 water quality objectives, one of the principal water quality issues in the upper 4 Sacramento River portion of the primary study area is acid mine drainage and 5 associated heavy-metal contamination from the Spring Creek drainage and other 6
1-6 Draft – June 2013

Chapter 1 Affected Environment
abandoned mining sites. It should be noted that the U.S. Geological Survey 1 (USGS) study detected mercury, but it did not exceed the criterion of ambient 2 level specified in the California Toxics Rule (CTR); however, CTR levels for 3 mercury are not protective to prevent the high concentration of mercury found 4 in fish tissue. In addition to heavy metal contamination, the Central Valley 5 Regional Water Quality Control Board (CVRWQCB) determined that the 25-6 mile reach of the Sacramento River from Keswick Dam downstream to 7 Cottonwood Creek is impaired because the water periodically contains levels of 8 dissolved cadmium, copper, and zinc that exceed levels identified to protect 9 aquatic organisms (CVRWQCB 2002). The 26-mile reach from Keswick Dam 10 to Red Bluff is listed for unknown sources of toxicity (CVRWQCB 2007a). 11
Lower Sacramento River and Delta 12 Water quality in the lower Sacramento River is affected by agricultural runoff, 13 acid mine drainage, stormwater discharges, water releases from dams, 14 diversions, and urban runoff. However, the flow volumes generally provide 15 sufficient dilution to prevent excessive concentrations of contaminants in the 16 river. 17
Several total maximum daily loads (TMDL) are currently proposed for the 18 lower Sacramento River. In addition, the Sacramento River downstream from 19 RBPP to Knights Landing is listed as an impaired water body under the EPA’s 20 Section 303(d) list for mercury and unknown toxicity. Elevated metals and 21 pesticide levels have been found at some sites in the Sacramento River Valley 22 downstream from Knights Landing. The parameters of concern in the 23 Sacramento River from Knights Landing to the Delta include diazinon, 24 mercury, and unknown sources of toxicity (CVRWQCB 2007a, 2007b). 25
Water quality in the Delta is highly variable temporally and spatially. It is a 26 function of complex circulation patterns that are affected by inflows, pumping 27 for Delta agricultural operations and exports, operation of flow control 28 structures, and tidal action. The existing water quality problems of the Delta 29 system may be categorized as presence of toxic materials, eutrophication and 30 associated fluctuations in dissolved oxygen, presence of suspended sediments 31 and turbidity, salinity, and presence of bacteria (SWRCB 1999). 32
The Delta waterways within the area under the CVRWQCB’s jurisdiction are 33 listed as impaired on the EPA’s 303(d) list for dissolved oxygen, electrical 34 conductivity (EC), dichlorodiphenyl-trichloroethane (DDT), mercury, Group A 35 pesticides, diazinon and chlorpyrifos, and unknown toxicity (CVRWQCB 36 2003b). The area of the Delta that is under the jurisdiction of the San Francisco 37 Bay Regional Water Quality Control Board (SFBRWQCB) is listed as impaired 38 for mercury, chlordane, selenium, DDT, dioxin compounds, polychlorinated 39 biphenyl (PCB) compounds, dieldrin, nickel, exotic species, and furan 40 compounds (SFBRWQCB 2007). 41
1-7 Draft – June 2013

Shasta Lake Water Resources Investigation Physical Resources Appendix—Water Quality Technical Report
Organic carbon in the Delta originates from runoff from agricultural and urban 1 land, drainage water pumped from Delta islands that have soils with high 2 organic matter, runoff and drainage from wetlands, wastewater discharges, and 3 primary production in Delta waters. Delta agricultural drainage can also contain 4 high levels of nutrients, suspended solids, organic carbon, minerals (salinity), 5 and trace chemicals such as organophosphate, carbamate, and organochlorine 6 pesticides. 7
Salinity is also an important water quality constituent in the Delta. Salinity in 8 the Delta is the result of tidal exchange with San Francisco Bay, variations in 9 freshwater inflow from the San Joaquin and Sacramento rivers, agricultural and 10 urban exports/diversions, and agricultural return flows. During dry conditions, 11 seawater intrusion is the primary factor influencing Delta salinity and can 12 adversely affect agricultural and municipal uses. The highest concentrations 13 typically occur in late summer or early fall. 14
CVP/SWP Service Areas 15 The CVP and SWP service areas are affected by water quality from the Delta. 16 Water quality concerns of particular concern are those related to salinity and 17 drinking-water quality. Salinity is an issue because excessive salinity may 18 adversely affect crop yields and require more water for salt leaching, may 19 require additional M&I treatment, may increase salinity levels in agricultural 20 soils and groundwater, and is the primary water quality constraint to recycling 21 wastewater (CALFED 2000b). 22
Constituents that affect drinking-water quality include bromide, natural organic 23 matter, microbial pathogens, nutrients, total dissolved solids (TDS), hardness, 24 alkalinity, pH, organic carbon, disinfection byproducts, and turbidity. 25
Sediment 26
Shasta Lake and Vicinity 27 Sediment-caused turbidity is one of the limiting water quality issues for Shasta 28 Lake and its tributaries. It is a noticeable recurring water quality problem that 29 affects beneficial uses, including recreation and fisheries. Within the reservoir, 30 turbid water results from clay- and silt-sized soil particles suspended in the 31 water column. Under certain conditions, inflow to the Pit Arm appears to be 32 influenced by water quality conditions upstream from Shasta Lake, but 33 monitoring data are not available to adequately document this phenomenon. 34
Before the construction of Shasta Dam, the widespread loss of vegetation 35 caused by historic copper mining and smelting operations resulted in large-scale 36 erosion, particularly in the watersheds that are tributary to the Main Body of 37 Shasta Lake and the Squaw Creek Arm. In addition to sediment sources from 38 upland areas, including roads and historic mining features, the construction and 39 operation of Shasta Dam continue to influence erosional processes that 40
1-8 Draft – June 2013
Chapter 1 Affected Environment
introduce sediment into Shasta Lake, causing turbid conditions that are visible 1 to the casual observer. 2
Nonpoint sources of fine sediment that increase turbidity in Shasta Lake include 3 sediment discharge from tributaries, wave-related erosion below and adjacent to 4 the fluctuating water surface, and surficial erosion of exposed surfaces as the 5 lake levels fluctuate (USFS 1996). Erosion of the fine-textured soil and rock 6 types that constitute much of the shoreline is a predominant factor in causing 7 turbidity. The turbid water is noticeable along the shoreline throughout the year, 8 but typically increases during wind and runoff events. Plumes of turbid water 9 entering from tributaries are also visible periodically throughout the year. The 10 fluctuation of lake levels, combined with various wave-generating processes, 11 also influences the degree and location of erosion-related turbidity. Turbidity 12 and, to a lesser degree, sediment suspended in the water column influence 13 recreational uses of the lake, including fishing, swimming, and boating, by 14 decreasing the clarity of the water along the shoreline. 15
Although some amount of fine sediment is transported downstream from Shasta 16 Dam, the size and location of the reservoir provide an efficient sediment trap for 17 material typically mobilized as bedload. Additional discussion of erosional 18 processes is provided in Chapter 4, “Geology, Geomorphology, Minerals, and 19 Soils,” of the Draft Environmental Impact Statement (DEIS). 20
Upper Sacramento River (Shasta Dam to Red Bluff) 21 Rates of loading and discharge of suspended sediment within the upper 22 Sacramento River watershed have been altered by activities such as mining, 23 smelting, agriculture, urbanization, and dam construction. The storage and 24 diversion of water within reservoirs for either hydroelectric or other purposes 25 can affect sediment yield, downstream sediment levels, and transport 26 characteristics. In particular, dams such as Shasta can trap sediment and result 27 in the depletion of coarse sediments needed by fisheries. This has resulted in the 28 creation of gravel replenishment programs on the upper Sacramento River as 29 part of the Central Valley Project Improvement Act restoration program. 30
Historic hydraulic gold mining has probably had the greatest effect on sediment 31 yield in the Sacramento River watershed (Wright and Schoellhamer 2004). 32 During the late 1800s, such mining introduced mass quantities of silt, sand, and 33 gravel into the Sacramento River system. Suspended sediment was washed 34 downstream into the Delta. Current sediment transport patterns in the 35 Sacramento River watershed are greatly affected by the trapping of sediment in 36 reservoirs such as Shasta Lake (Wright and Schoellhamer 2004). 37
Characteristics of peak-flow events are fundamental regulators of sediment 38 mobilization, bed scour, riparian recruitment, and bank erosion. However, 39 upstream sediment supply rates and sediment load distribution also affect 40 suspended sediment loading (CALFED 2003). The upper Sacramento River 41 contributes little coarse sediment from erosion because it is bounded by erosion-42
1-9 Draft – June 2013
Shasta Lake Water Resources Investigation Physical Resources Appendix—Water Quality Technical Report
resistant bedrock and terrace deposits (Stillwater Sciences 2006). Therefore, 1 today a decreasing trend in suspended sediment exists in the Sacramento River 2 (Wright and Schoellhamer 2004). 3
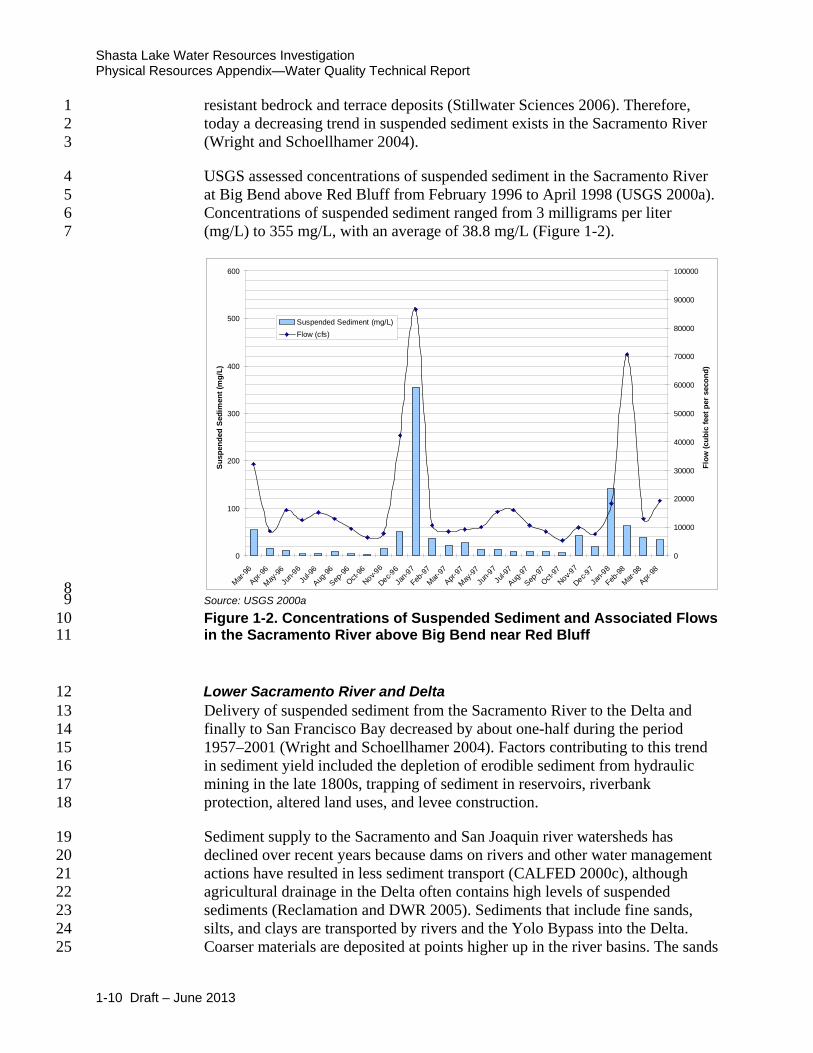
USGS assessed concentrations of suspended sediment in the Sacramento River 4 at Big Bend above Red Bluff from February 1996 to April 1998 (USGS 2000a). 5 Concentrations of suspended sediment ranged from 3 milligrams per liter 6 (mg/L) to 355 mg/L, with an average of 38.8 mg/L (Figure 1-2). 7
8 Source: USGS 2000a 9 Figure 1-2. Concentrations of Suspended Sediment and Associated Flows 10 in the Sacramento River above Big Bend near Red Bluff 11
Lower Sacramento River and Delta 12 Delivery of suspended sediment from the Sacramento River to the Delta and 13 finally to San Francisco Bay decreased by about one-half during the period 14 1957–2001 (Wright and Schoellhamer 2004). Factors contributing to this trend 15 in sediment yield included the depletion of erodible sediment from hydraulic 16 mining in the late 1800s, trapping of sediment in reservoirs, riverbank 17 protection, altered land uses, and levee construction. 18
Sediment supply to the Sacramento and San Joaquin river watersheds has 19 declined over recent years because dams on rivers and other water management 20 actions have resulted in less sediment transport (CALFED 2000c), although 21 agricultural drainage in the Delta often contains high levels of suspended 22 sediments (Reclamation and DWR 2005). Sediments that include fine sands, 23 silts, and clays are transported by rivers and the Yolo Bypass into the Delta. 24 Coarser materials are deposited at points higher up in the river basins. The sands 25
0
100
200
300
400
500
600
Mar-96
Apr-96
May-96
Jun-9
6Ju
l-96
Aug-96
Sep-96
Oct-96
Nov-96
Dec-96
Jan-9
7
Feb-97
Mar-97
Apr-97
May-97
Jun-9
7Ju
l-97
Aug-97
Sep-97
Oct-97
Nov-97
Dec-97
Jan-9
8
Feb-98
Mar-98
Apr-98
Susp
ende
d Se
dim
ent (
mg/
L)
0
10000
20000
30000
40000
50000
60000
70000
80000
90000
100000
Flow
(cub
ic fe
et p
er s
econ
d)
Suspended Sediment (mg/L) Flow (cfs)
1-10 Draft – June 2013

Chapter 1 Affected Environment
typically are transported in the bed load, while the clays and silts move the 1 suspended load. The suspended load is composed of generally finer materials 2 moving downstream in the water column. Sediment loads from the Sacramento 3 River are higher than those from the San Joaquin River (Reclamation and DWR 4 2005). 5
Hydraulic gold mining, particularly through the major westerly flowing 6 tributaries such as the American, Feather, Yuba, and Bear rivers, may also 7 affect sediment transport in the extended study area. USGS found that the 8 Sacramento River is the primary supplier of suspended sediment to the Delta. 9
CVP/SWP Service Areas 10 Some suspended sediments are transported within the CVP and SWP service 11 areas, but turbidity and sedimentation are not issues within the service areas 12 (CALFED 2000c). 13
Temperature 14
Shasta Lake and Vicinity 15 Water temperature is an important water quality parameter affecting the 16 beneficial uses of Shasta Lake and its tributaries, including contact and 17 noncontact recreation and aquatic organisms. Within the reservoir, water 18 temperature commonly controls the growth of algae and the rate of biochemical 19 processes. Shasta Lake periodically stratifies and a thermocline develops on an 20 annual basis, although turnover is incomplete and the lake has not been known 21 to freeze over (Bartholow et al. 2001). Strong stratification of the reservoir 22 occurs during summer at a depth of 10 to 15 meters. This stratification isolates 23 the epilimnion from nutrients available in the deeper hypolimnion, segregating 24 spring and fall algal blooms when water temperatures might otherwise support 25 algal production in the euphotic zone, the zone close to the surface that provides 26 opportunities for photosynthesis. The period of stratification generally overlaps 27 with the peak recreation season (May to September), when surface water 28 temperatures are comfortable for contact recreation activities. During fall, the 29 stratification dissipates and the surface water temperature is reduced. 30
Shasta Dam operations greatly influence the annual and seasonal water 31 temperature of the reservoir. The wetness of a given water year or series of 32 years generally controls the mean annual water temperature. The current 33 temperature regime of Shasta Lake is related to CVP operational requirements, 34 including those necessary to optimize the water temperatures in the Sacramento 35 River downstream from Keswick Dam. Overall, the tributaries that enter Shasta 36 Lake meet the Basin Plan water quality objective for temperature. 37
Upper Sacramento River (Shasta Dam to Red Bluff) 38 Water temperature in the Sacramento River from Shasta Dam to Keswick Dam 39 is determined primarily by Shasta Dam releases. Shasta Dam release flows are 40
1-11 Draft – June 2013

Shasta Lake Water Resources Investigation Physical Resources Appendix—Water Quality Technical Report
then mixed with flows from Whiskeytown Reservoir at Keswick Reservoir and 1 released into the upper Sacramento River. 2
Water temperature for rivers within the Sacramento River basin is reportedly 3 maintained consistent with regulatory requirements (e.g., National Marine 4 Fisheries Service (NMFS) biological opinion (BO) and Basin Plan) most of the 5 time, but temperature management can be difficult during low-flow periods 6 (USGS 2000a). Historically, low-flow events and a lack of flexibility in dam 7 operations can cause water temperatures to periodically approach critical levels 8 for sustaining juvenile salmon populations. In addition to low flows, high water 9 temperatures released from reservoirs, coupled with natural instream warming, 10 can cause elevated river water temperatures (Vermeyen 1997). 11
According to the 2004 BO for CVP and SWP operations for the Sacramento 12 River winter-run Chinook salmon, the Sacramento River water temperatures 13 will be below 56°F at compliance locations between Balls Ferry and Bend 14 Bridge from April 15 through September 30, and not in excess of 60°F at the 15 same compliance locations between Balls Ferry and Bend Bridge from October 16 1 through October 31. On June 4, 2009, NMFS issued the NMFS Operations 17 and Criteria Plan (OCAP) BO for listed anadromous fishes and marine mammal 18 species and their critical habitats governing the long-term operations of the CVP 19 and SWP. The 2009 NMFS BO established Sacramento River water 20 temperature requirements not to exceed 56°F between Balls Ferry and Bend 21 Bridge compliance points from May 15 through September 30 for protection of 22 winter-run Chinook salmon, from October 1 through October 31 for the 23 protection of mainstem spring-run Chinook salmon, whenever possible. 24
Several lawsuits were filed challenging the validity of the 2009 NMFS BO and, 25 the U.S. Department of the Interior, Bureau of Reclamation’s (Reclamation) 26 acceptance of the reasonable and prudent alternative included in the BO (see 27 Consolidated Salmonid Cases, 1:09-CV-1053 OWW DLB (E.D. Cal.)). On 28 September 20, 2011, the Eastern District of California (District Court) 29 remanded the 2009 NMFS BO to the fishery agency. The District Court ordered 30 NMFS and Reclamation to prepare a final BO and associated final National 31 Environmental Policy Act (NEPA) document by February 1, 2016. Despite the 32 uncertainty resulting from the ongoing reconsultation process, the 2009 NMFS 33 BO contains the most recent estimate of potential changes in water operations 34 that could occur in the near future and it is currently anticipated that the final 35 BO issued by NMFS will contain similar RPAs. 36
The Basin Plan specifies that water temperature shall not be elevated above 56 37 degrees Fahrenheit (°F) from Keswick Dam to Hamilton City (CVRWQCB 38 2009). In addition, the Basin Plan specifies that at no time or place shall the 39 temperature of cold or warm intrastate waters be increased more than 5°F above 40 natural receiving-water temperature (CVRWQCB 2009). Keswick Dam releases 41 are managed to meet temperature control requirements. 42
1-12 Draft – June 2013
Chapter 1 Affected Environment
Sacramento River water temperatures below Shasta Dam were analyzed from 1 January 1991 through December 2005. The data set indicates that average 2 temperatures vary seasonally, ranging from 47.9°F in February to 55.7°F in 3 November. Water temperatures below Keswick Dam were analyzed for January 4 1990 through December 2006. Like the temperatures below Shasta Dam, 5 average temperatures below Keswick Dam vary seasonally, ranging from 6 47.8°F in February to 54.9°F in November. Summer and fall temperatures 7 typically increase by about 7°F. Water temperatures just downstream from 8 Keswick Dam are influenced by releases from Shasta Lake and Whiskeytown 9 Reservoir and Keswick Dam operations. 10
To achieve water temperature objectives in the Sacramento River without 11 interrupting power generation, Reclamation constructed a temperature control 12 device (TCD) on Shasta Dam that became operational in 1997. Before 1997, to 13 help meet the needs of federally listed winter-run Chinook salmon, cold water 14 was released from low outlets at Shasta Dam. These cold-water releases 15 bypassed hydropower facilities, causing the loss of power revenues. The TCD 16 allows selective withdrawal of water from different reservoir depths without 17 bypassing power generation, provides flexibility to Shasta Dam operations, and 18 allows downstream temperature goals to be consistently achieved (Reclamation 19 2004a). 20
Lower Sacramento River and Delta 21 Water temperature in the Sacramento River at Colusa varies seasonally, ranging 22 from 47.5°F to 67.5°F. Water temperatures gradually increase through the 23 spring and summer and reach an average of about 65°F. Water temperature in 24 the Sacramento River at Freeport varies seasonally, ranging from 48.7°F to 25 72.1°F (USGS 2000a). 26
Water temperature in the Delta is influenced only slightly by water management 27 activities (i.e., dam releases) (Reclamation and DWR 2005). The BOs for 28 Sacramento River winter-run Chinook salmon are among the most influential 29 factors governing Shasta releases, in terms of both quantity and timing (NMFS 30 1993, 2004, 2009). The BOs set temperature requirements below Keswick Dam 31 for April through October. In years when CVP facilities cannot be operated to 32 meet required temperature and storage objectives, Reclamation reinitiates 33 consultation with NMFS (Reclamation 2004b). 34
CVP/SWP Service Areas 35 Water quality in the CVP and SWP service areas, including water temperature, 36 is affected by fluctuations of water quality in the Delta, which in turn are 37 influenced by water quality in the San Joaquin River, CVP and SWP export 38 pumping rates, local agricultural diversions and drainage water, and the 39 Sacramento River (CALFED 2000c). 40
1-13 Draft – June 2013

Shasta Lake Water Resources Investigation Physical Resources Appendix—Water Quality Technical Report
Metals 1
Shasta Lake and Vicinity 2 Certain areas of Shasta Lake have been identified as impaired by toxic metal 3 pollutants. For this reason, Shasta Lake is listed on the EPA’s Section 303(d) 4 list of impaired water bodies. For water bodies on the Section 303(d) list, the 5 CWA requires the development of TMDL allocations for the pollutants of 6 concern. A TMDL allocation must estimate the total maximum daily load, with 7 seasonal variations and a margin of safety, for all suitable pollutants and 8 thermal loads, at a level that would ensure protection and propagation of a 9 balanced population of indigenous fish, shellfish, and wildlife. Table 1-2 shows 10 the potential sources of pollution within specific areas of Shasta Lake, along 11 with the TMDL priority and the estimated affected area of the pollutants. 12
Table 1-2. EPA Section 303(d) List of Water Quality Limited Segments, 13 Shasta Lake, 2010 14
15 Waters discharged by stream channels draining the areas disturbed by the 16 mining of sulfide ore deposits are generally acidic and contain high 17 concentrations of dissolved metals, including iron, copper, and zinc. The 18 streams with the highest metal concentrations are Flat, Little Backbone, Spring, 19 Squaw, Horse, and Zinc creeks (USGS 1978). Dissolved metals concentrations 20 discharged by these streams violate water quality objectives (CVRWQCB 21 2003a). The sources of the metals are surface and groundwater discharge from 22 underground mines and waters flowing through open pits, tunnels, mine 23 tailings, waste rock, and tertiary deposits that include modern alluvium along 24
Pollutant Potential Sources TMDL Priority Estimated Area Affected
Horse Creek, Town Creek, and Little Backbone Creek Cadmium Resource extraction Low 1.5 miles
Copper Resource extraction Low 1.5 miles
Lead Resource extraction Low 1.5 miles
Zinc Resource extraction Low 1.5 miles
All of Shasta Lake Mercury Resource extraction Low 430 miles
Area where West Squaw Creek enters Squaw Creek Arm of Shasta Lake Cadmium Resource extraction Low 20 acres
Copper Resource extraction Low 20 acres
Zinc Resource extraction Low 20 acres
Source: SWRCB 2006
Key: TMDL = total maximum daily load
1-14 Draft – June 2013

Chapter 1 Affected Environment
the shoreline. Interaction with sulfide minerals and erosion of metal-rich 1 material commonly result in low pH readings and high metal concentrations. 2
The sources of the metals in the two areas identified in Table 7-2 in Chapter 7, 3 “Water Quality” of the DEIS, are associated with the Bully Hill/Rising Star 4 mining complex adjacent to the Squaw Creek Arm. Although the mines are no 5 longer operational and remedial action continues, these areas are a documented 6 source of metals and continue to be subject to an abatement order issued by the 7 CVRWQCB. A containment structure constructed sometime during the early 8 1900s has filled with sediment downstream from the Bully Hill Mine. No 9 information is available on the character of the material stored behind this earth 10 fill dam. In 2006, North State Resources, Inc., conducted a Phase 1 Site 11 Assessment of an area adjacent to, but over a small divide from, the Bully Hill 12 Mine. This assessment documented elevated levels of sulfide minerals in 13 sediment samples and extremely low pH values in surface waters draining the 14 mine (NSR 2007). 15
Tributaries to the Main Body of Shasta Lake are also a source of metals, along 16 with acid mine drainage from a number of mines in the West Straw Creek and 17 Little Backbone Creek watersheds. In addition to runoff from the historic 18 workings (i.e., adits and portals), a number of large mine tailing deposits are 19 currently leaching various metals into tributaries to Shasta Lake (CVRWQCB 20 2003a). 21
Between 2002 and 2003, the CVRWQCB conducted an investigation intended 22 to increase the understanding of the relationship between elevated metal 23 concentrations (dissolved copper and zinc) in discharges from Shasta Dam and 24 the temporal and spatial distribution of these metals within and upslope of 25 Shasta Lake (CVRWQCB 2003a). Specifically, this investigation attempted to 26 answer two questions: 27
• Why do these elevated metal concentrations appear seasonally? 28
• Are the concentrations somehow related to the operation of the 29 temperature control device that is attached to the upstream face of 30 Shasta Dam? 31
In 2003, the CVRWQCB issued an interim report that provided data and limited 32 analysis at 17 sites upstream from Shasta Dam. The data set included 412 33 discrete samples and included 1,043 specific chemical analyses for various 34 chemical constituents (CVRWQCB 2003a). The interim report offers the 35 following conclusion: “This study shows a direct correlation between dissolved 36 copper concentrations in the upper water column near the dam and dissolved 37 copper concentrations immediately downstream from the dam in the winter 38 months.” The report goes on to suggest that this correlation may somehow be 39 related to the operation of the temperature control device as it relates to the 40 seasonal thermocline that develops in Shasta Lake (CVRWQCB 2003a). 41
1-15 Draft – June 2013

Shasta Lake Water Resources Investigation Physical Resources Appendix—Water Quality Technical Report
Upper Sacramento River (Shasta Dam to Red Bluff) 1 A major source of metals to the Sacramento River is drainage from inactive 2 mines in the Iron Mountain area of the West Shasta mining district. During 3 mining and smelting activities from the 1880s to the 1960s, Iron Mountain’s 4 acid mine drainage discharged directly to Spring Creek, a Sacramento River 5 tributary upstream from Redding (USGS 2000b). 6
USGS conducted a water quality assessment of trace metal concentrations in the 7 Sacramento River at Big Bend above Red Bluff from February 1996 to May 8 1998 (USGS 2000b). Although metals concentrations are a serious water quality 9 concern in the project area, metals did not exceed water quality objectives 10 during the study period. 11
The CVRWQCB has determined that the 25-mile segment of the upper 12 Sacramento River between Keswick Dam and Cottonwood Creek near Balls 13 Ferry in Shasta County is impaired because of levels of dissolved cadmium, 14 copper, and zinc that exceed water quality standards (CVRWQCB 2002). The 15 impairment results primarily from inactive mines in the upper Sacramento River 16 watershed, predominantly the Iron Mountain site upstream from Keswick Dam 17 and other mines upstream from Shasta Dam. 18
Water quality enhancement actions at the mines and improved coordination of 19 the Spring Creek and Keswick Reservoirs have resulted in a notable decrease in 20 the number of water quality targets exceeded in the past 10 years. However, 21 metal loading remains high enough to cause periodic exceedances (CVRWQCB 22 2002). The sediments found in the Spring Creek Arm of Keswick Reservoir 23 contain high levels of copper and zinc, which settled out of the contaminated 24 stormwater runoff from the Iron Mountain Mine Superfund site. In 2009 and 25 2010, EPA dredged and removed contaminated sediments at this location with 26 the goal of protecting the downstream Sacramento River ecosystem during 27 storm events, when contaminated sediments can become mobilized and carried 28 downstream. EPA expects that dredging the contaminated sediments will 29 eliminate the last major threat that contamination from the Iron Mountain Mine 30 poses to human health and the environment (EPA 2009). 31
High mercury concentrations in the Sacramento River correlate with 32 concentrations of suspended sediment and high flows, because much of the 33 mercury is transported adsorbed to suspended sediments (Domagalski et al. 34 2000). In May 2000, EPA adopted a water quality objective for total mercury 35 for the Sacramento River watershed of 50 nanograms per liter (ng/L) (30-day 36 average). In a USGS study of mercury levels along the Sacramento River at Big 37 Bend above Red Bluff, conducted from February 1996 to May 1998, mercury 38 levels were consistently below the EPA criterion of 50 ng/L (USGS 2000b). 39
Lower Sacramento River and Delta 40 The downstream tributaries Cache Creek and Putah Creek are known to be 41 substantial sources of mercury to the Sacramento River. The Sacramento River 42
1-16 Draft – June 2013

Chapter 1 Affected Environment
from Knights Landing to the Delta is listed as impaired on EPA’s 303(d) list for 1 mercury (CVRWQCB 2002). 2
The Delta waterways within the area under the CVRWQCB’s jurisdiction are 3 listed on EPA’s 303(d) list as impaired for mercury from agriculture and 4 historic mining, while the western Delta, under the jurisdiction of the 5 SFBRWQCB, is listed as impaired for mercury, nickel, and selenium. The 6 primary sources of mercury are abandoned mine sites in the upper watershed 7 that drain into the lower Sacramento River and Delta. The City of Sacramento is 8 also the largest urban source of nitrogen, mercury, and assorted other urban 9 waste products. Selenium concentrations are attributed to agriculture and oil 10 refiners, while the primary source of nickel is unknown (SWRCB 2006). 11
CVP/SWP Service Areas 12 Water quality in the CVP and SWP service areas is affected by fluctuations of 13 water quality in the south Delta, which in turn are influenced by water quality in 14 the San Joaquin River, CVP and SWP export pumping rates, local agricultural 15 diversions and drainage water, and the Sacramento River (CALFED 2000c). 16
Salinity and Dissolved Solids 17 The following discussion of the affected environment in the study areas with 18 regard to salinity and dissolved solids is limited to a discussion of conditions in 19 the lower Sacramento River and Delta portion of the extended study area 20 because of the potential effects of salinity in this geographic area on beneficial 21 uses. Salinity is particularly important in the Delta, which is influenced by tidal 22 exchange with San Francisco Bay; during low-flow periods, seawater intrusion 23 results in increased salinity. 24
Extended Study Area 25
Lower Sacramento River and Delta Water quality in the Delta is continually 26 changing in response to natural hydrologic conditions, operation of upstream 27 reservoirs, agricultural and water supply diversions, and discharges into the 28 Delta system. Seasonal trends reflect the effects of higher spring/summer runoff 29 and fall/winter low-flow periods. 30
Recognized water quality issues in the Delta include the following (Reclamation 31 and DWR 2005): 32
• High salinity from Suisun Bay intrudes into the Delta during periods of 33 low Delta outflow. Salinity can adversely affect agricultural, M&I, and 34 recreational uses. 35
• Delta exports contain elevated concentrations of disinfection byproduct 36 precursors (e.g., dissolved organic carbon (DOC)), and the presence of 37 bromide increases the potential for formation of brominated 38 compounds in treated drinking water. 39
1-17 Draft – June 2013

Shasta Lake Water Resources Investigation Physical Resources Appendix—Water Quality Technical Report
• Agricultural drainage in the Delta contains high levels of nutrients, 1 suspended solids, DOC and minerals (salinity), as well as agricultural 2 chemicals (pesticides). 3
• Synthetic and natural contaminants have bioaccumulated in Delta fish 4 and other aquatic organisms. Synthetic organic chemicals and heavy 5 metals are found in Delta fish in quantities occasionally exceeding 6 acceptable standards for food consumption. 7
• The San Joaquin River delivers water of relatively poor quality to the 8 Delta, with agricultural drainage to the river being a major source of 9 salts and pollutants. Because the south Delta receives a substantial 10 portion of water from the San Joaquin River, the influence of this 11 relatively poor San Joaquin River water quality is greatest in the south 12 Delta channels and in the CVP and SWP exports. 13
Trends in water quality in the Delta reflect the effects of river inflows, tidal 14 exchanges with San Francisco Bay, diversions, and pollutant releases in the 15 Delta. The north Delta tends to have better water quality primarily because of 16 inflow from the Sacramento River. The quality of water in the west Delta is 17 strongly influenced by tidal exchange with San Francisco Bay; during low-flow 18 periods, seawater intrusion results in increased salinity. In the south Delta, water 19 quality tends to be poorer because of the combination of inflows of poorer water 20 quality from the San Joaquin River, discharges (agricultural return flows) from 21 Delta islands, export pumping, seasonal agricultural barriers, and effects of 22 diversions that can sometimes increase seawater intrusion from San Francisco 23 Bay. 24
The California Department of Water Resources (DWR), Reclamation, USGS, 25 California Data Exchange Center (CDEC), various water and reclamation 26 districts, and various cities monitor water quality in the Delta. City of Stockton 27 Department of Municipal Utilities et al. (2003) discusses water quality data 28 collected historically near the proposed intake site by these agencies. In general, 29 water quality improves from upstream to downstream in the Delta 30 (northwesterly direction). This improvement is due primarily to dilution from 31 higher flows and the quality of the Sacramento River inflow that is drawn 32 southwards to the CVP and SWP pumping plants. 33
Table 1-3 identifies current mean water quality concentrations of selected 34 constituents at various locations in the Delta. As shown, water quality of the 35 north Delta is generally higher than in the south Delta. 36
1-18 Draft – June 2013

Chapter 1 Affected Environment
Table 1-3. Water Quality for Selected Stations in the Delta 1
Location Mean TDS (mg/L)
Mean EC (µmhos/
cm)
Mean Chloride (mg/L)
Mean Bromide (mg/L)
Mean DOC
(mg/L) Sacramento River at Greene’s Landing 100 160 6.8 0.018 2.5
North Bay Aqueduct at Barker Slough 192 332 26 0.015 5.3
Clifton Court Forebay 286 476 77 0.269 4.0
CVP Jones Pumping Plant 258 482 81 0.269 3.7
CCWD Intake at Rock Slough 305 553 109 0.455 3.4
San Joaquin River at Vernalis 459 749 102 0.313 3.9
Sources: CALFED 2000c; data provided by Environmental Science Associates ESA in 2004
Note: Sampling period varies, depending on location and constituent, but generally is between 1990 and 1998.
Key: µmhos/cm = micromhos per centimeter CCWD = Contra Costa Water District CVP = Central Valley Project Delta = Sacramento-San Joaquin Delta DOC = dissolved organic carbon EC = electrical conductivity mg/L = milligrams per liter TDS = total dissolved solids
Salinity Excess salinity in Delta waters may affect M&I and agricultural water 2 supply beneficial uses, as well as habitat quality for aquatic biota in the Delta. 3 Sources of salinity include seawater intrusion, agricultural drainage, municipal 4 wastewater, urban runoff, connate groundwater, and evapotranspiration of 5 plants. Seawater intrusion is the major source of salinity in the Delta (CALFED 6 2000c). 7
TDS and EC are measures of dissolved salts in water. Because the EC of water 8 generally changes proportionately to changes in dissolved salt concentrations, 9 EC is often measured rather than salinity. In fresher waters, TDS is measured 10 instead of salinity. Based on DWR’s Municipal Water Quality Investigations 11 (MWQI) data for Delta channels, TDS is approximately equal to EC times 0.58 12 (CALFED 2000c). 13
Salinity control in the Delta is necessary since the Delta is influenced by the 14 ocean, and Delta water channels are at or below sea level. Unless repelled by 15 continuous seaward flow of freshwater, seawater will advance up the estuary 16 and into the Delta and degrade water quality. Salinity varies geographically and 17 seasonally within the Delta, and also varies depending on water year type 18 (SWRCB 1997). 19
CVP and SWP exports and pumping patterns have the potential to influence the 20 direction of flow at various locations throughout the Delta, and thereby have the 21
1-19 Draft – June 2013

Shasta Lake Water Resources Investigation Physical Resources Appendix—Water Quality Technical Report
potential to affect the salinity at export locations. Operation of the Banks and 1 Jones pumping plants draws high quality Sacramento River water across the 2 Delta and restricts the low quality area to the southeast corner (SWRCB 1997). 3 Each portion of the Delta is dominated by different hydraulic variables and, 4 therefore, salinity varies within different sections of the Delta. 5
The Sacramento and San Joaquin rivers contribute approximately 61 percent 6 and 33 percent, respectively, to tributary inflow TDS concentrations within the 7 Delta. TDS concentrations are relatively low in the Sacramento River, but 8 because of its large volumetric contribution, the river provides the majority of 9 the TDS load supplied by tributary inflow to the Delta (DWR 2001). Although 10 actual flow from the San Joaquin River is lower than from the Sacramento 11 River, TDS concentrations in San Joaquin River water average approximately 12 seven times that in the Sacramento River. 13
In addition to varying geographically within the Delta, salinity varies 14 seasonally, depending on the quantity and quality of freshwater inflows. During 15 winter and early spring, flows through the Delta are usually above the minimum 16 required to control salinity. However, for a few months in summer and fall of 17 most years, salinity must be carefully monitored and controlled (SWRCB 1997). 18 During the summer, salinity in the Delta may increase due to decreased inflows 19 or increased salt loading resulting from agricultural runoff. Additionally, 20 decreased inflow during late summer increases the possibility that reverse flow 21 could cause increased salt water intrusion within the Delta. Salinity control and 22 monitoring is provided by the CVP and SWP, and regulated by the SWRCB 23 under its water rights authority. Salinity is carefully monitored because water 24 exported from the Delta for delivery to CVP and SWP contractors is used for a 25 variety of M&I and agricultural uses (SWRCB 1997). 26
Table 1-3 shows that mean TDS concentrations are highest in the western Delta 27 and the south Delta channels that are affected by the San Joaquin River 28 (CALFED 2000c). Salinity problems in the western Delta result primarily from 29 the intrusion of saline water from the San Francisco Bay system. The extent of 30 seawater intrusion into the Delta is a function of daily tidal fluctuations, 31 freshwater inflow from the Sacramento and San Joaquin rivers, the rate of 32 export at the CVP/SWP intake pumps, and the operation of various control 33 structures (e.g., Delta Cross Channel Gates and Suisun Marsh Salinity Control 34 System) (DWR 2001). In the south Delta, salinity is largely associated with the 35 high salt concentrations carried by the San Joaquin River into the Delta 36 (SWRCB 1997). The high mean TDS concentration in the San Joaquin River at 37 Vernalis reflects the accumulation of salts in agricultural soils and the effects of 38 recirculation of these salts via the Delta-Mendota Canal (CALFED 2000c). 39 Locations in the north Delta at Barker Slough, which is not substantially 40 affected by seawater intrusion, and in the Sacramento River at Greene’s 41 Landing, have lower mean concentrations of TDS. A similar pattern is also seen 42 using mean EC levels as a surrogate for TDS concentrations (Reclamation and 43 DWR 2003). 44
1-20 Draft – June 2013

Chapter 1 Affected Environment
Seasonal changes in chloride concentrations occur in the Delta. The lowest 1 mean concentrations of chloride typically occur in early spring and early 2 summer (March through July) (CALFED 2000c). Salinity patterns in the Delta 3 also vary with water year type (DWR 2001). Salinity is higher in dry years than 4 in wet years. 5
Bromide The primary source of bromide in the Delta is saltwater intrusion. 6 Other sources include drainage returns in the San Joaquin River and the Delta, 7 connate water (saline water trapped in sediment when the sediment was 8 deposited) beneath some Delta islands, and possibly agricultural applications of 9 methyl bromide. River and agricultural irrigation sources are primarily a 10 recycling of bromide that originated from seawater intrusion. As shown in Table 11 1-3, TDS, EC, bromide, and chloride data indicate that seawater intrusion is 12 highest in the western and southern portions of the Delta, where the direct 13 effects of recirculated bromide from the San Joaquin River exist (DWR 2001). 14
Overall, bromide patterns in the Delta are similar to salinity patterns in the Delta 15 (DWR 2001). Like salinity, bromide concentrations are highest in the west and 16 south Delta channels affected by the San Joaquin River (DWR 2001). Like 17 salinity, bromide concentrations are higher in dry years than in wet years and 18 bromide concentrations are higher during low Delta outflows as compared to 19 medium or high flows (DWR 2001). 20
Bromide is important from a drinking water perspective because during 21 chlorination for disinfection of drinking water, bromide reacts with natural 22 organic compounds in the water to form disinfectant byproducts (DBP) such as 23 trihalomethanes (THM). Four types of THMs are regulated in drinking water, 24 including chloroform, bromodichloromethane, dibromochloromethane, and 25 bromoform. 26
Organic Carbon Naturally occurring organic carbon compounds are present in 27 surface waters as a result of degradation of plant and animal tissues. Two forms 28 of organic carbon occur in surface waters: (1) DOC, which is a measure of the 29 organic carbon dissolved in the water, and (2) total organic carbon (TOC), 30 which is a measure of all organic carbon in the water, including organic carbon 31 from particulate matter such as plant residues and DOC. Organic carbon is 32 important because of its role in the formation of DBPs, specifically THMs. 33
The Sacramento and San Joaquin rivers, and in-Delta island drainage return 34 flows, are important sources of DOC and TOC to the Delta (CALFED 2000c). 35 Of the DOC loading contributed by tributary inflow, the Sacramento River is 36 the major contributor to the Delta carbon load, contributing an estimated 71 37 percent of the total carbon load attributed to tributary inflow in the Delta (DWR 38 2001). The Sacramento River is a major contributor because although its carbon 39 concentrations are relatively low, approximately three-quarters of the inflow to 40 the Delta come from the Sacramento River (DWR 2001). The San Joaquin 41
1-21 Draft – June 2013

Shasta Lake Water Resources Investigation Physical Resources Appendix—Water Quality Technical Report
River contributes approximately 20 percent of the total carbon load attributed to 1 tributary inflow in the Delta (DWR 2001). 2
Drainage from Delta islands, particularly islands with highly organic peat soils, 3 contributes significantly to the DOC load in the Delta (DWR 2001). Studies 4 conducted by DWR (2001) suggest that during winter, 38–52 percent of the 5 DBP-forming carbon in the Delta is contributed by Delta island drainage; while 6 during summer irrigation, island drainage contributes 40–45 percent of the 7 DBP-forming carbon. In general, monitoring data suggest that most of the TOC 8 in the Delta is in the form of DOC (CALFED 2000c). 9
Similar to salinity and bromide, organic carbon concentrations in the Delta vary 10 both geographically and seasonally. Like salinity and bromide, organic carbon 11 concentrations are higher in west and south Delta locations (the San Joaquin 12 River near Vernalis and Banks Pumping Plant) than in the Sacramento River at 13 Greene’s Landing (Table 1-3). However, unlike salinity and bromide, organic 14 carbon concentrations are typically lowest in summer and higher during rainy 15 winter months. 16
Regulatory Framework 17
Several regulatory authorities at the Federal, State, and local levels control the 18 flow, quality, and supply of water in California either directly or indirectly. This 19 section of this chapter focuses on those laws related directly to the water quality 20 aspect of the project. 21
Management of the Delta is partly determined by Federal and State regulations 22 developed to protect both human and environmental beneficial uses. Primary 23 institutional and regulatory influences on the use and management of the Delta 24 include the Federal CVP, the SWP, direct Delta diverters, including Contra 25 Costa Water District (CCWD), Solano County Water Agency (SCWA), and the 26 City of Stockton Metropolitan Area (COSMA), San Francisco Bay water 27 quality needs, and multiple regulations covering protection of endangered 28 species. 29
At the State level, the SWRCB and the regional water quality control boards 30 (RWQCB) regulate and monitor Delta water quality. Nine regional boards 31 oversee water quality in California. Two of these, the CVRWQCB and 32 SFBRWQCB, oversee Delta water quality. EPA also plays an important role 33 under the auspices of the CWA and Safe Drinking Water Act (SDWA). The 34 California Department of Public Health (DPH) has an interest in the Delta 35 because the Delta is the source of drinking water for over 23 million 36 Californians. DWR extensively monitors Delta water quality as part of its 37 MWQI program and DWR, in cooperation with Reclamation, monitors Delta 38 water quality under the SWRCB’s compliance monitoring requirements. 39
1-22 Draft – June 2013

Chapter 1 Affected Environment
At the local level, water agencies that divert from the Delta have both strong 1 interest in and influence on Delta water quality management. These agencies 2 include CCWD, SCWA, and COSMA. 3
Two agencies with key planning roles in the Delta are the California Bay-Delta 4 Authority and the Delta Protection Commission. The California Bay-Delta 5 Authority became a State agency in January 2003, and is responsible for 6 implementing the CALFED Bay-Delta Program (CALFED). State legislation 7 created the Delta Protection Commission in 1992 with the goal of developing 8 regional policies for the Delta to protect and enhance existing land uses. In 9 2000, the Commission was made a permanent State agency. The Delta 10 Protection Commission comments on applications for CALFED ecosystem 11 restoration grants that affect the Delta and participates in meetings with other 12 CALFED agencies to provide input to CALFED management decisions. 13
Federal 14
Safe Drinking Water Act 15 The SDWA was established to protect the quality of drinking water in the 16 United States. The SDWA authorized EPA to set National health-based 17 standards for drinking water and requires many actions to protect drinking water 18 and its sources, including rivers, lakes, reservoirs, springs, and groundwater 19 wells. Furthermore, the SDWA requires all owners or operators of public water 20 systems to comply with primary (health-related) standards. EPA has delegated 21 to the DPH, Division of Drinking Water and Environmental Management, the 22 responsibility for administering California’s drinking-water program. DPH is 23 accountable to EPA for program implementation and for adopting standards and 24 regulations that are at least as stringent as those developed by EPA. 25 Contaminants of concern relevant to domestic water supply are defined as those 26 that pose a public health threat or that alter the aesthetic acceptability of the 27 water. These types of contaminants are regulated by EPA primary and 28 secondary maximum contaminant levels (MCL) that are applicable to treated 29 water supplies delivered to the distribution system. MCLs and the process for 30 setting these standards are reviewed triennially. 31
Clean Water Act 32 The CWA is the major Federal legislation governing the water quality aspects 33 of the project. The objective of the act is “to restore and maintain the chemical, 34 physical, and biological integrity of the nation’s waters.” The CWA establishes 35 the basic structure for regulating discharge of pollutants into the waters of the 36 United States and gives EPA the authority to implement pollution control 37 programs such as setting wastewater standards for industries (EPA 2008). In 38 certain states such as California, EPA has delegated authority to state agencies. 39
Section 303 This section of the CWA requires states to adopt water quality 40 standards for all surface waters of the United States. The three major 41 components of water quality standards are as follows: 42
1-23 Draft – June 2013
Shasta Lake Water Resources Investigation Physical Resources Appendix—Water Quality Technical Report
• Designated uses – Uses that society, through the Federal and State 1 governments, determines should be attained in the water body, such as 2 supporting communities of aquatic life, supplying water for drinking, 3 irrigating crops and landscaping, and industrial purposes, and 4 recreational uses (e.g., fishing, swimming, boating). 5
• Water quality criteria – Levels of individual pollutants or water 6 quality characteristics, or descriptions of conditions of a water body 7 that, if met, will generally protect the designated use of the water. 8 Water quality criteria must be scientifically consistent with attainment 9 of designated uses, which means that only scientific considerations can 10 be taken into account when determining what water quality conditions 11 are consistent with meeting a given designated use. Economic and 12 social impacts are not considered when developing water quality 13 criteria. 14
• Antidegradation policy – Designed to prevent deterioration of existing 15 levels of good water quality (see the “Antidegradation Policy” section 16 below for more information). 17
Where multiple uses exist, water quality standards must protect the most 18 sensitive use. In California, EPA has given the SWRCB and its nine RWQCBs 19 the authority to identify beneficial uses and adopt applicable water quality 20 objectives. 21
Section 303(d) of the CWA requires states and authorized Native American 22 tribes to develop a list of water quality–impaired segments of waterways. 23 The list includes waters that do not meet water quality standards necessary to 24 support the beneficial uses of that waterway, even after point sources of 25 pollution have installed the minimum required levels of pollution control 26 technology. Only waters impaired by “pollutants,” not those impaired by other 27 types of “pollution” (e.g., altered flow and/or channel modification), are to be 28 included on the list. 29
Section 303(d) of the CWA also requires states to maintain a listing of impaired 30 water bodies so that a TMDL can be established A TMDL is a plan to restore 31 the beneficial uses of a stream or to otherwise correct an impairment. It 32 establishes the allowable pollutant loadings or other quantifiable parameters 33 (e.g., pH or temperature) for a water body and thereby provides the basis for the 34 establishment of water quality–based controls. The calculation for establishment 35 of TMDLs for each water body must include a margin of safety to ensure that 36 the water body can be used for the purposes the State has designated. 37 Additionally, the calculation also must account for seasonal variation in water 38 quality (EPA 2011). The CVRWQCB develops TMDLs for the Sacramento 39 River (see discussion on the Porter-Cologne Water Quality Control Act below). 40 Sedimentation/siltation impacts are the primary water quality parameters of 41 concern with construction projects. 42
1-24 Draft – June 2013

Chapter 1 Affected Environment
Reductions in pollutant loading are achieved by implementing strategies 1 authorized by the CWA, such as the following, which are discussed in more 2 detail below. 3
• Section 401 – This section of the CWA requires Federal agencies to 4 obtain certification from the State or Native American tribes before 5 issuing permits that would result in increased pollutant loads to a water 6 body. The certification is issued only if such increased loads would not 7 cause or contribute to exceedances of water quality standards. 8
• Section 402 – This section creates the National Pollutant Discharge 9 Elimination System (NPDES) permit program. This program covers 10 point sources of pollution discharging into a surface water body. 11
• Section 404 – This section regulates the placement of dredged or fill 12 materials into wetlands and other waters of the United States. 13
Section 401 – Water Quality Certification This section of the CWA requires 14 an applicant for any Federal license or permit (e.g., a Section 404 permit) that 15 may result in a discharge into waters of the United States to obtain a 16 certification from the State that the discharge would comply with provisions of 17 the CWA. The SWRCB and RWQCBs administer this program. The SWRCB 18 issues 401 certifications for projects that would take place in two or more 19 regions. Any condition of a 401 certification (or water quality certification) 20 would be incorporated into the U.S. Army Corps of Engineers (USACE) permit. 21
The CVRWQCB has jurisdiction over the primary study area, while the 22 extended study area encompasses the San Francisco Bay, Central Coast, Los 23 Angeles, Lahontan, Colorado River basin, and the Santa Ana and San Diego 24 RWQCBs. A 401 certification would not be required from the RWQCBs within 25 the extended study area because no construction would occur in the extended 26 study area. 27
Section 402 – National Pollutant Discharge Elimination System All point 28 sources that discharge into waters of the United States must obtain a NPDES 29 permit under provisions of Section 402 of the CWA. As with Section 401, the 30 SWRCB and RWQCBs are responsible for the implementation of the NPDES 31 permitting process at the State and regional levels, respectively. 32
The NPDES permit process also provides a regulatory mechanism for the 33 control of nonpoint source pollution created by runoff from construction and 34 industrial activities, and general and urban land use, including runoff from 35 streets. Projects involving construction activities (e.g., clearing, grading, or 36 excavation) involving land disturbance greater than one acre must file a Notice 37 of Intent (NOI) with the appropriate RWQCB(s) to indicate their intent to 38 comply with the General Permit for Discharges of Storm Water Associated with 39 Construction Activity (Construction General Permit 99-08-DWQ). This general 40
1-25 Draft – June 2013

Shasta Lake Water Resources Investigation Physical Resources Appendix—Water Quality Technical Report
permit establishes conditions to minimize sediment and pollutant loadings and 1 requires preparation and implementation of a storm water pollution prevention 2 plan (SWPPP) before construction. The SWPPP is intended to help identify the 3 sources of sediment and other pollutants, and to establish best management 4 practices (BMP) for stormwater and nonstormwater source control and pollutant 5 control. A sediment monitoring plan must be included in the SWPPP if the 6 discharges occur directly to a water body listed on the 303(d) TMDL list for 7 sediment. 8
The CVRWQCB has jurisdiction over the primary study area. An NPDES 9 would not be required from the RWQCBs within the extended study area 10 because no construction would occur. 11
Section 404 – Discharge of Dredged or Fill Material into Waters of the 12 United States Section 404 deals with one broad type of pollution—the 13 placement of dredged or fill material into “waters of the United States.” 14 Jurisdictional limits of these features are typically noted by the ordinary high-15 water mark. Isolated ponds or seasonal depressions had been previously 16 regulated as waters of the United States. However, in Solid Waste Agency of 17 Northwestern Cook County (SWANCC) v. United States Army Corps of 18 Engineers et al. (January 8, 2001), the U.S. Supreme Court ruled that certain 19 “isolated” wetlands (e.g., nonnavigable, isolated, and intrastate) do not fall 20 under the jurisdiction of the CWA and are no longer under USACE jurisdiction. 21 Some circuit courts (e.g., U.S. v. Deaton, 2003; U.S. v. Rapanos, 2003; 22 Northern California River Watch v. City of Healdsburg, 2006), however, have 23 ruled that SWANCC does not prevent CWA jurisdiction if a “significant nexus” 24 such as a hydrologic connection exists. The hydrologic connection may be 25 human-made (e.g., roadside ditch) or a natural tributary to navigable waters, or 26 direct seepage from the wetland to the navigable water, a surface or 27 underground hydraulic connection. An ecological connection (e.g., the same 28 bird, mammal, and fish populations are supported by both the wetland and the 29 navigable water) and changes to chemical concentrations in the navigable water 30 caused by water from the wetland may also constitute a significant nexus. 31
The discharge of dredge or fill generally includes the following activities: 32
• Placement of fill that is necessary for the construction of any structure 33 or infrastructure in a water of the United States 34
• The building of any structure, infrastructure, or impoundment requiring 35 rock, sand, dirt, or other material for its construction 36
• Site-development fills for recreational, industrial, commercial, 37 residential, or other uses 38
• Causeways or road fills 39
1-26 Draft – June 2013

Chapter 1 Affected Environment
• Dams and dikes 1
• Artificial islands 2
• Property protection and/or reclamation devices such as riprap, groins, 3 seawalls, breakwaters, and revetments 4
• Beach nourishment 5
• Levees 6
• Fill for structures such as sewage treatment facilities, intake and outfall 7 pipes associated with powerplants, and subaqueous utility lines 8
• Placement of fill material for construction or maintenance of any liner, 9 berm, or other infrastructure associated with solid waste landfills 10
• Placement of overburden, slurry, mine tailing deposits, or similar 11 mining-related materials 12
• Artificial reefs 13
USACE regulations and policies mandate avoiding the filling of wetlands unless 14 it can be demonstrated that no practicable alternatives (to filling wetlands) exist. 15 Four basic processes exist for obtaining Section 404 authorization from 16 USACE. Because of its scale and potential impact, this project would require an 17 individual permit. 18
USACE’s Sacramento District has jurisdiction over the primary study area, but 19 the extended study area encompasses the USACE’s San Francisco and Los 20 Angeles Districts. 21
Antidegradation Policy 22 The Antidegradation Policy, established in 1968 and revised in 2005 (Title 40, 23 Code of Federal Regulations, Section 131.12), is designed to protect existing 24 uses and water quality and National water resources, as authorized by Section 25 303(c) of the CWA. At a minimum, the policy and implementation methods 26 must be consistent with the following: 27
• Existing instream water uses and the level of water quality necessary to 28 protect the existing uses shall be maintained and protected. 29
• Where the quality of the waters exceeds levels necessary to support 30 propagation of fish, shellfish, and wildlife and recreation in and on the 31 water, that quality shall be maintained and protected unless the State 32 finds that allowing lower water quality is necessary to accommodate 33 important economic or social development in the area in which the 34
1-27 Draft – June 2013

Shasta Lake Water Resources Investigation Physical Resources Appendix—Water Quality Technical Report
waters are located. In allowing such degradation or lower water quality, 1 the State shall assure water quality adequate to protect existing uses 2 fully. Further, the State shall assure that there shall be achieved the 3 highest statutory and regulatory requirements for all new and existing 4 point sources and all cost-effective and reasonable BMPs for nonpoint 5 source control. 6
• Where high-quality waters constitute an outstanding National resource, 7 such as waters of National and State parks and wildlife refuges and 8 waters of exceptional recreational or ecological significance, that water 9 quality shall be maintained and protected. 10
Although the quality of water in the upper Sacramento River is relatively good, 11 water quality problems do occur, including the presence of mercury, pesticides 12 such as organochlorine pesticides, trace metals, turbidity, and toxicity from 13 unknown origin (CALFED 2000a). 14
The CWA requires states to maintain a listing of impaired water bodies so that a 15 TMDL can be established. A TMDL is a plan to restore the beneficial uses of a 16 stream or to otherwise correct an impairment. The most prevalent contaminants 17 in the Sacramento River basin are for organophosphate pesticides (agricultural 18 runoff) and trace metals (acid mine drainage), for which TMDLs currently are 19 being considered. Only during conditions of stormwater-driven runoff are water 20 quality objectives typically not met (Domagalski et al. 2000). 21
Shasta-Trinity National Forest Land and Resource Management Plan 22 The Shasta-Trinity National Forest Land and Resource Management Plan 23 (STNF LRMP) contains Forest goals, standards, and guidelines designed to 24 guide the management of STNF. The following goals, standards, and guidelines 25 related to water quality issues associated with the study areas were excerpted 26 from the STNF LRMP (USFS 1995). 27
Water Quality 28
Goals (LRMP, p.4-6) 29 • Maintain or improve water quality and quantity to meet fish habitat 30
requirements and domestic use needs. 31
• Maintain water quality to meet or exceed applicable standards and 32 regulations. 33
Standards and Guidelines (LRMP, p. 4-25) 34 • Implement BMPs for protection or improvement of water quality, as 35
described in “Water Quality Management for National Forest System 36 Lands in California,” for applicable management activities. Determine 37 specific practices or techniques during project level planning using 38
1-28 Draft – June 2013

Chapter 1 Affected Environment
information obtained from on-site soil, water, and geology 1 investigations. 2
Best Management Practices 3
Standards and Guidelines (LRMP, Appendix E) 4 • STNF water quality BMPs were developed in compliance with Section 5
208 of the CWA, Public Law 92-500, as amended and are certified by 6 the RWQCB and approved by EPA. The following BMPs are 7 applicable to the proposed action: 8
Road Building and Site Construction 9
Standards and Guidelines (LRMP, Appendix E, pp. E-2 through E-3) 10 • General guidelines for the location and design of roads 11
• Erosion control plan 12
• Timing of construction activities 13
• Road slope stabilization (preventive practice) 14
• Road slope stabilization (administrative practice) 15
• Dispersion of subsurface drainage from cut and fill slopes 16
• Control of road drainage 17
• Construction of stable embankments 18
• Minimization of sidecast material 19
• Servicing and refueling equipment 20
• Control of construction in riparian management zones 21
• Controlling in-channel excavation 22
• Diversion of flows around construction sites 23
• Bridge and culvert installation 24
• Disposal of right-of-way and roadside debris 25
• Specifying riprap composition 26
• Maintenance of roads 27
1-29 Draft – June 2013

Shasta Lake Water Resources Investigation Physical Resources Appendix—Water Quality Technical Report
• Road surface treatment to prevent loss of materials 1
• Traffic control during wet periods 2
• Surface erosion control at facility sites 3
Recreation 4
Standards and Guidelines (LRMP, Appendix E, p. E-3) 5 • Sampling and surveillance of designated swimming sites 6
• On-site interdisciplinary sanitary surveys will be conducted to augment 7 the sampling of swimming waters 8
• Documentation of water quality data 9
• Control of sanitation facilities 10
• Control of refuse disposal 11
• Protection of water quality within developed and dispersed recreation 12 areas 13
U.S. Bureau of Land Management 14 The U.S. Bureau of Land Management’s (BLM) Resource Management Plan 15 (RMP), which is its plan for managing Federal lands in Shasta County, was 16 amended by the 1994 Record of Decision (ROD) for the Northwest Forest Plan 17 (Final Supplemental Environmental Impact Statement (EIS) for Amendments to 18 Forest Service and Bureau of Land Management Planning Documents within 19 the Range of the Northern Spotted Owl). This amendment required preparation 20 of Watershed Analysis before initiating BLM activities. As a party to the 21 Northwest Forest Plan, BLM, like USFS, is also required to ensure that projects 22 are consistent with the Aquatic Conservation Strategy. 23
Biological Opinions on the Long-term Central Valley Project and State 24 Water Project Operations Criteria and Plan 25 Since 2004, NMFS and USFWS BOs regarding effects of the proposed OCAP 26 have been revised twice. On October 22, 2004, NMFS issued a BO regarding 27 effects of the proposed OCAP for the CVP in coordination with the SWP on 28 winter-run Chinook salmon, spring-run Chinook salmon, Central Valley 29 steelhead, Southern Oregon/Northern California Coast Coho salmon, and 30 Central California Coast steelhead and their designated critical habitat. On 31 February 16, 2005, USFWS issued a BO regarding effects of the proposed 32 OCAP on delta smelt. The 2004 and 1995 BOs supersede the prior BOs issued 33 by NMFS and USFWS, and contain reasonable and prudent measures and terms 34 and conditions that specify fisheries monitoring actions, spawning gravel 35 augmentation, forecasting of deliverable water, management of cold-water 36
1-30 Draft – June 2013

Chapter 1 Affected Environment
supply within reservoirs, temperature monitoring, adaptive management 1 processes to analyze annual cold-water management, minimization of flow 2 fluctuations, passage at Red Bluff Diversion Dam, operation of gates in the 3 Delta, fish screening at pumping facilities, and numerous other effects 4 minimization measures. In response to litigation, the 2004 and 2005 BOs were 5 remanded to USFWS and NMFS. 6
In August 2008, Reclamation reinitiated consultation with the fishery agencies 7 based on the 2008 Biological Assessment on the Continued Long-Term 8 Operations of the CVP and SWP (2008 OCAP BA). In December 2008, the 9 USFWS issued a new BO, Formal Endangered Species Act Consultation on the 10 Proposed Coordinated Operations of the CVP and SWP, finding that the long-11 term operations of the CVP and SWP would jeopardize the continued existence 12 of the Delta smelt. In July 2009, NMFS issued a new BO finding that the same 13 operations would jeopardize populations of listed salmonids, steelhead, green 14 sturgeon and orcas. Because both agencies made jeopardy determinations, both 15 agencies included a reasonable and prudent alternative (RPA) in their BOs. 16
In response to lawsuits challenging the 2008 and 2009 BOs, the District Court 17 for the District Court remanded the BOs to USFWS and NMFS in 2010 and 18 2011, respectively. The District Court ordered USFWS and Reclamation to 19 prepare a final BO and associated final NEPA document by December 1, 2013. 20 Similarly, the District Court ordered NMFS and Reclamation to prepare a final 21 BO and associated final NEPA document by February 1, 2016. These legal 22 challenges may result in changes in CVP and SWP operational constraints, if 23 the revised USFWS and NMFS BOs contain new or amended RPAs. Despite 24 this uncertainty, the 2008 OCAP BA and the 2008 and 2009 BOs issued by the 25 fishery agencies contain the most recent estimate of potential changes in water 26 operations that could occur in the near future. Furthermore, it is anticipated that 27 the final BOs issued by the resource agencies will contain similar RPAs. 28
State 29
Porter-Cologne Water Quality Control Act 30 The Porter-Cologne Water Quality Control Act (Porter-Cologne Act) is 31 California’s statutory authority for the protection of water quality. Under the 32 act, the State must adopt water quality policies, plans, and objectives protecting 33 the State’s waters for the use and enjoyment of the people. Obligations of the 34 SWRCB and RWQCBs to adopt and periodically update their basin plans are 35 set forth in the act. A basin plan identifies the designated beneficial uses for 36 specific surface water and groundwater resources, applicable water quality 37 objectives necessary to support the beneficial uses, and implementation 38 programs that are established to maintain and protect water quality from 39 degradation for each of the RWQCBs. The act also requires waste dischargers 40 to notify the RWQCBs of their activities through the filing of reports of waste 41 discharge (RWD) and authorizes the SWRCB and RWQCBs to issue and 42 enforce waste discharge requirements (WDR), NPDES permits, Section 401 43
1-31 Draft – June 2013

Shasta Lake Water Resources Investigation Physical Resources Appendix—Water Quality Technical Report
water quality certifications, or other approvals. The RWQCBs also have 1 authority to issue waivers to RWDs/WDRs for broad categories of “low threat” 2 discharge activities that have minimal potential for adverse water quality effects 3 when implemented according to prescribed terms and conditions. 4
The CVRWQCB Basin Plan (originally published in 1998, last revised in 5 September 2009) (CFRWQCB 2009) regulates waters of the State located 6 within the primary study area. The CVRWQCB Basin Plan covers an area 7 including the Sacramento and San Joaquin River basins, involving an area 8 bounded by the crests of the Sierra Nevada on the east and the Coast Range and 9 Klamath Mountains on the west. The area covered in the CVRWQCB Basin 10 Plan extends some 400 miles, from the California/Oregon border southward to 11 the headwaters of the San Joaquin River, encompassing a substantial portion of 12 the extended study area. The beneficial uses of the Sacramento River are as 13 follows (CVRWQCB 2009): 14
• Municipal and domestic supply 15
• Irrigation and stock watering 16
• Service supply 17
• Power 18
• Contact recreation and canoeing and rafting 19
• Other noncontact recreation 20
• Freshwater habitat (warm and cold) 21
• Migration habitat (warm and cold) 22
• Spawning habitat (warm and cold) 23
• Wildlife habitat 24
• Navigation 25
The Basin Plan recognizes Shasta Reservoir (i.e., Shasta Lake) as a discrete 26 water body and identifies a number of specific beneficial uses: 27
• Municipal and domestic supply 28
• Agricultural supply 29
• Hydropower generation 30
• Water contact recreation 31
1-32 Draft – June 2013

Chapter 1 Affected Environment
• Noncontact recreation 1
• Freshwater habitat (warm and cold) 2
• Spawning, reproduction, and/or early development 3
• Wildlife habitat 4
The CVRWQCB has also promulgated water quality objectives for all surface 5 waters in the Sacramento and San Joaquin River basins (CVRWQCB 2009) for 6 the following: 7
• Bacteria levels 8
• Biostimulatory substances 9
• Chemical constituents 10
• Color 11
• Dissolved oxygen 12
• Floating material 13
• Methylmercury 14
• Oil and grease 15
• pH 16
• Pesticides 17
• Radioactivity 18
• Salinity 19
• Sediment 20
• Settleable material 21
• Suspended material 22
• Tastes and odors 23
• Temperature 24
• Toxicity 25
• Turbidity 26
1-33 Draft – June 2013

Shasta Lake Water Resources Investigation Physical Resources Appendix—Water Quality Technical Report
Primary Study Area The CVRWQCB determined that the 25-mile reach of 1 the Sacramento River from Keswick Dam downstream to Cottonwood Creek is 2 impaired because the water periodically contains levels of dissolved cadmium, 3 copper, and zinc that exceed levels identified to protect aquatic organisms. 4 Consequently, the CVRWQCB developed a TMDL program for dissolved 5 cadmium, copper, and zinc loading into the upper Sacramento River because of 6 these exceedances of water quality standards (CVRWQCB). No other TMDLs 7 have been finalized for this area (CVRWQCB 2007a). 8
Extended Study Area The Sacramento River downstream from RBPP was 9 listed as an impaired water body under Section 303(d) of the CWA. The 10 parameters of concern in this reach included diazinon, mercury and unknown 11 sources of toxicity (CVRWQCB 2003b). A few TMDLs are under development 12 for the Sacramento River, including diazinon, methylmercury, and chlorpyrifos 13 (CVRWQCB 2007b). The extended study area encompasses the San Francisco, 14 Central Coast, Los Angeles, Lahontan, Colorado River basin, and the Santa Ana 15 and San Diego RWQCBs. 16
RWQCBs are responsible for preparing and adopting basin plans, as required by 17 the California Water Code (Section 13240) and supported by the CWA. Section 18 303 of the CWA requires states to adopt water quality standards that consist of 19 the designated uses of the navigable waters involved and the water quality 20 criteria for such waters based upon such uses. Basin plans are regulatory 21 references for meeting the State and Federal requirements for water quality. 22 Each basin plan designates beneficial uses for the waters within the area 23 covered by the plan, water quality objectives to protect those uses, and a 24 program for achieving the objectives. 25
The Basin Plan for the Sacramento and San Joaquin River basins was prepared 26 by the CVRWQCB. The Basin Plan was first adopted in 1975 and has since 27 been updated. The most recent edition, the fourth edition, was adopted in 1998 28 and amended in 2004. The Basin Plan recognizes Shasta Reservoir (i.e., Shasta 29 Lake) as a discrete water body and identifies a number of specific beneficial 30 uses: 31
• Municipal and domestic supply – Uses of water for community, 32 military, or individual water supply systems, including, but not limited 33 to, drinking water supply. 34
• Agricultural supply – Uses of water for farming, horticulture, or 35 ranching, including, but not limited to, irrigation (including leaching of 36 salts), stock watering, or support of vegetation for range grazing. 37
• Hydropower generation – Uses of water for hydropower generation. 38
• Water contact recreation – Uses of water for recreational activities 39 involving body contact with water where ingestion of water is 40
1-34 Draft – June 2013

Chapter 1 Affected Environment
reasonably possible. These uses include, but are not limited to, 1 swimming, wading, water-skiing, water boarding, fishing, or use of 2 personal watercraft. 3
• Noncontact recreation – Uses of water for recreational activities 4 involving proximity to water, but where there is generally no body 5 contact with water nor any likelihood of ingestion of water. These uses 6 include, but are not limited to, picnicking, sunbathing, hiking, camping, 7 boating, hunting, sightseeing, or aesthetic enjoyment in conjunction 8 with the above activities. 9
• Freshwater habitat: 10
− Warm freshwater habitat – Uses of water that support warm 11 water ecosystems, including, but not limited to, preservation or 12 enhancement of aquatic habitats, vegetation, fish (e.g., black bass, 13 catfish), or wildlife, including invertebrates. 14
− Cold freshwater habitat – Uses of water that support cold-water 15 ecosystems, including, but not limited to, preservation or 16 enhancement of aquatic habitats, vegetation, fish (e.g., salmon, 17 trout), or wildlife, including invertebrates. 18
• Spawning, reproduction, and/or early development – Uses of water 19 that support high-quality aquatic habitats suitable for reproduction and 20 early development of fish (i.e., warm water for bass; cold water for 21 salmon and trout). 22
• Wildlife habitat – Uses of water that support terrestrial or wetland 23 ecosystems, including, but not limited to, preservation and 24 enhancement of terrestrial habitats or wetlands, vegetation, wildlife 25 (e.g., mammals, birds, reptiles, amphibians, invertebrates), or wildlife 26 water and food sources. 27
The Basin Plan provides the foundation for assessing the water quality of Shasta 28 Lake and ensuring that any waste water discharges are in compliance with the 29 Basin Plan. The following discussion provides an overview of the history and 30 regulatory requirements for waste water discharges in Shasta Lake. 31
Clean Water Act Section 401 Water Quality Certification 32 The CVRWQCB, under the auspices of the SWRCB, requires that a project 33 proponent obtain a Clean Water Act Section 401 water quality certification in 34 conjunction with the Section 404 permits granted by the Corps. Since the 35 project would have the potential to affect water quality in Shasta Lake, the 36 CVRWQCB is likely to impose water quality limitations on the project through 37 waste discharge requirements. Reclamation will prepare and submit to the 38 RWQCB a request for water quality certification prior to development of the 39 project. A likely condition of the water quality certification is preparation of an 40
1-35 Draft – June 2013

Shasta Lake Water Resources Investigation Physical Resources Appendix—Water Quality Technical Report
erosion and sedimentation control plan and a spill prevention and containment 1 plan. 2
Waste Discharge Permit 3 The CVRWQCB controls the discharge of wastes to surface waters from 4 industrial processes or construction activities through the NPDES permit 5 process. Waste discharge requirements are established in the permit to protect 6 beneficial uses. The CVRWQCB will require an application for a waste 7 discharge permit for the project. 8
Industrial Storm Water General Permit 9 The Industrial Storm Water General Permit (General Industrial Permit) is an 10 NPDES permit that regulates discharges associated with 10 broad categories of 11 industrial activities. This permit requires the implementation of management 12 measures that will achieve the performance standard of best available 13 technology economically achievable and best conventional pollutant control 14 technology. This permit also requires the development of a SWPPP and a 15 monitoring plan. Through the SWPPP, sources of pollutants are to be identified 16 and the means to manage the sources to reduce stormwater pollution are 17 described. 18
Storm Water Pollution Prevention Plan 19 The General Industrial Permit includes provisions for developing a SWPPP to 20 maximize the potential benefits of pollution prevention and sediment- and 21 erosion-control measures at construction sites. Developing and implementing a 22 SWPPP would provide Reclamation with the framework for reducing soil 23 erosion and minimizing pollutants in stormwater during project construction. 24
Water Quality Control Plan for the Control of Temperature in the Coastal 25 and Interstate Waters and Enclosed Bays and Estuaries of California 26 The Water Quality Control Plan for the Control of Temperature in the Coastal 27 and Interstate Waters and Enclosed Bays and Estuaries of California (Thermal 28 Plan) sets limits for “thermal waste” and “elevated temperature waste” 29 discharged into coastal and interstate waters and enclosed bays and estuaries of 30 California (SWRCB no date). Estuarine waters are considered to extend from 31 “…a bay or the open ocean to the upstream limit of tidal action” (SWRCB no 32 date). This definition includes the Delta as defined by Section 12220 of the 33 California Water Code, as well as portions of the Sacramento River that are 34 subject to tidal action. Generally, the Basin Plan defines temperature objectives 35 in two parts (CVRWQCB 2009): 36
At no time or place shall the temperature of COLD or WARM 37 intrastate waters be increased more than 5°F above natural 38 receiving water temperature… 39
The temperature shall not be elevated above 56°F in the reach 40 from Keswick Dam to Hamilton City nor above 68°F in the 41
1-36 Draft – June 2013

Chapter 1 Affected Environment
reach from Hamilton City to the I Street Bridge during periods 1 when temperature increases will be detrimental to the fishery. 2
The first water quality standards for the Delta were adopted in May 1967, when 3 the State Water Rights Board (predecessor to the SWRCB) released Water 4 Right Decision 1275 (D-1275), approving water rights for the SWP while 5 setting agricultural salinity standards as terms and conditions. Since then, these 6 requirements were changed in 1971 under Water Right Decision 1379 (D-7 1379), and again in 1978 under Water Right Decision 1485 (D-1485) and the 8 Water Quality Control Plan (WQCP) for the Delta and Suisun Marsh (1978 9 WQCP). In May 1995, the SWRCB adopted a new Bay-Delta WQCP, and it 10 was implemented through SWRCB Revised Water Right Decision 1641 (D-11 1641) in March 2000. 12
1995 Water Quality Control Plan 13 The 1995 Water Quality Control Plan for the San Francisco Bay/Sacramento-14 San Joaquin Delta Estuary (1995 WQCP) (SWRCB 1995) established water 15 quality control measures that contribute to the protection of beneficial uses in 16 the Delta. The 1995 WQCP identified (1) beneficial uses of the Delta to be 17 protected, (2) water quality objectives for the reasonable protection of beneficial 18 uses, and (3) a program of implementation for achieving the water quality 19 objectives. The 1995 WQCP superseded the Water Quality Control Plan for 20 Salinity (adopted in May 1991) and the Water Quality Control Plan for the 21 Sacramento-San Joaquin Delta and Suisun Marsh that was adopted in August 22 1978. 23
The 1995 WQCP was developed as part of the December 15, 1994, Bay-Delta 24 Accord, which committed the CVP and SWP to new Delta habitat objectives. 25 Since these new beneficial objectives and water quality standards were more 26 protective than those of the previous D-1485, the new objectives were adopted 27 by amendment in 1995 through a Water Rights (WR) Order for operation of the 28 CVP and SWP. One key feature of the 1995 WQCP was the estuarine habitat 29 (X2) objectives for Suisun Bay and the western Delta. The X2 objective 30 required specific daily or 14-day surface EC criteria, or 3-day averaged outflow 31 requirements to be met for a certain number of days each month, February 32 through June. These requirements were designed to provide improved shallow 33 water habitat for fish species in spring. Because of the relationship between 34 seawater intrusion and interior Delta water quality, the X2 criteria also 35 improved water quality at Delta drinking water intakes. Other new elements of 36 the 1995 WQCP included export-to-inflow (E/I) ratios intended to reduce 37 entrainment of fish at the export pumps, Delta Cross Channel gate closures, and 38 San Joaquin River EC and flow standards. 39
Water Right Decision 1641 40 D-1641 and WR Order 2001-05 contain the current water right requirements to 41 implement the 1995 WQCP. D-1641 incorporates water right settlement 42 agreements between Reclamation and DWR and certain water users in the Delta 43
1-37 Draft – June 2013

Shasta Lake Water Resources Investigation Physical Resources Appendix—Water Quality Technical Report
and upstream watersheds regarding contributions of flows to meet water quality 1 objectives. However, Reclamation and/or DWR are responsible for ensuring 2 that objectives are met in the Delta. D-1641 also authorizes the CVP and SWP 3 to use joint points of diversion (JPOD) in the south Delta, and recognizes the 4 CALFED Operations Coordination Group process for operational flexibility in 5 applying or relaxing certain protective standards. The additional exports 6 allowed under the JPOD could result in additional degradation of water quality 7 for water users in the south and central Delta, including CCWD. JPOD also 8 could affect water levels in the south Delta and endangered fish species. 9
In February 2006, the SWRCB issued notice to Reclamation and DWR that 10 each agency is responsible for meeting the objectives in the interior south Delta, 11 as described in D-1641. The SWRCB order requires Reclamation and DWR to 12 comply with a detailed plan and time schedule that will bring them into 13 compliance with their respective permit and license requirements for meeting 14 interior south Delta salinity objectives by July 1, 2009. The SWRCB order also 15 revised the previously issued (July 1, 2005) Water Quality Response Plan 16 approval governing Reclamation’s and DWR’s use of each other’s respective 17 point of diversion in the south Delta. Additionally, the order specifies that JPOD 18 operations are authorized pursuant to the 1995 WQCP, and that Reclamation 19 and DWR may conduct JPOD diversions, provided that both agencies are in 20 compliance with all conditions of their respective water right permits and 21 licenses at the time the JPOD diversions would occur (SWRCB 2006). 22
Municipal and Industrial Water Quality Objectives 23 In the 1978 WQCP, the SWRCB set two objectives that it believed would 24 provide reasonable protection for M&I beneficial uses of Delta waters from the 25 effects of salinity intrusion. The first objective established a year-round 26 maximum mean daily chloride concentration measured at five Delta intake 27 facilities, including CCWD’s Pumping Plant Number 1, of 250 mg/L for the 28 reasonable protection of municipal beneficial uses. This objective was 29 consistent with the EPA secondary MCL for chloride of 250 mg/L, and is based 30 only on aesthetic (taste) considerations. The second objective established a 31 maximum mean daily chloride concentration of 150 mg/L (measured at either 32 CCWD Pumping Plant No. 1 or the San Joaquin River at the Antioch water 33 works intake) for the reasonable protection of industrial beneficial uses 34 (specifically manufacture of cardboard boxes by Gaylord Container Corporation 35 in Antioch). This requirement is in effect for a minimum of between 155 and 36 240 days each calendar year, depending on the water year type. 37
In the 1991 WQCP, the SWRCB reviewed the water quality objectives for M&I 38 use contained in the 1978 WQCP, and reviewed potential new objectives for 39 THM and other DBP, including bromides. The SWRCB concluded that 40 technical information regarding THMs and other DBPs was not sufficient to set 41 a scientifically sound objective. Accordingly, the SWRCB continued the 42 existing objectives for chloride concentration, and until development of more 43 information about these constituents, set a water quality “goal” for bromides of 44
1-38 Draft – June 2013

Chapter 1 Affected Environment
0.15 mg/L (150 micrograms per liter (µg/L)). The SWRCB also noted that the 1 150 mg/L chloride objective was maintained in part because it provides 2 ancillary protection for other M&I uses in the absence of objectives for THMs 3 and other DBPs. 4
These objectives remained unchanged in the 1995 WQCP. The SWRCB and 5 CVRWQCB basin plans specify water quality objectives to protect designated 6 beneficial uses, including municipal drinking-water supply. The CVRWQCB 7 also is developing a Central Valley drinking-water policy that may lead to 8 regulations limiting the discharge of bromide, organic carbon, pathogens, and 9 other drinking water constituents of concern. The CVRWQCB took the 10 important step of adopting resolutions in July 2004 (Resolution No. R5-2004-11 0091) and July 2010 (Resolution No. R5-2010-0079) supporting development 12 of the policy. Resolution No. R5-2010-0079 directed CVRWQCB staff to 13 develop and bring a comprehensive drinking water policy to the board within 3 14 years (i.e., by 2013). 15
Coordinated Operations Agreement 16 The Coordinated Operations Agreement defines how Reclamation and DWR 17 share their joint responsibility to meet Delta water quality standards and meet 18 the water demands of senior water right holders. The Coordinated Operations 19 Agreement defines the Delta as being in either “balanced water conditions” or 20 “excess water conditions.” Balanced conditions are periods when Delta inflows 21 are just sufficient to meet water user demands within the Delta, outflow 22 requirements for water quality and flow standards, and export demands. Under 23 excess conditions, Delta outflow exceeds the flow required to meet the water 24 quality and flow standards. Typically, the Delta is in balanced water conditions 25 from June to November, and in excess water conditions from December through 26 May. However, depending on the volume and timing of winter runoff, excess or 27 balanced conditions may extend throughout the year. 28
During excess water conditions, but during periods when Delta outflow is still 29 relatively low, additional Delta diversions can degrade the water quality needed 30 to meet drinking water standards, even when SWRCB M&I objectives are being 31 met. 32
Local 33 The primary study area is located within both Shasta and Tehama counties, 34 while the extended study area includes the following counties: Glenn, Butte, 35 Colusa, Sutter, Yolo, Yuba, Sacramento, Napa, Solano, San Francisco, Contra 36 Costa, San Joaquin, Alameda, Santa Clara, Stanislaus, Santa Cruz, San Benito, 37 Merced, Madera, Fresno, Tulare, King, Kern, Santa Barbara, Ventura, Los 38 Angeles, San Bernardino, Orange, Riverside, San Diego, and Imperial. Each of 39 these counties has a general plan that includes general policies to protect water 40 quality, water supply, water resources, and watersheds. No specific local 41 requirements are pertinent to this analysis. 42
1-39 Draft – June 2013

Shasta Lake Water Resources Investigation Physical Resources Appendix—Water Quality Technical Report
Water quality protection measures are included in the Shasta County General 1 Plan. The county’s goal is to protect all aspects of water quality in the county. 2 The county defines erosion and downstream sedimentation as geologic hazards 3 that must be prevented as part of grading and site development. The Shasta 4 County Grading Ordinance sets requirements for grading and erosion control, 5 including prevention of sedimentation or damage to off-site property. Grading 6 permits require a vested map and the following information: 7
• A detailed grading plan 8
• Geological studies if located within an area prone to slippage, having 9 highly erodible soils or of known geologic hazards 10
• Detailed drainage or flood control information as required by the 11 department of public works 12
• A final development plan if the project is located in a zone or district 13 that requires a final development plan 14
• A noise analysis if the project is located in the vicinity of a high noise 15 generating use 16
17
1-40 Draft – June 2013

Chapter 2 Model Output
Chapter 2 1
Model Output 2
Detailed Delta Simulation 2 outputs for the comprehensive plans are attached to 3 the DEIS Modeling Appendix for Water Quality (Attachment 17) and 4 Temperature (Attachment 2). 5
6
2-1 Draft – June 2013

Shasta Lake Water Resources Investigation Physical Resources Appendix—Water Quality Technical Report
This page intentionally left blank. 1
2
2-2 Draft – June 2013

Chapter 3 References
Chapter 3 1
References 2
Bartholow, J.M., R.B. Hanna, L. Saito, D. Lieberman, and M. Horn. 2001. 3 Simulated Limnological Effects of the Shasta Lake Temperature Control 4 Device. Environmental Management 27(4):609-627. 5
CALFED. See CALFED Bay-Delta Program. 6
CALFED Bay-Delta Program. 2000a. Ecosystem Restoration Program Plan 7 Volume 1: Ecological Attributes of the San Francisco Bay-Delta 8 Watershed. Final Programmatic Environmental Impact 9 Statement/Environmental Impact Report Technical Appendix. 10 Sacramento, California. 11
———. 2000b (July). Final Programmatic Environmental Impact 12 Statement/Environmental Impact Report. Chapter 5.1, Water Supply and 13 Water Management. Prepared by U.S. Department of the Interior, 14 Bureau of Reclamation, U.S. Fish and Wildlife, National Marine 15 Fisheries Service, U.S. Environmental Protection Agency, Natural 16 Resources Conservation Service, U.S. Army Corps of Engineers, and 17 California Resources Agency. Sacramento, California. 18
———. 2000c (July). Water Quality Program Plan. Final Programmatic 19 Environmental Impact Statement/Environmental Impact Report 20 Technical Appendix. Sacramento, California. 21
———. 2003 (March). Environmental Water Program: Restoring Ecosystem 22 Processes through Geomorphic High Flow Prescriptions. Sacramento, 23 California. Prepared by Stillwater Sciences, Inc., Berkeley, California. 24
California Bay-Delta Authority. 2005 (June). Sacramento River–Chico Landing 25 Subreach Habitat Restoration Project Draft Environmental Impact 26 Report. State Clearinghouse #2004112024. Sacramento, California. 27 Lead agency: California Bay-Delta Authority. Project proponent: The 28 Nature Conservancy. Prepared by EDAW, Sacramento, California. 29
California Department of Water Resources. 2001 (December). Sanitary Survey 30 Update Report. Division of Planning and Local Assistance, and 31 Municipal Water Quality Investigations Program. Sacramento, 32 California. 33
CBDA. See California Bay-Delta Authority. 34
3-1 Draft – June 2013

Shasta Lake Water Resources Investigation Physical Resources Appendix—Water Quality Technical Report
Central Valley Regional Water Quality Control Board. 2002 (April). Upper 1 Sacramento River TMDL for Cadmium, Copper, and Zinc. Final Report. 2 Sacramento, California. 3
———. 2003a. Metal Distributions within Shasta Lake, Shasta County, 4 California, Interim Report. (Phil Woodward.) 5
———. 2003b (July). 2002 CWA Section 303(d) List of Water Quality Limited 6 Segment, Central Valley Regional Water Quality Control Board. 7 Approved by U.S. Environmental Protection Agency. 8
———. 2007a (June 28). 2006 CWA Section 303(d) List of Water Quality 9 Limited Segment, Central Valley Regional Water Quality Control 10 Board. Approved by U.S. Environmental Protection Agency. 11
———. 2007b (May). Basin Plan Amendments to the Water Quality Control 12 Plan for the Sacramento River and San Joaquin River Basins for the 13 Control of Diazinon and Chlorpyrifos Runoff into the Sacramento and 14 Feather Rivers. Final staff report. Sacramento, California. 15
———. 2009. The Water Quality Control Plan (Basin Plan) for the Sacramento 16 River and San Joaquin River Basins. Fourth edition. Originally 17 published 1998, revised through September 2009. Rancho Cordova, 18 California. 19
———. 2011. (October) Revised Pages to: The Water Quality Control Plan 20 (Basin Plan) for the Sacramento River and San Joaquin River Basins. 21 Fourth edition. Originally published 1998, revised through September 22 2009. Rancho Cordova, California. 23
City of Stockton Municipal Utilities Department, Environmental Science 24 Associates, MWH Americas, and West Yost & Associates. 2003 25 (January). Delta Water Supply Project Engineering Feasibility Study. 26
City of Stockton Department of Municipal Utilities et al. 2003. 27
CVRWQCB. See Central Valley Regional Water Quality Control Board. 28
Davis, J.A., A.R. Melwani, S.N. Bezalel, J.A. Hunt, G. Ichikawa, A. Bonnema, 29 W.A. Heim, D. Crane, S. Swenson, C. Lamerdin, and M. Stephenson. 30 2010. Contaminants in Fish from California Lakes and Reservoirs, 31 2007–2008: Summary Report on a Two-Year Screening Survey. A 32 Report of the Surface Water Ambient Monitoring Program. California 33 State Water Resources Control Board, Sacramento, California. 34
Domagalski, J.L., D.L. Knifong, P.D. Dileanis, L.R. Brown, J.T. May, V. 35 Connor, and C.N. Alpers. 2000. Water Quality in the Sacramento River 36 Basin, California, 1994–1998. U.S. Geological Survey Circular 1215. 37
3-2 Draft – June 2013

Chapter 3 References
DWR. See California Department of Water Resources. 1
EPA. See U.S. Environmental Protection Agency. 2
National Marine Fisheries Service. 1993. Biological Opinion for the Operation 3 of the Federal Central Valley Project and the California State Water 4 Project. Southwest Region. Long Beach, California. 5
———. 2004 (October). Biological Opinion on the Long-Term Central Valley 6 Project and State Water Project Operations Criteria and Plan. Southwest 7 Region. Long Beach, California. 8
———. 2009 (June). Revised Biological Opinion on the Long-Term Central 9 Valley Project and State Water Project Operations Criteria and Plan. 10 Prepared by National Marine Fisheries Service, Southwest Region. 11
NMFS. See National Marine Fisheries Service. 12
North State Resources, Inc. 2007. Bully Hill Mine Assessment Technical 13 Memorandum. Unpublished report to U.S. Department of the Interior, 14 Bureau of Reclamation. 15
NSR. See North State Resources, Inc. 16
Reclamation. See U.S. Department of the Interior, Bureau of Reclamation. 17
Reclamation and DWR. See U.S. Department of the Interior, Bureau of 18 Reclamation, and California Department of Water Resources. 19
San Francisco Bay Regional Water Quality Control Board. 2007 (June 28). 20 2006 CWA Section 303(d) List of Water Quality Limited Segments, San 21 Francisco Bay Regional Water Quality Control Board. Approved by 22 U.S. Environmental Protection Agency. 23
SFBRWQCB. See San Francisco Bay Regional Water Quality Control Board. 24
State Water Resources Control Board. No date. Water Quality Control Plan for 25 the Control of Temperature in the Coastal and Interstate Waters and 26 Enclosed Bays of California. Sacramento, California. 27
———. 1995 (May). Water Quality Control Plan for the San Francisco 28 Bay/Sacramento–San Joaquin Delta Estuary. 95-1 WR. Sacramento, 29 California. 30
———. 1997 (November). Draft Environmental Impact Report for 31 Implementation of the 1995 Bay/Delta Water Quality Control Plan. 32 Sacramento, California. 33
3-3 Draft – June 2013

Shasta Lake Water Resources Investigation Physical Resources Appendix—Water Quality Technical Report
———. 1999 (November). Final Environmental Impact Report for 1 Implementation of the 1995 Bay/Delta Water Quality Control Plan. 2 Volume I. State Clearinghouse Number 97-122056. 3
———. 2006 (October 25). Proposed 2006 CWA Section 303(d) List Of Water 4 Quality Limited Segments. Sacramento, California. 5
———. 2007. Stormwater Best Management Practices, Construction Program. 6 Available: <http://www.waterboards.ca.gov/quality.html>. Last updated 7 March 2, 2007. Accessed August 17, 2007. 8
Stillwater Sciences. 2006 (November 22). Sacramento River Ecological Flows 9 Study: State of the System Report. Public review draft. Berkeley, 10 California. Prepared for The Nature Conservancy. 11
SWRCB. See State Water Resources Control Board. 12
U.S. Department of Agriculture, Forest Service. 1995 (April 28). Shasta-Trinity 13 National Forest Land and Resource Management Plan. Shasta-Trinity 14 National Forest. Redding, California. 15
———. 1996. Management Guide: Shasta and Trinity Units – Whiskeytown-16 Shasta-Trinity National Recreation Area. Shasta-Trinity National Forest. 17 Redding, California. 18
———. 1998. McCloud Arm Watershed Assessment. Shasta-Trinity National 19 Forest. Redding, California. 20
U.S. Department of the Interior, Bureau of Reclamation. 2004a (June 30). Long-21 Term Central Valley Project Operations Criteria and Plan, CVP-OCAP. 22 Mid-Pacific Region. Sacramento, California. 23
______. 2004b (September 1). Sacramento River Settlement Contractors Draft 24 Environmental Impact Statement. Mid-Pacific Region. Sacramento, 25 California. Prepared by CH2M HILL, Sacramento, California. 26
U.S. Department of the Interior, Bureau of Reclamation, and California 27 Department of Water Resources. 2003 (July). Environmental Water 28 Account Draft Environmental Impact Statement/Environmental Impact 29 Report. Chapter 5, Water Quality. Sacramento, California. 30
———. 2005 (October). South Delta Improvements Program Draft 31 Environmental Impact Statement/Environmental Impact Report. 32 Sacramento, California. State Clearinghouse No. 2002092065. Bureau 33 of Reclamation Mid-Pacific Region and DWR Bay-Delta Office, 34 Sacramento, California. Prepared by Jones & Stokes, Sacramento, 35 California. 36
3-4 Draft – June 2013

Chapter 3 References
U.S. Department of the Interior, Geological Survey. 1978. An Evaluation of 1 Problems Arising from Acid Mine Drainage in the Vicinity of Shasta 2 Lake, Shasta County, California. Water-Resources Investigations 3 Report, 78-32. Denver, Colorado. 4
———. 2000a. Water Quality Assessment of the Sacramento River Basin, 5 California: Water Quality, Sediment, and Tissue Chemistry, and 6 Biological Data, 1995–1998. Open-File Report 2000-391. 7
———. 2000b. Metals Transport in the Sacramento River, California, 1996–8 1997. Volume 2: Interpretation of Metal Loads. U.S. Geological Survey 9 Water-Resources Investigations Report 00-4002. In cooperation with 10 Sacramento Regional County Sanitation District, California State Water 11 Resources Control Board, U.S. Environmental Protection Agency, U.S. 12 Department of Commerce, and National Marine Fisheries Service. 13 Sacramento, California. 14
U.S. Environmental Protection Agency. 2008. Introduction to the Clean Water 15 Act. Watershed Academy Web. Available: <http://www.epa.gov/ 16 owow/watershed/wacademy/acad2000/cwa/>. Last updated September 17 12, 2008. Accessed June 15, 2011. 18
———. 2009 (June). EPA Iron Mountain Mine Superfund Site Fact Sheet: EPA 19 Accelerating Cleanup Efforts at Iron Mountain Mine Site Supporting 20 Local Economy with Recovery Act Funds. Region 9, San Francisco, 21 California. Available: <http://yosemite.epa.gov/R9/SFUND/ 22 R9SFDOCW.NSF/3dc283e6c5d6056f88257426007417a2/87692a5a73023 4e22a882575df0067b8e2!OpenDocument>. Accessed February 2, 2011. 24
———. 2011. Total Maximum Daily Load–Definitions. Available: 25 <http://www.epa.gov/region7/water/definitions.htm>. Last updated 26 April 15, 2011. Accessed June 15, 2011. 27
USFS. See U.S. Department of Agriculture, Forest Service. 28
USGS. See U.S. Department of the Interior, Geological Survey. 29
Vermeyen, T.B. 1997 (August 10–15, 1997). Modifying Reservoir Release 30 Temperatures Using Temperature Control Curtains. Proceedings of 31 Theme D: Energy and Water: Sustainable Development, 27th IAHR 32 Congress, San Francisco, California. 33
Wright, S.A., and D.H. Schoellhamer. 2004 (May). Trends in the Sediment 34 Yield of the Sacramento River, California, 1957–2001. San Francisco 35 Estuary and Watershed Science 2(2):Article 2. 36
37
3-5 Draft – June 2013

Shasta Lake Water Resources Investigation Physical Resources Appendix—Water Quality Technical Report
This page intentionally left blank. 1 2
3-6 Draft – June 2013