u-net v300r007_lte parameter setting guide
DESCRIPTION
fyiTRANSCRIPT
U-Net V300R007_LTE Parameter Setting Guide SECRET
Product Name Confidentiality
U-Net INTERNAL
Document VersionTotal 35 pages
V3.7
U-Net V300R007_LTE Parameter Setting Guide
Huawei Technologies Co., Ltd.All rights reserved
2023-04-18 Huawei Proprietary and Confidential Page 1 of 35

SECRET
Change History
Date Version Change Description Authors
2010-09-14 Completed the draft.Dai Jianshe (employee ID: 00142864) and Liu Minghui (employee ID: 00133691)
2011-04-25Revised the guide based on U-Net V300R007.
Li Chunguang (employee ID: 00142081)
2023-04-18 Huawei Proprietary and Confidential Page 2 of 35

SECRET
Abbreviations and Acronyms
Abbreviation or Acronym
Full Name
LTE Long Term Evolution
PCI Physical cell identifier
MCS modulation and coding scheme
IOT Interference Over Thermal
2023-04-18 Huawei Proprietary and Confidential Page 3 of 35
SECRET
1 Overview
1.1 BackgroundWith the mass commercial use of Long Term Evolution (LTE) networks worldwide, U-Net has become a widely used network planning tool. Currently, many engineers have mastered the basic operations of the tool, but are still unfamiliar with the settings of certain parameters, which may affect the simulation effect. This guide is prepared to instruct the engineers on how to set the parameters. By reading this guide, you can improve the efficiency of parameter settings.
1.2 PurposeAs a guide describing the basic operations of U-Net is already released, this guide focuses on how to set the parameters that are prone to mistakes and key parameters. The descriptive sequence of parameters in this guide is consistent with that in project creation.
2023-04-18 Huawei Proprietary and Confidential Page 4 of 35

SECRET
2 Parameter Settings
2.1 MapRight-click Clutter under Map and choose Parameter Manager from the shortcut menu. The Clutter Parameters Display dialog box is displayed.
Figure 2-1 Parameters to be set on the map
Set the parameters on the Actual Value tab if a digital map is provided, and set the parameters on the Default Value tab if a blank map is provided.
2023-04-18 Huawei Proprietary and Confidential Page 5 of 35
Digital map
Blank map
SECRET
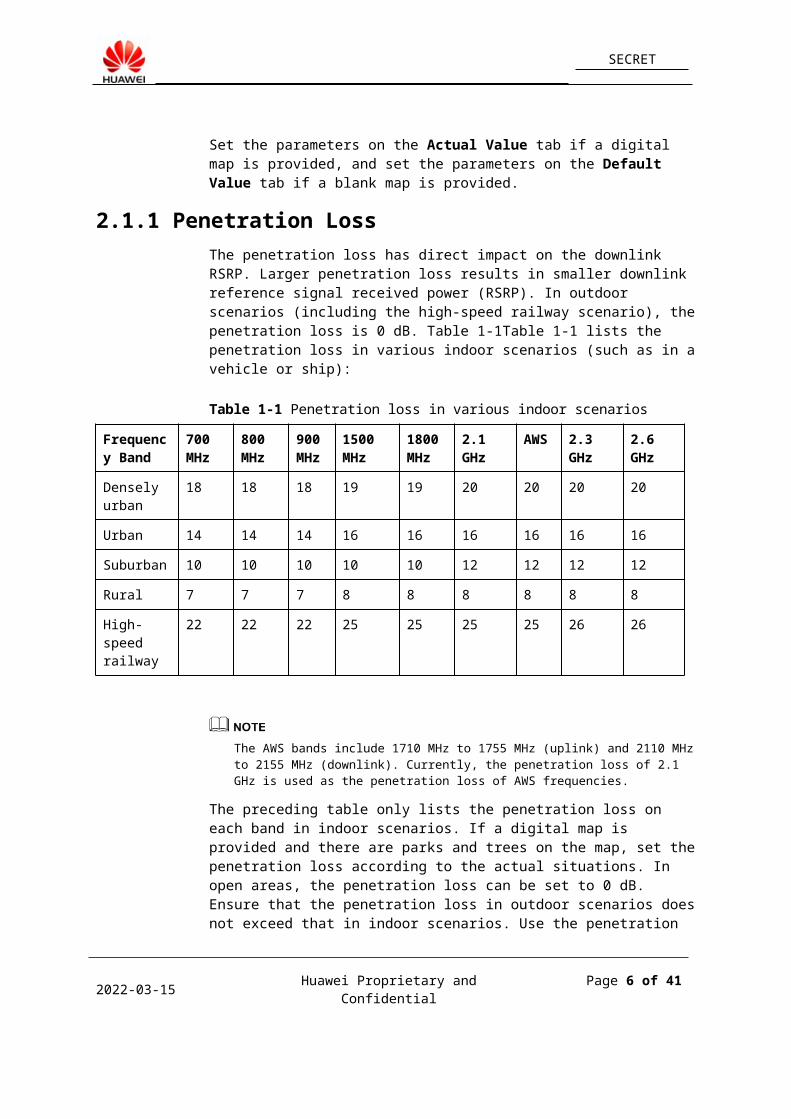
2.1.2 Penetration LossThe penetration loss has direct impact on the downlink RSRP. Larger penetration loss results in smaller downlink reference signal received power (RSRP). In outdoor scenarios (including the high-speed railway scenario), the penetration loss is 0 dB. Table 2-1Table 2-1 lists the penetration loss in various indoor scenarios (such as in a vehicle or ship):
Table 2-1 Penetration loss in various indoor scenarios
Frequency Band
700 MHz
800 MHz
900 MHz
1500 MHz
1800 MHz
2.1 GHz
AWS
2.3 GHz
2.6 GHz
Densely urban
18 18 18 19 19 20 20 20 20
Urban 14 14 14 16 16 16 16 16 16
Suburban 10 10 10 10 10 12 12 12 12
Rural 7 7 7 8 8 8 8 8 8
High-speed railway
22 22 22 25 25 25 25 26 26
The AWS bands include 1710 MHz to 1755 MHz (uplink) and 2110 MHz to 2155 MHz (downlink). Currently, the penetration loss of 2.1 GHz is used as the penetration loss of AWS frequencies.
The preceding table only lists the penetration loss on each band in indoor scenarios. If a digital map is provided and there are parks and trees on the map, set the penetration loss according to the actual situations. In open areas, the penetration loss can be set to 0 dB. Ensure that the penetration loss in outdoor scenarios does not exceed that in indoor scenarios. Use the penetration loss provided by the customer if the customer provides one. Otherwise, use the default value of Huawei.
2.1.3 Model Standard DeviationThe standard shadow fading deviation and cell edge coverage probability are used to calculate the shadow fading margin. As the wireless channels are randomly allocated, the penetration loss within a fixed distance is varying, and the signal strength within the coverage is not always larger than a certain level. However, you can ensure that the level of the received signals is larger than certain signal strength in a certain probability. To ensure that an eNodeB covers the edge of a cell in a certain probability, the eNodeB must reserve a certain part of power to counteract the impact of shadow fading. This part of power is the shadow fading margin.
The larger the standard shadow fading deviation, the larger the shadow fading margin. The higher the probability of cell edge coverage, the larger the shadow fading margin. If shadow fading is taken into account, the shadow fading margin is directly subtracted during RSRP calculation in coverage forecast.
2023-04-18 Huawei Proprietary and Confidential Page 6 of 35

SECRET
Shadow fading is Gaussian process whose average value is 0 and whose standard shadow fading deviation is . The probability density function is as follows:
The shadow fading exceeds z dB in the following probability:
If is divided by x, the result is as follows:
Q indicates the supplementary cumulative function. In this case, the shadow fading margin is as follows:
indicates the cell edge coverage probability. The value of this parameter
must be set manually.
Right-click Predictions and choose New from the shortcut menu. Click Next. The Group Properties dialog box is displayed. Set the cell edge coverage probability in this dialog box.
2023-04-18 Huawei Proprietary and Confidential Page 7 of 35

SECRET
Figure 2-1 Setting the cell edge coverage probability
Table 2-1 lists the recommended values of the standard shadow fading deviation. Set the parameter according to the actual situations.
Table 2-1 Standard shadow fading deviation
Morph
StdSlowFading
(dB)
Indoor Outdoor
Densely urban 11.7 10
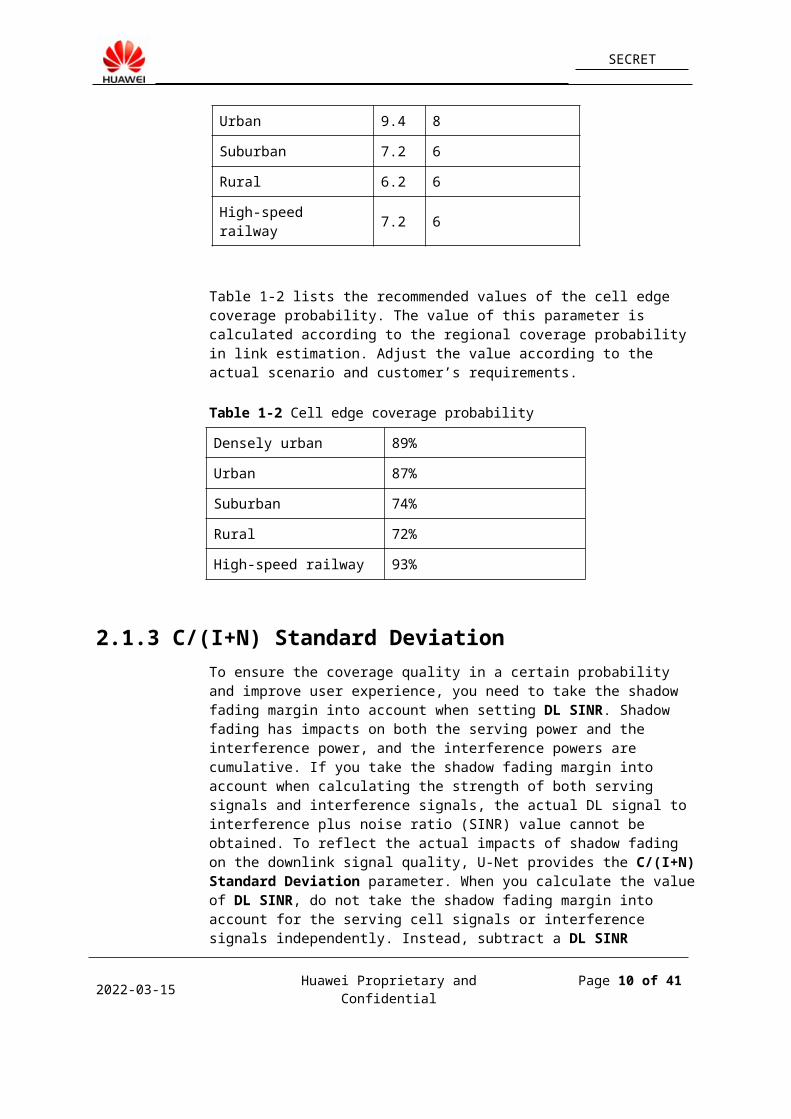
Urban 9.4 8
Suburban 7.2 6
Rural 6.2 6
2023-04-18 Huawei Proprietary and Confidential Page 8 of 35

SECRET
High-speed railway 7.2 6
Table 2-2 lists the recommended values of the cell edge coverage probability. The value of this parameter is calculated according to the regional coverage probability in link estimation. Adjust the value according to the actual scenario and customer’s requirements.
Table 2-2 Cell edge coverage probability
Densely urban 89%
Urban 87%
Suburban 74%
Rural 72%
High-speed railway 93%
2.1.4 C/(I+N) Standard DeviationTo ensure the coverage quality in a certain probability and improve user experience, you need to take the shadow fading margin into account when setting DL SINR. Shadow fading has impacts on both the serving power and the interference power, and the interference powers are cumulative. If you take the shadow fading margin into account when calculating the strength of both serving signals and interference signals, the actual DL signal to interference plus noise ratio (SINR) value cannot be obtained. To reflect the actual impacts of shadow fading on the downlink signal quality, U-Net provides the C/(I+N) Standard Deviation parameter. When you calculate the value of DL SINR, do not take the shadow fading margin into account for the serving cell signals or interference signals independently. Instead, subtract a DL SINR correction from the calculation result. This correction is calculated according to the values of C/ (I+N) Standard Deviation and cell edge coverage probability. The calculation method is the same as that of the shadow fading margin. This parameter has direct impact on DL SINR. Therefore, set this parameter to an appropriate value in coverage forecast.
Right-click Clutter under Map and choose Parameter Manager from the shortcut menu. The Clutter Parameters Display dialog box is displayed.
2023-04-18 Huawei Proprietary and Confidential Page 9 of 35
SECRET
Figure 2-1 Setting the C/ (I+N) Standard Deviation parameter
The setting of this parameter has high requirements on the experience of network planning engineers. You need to adjust the value according to the actual scenario and coverage forecast result. The recommended value is 2 dB to 4 dB lower than the value of Model Standard Deviation.
2.2 Transceiver
2.2.1 Power RatioPower Ratio refers to the ratio of an antenna way’s transmit power in the overall transmit power of a multi-way antenna. If a one-way antenna is configured, set this parameter to 1. If a multi-way antenna is configured, set this parameter to the ratio of the main antenna way's transmit power. Set the ratios of other antenna ways' powers in Antenna Config. Right-click a sector and choose Properties from the shortcut menu. The Transceiver Properties dialog box is displayed, as shown in Figure 2-2. The sum of all ratios must be 1, and the value of Power Ratio in Figure 2-1 must be consistent with that of the main antenna way. Currently, one-way antenna is configured in both forecast and simulation scenarios. Therefore, the default value of this parameter is 1.
2023-04-18 Huawei Proprietary and Confidential Page 10 of 35

SECRET
Figure 2-1 Setting the Power Ratio parameter
Figure 2-2 Setting the Power Ratio parameter in multi-way antenna scenarios
2023-04-18 Huawei Proprietary and Confidential Page 11 of 35

SECRET
2.2.2 Antenna Configuration on eNodeBM x N indicates that the eNodeB is configured with an M-way transmit antenna and the UE is configured with an N-way receive antenna. For example, 4 x 2 indicates that the eNodeB is configured with a 4-way transmit antenna and the UE is configured with a 2-way receive antenna.
4T2R indicates that the eNodeB is configured with a 4-way transmit antenna and 2-way receive antenna. Generally, the MIMO mode refers to M x N.
For example, to set the downlink MIMO mode to 4 x 2, set Number of Transmission Antennas to 4, and set Number of Reception Antennas to 2. Note that Number of Reception Antennas in Figure 2-1 is not used.
Figure 2-1 Setting the antenna of the eNodeB
Set Number of Transmission Antennas Ports to the quantity of the logical ports mapping the antennas of the eNodeB, and ensure that the value of this parameter is equal to or less than that of Number of Transmission Antennas.
2.2.3 Antenna DowntiltU-Net provides the following modes for setting the downtilt of an antenna:
Mechanical downtilt setting: Adjust the downtilt mechanically. In this case, the coverage distance of the antenna's main lobe significantly changes, but the vertical and horizontal components of the antenna do not change.
Electrical downtilt setting: Alter the phase of the antenna oscillator to adjust the vertical and horizontal components of the antenna. In this way, the combined field strength of the components can be changed.
2023-04-18 Huawei Proprietary and Confidential Page 12 of 35

SECRET
Figure 2-1 Setting the downtilt of an antenna
The antenna downtilt is related to various factors. Adjust it according to the actual situations.
2.3 Cells
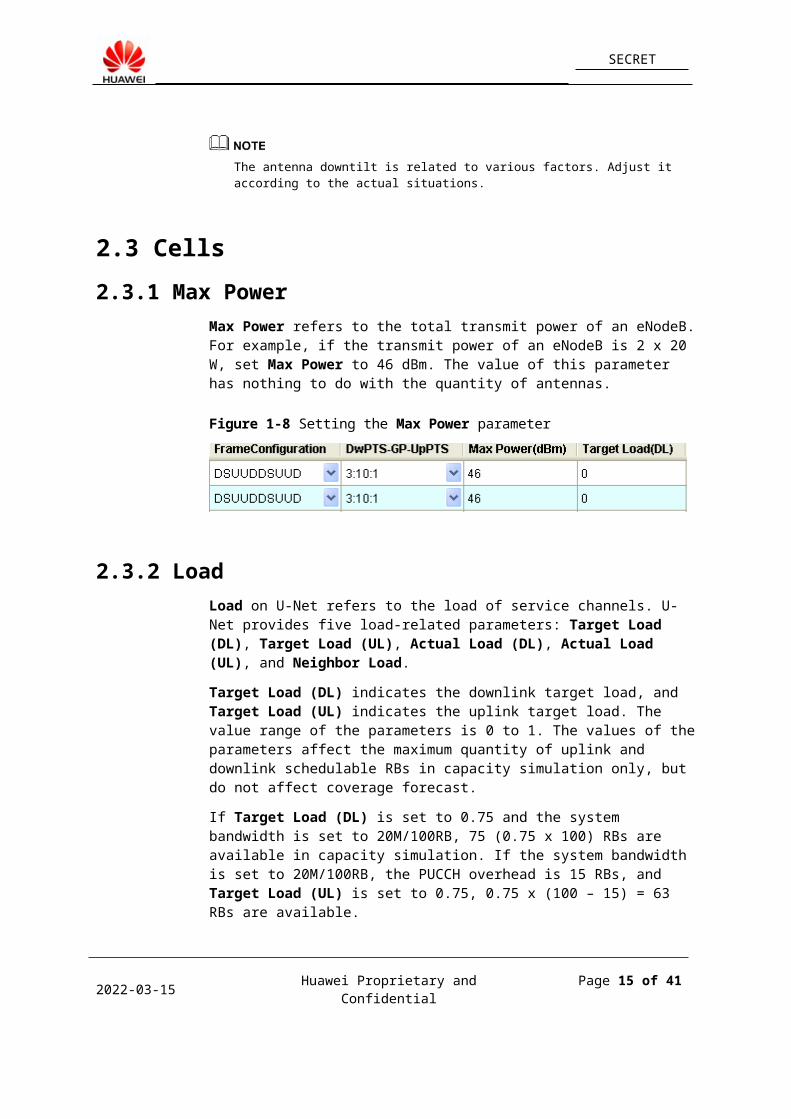
2.3.1 Max PowerMax Power refers to the total transmit power of an eNodeB. For example, if the transmit power of an eNodeB is 2 x 20 W, set Max Power to 46 dBm. The value of this parameter has nothing to do with the quantity of antennas.
Figure 2-1 Setting the Max Power parameter
2.3.2 LoadLoad on U-Net refers to the load of service channels. U-Net provides five load-related parameters: Target Load (DL), Target Load (UL), Actual Load (DL), Actual Load (UL), and Neighbor Load.
Target Load (DL) indicates the downlink target load, and Target Load (UL) indicates the uplink target load. The value range of the parameters is 0 to 1. The values of the parameters affect the maximum quantity of uplink and downlink schedulable RBs in capacity simulation only, but do not affect coverage forecast.
2023-04-18 Huawei Proprietary and Confidential Page 13 of 35

SECRET
If Target Load (DL) is set to 0.75 and the system bandwidth is set to 20M/100RB, 75 (0.75 x 100) RBs are available in capacity simulation. If the system bandwidth is set to 20M/100RB, the PUCCH overhead is 15 RBs, and Target Load (UL) is set to 0.75, 0.75 x (100 – 15) = 63 RBs are available.
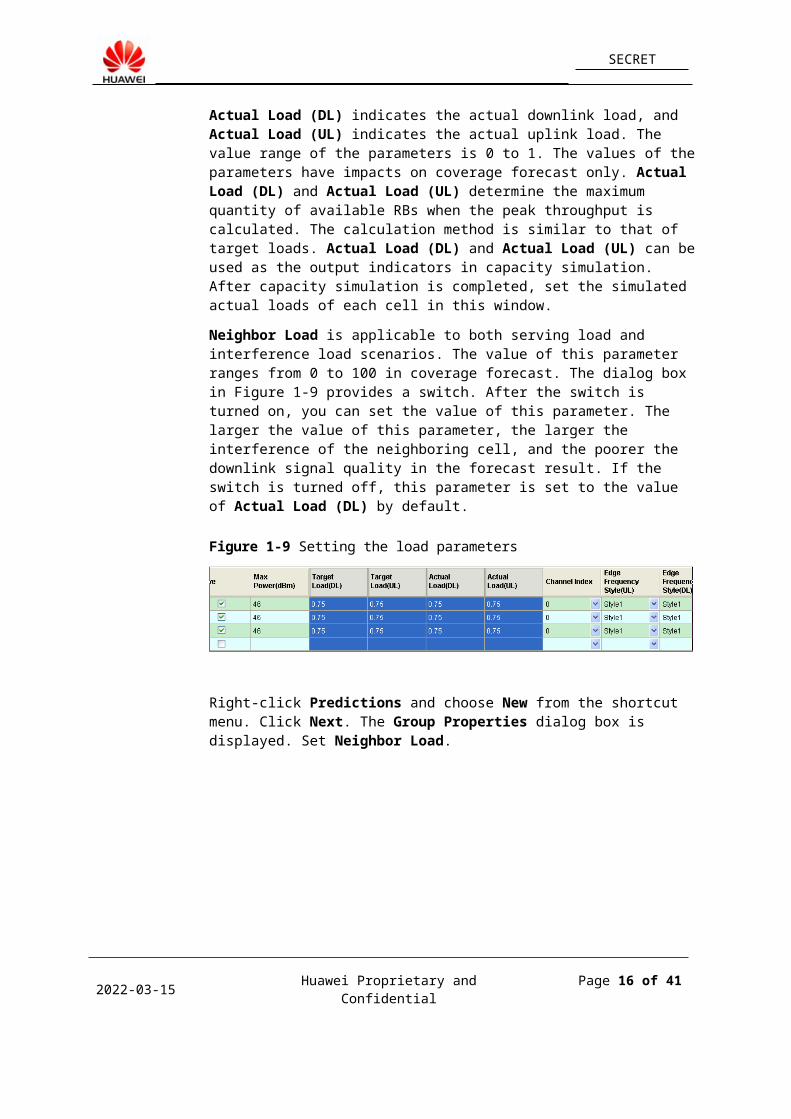
Actual Load (DL) indicates the actual downlink load, and Actual Load (UL) indicates the actual uplink load. The value range of the parameters is 0 to 1. The values of the parameters have impacts on coverage forecast only. Actual Load (DL) and Actual Load (UL) determine the maximum quantity of available RBs when the peak throughput is calculated. The calculation method is similar to that of target loads. Actual Load (DL) and Actual Load (UL) can be used as the output indicators in capacity simulation. After capacity simulation is completed, set the simulated actual loads of each cell in this window.
Neighbor Load is applicable to both serving load and interference load scenarios. The value of this parameter ranges from 0 to 100 in coverage forecast. The dialog box in Figure 2-1 provides a switch. After the switch is turned on, you can set the value of this parameter. The larger the value of this parameter, the larger the interference of the neighboring cell, and the poorer the downlink signal quality in the forecast result. If the switch is turned off, this parameter is set to the value of Actual Load (DL) by default.
Figure 2-1 Setting the load parameters
Right-click Predictions and choose New from the shortcut menu. Click Next. The Group Properties dialog box is displayed. Set Neighbor Load.
2023-04-18 Huawei Proprietary and Confidential Page 14 of 35
SECRET
Figure 2-2 Setting the Neighbor Load parameter
2.3.3 Control Channel OverheadControl Channel Overhead (UL) indicates the RB overhead of the uplink control channel (PUCCH). PUCCH carries the following information: HARQ-ACK, channel quality indicator (CQI), SR, and PMI, which is called uplink control information (UCI). PUCCH and PUSCH transmit data to each user in timesharing mode. Table 2-1 lists the formats of PUCCH.
2023-04-18 Huawei Proprietary and Confidential Page 15 of 35
SECRET
Table 2-1 PUCCH formats
Format 1 adopts the On-Off Keying (OOK) coding mode, and other formats adopt the binary phase shift keying (BPSK) or quadrature phase shift keying (QPSK) modulation mode.
According to the 36.213 protocol, format 1 is used to transmit Scheduling Request Indication (SRI), format 1a is used to transmit 1bit HARQ-ACK, format 1b is used to transmit 2bits HARQ-ACK, format 2 is used to transmit CQI, format 2a is used to transmit CQI and 1bit HARQ-ACK, and format 2b is used to transmit CQI and 2bits HARQ-ACK. Coverage forecast supports formats 1, 1a, and 2 only.
The RB quantity used by PUCCH depends on the system bandwidth (Bw). Table 2-2 lists the typical value range and default value in various bandwidth scenarios. The more RBs used by PUCCH, the fewer RBs available for PUSCH, the lower the uplink peak rate in coverage forecast, and the lower the uplink throughput in capacity simulation.
Table 2-2 PUCCH overhead
Bw
(MHz)
TotRbNum Default Value of PUCCH
1.4 6 2
3 15 4
5 25 4
10 50 6
15 75 8
20 100 10
In commercial use, the default value is the minimum value. In comparison test, the minimum value is 2. In coverage forecast and capacity simulation, set the value as required.
Control Channel Overhead (DL) indicates to the symbol overhead of the downlink control channel (PDCCH). PDCCH can use the first three symbols of an RB at most. The value of this parameter ranges from 1 to 3. In coverage forecast and capacity simulation, this parameter is usually set to 3. The larger the value of this parameter, the
2023-04-18 Huawei Proprietary and Confidential Page 16 of 35

SECRET
less the resources of each RB for data transmission, the lower the throughput of each RB, and the lower the calculated peak throughput.
Figure 2-2 Symbols used by PDCCH
Figure 2-3 Setting the Control Channel Overhead parameters
2.3.4 IOT and Open Loop Power ControlIn coverage forecast, the downlink interference of neighboring cells can be calculated according to the interference power of neighboring cells. The uplink interference of neighboring cells is related to the location and transmit power of the UE. U-Net uses Interference Over Thermal (IOT) to indicate the uplink interference. You can set Actual IOT (UL) on U-Net to configure the uplink interference.
Actual IOT (UL) has direct impact on the uplink signal quality in coverage forecast. The larger the value of Actual IOT (UL), the larger the uplink interference and the poorer the uplink signal quality. Table 2-1 lists the IOT values in various scenarios. In some planning scenarios, you need to adjust the value of the parameter according to
2023-04-18 Huawei Proprietary and Confidential Page 17 of 35

SECRET
the actual situations. The value of Actual IOT (UL's) obtained in capacity simulation can be used in coverage forecast.
Ensure that the IOT value ensures certain cell edge rate and edge modulation and coding scheme (MCS).
RB quantity used by cell edge UEs = UL edge rate/[RE quantity of each RAB (144) x MCS]/TDD efficiency for FDD
Throughput/RB = UL cell edge rate/Uplink RB quantity
Throughput rate/RB = SINR (that is, the required SINR to reach a certain rate or MCS)
Calculate the IOT according to SINR and RB quantity supported by cell edge UEs. Use the full transmit power for cell edge UEs.
Receiver power of one RB = Po + Alpha x PL – PL = 23 – 10 x log(RB quantity used by uplink cell edge UEs) – PL
IOT = Receiver power of one RB – SINR – Uplink noise of one RB
The preceding formulas are based on the uplink cell edge rate, MCS, and path loss and use FDD as an example. The calculation results are as follows:
Table 2-1 Recommended IOT values
ISD UL Edge Rate
Cell Edge MCS
Edge Path Loss
Required SINR
IOT
500 256 Kbps 0.4 (4th tier) 126 dB -0.75 dB 12
1000 128 Kbps 0.5 (5th tier) 133 dB -1.5 dB 8
1732 64 Kbps 0.6 (6th tier) 140 dB -2.5 dB 4
Right-click Cells under Transceiver and choose Open Table from the shortcut menu. The window shown in Figure 2-2 is displayed.
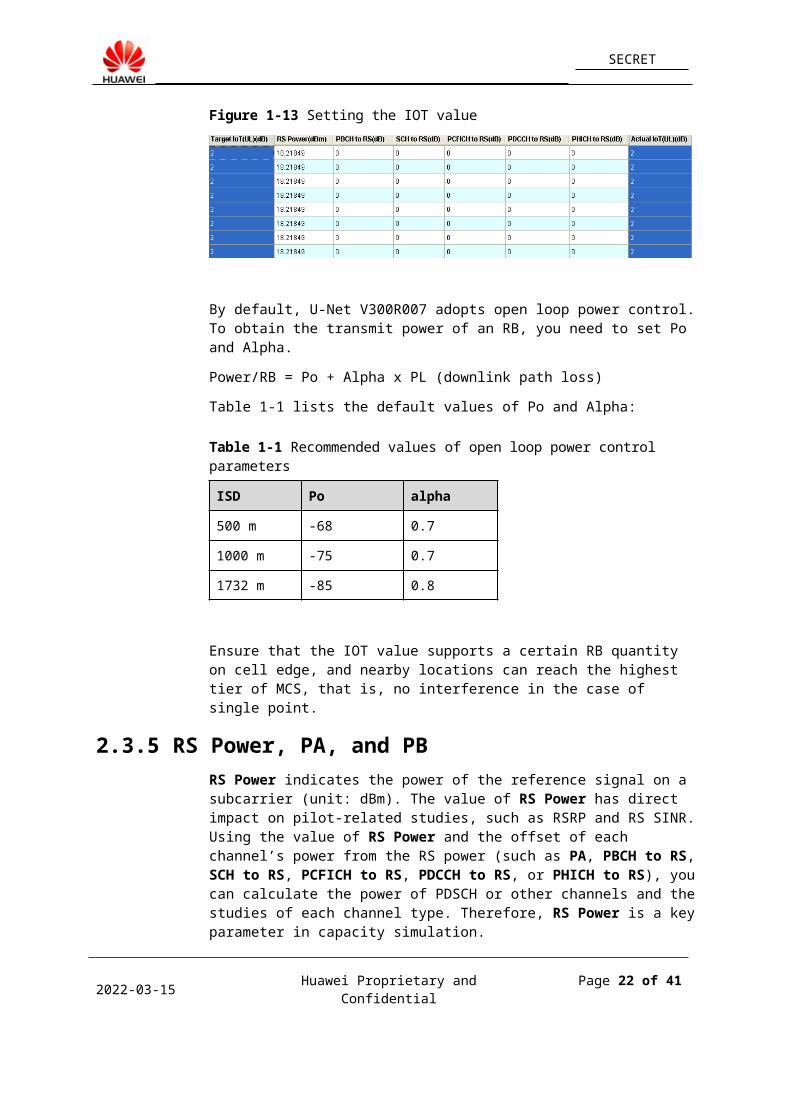
Figure 2-2 Setting the IOT value
By default, U-Net V300R007 adopts open loop power control. To obtain the transmit power of an RB, you need to set Po and Alpha.
Power/RB = Po + Alpha x PL (downlink path loss)
Table 2-1 lists the default values of Po and Alpha:
2023-04-18 Huawei Proprietary and Confidential Page 18 of 35

SECRET
Table 2-1 Recommended values of open loop power control parameters
ISD Po alpha
500 m -68 0.7
1000 m -75 0.7
1732 m -85 0.8
Ensure that the IOT value supports a certain RB quantity on cell edge, and nearby locations can reach the highest tier of MCS, that is, no interference in the case of single point.
2.3.5 RS Power, PA, and PBRS Power indicates the power of the reference signal on a subcarrier (unit: dBm). The value of RS Power has direct impact on pilot-related studies, such as RSRP and RS SINR. Using the value of RS Power and the offset of each channel’s power from the RS power (such as PA, PBCH to RS, SCH to RS, PCFICH to RS, PDCCH to RS, or PHICH to RS), you can calculate the power of PDSCH or other channels and the studies of each channel type. Therefore, RS Power is a key parameter in capacity simulation.
Table 2-1 lists the default values of PBCH to RS, SCH to RS, PCFICH to RS, PDCCH to RS, and PHICH to RS.
Table 2-1 Offset of each channel from the RS channel
Channel Type Default Offset
PBCH to RS –3
SCH to RS 0
PCFICH to RS –3
PDCCH to RS –3
PHICH to RS 0
To obtain the offset of the PDSCH power on the central band and the PDSCH power on the edge band from the RS power, set CCU PA and CEU PA. The value range is as follows: [-6, -4.77, -3, -1.77, 0, 1, 2, and 3]. The default value of CCU PA is –6, and the default value of CEU PA is –1.77. You are advised not to change the default values.
The value of RS Power depends on the Max Power value, bandwidth, antenna port quantity, and PB configuration. The pilot structure of an antenna varies according to the antenna configuration, and the PB configuration varies according to the pilot structure. The following section describes the involved pilot structures and PB values in detail.
2023-04-18 Huawei Proprietary and Confidential Page 19 of 35

SECRET
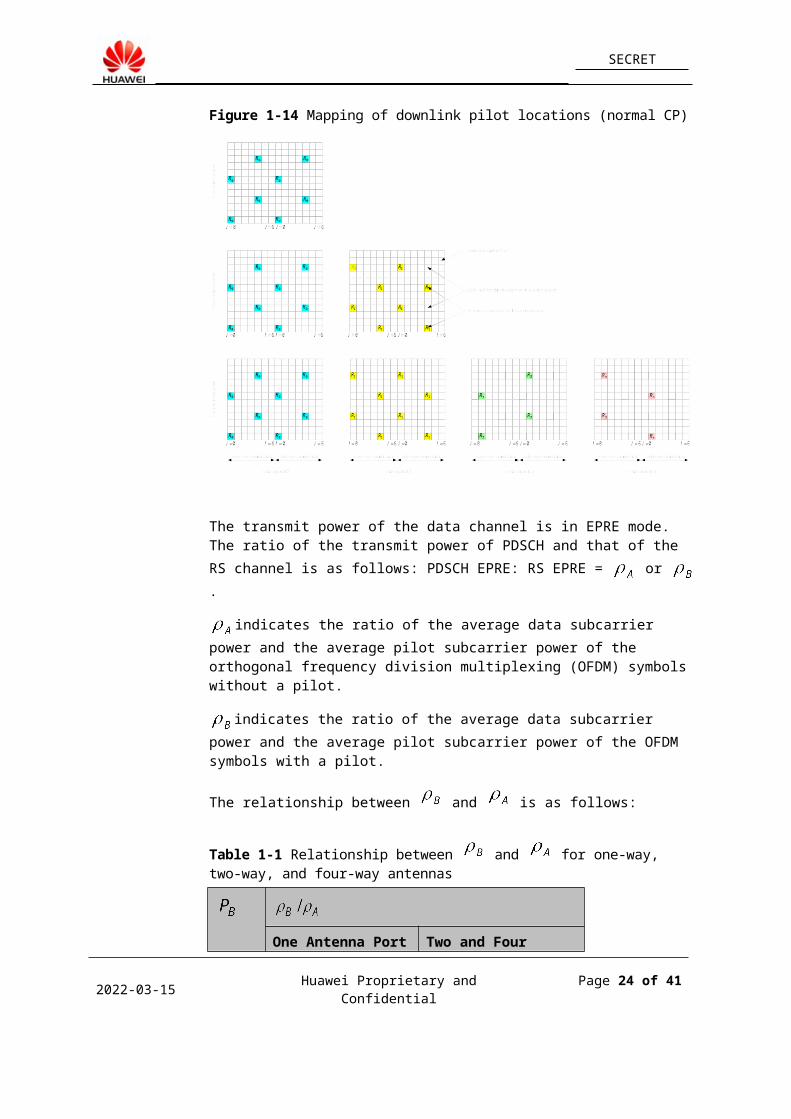
Figure 2-2 Mapping of downlink pilot locations (normal CP)
The transmit power of the data channel is in EPRE mode. The ratio of the transmit power of PDSCH and that of the RS channel is as follows: PDSCH EPRE: RS EPRE =
or .
indicates the ratio of the average data subcarrier power and the average pilot subcarrier power of the orthogonal frequency division multiplexing (OFDM) symbols without a pilot.
indicates the ratio of the average data subcarrier power and the average pilot subcarrier power of the OFDM symbols with a pilot.
The relationship between and is as follows:
Table 2-1 Relationship between and for one-way, two-way, and four-way antennas
One Antenna Port
Two and Four Antenna Ports
2023-04-18 Huawei Proprietary and Confidential Page 20 of 35

SECRET
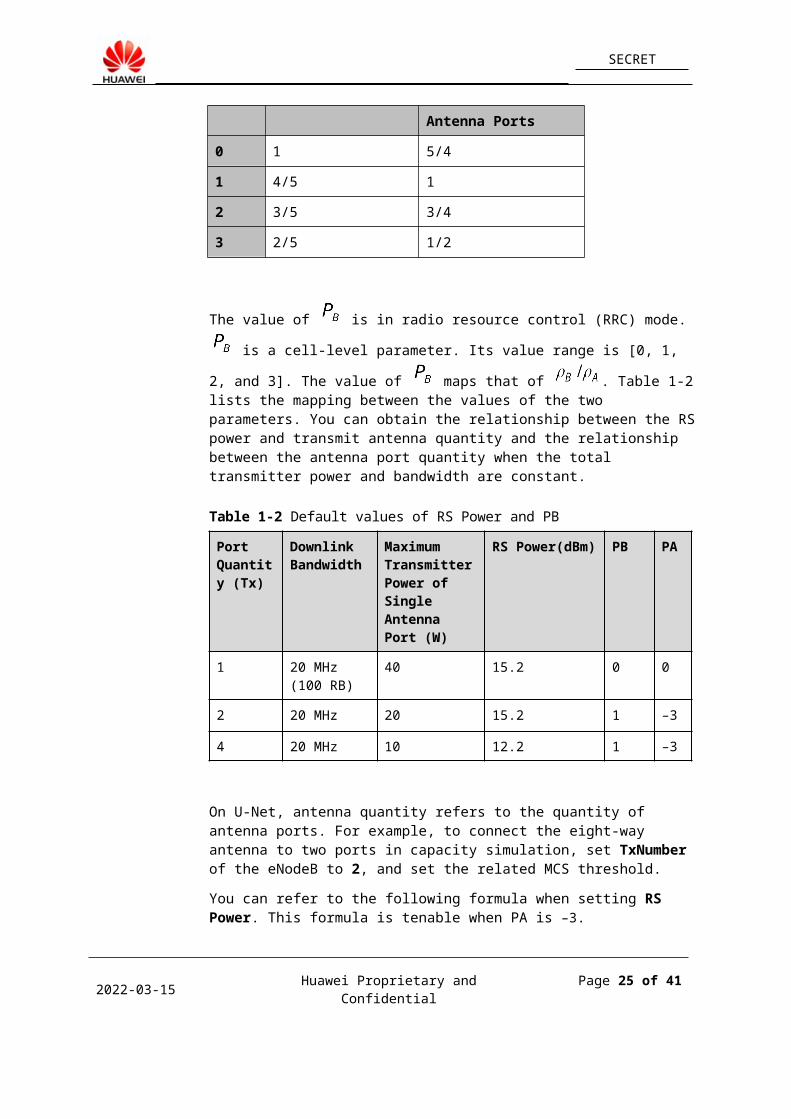
0 1 5/4
1 4/5 1
2 3/5 3/4
3 2/5 1/2
The value of is in radio resource control (RRC) mode. is a cell-level
parameter. Its value range is [0, 1, 2, and 3]. The value of maps that of . Table 2-2 lists the mapping between the values of the two parameters. You can obtain the relationship between the RS power and transmit antenna quantity and the relationship between the antenna port quantity when the total transmitter power and bandwidth are constant.
Table 2-2 Default values of RS Power and PB
Port Quantity (Tx)
Downlink Bandwidth
Maximum Transmitter Power of Single Antenna Port (W)
RS Power(dBm)
PB PA
1 20 MHz (100 RB)
40 15.2 0 0
2 20 MHz 20 15.2 1 –3
4 20 MHz 10 12.2 1 –3
On U-Net, antenna quantity refers to the quantity of antenna ports. For example, to connect the eight-way antenna to two ports in capacity simulation, set TxNumber of the eNodeB to 2, and set the related MCS threshold.
You can refer to the following formula when setting RS Power. This formula is tenable when PA is –3.
RS Power = (Max Power/Antenna port quantity)/(12 x RB quantity) x (1 + )
In the preceding table, the default bandwidth is 20 MHz, and the default total transmit power is 40 W. Modify the value of RS Power if the bandwidth or transmit power is different. For example, if the bandwidth is 10 MHz and the transmitter power remains unchanged, add 3 dB to the value of RS Power.
2023-04-18 Huawei Proprietary and Confidential Page 21 of 35
SECRET
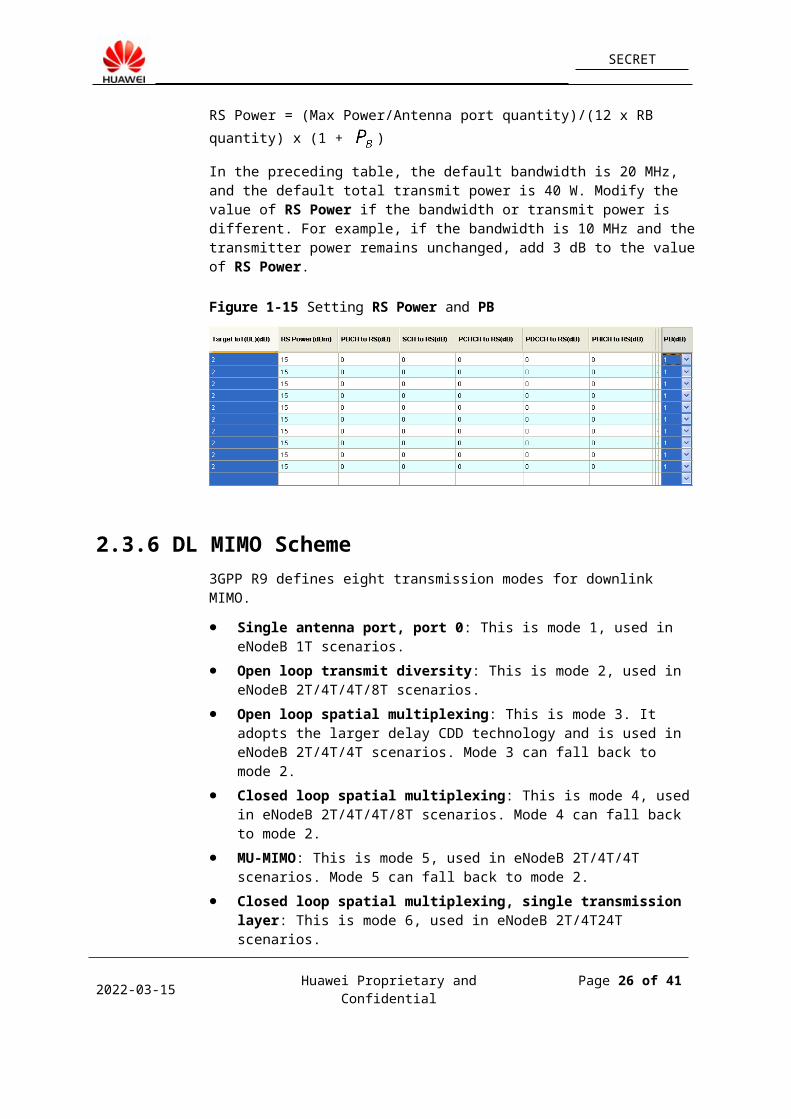
Figure 2-3 Setting RS Power and PB
2.3.6 DL MIMO Scheme3GPP R9 defines eight transmission modes for downlink MIMO.
Single antenna port, port 0: This is mode 1, used in eNodeB 1T scenarios.
Open loop transmit diversity: This is mode 2, used in eNodeB 2T/4T/4T/8T scenarios.
Open loop spatial multiplexing: This is mode 3. It adopts the larger delay CDD technology and is used in eNodeB 2T/4T/4T scenarios. Mode 3 can fall back to mode 2.
Closed loop spatial multiplexing: This is mode 4, used in eNodeB 2T/4T/4T/8T scenarios. Mode 4 can fall back to mode 2.
MU-MIMO: This is mode 5, used in eNodeB 2T/4T/4T scenarios. Mode 5 can fall back to mode 2.
Closed loop spatial multiplexing, single transmission layer: This is mode 6, used in eNodeB 2T/4T24T scenarios.
Single antenna port, port 5: This is mode 7. It is defined in 3GPP R8 and applicable to single layer BF. Mode 7 can fall back to mode 1 or mode 2.
Single layer BF and dual layer BF: This is mode 8. It is defined in 3GPP R9. Dual layer BF refers to Dual layer transmission, 7 and 8 of port, and single layer BF refers to Single antenna port, 7 or 8 of port. Single layer BF can also be used for MU-BF. Mode 8 can fall back to mode 1 or mode 2.
The UEs that support 3GPP R8 but do not support uplink transmit antenna selection can be handed over between modes 2, 3, and 7 in self-adaptation mode.
The UEs that support 3GPP R9 and uplink transmit antenna selection can be handed over between modes 2, 3, and 8 in self-adaptation mode.
Besides the preceding modes, U-Net also supports the following modes: open loop adaptation (modes 2 and 3), closed loop self adaptation (modes 4 and 6), and open-closed loop self adaptation (modes 2, 3, 4, and 6), and BF & MIMO self adaptation.
2023-04-18 Huawei Proprietary and Confidential Page 22 of 35

SECRET
Figure 2-1 Downlink MIMO mode
No model is set for mode 5 on U-Net, and the fallback of mode 5 is not taken into account. The performance of each MIMO mode is described in the MCS threshold table.
Some UEs do not support mode 7 or 8. If BF is selected in the cell table, select Support BF in the MIMO TerminalLTE Properties dialog box.
If Not Support is selected, the MIMO mode is mode 2 even if mode 7 or 8 is selected in the cell table.
If TM7 is selected, the MIMO mode is mode 7 even if mode 8 is selected in the cell table.
Figure 2-2 Setting UE Properties
2023-04-18 Huawei Proprietary and Confidential Page 23 of 35
SECRET
2.4 Traffic
2.4.1 Setting UE PropertiesNote the BF support mode and antenna quantity when you set the UE parameters. When calculating the downlink throughput, U-Net selects the MCS threshold according to the BF support mode and antenna quantity. Therefore, the downlink throughput may be incorrect if these parameters are incorrect.
For the setting rules, see section 2.2.2 "Antenna Configuration on eNodeB." For details about how to set the BF support mode, see section 2.3.6 "DL MIMO Scheme."
If the check box of Input RB Number is selected, you can obtain the RB quantity supported by the UE from this window.
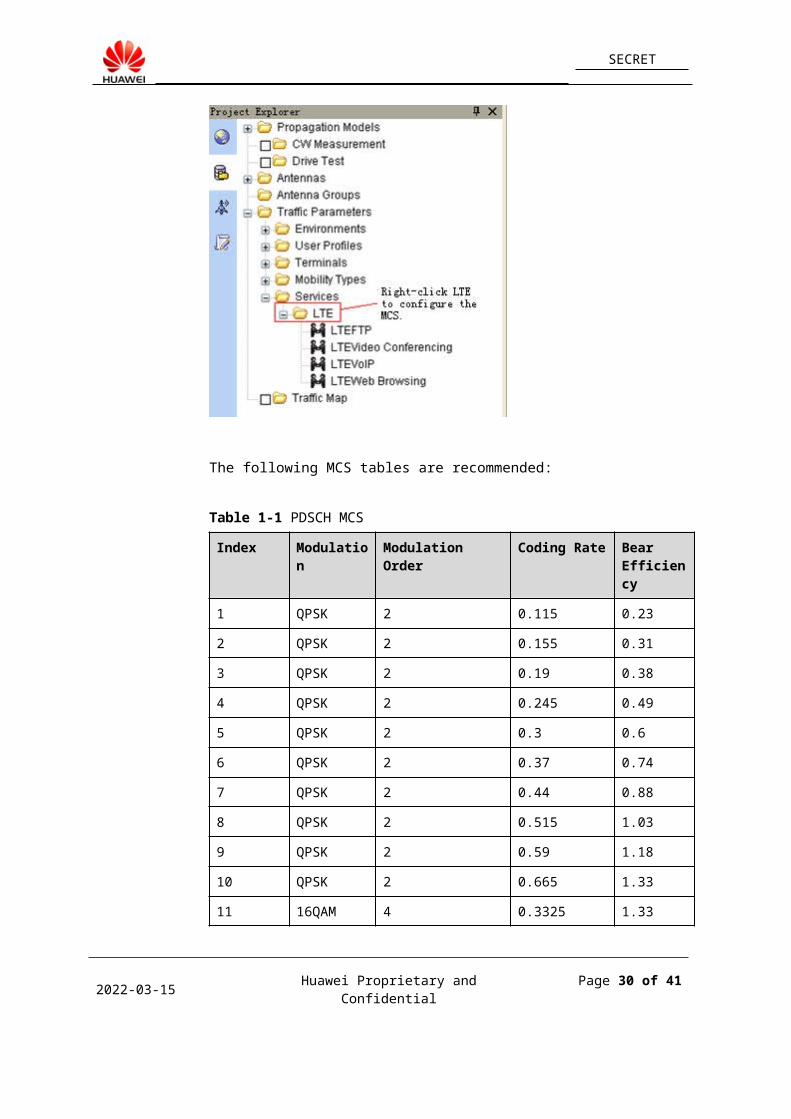
Choose Traffic Parameters > Terminals > LTE. Double-click MIMO TerminalLTE or Mobile TerminalLTE. The MIMO TerminalLTE Properties dialog box is displayed.
Figure 2-1 Setting the antenna type of a UE
2023-04-18 Huawei Proprietary and Confidential Page 24 of 35
SECRET
2.4.2 Setting the MCS EfficiencyBy default, the MCSs of all MIMO modes supported by U-Net map the MCS efficiency in the PDSCH MCS and PUSCH MCS tables. Therefore, if you use the MCS thresholds of the MIMO modes supported by U-Net, do not modify the MCS tables. If you want to use custom MCS tables and custom MCS thresholds, you can modify the MCS tables.
Choose Traffic Parameters > Service > LTE > PDSCH MCS & PUSCH MCS.
The following MCS tables are recommended:
Table 2-1 PDSCH MCS
Index Modulation
Modulation Order
Coding Rate
Bear Efficiency
1 QPSK 2 0.115 0.23
2 QPSK 2 0.155 0.31
3 QPSK 2 0.19 0.38
4 QPSK 2 0.245 0.49
5 QPSK 2 0.3 0.6
6 QPSK 2 0.37 0.74
7 QPSK 2 0.44 0.88
8 QPSK 2 0.515 1.03
2023-04-18 Huawei Proprietary and Confidential Page 25 of 35
SECRET
Index Modulation
Modulation Order
Coding Rate
Bear Efficiency
9 QPSK 2 0.59 1.18
10 QPSK 2 0.665 1.33
11 16QAM 4 0.3325 1.33
12 16QAM 4 0.37 1.48
13 16QAM 4 0.425 1.7
14 16QAM 4 0.4775 1.91
15 16QAM 4 0.54 2.16
16 16QAM 4 0.6025 2.41
17 16QAM 4 0.6425 2.57
18 64QAM 6 0.4283333 2.57
19 64QAM 6 0.455 2.73
20 64QAM 6 0.505 3.03
21 64QAM 6 0.5533333 3.32
22 64QAM 6 0.6016667 3.61
23 64QAM 6 0.65 3.9
24 64QAM 6 0.7016667 4.21
25 64QAM 6 1.08 4.52
26 64QAM 6 1.205 4.82
27 64QAM 6 0.8533333 5.12
28 64QAM 6 0.8883333 5.33
29 64QAM 6 0.925 5.55
Table 2-2 PUSCH MCS
Index Modulation
Modulation Order
Coding Rate
Bear Efficiency
1 QPSK 2 0.095 0.19
2 QPSK 2 0.125 0.25
3 QPSK 2 0.155 0.31
2023-04-18 Huawei Proprietary and Confidential Page 26 of 35

SECRET
Index Modulation
Modulation Order
Coding Rate
Bear Efficiency
4 QPSK 2 0.2 0.4
5 QPSK 2 0.245 0.49
6 QPSK 2 0.305 0.61
7 QPSK 2 0.36 0.72
8 QPSK 2 0.425 0.85
9 QPSK 2 0.485 0.97
10 QPSK 2 0.545 1.09
11 QPSK 2 0.61 1.22
12 16QAM 4 0.305 1.22
13 16QAM 4 0.35 1.4
14 16QAM 4 0.395 1.58
15 16QAM 4 0.445 1.78
16 16QAM 4 0.4975 1.99
17 16QAM 4 0.5325 2.13
18 16QAM 4 0.565 2.26
19 16QAM 4 0.6275 2.51
20 16QAM 4 0.6875 2.75
21 16QAM 4 0.7475 2.99
22 64QAM 6 0.498333 2.99
23 64QAM 6 0.538333 3.23
24 64QAM 6 0.581667 3.49
25 64QAM 6 0.623333 3.74
26 64QAM 6 0.663333 3.98
27 64QAM 6 0.706667 4.24
28 64QAM 6 0.735 4.41
29 64QAM 6 0.855 5.13
2023-04-18 Huawei Proprietary and Confidential Page 27 of 35

SECRET
2.4.3 Setting the MSC ThresholdThe MCS threshold on U-Net is changed from tier-fixed MCS to AMC. To ensure the correctness of the TBS/RB after the tier selection of SINR in the capacity forecast, you can use the default MCS thresholds of U-Net or customize an MCS threshold in capacity simulation. The customization method is as follows:
Choose Traffic Parameters > Terminals > Reception Equipment.
Figure 2-1 Configuring a MCS threshold
Select the reception equipment (eNodeB for the uplink equipment and UE for the downlink equipment), and modify the MCS threshold. By default, the first and second lines are modified. You can also create a new MCS threshold.
To ensure that a correct MCS threshold is selected, set the parameters related to the MCS threshold correctly in capacity simulation.
2023-04-18 Huawei Proprietary and Confidential Page 28 of 35

SECRET
Reception Equipment: Set the downlink reception equipment in the UE parameter window, and set the uplink reception equipment in the cell parameter table. Ensure that the UE is selected correctly in capacity simulation.
Set PDSCH MCS/PUSCH MCS.
Mobility: Set Mobility according to the MCS threshold in coverage forecast.
MIMO: Set the antenna quantities of the eNodeB and UE. For example, set this parameter to DL 2*2, which indicates configuring a two-way antenna for the eNodeB and a two-way antenna for the UE.
Set DL MIMO Scheme for the downlink equipment.
This section describes an actual case. In the cell parameter table, set the uplink reception equipment to Default Cell Reception Equipment, and set the downlink reception equipment to Default UE Reception Equipment.
Figure 2-2 Setting the uplink and downlink equipment
Set the MCS and MCS threshold. For details about how to set the MCS, see section 2.4.2 "Setting the MCS Efficiency.". For details about how to set the MCS threshold, see Figure 2-1. In the Default UE Reception Equipment Properties dialog box, set Mobility to 30Km/h, MIMO to 2x2, and DL_MIMO_Scheme to TM2. Ensure the
2023-04-18 Huawei Proprietary and Confidential Page 29 of 35
SECRET
antennas of the eNodeB and UE are set correctly. For details about how to set the antennas, see section 2.2.2 "Antenna Configuration on eNodeB" and section 2.4.1 "Setting UE Properties." In section 2.2.2 "Antenna Configuration on eNodeB," Tx Number is set to 2, indicating a two-way antenna is configured for the eNodeB. In section 2.4.1 "Setting UE Properties," Number of Reception Antenna Ports is set to 2, indicating a two-way antenna is configured for the UE.
Ensure that the mobility speed is correctly set. The procedure is as follows: Right-click Predictions and choose New from the shortcut menu. The New Prediction Group dialog box is displayed.
Figure 2-3 Setting the mobility rate for coverage forecast (1)
Select the studies, and click Next. The Group Properties dialog box is displayed. Select the Condition tab. Set Mobility to 30km/h to ensure that the mobility rate is consistent with that of the MCS threshold. If the mobility rate in antenna configuration or UE configuration is inconsistent with that of the MCS threshold, the MCS threshold cannot be correctly read, and the studies cannot be correctly calculated.
2023-04-18 Huawei Proprietary and Confidential Page 30 of 35

SECRET
Figure 2-4 Setting the mobility rate for coverage forecast (2)
2.4.4 Setting the Service RateMax Throughput indicates the required throughput rate of the UE. Currently, full buffer services are used in most capacity simulations. Therefore, set Max Throughput to as large a value as possible, such as 100 Mbps or 200 Mbps, to ensure that all resources can be used up.
During the simulation of real services, set the mobility rate according to the specific service. If the quantity of UEs is insufficient and the service rate is low, the resources may be redundant, and the throughput of the cell may be low.
If the guaranteed bit rate (GBR) service is used, select GBR. After GBR is selected, U-Net automatically raises the priority of the UEs whose throughput does not reach the value of Min Throughput to ensure that the average service rate of the UEs reaches the value of Min Throughput.
2023-04-18 Huawei Proprietary and Confidential Page 31 of 35

SECRET
Figure 2-1 Setting the Service Rate
2023-04-18 Huawei Proprietary and Confidential Page 32 of 35

SECRET
3 FAQs
3.1 How Do I Do If the Link Estimation Result Is Inconsistent with the Coverage Forecast Result on U-Net When the Parameter Settings Are Consistent?
Analysis: If the link estimation result is inconsistent with the coverage forecast result on U-Net when the parameter settings are consistent, the possible causes are as follows:
1. Different methods are used to calculate the antenna gain.
Link estimation: Use the maximum antenna gain of the eNodeB and do not take the fading of the antenna in every direction into account.
Coverage forecast on U-Net: Calculate the antenna gain according to the actual antenna file and take the fading of the antenna in every direction and the impacts of the azimuth and downtilt into account. Therefore, the antenna gain obtained on the cell edge is usually not the maximum value.
2. Different downlink interference models are used.
Link estimation: The downlink interference margin is a simulation result of the radio transmission technology (RTT) in the case of different loads. The link estimation result varies according to the downlink interference margin.
Coverage forecast on U-Net: The downlink interference margin is calculated according to the current network configuration.
3. The transmit power of each RB is inconsistent due to different uplink transmit power and RB quantity.
Link estimation: The maximum transmit power in the link estimation table is used as the uplink transmit power. The RB quantity is calculated according to the service rate on cell edge and the tier of the MCS.
2023-04-18 Huawei Proprietary and Confidential Page 33 of 35

SECRET
Coverage forecast on U-Net: Uplink open loop power control is used. The transmit power of each RB is calculated according to the P0 and Alpha in the protocol. The formula for calculating the RB quantity used in each uplink location is as follows:
Min[Bandwidth x Load, MaxPower/(Po + Alpha x PL)]
4. The uplink IOT in coverage forecast is different from that in link estimation.
Link estimation: The maximum coverage distance is used in link estimation. The background noise increase on cell edge is used as the IOT, which is different in indoor and outdoor scenarios.
Coverage forecast on U-Net: The cell-level IOT is used in coverage forecast, which is the same in indoor and outdoor scenarios. It can be calculated according to the uplink transmit power of the actual UE.
Therefore, the link estimation result is different from the coverage forecast result on U-Net. Do not compare them directly.
2023-04-18 Huawei Proprietary and Confidential Page 34 of 35

SECRET
4 References
1. Guide to the Template for Setting LTE Engineering Parameters
2. Shadow Fading in Coverage Forecast and Capacity Simulation
2023-04-18 Huawei Proprietary and Confidential Page 35 of 35