u n for 1992 o o o - noaa fisheries: northeast fisheries ... · ~"rhis report is...
TRANSCRIPT

_-.Jc.--_~n _u -------~;
PB93144103--- ---- --'I I
'" "" II "'" 11111' """ 11111 ~ '------ -----)
Status of F!shery Resources
off the- Northeastern U n ~ted States
for 1992
o
o o

\
61. FisU"n !!IS SelJ]~furnells o[ lElI1lviroll1lmell1l~!!Ill lHIe!!lll~U"n. By Robert A. Murchelano. September 1988. iii + 16 p., 4 figs. NTIS Access. No. PB89-139737/AS. . .
62. 1'U"ne IEfr'll'eds oIfDelll1si.~y DeJ!lelll1dell1l~ lP'o[pQ.llll!!l~iolJ] Mecibl!!llJ]isms 01J] AssessmelJ]~ Advice [Oil" ~ihle Norill1lwes~ A~ll!!llJ]~ic M!!Ickenll SUoclk. ByW. 1. Overholtz, S.A. Murawski, W.L. Michaels, andL.M. Dery. October 1988. v + 49.p., 7 figs., 20 tables. NTIS Access. No. PB89-151948/AS.
63. S~!!I~l.lIS olfftll1le Fisll1lerry lResol.llll"Ces Ofr'll'~ible Nortible!!ls~e!l"lJ] TLJIJ]i.~ed s~!!Iaes [Oil" 1988. By Conservation and Utilization Division. October 1988. iii + 135 p., 51 figs., 52 tables. NTIS Access. No. PB89-130819/AS.
64. 1'ihle Sihlellll Disel!lse SYll1ldrome ill1l M!!Inll1le Crushnce!!ll!Ds. By Carl 1. Sindermann. February 1989. v + 43 p., 5 figs., 2 tables. NTIS Access. No. PB89-162523/AS.
65. S~ock Assessmell1l~ ITlJ]lfoll"m!!l~iolll1!foll" lP'olllloclk, lPollachius virens (lL.) , irrn UlI1le Scoui!!llJ] Sll:nelllf, Geou-ges IlblJ]k, !!IlJ]di Gl.lIl!f o[M!!Inll1le lRegiolJ]s. By Ralph K. Mayo, Stephen H. Clark, and M. Christina Annand. April 1989. vi + 14 p., 6 figs., 14 tables. NTIS Access. No. PB90-120676/AS.
66. Gl.lIidiellil!Des !fOil" lEsUi.m!!lUilJ]g lLell1lgftihls Ilift Age !fOil" 18 Noraihlwesft AUllllill1luk FilJ]rnsihl !llII1ld Sihlellllrnsll:n S[pedes. By Judith A. Pentilla, Gary A. Nelson, and John M. Burnett, III. May 1989. iii + 39p.,18 figs., 19 tables. NTIS Access. No.,PB90-120675/AS. ,I
67. lRes[polJ]se o!f ~ible lHI!!Iihi~!!I~ !!I1J]d! BioUIli o!f ~Il:ne ][Ilmell" New Y oll"k BigM Uo Aihlli~emelJ]U o!f Sew!!lge Slll.lld!ge DQ.IlID[pilJ]g. Secoll1ldi AII1lIIJIQ.Il!!lll lP'rogNSS lRe[port -- 1988. By Environmental Processes Division, Northeast Fisheries Center. July 1989. vii + 47 p., 39 figs., 11 tables, 3 app. NTIS Access. No. PB90-125444/AS.
68. MAlRMIAlP' Sl.lIll"Veys oHll:ne COIJ]UfurneIn~!!In SlI1lenlflrrom C!!IIPe lHI!!IMell"l!ls, Nortll:n C!!Irollimn, ~o C!!I[pe S!!Iiblle, Non §co~i!!l (19841-87). A~ll!lls No.3. §l.lImm!llrry olf Opell"l!lUiolJ]s. By John D. Sibunka and Myron J. Silverman. July 1989. iv + 197 p., 36 figs., 2 tables. NTIS Access. No. PB90-160656/AS.
69. 1'U"ne 1988 IEx[pell"i.melJ]~!Illl WIIlli.~iIng Fisiblerry: A NMFSfllmllQ.llS~rry CooIPell"l!lUive lP'rogll"l!lm. By Frank P. Almeida, Thurston S. Burns, and Sukwoo Chang. August 1989. v + 16 p., 9 figs., 11 tables, 1 app. NTIS Access. No. PB90-160664/AS.
70. SQ.IlIDmell" Dis~ll"ilbl.ll~ioll1l o!f lRegl.ll!lli~edi §[pecnes 01J] Georr-ges B!IlJrnk wi.ftll:n lReli'eNlJ]ce fto ~lI1le 1988 lEx[pell"i.melJ]~!Iln Wll:niUiJrng Fisll1lery. By Frank P. Almeida, Sukwoo Chang, and Thurston S. Burns. September 1989. v+ 25 p., 74 figs., 1 table. NTIS AcceSs. No. PB90-206525/AS.
71. AllioCl!luioJrn o!f Sft!!lUewid!e-lReportedi MlRFSS C!Ilftcll:n !IlJrndilL!IlJrndimgs Sft!!l~.i.sfti.cs iheUweelJ] AN!!IS: A[p[plliCl!lUi.olJ] fto WiJrnUell" 1fil0l.lllJ]diell". By FrankP. Almeida. September 1989. v + 18 p., 5 figs., 6 tables, 2 app. NTIS Access. No. PB90-246745.
,72. §ft!llftl.llS olTaible Fisll:nerry lResol.llll"Ces ofr'll' ftible Nortihlel!ls~e!l"lJ] 'iUlJ]i1ed S1!1l1es !fOil" 1989. By Conservation and Utilization Division, Northeast Fisheries Center. December 1989. iv + 110 p., 50 figs., 93 tables. NTIS Access. No. PB90-170622/ AS.
73. §l.lIri!!lce !IlJrndi BoUUom 1'em[pell"l!lftun Dis~Il"i.IbQ.llftnolJ] !fOil" ftll1le Nortihle!!lsU COJrnftmeJrnU!!Ill §iblell!f. By David G. Mountain and Tamara J. Holzwarth. December 1989. iii + 32 p., 31 figs. NTIS Access. No. PB90-252172/AS.
74. Siblellll lD>i.se!llse o!fCll"Q.IlSft!llce!!llJ]s m Uible New YOll"k BigM. By C.J. Sindermann (chair.), F. Csulak (EPA coord.), T.K. Sawyer (rapp.), R.A. Bullis, D.W. Engel, B.T. Estrella, E.1. Noga, J.B. Pearce, Jc. Rugg, R. Runyon, 1.A. Tiedemann, and RR. Young. December 1989. vii + 47 p., 7 figs., 4 tables, 4 app. NTIS Access. No.lPB90-195058/AS.
75. AJrn ][lJ]diexed! Biiblliogll"l!l[pll:ny olfNortll:ne!!lsft Fisll1lell"ies CelJ]ftell" lP'u1hlli.c!llftioJrns !mdilReports !fOil" 1988. By Jon A. Gibson. December 1989. iii + 32 p. NTIS Access. No. PB91-112912.
(continued on inside back cover)

i
NOAA Technical Memorandum NMFS-F/NEC-95
This TM series is used for doc;umentation and timely communication of preliminary results, interim reports, or special purpose information, and has not undergone external scientific review.
Status of Fishery Resources off the Northeastern United States
for 1992
Conservation and Utilization Division
Northeast Fishe,ries Science Center
U. S. DEPARTMENT OF COMMERCE Barbara H. Franklin, Secretary
National Oceanic and Atmospheric Administration John A. Knauss, Administrator
National Marine Fisheries Service William W. F_ox, Jr., Assistant Administrator for Fisheries
Northeast Region Northeast Fisheries Science Center
Woods Hole, Massachusetts
October 1992
L

Page ii
ACKNOWLEDGEMENTS
-.~l.
The following personnel of the Northeast Fisheries Science Center, listed alphabetically, assisted in writing .~~ , this report: Frank Almeida, Vaughn Anthony, Jon Brodziak, Nicole Buxton, Stephen Clark, Darryl Christensen, Ray Conser, Steven Edwards, Kevin Friedland, Wendy Gabriel, Daniel Hayes, Thomas Helser, Josef Idoine, John Kocik, Marjorie Lambert, Philip Logan, Ralph Mayo, Margaret McBride, Tom Morrissey, Steven Murawski, Loretta O'Brien, William Overholtz, Joan Palmer, Barbara Pollard, Anne Richards, Fredric Serchuk, Gary Shepherd, Katherine Sosebee, Mark Terceiro, James Weinberg, and Susan Wigley.
Computer plotting of the figures was by Frank Almeida, Daniel Sheehan, and Katherine Sosebee. Steven Murawski and Elizabeth Holmes completed technical editing. Information Services staff provided design, layout, photo management, printing, and distribution.

Page iii
TABLE OF CONTENTS
Introduction ........................................................................................................................................................................... 1 Overview of assessment approaches ........................................................................................................................... 1 Kinds of assessments .................................................................................................................................................... 2 Fishery management ................................................................................................................................ , .................... 4 Definition of technical terms ........................................................................................................................................ 4
Fishery landings trends ........................................................................................................................................................ 9 Aggregate resource trends ................................................................................................................................................. 11
Research vessel trawl survey data ............................................................................................................................. 12 Summary of trends ..................................................................................................................................................... 12 Commercial trawl catch and effort data ................................................................................................................... 13 Conclusions about resource abundance .................................................................................................................... 15
FiShery economic trends ....................................................................................................................................... ............ 17 Regional summary ..................................................................................................................................................... 17 Data collection considerations .................................................................................................................................. 19 Fleets and fish ............................................................................................................................................................. 21 Trade ........................................................................................................................................................................... 26 Processing ................................................................................................................................................................... 26 Foreign fishing and joint ventures ............................................................................................................................ 27 Recreational fishing ................................................................................................................................................... 27 Net national benefits .................................................................................................................................................. 28
Research vessel surveys .................................................................................................................................................... 30 Introduction ................................................................................................................................................................ 30 Why conduct research vessel surveys? ..................................................................................................................... 31 What types of surveys are conducted? ................................... ; ................................................................................. 33 Why do research vessels sometimes go where there are few fish? ........................................................................ 38
Species synopses ................................................................................................................................................................ 39
Principal groundflsh 1. Atlantic cod· ........................................................................................................................................................ 41 2. Haddock ............................................................................................................................................................. 44 3. Redfish (ocean perch) ....................................................................................................................................... 47 4. Silver hake (whiting) ......................................................................................................................................... 49 5. Red hake ............................................................................................................................................................ 52 6. Pollock ............................................................................................................................................................... 55
Flounders 7. Yellowtail flounder .......................................................................................................................................... 57 8. Summer flounder (fluke) ................................................................................................................................. 62 9. American plaice (dab) ...................................................................................................................................... 64
10. Witch flounder (gray sole) .............................................................................................................................. 66 11. Winter flounder (blackback, lemon sole) ........ , .............................................................................................. 68 12. Windowpane flounder ..................................................................................................................................... 72
Other groundflsb 13. Goosefish .......................................................................................................................................................... 75 14. Scup (porgy) ..................................................................................................................................................... 77 15. Black sea bass ................. ~ ................................................................................................................................. 79 16. Ocean pout ........................................................................................................................................................ 81 17. White hake ........................................................................................................................................................ 83 18. Cusk .................................................................................................................................................................. 85 19. Atlantic wolffish (catfiSh) ................................................................................................................................ 87 20. Tilefish ............................................................................................................................................................ :. 89

Pageiv
Principal pelagics 21. 'Atlantic herring ........................................................................................................................ .................. 91 22. Atlantic mackerel ................. : ..................................................................................................................... 93
Other pelagics 23. Butterfish ................................................................................................................................................... 95 24. Bluefish ... ................................................................................................................................................... 97 25. Spiny dogfish ............................................................................................................................................. 99 26. Skates ............................................................................................................................................ ; .......... 101 . .
Invertebrates 27. Short-finned squid (Illex) ........................................................................................................................ 103 28. Long-finned squid (Loligo) ..................................................................................................................... 105 29. American lobster (Northern lobster) ....................................................................................................... 107 30 . Northern shrimp ...................................................................................................................................... 110 31. Surfclam .................................................................................................................................................. 112 32. Ocean quahog .......................................................................................................................................... 115 33. Sea scallop ............................................................................................................................................... 118,
Anadromous fish 34. River herring (alewife, blueback herring) .......................................................................... , .................... 122 35. American shad ......................................................................................................................................... 124 36. Striped bass.............................................................................................................................................. 126 37. Atlantic salmon ......................................................................................................................................... 128 38. Sturgeon .................................................................... ................................................................................ 130
Common name index ............................................................................................................................................... 132 Scientific name index ..... ~ .......................................................................................................................................... 133

Page 1
INTRODUCTION
Atlantic cod, king of the New England groundfish catch.
~The Conservation and Utilization lighting recreational fishing trends and Division of the Northeast Fisheries data collection programs in the region. Science Center (NEFSC), with head- The Species Synopses section, on the quarters in Woods Hole, Massachu- other hand, includes information about setts, annually updates its assessments the status of 50 individual populations
';of finfish and shellfish resources off or stocks of some 38 species of finfish ~he northeastern coast of the United and shellfisht)~ ~ Sl£tes~and presents detailed informa- The speCies oescribed in the Spe-tion .... o~ed to adrninistrators, man- cies Synopses section can be grouped agers, th~·ftshing industries, and the conveniently under eight headings:
pu15lic:-'lf'lll~Je1JOrt is based on those), ,'- principal groundfish, flounders, other assessmentS':-'ld summarizes the gin- . groundfish, principal pelagics, other eral status of selected finfish and shell- pelagics, invertebrates and anadromous f'sh resources off the northeastern coast species. There are several other spe-o{ the United States from Cape Hatteras cies of commercial and recreational to Npy.a..S.C2!i~,l:>v !':U'lUI1eT 1992. , importance which are not included ~"rhis repOrt is div'hi'ecf i~to two here, such as bluefin and yellowfin
sections, Aggregate Summaries and tuna, swordfish, red crabs, sand lance, Species Synopses. The Aggregate sea urchins, menhaden, and pelagic Summaries section includes general sharks, and inshore shellfish, includ-descriptions of fishery landings trends, ing softshell and hard clams, oysters, aggregate resource trends and com- and blue mussels. Some of these are mercial fishery economic trends. A migratory species that seasonally move special section is added this year high- outside the northeastern fishery con-
servation zone (FCZ) , while others are fisheries that have not been routinely assessed by the Northeast Fisheries Science Center.
OVERVIEW OF ASSESSMENT APPROACHES
Depending on the nature of the fishery, the type and amount of data from the fishery and from research surveys, and the information required for management, the assessment information reported here may be generated in several different ways. Figure 1 is a diagram of several ways in which catch and survey data, 'in the lower left and right boxes respectively, can be combined to provide assessment advice, illustrated at the top of the diagram. The simplest approach is when

Page 2
catch data are used to generate indices of abundance, as seen by moving-vertically up the right side of Figure 1. A more complex approach is when the catch data are combined with trawl survey data to generate indices of abundance, as seen by moving vertically up the left side of Figure 1. These approaches are frequently supplemented with knowledge of the life history generated from biological data from sampiing the commercial and survey catches. A third approach is to utilize the information about total stock size and population productivity generated under the first two approaches to determine the relationship between productivity and stock size; this is referred to as production models. Finally, for those species where the age composition of the catch or of the survey samples
. can be determined reliably, more detailed analytic assessments ca!1- be developed that use the information in the age structure of the population and the catches to determine productivity.
The status of information pertaining to the various elements in Figure 1 is diagrammed in Figure 2. The great differences in availability of different types of information (colWIUlS) for the several species of interest in this region (rows) suggests why assessments of different species involve different paths in Figure 1. Although research on some of the species has been underway for many years, some of the items are still not known. As fisheries become more intense, more of the categories will need to be filled to evaluate the effects of fishing on the resource. Much of the biological information (e.g. growth and maturity rate) must be continually updated since these parameters are apt to change significantly with the level of exploitation and due to environmental variation.
The different informational paths in Figure 1 result in assessment information having different levels of s0-
phistication and reliabili ty. The actual level of complexity of an assessment is determined by the amount of information available, as indicated in Figure 2, and by the amount of information needed by management. Although there is some overlap, the assessments
STOCK ASSESSMENT SYSTEMS MODEL
[ SCIENTIFIC ADVICE I I
TRENDS IN CATCH AND TRENDS IN
RELATIVE -- ABUNDANCE RELATIVE
ABUNDANCE PROJECTIONS ABUNDANCE I I l YIELD/RECRUIT I EVALUATION OF SSB/RECRUIT
MANAGEMENT I OPTIONS
I BIOLOGICAL
DATA
CURRENT -GROWTH
ABUNDANCE AND -MATURITY
FISHING MORTALITY -etc_
IN-DICES OF AT AGE INDICES OF
STOCK I ABUNDANCE --I CALIBRATION I STOCK·
AND ABUNDANCE:
RECRUITMENT I CPUE/LANDINGS HISTORICAL
ABUNDANCE AND FISHING MORTALITY
$ AT AGE
1 CATCH-AT-
AGE MATRIX (NUMBERS)
1 AGE-LENGTH KEY
SIZE COMPOSITION, .1 FISHERY
-,- CATCHES ~ LENGTH/WEIGHT - I '
1 RESEARCH
BIOLOGICAL I SEA I FISHERIES:
DATA -LANDINGS VESSEL I SAMPLING
-GROWTH -EFFORT SURVEYS -MATURITY -SAMPLING
-etc.
Figme 1. Diagram of alternative ways in which fishery-generated data and research vessel data (lower right and left boxes, respectively) are combined to provide scientific advice on the status of the stocks.
presented here can be roughly grouped in order of increasing level of complexity into the following categories, each one including features of all simpler levels.
KINDS OF ASSESSMENTS
INDEX: assessment relies on an index of stock size, from resource survey data or from fisheyry catchper-unit-of-effort (CPUE) data.
YIELD: assessment also includes an evaluation of yield tradeoffs for different levels of fishing mortality and ages of fish caught, (e.g. yield-perrecruit analysis).
AGE STRUCTURE: assessmentalso includes analysis of the observed age composition of the catch (e.g. virtual popUlation analysis).
SPAWNING STOCK: assessment also includes analysis of the data on spawning stock size and subsequent recruitment.
PREDICTIVE: assessment also includes a model for future stockconditions that accounts for variations in the environment.
For example, in Figure 1 an INDEX level assessment involves information generated by following either the rightmoSt or leftmost vertical arrows, depending on whether commercial or survey data were available. A

Figure 2. Status of biological assessment knowledge required for fishery management.
_ Acceptable State of Knowledge rn Significant Progress ...... Provisional Analysis C.:.::1 No Analvsis IEII No Data o Not Applicable
ATLANTIC COD
HADDOCK
REDFISH SILVER HAKE
RED HAKE
POLLOCK YELLOWTAIL
SUMMER FLDR. AMER. PLAICE
WITCH FLDR. WINTER FLDR. WINDOWPANE
GOOSEFISH
SCUP BLACK SEA BASS
OCEAN POUT
WHITE HAKE CUSK
WOLFFISH
TILEFISH ATL. HERRING
ATL. MACKEREL BUTTERFISH
BLUEFISH
RIVER HERRING AMER. SHAD
STRIPED BASS SPINY DOGFISH
SKATES ILLEXSQUID
LOL/GO SQUID AMER. LOBSTER
NORTH. SHRIMP SURF CLAM
OCEAN QUAHOG SEA SCALLOP
ATL.SALMON
"0 ..c: ~ i U
0 0 - "-00 CJ
>--.::; .;::; -0 U CD
CD~ N·- CD .- '- 00 00:::1 -- '-CD co co en::E CD « CJ
!/l !/l 0 en "0 ..c: c: '- .~ U
CIS -"0 U Cl co ..c: c: !/l - U U
iii co "0 Cl -.....J c: 0 U co E .....J ..c: -E - 0
E E 0 C) c: CD
0 0 CD en CD u u a: -I «
Page 3
.t:: !/l :::I CD CD >< '- .~ > '0 CD U !/l .;::; CD "0 CD >- U dl Q. c: a: (ij CD > 00 - a- 0.t=_
>- ·m c: !/lCD UCD W CD 00 « 0"0 '-'0 "0 ::J ~ :::0 "Co CD
00 a: >< Cl.. :::I CD::E ~::E - - ~ U 00 >- 00 a: Cl..

Page 4
Table 1. Federal and interstate fishery management plans currently in place or under development for fisheries off the northeastern United States
Plan Type Organization Since Responsible
1. Northeast Multispecies FMP NEFMC 1986 2. Atlantic Sea Scallop FMP NEFMC 1982 3. American Lobster FMP NEFMC 1983 4. Surfclam-Ocean Quahog FMP MAFMC 1977 5. Squid-Mackerel-Butterfish FMP MAFMC 1978 6. Summer Bounder Cooperative MAFMC/ASMFC 1988 7. Bluefish Cooperative MAFMC/ASMFC 1989 8. Atlantic Herring Cooperative NEFMC/ASMFC 9. Northern Shrimp Interstate ASMFC 1974 10. Striped Bass Interstate ASMFC 1981 11. Swordfish FMP NMFS 12. Pelagic' Sharks FMP NMFS 13. Atlantic Billfish FMP NMFS 14. Tilefish .FMP MAFMC 15. Atlantic Salmon FMP NEFMC 1987 16. Winter Flounder Interstate ASMFC 1992
1 Amendment revision In process
YIELD level assessment would also involve information from the box in the lowest rank labeled AGE AND GROWfH. Assessments at the AGE STRUCTURE and SPAWNING STOCK levels would require, in addition to the above, information represented in the middle column of boxes in Figure 1. Finally, a PREDICTIVE level assessment would require substantial additional information on the survival of year classes not yet recruited to the fishery.
Increasing the level of complexity of an. assessment requires substantial additionalresearch;subsequeritly,substantiaJ1y more activity each year is required to maintain it at its more complex level. Conversel y, the level of an assessment can decrease relatively quickly if sufficient activity is not needed to interpret each year's events and new data.
The required level of an assessment depends on the complexity of the information needed for management. If managers require estfmates of annual quota levels, for example, then a more complex assessment is generally needed.
Both Figures 1 and 2 reflect information about each species separately, as if they had no interactions with each other. There are Significant biological
(predator/prey) and technological (bycatch) interactions among northeast fishery resOurces, and a large part of the Center's research program has been dedicated to collecting information for and modeling the' effects of interactions among these resources. The results of these studies are not presented in this document. The assessments in the Species Synopses section of this report are presented individually, with little indication of the biological interactions among species or of the technical interactions due to the mixed-species nature of many of the fisheries. The significance of the . mixed-species nature of the trawl fisheries in the Northeastern United States is illustrated in the section entitled Aggregate Resources Trends (page 11). There, aggregate research trawl survey and commercial trawl data are
. presented illustrating major trends in abundance and catches. The informa~ tion presen ted there, however, is rather simple, and does not address many of the complexities of these multispecies fisheries. Additional studies of the dynamiCS of the mixed-species trawl fishery, and of the mixed species complex that it catches, are needed to adequately address pressing management needs.
Last Amendment Amendment Number
1991 41
1989 41
1989 31
1990 8 1990' 1992 2
Under Development 1986 1989 4
Under development Under development Under development Under development
FISHERY MANAGEMENT
Fisheries occurring primarily in the Exclusive Economic Zone (EEZ) off the Northeastern U.S. are managed under Fishery Management Plans (FMPs) developed by the New England Fisheries Management Council, the Mid-Atlantic Fisheries Management Council, and, in a few instances, under Preliminary Fishery Management Plans (PMPs) developed by the National Marine Fisheries Service. Fisheries occurring primarily in state waters are managed by the individual states or under Interstate Agreements under the auspices of the Atlantic S ta tes Marine Fisheries Commission. The management currently in plaCe is shown in Table 1.
DEFINITION OF TECHNICAL TERMS
Assessment terms used throughout this document may not be familiar to all. A brief explanation of some follows, organized alphabetically. Assessment level: Categories of the
level of complexity of and data available for each assessment included in this document: index of abundance

(INDEX), yield-per-recruit analysis (YIELD), analysis of the age structure of the catch (AGE STRUCTURE), analysis including the relationship between recruitment and . spawning stock size (SPAWNING STOCK) and assessment that allows prediction of future (one or two years ahead) stock sizes and catches (PREDICTIVE). These levels are detailed in the section titled Overview of Assessment Approaches.
Biological reference points: Fishing mortality rates that may provide acceptable protection against growth overfishing and/or recruitment over~ fishing for a particular stqck. They are usually calculated from equilibrium yield-per-recruit curves, spawning stock biomass-per-recruit curves and stock recruitment data.
Examples are Fo.l ' F max and F naI'
Exploitation pattern: The distribution of fishing mortality over the age composition of the fish population, determined by the type of fishing gear, areal and seasonal distribution of fishing, and the growth and migration of the fish. The pattern can be changed by modifications to fishing gear, for example, increasing mesh or hook size, or by changing the ratio of harvest by gears exploiting the fish (e.g., gill net, trawl, hook and line, etc.).
Exploitation rate: The proportion.of a population at the beginning of a given time period that is caught during that time period (usually expressed on a yearly basis). For example, if 720,000 fish were caught during the year from a population of 1 million fish alive at the beginning of the year, the annual exploitation rate would be 0.72.
F DIU: The rate of fishing mortality for a given exploitation pattern rate of growth and natural mortality, that results in the maximum level of yieldper-recruit. This is the point that defines growth overfishing.
FOol: The fishing mortality rate at which the increase in yield-per-recruit in weight for an increase in a unit-ofeffort is only 10 percent of the yieldper-recruit produced by the first unit of effort on the unexploited stock
(i.e., the slope of the yield-per-recruit curve for the FO.I rate is only one-tenth the slope of the curve at its origin).
Growth overtlshing: The rate of fishing, as indicated by an equilibrium yield-per-recruit curve, greater than which the losses in weight from total mortality exceed the gain in weight due to growth. This point is defined
as F max'
Long-tenn potential catch: The largest annual harvest in weight that could be removed from a fish stock year after year, under existing environmental conditions. This can be estimated in various ways, from maximum values from production models to average observed catches over a suitable period of years.
Mortality rates: Mortality rates are critical for determining the abundance of fish populations and the effects of harvesting strategies on yield and spawning potential from the stock. Fish abundance is a balance between the factors that act to increase the stock -- births -- and factors that decrease population numbers -- deaths. When births exceed deaths, the stock increases, and vice-versa. The stock is brought into stability when the number of recruits entering the fishery balances the number of deaths. Fishery managers can control deaths caused by fishing by manipulating the sizes of fish vulnerable to the gear. Fishing mortality can be changed through indirect methods, such as regulating mesh size to make fish of certain ages less vulnerable to the gear. Direct control measures, such as catch quotas or effort limits, determine the rate of fishing mortality on the vulnerable sizes. The total number of births is determined by the abundance of breeders in the population --the spawning stock-- which can also be manipulated by managers.
Mortality occurs at all life stages of the population. Depending on the species, mortalities suffered from the egg to larval stages are usually very high, less so from the larval to juvenile stage. As young fish, death
Page 5
can occur from several causes: starvation, predation, or disease. As fish pass their first year, these "natural" causes of death usually decline dramatically, and in many cases, fishing becomes the dominant source of mortality. Pollution may also add to the death rate Qf the population. Generally, the young life stages are more vulnerable to pollution mortalities than are older fish.
Knowing the sources and levels of mortalities affecting fish populations is a critical ingredient of forecasting both the landings and spaWJling stock sizes, and, more importantly, the changes in populations that may be caused by regulations that those impose specific mesh sizes, minimum fish lengths, quotas, effort limits, and area closures. The rate at which the stock is harvested is usually estimated by calculating the abundance of a cohort or year class over successive years to determine how fast it is declining. The total mortality of the population is the sum of deaths due to both natural and fishing-related causes.
Mortalities are usually expressed as rates, which has led to considerable confusion, particularly in the context of fishery management. The following simple example compares the use of fish population mortality rates with a more familiar example of using rates -- compound interest applied to a savings account.
If you put $1,000 in a savings account with a guaranteed annual interest rate of 5 percent, how much interest is gained over time, and what is the account balance over, say, 10 years? The following table represents a simple way to compute interest and total balance (in dollars) over the ten year period:
Year Principal Earned Bank Amount Interest !;Ialance
1 1,000.00 50.00 1,050.00 2 1,050.00 52.50 1,102.50 3 1,102.50 55.13 1,157.63 4 1,157.63 57.88 1,215.51 5 1,215.51 60.78 1,276.29 6 1,276.29 63.81 1,340.10

Page 6
Year Principal Eamed Amount Interest
7 1,340.10 67.01 8 1,407.11 70.36 9 1,477.47 73.87 10 1,551.34 77.57
Bank Balance
1,407.11 1,477.47 1,551.34 1,628.91
In this example, the balance at the end of one year becomes the principal amount for the next, and so on. The increase in the total balance over time is plotted in the upper panel (A) of Figure 3. The 5 percent interest is applied to the account balance at the end of each year ("compounded annually"). In order to compute your balance at the end of 10 years, you must make nine prior calculations to trace the interest and balance each year. Although this is a'straightforward approach to a simple example, banks do not compute interest earnings this way, for three reasons: (1) the process is rather lengthy to compute, particularly where the number of time periods may be great, (2) smallinaccuracies that occur when rounding the account balances to whole cents, these add up over a large number of accounts, and (3) most importantly, the method is unrealistic since you
, cannot apply the annual rate directly to monthly or daily balances. In the real world, savings accounts constantly have varying amounts of principal balance, and interest rates fluctuate. Fortunately, some rather important mathematical formulas were derived (back in the time of Isaac Newton) that solve the three problems noted earlier. Computing the account balance at any point in time involves two formulas, and the use of logarithms:
r = lo~ (1 +i) (1) where, r = the instantaneous rate of interest;
the rate of interest applied to a very small increment of time
i = the periodic interest rate, expressed as a proportion (5% = 0.05);
lo~ = the logarithm of the quantity 1 +i, using the natural logarithm system (sometimes abbreviated In).
Figure 3. Two examples of the application of annual rates to compute changes in numbers. Panel A gi ves the expected increase in a theoretical savings account with $1 ,000 invested at 5 percent per year, with annual compounding and no withdrawals. Panel B gives the expected population size over 10 years with an initial population size of 1,000 fish, and an annual mortality rate of 5 percent.
1700
1600 SAVINGS ACCOUNT
1500 5% ANNUAL INTEREST RATE
1400
1300
1200 W U 1100 Z A « 1000 ~
« 900 m
800
700 FISH POPULATION
600 5% ANNUAL DEATH RATE
500
400 B 300
0 2 3 4 5 6 7 8 9 10
YEAR FROM START
The instantaneous rate corresponding to a 5 percent annual interest is then 0.488. From this calculation, the bank can apply the following formula to compute account balances:
Balance = . (2) Initial Principal Amount X e"
where, Balance = the total balance (princi
pal + interest) at time, t; Initial principal = the amount ori
ginally placed into the account;
e = the base of the natural logarithm system (=2.71828);
r = the instantaneous interest rate, computed with formula (1);
t '= time, expressed in units similarto the interest rate (years, months, days)
Thus, in our example, if the annual interest rate is 5 percent, the account balance after 10 years is: $1000.00 X 2.71828 0,Q488 X 10 = $1,628.89. Note that the account balance computed with the formulas is 2 cents lower than in the table. This is because the balances are rounded to whole cents at each step in the calculation in the table. By using the formula rather than the 10-step calculation, the bank saves a
. tiny bit of interest in this example. So what does this have to do with
fish mortality rates? The formulas used to illustrate bank interest rates are directly comparable to formulas used by fishery scientists to track the decline of stock. The one big difference is, of course, that the interest rates are set by the bank and wellpublicized. In the case of fish populations, scientists must estimate the mortality rates based on measure-

ments of the decline of various age groups of the population over time.
The decline of a fish stock over time, subjected to a 5 percent annual death rate is portrayed in the lower panel (B) of Figure 3. Note that in this example the population at time a (the start) is 1,000 fish. The big difference from the interest rate example is that the total bank balance increases, while the number of fish declines. At the end of 10 years there are 599 fish left in the population. This total is calculated in exactly the same manner as for the savings account:
z = -Io~ (I-a) (3) where, z= the instantaneous mortality rate
of the population (sometimes called the total instantaneous mortality rate);
a = the periodic mortality rate, expressed as a proportion (5 percent' per year = 0.05);
lo~ = the natural logarithm of the quantity 1 +i
The quantity I-a equals the annual survival rate, which in this case is 1-0.05 = 0.95 (95%); Z = 0.0513.
Total numbers in the population are then calculated from a formula similar to (2):
PopUlation Numbers = (4) Initial Population Number X e'ZI
where, PopUlation = the population reNumbers maining at time, t;
Initial PopUlation Number
= the number of fish at the beginning time period
e = the base of the natural logarithm system (= 2.71828);
z = the instantaneous mortality rate, computed with formula (3);
t = time, expressed in units similar to the mortality rate (years, months, days).
At the end of 10 years, the number of survivors is 1000 x 2.71828 .{l.am • 10 = 599 fish.
This example uses an annual mortality rate (5 percent) that is unrealistically low for most of the exploited stocks off the Northeastern United States (the exceptions are some long-lived stocks exploited at low rates such as ocean quahog and Acadian redfish). For some heavily fished stocks (scallops, yellowtail flounder) the annual mortality rates of harvested sizes may exceed 80 percent, with the majority of the deaths due to fishing. The instantaneous total mortality rate corresponding to an 80 percent annual mortality rateis:-Iog
e(1-0.80)= 1.609. Foran
annual mortality rate of 80 percent, the number fish alive after 5 years, from an initial population of 10,000 fish is: 10,000 X 2.71828 ·1.609., =, 3.2 fish!
Fishery scientists use different notation to account for the various sources of mortalities affecting populations. Using instantaneous rates, natural mortality is usually denoted as M; fishing mortality by F. As instantaneous rates they are addi-
Page 7
stock. At intermediate stock abundance levels the relationship between effort and F is direct. A doubling of effort translates into a doubling. of the fishing mortality rate. At very low or very high stock sizes (when the stock is either hard to locate or unavoidable), the relation between effort and F may change.
Management of fish populations through a combination of direct and indirect control measures determines the overall fishing mortality rate, and ultimately the balance between births and deaths, resulting in an increasing, decreasing, or stable stock.
Nominal catch: The sum of catches that have beenreportedas live weight or equivalent of the landings. Nominal catches do not include unreported discards or unidentified young fish put into fish meal. Remember these are not catches but landings.
Quota: A portion of a total allowable catch (T AC) allocated to an operating unit, such as a size class of vessels or a country.
Recruitment: The amount of fish added to the fishery each year due to growth and/or migration into the fishing area. For example, the num-tive: M + F = Z (where Z is the total
instantaneous mortality rate). One feature of using the instantaneous rL
fishing mortality rate, is that multiplying F by the average population
ber of fish that grow to become vulnerable to the fishing gear in one' year would be the recruitment to the fishable population that year. This term is also used in referring to the number of fish from a year class reaching a certain age. For example, all fish reaching their second year would be age 2 recruits.
size during the year (N) gives the fishery catch. For example, suppose the instantaneous natural mortality rate (M) is 0.2, and F = 0.6. Total instantaneous mortality is 0.8; the annual mortality rate is 55 percent. If, at the beginning of the year there are 1,000 fish, the average popula-tion size during the year is calculated as: (1,000 X 0.55)-0.8 = 688 fish. Multiplying the average population size by F gives the annual catch (688 X 0.6 = 413 fish).
The fishing mortality rate (F) on each age group of the stock is determined by two factors: (1) the pro-
. portion of that age group that is big enough to be captured by the gear (usually termed the "partial recruitment" of each age), and (2) the overall amount of fishing effort on the
Recruitment overf"lShing: The rate of fishing above which the recruitment to the exploitable stock becomes significantly reduced. This is characterized by a greatly reduced spawning stock, a decreasing proportion of older fish in the catch, and generally very low recruitment year after year.
Spawning stock biomass (SSB): The total weight of all sexually mature fish in the population. This quantity depends on year clasS abundance, the exploitation pattern, the rate of growth, bothflShing andnaturalmortality rates, the onset of sexual matu-

PageS
rity and environmental conditions. Spawning stock biomass-per-recruit
(SSB/R): The expected lifetime contribution to the spawning stock biomass for a recruit of a specific age (e.g., per age 2 individual), such as the spawning stock biomass divided by the number of fish recruited to age 2. For a given exploitation pattern, rate of growth, and natural mortality, an equilibrium value of SSB/ R is calculated for each level of F. 11tis means that under constant conditions of growth, natural mortality, and exploitation patterns over the life span of the species, an expected average SSB/R would result from each constant rate of fishing. A useful reference point is the level of SSB/R that would be obtained if there were no fishing. This is a: maximum value for SSB/R, and levels of SSB/Runder different rates of fishing can be compared to it. For example, the maximum SSB/R for Georges Bank haddock is approximately 9 kg for a recruit at age.
Status of exploitation: An appraisal of exploitation is given for each stock of the species discussed in Species Synopsis section using the terms unknown, protected, not exploited, underexploited, moderatelyexploited, fully exploited, and overexploited. These terms describe the effect of current fishing effort on each stock, and represent the assessment scientists' educated opinion based on current data and the know ledge of the stocks over time.
Sustainable yield: The number or weight of fish in a stock that can be taken by fishing without reducing the stock's biomass from year to year, assuming that environmental
. conditions remain the same. TAC: Total allowable catch is the
total regulated catch from a stock in a given time period, usually a year.
Vessel class: Commercial fishing vessels are classified according to their gross registered tons (grt). of displacement. Vessels displacing less than 5 tons are not routinely monitored, and are referred to as undertonnage. Larger vessels are classified as follows:
Vessel Class 2 3 4
GRT 5 - 50
51 - 150 151-500
Virtual popUlation analysis (or cohort analysis): An analysis of the catches from a gi ven year class over its life in the fishery. If 10 fish from the 1968 year class were caught each year for 10 successive years from 1970to 1979 (age 2 to age 11), then 100 fish would have been caught from the ·1968 year class during its life in the fishery. Since 10 fish were caught during 1979, then 10 fish must have been alive at the beginning of that year. At the beginning of 1978, there must have been at least 20 fish alive because 10 were caught in 1978 and 10 more were caught in 1979. By working backward year by year, one can be virtually certain that at least 100 fish were alive at the beginning of 1970. A virtual population analysis goes a step further and calculates the number of fish that must have been alive· if some fish also died from causes other than fishing. For example, if the instantaneous natural mortality rate was known in addition to the 10 fish caught per year in the fishery, then a virtual population analysis calculates the number that must have been alive each year to produce a ca tch of 10 fish each year in addi tion to those that died from natural causes. If one knows the fishing mortality rate during the last year for which catch data are available (in this case 1979), then the exact abundance of the year class can be determined in each and every year if the catches are known with certainty. If the fishery removes a large proportion of the stock each year so that the population declines rapidly over time, then an approximate fishing mortality rate can be used in the last year (1979), and by calculating backward year by year for the year class, a precise estimate of the abundance can be determined for the previous three or four years (1976 or 1975). Accuracy depends on the rate of popula-
. tion decline and the correctness of the starting value of the fishing mor-
tality rate (in the most recent year). This teclutique is used extensively in fishery assessments since the conditions for its use are so common: many fisheries are hea vily exploited, the annual catches for a year class can be easily determined, and the natural mortality rate is known within a fairly small range and is low compared with the fishing mortality rate.
Year class (or cohort): Fish in a stock born in the same year. For example, the 1987 year class of cod includes all cod born in 1987, which would be age 1 in 1988. Occasionally a stock produces a very small or very large year class and this group of· fish is followed closely by assessment scientists since it can be pivotal in determining the stock abundance in later years.
Yield-per-recruit analysis: The expected lifetime yield-per-fish of a specific age (e.g., per age 2 individual). For a given exploitation pattern, rate of growth, and natural mortality, an equilibrium value. of Y/R is calculated for each level ofF. Thismeansthatunderconstantcon~
di tions of growth, natural mortali ty , and exploitation patterns over the life span of the species, an expected average Y /R would result from each constant rate of fishing.

Page 9
FISHERY LANDINGS
Recreational and commercial fishing for marine and estuarine fish stocks off the northeastern United States results in landings that are a significant· portion of total U.S. landings. U.S. commercial landings in 1991 are estimated to be more than 4.3 million mt, of which approximately 18 percent were from the Northeast region. U.S. recreational landings are estimated to exceed 106,000 mt (excluding Alaska, Hawaii, and Pacific Coast salmon). Aggregate statistics for U. S. fisheries are detailed in Fisheries o/the United States, 1991.
Fishery statistics are collected in the northeastern United States through an integrated system of reporting by commercial fishennen and sampling surveys of recreational fishermen. The reports by commercial fishennen are generally tenned "weighout slips", and these are collected by employees of state agencies as well as the National Marine Fisheries Service. Recreational fishennen are surveyed both as they complete fishing trips and through telephone calls to households. While these numbers are not without statistical errors and some biases, they reveal roughly how much is landed and certainly reveal trends in fishing activity and catches.
The landings of domestic commercial and recreational fisheries, and foreign and joint venture fisheries, for the 38 species described in this document totaled 511,000 mt in 1991, a decrease of3 percent from 1990 (Table 2). Of these landings, 18 percent were
'from foreign, 74 percent from domes-tic commercial, and 8 percent from
Landing haddock, Boston Fish Pier, 1960s.
NMFS photo by Bob Brigham
TRENDS

Page 10
domestic recreational fishing. For- Table 2. Total landings of selected assessment species groups off the northeastern United eign commercial landings increased 4 States, domestic and foreign commercial fishing, and for recreational fishing 1990
percent, while domestic commercial and 1991 (1,000 mt)
and recreational landings decreased 4 Species Commercial Recreational Total
percent and 1 percent. Foreign US. The landings trends for six groups 1990 1991 1990 1991 1990 1991 1990 1991
of species contributing to northeast fisheries are as follows: Principal Groundnsh
The most important group in terms Allanticcod 14.3 13.4 43.4 42.0 5.5 3.8 63.2 59.2 Haddock 3.3 5.5 2.5 1.8 <0.1 <0.1 5.8 7.3
of weight is traditionally the principal Redfish <0.1 <0.1 0.6 0.5 0.0 0.0 0.6 0.5
groundfish (Atlantic cod, haddock, Silver hake 0.0 0.0 20.2 16.6 <0.1 <0.1 20.2 16.6
redfish, silver hake, red hake, and pol- Red bake 0.0 0.0 1.6 1.6 <0.1 0.2 1.6 1.8 Pollock 37.5 39.4 9.5 7.9 0.1 0.1 47.1 47.4
lock) accounting for 26 percent of the Subtotal 55.1 58.3 77~ 70.4 5.6 4.1 138.5 132~ landings in 1990 and 1991. The inver-tebrates (short- and long-finned squid, Flounders
American lobster, Northern shrimp, Yellowtail flounder 0.0 0.0 14.1 7.5 0.0 0.0 14.1 7.5 Summer flounder 0.0 0.0 4.2 6.2 2.4 3.6 6.6 9.8
surfclams, ocean quahogs, sea scal- American plai~ <0.1 <0.1 2.5 4.3 0.0 2.5 4.3 lops) accounted for 27 percent of the Witch flounder <0.1 <0.1 1.4 1.8 0.0 0.0 1.4 1.8 landings in 1991, up from 26 percent in Winterflounder <0.1 0.1 6.6 7.5 0.4 1.1 7.0 8.7'
1990. Principal pelagic species (At- Windowpane 0.0 0.0 1.9 3.7 0.0 0.0 1.9 3.7
lantic herring, Atlantic mackerel) de-Subtotal <0.1 0.1 30.7 31.0 2.8 4.7 33.5 35.8
creased in percentage from 23 to 21 Other Groundnsh between 1990 and 1991. Goosefish 1.6 1.0 10.6 12.8 <0.1 <0.1 12.2 13.9
The fourth highest landings were Scup 0.0 0.0 4.2 6.7 1.9 3.7 6.1 10.4 Black sea bass 0.0 0.0 1.5 1.1 1.3 0.9 2.8 2.0
from the other groundfish (goosefish, Ocean pout 0.0 0.0 1.3 1.4 0.0 0.0 1.3 1.4 SCUp, black sea bass, ocean pout, white White hake 0.5 0.6 5.0 5.6 <0.1 <0.1 5.5 6.2 hake, cusk, Atlantic wolffish, tilefish, Cusk 0.5 0.6 1.2 1.5 <0.1 <0.1 1.7 2.1
spiny dogfish, Skates), which ac- Allantic wolffish 0.1 <0.1 0.4 0.5 <0.1 <0.1 0.5 0.5
counted for 11 percent of the landings Tilefish <0.1 . 0.0 0.9 1.2 <0.1 <0.1 0.9 1.2 Spiny dogfish 0.0 0.0 14.3 11.5 0.0 0.0 14.3 11.5
in 1990 and 12 percent in 1991. Skates 0.0 0.0 11.3 11.2 0.0 0.0 11.3 11.2 Next in importance by weight are Subtotal 2.7 2.2 SO.7 53.5 3.2 4.7 56.6 60.4
flounders, accounting for 7 percent of Principal Pelaglcs
the total in 1990, and other pelagics, Allantic herring <0.1 0.0 62.2 54.3 0.0 0.0 62.2 54.3 also accounting for 7 percent. Allanticmackerel 27.3 27.5 31.3 25.7 2.0 2.0 60.6 55.2
Total 1991 foreign vessel land- Subtotal 27.3 27.5 93.5 80.0 2.0 2.0 122~ 109.5
ings of species and stocks oCcurring in Other Pelagics
U.s. waters was 94,000 mt, up 4 per- Atlantic butterfish <0.1 0.0 2.4 2.2 0.0 0.0 2.4 2.2 cent from 1991. This includes for ex- Bluefish 0.0 0.0 6.3 6.0 24.2 21.6 30.5 27.6 ample, catches of transboundary mi- River herring <0.1 0.0 1.4 0.6 0.0 0.0 1.4 0.6
gratory pollock and mackerel stocks American shad 0.0 0.0 1.0 1.0 0.0 0.0 1.0 1.0
by Canadian fishermen. It also in-Striped bass 0.0 0.0 0.4 0.5 1.2 1.6 1.6 2.1 Subtotal <0.1 0.0 11.5 10.3 25.4 23.2 36.9 33.5
cludes catches of cod, haddock, and scallops from the Georges Bank stocks, Invertebrates which occur on the Canadian portion Shon·finnedsquid 0.0 0.0 11.7 11.9 0.0 0.0 11.7 11.9
of that fishing ground. Long.finnedsquid 0.0 0.0 15.5 19.4 0.0 0.0 15.5 19.4 American lobster 0.0 0.0 27.7 28.9 0.0 0.0 27.7 28.9 Nonhemshrimp 0.0 0.0 4.4 3.4 0;0 0.0 4.4 3.4 Surfclams 0.0 0.0 32.6 30.0 0.0 0.0 32.6 30.0
For more information Ocean quahog 0.0 0.0 21.2 22.3 0.0 0.0 21.2 22.3 Sea scallop 5.2 5.9 17.4 16.9 0.0 0.0 22.6 22.8 Subtotal 5.3 5.9 130.5 132.8 0.0 0.0 135~ 138.7
NMFS, 1992. Fisheries of the United States, 1991. Current Fishery Sta- Total 90.4 94.0 394.7 378.0 39.0 38.7 524.1 510.7 tisties No.9100. Available from: Superintendent of Documents, U.S. Government Printing Office, Wash. D.C.

Page 11
AGGREGATE RESOURCE TRENDS
The fishery resources off the northeastern United States are harvested by a variety of fishing gears, including trawls, gill nets, traps, longlines, and dredges. While each type of gear takes a different mixture of species, few fishermen target exclusively one species. The degree of mixture in the catches varies among the types of gear used in different areas. In addition, there are predatory and competitive relations among many of the fishery resources.
These relationships result in significant interactions among gear types, termed technical interactions, and among some species, termed biological interactions. Management of fishing activity in the northeast region is a complex problem because of these two types of interactions. This complexity is reflected, for example, in the structure of some of the fishery management plans (FMPs). The ground fish resources off New England are managed under the Multispecies FMP. Several pelagic fisheries in the southern portion of the region are managed in one plan, the Squid, Mackerel, and Butterfish FMP, and a new FMP is being developed to include summer flounder, black sea bass and scup.
While much of the stock assessment advice used to manage these fisheries requires knowledge of the dynamics of individual populations of each species, there is an increasing recognition of the need to consider fishery resource abundance information on a more aggregated level to fully understand the dynamics of the fisheries as a whole. In this section, trends
Dogfish and skate continue to dominate Georges Bank finfish biomass, accounting for approximately 75 precent of the catch, by weight. Although dogfish are plentiful on the Bank, their fecundity is relatively low and stocks in other parts of the world have been reduced quickly when fished intensively.
NMFS photo by Brenda Figuerldo

Page 12
are presented for several of the fishery resources in aggregate fonn to illustrate major changes in the fishery ecosystems off the northeastern United States.
Two sources of data are available for measuring the trends in aggregate resource abundance: (1) research vessel trawl survey data, and (2) commercial trawl catch and effort Gata. While neither data source completely reflects the changes in all fishery resources, both provide infonnation that is useful in interpreting changes in fishery resources and fishing activity in recent years.
RESEARCH VESSEL TRAWL SURVEY DATA
The Northeast Fisheries Science Center has conducted an intensive bottom trawl survey program off the northeastern United States for more than 25 years. An autumn survey has been conducted annually since 1963; a spring survey was initiated in 1968, and summer and winter surveys have been conducted intennittently. These surveys have employed standard gear and sampling procedures following a stratified random sampling design and thus provide a valuable time series of data for monitoring resource trends. Since bottom-tending gear is used, the data are most appropriate for demersal species, although reliable indices of abundance have been developed for some pelagic species as well. Four groups of species are considered:
1. Principal groundflSh and flounders, including demersal species such as Atlantic cod, haddock and yellowtail flounder, that have supported historically important trawl fisheries.
2. Other finflSh, including a variety of demersal and pelagic species that collectively are of considerable economic importance.
3. Principal pelagics (Atlantic herring and Atlantic mackerel).
4. Skates and spiny dogfish, which have been of minor commercial importance but are now a major component of the total finfish biomass.
For each of these groups, an aggregate index of abundance has been developed to monitor resource trends. Autumn survey data (stratified mean catch-per-tow, kg) were used for principal groundfish and flounders and for other finfish, while spring survey data
. were used for principal pelagics and for skates and spiny dogfish. For each group of species an aggregate index of abundance has been computed as the sum of the individual stratified mean catch-per-tow values, smoothed to compensate for between-year variability using a first order autoregressive model. No adjustments have been made for differences in the vulnerability of each· species to the trawl gear, so the overall index in each case tends to reflect trends in abundance of those species within each group that are most vulnerable. However, vulnerability to the gear is not thought to change markedly over time, so the aggregate indices derived from these data appear to provide a useful general index of overall resource trends, although they are weighted toward certain species.
SUMMARY OF TRENDS
Principal Groundfish and Flounders
This group includes important gadoid species (Atlantic cod, haddock, redfish, silver and red hake, and pollock) and several flatfish (yellowtail flounder, summer and winter flounder, American plaice, witch flounder and windowpane). The combined index for this group declined by almost 70 percent between 1963 and 1974, reflecting substantial increases in exploitation associated with the advent of distant-water fleets (Figure 4). Pronounced declines in abundance occurred for many stocks in this group, notably Georges Bank haddock, most
silver and red hake stocks, and most flatfish stocks. By 1974, indices of abundance for many of these species had dropped to the lowest levels observed in the history of the survey time series.
Partial resource recovery occurred during the mid- to late- 1970s. This has been attributed to reduced fishing effort associated with increasingly restrictive management under the International Commission for the Northwest Atlantic Fisheries (ICNAF) during the early 1970s and implementation of the Magnuson Fishery ConservationandManagement Act (MFCMA)in 1977. Cod and haddock abundance increased markedly; stock biomass of pollock increased more or less continually, and recruitment and abundance also increased for several flatfish stocks. The aggregate index peaked in 1978. Subsequently, the combined index again declined; 1987 and 1988 values were the lowest in the time series. The index increased somewhat during 1989-1990, reflecting improved recruitment (primarily for cod, redfish, silver and red hake, and American plaice). The index dropped sharply in 1991, reflecting reduced survey catches for all of these species.
Other Finfish
This group includes a number of demersal and pelagic species that are taken in directed fisheries or are important in mixed-fishery situations. The combined index for this group (Figure . 4) includes data for 10 demersal species (white hake, cusk, croaker, black sea bass, scup, weakfish, spot, wolffish, ocean pout, and goosefish) and five pelagic species (alewife, blueback, shad, butterfish, and bluefish). Landings for many of these species have been small, although their combined contribution to U.S. commercial and recreational harvests has been significant.
The aggregate index for this group was relatively stable from 1963 to 1970 and then increased to peak levels from 1977 to 1980, reflecting unusually high survey catches of Atlantic croaker and

spot "and strong recruitment of butterfish" from the 1979 and 1980 year classes. Survey catches of a number of demersal species were anomalously low in 1982 for unknown reasons. Strong 1983 and 1984 butterfish year classes contributed to the 1985 peak. The index has since declined more or less continually.
Principal Pelagics
Abundance of Atlantic herring and Atlantic mackerel has been monitored using spring survey data. In general, survey catch-per-tow data for these species have been more variable than those collected for principal groundfish and flounders, although the aggregate index is adequate to depict overall trends. This index declined to minimal levels in the mid-1970s, reflecting pronounced declines in abundance for both herring and mackerel (including the collapse of the Georges Bank herring stock). This was followed by a pronounced increase to high levels for 1987-1990, reflecting high levels of abundance for both species (Figure 4). This trend is corroborated by virtual population analysis or (VPA) of commercial catch-at-age data indicate recovery of both the Gulf of Maine herring stock and the Northwest Atlantic mackerel stock. There is also evidence for some degree of recovery of the Georges Bank herring stock. The 1991 index value was the highest in the time series.
Skates and Spiny Dogfish
The remaining aggregate index includes data for two important resource components, spiny dogfish and skates, which are effectively monitored using spring survey data (Figure 4). Spiny dogfish and seven skate species are included in this index: little, winter, thorny, smooth-tailed, leopard, briar, and barndoor. The continued increase in this index since the late 1960s reflects major changes in rela-
Page 13
80
60 PRINCIPAL GROUNDFISH AND FLOUNDERS
40
20
0
20 OTHER FINFISH Vl w U 15 0 Z
10 3: 0 t- 5 ~ I (J 0 GJ 3: 5 Z
PRINCIPAL PELAGICS <l:
4 w ~
0 w 3 t-t- 2 ~
SKATES AND SPINY DOGFISH 120
80
40
O+-~--'-~--'-~--~~r--r--~-r--~-r--~~~ 62 64 66 68 70 72 74 76 7B BO 82 84 86 88 90 92
YEAR
Figure 4. Trends in indices of aggregate abundance (catch in weight-per-survey-trawlhaul) forfour species groups, reflecting the major changes in fishery resources, 1962-1990.
tive abundance within the finfish species complex, with increasing abundance of species with low commercial value. These increases in dogfish and skate abundance, in conjunction with declining abundance of groundfish and flounders, have resulted in the proportion of dogfish and skates in Georges Bank survey catches increasing from roughly 25 percent by weight in 1963 to nearly 75 percent in recent years.
COMMERCIAL TRAWL CATCH AND EFFORT
DATA
Commercial trawl landings and effort data have been consistently collected by NEFSC using dockside interviews and weigh-out reports since implementation of the MFCMA. Because of the mixed-species nature of

Page 14
this fishery throughout most of the region, there is a complex relationship between the amount of fishing effort and the landings of individual species or stocks. While simple indices based on total landings and effort will not directly reflect the abundance of any one species, such indices do provide useful measures of aggregate abundance that appear to reflect general overall trends, although increases in the efficiency of fishermen over time generally results in underestimates of the magnitude of change.
Indices of multispecies CPUE were derived by aggregating trawl landings and effort data for three major fishery assessment areas:
1. Gulf of Maine (GM) 2. Georges Bank (GB) 3. Northern Mid-Atlantic Bight
(NMA; comprising the area from Cape Cod through New Jersey)
Nominal fishing effort was standardized to account for variability in the size composition of trawl vessel fleets in the three regions, and the changes in fleet compositions over time. Data collected prior to 1976 were not included because of the problems of standardizing foreign fishing effort, and because complete trawl fishing effort data were not available for the more southern ports. Fishing effort was standardized to the performance of a class 3 trawler fishing on Georges Bank. Appropriate weighing coefficients for smaller- and larger-sized vessels -were then applied to derive single estimates of total standardized fishing effort by sub-area.
Total landings of all finfish and invertebrate species caught by trawlers were aggregated over all vessel size classes over all areas (Figure 5). These landings peaked in 1983 at 186,000 mt, and declined steadily to 112,000 mt in 1987 and 1988, a decrease of 40 percent. Otter trawl landings in 1991 decreased to 127,300 mt (1 percent lower than 1990) primarily due to decreased landings of yellowtail flounder, whiting, and pollock. Nominal fishing effort in terms of number of
240 ,..--,..
(f)
0 LANDINGS 0 200 0 '--"' (/)
Z 160 0 I-
U a: 120 I-w 2
80 ,,-...
(f)
0 0 50 EFFORT 0 '--"'
0 W 40 I V1 c;: (/) 30
~ 0
20
4 u... 0
~ 2
2 CPUE
o , 75 77 79 81 83 85 87 89 91
YEAR
Figure 5. Total trawl catch (mt, all ages), standardized trawl fishing effort (DF, days fished), and catch divided by effort (CPUE, mt/DF) since the introduction of MFCMA in 1977, reflecting major changes in trawl fishing activity and aggregate resource abundance.
days fished (Figure 5) nearly doubled from roughly 25,000 standard days in the 1976-1978periodtoroughly48,000 in 1985. Subsequently, effort declined slightly, and has remained relatively constant since 1986. Total trawl effort increased 5 percent (to 46,700 days fished) from 1990 to 1991.
The total increase in the effect of fishing has been greater than indicated by these increases in days fished, however, because the fishing power of individual vessels has increased as vessels have become larger, with more powerful engines, larger nets, and more sophisticated electronic equipment.
The total landings (mt) divided by the total standardized effort (days fished, DF) for all three regions com-
bined is acatch-per-unit-effort (CPUE) index reflecting the major changes in aggregate species abundance (Figure 5). This index rose from 4.2 in 1976, he1droughIy steady from 1977to 1980, but has since declined steadily and dramatically by about 50 percent t02.5
-in 1987. The 1990 index decreased 7 percent (to 2.7 mtjdf, reflecting decline of several groundfish stocks. The changes in this CPUE index are similar to those observed in the research trawl data for principal groundfish and flounders, with an initial rise and subsequently a major decline. The trend in this CPUE index is markedly different from the research trawl data for pelagic species and for other finfish, as might be expected given the nature of

100 ~
I-/'-~ ....--.-~ .
80 ,
~ (fl / 0 0 60 /. 0 ""--"
til , .... <...? 40
"" Z --0 ,/ 20 -Z ..,
<l: ....J
0
c-o (fl
, ,-.... ---. -~ GEORGES .-/ '-- ~ BANK ______ ~
20 o o -3
~~ GULF OF -- MAINE ---
I-0::
2 u... w
10
6
" .",.,..- ...... ----' -"/
-
\
- - -N. MIDDLE ATLANTIC
- ..... , w :::J 0.... U
I ~_~ ___
/ .-....,.. -.......... .-
"""'-..~.--.,..... 3
o+---~~~~--r-~'-~-r~-'--~'-~'-~ 75 77 79 81 83 85 87 89 91
YEAR
Figure 6. Total trawl catch (rot), standardized fishing effort (DF, days fished), and catch divided by effort (CPUE, rotjDF) since 1976, for three regions, reflecting changes in trawl fishing activity and aggregate resource abundance.
the trawl fishery. This CPUE index may, however, underestimate the actual declines in abundance of demersal species because of increasing fleet efficiency. Also, this index includes species not included in the principal groundfish trawl index species that have remained at relatively high stock sizes, such as butterflsh and mackerel.
The same general trends in catch, effort, and CPUE are apparent in the data when treated separately for the three assessment regions (Figure 6). During the period'1976-1987, nominal effort increased 100 percent in the Gulf of Maine, 58 percent on Georges Bank, and 63 percent in the northern Mid-Atlantic. Total effort in the Gulf of Maine area declined from a peak of
14,600 days fished in 1987 to 10,900 days fished in 1989 (-25 percent), reflecting declines in CPUE of 19 percent and landings of 41 percent. Landings and CPUE declined 2 percent and 14 percent respectively in the Gulf of Maine, while fishing effort rose 13 percent. Georges Bankeffort remained relatively stable since 1988 (decreasing 5 percent from 1990 to 1991). Landings and CPUE on Georges Bank decreased 11 and 5 percent, respectively in 1991, primarily because of lower landings of cod and yellowtail flounder. Landings and effort in the northern Mid-Atlantic increased from 1990 to 1991 (17 and 33 percent respectively), although CPUEdecreased 11 percent.
Page 15
During the period covered in these analyses, the species composition of landings changed dramatically for most vessel size classes and areas. In the Gulf of Maine, landings of pollock, redfish, and flounders have declined. Currently, cod., silver hake, and American plaice predominate in the landings. On Georges Bank, haddock and yellowtail flounder stocks have declined and are a small fraction of overall catches, which are primarily cod, winter flounder, and windowpane flounder. In the northern Mid-Atlantic Bight, catches are generally highly mixed, but several trends are notable. Winter and summer flounder catches have declined relative to other species such as Lo/igo squid, butterflsh, and silver hake. Yellowtail flounder catches decreased in the area in 1991 because of the reduced abundance of the 1987 year class.
CONCLUSIONS ABOUT RESOURCE ABUNDANCE
Both the research trawl data and the aggregate trawl fishery data suggest major changes in the abundance of resources in the Northeast Atlantic, especially since the implementation of the MFCMA in 1976. Increases in abundance of groundfish and flounders associated with the reduction of foreign fishery effort during the mid-1970s were followed by increases in domestic fishing effort and landings. Abundance of groundfish and flounders started declining after 1978, and currently are at historically low levels. Abundance of other finfish has fluctuated widely, while that of the principal pelagics has increased steadily in recent years. More recently, the Georges Bank herring stock appears to be recovering. Trawl fishing effort increased steadily through 1985, and remains at near-record high levels. Total trawl catches increased until 1983, and have subsequently declined to levels comparable to those seen in 1976, despite the great increase in fishing effort. Trawl catches reached a time-series low in 1989, improved. somewhat in 1990, and declined in

Page 16
1991. These major changes in the fisheries have included extensive changes in the species composition of the catches, with shifts to previously less desirable species. At the same time, major increases in the abundance of nontarget species such as spiny dogfish and skates, has occurred.
It appears that most of the changes in resource abundance described above are directly related to changes in fishing mortality. For example, increases in abundance of groundfish and flounder occurred from 1975 to 1978 when fishing effort was being reduced by international and domestic management actions. Subsequently, decreases in abundance began in the early 1980s while fishing effort continued increasing. Fishing intensity appears to have been the principal cause of changes in resource abundance for these species. Decreases in fishing activity allowed more fish to survive and grow in the late 1970s, indicating the intensity of and significance of fishing on resource abundance. Record increases in fishing effort through the 1980s have reduced several new year classes before they were able to achieve full growth and reproduce. Continued high fishing effort sustains this pattern, with populations of several species being dominated by only one or two age groups.
Factors other than fishing effort may have played a role in these changes, as, for example, in years when exceptionally strong or weak recruitment occurred for some species. However, there is little evidence of long-tenn climatic changes that might have affected the recruitment of several species simultaneously as would be necessary to cause declines in abundance of the magnitude apparent in these data. Similarly, there is little suggestion that environmental contamination has played a significant role in these changes in resource abundance because comparable decreases have been seen in all three regions even though pollution levels vary greatly. Moreover, the effects of pollution are limited to nearshore regions, while fish abundance has declined in all areas.
Increased fishing effort in the three
regions has resulted in elevated fishing mortality (exploitation) rates on the target species. Up to 70 percent of some harvestable stocks are removed by fishing each year. The high rates of population removal can result in two effects:
1. Catching young, fast-growing fish, which may result in decreased aggregate yield-in-weight from a particular group of recruits; and
2. Reducing the total level of adult biomass to a point that too few young fish result from each years spawning
The elevated levels of fishing mortality clearly have resulted in the first problem. Total catch has been less than what is possible because exploitation rates for many species are far in excess of the levels that result in maximum yield-per-recruited fish. Recent analyses of the relationship between the production of young fish and adult spawning biomass suggest that the second problem is also occurring. Present fishing mortality rates do not allow sufficient young fish to be produced to maintain their populations at even their current low abundance levels.
While the causes of the changes in resource abundance shown by the indices of aggregate abundance described here are not completely understood, it appears that fishing is probably the major cause. Climatic or environmental changes of sufficient magnitUde to cause simultaneous changes in all of these stocks are not apparent. The amount of fishing has increased markedly, exceeding levels producing maximum catch-per-recruit, and for several species exceeds those levels that allow recruitment sufficient to maintain spawning stock size. While further research is needed, especially in terms of the possible effects of environmental or climatic changes, the changes that have occurred following a decline in fishing in the mid-1970s and a subsequent doubling in the amount of
. fishing, are consistent with similar changes that were clearly Seen when
fishing effort in the North Sea declined during and then increased after W orId Wars I and II. The message that was clear then is no less clear today; reduced fishing will result in an increased abundance of fishery resources.
For further information
NEFC. 1987. Status of mixed demersal finfish resources in New England and scientific basis for management. NEFC Laboratory Reference Document 87-08. Available from: NOAA/NMFS Northeast Fisheries Science Center, Woods Hole, MA 02543.
NEFMC. 1988. Anassessmentofthe effectiveness of the Northeast Multispecies Fishery Management Plan with recommendations for plan and management system improvements. Saugus, MA: New England Fishery Management Council. Available from: New England Fishery Management Council, Suntaug Office Park, 5 Broadway (Rte. 1), Saugus, MA 01906.
NEFSC. 1992. Report of the 13th Northeast Regional Stock Assessment Workshop (13th SAW). NEFSC Reference Document92-02. Available from: NOAA/NMFS Northeast Fisheries Science Center, Woods Hole, MA 02543.
NEFSC. 1992. Report of the 14th Northeast Regional Stock Assessment Workshop (14th SAW). NEFSC Reference Document 92-
. 07. Available from: NOAA/NMFS, Northeast Fisheries Science Center, Woods Hole, MA 02543.

1.
Page 17
FISHERY ECONOMIC
REGIONAL SUMMARY
The Northeast's commercial oceanic and estuarine fisheries produced domestic landings worth $891 million dockside in 1991 (preliminary figure), an increase of $23 million, or 3 percent over final 1990 figures. Total landings were down negligibly to 748,000 mt (preliminary). Finfish landings brought in $321 million, representing 36 percent of the revenue generated in the region. Shellfish landings were 213,000 mt, an increase of 6 percent over 1990 levels .. These figures are preliminary and subject to minor change as late or corrected information is received from the ports.
Important species of fish and shellfish landed or raised in the Northeast region are shown in Table 3 along with their prices, weight and value for the last six years. This table ranks species by value and includes those covered by management plans. Landings of finfish, lobster, shrimp, and crab are given in live weight; landings of all other shellfish are expressed in meat weight. The most important species, ranked in terms of ex-vessel value, are lobster, sea scallops, cod, hard clams, blue crab, oysters, menhaden, Atlantic salmon,andsurfclams. Five of the six most important species, in terms of value, are shellfish, and five of the top seven are harvested predominantly inshore (0 to 3 miles).
There are noteworthy trends in the prices and landings of the species shown in Table 3. Relatively few species accounted for a large part of the value of landings in the Northeast, with the top 10 generating 84 percent of the landings value. The change in
TRENDS
NMFS photo by Greg Power
NMFS photo by Brenda Flguer1do
Above, New Bedford harbor, consistently among
the nation's top-grossing commercial fish ports.
Left, witch flounder on the floor of the Port/and, Maine
fish auction.

, ;,
Page 18
Table 3. Northeast landings (L) (I,OOOmt), values ($ million) and prices ($/lb) of important species, 1986-1991 (preliminary data, 1991). Some aquaculture species are included.
Year L Value Price L Value Price L Value Price L Value Price L Value Price
I.&h5l~[ Sea scallol!!! Cod Hard clam Blue crab 1986 20.8 120.1 2.62 8.3 91.0 4.97 27.6 36.0 0.59 4.7 40.6 3.92 42.9 34.3 0.36 1987 20.8 142.1 3.10 13.2 123.4 4.23 26.8 44.2 0.75 5.0 50.3 4.59 38.9 37.6 0.44 1988 22.2 146.4 2.99 13.0 121.9 4.24 34.6 43.0 0.56 6.8 48.7 3.25 41.8 40.6 0.44 1989 24.0 148.9 2.82 14.4 126.6 3.98 35.6 47.8 0.61 4.2 SO.6 5.48 45.6 42.0 0.42 1990 21.6 151.0 2.48 17.2 141.4 3.88 43.6 61.4 0.64 4.6 46.9 4.63 43.9 43.2 0.45 1991 28.7 165.0 2.61 17.0 ' 151.9 4.05 41.8 73.1 0.80 4,4 44.8 4.61 48.1 41.0 0,39
Oyster meats Menhaden Atlantic salmon Surfclam ~uid (LoUgoJ 1986 6.8 37.8 2.51 222.6 24.3 0,05 0,0 0,0 0,00 35.4 42,2 0.54 11,5 9.0 0.35 1987 4.3 29.5 3,11 300.0 32.5 0,05 0,0 0,0 0,00 27.4 27,9 0.46 10.5 9.3 0.40 1988 3.1 26.2 3.81 273,5 29,7 0.05 0.0 0.0 0.00 28.6 28,9 0.46 18.9 15,4 0,37 1989 2,4 22.3 4.16 287.8 31.3 0,05 0,0 0,0 0.00 30.4 30,7 0.46 23,0 21.8 0,43 1990 3,3 40,1 5.54 336.1 37,2 0,05 2,1 16,1 3.50 32.6 32.4 0.45 15.0 14.0 0.43 1991 3,6 38,8 4.86 294,8 33.2 0,05 4.7 30.0 2,89 30,0 29,2 0,44 19,4 22.7 0.53
Gooselish Ocean guahog Winter flounder Yellowtail flounder Bluelin tuna 1986 6.7 6,9 0.47 20,6 15,7 0.35 8,0 17.6 1.00 10.4 21.0 0.92 0.9 15,2 7.92 1987 6.9 9,8 0.64 22,8 16.6 0.33 9,0 24.1 1.21 7.6 20.1 1.20 1.0 11.9 5.54 1988 7,6 10.4 0,62 21.0 14,9 0,32 8.4 22.4 1.20 5.0 13,2 1.19 0.8 11.3 6,61 1989 11,3 12,6 0.51 23.1 16.4 0.34 6,6 19.6 1.34 5.6 13.9 1.13 1.1 19,7 8.01 1990 10.1 13.1 0,59 21.2 16.3 0.35 7.0 17,1 1.11 14.4 28.1 0.89 1.0 ·21.2 9.26 1991 11.7 21.1 0.82 22,3 19.0 0.39 7.1 18.0 1.15 7,6 17,4 1.03 0.9 15,3 7.58
, Summer flounder Soil clam Swordfish Sea urchins Silver hake 1986 9.5 26.3 1.25 2,9 20.8 3,21 2,0 13,1 3.01 0.0 0.0 0,00 18,0 8.2 0.21 1987 9.9 32.0 1.46 3.4 19.2 2,58 2.1 16.0 3.39 0.7 0.2 0,16 15.7 11.6 0,33 1988 11.6 33.6 1.31 3,5 20.1 2,60 2.1 18,1 2,99 2,8 1.8 0,28 16.1 8.6 0.24 1989 6,2 22.2 1.63 2.9 19.4 ,2.98 2.7 17,2 2.92 4,3 3,6 0,38 17,8 9.4 0,24 1990 3,0 12,0 1.84 2.4 20.8 3.88 2,3 15,1 2,92 6.1 6,1 0.45 20,0 11.1 0,25 1991 4.6 14,8 1.45 1.9 14,8 3.51 1.8 12.0 3,00 9.3 11.2 0,54 16.1 ILl 0.31
Pollock. American ~laice Scu~ ~uid (IUexJ Northern shrime 1986 24.6 14.0 . , 0.26 6.1 12.4 0,92 6,7 8,3 0,56 4.4 1.5 0.15 4.7 6.5 0,63 1987 20,7 17,9 0,39 5,1 11.9 1.07 6.0 8,7 0,66 7.0 3,1 0,20 5.0 12,2 1.10 1988 15.0 11.0 0.33 4.7 10.5 1.01 5,6 8.1 0,66 2.0 0,6 0,]3 3,1 7,5 , 1.10 1989 10.5 9.9 0.43 3,5 8.8 1.14 3,5 6.1 0.18 6,8 3,2 0.22 3.6 7.8 0.98 1990 9.6 10.6 O,SO 2.5 5.6 1.03 4,2 6.4 0.68 11.3 6.5 '0.26 4.4 6,9 0.72 1991 7,8 9.8 0.57 4.3 8,9 0,94 6.3 7.3 .0,52 11.9 6.9 0.26 3,4 6,8 0.91
Atlantic herring Bigeye tuna Witch flounder White hake Atlantic m~ckerel 1986 32.0 3,8 0,05 0,6 4.4 3.43 5,2 12,9 1.14 6.4 4,8 0.34 4.0 1.1 0.13 1987 39.4 4.5 0.05 0.6 4,7 3.56 3,8 12.2 1.45 5,8 5.2 0.41 4,3 1.0 0,11 1988 40,9 5.2 0.06 0,5 4,0 3,95 3.6 11.6 1.46 4,8 3,2 0.31 6.4 1.9 0.13 1989 40.7 5.0 0.06 0.4 2.7 3,18 2.4 9.0 1.73 5,1 4.4 0.39 8.1 3,2 0,18 1990 51.3 5.1 0.05 0,4 3,9 4,03 1.5 5,8 1.78 4.9 4.3 0.39 9.9 3,6 0,16 1991 48,5 6,3 ' 0:06 0,7 6,2 3.93 1.8 6,1 1.57 5.6 5.4 0.44 16.5 5.4 0,15
Haddock Windowpane flounder Tilelish Yellowfm tuna Buttertlsh 1986 5,0 10.9 0.99 3,2 3.7 0.52 2,0 5,0 1.17 0,7 1.8 1.16 4,5 6,5 0.66 1987 3.0 8,5 1.28 2.3 3.1 0,61 3.2 7.9 1.11 0.9 2.6 1.25 4,6 6.4 0,63 1988 2.9 7.0 1.09 2,6 3,0 0.53 1.4 5.3 1.76 0.8 2.4 1.46 2.1 3.2 0.68 1989 1.7 4.5 1.19 2,6 3,1 0.55 0,5 2,0 1.81 0.5 1.6 1.33 3.0 3.9 0.60 1990 2,5 6.0 1.10 2,0 1.7 0,38 0.9 3.8 1.97 0.6 2,4 . 1.71 2.3 2.8 0.56 1991 1.8 4,6 1.13 3.7 4.4 0.54 1.2 4,2 1.61 1.0 3,1 1.39 2,1 2,7 0,59
Sea bass WeakfISh Mussels BluerlSb Stri~d bass 1986 1.6 3.5 0,99 2.7 2.7 0.45 2.9 2.5 0,39 4,6 1.8 0.18 0.1 0.2 1.06 1987 1.7 3.9 1.02 2.2 2.7 0,55 2,9 2,3 0,36 3,8 2.0 0.24 0.1 0.2 1.32 1988 1.3 3.2 1.08 2.2 2.3 0.48 3,9 2,9 0.33 4.3 1.8 0,19 0,1 0.4 1.39 1989 1.0 2.7 1.20 1.7 2,7 0.73 4.3 3.4 0,35 2.7 1.3 0,22 0,1 0.4 2.12 1990 1.3 3.0 1.06 1.4 2,2 0.69 3.9 2,9 0.34 3.6 2.1 0,26 0,3 . 1.0 1.48 1991 1.1 2.7 1.12 1.5 2.5 0,77 2,9 2,2 0.33 3,5, 1.1 0.22 0.3 1.0 1.60
Red hake Ocean~rch Ocean ~ut 1986 2.1 0.7 0.14 3.0 3,2 0.48 0.8 0.2 0,11 1987 2.0 0,9 0,20 1.9 2,7 0,64 2.2 0.5 0,10 1988 1.7 0,6 0,16 1.1 1.5 0,62 1.8 0,4 0.10 1989 1.6 0,6 0,17 0,6 0,9 0,66 1.3 0,3 0.10 1990 1.6 0.6 0.17 0.6 0,7 0.53 1.3 0,3 0.10 1991 1.6 0.8 0.22 0,5 0.5 0.46 1.4 0.3 0,10

landings in the past year has been mixed. About half of the species listed have experienced substantial declines in landings, while the remaining species have shown increases. The most valuable species in the Northeast continue to be lobsters, scallops, and cod. Lobsters, Atlantic salmon, cod, Loligo squid and monkfish landings accounted for the largest gains in total value (in absolute terms) in 1991, while Atlantic mackerel made the most significant gain in landings in 1991. The growth in magnitude of the sea urchin fishery is evident. Declining landings were seen by soft-shell c1ammers who had their smallest harvest in years. Yellowtail flounder landings and value were also strikingly low.
Although a rna jority of the region's vessels use a single gear, a significant number employ more than one gear type. 'f!1e most important gear types used, as measured by landings, are bottom otter trawls, surfclam dredges, and scallop dredges. These account for about 75 percent of the landings by weight. Otter trawls produce the most revenue and landings, followed by sea scallop dredges, clam dredges, hook gear, combined inshore and offshore lobster gear, and sink gill nets.
DATA COLLECTION CONSIDERATIONS
In the Northeast, NMFS collects infonnation on landings through a network of 32 federal and state port agents located at the busiest ports. The agents collect data several ways, principally by gathering wei ghou t sales receipts at the point of first sale. They also pay weekly and monthly visits to less busy ports to supplement the weighout collections made at major ports. Another part of the data collection process occurs when the fish are landed, and agents interview the vessel operators. These "interview records" contain the most reliable infonnation on trip variables such as gear type, fishing location, and effort. The percentage of trips interviewed varies considerably, depending on, among other things, port, size of vessel, and length of trip or trip
Page 19
Table 4. Pennits issued in the Northeast by gear, 1990-1991
1920 ]22]
Proposed Gear Use Number Number Number Number of Vessels of Boats of Vessels of Boats
Purse seines 40 6 Beach seines 4 1 Boat seines 15 4
Bottom trawls 1,597 84 Mid-water trawl 171 7 Other trawl 101 4
Dredges 1,277 78
Gill, entanglement net 438 109
Pots and traps 1,315 278
Handlines 788 671 Rod-and-reel 1,501 1,140 Longlines, set lines 423 91
Harpoons 62 24
Other gear 60 18 Diving gear 180 56
Pennits by gear 7,972 2,571 Pennitted craft 4,422 1,906
vessels boats
type. The non-interviewed trip records contain estimates based on those trips that were interviewed.
Additional data are collected by conducting a monthly or annual canvas to fill in gaps. All of the landings recorded are associated with the type of gear that produced them. However, the further removed the collection of infonnation is from the time and place of first sale, the more difficult it is to associate those landings with· a particular craft and the fishing· effort that produced them. ..
All vessels, those craft displacing more than 5 gross registered tons (grt), fiShing in the exclusi ve economic zone (EEZ) are required by law to be registered with the U.S. Coast Guard. The registration number must be clearly displayed so that vessels can be identified. In contrast,. boats, those craft displacing less than 5 grt, must have either a state registration number or a Coast Guard registration number displayed. In addition, all boats and vessels used to commercially exploit the
52 7 4 3
15 5
1,680 77 176 11 121 12
1,337 112
526 141
1,564 326
1,474 891 2,156 1,427
807 157
179 33
85 28 208 88
10,384 3,318 5,071 2,269
vessels boats
species managed under federal FMPs in the Northeast Region are required to apply annually for the appropriate fishery specific permits.
Table 4 shows the vessels and boats granted permits to fish certain gears in 1990 and 1991. Under the boat category, rod-and- reel permits continued to be dominant, although permits for handlines were also abundant. Both of these categories showed significant increases from the previous year. Although the largest category of permits among vessels was also for rod-and-reel, these are thought to be mainly for incidental catches of bluefin tuna. The second largest category of permits issued for vessels was bottom trawl gear, followed by pots and traps, handlines, dredges, and longlines. A surprising increase in the number of permits issued.occurred in the longline, handline, and rod-andreel categories. This was caused, in part, by a growing awareness of the requirements of the permitting process, as well as a concern about poten-
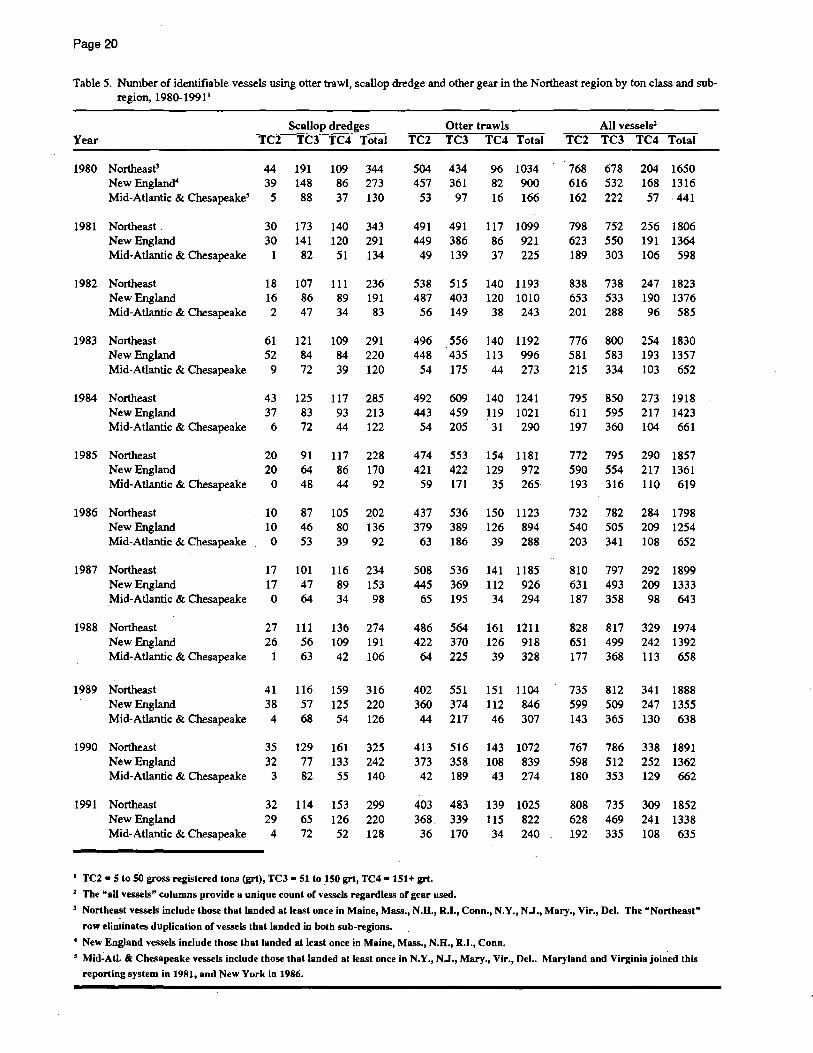
Page 20
Table 5. Number of identifiable vessels using otter trawl, scallop dredge and other gear in the Northeast region by ton class and subregion, 1980-19911
Scallop dredges Year TC2 TC3 TC4 Total
1980 Northeast3 44 New Englan~ 39 Mid-Atlantic & Chesapeake~ 5
1981 Northeast. 30 New England 30 Mid-Atlantic & Chesapeake 1
1982 Northeast 18 New England 16 Mid-Atlantic & Chesapeake 2
1983 Northeast 61 New England 52 Mid-Atlantic & Chesapeake 9
1984 Northeast 43 New England 37 Mid-Atlantic & Chesapeake 6
1985 Northeast 20 New England 20 Mid-Atlantic & Chesapeake 0
1986 Northeast 10 New England 10 Mid-Atlantic & Chesapeake 0
1987 Northeast 17 New England 17 Mid-Atlantic & Chesapeake 0
1988 Northeast 27 New England 26 Mid-Atlantic & Chesapeake 1
1989 Northeast 41 New England 38 Mid-Atlantic & Chesapeake 4
1990 Northeast 35 New England 32 Mid-Atlantic & Chesapeake 3
1991 Northeast 32 New England 29 Mid-Atlantic & Chesapeake 4
191 148
88
173 141
82
107 86 47
121 84 72
125 83 72
91 64 48
87 46 53
101 47 64
111 56 63
116 57 68
129 77 82
114 65 72
109 86 37
140 120
51
111 89 34
109 84 39
117 93 44
117 86 44
105 80 39
116 89 34
136 109 42
159 125 54
161 133
55
153 126 52
344 273 130
343 291 134
236 191 83
291 220 120
285 213 122
228 170 92
202 136 92
234 153 98
274 191 106
316 220 126
325 242 140
299 220 128
Otter trawls TC2 TC3 TC4 Total
504 434 457 361
53 97
491 491 449 386
49 139
538 515 487 403
56 149
496 556 448 435
54 175
492 609 443 459
54 205
474 553 421 422
59 171
437 536 379 389 63 186
508 536 445 369
65 195
486 564 422 370
64 225
402 551 360 374 44 217
413 516 373 358 42 189
403 483 368 339
36 170
96 1034 82 900 16 166
117 1099 86 921 37 225
140 1193 120 1010 38 243
140 1192 113 996 44 273
140 1241 119 1021
31 290
154 1181 129 972
35 265
150 1123 126 894 39 288
141 1185 112 926 34 294
161 1211 126 918 39 328
151 1104 112 846 46 307
143 1072 108 839 43 274
139 1025 115 822 34 240
1 TC2. 5 to SO gross registered tons (grt), TCl • 51 to 150 grt, TC4 - 151 + grt.
2 The "all vessels" columns provide a unique count or vessels regardless or gear used.
All vessels' TC2 TC3 TC4 Total
768 678 616 532 162 222
798 752 623 550 189 303
838 738 653 533 201 288
776 800 581 583 215 334
795 850 611 595 197 360
772 795 590 554 193 316
732 782 540 505 203 341
810 797 631 493 187 358
828 817 651 499 177 368
735 812 599 509 143 365
767 786 598 512 180 353
808 735 628 469 192 335
204 1650 168 1316 57 . 441
256 1806 191 1364 106 598
247 1823 190 1376 96 585
254 1830 193 1357 103 652
273 1918 217 1423 104 661
290 1857 217 1361 110 619
284 1798 209 1254 108 652
292 1899 209 1333
98 643
329 1974 242 1392 113 658
341 1888 247 1355 130 638
338 1891 252 1362 129 662
309 1852 241 1338 108 635
l Northeast vessels include those that landed at least once in Maine, Mass., N.H., R.I., Conn., N.Y., N.J., Mary., Vir., Del. The "Northeast"
row eliminates duplication or vessels that landed in both sub-regions.
• New England vessels include those that landed alleast once in Maine, Mass., N.H., R.I., Conn.
• Mid-AU. & Chesapeake vessels include those that landed at least once in N.Y., N.J., Mary., Vir., Del.. Maryland and Virginia joi~ed this
reporting system in 1981, and New York in 1986.

tial moratoriums and management options. In many instances, the number of permits issued exceeds the number of vessels actually using that gear in a given year.
Table 5 shows the total number of identifiable vessels using scallop dredge, otter trawl, and other gear that are represented in the weighout data base from 1980 through 1991. There has been a general decline in the number of vessels in both the otter trawl fishery and the scallop dredge fishery across all regions in the Northeast.
The collection of weighout receipts coupled with the ability to identify the particular vessel involved allows landings to be associated with vessel and gear characteristics.
Table 6 examines these identified vessels and lists their landings and revenue by gear type as recorded in the database in 1991. As, this table indicates, one can associate only a portion of total landings with the specific vessels that made those landings. These landings are about 64 percent of all landings for all fisheries in all waters of the region. The revenue also represents 64 percent of the total for the region. The most obvious omission of identified vessels occurs in the lobster fishery. Vessels using otter trawl gear, once again, had the highest revenue among uniquely identified vessels.
FLEETS AND FISH
Tables 7 to14 contain condensed pictures of the known vessel activity captured by the port data collection system. All information about an individual vessel's activity has been aggregated into an annual picture. This information was then aggregated across vessels into groups or fleets on the basis of gear use, area fished, and tonnage class. The purpose is to give some continuing set of indicators of how vessels are performing. Most information concerns effort, landings, and revenue. No cost information is reported. Tonnage class 2 vessels range from 5 to 50 grt; class 3 vessels are 51 to 150 grt; and class 4 vessels displace more than 150 grt.
Page 21
Table 6. Identified vessels' landings (1,000 mt) and ex-vessel revenue ($ million) in the Northeast by gear used, 1991
Gear Types
Otter trawl, fish Dredge, sea scallop Dredge, surfclam and ocean quahog Longline, set line and line trawl Pots and traps, lobster Sink gill net Otter trawl, bottom (scallop) Otter trawl, bottom (shrimp) Purse seine, tuna Pots & traps, crabs Otter trawl, bottom (paired) Purse seine, herring All other gears
1991 total
Several caveats are in order concerning how vessels were categorized by fleet. In general, if a vessel landed at least once in a port in the region, its total actiVity (all trips regardless of gear used) was ascribed to that region, defined as either New England, MidAtlantic and Chesapeake, or the entire Northeast. Hence, several vessels and their activity may be represented in more than one table. The same multiple representation exists for use of a gear. If a vessel uses a gill net, for example, and, in the same year, a longline, its total activity will be represented in the total activity section of two tables, but its "primary gear" activity in only one - that describing gill net use or that describing longline use. For some gears this distinction between primary gear activity and total activity is not displayed because a gear's use constitutes an overwhelming majority of the activity of the fleet in question.
Some of the weighout data, from 1982 to 1990, has been aggregated from a different perspective by the Center's Fleet Modeling Group to reveal the distribution of individual vessel-based statistics such as annual revenue and effort. These statistics help answer questions such as "what is the distribution of annual gross revenue across vessels in a particular geardefined fleet?" More attention will be given to further developing the appro-
Landings Revenue
136.94 187.8 19.06 149.3 49.24 44.6
5.28 25.4 4.20 22.6
13.56 15.8 0.87 6.2 3.04 5.8 0.29 3.6 1.78 2.0 0.98 1.9
18.87 1.9 19.45 10.0
273.56 476.8
priate data bases necessary to answer questions of this sort. For now, we rely mostly on the commercial weighout database as it exists and the standard aggregate statistics.
New England Otter Trawl
The total number of vessels participating in this fishery continues its steady decline to 822 vessels, a pre-1980 level (see Table 7). Total landings increased for the second year, recovering slightly from their steady decline through the 1980s. Average revenue-per-vessel increased for each tonnage class in 1991, because total revenue was up and vessel participation was down. The average number of days-at-sea has increased slightly for all tonnage classes in the aggregate.
Mid-Atlantic Otter Trawl
Mid-Atlantic otter trawlers primarily land summer flounder, scup, and black sea bass (Table 8). The number of vessels engaged in this fishery dropped further in 1991, to 240 vessels, 34 less than the previous year. A significant increase in the average number of days absent from port occurred among all tonnage classes, attributable to the increase in total days

Page 22
Table 7. New England otter trawl vessels, all gears used
Ton Class 2 Ton Class 3 Ton Class 4 1988 1989 1990 1991 1988 1989· 1990 1991. 19.88 1989 1990 1991
Vessel count 422 360 373 368 370 374 358 339 126 112 108 115 Average age 23 24 24 24 17 16 17 18 9 8 10 11 Average grt 27 28 27 27 99 101 102 103 193 193 178 177 Average days absent 62 62 62 61 130 123 133 140 163 174 173 187 Average crew size 2.7 2.8 . 2.8 2.8 5.3 5.3 5.3 5.3 7.2 7.1 7.0 7.1 Revenue-per-day-absent ($) 866 920 944 1072 1892 1844 1960 2136 3075 3305 3321 3655 Lb-per-da y -absent 1633 1585 2020 1965 2983 2685 3454 3583 5107 5955 6302 6459 Average number of trips-per-vessel 53 54 51 50 38 35 37 36 23 25 28 28
Table 8. Mid-Atlantic otter trawl vessels, all gears used
Ton Class 2 Ton Class 3 Ton Class 4 1988 1989 1990 1991 1988 1989 1990 1991 1988 1989 1990 1991
Vessel count 64 44 42 36 225 217 189 Average age 23 21 26 24 14 15 16 Average grt 31 30 30 28 134 103 105 Average days absent 37 55 63 81 65 70 84 Average crew size 2.5 2.7 2.7 2.6 4.5 4.8 4.8 Revenue-per-day-absent ($) 910 861 731 763 1974 1682 1750 Lb-per-day-a bsent 2142 2241 2057 1730 3819 4536 4561 Average number of trips-per-vessel 33 54 61 74 17 22
Table 9. Northeast scallop dredge vessels, all gears used
1987
Vessel count 101 Average age 13 Average grt 121 A verage days absent 147 Average crew size 7.8 Revenue-per-day-absent ($) 3150 Lb-per-day-a bsent 6583 Average number of trips-per-vessel
absent and the decline in vessel numbers. On average, vessels experienced an increase in per-day-absent revenue and landings. Each vessel in this fishery, on average, continues to make a greater number of trips each year.
In 1991, total revenue increased by 8 percent, and total landings reached another new high of 63,000 mt, a 13 percent increase. Receipts-per-vessel rose approximately 23 percent over 1990 as landings increased and vessel participation declined.
New England or Mid-Atlantic otter trawlers did not do a significant
18
Ton Class 3 1988 1989 1990 1991
111 116 129 114 14 15 16 16
119 119 118 119 149 149 152 178 7.5 7.7 7.3 7.5
2682 2421 . 2542 2524 5644 5412 5887 5483
18 20 19 22
amount of fishing with other gears. However, there was great variability among vessels in the number of days absent. This reflects, to some extent, the frequency of encounters with some vessels as much as it reflects actual fishing vessel behavior. For 1990, the latest year for which these data are available, total annual days absent most frequently ranged from less than 10 to 75 for tonnage class 2, from 75 to 200 for tonnage class 3, and from 150 to 250 for tonnage class 4.
Although not shown in the tables, 14 vessels participated in pair trawling
25
170 39 46 43 34 17 7 8 11 13
104 176 175 175 179 99 102 99 135 153 5.1 7.6 7.4 7.3 7.5
1896 3329 3226 3020 3322 '5335 . 8559 8017 7727 8674
31 22 19 28 32
Ton Class 4 1987 . 1988 1989 1990 1991
116 136 159 161 153 13 12 13 13 14
182 181 182 181 181 182 185 182 191 213 9.8 9.5 9.3 9.2 9.6
3969 3440 3301 3399 3283 7611 7097 7249 7129 6448
18 19 18 19 20
activities in the Northeast Region in 1991. These pair trawling vessels had significantly higher revenue-per-dayabsent arid' landings-per-day-absent than otter trawlers that worked alone.
Northeast Scallop Dredge
Table 9 shows the activity of the Northeast sea scallop fleet for tonnage clasSes 3 and 4. Tonnage class 2 vessels.accounted for negligible levels of effort and landings. In 1991,~he number of vessels partiCipating in this fishery dropped, although those ves-

Page 23
Table 10. Northeast vessels that used shrimp trawls, all gears used and shrimp gear only
Ton Class 2 Ton Class 3 1987 1988 1989 1990 1991 1987 1988 1989 1990 1991
All Gears Vessel count 198 207 169 178 165 61 55 49 46 33 Average age 18 20 20 18 20 19 22 20 20 22 Average grt 24 25 26 26 25 83 77 81 78 76 Average days absent 66 63 63 67 69 129 106 100 115 117 Average crew size 2.4 2.5 2.4 2.4 2.6 5.3 4.9 4.8 4.8 4.4 Revenue-per-day-absent ($) 1050 831 845 873 1054 1953 1427 1461 1619 1925 Lb-per-day -3 bsent 1567 1454 1324 1673 1919 3441 2914 2385 3022 3719 Average number of trips-per-vessel 60 58 59 60 61 72 75 64 67 66
Shrimp Trawl Gear Trips Average days absent 28 24 28 27 24 37 28 35 36 34 A verage crew size 2.4 2.5 2.4 2.4 2.6 5.3 4.9 4.8 4.8 4.4 Revenue-per-day-absent ($) 1126 902 902 808 972 2211 1722 1418 1448 1740 Lb-per-day-absent 1155 912 1006 1164 1115 2290 1994 1712 2271 2120 Average number of trips-per-vessel 28 23 27 26 23 29 25 32 30 . 32
Table 11. Northeast vessels that used gill nets, all gears used and gill net trips only
Ton Class 2 Ton Class 3 1987 1988 1989 1990 1991 1987 1988 1989 1990 1991
All Gears Vessel count 185 215 224 209 240 5 15 23 16 12 Average age 14 14 14 15 14 19 16 18 14 15 Average grt 21 22 21 22 22 89 79 81 80 80 Average days absent 62 62 67 72 73 79 93 92 110 74 A verage crew size 2.8 2.8 2.6 2.7 2.6 5.0 3.6 4.3 4.3 5.8 Revenue per day absent ($) 1193 951 1117 1031 1173 2227 2037 2247 1959 1743 Lb-per-day-absent 2893 2682 3429 2407 2263 2928 4344 8963 3875 3339 Average nmnber of trips-per-vessel 54 54 61 64 64 35 46 51 58 46
Gill net trips only Average days absent 49 50 51 58 57 27 31 45 54 53 Average crew size 2.8 2.8 2.6 2.7 2.6 5.0 3.6 4.3 4.3 5.8 Revenue-per-day-absent ($) 1209 908 1126 1042 1138 2187 1995 2658 1949 1737 Lb-per-day-absent 2702 2545 3006 2555 2447 2230 5041 6185 5323 3848 Average nmnber of trips-per-vessel 43 43 47 52 49 20 22 21 35 40
sels that were active increased their the total in 1982 to 44 percent in 1990. Northeast Shrimp Trawl level of effort. Annual landings in- For tonnage class four vessels, the creased but apparently not enough to percentage increased from 31 percent The northern shrimp fishery is a push total revenue up as well. Income in 1982 to 60 percent in 1990. seasonal fishery. Vessels using the earned by this fleet fell by almost 3 It is worth noting that crew size shrimp trawl land 96 percent of the percent. Revenue-per-day-absent fell numbers are based on vessel berths shrimp, generating revenue of more slightly in 1991, and landings-per-day- and do not represent actual observa- than $6 million in 1991. There was a absent fell quite significantly for both tions of crew at the end of a trip. For decline in revenue, total landings, and vessel size categories. the scallop fleet, the number of people total effort from 1990 levels. How-
Information from the Center's represented as full-time crew is likely ever, the decrease in the number of . - -Fleet Modeling Group reveals that for to be grossly underestimated. Regula- vessels in this fishery resulted in mini-
tonnage class three, the number of tions made in recent years have re- mal increases in the average days-at-vessels absent for more than 200 days suIted in incentives to carry more crew sea and substantial increases in land-per year increasedJrom two percent of than sleeping spaces. ings-per-day-absent and revenue-per-
day-absent.

Page 24
Table 11. Northeast vessels that used gill nets, all gears used and gill net trips only
Ton Class 2 Ton Class 3 1987 1988 1989 1990 1991 1987 1988 1989 1990 1991
All Gears Vessel COW1.t 185 215 224 209 240 5 15 23 16 12 Average age 14 14 14 15 14 19 16 18 14 15 Average grt 21 22 2f 22 22 89 79 81 80 80 Average days absent 62 62 67 72 73 79 93 92 110 74 Average crew size 2.8 2.8 2.6 2.7 2.6 5.0 3.6 4.3 4.3 5.8 Revenue per day absent ($) 1193 951 1117 1031 1173 2227 2037 2247 1959 1743 Lb-per-day-absent 2893 2682 3429 2407 2263 2928 4344 8963 3875 3339 Average rimnber of trips-per-vessel 54 54 61 64 64 35 46 51 58 46
Gill net trips only Average days absent 49 50 51 58 57 27 31 45 54 53 Average crew size 2.8 2.8 2.6 2.7 2.6 5.0 3.6 4.3 4.3 5.8 Revenue-per-day-absent ($) 1209 908 1126 1042 1138 2187 1995 2658 1949 1737 Lb-per-day-absent 2702 2545 3006 2555 2447 2230 5041 6185 5323 3848 Average nmnber of trips-per-vessel 43 43 47 52 49 20 22 21 35 40
Table 12. Northeast vessels that used longlines or line trawls; all trips regardless of gear used and long line/line trawl trips
Ton Class 2 Ton Class 3 Ton Class 4 1988 1989 1990 1991 1988 1989 1990 1991 1988 1989 1990 1991
All Gears Vessel COW1.t 75 71 90 119 70 62 60 76 19 16 11 8 Average age 14 15 14 13 11 11' 12 13 9 6 6 7 Average grt 23 23 27 26 92 94 91 89 172 173 174 177 Average days absent 51 52 55 59 83 85 88 97 93 119 111 138 Average crew size 2.6 2.4 2.7 3.1 4.7 4.8 4.4 4.6 7.2 6.9 6.0 6.1 Revenue-per-day-absent ($) 1414 1217 1334 1719 2541 2382 2516 2567 3503 3395 3709 3440 Lb-per-day -absent 1654 1878 1732 1821 1063 1125 1307 1538 1244 1832 1911 2209 Average nmnber of trips-per-vesse1 36 40 36 41 10 10 12 15 3 6 6 8
Longline and Line Trawl Trips Only Average days absent 39 36 32 32 61 65 71 71 92 105 103 107 Average crew size 2.6 2.4 2.7 3.1 4.8 4.8 4.4 4.6 7.2 6.9 6.0 6.1 Revenue-per-day-abserit ($) 1450 1239 1428 1966 2538 2456 2626 .2710 3507 3375 3641 3686 Lb-per-day-absent 1394 1414 1259 1529 1029 949 1068 1347 1243 1287 1519 1433 Average nmnber of trips-per-vessel 25 25 15 18 5 5 7 8 '3 4 5 5
More than 80 percent of the fleet Northeast Gillnet The number of vessels in this fish-
is composed of small, tonnage class 2 This is a broad category of gear,
ery increased steadily between 1986
vessels. The principal gears used by and 1989, decreased in 1990, but in-
these vessels in the six month off- but it excludes the large-mesh drift net creased again to 253 vessels in 1991.
season are otter trawls, gill nets and used for large pelagics. Small-mesh Average revenue increased in 1991,
lobster traps. Table 10 shows both the drift and sink gill nets capture a sub- along with revenue-per-day-absent,
activity of this fleet in pursuing shrimp stantial amount of pollock, a small while average landings declined from
and allits other fishing acti vity. Shrimp amount of bluefish, and several other 1990 levels.
trawl gear was used an average of 31 groundfish species (Table 11). The There is uncertainty about future
days out of an average of 93 days-at- majority of gill net vessels are small, use of this gear in some areas where
sea, and contributed about the same tonnage class 2 vessels that employ marine mammals, primarily the harbor
proportion to total revenue .. other gear for approximately 20 per- porpoise, are also present. Final impli-cent of the year, usually otter trawls cations will become apparent when the and shrimp trawls. Marine Mammal Protection Act is fully
implemented in October 1993.

Page 25
Table 13. Northeast region surfclam and ocean quahog vessels and mid-Atlantic vessels, all trips
Ton Class 2 Ton Class 3 Ton Class 4 1988 1989 .1990 1991 1988 1989 1990 1991 1988 1989 1990 1991
All Regionlll SurCclllm/Ocean Quahog Vessels Vesse! count 11 10 9 31 89 87 81 60 44 46 43 28 Average age 44 42 41 13 22 22 23 21 26 25 27 21 Averagegrt 42 42 42 22 103 103 104 109 190 189 189 181 A verage days absent 48 43 46 27 54 61 45 61 78 67 58 92 Average crew size 3.1 3.0 3.0 2.7 4.0 3.8 4.0 4.1 8.3 8.3 8.6 9.6 Revenue-per-day-absent ($) 2281 2217 2254 2024 4556 4633 6621 6577 5509 5625 7198 7626 Lb:-per-day-absent (live wI.) 23,934 22,995 19,854 16,575 63,269 71,479 98,106 102,875 109,027 110,653121,480 127,243 Average number of trips-per-vessel -38 36 50 43 46 60 55 67 66 61 58 -91
Mid-Atlantic Surfclam/Ocean Quahog Vessels Vessel count 9 8 6 11 81 81 78 57 43 46 42 27 Average days absent 34 37 36 15 50 60 45 59 79 67 57 93 Average crew size 3.1 3.0 3.0 H B B 4.0 4.1 5.6 8_3 8.7 9_4 Revenue-per-day-absent ($) 2385 2279 2183 3203 5042 4879 6699 6893 5556 5625 7354 7608 Lb-per-day-absent (live wI.) 26,343 24,626 21,169 55,225 72,591 76,227 99,907 110,209 110,290 110,653122,893 128,787 Average number of trips-per-vessel 34 36 44 15 46 61 56 69 67 61 59 93
Table 14. Northeast vessels using offshore lobster gear, all trips and offshore lobster trips
Ton Class 2 Ton Class 3 Ton Class 4 1988 1989 1990 1991 1988 1989 1990 1991 1988 1989 1990 1991
All Gears Vessel count 26 41 61 61 40 42 44 39 4 3 4 4 Average age 12 15 15 15 10 10 10 11 4 5 10 11 Average grt 28 24 23 23 84 86 87 90 168 172 178 178 Average days absent 69 88 104 125 135 139 120 145 140 169 188 .235 Average crew size 3.1 2_7 2.6 3.2 4.2 4.2 4.3 4.2 5.0 5.0 5.0 5.0 Revenue-per-day-absent ($) 1564 1255 1246 1083 2469 2215 2753 2591 3571 3259 2997 3382
Lb-per-day-absent 814 549 683 674 1002 948 1352 1330 2795 1308 3626 3095 Average number of trips-per-vessel 34 69 86 106 36 35 34 39 43 45 74 83
Offshore Lobster Trips Only Average days absent 51 40 57 100 123 132 112 104 102 169 103 149 A verage crew size 3.1 2.7 2.6 3.2 4-2 4.2 4.3 4.2 5.0 5.0 5.0 5.0 Revenue-per-day-absent ($) 1728 1371 1509 1065 2582 2268 2848 2686 3977 3253 3228 3632 Lb-per-day-absent
/ 742 575 653 411 1000 944 1199 1133 1572 1306 1616 1647
Average number of trips-per-vessel 17 22 40 85 30 31 28 29 27 45 41 55
Longline and Line Trawl Surfclam and Ocean The activity represented in Table
Quahog Dredge 13 is divided between the activity of all
These related gears land the vast vessels in the Northeast region using
majority of swordfish, bigeye tuna, In 1991, this fishery continued its ad- that gear and the activity of vessels that
and yellowfin tuna, about half of the justment to the individual vessel trans- landed in the Mid -Atlantic. In general,
tilefish, and a small amount of cod. ferrable quota management system. all measures of quantities, revenue,
Participation in this fleet contin- The number of vessels in the fishery and effort increased. Average revenue,
ued to increase with the number of declined by 10 percent from 1990 as average landings, and average days-
vessels expanding from 160 to 203 vessel quotas were consolidated within at-sea increased significantly. With vessels (Table 12). Average revenue and across firms. Some growth oc- fewer vessels in this fishery, they are for all vessels increased by 12 percent curred in the smallest vessel class at making more trips and spending more
in 1991, while average landings were the expense of a decline in the number days at sea. Of the 119 vessels operat-
17 percent greater than the 1990 level. of larger vessels. Many of these small ing in the region, 24 vessels landed In general, the larger the vessel class, vessels are not limiting their activity to away from mid-Atlantic or Chesapeake
the more these two gears types con- Mid-Atlantic ports. ports. tribute to their total fishing activity.
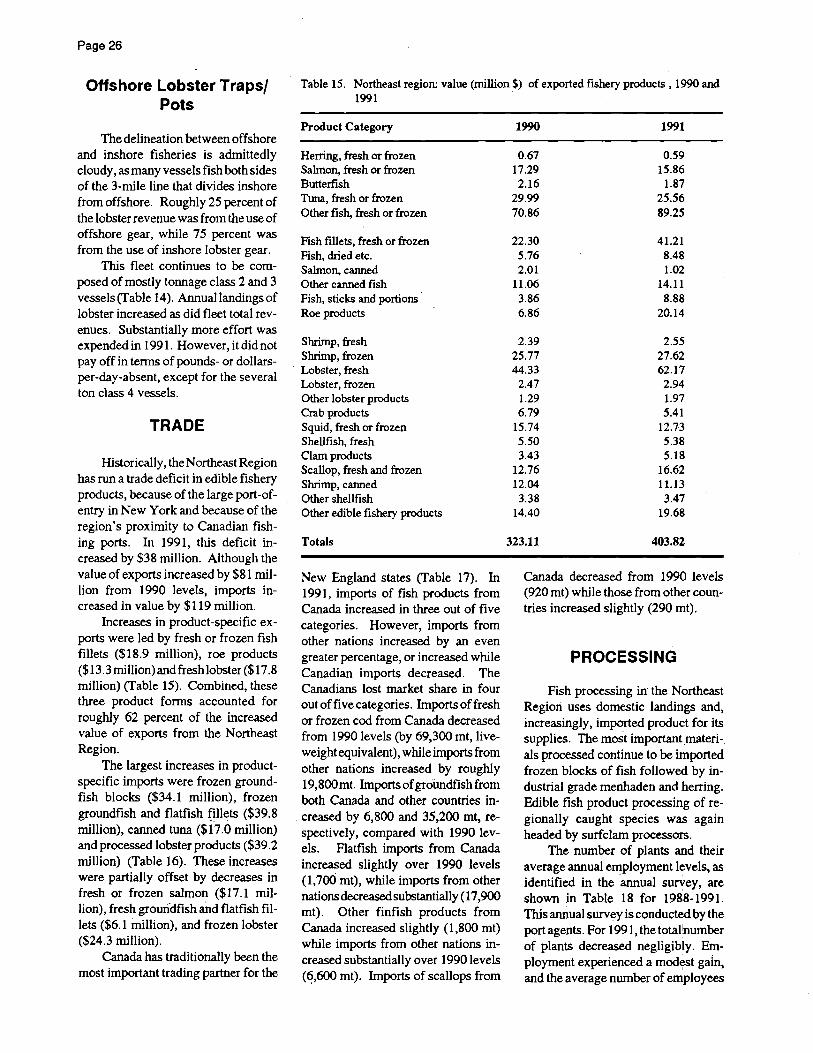
Page 26
Offshore Lobster Trapsi Pots
The delineation between offshore and inshore fisheries is admittedly cloudy, as many vessels fish both sides of the 3-mHe line that divides inshore from offshore. Roughly 25 percent of the lobster revenue was from the use of offshore gear, while 75 percent was from the use of inshore lobster gear.
This fleet continues to be composed of mostly tonnage class 2 and 3 vessels (Table 14). AnnuaJIandingsof lobster increased as did fleet total revenues. Substantially more effort was expended in 1991. However, it did not payoff in terms of pounds- or dollarsper-day-absent, except for the several ton class 4 vessels.
TRADE
Historically, the Northeast Region has run a trade deficit in edible fishery products, because ofthe large port-ofentry in New York and because of the region's proximity to Canadian fishing ports. In 1991, this deficit increased by $38 million. Although the value of exports increased by $81 million from 1990 levels, imports increased in value by $119 million.
Increases in product-specific exports were led by fresh or frozen fish fillets ($18.9 million), roe products ($13.3 million) and fresh lobster ($17.8 million) (Table 15). Combined, these three product fonns accounted for roughly 62 percent of the increased value of exports from the Northeast Region.
The largest increases in productspecific imports were frozen groundfish blocks ($34.1 million), frozen groundfish and flatfish fillets ($39.8 million), canned tuna ($17.0 million) and processed lobster products ($39.2 million) (Table 16). These increases were partially offset by decreases in fresh or frozen salmon ($17.1 million), fresh grouridfish and flatfish fillets ($6.1 million), and frozen lobster ($24.3 million).
Canada has traditionally been the most important trading partner for the
Table 15. Northeast region: value (million$) of exported fishery products, 1990 and 1991
Product Category
Hening, fresh or frozen Sabnon, fresh or frozen Butterfish Tuna, fresh or frozen Other fish, fresh or frozen
Fish fillets, fresh or frozen Fish, dried etc. Sabnon, canned Other canned fish Fish, sticks and portions Roe products
Shrimp, fresh Shrimp, frozen
. Lobster, fresh Lobster, frozen Other lobster products Crab products Squid, fresh or frozen Shellfish, fresh Clam products Scallop, fresh and frozen Shrimp,canned Other shellfish Other edible fishery products
Totals
New England states (Table 17). In 1991, imports of fish products from Canada increased in three out of five categories. However, imports from other nations increased by an even greater percentage, or increased while Canadian imports decreased. The Canadians lost market share in four out of five categories. Imports offresh or frozen cod from Canada decreased from 1990 levels (by 69,300 mt, liveweight equi valent), while imports from other nations increased by roughly 19,800mt. Importsofgrooodfishfrom both Canada and other countries increased by 6,800 and 35,200 mt, respectively, compared with 1990 levels. Flatfish imports from Canada increased slightly over 1990 levels (1,700 mt), while imports from other nations decreased substantially (17,900 mt). Other finfish products from Canada increased slightly (l,800 mt) while imports from other nations increased substantially over 1990 levels (~,600 mt). Imports of scallops from
1990 1991
0.67 0.59 17.29 15.86 2.16 1.87
29.99 25.56 70.86 89.25
22.30 41.21 5.76 8.48 2.01 1.02
11.06 14.11 3.86 8.88 6.86 20.14
2.39 2.55 25.77 27.62 44.33 62.17
2.47 2.94 1.29 1.97 6.79 5.41
15.74 12.73 5.50 5.38 3.43 5.18
12.76 16.62 12.04 11.13
3.38 3.47 14.40 19.68
323.11 403.82
Canada decreased from 1990 levels (920 mt) while those from other countries increased slightly (290 mt).
PROCESSING
Fish processing in the Northeast Region uses domestic landings and, increasingly, imported product for its supplies. The moSt importantmateri-. als processed continue to be imported frozen blocks of fish followed by industrial grade menhaden and herring. Edible fish product processing of regionally caught species was again headed by surfclam processors.
The number of plants and their average annual employment levels, as identified in the annual survey, are shown in Table 18 for 1988-1991. This annual survey is conducted by the port agents. For 1991, the total!number of plants decreased negligibly. Employment experienced a mod~t gain, and the average number of employees

Table 16. Northeast region valuee (million $) of imported edible fishery products , 1990 and 1991
Product Category 1990 1991
Fresh or frozen sea herring 3.12 4.20 Fresh whole groundfish, halibut and other flatfish 45.82 36.02 Frozen whole groundfish, halibut and other flatfish 9.24 14.25 Salmon, fresh or frozen Other fish fresh or frozen Frozen groundfish blocks
Ocean perch fillets Fresh grolllldfish and flatfish fillets Frozen grolllldfish and flatfish fillets Other fresh, frozen fillets
Salted or dried groundfish Salted herring Canned tuna Canned sardines Minced fish Clam products Crab products Lobster, fresh Lobster, frozen Other lobster products Scallops Shrimp products Analog fish products Squid Other fishery products
Totals
per plant remained virtually unchanged.
Total regional employment in the processing sector has declined since the early days ofthe Magnuson Act. In 1978, almost 22,000 persons worked in processing, with 4 persons in processingforevery 1 person in wholesaling. Today, fewer than 1 8,000 persons are employed in processing, reducing this processing:wholesaling ratio to 2.2:1.
FOREIGN FISHING AND JOINT VENTURES
There have been directed foreign fishing operations in the Northeast Region since the Magnuson Act's pas-' sage in 1976 and joint venture arrangements since 1982. Directed foreign fishing for Loligo or /llex squid has been phased out. Since 1987, foreign
93.06 76.00 58.81 55.01
313.42 347.49
56.35 62.52 48.63 42.57
343.54, 383.36 124.97 128.72
30.19 3l.09 3.74 3.82
161.78 178.81 30.38 30.07 18.61 27.23 8.83 8.58
36.26 40.04 111.80 113.18 139.95 115.68
5.80 45.03 82.20 77.93
366.08 376.64 10.53 6.96 9.58 1l.20
136.68 15l.99
2,249.4 2,368.4
vessels have been allowed to take only mackerel in a directed fishery (Table 19). This take was reduced by a factor of more than four in 1990 and reduced again in 1991 by 38 percent.
For the past several years, ratios have been imposed on the foreign fleet, linking the amount of foreign catches to the amount that must be bought "over the side" from U.S. vessels in joint ventures and to amounts of processed product that must be bought from U.S. mackerel processors. In 1991, the ratio requ ired that for 9 mt of mackerel caught directly, the foreign fleet had to purchase 3 mt over-theside OR 1 mt of processed product. Prior to 1991, the ratio required that for 9 mt of mackerel, the foreign fleet had to purchase 3 mt over-the-side AND 1 mt of processed product. . Since the U.S. demand is lowrela
tive to the potential sustainable yields. of mackerel, this species is considered viable for joint venture operations. The
Page 27
U.S. harvesting industry benefits as U.S. exporters continue to discover competitive markets. In 1991, the U.S. conducted joint ventures with the Netherlands and what was then the Soviet Union. The number of U.S. vessels participating inregional mackerel joint venture activities dropped from 19 in 1990 to 9 in 1991. However, the number of firms coordinating the activity was fewer than three; hence more detailed information is confidential.
RECREATIONAL FISHING
NMFS reports that about 4.5 million anglers caught roughly 160 million marine finfish during an estimated 19 million fishing trips-in the Northeast region during 1991 (preliminary estimates from the NMFS' Marine Recreational Fishing Statistics Survey). Fishing from private or rental boats was the most common mode (59 percent of total fishing trips), followed by shore fishing (37 percent of trips) and party or charter boat fishing (4 percent of trips). Most activity took place in the Mid-Atlantic area (60 percent of participants, 80 percent of catch, and 70 percent of trips). The ranking of modes was the same in each area, but party and charter boat fishing and private boat fishing were relatively greater in the Mid-Atlantic.
Recreational landings of most commercially-important species now covered by fishery management plans remain minor or insignificant compared to commercial landings. (See the Species Synopsis section.) However, anglers contributed significantly to the fishing mortality of some species during 1991, particularly summer flounder and winter flounder as well as bluefish and striped bass. Other spe- . cies popular with anglers are tautog, scup, Atlantic cod, weakfish, Atlantic mackerel, Atlantic bluefin tuna, and sharks.
The demand for and value of fishing by anglers in the Northeast remains poorly understood in quantitative terms, and the economics of charter and party boat fishing has not been

Page 28
examined either. For example, anglers as a group are known to fish for fun, food, and, in some cases, income, but the relative importance of these motives among anglers remains unknown in fisheries throughout the region. Similarly, income and employment in the commercial sector that services anglers, including charter boat or party boat fishing, is unknown.
The complex and poorly understood relationships among stock size, harvest, anglers' motives, and industry perfonnance undermine economic evaluations of proposed regulations. Existing data on expenditures by anglers are necessary to begin to understand the relationships, but expenditures are not indicative of angler satisfaction or income (Edwards 1990).
. NET NATIONAL BENEFITS
The Magnuson Fishery Conservation and Magnuson Act was enacted, in part, to achieve a continued optimum utilization of living marine resources for the Nation of commer-cia! fishennen, recreational fishennen, consumers, and related industries. In economics, optimum yield and benefits usually concern efficiency, or the greatest difference between the economic value of fish harvests and the opportunity costs of managing, harvesting, distributing, processing, and otherwise marketing fish, including in the recreation sector. Economic value is understood in terms of the most that consumers and anglers are willing to pay for fish (potentially much more than actual expenditures). Opportunity costs are the values to consumers and anglers that are foregone when human capital, physical capital, and natural resources are used to harvest, market, and manage fish instead of to produce other goods and services valued by the pUblic.
These notions of economic costs, benefits, and efficiency are grounded in theory and are estimable. (See Edwards (1990) for a further discussion and references.) The major cat-
Table 17. New England imports (1,000 mt) of selected fishery products '
1990 1991 Canada Other Canada Other
Cod 286.54 99.89 217.27 119.71 Groundfish 95.72 97.81 102.56 133.04 Flatfish 48.48 27.98 50.18 10.06 Other finfish 26.05 34.98 27.87 41.54 Scallops. 7.16 1.04 6.24 1.33
With the exception oCscallops, product rorms include whole rresh and rrozen, rrozen blocks, and fresh and rrozen lillets. Groundlish are cusk, hake, pollock, and ocean perch. Flatlish include halibut. Finfish weights are expressed in live weight equivalents and scallops in meat weights
Table 18. Marine products processing and wholesaling establishments and their employment levels for 1988 to 1991
Processing
1988 New England 261 6582 Mid-Atl. & Chesapeake 210 7739 Northeast Region 471 14321
1989 New England 252 6182 Mid-Atlantic & Chesapeake 191 7472 Northeast Region 443 13654
1990 New England 247 5649 Mid-Atl. & Chesapeake 176 6483 Northeast Region 423 12132
19911
New England 245 5526 Mid-Atl. & Chesapeake 172 6773 Northeast Region 417 12299
I 1991 ligures are preliminary.
egories of costs and benefits were discussed in last year's document (NEFSC 1991). By way of review, costs include the use of labor, physical capital (e.g., vessels and buildings), andnatural resources in the following ways: (1) management (administration, data collection, enforcement, research); (2) regulations that inhibit the productivity of fishennen, vessels, or gear; and (3) overcapacity (i.e., use of more inputs than necessary to harvest the same or greater amount of fish, provided that these resources .have alternative employment).
On the benefits, or value, side of
Wholesaling Total
627 2470 888 9052 363 2760 573 10499 990 5230 1461 19551
682 2745 934 8927 371 2860 562 10332
1053 5605 1496 19259
691 2918 938 8567 361 2687 537 9170
1052 5605 1475 17737
700 2966 945 8492 353 2624 525 9397
1053 5590 1470 17889
the equation there are: (1) income of boat owners and fishennen, including economic profit from ownership of vessels (i.e., producer's surplus) and higher salaries earned by particularly skilled fishennen; (2) income in fishing-dependent industries (e.g., processing, restaurants, charter boat fishing), including economic profit; (3) consumer's surplus enjoyed by seafood consumers and anglers; and (4) resource rent, or the economic value of fish resources (vis-a-vis returns to labor or physical capital).
. Although potentially estimable, much of the fisheries and related data

necessary to estimate economic benefits and costs have not been collected in the Northeast (or in other NMFS regions). For example, the potential gains in resource rents and consumer benefits from efficient harvest of groundfish resources was estimated to be roughly $130 million and $20 million a year, respectively (Edwards and Murawski in press). However, the extent to which these benefits might be realized depends on the costs in the fishery to adjust to this position, the total costs of management during the interim, and the extent to which property rights to harvest fish are created. These uncertaintieS limit on-going economic analyses of Amendment 5 to the Multispecies Plan.
The close relationship between property rights and economic value is indisputable. (What real estate on land-such as your house or farm--would be valued without property rights?) The regional fishery management councils, industry, and NMFS are currently debating individual transferable quotas (ITQs), one form of property rights, or controlled access. To help clarify the issues, NMFS Headquarters funded teams of economists to explore ITQ management for fisheries throughout the United States. The sea scallop fishery was investigated in the Northeast. The report was published by NMFS Headquarters in Silver Spring, Maryland.
For further information
Edwards, S.F. 1990. An Economics guide to allocation of fish stocks between commercial and recreational fisheries. NOAA Tech. Rept. NMFS-94.
Edwards, S.F. and S.A. Murawski. In press. Potential economic benefits from efficient harvest of New England groundfish. No. Amer. J. Fisher. Man .
. NEFSC. 1991. Status of the fishery resources off the northeastern United States for 1990. NOAA Tech. Memo. NMFS-F/NEC-81.
Page 29
Table 19. U.S. income ($1,000) from Northeast region directed foreign fishing for squid, mackerel, and butteIfish, 1984-1991
u.s. Income from Directed Foreign Fishing Jllex Squid Loligo Squid Buttertish Mackerel Other & mt $ mt $ mt $ mt $ Contid}
1984 638 38.3 11029 1417.9 430 67.1 9478 236.9 1433.0 1985 1008 57.5 6558 747.6 802 128.3 26384 1292.8 2489.0 1986 249 34.6 4862 1098.8 125 27.5 19144 957.2 1406.0 1987 0.3 0.1 < 1362 < 40.0 29294 1728.3 <220.7 1988 < 293 < 30.5 3.4 0.8 < 293 < 80.5 42879 2935.4 < 371.6 1989 < 180 < 18.7 3.5 0.9 0.9 < 0.2 36823 2519.8 < 274.6 1990 (1)3 (1) (1) 8670 593.3 < 537.7 1991 5349 312.0 (2)4
I Confidentilil. 2 < denotes less tblln. 3 (1) not broken out: included in "Other" totlil. 4 (2) included witb Atlllntic mackerel.
Butterfish, long·finned squid, and sand lance. NMFS photo by Brenda F/guerldo

Page 30
RESEARCH VESSEL
INTRODUCTION
In order to evaluate the status of exploited fishery resources, many different kinds of infonnation must be collected and and analyzed. Basic landings statistics, including the numbers and weight of each species landed, and demographic data such as length and age samples characterize what is brought ashore. At-sea sampling aboard commercial fishing vessels is used to establish the numbers and length/age composition of animals culled overboard. Telephone recall and roving samplers are used to estimate recreational catches. Effort data collected with catches is combined into indices of stock abundance based on catch-per-unit of effort (CPUE) ratios. Data from these three types of collection programs are generally referred to as flShery-dependent information -- derived directly from the commercial and recreational fisheries.
Fishery-dependent data are vital to our ability to monitor stocks, and often are the only reliable source of data concerning some species. However, using of fishery-dependent data alone may severely limit our ability to evaluate some stocks, and to make predictions. For example, in fisheries that are heavily dependent on the incorning age group to the fishery each year (the new "recruits"), fishery data alone can not be used to forecast catches, since very small fish are generally not taken with standard fishing gear. Likewise, CPUE may not be a reliable measure of abundance in all cases such as for schooling species, or when the increase in fishing technology cannot be factored into the relationship between catch and fishing ef-
SURVEYS
NEFSC scientifist Marjorie Lambert sorting trawl haul aboar~ R{V Albatross IV, 1992 trawl survey.
fort. For these and other reasons, fishery scientists throughout the world have initiated research vessel sampling programs to gather flSbery-independent
NMFS photo by Blenda F'1fJU6rido
infonnation (Clark 1981). Thescope and use of research vessel surveys in assessing Northeast fishery resources is reviewed in this section.

:t 180
E >- 160
~ a: 140 ::;, CI)
:5 120 Q.
CI) 100 Q. o ..,J ..,J
~ CI)
..... o :5 r:n :e ::;,
80
60
40
20
~ 0<----,.-
1979 1981
PRE-RECRUIT HARVESTABLE
1983 1985 1987
YEAR
1989 1991
Page 31
1993
Figure 7. Abundance indices for two size categories of Atlantic sea scallop taken in NEFSC smnmer scallop surveys in the Middle Atlantic region, 1980-1992. Data are presented separately for prefishery recruits (animals <70 mm shell height), and for harvestable sizes ( 70 mm shell height).
WHY CONDUCT RESEARCH VESSEL
SURVEYS?
Fishery-independent surveys of Northeast fishery resources are conducted for six important reasons:
(1) To monitor recruitment: Research surveying is generally conducted with sampling gear equipped with smaller mesh than is allowed in most fisheries. Small-mesh gear is used in order to estimate the abundance of very small animals that will eventually become large enough to be caught in standard fishing gear. To predict future landings and stocksizes, estimates of the survival of fish already large enough to be retained by harvesting gear must be combined with estimates of the incoming recruitment
to the fishery each year. Depending on the species, research vessel surveys can allow extrapolation of the strength of incoming age groups up to several years before they are allowed to be landed. For example, American plaice reach the minimum size for landing (14 in.) at about age 6. Trawling surveys begin to sample small American plaice during their first year oflife, thus allowing five estimates of the relative numbers of small plaice in the population before animals are large enough to land.
For some species, however, growth rates are much faster, and thus the time interval between when fish enter the surveying gear and when they are landed by the fisheries is much shorter. One such case is that of Atlantic sea scallop (Figure 7). Annual dredge surveys are conducted for this species in the Northeast. The relative
catch in numbers of sea scallops per haul of the dredge is plotted for two size categories of scallops: those smaller than 70 mm (2-3/4 in.) shell height are designated as prerecruits, and animals larger than or equal to 70 . mm are designated as harvestable. In Figure 7, the height of the black bars in each year is an index of the numbers of sea scallops likely to be available for harvest in the near future. As can be seen from Figure 7, the abundance of all sizes of sea scallops has declined significantly since the peak in 1989.
(2) To monitor abundance and survival of barvestable sizes: Research vessel sampling generally results in catches that span the full size and age range of the popUlation in the ocean. Although recruitment prediction is one important element of fishery forecasts, it is equally important to calculate the

Page 32
survival rate of the portion of the stock already subjected to fIshing. Thecatchat-age data collected from the surveys are one important source of infonnation used to estimate survival rates from one year to the next. A simple estimate of the survival of various age groups in the population can be.computed from the indices of abundance in two consecutive years. If the catchper-trawl-haul of age 4 cod was 100 individuals in 1991; and the catch-perhaul of the same fIsh, now age 5 in 1992, is 40 indiViduals, the estimated survival rate is 40/100 = 0.4 = 40 percent. In practice, fishery scientists usually combine catch-at -age data from the surveys with similar data from the fishery catch to improve estimates of fishingmortaIity and stock sizes. These combined estimates allow calculation of the popoulation .that must have been existence to give the levels of catches observed during the recent history of the fishery.
Sampling the abundance of harvestable sizes from research vessel surveys may be the only source of data available for species that have never been fished in the past, or are only fished at very low levels. Thus, dredging surveys conducted in the 1960s and 1970s were the only source of infonnation on the abundance of the latent ocean quahog resource of the Middle Atlantic, Southern New England and Georges Bank areas. Minimum population estimates were made by expanding the average catch-persquare-nautical-mile from the surveys by the number of square nautical miles of sea bottom inhabited by the stock. Similarly, current knowledge of the stock biomass of spiny dogfish and skates is based only on surveys, since catch-at-age based studies have not been undertaken.
(3) To monitor the geographic distribution of species: Some species lead rather sedentary lives while others are highly migratory. A major source of data concerning the movement patterns and geographic extent of stocks comes from research vessel surveys. Distribution maps can be drawn from reports of fishermen, but
4S 7~7~-.~~~~~~ __ ~~~,-c-'-r-,-,-,-,"~ __ ~--,6545 /. , I I'?" ,!-- .. t...
, ~ , ",k-., :fl.{:~~"''' t~:. ~ -;t' .
£J'/ r--' i 1\fWV:¥'.'/.-~-~/' J/ , 'I ~' ~ ,.<. ~i.:I. .. :~ i,
'''J I '!':I~.,"-<:' • ( '\ .i~· ;-: .• :.,'.¥ ~~' .'4~, .... "', .~~
. .-1 !" ~~ .~r" .... - .••• i.· .. -.. t.. . .~: i'~" I "Jj"~ •.. ".... . •... ' ... '.
! i 'Tr'". ':it: .' ~.~., ".~ / • '~. ~ :~.~_----I: '1 40' ". ( "'~.j.. ___ 110 _____
1 ._,...... .. , '.. \ .: . '-- . -
. r .... <r. .'" _ .. ' _. I ~ " • ..... :. M~' ------... r---.----.... -~ ..... :: .. :. "!'/_~' - ~'
'. , • ,1.( .• - .. 'J, ":'It , I I., " .. ' .. ,\ ... el ...
, ''}t... \" _L.--l-. ~ 411.';> -.d. '~.I ~ .,. ~ ... s ~.~ I .... }?,. -, f. ". ,., •.•. \ ( ~,..r"fo:::::.I.· ..... . _ 1.:" ... • • ~," '_
, ~~-.--~ • • .", ••• #. ~- " I ~:.. •. ' ....... ~ ,
", .~" "" .. ' ~ ~~- \
-41,(\~r·, . > ; r~ Distribution of
~ Lif.'-'y' --- /' Atlantic_Cod. ~.. 1987-1991
i I
~ Weight Per Tow \s' . (Pounds) ''eJ,
~. \ •
1 - 10
11 - 50 50+
3S~~C-~L-~L-~L---~~~~~~--~------~--~ 35 65 77
Figure 8. Geographic distribution of Atlantic cod, based onNEFSC bottom trawl surveys, 1987-1991. Data are the catch in each trawl tow catching cod, expressed in pounds. Data from spring, smruner, and autumn bottom trawl surveys are plotted.
these may give a biased picture of the stock, emphasizing only where highdensity fishable concentrations exist. The geographic distribution of Atlantic cod is depicted in Figure 8, based on trawl surveys conducted from 1987 to 1992. Distribution data are important not only for fishery management, but also for evaluating the population level effects of pollution and environmental change.
(4) To monitor ecosystem changes: With few exceptions, surveys conducted by the Northeast Fisheries Science Center are designed to be multipurpose. Bottom trawl surveys are not directed at one species, but rather generate data on nearly 200 species of fIsh and invertebrates taken in Northeastern Continental Shelf waters. Many of these species are relatively rare, and have little or no commercial or recreational value. However, by collecting
data on such an array of species, important patterns emerge when evaluating the response of the entire animal community to intensive harvesting on selected species. Figure 9 presents by percentage the species composition of fish taken in bottom trawl surveys of Georges Bank in 1963 and again in 1990. The dramatic changes in the system reflect the depletion of several important commercial fishery species (haddock, yellowtail flounder, pollock, plaice) and an increase in winter skate, spiny dogfish, and other species catches. These data suggest ecosystem-level responses to intensive harvesting, which may have important implications for developing harvesting strategies for the community of species, rather than the individual stocks. A multispecies surveying approach has thus provided an important research opportunity in the emerging field of ecosystem-based management.

Figure 9. Species composition (in percent by weight) of trawl survey catches on Georges Bank in autumn of 1963 and autumn of 1990.
(5) To monitor biological ratesorthe stocks: Apart from basic infonnation on the abundance and distribution of species, research vessel survey data are collected on a range of biological parameters of the stocks. These parameters include growth, sexual maturity, and feeding. Changes in growth and maturity directly influence assessment calculations related to spawning stock biomass, yield per recruit and percent of maximum spawning potentia\. Over the past three decades, these parameters have changed -- dramatically, for some species. Faster growth and earlier onset of maturity have been observed for haddock and cod. It is thus important to monitor these rates continuously, if the stock status is to be accurately detennined: Likewise, diet data collected by examining stomach contents at sea will be increasingly important as scientists try to evaluate how harvesting affects species that are linked by predator-prey relationships.
(6) To collect environmental data, and to allow other research: Research vessel surveys are generally conducted 24 hours a day when the vessels are at sea. This presents a superb opportunity to collect environmental infonnation (temperature, salinity, pollution levels, .and so on), and to allow other researchers to 'piggyback' on surveys to collect a host of _data not directly related to the stock assessment. All research vessel surveys conducted by the Northeast Fisheries Science Center collect and archive an extensive array of environmental measurements, and usually have a 'shopping list' of duties to be accomplished for researchers in academic institutions, other government agencies, and the private sector. On every survey there are scientific berths allocated to cooperating scientists and students so as to foster this cooperative approach to marine science.
HADDOCK
COD
YELLOWTAIL
RED HAKE
PLAICE
SILVER HAKE
GOOSEFISH
POLLOCK
WINTER SKATE
lITILE SKATE
THORNY SKATE
BARNDOOR SKATE
SPINY DOGFISH
OTHERS
0
WHAT TYPES OF SURVEYS ARE CONDUCTED?
The various types of research vessel surveys conducted by the Northeast Fisheries Science Center are described below:
(1) Spring and autumn bottom trawl survey: The spring and autumn bottom trawl surveys conducted by the Northeast Fisheries Science Center are the longest running continuous time series of research vessel sampling in the world. The autumn survey was initiated in 1963; the spring in 1968 (Azarovitz 1981). These surveys cover the ocean environment from 5 to 200 fathoms deep, from Cape Hatteras, North Carolina to well beyond the Canadian boarder. About 300 half-
10
Page 33
_ 1963
D 1990
20 30
PERCENT
40 50
hour trawl sets are made at sites ("stations") randomly chosen prior to the beginning of each survey (Figure 10). The objective of each tow is not to catch large numbers of fish, but just a representative sample of the various species and relative numbers ina given area. The distribution of trawling locations is allocated according to a statistical method that divides the region into a riumber of smaller areas (strata) with similar depth characteristics. The method employed is tenned a "stratified-random sampling design," one commonly used for a wide variety of statistical estimation programs, including exit polling for elections. In the history of the trawl surveys, only two research vessels -- NOAA's A lbatross IV and Delaware II -- have been used to conduct these surveys.
A small-mesh cod-end liner (1/2 in. mesh) is used to retain prerecruits.

Page 34
Sl<ltion Locations Fall Bottom Trawl Survey 1990
3S 6S
Figure 10. Distribution of trawl survey locations from the autumn 1990 bottom trawl survey.
NOAA vessel Albatross IV, commissioned in 1963, is the first scientific vessel built by the United States exclusively for fisheries research in the modern era. Albatross I was the first fisheries research vessel built by any government. A steamer, the vessel operated from 1882 until 1920. Albatross /I was a tug, converted by the Navy to a minesweeper in World War I, and then passed on to the fisheries service· for research until 1932. Albatross III was a steam trawler built in 1926 for fishing, used by the Coast Guard as a patrol vessel beginning in 1942, then retrofitted by the Navy for military use during World War ", and finally converted to a research vessel in 1948.
All species in each tow are weighed and counted, and all or a sub-sample is measured to determine the length composition of the catch. Hard parts (scales, ear stones, rm rays) are removed from some of the fish of each species taken in the trawl, and then cataloged. These hard parts are used to detennine the age of each fish selected. The age distribution of the whole catch can then be estimated by expanding the sub-sample. Fish are also examined to detennine sex and state of sexual maturity. Stomach contents are researched and any obvious disease-relat~ conditions of the fish are record~ All data are brought back to the laboratory, where they are subsequently entered into computer files. The accumulated trawl survey data set (1963 to present) represents over 20,000 stations, with millions of individual pieces of infonnation concerning fishery resources of the region. The entire data series is available online to fishery scientists wishing to examine trends in abundance, distribution, species associations, or numerous other scientific questions. (2) Sea scallop dredge survey: Each summer, the Northeast Fisheries Sci-
NMFS phoID by Blends Rgusrfdo

ence Center conducts a research survey directed to the Atlantic sea scallop. This survey is also used to assess abundance, distribution, size/age composition and other factors. The survey encompasses the continental shelf from Cape Hatteras through Georges Bank and the Gulf of Maine. The scallop survey uses the same stratified random survey design as that used in trawl surveys.
Scallop surveys began in 1975, and have been every year since 1977. Since 1979, the standard gear has been an 8 ft-wide commercial scallop dredge equipped with a 2 in. ring bag and a 1-1/2 in. mesh liner. The dredge is towed for 15 minutes. The depths surveyed range from 15 to 60 fathoms. In addition to sea scallops, the surveys catch significant numbers of flounders (primarily yellowtail), hakes, and goosefish. Results from the sea scallop survey have been used in assessing the other species.
(3) Hydraulic dam dredge for surf dam and ocean quahog: Since 1965, the Center has conducted hydraulic clam dredge surveys aimed at resources of surfclam and ocean quahog. The surveys are not conducted every year, since the exploitation rates of these species are low, the time from first appearance in the survey gear until commercial size is attained is long, and fisheries are not generally dependent on the incoming year classes. The current schedule calls for the clam survey to be conducted every third year. The last survey was conducted in 1992.
AS ft -wide hydraulic clam dredge is used on the surveys. The dredge has a submersible electric pump that uses high pressure water jets to loosen substrate and animals in the path of the dredge. The submersible pump allows the surveys to extend to deeper depths than are now commercially exploited, based on standard deck-mounted dredge pumps. The bar spacing of the dredge is such that very small-sized clams are retained in the dredge, along with large quantities ·of shell debris and live clams and associated invertebrates, all of which are included in the
'Page 35
Sorting quahogs and surfclams from dredge haul aboard RN Delaware II.
database. The areas primarily surveyed are from Cape Hatteras to Georges Bank. Additionally, some surveying has occurred in Massachusetts Bay (to evaluate fishery potential for the Arctic surfclam, Mactromeris polynyma) and off the Maine coast to evaluate populations of ocean quahog.
(4) Summer Gulf of Maine trawl survey: Beginning in 1991, the. center has conducted a special bottom trawl survey directed to nearshore areas in the Gulf of Maine. Traditionally, it has proved impractical to survey Maine, New Hampshire, and northern Massachusetts coastal waters with bottom trawls based on random station selections because of large areas of hard, rocky bottom and fixed fishing gear such as lobster pots and .gill nets. Hence, large concentrations of juvenile groundfish occurring inshore have not been adequately included in trawl catches. The survey methods used in
NMFS photo by Brenda Rguerldo
the summer Gulf of Maine survey are a hybrid of the stratified random technique. In spring 1991, Center personnel met with fishennen and others knowledgeable about where towable areas in the Gulf of Maine were located. From these meetings, a master list of towable areas was generated. Based on this list, sites are chosen randomly as the stations to be sampled. This way, expensive and time-consuming gear damage is minimized, but the statistical criteria necessary for the survey are met. Prior to the 1992 survey, we again consulted with Maine fishennen and expanded the master list of potential tows. The survey has generated important new information on the inshore distribution and abundance of groundfish, and has added to the biological data on the timing of spawning for a number of species.
Apart from the new Gulf of Maine survey, a monthly sampling program has been established in conjunction

Page 36
with the Maine Department of Marine Resources to improve the quality of groundfish population biology data.
(5) Winter trawl survey along the continental shelf: Initiated in 1992, a winter trawl survey along the Middle Atlantic, Southern New England and southern Georges Bank continental shelves is specifically directed to improve the quality of flatfish assessments. Standard groundfish surveys . use rollers along the foot rope to minimize gear damage in rough bottoms. Although the roller-rigged gear catches flatfish, many of the animals pass under the foot rope, and thus abundance measures from the survey tend to be . highly variable. The new survey employs a chain sweep (a "flat net") to minimize the escapement of flatfish under the foot rope. Accordingly, abundance indices from the new survey are. likely to provide a more precise assessment tool than that derived from roller-rigged gear. Specifically, the survey will be used to improve assessments for yellowtail and summer floun-
ders. Assessments of other species caught along with these two important flatfish may also be improved.
(6) Marine mammal sighting surveys: Shipboard sighting surveys of marine mammals involve directing the vessel along a predetermined transect, and counting the number of each marine mammal species sighted. The interpretation of the data is complicated by the range and bearing of the sighting from the vessel track line, and the fact that the probability of sighting a mammal falls off with the distance from the vessel. These effects are well known when conducting sighting surveys, and are being evaluated by Center scientists. An intensive survey to estimate the abundance of harbor porpoise in the Gulf of Maine was initiated in 1991. Other sighting surveys have been conducted to evaluate the abundance and distribution of the marine mammal community in coastal shelf waters, and those associated with the. western boundary of the Gulf Stream. Marine mammal sightings are
Bongo nets being set on a 1965 research cruise. NMFS pharo by Robert Brigham
routinely conducted as a "piggy-back" activity on bottom trawl and larval fish survey cruises.
(7) Surveys of flSh eggs and larvae: Surveys of the distribution and abundance of "baby fish" (the free-floating eggs and new hatchlings called larvae) are conducted several times per year to evaluate the timing and distribution of spawning. Another important function of these surveys is to estimate the quantity of baby fished spawned, and thereby work back to the size of the female population that must have been present to produce the numbers of small fish counted. This "back-calculation" of the spawning stock is an important tool used in assessing fish populations worldwide, and in some cases may be the only reliable information about the size of the spawning stock. For North-
east fishes, egg and larval studies have been used to evaluate populations such as Atlantic mackerel, yellowtail flounder, sand lance, and bluefish.
Egg and larval surveys are conducted using a pair of very fine-mesh nets towed in a frame resembling a bongo drum (hence the name "bongo nets"). The nets are pulled with varying amounts of scope on the towing line so the bongo samples from the surface to just off the bottom (all layers of the water column). Contents of the net are preserved at sea for later intensive analysis in the laboratory. These fine-mesh plankton nets also sample the community of free-floating plants and animals that support the base of marine food chains. These animals are also assessed to examine the production and distribution of zooplankton (animals) and phytoplankton (plants).

NMFS photo by Don Fl6scher
Research cruise surveys are the base for NEFSC fishery-independent biological data on fish and shellfish species off the Northeastern United States. Above left, typical trawl haul aboard the RN Albatross IV during the biannual trawl survey. Above right, crew sorts trawl haul. Below, Frank Bailey and Fred Lux measure yellowtail flounder during an Albatross 111 cruise in the mid-1950s. Right, fisherman Joe Ferriera takes two lobster off the top of a haul ready for sorting, Albatross 111, 1960.
NMFS photo by Robert Btighsm
NMFS photo by Brenda Figuerido
Above, Gary Shepherd and Don Flescher sorting scallops on 1992 survey, Delaware 111, Georges Bank, 1991. Right, PatTwohig displays cod caught during Albatross IV cruise off Gloucester, 1969.
Page 37
NMFSphoto
NMFS photo by Robert BrIgham

Page 38
(8) Special experiments. A variety of special one-time-only experiments are conducted to augment the standard monitoring surveys. For example, when vessels or surveying gear have to be changed, it is necessary to estimate; conversion factors accounting for differences in fishing power. Several years ago the standard trawl net doors had to be changed, since fishing gear suppliers could no longer manufacture doors to 1963 specifications. A polyvalent door was chosen for the new standard, and a series of research vessel experiments was conducted to estimate the effect that the door change alone had on catch rates. Similar experiments have been conducted to relate catches between the Albatross IV and the Delaware II.
. Other special experiments using vessel surveys have been directed at evaluating feeding interactions among species, relating oceanographic processes to the survival of eggs and larv~e, and other associated studies.
WHY DO RESEARCH VESSELS SOMETIMES
GO WHERE THERE ARE FEW FISH?
This is a question that often comes up when explaining the theory behind the surveying program. The fundamental objective of the surveys is to provide realistic estimates of the trends in populations over time. By only fishing where fishing is exceptionally good (the "hot spots"), potentially large fractions of the stock that may occur in low-density areas would not be adequately sampled. This would be akin to estimating the population of Massachusetts or New Jersey by counting only people that live in the eastern counties of these states, and extrapolating the rest based on numbers of people-per-square-mile.
By selecting random stations within certain depth zones, any fish that exists in that zone have an equal probability of being caught in the survey. Thus, the method produces estimates of the relative stock size that are
tenned "unbiased." One of the downsides to this procedure is for fish stocks that are highly clumped in their distributions: the "error bars" around the estimates tend to be rather wide. Alternative survey methods that produce more precise "error bars" include a grid of fixed-station locations that are fished each year. However, this design may provide biased abundance measures if changes in the abundance at these locations do not reflect the actual changes in the stock as a whole. Some countries use the stratified random technique, and others use fixedstations (for example the English groundfish survey of the North Sea; ICES 1992). There appear to be no best sampling design to cover all cases. Rather it depends on the particular situation of the species distribution and the number of sampling sites that are included in the survey. Because of the large number of species and stocks analyzed from the bottom trawl surveys, and the different bottom types
and habitats in the Northeast, the stratified random sampling plan appears to be most efficient design.
For more information
Azarovitz, T.R.. 1981. A briefhistorical review of the Woods HoleLaboratory trawl survey time series. In: Doubleday, W.G. and Rivard, D., eds. Bottom trawl surveys. Canadian Special Publication of Fisheries and Aquatic Sciences 58, p. 62-67.
Clark, S. 1981. Use of trawl survey data in assessments. In: Doubleday, W.G. and Rivard, D., eds' Bottom trawl surveys. Canadian Special Publication of Fisheries andAquatic Sciences 58, p. 82"92.
International Council for the ExplorationoftheSea. 1992. Report of the workshop on the analysis of trawl survey data. ICES CM. 1992:D:6.
NMFS photo by Robert Brigham
Scientist Ruth Stoddard and fisherman Tom Fonteiro examine cod on the deck of Albatross IV, 1964, The first women to go to sea on a U.S, government fisheries research boat were famed ecologists Rachel Carson and Marie F, Rodell who were part of the July 1950 survey 01 Georges Bank aboard the Albatross 11/,

Page 39
SPECIES SYNOPSES The synopses of information on
the status of the stocks of the 37 species or groups of species presented in this section are based on commercial and recreational fishery data and on research survey data, as described in the Introduction to this report. The synopses are arranged by major groups of groundfish, flounders, pelagics, elasmobranchs, invertebrates and anadromous species. Each synopsis briefly reviews the biology of the animals and the general nature of the fishery, summarizes recent catch statistics and reo, search survey results, indicates the general status of the target stocks, and where possible, predicts future stock status for possible developments within the fishery.
For each stock or species a sum-. mary table l of catch statistics is included, along with one or more graphs showing how landings and, stock abundance have varied over time. The measures of stock abundance used include trawl survey catch per tow, estimated stock biomass from virtual population analyses, and catch per unit of fishing effort.
Indices of abundance from NEFSC research vessel bottom trawl surveys were fit to a time series model (autoregressive integrated moving average (ARIMA) (Box and Jenkins, 1976,Fogartyetal. 1988,NEFC 1988, Pennington, 1985; 1986). The approach was based on the concept that the biomass of multi-age class.stocks
I The lables and figures in this section are labeled using decimal notation by species and by table or figure within species. For example, Figure 7.3 indicates the third figure ror the seventh species synopsis, yellowtail nounder.
would not be expected to change radically from year to year without the identification of a reasonable causative agent. The objective of using the ARIMA model was to filter the effects of measurement error (random withinsurvey variation) in the survey abundance indices from 'true' variation in population levels and therefore provide better estimates of population trends. Abundance indices from special surveys such as the NEFSC scallop and clam surveys, and the Massachusetts Division of Marine Fisheries bottom trawl survey were not modeled due primarily to the short duration of these time series.
References in the text to catches or indices of abundance are usually to values given in these tables and figures, although some summary statistics are given in the text for different areas, fishing gears, or data sources which are not in the tables and figures.
Catch statistics in the tables are given in thousands of metric tons, rounded to the nearest one hundred metric tons; values less than 100 mt are indicated as <0.1. Values quoted in the text are also usually rounded to the nearest 100 mt when greater than that value, and are rounded to the nearest 10 mt when less. Values smaller than 10 mt are indicated by a dash. Values which are not yet available are indicated by N/ A.
Many of the assessments reported on here are described in NEFSC Ref-
o
erence Documents at the Northeast Fisheries Science Center, which may be obtained upon request. The most recent complete assessment for each stock is cited. Additionally, in recent years the NEFSC has reviewed assessments of selected species-stocks in semi-annual workshops. The reports of those workshops are cited in the species synopses sections for those species which have been reviewed.
For further information
Box, G.E.P., and G. Jenkins. 1976. Time series analysis: forecasting and control. Rev. ed. San Francisco: Holden-Day.
Fogarty,M.J.,J.S.ldoine,F.P.Almeida and M. Pennington. 1986. Model-. ling trends in abundance based on research vessel surveys. Int. Comm. Explor. Seas. CM. 1986/G:92.
Northeast Fisheries Center. 1988. An evaluation of the bottom trawl survey program of the Northeast Fisheries Center. NOAA Tech. Memo. NMFS-FfNEC-52.
Pennington, M. 1985. Estimating the relative abundance of fish from a series of trawl surveys. Biometrics. 41:197-202.
Pennington, M. 1986. Somestatistical techniques for estimating abundance indices from trawl surveys. Fish. Bull. U.S. 84:519-526.


The Atlantic cod, Gadus morhua, is a demersal gadoid species distributed in the Northwest Atlantic-from Greenland to North Carolina. Cod are omnivorous feeders and commonly attain lengths up to 130 cm (51 in.) and weights up to 25 to 35 kg (55 to 77 Ib). Maximum age is in excess of 20 years, although young fish (ages 2 to 5) generally comprise the bulk of the catch. Sexual maturity is attained between ages 2 to 4; spawning occurs during winter and early spring.
In U.S. waters, cod are assessed as two stocks: Gulf of Maine, and Georges Bank and Southward. Importantcommercial and recreational fisheries occur in both. The commercial fisheries are conducted year-round with otter trawls and gill nets as primary gear. Recreational fishing also occurs yearround; peak activity occurs during the late summer in the lower Gulf of Maine, and during late autumn to early spring from Massachusetts southward.
U.S. commercial and recreational fisheries for cod are managed under the New England Fishery Management Council's (NEFMC's) Multispecies Fishery Management Plan (FMP). Total commercial cod landings from the Georges Bank and Gulf of Maine stocks in 1991 were 55,400 mt, down 4 percent from 57,700 mt in 1990. U.S. commercial landings in 1991 totaled 42,000 mt, 3 percent less than in 1990 (43,300 mt), but still the second-highest total during the last seven years.
Gulf of Maine
Total nominal commercial catch (exclusively United States) in 1991 was 17,800 mt, a record-high, and 17 percent greater than in 1990 (15,200 mt).
U.S. otter trawl fishing effort (nominal days fished), which accounted for 74 percent (the highest proportion since 1970) of the 1991 landings, was 12 percent higher in
Page 41
Atlantic Cod
Ken Honey and Peter Henderson with whale cod, R'/V Albatross IV, June 1966
1991 than in 1990 and the fourthhighest ever. U.S. commercial CPUE (catch-per-day-fished for all trips catching cod) increased in 1991 to its highest level since 1977. Directed trips, which accounted for between
~ 15 and 67 percent of the annual U.S. otter trawl catch during 1984-1990, accounted for a record-high 71 percent of the 1991 total.
Fishery age-composition data indicate that commercial landings in 1991 were dominated by the 1987 year class; this cohort accounted for 64 percent of the landings by number and 59 percent by weight. The 1986 and 1988 year classes were also important, together accounting for 27 percent ofthe 1991 landings by number and 28 percent by weight.
NMFS research vessel weight-
NMFS photo by Gareth Coffin
per-tow indices declined in both the spring and autumn 1991 surveys, but markedly increased in the spring 1992 survey. Survey catch-at-age data indicate that the strong 1987 year class dominates the stock and that recruitment since 1988 has either been average or below-average.
Fishing mortality in 1991 remained at the same level as in 1990 (F = 0.94). Fishing mortality in 1991 was far beyond F max (F=0.27) and well in excess of the F needed to attain 20 percent maximum spawning potential (F
20% = 0.40),
the management target established for this stock. As such, the stock continues to be overfished.
Spawning stock biomass peaked in 1991 at 30,000 mt due to full recruitmentofthestrong 1987 year class to the spawning stock. However, SSB de-
I Preceding page blank!

Page 42
"At the current level of fishing mortality, com. merciallandings are expected to decline
below 14,000 mt in 1992 and may drop below
12,000 mt in 1993."
c1ined in 1992 (to about 23,000 mt) and will decline further in 1993 as the 1987 cohort is fished down and the much weaker 1988-1990 year classes recruit to the spawning stock.
At the current level of fishing mortality, commercial landings are expected to decline below 14,000 mt in 1992 and may drop below 12,OOOmt in 1993. By 1994, the 1987 year class will no longer be a major component of the stock. To halt the declining trend in SSB, fi~hing mortality needs to be .markedly reduced.
Georges Bank and Areas . to the South
Total nominal commercial catch (United States and Canada) in 1991 was 37,600 mt, 12 percent less than in 1990 (42,500 mt). The 1991 U.S. catch (24,200 mt) was the lowest since 1987, and below the 1977-1990 annual average of 29,000 mt. Canadian 1991 landings totaled 13,400 mt, 6 percent lower than in 1990, but still the fourth highest on record.
Nominal U.S. commercial fishing effort declined by 4 percent in 1991 but was still only slightly less (-6 percent) than the record-high 1988 level. U.S. commercial CPUE declined by lO percent in 1991.
Commercial landings in 1991 were dominated by the good 1987 and strong 1988 year classes. Together, these two cohorts accounted for 60 percent of the catch by number and 54 percent by weight.
NMFS research vessel survey indices in 1991 and in spring 1992 were among the lowest in the survey timeseries, and indicated that the abundance of older animals (ages 5+) had sharply declined. In contrast, the sur-
Atlantic Cod Gulf of Maine
30~--------------------------------------~,~
25
\. , ,
I
I, I ,
'tii' b 20 o
SPAWNING ~ \
B VJ
STOCK -\ . BIOMASS \
Z 15 ~ U 5: t:i 10 ~
5
0 62 64 66 68 70 72 74
\
76 78 80 82 84 86 88 90 92 YEAR
Table 1.1 RecrUtional catches and cornrnerciallandings (thousand metric tons)
Year Category 1972-81 1982 1983 1984 1985 1986 1987 1988 1989 1990 1991
Average
u.s. recreational 5.1' 2.9 2.6 2.7 3.0 2.4 2.6 3.0 4.2 3.5 2.5 Corrunercial
United Slates 10.2 13.6 14.0 1O.B 10.7 9.7 7.5 B.O 10.4 15.2 17.B Canada <0.1 Other <0.1 -
Total nominal catch 15.3 16.5 16.6 13.5 13.7 12.1 10.1 11.0 14.6 IB.7 20.3
I 1979-1981.
Gulf of Maine Atlantic Cod
},
Long-term potential catch SSB for long-term potential catch Importance of recreational fishery Management Status of exploitation Age at 50% maturity
" Size at 50% maturity ;;~: 1· Assessment level :::~
Overfishing definition Fishing mortality rate corresponding
to overfishing definition
FO•I = 0.16 F = 0.27 IIIU
M=0.20
lO,OOO mt 30,000 t
Major Multispecies FMP
Overexploited 2.3 years, males
2.1 years, females 36 cm (14.2 in.) males
32 cm (12.6 in.) females Age structured
20% MSP
F20l' = 0.40
F20 .. = 0.40 FI991 = 0.94

'The 1991 u.s. catch (24,200 mt) was the
lowest since 1987, and below the 1977-1990
annual average of 29,000 mt."
vey results suggest that recent recruitment has been good; both the 1990 and 1991 year classes currently appear to be above-average in strength.
Spawning stock biomass increased from 55,000 to 74,000 mt between 1985-1990 due to the strong 1983, 1985, and 1988 year classes entering the spawning stock. Subsequently, however, SSB has declined to less than 65,000 mt.
Fishing mortality in 1990 was estimated from VPA to be F=O.72. Although an updated VPA for 1991 has not yet been conducted, the most recent survey and commercial data suggest that fishing mortality in 1991 was probably as high as in 1990. As such, current F would still be more than twice as large as F ~ (F=0.30) and well in excess of the F needed to attain 20 percent maximum spawning potential (F
20% = 0.36), the management tar
get established for this stock. In this context, the stock remains overfished.
For further information
Serchuk, P.M. and S.E. Wigley. 1991. Assessment and management of the Georges Bank cod fishery. Northwest Atlantic Fisheries Organization (NAFO) SCR Doc. 91/107.
Northeast Fisheries Science Center. 1991. Report of the 12th Northeast Regional Stock Assessment Workshop (12th SAW). NEFSC Reference Document 91-03. Available from: NOAAjNMFS, Northeast Fisheries Science Center, Woods Hole, MA 02543.
Northeast Fisheries Science Center. 1992. Report of the 13th Northeast Regional Stock Assessment Workshop (13th SAW). NEFSC Reference Document 92-02.
Page 43
100
90
80
'Vi' 70 0 0 ,Q. 60
V1 Z 50 ~ U 40 0:: t-W ::2: 30
20
10
0
Atlantic Cod Georges Bank and South
SPAWNING ~ \
~~~:SS -----... I ' ' \ I \
COMMERCIAL LANDINGS ----..
, \ ,
\ ,
\ ,
62 64 66 68 70 72 74 76 78 80 82 84 86 88 90 92
YEAR Table 1.2 Recreational catches and commercial landings (thousand metric tons)
Category 1972-81 1982 1983 1984 Average
U.S. recreational 1.9' 5.3 4.9 2.4 Commercial
United States 23.3 39.4 36.8 32.9 Canada 4.9 17.8 12.1 5.8 Other 3.6
Total nominal catch 33.7 62.5 53.8 41.1
1 1979-1981.
Long-term potential catch SSB for long-term potential catch Importance of recreational fishery Management Status of exploitation Age at 50% maturity
Size at 50% maturity
Overfishing definition
1985
4.6
26.8 10.5
41.9
Fishering mortality rate corresponding to overfishing definition
FO•I = 0.16 F = 0.27 IDIlll
Year 1986 1987 1988 1989 1990
1.1
17.5 8.4
27.0
1.2 4.3 1.9 1.7
19.0 26.3 25.1 28.2 11.9 12.9 8.0 14.3
32.1 43.5 35.0 44.2
35,OOOmt 105,000 t
Major Multispecies FMP
Overexploited 1.9 years, males
1.7 years, females 41 cm (16.1 in.) males
39 cm (15.4 in.) females Age structured
20% MSP
F20% = 0.30
1991
1.3
24.2 13.4
38.9
F10'.l\ = 0.30 FI991 = 0.71

Page 44
Haddock The haddock, Melanogrammus
aeglefinus, a demersal gadoid species, is distributed on both sides of the North Atlantic. In the western AGiilltic, haddock range from West Greenland to Cape Hatteras. Highest concentrations off the U.S. coast occur on the northern and eastern section of Georges Bank and in the southwestern Gulf of Maine. Two stocks occur in U.S. waters; these are termed the Gulf of Maine stock and the Georges Bank stock. Haddock are most common at depths of 45 to 135 m (25 to 75 fathoms) and temperatures of 2° to 10"C (36° to 500 P). Adult haddock on Georges Bank appear to be relatively sedentary, but seasonal coastal movements occur in the western Gulf of Maine. Haddock prey primarily on small invertebrates, but fish are also consumed by adult haddock.
The growth rate of haddock has changed substantially over the past 30 to 40 years, possibly in response to changes in abundance. Prior to 1960, when haddock were considerably more abundant than at present, the average length of an age 4 fish was approxi
.mately 48 to 50 cm (19 to 20 in.). Presently, growth is more rapid with haddock reaching this size at age 3. Changes in sexual maturation have· also been observed during the past three decades. During the early 1960s, all females age 4 and older were fully mature, and approximately three-quarters of age 3 females were mature. In recent years, the maturation schedule has shifted by about one year; currently nearly all age 3 and three-quarters of the age 2 female haddock are mature. Although the presence of early maturing fish increases spawning stock biomass, it is uncertain if these younger fish are spawning successfully or producing eggs of sufficient quality to contribute strongly to the reproductive success of the population. Spawning occurs between January and June, with peak activity during late March and
early April. Individual females may produce up to 3 million eggs, but a 55 cm (22 in.) individual produces approximately 850,000 eggs. Major spawning concentrations occur on eastern Georges Bank, although some spawning also occurs to the east of Nantucket Shoals and along the Maine coast. Juvenile haddock remain pelagic for several months before settling to the bottom.
The principal commercial fishing gear used to catch haddock is the otter trawl. Recreational catches are insig-
"nificant. Fishing is managed under the New England Fishery Management Councils Multispecies Fishery Management Plan (FMP). In the PMP, overfishing for haddock is defined to occur when fishing mortality results in a spawning potential that is 30 percent or less of the spawning potential in the absence of fishing. For the present growth rate and maturation schedule, this fishing mortality rate is 0.40. Currently, the primary management measures include a 48 cm (19 in.) minimum size, 140 mm (5 1/2 in.) minimum mesh size across most of the fishing grounds for haddock, and two areas closed to fishing from February through the end of May. Total landings (United States and Canada) in
NMFS photo by Brenda Ftguerido
1991 were 7,3OOmt, 28 percent higher than 1990 (5,700 mt). U.S. landings declined, from 2,400 mt in 1990 to 1,800 mt in 1991, only slightly higher than the record-low 1,700 mt landed in 1989.
Gulf of Maine
Landings of Gulf of Maine had-. dock declined from about 5,000 mt annually in the mid-1960s to less than 1,000 mt in 1973. Total annual landings increased sharply between 1974 and 1980, and averaged 7,000 mt during 1980-83. Subsequently, catches have declined markedly to record-low levels (3OOmt in 1989; 400mt in 1990 and 1991). Recreational catches have also declined and have been at insignificant levels since 1981. Virtually all catches from this stock are now taken in the U.S. fishery.
Spring and autumn NEPSC survey abundance. indices (adjusted for changes in survey gear) have declined sharply during the past decade. From 1983 to 1990, the autumn survey index fell from 3.48 kg/tow to 0.46 kg/tow. In 1991 the fall survey index dropped even further to O. 18 kg/tow. Likewise, the spring survey index has fallen dramatically; from 3.57 in 1983 to 0.07 in

'This stock is severely depleted and is at an alltime low in abundance."
1991. Survey catch-at-age data indicate that recruitment has been poor since 1982.
The 95 percent decline in landings observed from 1983 to 1991 (7,600mt to 400 mt) and equal decline in the fall research index (3.48 kg/tow to 0.18 kg/tow) are indicative of the status of this stock This stock is severely depleted and is at an all-time low in abundance. Recruitment has been insufficient to support the current level of landings, resulting in continued overfishing and further stock depletion. Preliminary estimates of fishing mortality on this stock are greater than F30%" Spawning stock biomass is below maintenance level and is likely to remain so in the near future.
Georges Bank
Landings of Georges Bank haddock increased from about 50,000 mt annually prior to 1965 to nearly triple that amount in 1965 and 1966 due to intense fishing by the distant-water fleets. Following the high levels of landings during the mid-1960s, landings declined through 1976. Catches increased between 1977 and 1980, reaching about 28,000 mt, but catches declined after 1980, dropping to 4,500 mt in 1989. Landings since 1989 have increased roughly 20 percent per year, reaching 6,800 mt in 1991. In 1990, the increase was mainly due to higher U.S. landings (1,450mtin 1989;2,000 mtin 1990). U.S. landings declined to a record-low 1,400 mt in 1991, but were offset by higher Canadian landings (3,300 mt in 1990; 5,500 mt in 1991).
The NEFSC spring and autumn bottom-trawl survey results have indicated a marked decline in the biomass of haddock since the mid- to late 1970s. The 1991 autumn survey index (0.94 kg per tow) is the lowest in the time series, less than half the previous mini-
Haddock Gulf of Maine
Page 45
8~----------------------------------------T40
6
"iii' b 0 .e.. Vl z 4 ~ 0 1l:: I-LU ~
2
j\ "' .. ,.
··.~./oi"~.~
'-'''''''' '~ . ..
,-,.
£ .303
o .~ o \ct
20 0 z L5 ~
o w c;:
10 ~ a::: !n
o 0 62 64 66 68 70 n 74 76 78 80 82 84 86 88 90 92
YEAR
Table 2.1 Recreational catches and conunerciallandings (thousand metric tons)
Category 1972-81 1982 1983 1984 Average
U.S. recreational <0.1 <0.1 <0.1 Conunercial
United States 3.1 5.6 5.6 2.8 Canada 0.2 1.1 2.0 1.2 Other
Total nominal catch 3.3 6.7 7.6 4.0
Long-term potential catch SSB for long-term potential catch Importance of recreational fishery Management Status of exploitation Age at 50% maturity
Overfishing definition Fishing mortality rate corresponding
to overfishing definition
M =0.20 Fo.1 = 0.24
Year 1985 1986 1987
<0.1 <0.1
2.2 1.6 0.8 0.8 0.2 0.2
3.0 1.8 1.0
1988 1989 1990 1991
<0.1 <0.1 <0.1 <0.1
0.4 0.3 0.4 0.1
0.5 0.3 0.4
5,000 mt Unknown
Insignificant Multispecies FMP
Overexploited 1.8 years, females
2.1 years, males 35 cm (14 in.)
Yield-per-recruit 30% MSP
0.40
0.4
0.4

Page 46
"Abundance and biomass are at aU-time lows, approximately 17 million
fish with a biomass of 22,500 mt."
mum in 1987 (2.56 kg per tow). Population estimates derived from virtual population analysis (VP A) indicate that this stock is severely depleted. Abundance and biomass are at all -time lows, approximately 17 million fish with a biomass of 22,500 mt. This is in contrast to abundance during 1979 (for example) when there was an estimated 132 million haddock with a biomass of 113,600mt. During the 1980s,recruitment was poor; the 1989 and 1990 year classes continued this trend, each with roughly 4 million age 1 fish. Fishing mortality on age 4 and older haddock in 1990 was estimated at 0.51, the highest value since 1968. From 1980 to the present, fishing mortality has averaged 0.40; a value at or above F :lO'J:
Population projections suggest that if recruitment and fishing mortality remain at current levels the abundance and biomass of this stock will continue to decline. Because of the low level of spawning stock biomass relatively poor recruitment is expected, perpetuating the severely depleted condition of this stock. Landings in 1992 are expected to remain near the record-low level of recent years.
For further information
Clark, S.H., W.l. Overholtz, and R.c. Hennemuth. 1982. Review and assessment of the Georges Bank and Gulf of Maine haddock fishery. J. Northw. Arl. Fish. Sci. 3: 1-27.
NEFSC. 1992. Report of the 13th Northeast Regional Stock Assessment Workshop (13th SAW). NEFSC Reference Document 92-02.
Overholtz, W.J., S.H. Clark, and D.Y. White. 1983. A review of the status of the Georges Bank and Gulf of Maine haddock stocks for 1983. Woods Hole Laboratory Reference Document 83-23.
Haddock Georges Bank
200.-------~----------------------------------r70
150
"iii' b 0 B U1 Z 100 ~ u EE I-W :::!:
50
,~ AUTUMN f % ___ SURVEY j ~ INDEX
/ \ 60~
50 ~ ~ U
40 '<i: u Z
30 L5 ~
o w 20 G:
~ 0:::
10 tIi
o a' 62 64 66 68 70 72 74 76 78 80 82 84 86 88 90 92
YEAR
Table 2.2 Recreational catches and cormnerciallandings (thousand metric tons)
Yellr Category 1972-81 1982 1983 1984 1985 1986 1987 1988 1989 1990 1991
Average
U.S. recreational <0.1 <0.1 <0.1 <0.1 Commercial
United States 8.7 12.6 8.7 8.8 4.3 3.3 2.2 2.5 1.4 2.0 1.4 Canada 3.9 5.6 3.2 1.4 3.5 3.4 4.1 5.9' 3.1 3.3 5.5 Other 0.4
Total nominal catch 13.0 18.2 11.9 10.2 7.8 6.7 6.3 8.41 4.5 5.3 6.9
1 Suspected of being roughly 2,000 mt too high due to misreporting.
Georges Bank Haddock
li[ =::~ ~:;'~tion iii Fishing mortality rate corresponding
to overfishing definition
M= 0.20 Fo.1 = 0.24
47,OOOmt 131,OOOmt
Insignificant Multispecies FMP
Overexploited 1.5 years (females)
1.3 years (males) 30 em (12 in.) females
27 cm (11 in.) males Age structured
30% MSP
0.40
FlO ... = 0.40 FI991 = 0.51

Redfish or ocean perch, Sebastes, spp., are distributed throughout the North Atlantic from the coast of Norway to Georges Bank. Off New England, Sebastes !asciatus are most common in deep waters of the Gulf of Maine to depths of 300 m (975 ft). Redfish are slow growing, long-lived animals with an extremely low natural mortality rate. Ages in excess of 50 years and maximum sizes of 45 to 50 cm (18 to 20 in.) have been noted. In the Gulf of Maine, redfish reach maturity in about 5 to 6 years at an average length of 20 to 23 cm (8 to 9 in.). Females are viviparous, retaining eggs in the ovary after fertilization until yolk-sac absorption. Mating takes place in autumn, with subsequent larval extrusion occurring the following spring and summer.
The principal commercial fishing gear used to catch redfish is the otter trawl. Recreational catches are insignificant. Fishing is managed under the New England Fishery Management Council's Multispecies FMP. The total nominal catch declined between 1990 and 1991 from 600 mt to 500 mt.
During the development phase of the Gulf of Maine fishery, U.S. nomi- _ nal catches rapidly rose to a peak level of about 60,000 mt in 1942 followed by a gradual decline. Nominal catches in recent years increased from approximately 10,000 to 11,000 mt during 1974-1976toapproximately 14,000 to 15,000 mt in 1978-79. In 1989 and 1990, however, catches declined to 600 mt, and further declined to 530 mt in 1991, the lowest animal figures since the directed fishery commenced in the early 1930s. In the past 20 years, only two strong year classes, those produced in 1971 and 1978, have recruited to this fishery. However, length composition data from bottom trawl surveys suggest that one or more moderately- strong year classes produced in the mid-1980s will recruit to the fishery during the early 1990s.
The standardized catch-per-uniteffort (CPUE) index declined from 6.1 mt/day in 1968 to approximately-2.4 mt/day between 1975 and 1978, and to less than 1.0 mt/day since 1987. The NEFSC autumn survey biomass index declined from 40.4 kg/tow in 1968 to an average of 3.8 kgltow during 1982-84. Although the 1986 autumn index increased to 8.0 kgltow, estimates for 1987-89 have averaged only 6.2 kg! tow. The 1990 and 1991 autumn biomass indices of 12.2 and 10.0 kg/tow, respectively, were the highest since the early 1980s, but are still well below the average of the 1960s and early 1970s. However, the increased biomass in 1990 and 1991 is consistent with incremental increases in survey abundance indices (mean number-pertow) noted during the past two to three years, and reflects accumulated recruitment and growth of one or rnore recent year classes whose strength is likely to be greater than the 1980s average.
Estimates of exploitable biomass (ages 5 and older) from virtual population analysis declined by 75 percent, from 136,000 mt in 1969 to 32,000 mt in 1985. Projections are not available
Page 47
Redfish
NMFS photo by Brenda F"lguerldo
for 1991 because the virtualpopulation analysis was discontinued in 1986. Average fishing mortality during the 1970s was slightly greater than F max (0. 14) and twice the FO_l (0.07) level. In addition, the combination of declining overall stock size and increased fishing effort on the 1971 year class produced fishing mortality rates that were 50 percent greater than F and three times FOI in the late 197~. Fishing mortality has likely declined in recent years to a point less than or equal to F
, . 0.1
_ and well below Fmax. Equilibrium sur-plus production models have indicated that the long-tenn potential catch is about 14,000 mt.Given the current low population abundance and poor recruitment during most -of the 1980s, surplus production in the near future will remain considerably less than that, as indicated by the continued decline in nominal catches.
The extremely low 1991 landings level continues a trend evident since 1980, reflecting a decreasing level of fishing mortality. Given the present pattern of exploitation, the fishery remains extremely dependent on recruitment. Recruitment has been poor since

Page 48
Redfish Gulf of Maine-Georges Bank
70 ~-------------------------------------r60
60
'Vi' 50 b 0 B 40 If) Z
~ U 30 0:: f-W ~ 20
10
1 AUTUMN ~ ....---- SURVEY ~.....-- INDEX
,-... 50 .E ~ o
40~ I
~ < 30 U
Z j ~
20 8 G:
~ 0:::
10 tii
~~~~~~~~~~~~~~~~~~~~~TO 36 40 44 48 52 56 60 64 68 72 76 80 84 88 92
YEAR
Table 3.1 Recreational catches and conunerciallandings (thousand metric tons)
Year Cateogry 1972-81 1982 1983 1984 1985 1986 1987 1988 1989 1990 1991
Average
U.S. recreational Conunercial
United States 11.3 6.6 5.2 4.7 Canada 0.1 0.2 0.1 0.1 Other 1.5
Total nominal catch 12.9 6.8 5.3 4.8
Long-tenn potential catch SSB for long-tenn potential catch Importance of recreational fishery Management Status of exploitation Age at 50% maturity Size at 50% maturity
Assessment level Overfishing definition Fishing mortality rate corresponding
to overfishing definition
M=O.OS Fo.l = 0.07
4.2 2.9 1.9 0.1 0.1 0.1
4.3 3.0 2.0
F""", = 0.14
1.1 0.6 0.6 0.5 0.1 <0.1 <0.1 <0.01
1.2 0.6 0.6 . 0.5
14,OOOmt Unknown
Insignificant Multispecies FMP
Overexploited 5 to 6 years . 20 to 23 cm
(7.9 to 9.0 in.} Yield-per-recruit
20% MSP
0.12
"Despite the low levels of catch seen in recent years, stock biomass
remains low."
1971, except for the moderate 1978 year class and recent indications of some modest recruitment from the mid-1980s. Despite the low levels of catch seen in recent years, stock biomass remains low. Unless recruitment impro.ves, biomass and yield are net expected to. increase substantially; the population remains o.verexploited.
For further information
Mayo., R. K. 1980. Explo.itatio.n of redfish, Sebastes marin us (L.), in the Gulf of Maine-Georges Bank region, with particular reference to. the 1971 year class. J. North. Atl. Fish. Sci. 1:21-38.
Mayo, R. K., U. B. Oozier, and S. H. Clark. 1983. An assessment o.f the redfish, Sebastesfasciatus, stock in the Gulf of Maine - Georges Bank region. Woods- Hole Laboratory Reference Document 83-22. Available from: NOAA/NMFS, Northeast Fisheries Science Center, Woods Hole, MA 02543.
Mayo, R.K. 1987. Recent exploitation patterns and future stock rebuilding strategies for Acadian redfish, Sebastes fasciatus Sto.rer, in the Gulf of Maine-Georges Bank region of the Northwest Atlantic. Melteff, Brenda R., coordinator. Proceedings of the International Rockfish Symposium; Anchorage, AK, October 20-22, 1986. Fairbanks, AK: University of Alaska Sea Grant College Program. Alaska Sea Grant Report 87-2, p. 335-353.
Northeast Fisheries Center. 1986. Report of the Second NEFC Stock Assessment Workshop. Woods-Hole Laboratory Reference Document86-09. Available from: NOAA/NMFS,
. Northeast Fisheries Science Center, Woods Hole, MA 02543.

The silver hake or whiting, Merluccius bilinearis, is a widely distributed, slender, swiftly swimming fish with a range extending from Newfoundland to South Carolina. Silver hake are important predators and concentrate in response to seasonal variations in hydrographic conditions, food availability, and spawning requirements. In U.S. waters, two stocks have been identified based on morphologicaJ. differences; one extends from the Gulf of Maine to northern Georges Bank, and the second occurs from southern Georges Bank to the midAtlantic area. Migration is extensive, with overwintering in the deeper waters of the Gulf of Maine for the northern stock and along the outer continental shelf and slope for the southern stock. Silver hake move toward shallow water in the spring, spawn during the late spring and early summer, and return to the wintering areas in the autumn. Peak spawning occurs earlier in the southern stock area (May and June) than in the northern stock area (July and August).
Major spawning areas include the coastal region of the Gulf of Maine from Cape Cod to Grand Manan Island, southe'rn and southeastern Georges Bank, and the Southern New England area south of MarthasVineyard. More than 50 percent of age 2 fish (20 to 30 cm, 8 to 12 in.), and nearly all age 3 fish (25 to 35 cm, 10 to 14 in.) are sexually mature. Silver hake grow to a maximum length of around 65 em. Ages up to 15 years have been reported, but few fish older than age 6 have been observed in recent years. Instantaneous natural mortality is assumed to be 0.4.
The otter trawl is the principal gear used in the commercial fishery and the recreational fishery is insignificant. The commercial fishery is currently managed under the New England Fishery Management Council's Multispecies FMP. Total nominal catches decreased by 18 percent in
Page 49
Silver Hake
1991 (20,200 to 16,600 mt).
Gulf of Maine-Northern Georges Bank
Following the introduction of distant-water fleets in 1962, total landings increased rapidly to a peak of 94,5OOmt in 1964, dropped sharply in 1965, and declined for 13 years, reaching the lowest level in the series (3,400 mt) in 1979. Prior to the inception of the MFCMA, distant-water fleet landings averaged about 49 percent of the total. Activity by distant-water fleets diminished after 1977.
Landings increased slightly dur-
NMFS photo by Brenda Flguerldo
ing the early 1980s and have averaged 6,600 mt since 1985. Commercial landings were 6,100 mt in 1991.
The NEFSC autumn bottom-trawl survey biomass index declined during the 1960s, reaching a minimum in 1968-69. With the appearance of the strong 1973 and 1974 year classes, biomass indices increased during the mid-1970s, declined thereafter through 1981, and have generally increased
, (with fluctuation) ·over the past decade.
Fishing mortality rates (F) for fully recruited fish fluctuated in the range 0,38 to 1.1 during the period 1973 to 1982; and generally increased from 1982 (0.45) through 1988 (0,70).

Page 50
'Total nominal catches decreased by
18 percent in 1991 (20,200 to 16,600 mt) ...
Although bottom-trawl survey indices suggest silver hake biomass over the past 15 years has remained at or above levels observed prior to 1975, results from the VPA show a significant decline (through 1986) in stock biomass levels compared to the pre-1975 period, despite the rather low leveloflandings. Until these inconsistencies are resolved, the precise level of exploitation remains uncertain. However, since it is not likely that F will decline substantially below the 0.4 to 0.5 range in the near future, and given the rapid removal of recruits from the stock in recent years, it appears that this stock cannot support increased fishing and must be considered fully exploited.
Southern Georges Bank -Middle Atlantic
Following the introduction of distant-water fleets in 1962, total landings increased rapidly to a peak of 307,100 mt in 1965, declined sharply through 1970, and increased to a secondary peak of 109,900 mt in 1974. Landings declined thereafter and have remained below 15,OOOmtsince 1980. Prior to inception of the MFCMA, distant -water fleet landings comprised about 87 percent of total commercial landings. Catches by distant-water fleets were taken primarily as bycatch in the squid fishery during the early and mid-1980s, but this bycatch has been insignificant since 1987. In 1991, commercial landings were 10,500 mt. Recreational landings are insi gnificant since 1986.
Mter dropping sharply throughout the 19605, the NEFSC autumn trawl survey index has fluctuated without major trend. However, afterreaching a minor apogee in 1985, the index declined continuously, reaching a record low in 1991.
Silver Hake Gulf of Maine-Northern Georges Bank
100.-----------------------------------------~30
'Vi' b a
80
S 60
Vl Z
~ U cr f--W ~
40
20
O~_r~~~~,_~~~~~~~~~~~ __ ~~O 59 61 63 65 67 69 71 73 75 77 79 81 83 85 87 89 91
YEAR
Table 4.1· Recreational catches and commercial landings (thousand metric tons)
Year Category 1971-81 1982 1983 1984 1985 1986 1987 1988 1989 1990 1991·
Average
U.S. recreational Commercial
United States 9.1 4.7 5.3 8.3 Canada Other 7.8
Total nominal catch 16.9 4.7 5.3 8.3
Long-tenn potential catch SSB for long-tenn potential catch Importance of recreational fishery Management Status of exploitation Age at 50% maturity Size at 50% maturity
AsseSsment level Overfishing definition Fishing mortality rate corresponding
to overfishing definition
M = 0.40 Fo.l = 0.44
8.3 8.5
8.3 8.5
5.7 6.8 4.6 6.4 6.1
5.7 6.8 4.6 6.4 6.1
Unknown Unknown
Insignificant Multispecies FMP
Fully exploited 2 years
22.3 cm (8.8 in.) males 23.1 cm (9.1 in.) females
Age structured 31% MSP
0.51

" ... given the rapid removal of recruits from
the stock in recent years, it appears this stock
cannot support increased fishing and must be considered fully exploited."
Before introduction of the distantwater fleet, fishing mortality (F) was relatively low, ranging from 0.09 to 0.41 (average = 0.24) between 1955 and 1962. With increased fishing effort on the stock beginning in 1963, F rose rapidly and reached 0.98 by 1965. Since passage of the MFCMA in 1977, F has averaged 0.82. Increased landings in 1989 and 1990, coupled with relatively low survey biomass indices suggest that F may have increased somewhat above the 1988 level: VPA estimates of spawning stock biomass have decreased steadily since 1973, and in the late 19805 were only about 10 percent of the biomass estimates for the rnid-19705. In contrast, bottomtrawl survey results indicate that the silver hake biomass has remained fairly constant since the late 19605. Until these inconsistencies are resolved, the status of exploitation remains uncertain. It seems unlikely that F will decline below 0.3 to 0.4 in the near future, and given the rapid removal of recruits from the stock in recent years, it appears this .stock cannot support increased fishing and must be considered fully exploited.
For further information
Almeida, F. P. 1987. Status of silver hake resources of the northeast coast of the United States - 1987. Woods" Hole lAboratory Reference Document87-03. Availablefrom:NOAA/ NMFS, Northeast Fisheries Science Center, Woods Hole, MA 02543.
Northeast Fisheries Science Center. 1990. Report of the 11th NEFC Stock Assessment Workshop. NEFSC Reference Document90-09. Available from: NOAA/NMFS, Northeast Fisheries Science Center, Woods Hole, MA 02543.
Page 51
Silver Hake Southern Georges Bank-Middle Atlantic
~0,-------------------------------------------r5
300
'iii" 250 0 0 S 200 V"l Z ~ U 150 a:: f-LU ::::E 100
50
0 61 63 65 67 69 71 73 75 77 79 81 83 85 87 89 91
YEAR
Table 4.2 Recreational catches and commercial landings (thousand metric tons)
Category 1972-81 1982 1983 1984 Average
U.S. recreational 0.6 0.3 <0.1 <0.1 Commercial
United States 9.4 11.9 11.5 12.7 Canada Other 48.4 2.4 0.6 0.4
Total nominal calch 58.4 14.6 12.1 13.1
Long-term potential catch SSB for long-term potential catch Importance of recreational fishery Management Status of exploitation Age at 50% maturity Size at 50% maturity
Assessment level Overfishing definition fishing mortality rate corresponding
to overfishing definition
M=0.40 Fo.1 = 0.35
1985
<0.1
11.8
1.3 13.1
Year 1986 1987 1988 1989 1990 1991
0.1 <0.1 <0.1 <0.1 <0.1 <0.1
9.4 9.8 9.2 13.2 13.8 10.5
0.5 10.0 9.8 9.2 13.2 13.8 10.5
Unknown Unknown
Minor Multispecies FMP
Fully exploited 2 years
22.7 cm (8.9 in.) males 23.2 cm (9.1 in.) females
Age structured 42% MSP
0.38
Fmu = N/A FI988 = 0.42

Page 52
Red Hake The red hake, Urophycis chuss, is
distributed from the Gulf of st. . Lawrence to North Carolina, but is most abundant between Georges Bank and New Jersey. Research vessel bottom-trawl surveys indicate that red hake have a broad geographic and depth distribution throughout the year, undergoing extensive seasonal migrations. Red hake winter in the deep waters of the Gulf of Maine and along the outer continental shelf and slope south and southwest of Georges Bank. Spawning occurs from May through November, with major spawning areas located on the southwest part of Georges Bank and in the Southern New England area south of Montauk Point, Long Island. Red hake feed primarily on crustaceans, but adult red hake also feed --extensively onfish:Themaximum length reached by red hake is approximately 50 cm (20 in.). Maximum age of red hake is reported to be about 12 years, but few fish survive beyond 8 years of age. Two stocks have been assumed, divided north and south in the central Georges Bank region.
Otter trawls are the principal commercial fishing gear used to catch red hake. Recreational catches are of minor importance. The fishery is managed under Amendment 4 to the New England Fishery Management Council's Multispecies FMP. Total commerciallandings in 1991, taken exclusively by the United States, were 1,700 mt and were slightly higher than 1990 when 1,600 mt were landed.
Gulf of Maine - Northern Georges Bank
Landings in 1991 were at a record low for the Northern red hake stock. Nominal landings were 750 mt, slightly less than in 1990 (825 mt). Trends in landings from this stock have shown
three distinct periods. The first period, from the early 1960s through 1971, was characterized' by relatively low landings ranging from about 1,000 to 5,000 mt. The second period, from 1972 to 1976, showed a sharp increase, with landings ranging from 6,300 to 15,300 mt. During this period, approximately 93 percent of the total annual landings were taken by the dis~ tant-water fleets on northern Georges Bank. Following implementation of the Magnuson Fisheries Conservation and Management Act (MFCMA) in 1977, both total landings and the pro-
NMFS photos by Brenda Flguerido
portion of landings by the distant-water fleets dropped sharply. From 1977 to the present, annual landings from this stock have averaged only 1,100mt and have been less than 1,000 mt since 1988. The NEFSC autumn bottomtrawl sUrvey index increased steadily from 1968 (0.4 kg,Itow) to 1989 (4.5 kg/tow). Trends in survey indices have shown two general levels of stock abundance. From 1964 to 1976, abundance was relatively low, with survey indices ranging from 0.4 to 1. 7 kg,Itow. Following 1976, sUrvey indices increased and have remained at rela-

'This stock is underexploited and
could support substantially higher catches."
tively high levels (1.3 to 7.9 kg/tow) since that time. The survey index has declined during the past two years (4.2 kgftow in 1990; 3.9 kgftow in 1991), but remains above the iong-term average. Thus, stock abundance appears to be moderately high. Survey data indicate that year class strength of red hake has been average or better for most of the 19805, except for the 1987 year class, which was weak. The 1991 year class presently appears to be of moderate strength.
The combination of low landings and relatively good year classes has allowed the stock to maintain itself at relatively high levels of biomass. This stock is underexploited and could support substantially higher catches.
Southern Georges BankMiddle Atlantic
. Nominal 1991 landings from the Southern red hake stock were 1,100 mt, 300 mt higher than in 1990 (800 mt). Historically, total landings from this stock peaked in the mid- 1960s (108,000 mt in 1966) due to development of the distant-water fleetS. Annuallandings averaged 35,000 mt from 1967-1972 but declined markedly after distant-water. fleet landings were reduced. From 1978 to 1984, the distant-water fleet landings averaged 10 percent of the total annual landings (compared to 83 percent from 1965-1976) due to restrictions placed on the fleet after the implementation of the MFCMA. Since 1985, landings of red hake have been exclusively domestic.
U.S. commercial landings increased from 4,300 mt in 1960 to a high of 32,600 mt in 1964, but declined sharply to 4,000 mt in 1966. U.S. landings remained at about 4,000 mt per year between 1967 and 1979, but have since declined to the current record low level of approximately 800 to 1,000 mt/year.
Page 53
Red Hake Gulf of Maine-Northern Georges Bank
16 ~--------------------------------~--r8
14
12 'Vi' 0 0 10 8-Vl Z 8 i2 <.) 0:: 6 f-W ~
4
2
..
LANDINGS
7 r-...
£ 63
o
5~ U '<t
4U Z « w
3~ o w G:
2~ a:: iii
0~~~~~~~~'-~--~-r~--~-r~--~-r+0 61 63 65 67 69 71 73 75 77 79 81 83 85 87 89 91
YEAR Table 5.1 Recreational catches and conunerciallandings (thousandrnetric tons)
Category 1972-81 1982 1983 1984 Average
U.S. recreational Conunercial
United States 0.8 1.2 0.9 1.1 Canada Other 5.0
Total nominal catch 5.8 1.2 0.9 1.1
Long-term potential catch SSB for long-term potential catch Importance of recreational fishery Management Status of exploitation Age at 50% maturity
Size at 50% maturity
Assessment level Overfishing definition Fishing mortality rate corresponding
to overfishing definition
M=0.4 FO•I = 0.5
Year 1985 1986
1.0 1.5
1.0 1.5
1987 1988 1989 1990 1991
1.0 0.9 0.8 0.8 0.7
1.0 0.9 0.8 0.8 0.7
Unknown Insignificant
Multispecies FMP Underexploited
1.8 years, females 1.4 years, males
27 cm (11 in.) females 22 cm (9 in.) males
Yield-per-recruit None
N/A
F""", = None

Page 54
''This index value is near the series average,
indicating that stock abundance is average."
The NEFSC autumn bottom-trawl survey index declined from its highest levels in the early 1960s to a relatively constant level between 1968 and 1982. After 1983, the index declined to the time-series' minimum during 1987 and 1988. Since 1988, the survey index has increased substantially to the current level of 2.0 kg/tow. This index value is near the series average, indicating that stock abundance is average.
Survey data indicate that most year classes produced during the 1980s were low to moderate in strength. Although catch rates of age 0 fish were very low during 1990, this year class appears of average strength as age 1 fish in 1991.
The decline of the autumn index from 1982 to 1988 does not appear to be caused by the fishery; landings duringthe 1980s were low (less than 5,000 mt/year) compared with those of the late 1960s and early 1970s (more than 20,000 mt most years) when the survey index was stable. The recent increase in the survey is likely due in part to the relatively stronger year classes that have been produced during the past four to-five years. This stock is underexploited and could support substantially higher catches.
For further information
Northeast Fisheries Center. 1986. Report of the Second NEFC Stock Assessment Workshop. WoodsHole Laboratory Reference Document 8~ 09. Availablefrom: NOAA/NMFS, Northeast Fisheries Science Center, Woods Hole, MA 02543.
Northeast Fisheries Center. 1990. Report of the 11 th NEFC Stock Assessment Workshop, Fall 1990. NEFSC Reference Document90-09. Available from: NOAA/NMFS, Northeast Fisheries Science Center, Woods Hole, MA 02543.
Red Hake. Southern Georges Bank-Middle Atlantic
120.-------------------------------------------r9
100
'(ij' b 80 o S. VJ Z 60 ~ u 0:: W 40 ~
20
0
Table 5.2
61
\\ t
6.3
/LANDINGS
/~ ~ . \,
\ \~ ,
.."-.. .. ~/
65 67 69 71 7.3
~ AUTUMN n
~/~~~~EY [' .-.!\ , .. \ :
f --~--\ l-'·--'--~··-L \~\ f,
'.,' '-,.F', ...... ,/~i
75 77 79 . 81 8.3 85 87 89 91
YEAR
Recreational catches and commercial landings (thousand rnelric tons)
Year
a
a
Clltegory 1972-81 1982 1983 1984 1985 1986 1987 1988 1989 1990 1991 Average
U.S. recreational 0.5 0.1 0.1 <0.1 Commercial
United Stales 3.2 3.0 1.3 1.2 Canada Other 17.6 0.2 0.1 0.1
Total nominal catch 21.3 3.3 1.5 1.3
Long-term potential catch SSB for long-term potential catch Importance of recreational fishery Management Status of exploitation Age at 50% maturity
Size at 50% maturity
Assessment level Overfishing definition fishing mortality rate correSponding
to overfishing definition
M=O.4 Fo.1 = 0.5
<0.1 <0.1
0.8 0.6
0.1 0.9 0.6
<0.1 <0.1 <0.1 <0.1
0.9 0.9 0.8 0.8
0.9 0.9 0.8 0.8
Unknown Unknown
Minor Multispecies FMP
Underexploited 1.7 years, females
1.8 years, males 25 cm (10 in.) females
24 cm (9 in.) males Yield-per-recruit
None
N/A
F""", = None
0.2
0.9
1.1

Pollock, Pollachius virens, occur on both sides of the North Atlantic; in the Northwest Atlantic, they are most abundant on the Scotian Shelf and in the Gulf of Maine. One major spawning area exists in the western Gulf of Maine, and several areas have been identified on the Scotian Shelf. Tagging studies suggest considerable movement of pollock between the Scotian Shelf and Georges Bank and, to a lesser extent, between the Scotian Shelf and the Gulf of Maine. Electrophoretic analyses of pollock tissue samples from the Scotian shelf and western Gulf of Maine showed no significant differences between areas, although differences in some morphometric and meristic characteristics were significant. Accordingly, pollock from Cape Breton and south continue to be assessed as a unit stock by U.S. scientists. Spawning occurs in winter and sexual maturation is essentially complete by age 6 although most fish are mature by age 4. Juvenile "harbor pollock" are common in inshore areas, but move offshore as they grow older. Pollock attain lengths up to 110cm (43 in.) and weights of 16 kg (35 lb).
Traditionally, pollock were taken as bycatch in the demersal otter trawl fishery, but, in recent years, directed effort has increased substantially. Much of this increase in effort has occurred in the winter gill-net fishery. Since 1984, the U.S. fishery has been restricted to that fraction of the stock occurring in areas of the Gulf of Maine and Georges Bank west of the line delimiting the U.S. and Canadian fishery zones. The domestic portion of the fishery is managed under the New England Fishery Management Council's Multispecies FMP. The Canadian fishery is managed under fleetspecific quotas; the two management regimes do not interact. Total nominal catches increased by less than 1 percent in 1991 (from 47,100 to 47,400 mt) as increased Canadian catches were offset by an almost equal decline in
U.S. and distant-water fleet catches. United States commercial landings declined by 17 percent in 1991 (9,500 mt to 7,900 mt).
Nominal commercial catches from the entire Scotian Shelf, Gulf of Maine, and Georges Bank region increased from an annual average of 38,200 mt during 1972-1976 to 68,500 mt by 1986. Nominal catches for Canada increased steadily from 24,700 mt in 1977 to an average of 43,900 mt during 1985-1987. United States catches increased from an average of 9,700 mt during 1973-1977 to more than 18,000 mt annually between 1984 and 1987, peaking at 24,500 mt in 1986. Nominal catches by distant-water fleets, however, have declined from an annual average of9,800 mt during 1970-1973, to less than 1,400 mt per year during 1981-1988. Thedistant-water fleet catch increased to 1,800 mt in 1989, but declined to 1,300 mt in 1990 and 700 mt in 1991. Most of this catch has been taken by Soviet vessels on the Scotian Shelf. Estimated U.S. annual recreational catches have fluctuated between 100 and 1,300 mt since 1979. No information is available for the Canadian recreational harvest, although it appears to be of minor importance. The total nominal catch from the stock, including recreational, after declining for four consecutive years, remained relatively stable at 47,400 mt in 1991. Most of the decline since 1986 was due to sharp reductions in U.S.landingsin 1987, 1988,and 1989, followed by a substantial decline in Canadian landings in 1990.
Total stock size, after increasing throughout the late 1970s and early 1980s, has declined substantially since the mid-1980s. Biomass indices for the Gulf of Maine-Georges Bank portion of the stock, derived from NEFSC autumn bottom-trawl surveys, increased during the mid-1970s, but declined sharply during the early 1980s and have remained relatively low since 1984. Indices derived from Canadian
Page 55
Pollock bottom-trawl surveys conducted on the Scotian Shelf increased during the 1980s but have also declined in this region in 1991. Commercial CPUE indices for U.S. trawlers fishing predominantly in the Gulf of Maine increased during the late 1970s, but declined after 1983 and have remained consistently low since 1987 at less than one-half the 1977-1983 average. Canadian commercial CPUE indices from the Scotian Shelf also increased between 1974 and 1984, but declined in 1985, 1987 and 1988;CPUEindices for both countries increased slightly in 1989 and 1990, but Canadian indices declined sharply in 1991.
Virtual population analyses have indicated a gradual increase in age 2+ stock biomass during the 1970s followed by a 45 percent decrease between 1984 and 1988. The increases in stock biomass during the 1970s resulted from recruitment and growth of several relatively strong year classes, notably those of 1971,1975 and 1979. Recruitment conditions were favorable throughout the 1970s and early 1980s, with moderate to strong year classes appearing regularly every three to four years. The most recent strong year class that contributed to this earlier increase in stock biomass was produced in 1982 and recruited to the fishery at age 2 in 1984. By 1989 and 1990, however, lhecatch composition of the U.S. fishery was dominated by the 1985 and 1986 year classes, which are considered to be only moderate in size.
Under the favorable recruitment conditions that prevailed during the 1970s and early 1980s, fishing at FOI would provide a long-term catch of 53,600 mt, while fishing at F max would provide a catch of 58,100 mt. Although potential yield is approximately 8 percent greater at the F max level, fishing at Fo,l provides for a 55 percent increase in total stock and a 74 percent increase in spawning stock biomass over those achieved under F ma<' thereby

Page 56
Pollock "Overall, the stock Scotian Shelf-Gulf of Maine-Georges Bank continues to be
overexploited ... " 100 a
90
ao
'(ii' 70 o o 8- 60 (/')
Z 50 g U 40 ~ w ~ 30
20
10
,~
" '\\:1
AUTUMN I; SURVEY -'\ INDEX i \
LANDINGS
+
J~ \ ,\ '\ , ~ : , :,\.
, ..... '\/ \. .. ·(~\7.
63: a
5~ u I;;t
4U Z <I: w
3~ o w [i:
2~ 0:::
Vi
o 0 62 64 66 6a 70 72 74 76 7a ao 82 84 86 88 90 92
YEAR Table 6.1 Recreational catches and conunercial1andings (thousand metric tons)
Category 1972·81 1982 1983 1984 Average
U.S. recreational 0.7 1.3 1.3 0.2 Conunercial
United States 12.4 14.4 14.0 17.8 Canada 27.8 38.0 32.7 33.2 Other 3.4 0.4 0.5 0.1
Total nominal calch 44.3 54.1 48.5 51.3
Long-tenn potential catch SSB for long-tenn potential catch Importance of recreational fishery Management Status of exploitation Age at 50% maturity 'Size at 50% maturity Assessment level Overfishing definition
1985
0.7
19.5 43.3
0.4 63.9
Fishing mortality rate corresponding to overfishing definition
Year 1986 1987
0.2 0.1
24.5 20.4 43.0 45.3
1.0 0.9 68.7 66.7
1988 1989 1990 1991
0.2 0.4 0.1 0.1
14.9 10.5 9.5 7.9 41.7 41.2 36.2 38.7
1.3 1.8 1.3 0.7 58.1 53.9 47.1 47.4
54,OOOmt 260,000 mt
Minor Multispecies FMP
Overexploited 2.2 years
40 cm (16 in.) Age structured
20% MSP
0.65
M=O.20 FO•I = 0.29 F ..... = 0.57 FI987=O.68 F
I991 = Unknown
providing for greater stability in reproductive potential and resilience to environmental perturbations. Continued fishing at or above F max will likely result in a long-tenn decline in spawning stock, since this strategy does not account for fluctuating recruitment.
Increases in total landings during the mid-1980s (in excess of 63,000 mt per year between 1985 and 1987) resulted in relatively high fishing mortality rates ranging from 0.5 to 0.7 during the latter part of the decade. Although total landings have declined by about 30 percent since the 1986 peak, these reduced catch levels may still generate high fishing mortality rates because stock biomass has also decreased. Overall, the stock continues to be overexploited, and no increase in stock size is likely in 1993 unless recruitment improves.
For further information
Annand, C., D. Beanlands and 1. McMillan. 1988. Assessment of Divisions 4VWX and Subarea.5 pollock, Poliachius virens. Canadian Atlantic Fisheries Scientific Advisory Committee Research Document 88/71.
Annand, e., and D. Beanlands. 1992. Assessment of pollock (Pollachius virens) in Divisions4VWX and Subdivision 5Zc for 1991. canadian Atlantic Fisheries Scientific Advisory Committee. Research Document92/44.
Mayo, R. K., I.M. McGlade, and S. H. Clark 1989. Patterns of exploitation and biological status of pollock Pollachius virens L. in the Scotian Shelf, Gulf of Maine, and Georges Bankarea. J. Nonhw.Atl. Fish. Sci. 9: 13-36.
Mayo, R.K. S.H. Clark, and M.e. Armand. 1989. Stock assessment information for pollock Pollachius virens L. in the Scotian Shelf, Georges Bank, and Gulf of Maine regions. NOAA Tech. Mem. NMFSFfNEC-65.

Page 57
Yellowtail Flounder
The yellowtail flounder, Pleuronectes /errugineus,ranges from Labrador to Chesapeake Bay. Off the U.S. coast, commercially important concentrations are found on Georges Bank, off Cape Cod, and in Southern New England, generally at depths between 37 and 73 m (20 to 40 fathoms). Fishing for yellowtail by the U.S. fleet also occurs in the northern. Gulf of Maine, in the Mid-Atlantic Bight, and on the Grand Banks of Newfoundland outside the Canadian 200-mile limit (the Tail of the Bank). Yellowtail commonly attain lengths up to 47 cm (18.5 in.) and weights up to 1.0 kg (2.2 lb); commercial catches tend to be dominated by smaller fish. Yellowtail appear to be relatively sedentary, although seasonal movements have been documented. Spawning occurs during spring and summer, peaking in May. Larvae drift for a month or more, then assume adult characteristics and become demersal.
Tagging studies and other information indicate that Southern New England, Georges Bank, and Cape Cod yellowtail flounder form relatively discrete groups, although some intermingling occurs among these groups of fish.
The principal fishing gear used to catch yellowtail flounder is the otter trawl. Current levels of recreational and foreign fishing are insignificant. The U.S. fishery is managed under the New England Fishery Management Council's Multispecies FMP. Total landings of yellowtail flounder decreased by 46 percent in 1991 to 7,500 mt.
Two sides of a yellowtail flounder NMFS photo by Blenda Figuerldo

Page 58
Yellowtail Flounder East of 6C]OW-Georges Bank
20,-------------------------------------------r20
'Cii' b o
16
B 12 (f) Z
~ U
~ w ~
8
4
.. ;.
\ \ /". AUTUMN ", ,,',; SURVEY ~ /, ... \ / INDEX ~\ ~ \ \ / \ ~.~.~""'-~. ~f ,/ ... ."
'C) 16 e. ~ o
~ 12 U
'< U Z
8 ~ o w [i:
~ 4 a::
I(f)
'.j ~\···~ .. I'-;;.,···~r ~' ... ..... ~ .. -...... .., .. ,....~.-
o 0 62 64 66 68 70 72 74 76 78 80 82 84 8688 90 92
YEAR
Table 7,1 Recreational catches and commercial landings (thousand metric tons)
Year Category 1972"81 1982 1983 1984 1985 1986 1987
Average.
U,S, recreational Commercial
United States 10,9 10.7 11.4 5.8 2.5 Canada <0.1 <0.1 <0.1 <0.1 Other 0.4
Total nominal catch 11.3 10.7 11.4 5.8
Long-term potential catch SSB for long-term potential catch Importance of recreational fishery Management Status of exploitation Age at 50% maturity Size at 50% maturity Assessment level Overfishing definition Fishing mortality rate corresponding
to overfishing definition
M =0.20 Fo.1 = 0.25
2.5
3.0 2.7 <O.l
3.0 2.7
F = 0.63 IOU
1988 1989 1990 1991
1.9 1.1 2.7 1.8
1.9 1.1 2.7 1.8
16,oOomt . 65,ooomt
Insignificant Multispecies FMP
Overexploited 2 years
26 cm (10 in.) Age structured
20% MSP
0.58
FI990 = 0.82
" ... the stock is still at a very low level and is
comprised of few age groups ... "
Georges Bank
Total landings of yellowtail from Georges Bank averaged 16,300 mt during 1962-1976 but declined to an average of 5,800 mt between 1978 and 1981. Landings increased to more than 11,000 mt in 1982 and 1983 due to strong recruitment from the 1979 and 1980 year classes. Since then, landings have generally declined, reaching a record low of 1,100 mt in 1989, increasing slightly to 2,740 mt in 1990, and declining again to 1,784 mt in 1991.
NEFSC autumn survey biomass indices for Georges Bank yellowtail declined between 1963 and 1976, stabilized at relatively low levels during 1977-1983 (with the exception of the elevated 1980 index), and subsequently fell to record low levels during 1984 and 1988. After increasing slightly in 1989, due to above average recruitment from the 1987 year class, the survey index declined again in 1990, and remained stable in 1991.
Fishing mortality rates ranged between 0.5 and O. 8 between 1969 and 1973, but increased to well over 1.0 during 1974-1988. An apparent drop in F in 1989 was followed by an increase to 0.82 in 1990.
Although abundance of the Georges Bank stock increased modestly in 1989 due to the above average 1987 year class, the stock is still at a very low level and is comprised of few age groups. Recent recruitment following the 1987 cohort appears to be poor. Hence, rebuilding of the stock will require a major reduction in fish-
. ing mortality and several years of improved recrui tment. The population is severely overexploited, and the stock is at a record low level.

Yellowtail Flounder West of 69<'W-Southern New England
40~----------------------------~----------r40
'Cii' b
35
30
o 25 8-(/)
Z 20 2 u 0:: 15 W ::::!:
10
5
, ,:,'\
\~
\ '-'. ' .. ~ ,~
•.•. (
_LANDINGS
AUTUMN ~ __ SURVEY '. INDEX
.35 ,-.,.
£ .30 3
o 25 ~
U
< 20 U
z L5
15 ::::!: o w c;:
10 ~ c:::
5 to
o 0 62 64 66 68 70 n 74 76 78 80 82 84 86 88 90 92
YEAR
Table 7.2 Recreational catches and commercial landings (thousand metric tons)
Year Category 1972-81 1982 1983 1984 1985 1986 1987 1988 1989 1990 1991
Average
U.S. recreational Commercial
Uniled Stales 5.4 10.3 17.0 7.9 Canada Other 0.3
Total nominal catch 5.7 10.3 17.0 7.9
Long-tenn potential catch SSB for long-tenn potential catch Importance of recreational fishery Management Status of exploitation Age at 50% maturity Size at 50% maturity Assessment level Overfishing definition Fishing mortality rate corresponding
to overfishing definition
M =0.20 Fo.1 = 0.22 .
2.7 3.3 1.6
2.7 3.3 1.6
F =0.48 ""'"
I Includes potential rrom Cape Cod lind Mid-Atlantic groups.
0.9 2.5 8.0 3.9
0.9 2.5 8.0 3.9
23,000 mtl 75,000 mt
Insignificant Multispecies FMP
Overexploited 2 years
26 cm (10 in.) Age structured
20% MSP
F20% = 0.49
FI990 = 1.61
Page 59
n ••• current fishing mortality is too high to achieve the target spawning potential established
for this stock ... "
Southern New England
Landings of yellowtail flounder from the Southern New England stock averaged 28,000 mt during 1963-1970 but declined rapidly afterward, reaching a low of 1,700 mt in 1976. Landings increased during 1977-1983, peaking at 18,500 mt in 1983, but subsequently declined to a record low of only 900 mt in 1988. In 1989 and 1990, landings increased to 2,500 mt and 8,008 mt respectively, due to recruitment from the strong 1987 year class, but declined in 1991 to 3,910 mt.
NEFSC autumn survey abWldance and biomass indices were at historically high levels between 1963 and 1972, but declin~ markedly in 1973 and remained very low until 1982 when both abundance and biomass values increased due to strong recruitment from the 1980 and 1981 cohorts. These increases, however, were short-lived; survey indices during 1985-1988 were the lowest on record. The 1989 indices increased to their highest levels since 1983 due to strong recruitment from the 1987 year class. However, this increase was again short-lived, as the 1990 index dropped precipitously, and declined further in 1991.
Fishing mortality rates (on the fully recruited ages) fluctuated between 0.6 and 1.0. durfng 1973 to 1979. After 1979 fishing mortality rates were generally well in excess of 1.0, with a peak of 1.9 in 1984 and a recent high of 1.6 in 1990.
As for the Georges Bank stock, abundance of the Southern New England stock improved in 1989 and 1990 due to the strong 1987 year class. This cohort was relatively stronger in Southern New England than on Georges Bank, and essentially comprises the entirety (97 percent) of the Southern New England stock. Significant quantities of this cohort were discarded in

Page 60
Yellowtail Flounder West of 69°W-Cape Cod
6,-------------------------------------------r6
5
'iii' b 4 o 8-tfJ Z 3 8 u ~ t::J 2 ~
AUTUMN .' SURVEY -!~ INDEX ! \
!,,~ ~\\ .~
"~i),} · \:/'; V~'v ~':C\ . .J' "'.,
O;-~--~~~~_r--~_r~~,_~--~~-~~"·T·'~~·~O 62 64 66 68 70 72 74 76 78 80 82 84 86 88 90 92
YEAR
Table 7.3 Recreational catches and commercial landings (thousand metric tons)
Yellr Clltegory 1972-81 1982 1983 1984 1985 1986 1987
Averllge
U.S. recreational Commercial
United States 3.3 3.2 1.9 1.1 Canada Other
Total nominal catch 3.3 3.2 L9 1.1
Long-term potential catch SSB for long-term potential catch Importance of recreational fishery Management Status of exploitation Age at 50% maturity Size at 50% maturity Assessment level Overfishing definition Fishing mortality rate corresponding
to overfishing definition
M =0.20 Fo.1 = 0.21
LO LO 1.2
LO LO 1.2
F = 0.55 .....
1988 1989 1990 1991
1.1 0.9 3.0 1.5
1.1 0.9 3.0 1.5
Unknown Unknown
Insignificant Multispecies FMP
Overexploited 2 years
26 cm (10 in.) Yield-per-recruit
N/A
N/A
Fl991
= Unknown
" ... stock biomass has been reduced by the
high catches of the late 1970s and early 1980s ... "
1989 since, as two-year-olds, virtually all fish were less than the minimum legal-landing size of 13 in. Significant discarding continued on this year class in 1990, especially early in the year.
At this level of catch (i.e., landingsplusdiscards), the 1987 year class will not sustain the fishery beyond 1991. Since recruitment of the 1988 and 1989 year classes appears to be poor, landings and stock size will then likely revert to the low pre-1989 levels.
This stock is overexploited and, despite the 1987 year class, current fishing mortality is too high to achieve the target spawning potential established for this stock.
Cape Cod
Total landings of yellowtail flounder from the Cape Cod stock generally fluctuated between 1,500 and 2,000 mt in the 1960s, increased during the 19705 to approximately 5,000 mt in 1980, and then declined, reaching record low levels during the 19805. Landings in 1990 were 2,979 mt,dropping to 1,466 mt in 1991.
NEFSC autumn survey indices have been highly variable, but have reflected the general pattern of landings. The 1989 value was the highest since 1980, due to the strong 1987 year class, but the index declined again in 1990, and dropped even lower in 1991.
Recent declines in landings and the corresponding general downward trends in the survey indices suggest that stock biomass has been reduced by the high catches of the late 19705 and early 19805., A short-term increase in landings associated with the 1987 year class occurred in 1990, but the stock is considered to be overexploited.

Yellowtail Flounder West of 690W-Middle Atlantic
24 ,---------------------------------------~~
20
'iii' 0 16 0 S. (/) Z 12 0 I-
U 0:: I- 8 w :::!:
4
3 o 16 .t;.
I U
'< U
12 Z
~ :::!:
B 8 CL:
~ a:::
4 tii
o 0 62 64 66 68 70 n. 74 76 78 80 82 84 86 88 90 92
YEAR
Table 7.4 Recreational catches and commercial landings (thousand metric tons)
Year Category 1972-81 1982 1983 1984 1985 1986 1987
Average
U.S. recreational Commercial
United Slates 2.0 1.3 1.5 2.2 Canada Other
Total nominal catch 2.0 1.3 1.5 2.2
Long-term potential catch SSB for long-term potential catch Importance of recreational fishery Management Status of exploitation Age at 50% maturity Size at 50% maturity Assessment level Overfishing definition
0.2
0.2
Fishing mortality rate corresponding to overfishing definition
M=0.20 FO•I = 0.21
0.3 0.2
0.3 0.2
Fmu = 0.55
1988 1989 1990 1991
<0.1 0.5 0.4 0.3
<0.1 0.5 0.4 0.3
Unknown Unknown
Insignificant Multispecies FMP
Overexploited 2 years
26 cm (10 in.) Yield-per-recruit
N/A
N/A
Fl991
= Unknown
Page 61
"The assessment level for yellowtail in this region is too low to evaluate
the current status of exploitation."
Middle Atlantic
Trends for the Mid-Atlantic have . been generally similar to those observed for Southern New England.· Landings declined from more than 8,000 mt in 1972 to less than 1,000 mt between 1976 and 1980. Landings increased gradually during the early 1980s, from 300 mt in 1980 to 1,500 mt and 2,200 mt in 1983 and 1984, respectively, reflecting improved recruitment. Landings have since declined to the low levels of the late 1970s. Landings in 1990 declined to
·400 mt, and further declined to 325 mt in 1991. NEFSC autumn survey indices declined to very low levels in the mid-1970s, followed by an increase during 1981-82 with improved year class strength. Subsequent indices have declined to levels similar to those observed during the mid- to late 19705, with the .1987 autumn survey value representing the lowest on record. Although survey indices improved in the late 1980s and in 1990, the index for 1991 dropped to a very low level. The assessment level for yellowtail in this region is too low to evaluate the current status of exploitation.
For further information
Clark, S. H., M. M. McBride, and B. Wells. 1984. Yellowtail flounder assessment update - 1984. Woods Hole lAboratory Reference Document84-39. Availablefrom:NOAAj NMFS, Northeast Fisheries Science Center, Woods Hole, MA 02543.
Northeast Fisheries Science Center. 1991. Report of the 12th Northeast Regional Stock Assessment Workshop. NEFSC Reference Document 90-03.

Page 62
Summer Flounder The summer flounder or fluke,
Paralichthys dentatus, occurs from the southern Gulf of Maine to South Carolina. Important commercial and recreational fisheries for summer flounder exist within the Mid-Atlantic Bight (Cape Cod to Cape Hatteras).
Summer flounder are concentrated in.coastal embayments and estuaries from late spring through early autumn. An offshore migration to the outer continental shelf is undertaken in autumn. Spawning occurs during the offshore autumn migration, and the larvae are transported toward coastal areas by prevailing water currents.
Development of post-larvae and juveniles occurs primarily within embayments and estuarine areas, notably Pamlico Sound and Chesapeake Bay. Growth rates differ appreciably between the sexes with females attaining weights up to 11.8 kg (261b).
Female summer flounder may live up to 20 years, but males rarely exceed 7 years. No separate stocks have been identified in this region. The principal gear used in commercial fishing for summer flounder is the otter trawl. Recreational landings historically constitute about 40 percent of the total landings. The fishery is managed under the Summer Flounder FMP.
Nominal total landings averaged 19,100 mt during 1982-1990, peaking at 30,200 mtin 1984. Totallandingsin 1991 (9,800mt) were 49 percent higher than in 1990 (6,600 mt). Nominal commercial landings of summer flounder averaged 11,300 mt during 1982-1990, reaching a high of 17,100 mt in 1984. Commercial landings in 1991 were 6,200 mt, a 48 percent increase relative to the 1990 level of 4,200 mt. The recreational fishery for summer flounder harvestsa sigrtificant proportion of the total nominal catch of this species, and in some years, recreational landings have exceeded the commercial landings. The estimated recreational landings of summer flounder averaged 7,800 mt during 1982-1990,
peaking in 1983 at 16,400 mt. The recreational landings decreased dramatically (by 82 percent) between 1988 and 1989 to 1,500 mt, the lowest level since 1979, when the current system to monitor the recreational fishery was implemented. Recreational landings have since rebounded to 3,600 mt in 1991. Since the inception of the MFCMA, nominal landings by foreign vessels have been very low.
NMFS photos by Brenda Figuerido -
Based on NEFSC survey indices, stock biomass is currently at the lowest average level since the late 1960s and early 1970s, and is about onequarter of the level observed in the mid-1970s. The spring survey index (mean weight-per-tow) rose from a low point in 1970 to a peak in 1976, was at an average level during the late 1970s and early 1980s, and then decIineddramaticallyfrom 1985to 1991.

. " ... fishing mortality rates continue to greatly
exceed those resulting in maximum yield-per
recruit, and are reducing long-term potential yields ... "
Catch curve analysis of survey and commercial age composition data collected from 1976 through 1983 indicated fishing mortality rates of about 0.6 to 0.7, well in excess of F max
(NEFSC 1986). Analyses of more recent NEFSC spring survey age composition data (1984-1992) and fishery age composition data (1982-1990) suggest that current fishing mortality rates . are about 1.1. Thus, fishing mortality rates continue to greatly exceed those resulting in maximum yield-per-recruit, and are reducing long-term potential yields. NEFSC survey indices and VPA results indicate that stock abundance, and hence the catches, are currently being sustained primarily by fish aged 2 and younger. The marked decrease in combined commercial and recreational catch since 1988 likely reflects decreased adult (age 2 and older) stock size and verypoorrecruitment in 1988 and 1989. Recruitment levels in 1990 and 1991 were estimated to be below average. Current data and analyses indicate that the stock continues to be significantly over-exploited.
For further information
Northeast Fisheries Center. 1986. Report of the Third NEFC Stock Assessment Workshop. Woods Hole, MA: Woods Hole Laboratory Reference Document 86-14.
Northeast Fisheries Center. 1990. Report of the 11 th NEFC Stock Assessment Workshop (lIth SAW). NEFSC Reference Document90-09.
Northeast Fisheries Science Center. 1992. Report of the 13th Northeast Regional Stock Assessment Workshop (13th SAW). NEFSC Reference Document 92-02.
Page 63
Summer Flounder Georges Bank-Middle Atlantic
18 ~-----------------------r------------------r2.0
16
14
'tIi' (:) 12 0 S til 10 Z
~ 8 ,
u l 1'E ,.~.
f- 6 .. I w ri ~
4 .'
2
0 62 64 66 68 70 72 74 76 78 80
~ f. ~
82
;. " !I \\ t t
,i \ .. '.S \~'~
-._; " \ -.. ~
84 86 88 90 92
........ en 1.6.0
~ o J;. I
1.2 U
< U Z
~ 0.8 ~
o w c;:
~ 0.4 ~
0.0
YEAR
Table 8.1 Recreational and corrunercial1andings (thousand metric Ions)
Category 1972-81 1982 1983 1984 Average
U.S. recreational 10.0 9.6 16.4 13.1 Corrunercial
United Slates 11.7 10.4 13.4 17.1 Canada Other <0.1 <0.1 <0.1
Total nominal catch 21.7 20.0 29.8 30.2
Long-term potential catch SSB for long-term potential catch Importance of recreational fishery Management Status of exploitation Age at 50% maturity Size at 50% maturity Assessment level Overfishing definition Fishing mortality rate corresponding to overfishing definition
M = 0.20 Fo.l = 0.14
1985
7.6
14.7
22.3
Year 1986 1987 1988 1989 1990 1991
8.5 6.4 8.4 1.5 2.4
12.2 12.3 14.7 8.1 4.2
20.7 18.7 23.1 9.6 6.6
Unknown Unknown
Major Summer Flounder FMP
Overexploited 1 year (females) 27 cm (10.6 in.) .
VPA >F
max
>0.23
3.6
6.2
9.8
F ...... = 0.23 FI99l = 1.1

Page 64
American Plaice The American plaice or dab,
Hippoglossoides platessoides, is a large-mouthed, "right-handed" floun- -
" der distributed along the Northwest Atlantic continental shelffrom southern Labrador to Rhode Island in relatively deep waters. Offthe U.S. coast, the greatest commercial concentrations exist between 90 and 182 m (50 and 100 fathoms). Sexual maturity begins between ages 2 and 3 but most individuals do not reach maturity until age 4. Spawning occurs in spring, generally during March through May. Growth is rather slow; three-year-old fish are normally between 22 and 28 cm (9 to 11 in.) in length and weigh between 90 and 190 g (0.2 and O.4lb). After age 4, females grow faster than males.
The principal commercial fishing gear used to catch American plaice is the otter trawl. The fishery is prosecuted primarily during the second and third quarters of the calendar year. Recreational and foreign catches are insignificant. The U.S. fishery is managed under the New England Fishery Management Council's Multispecies FMP. Total catches increased 72 percenUn 1991 (from 2,500 mt to 4,300 mt). The 1986 and 1987 year classes accounted for the majority (69 percent by numbers; 57 percent by weight) of the landings in 1991.
Landings of American plaice increased an average 2,300 mt during 1972-1976 to greater than 10,000 mt during 1979-1984. Subsequently, annuallandings declined and are now at similar levels as in the late 1960s.
Between 1960 and 1974, 67 percent of U.S. landings were from deepwater areas on Georges Bank. Since then, Gulf of Maine landings have greatly exceeded those from Georges Bank. The U.S. 1991 Gulf of Maine catch (3,000 mt) was more than twice as large as that from Georges Bank (1,300 mt).
United States commercial CPUE
indices were relatively stable between 1964 and 1969, declined in the early 1970s, and sharply increased to a record-high in 1977 when totalland-. ings doubled. Subsequently, annual CPUE indices steadily declined reaching a record low in 1988. The 1991 index increased 11 percent from 1990.
VPA analyses indicate that fishing mortality (ages 6 to 9+) more than doubled from 1981 (F=.36) to 1987 (F=.87) and subsequently declined to a low in 1990 (F=.47). Fishing mortality in 1991 was estimated to be 0.58, well above bothF =.29 and the F
. max needed to attain 20 percent maximum spawning potential (F
20%=.49), the
management target established for this stock.
Stock sizes (in numbers) declined 72 percent from 1980 (204 million) to 1986 (58 million). In 1990, stock size increased 81 percent (105 million) as the outstanding 1987 year class recruited into the fishery. Stock sizes declined 13 percent in 1991 (91 million)."
Spawning stock biomass declined from 41 ,400 mtin 1980-1982 to 10,333 mt in 1989-1991. In 1991, the spawning stock biomass increased to 13,400 mt as the 1987 year class began to
NMFS photo by Brenda Figuerido
recruit to the spawning stock. Discard estimates of American
plaice indicate that discarding is high"est for age 2 and 3 fish in the shrimp fishery and for age 3 and 4 fish in the large-mesh fishery. Direct estimateS of discarded plaice in the northern shrimp fishery using sea sampling data indicated that by 1991,40 percent of the total cumulative catch (in numbers) of the 1987 year class had been discarded. Similarly, in the large mesh fishery, indirect estimates of discarding of plaice indicated that 41 percent of the total cumulative catch of the 1987 year class had been discarded by 1991.
Abundance and biomass indices from NEFSC autumn surveys reached record-low values in 1987 but increased until 1990 and remained stable in 1991 as the 1987 year class matured. Survey number-per- tow indices indicate that the strongest year classes occurred in
. 1978,1979, and 1987, and that above average year classes occurred in 1986 and 1989. The 1989 year class will enter the commercial fishery during mid-year 1994.
The decline in landings that began in 1983 reflects a declining trend in harvestable biomass, as indicated in

American Plaice Gulf of Maine-Georges Bank
16 16
14 14 '""'
.E 12 12 3
"Iii' ~ b 0 10 10 :r: B ~ V') <I:
U Z 8 8 Z ~ LS u ::::?! 0:: 6 ./,:'\ 6
I- 0 w /';i>''''-' - ~ W
~ c;: 4 , , 4 ~ .. ," ~ ... \ a:::
." AUTUMN /V , l-V')
2 SURVEY """'"', .iI> .. 2 INDEX ··"".",...·',e·
o 0 62 64 66 68 70 n 74 76 78 80 82 84 86 88 90 92
YEAR Table 9.1 Recreational catches and cornrnerciallandings (thousand metric tons)
Category 1972-81 1982 1983 1984 Average
U.S. recreational Commercial
U.S. 6.6 15.1 13.2 10.1 Canada <0.1 <0.1 <0.1 <0.1 Other <0.1
Total nominal catch 6.7 15.2 13.2 10.1
Long-term potential yield· SSB for long-term potential catch Importance of recreational fishery Management Status of exploitation Age at 50% maturity
Size at 50% maturity
Overfishing definition Fishing mortality rate corresponding
to overfishing definition
M=0.20 FO'1 = 0.18
I excluding discards.
1985
7.0 <0.1
7.0
Year 1986 1987 1988 1989 1990 1991
4.1 3.8 3.3 2.3 2.5 4,3 <0.1 <0.1 0.1 0.1 <0.1 <0.1
4.1 3.8 3.4 2.4 2.5 4.3,
3,600mt 12,OOOmt
Insignificant Multispecies FMP
Overexploited 3.0 years (males);
3.6 years (females) 22.1 cm (8.7 in.) males;
26.8 cm (10.6 in.) females Age structured
20% MSP
0.49
F = 0.29 FI!I91 = 0.58 DIU
Page 65·
"The 1989 year class represents the next
opportunity to increase harvestable biomass if fishing mortality and
discarding are reduced."
both catch-per-unit-effort and survey indices. Although landings increased in 1991 due to the recruiting 1986 and 1987 year classes, stock biomass is still at a low level. The 1989 year cl~ represents the next opportunity to increase harvestable biomass if fishing mortality and discarding are reduced. However, fishing effort has increased in recent years and levels of both fishing and discard mortality are likely to remain high. Given these conditions, abundance and landings of American plaice are expected to remain low and the stock will continue to be over exploited,
For further information
Mayo, R.K., L. O'Brien, and N. Buxton, 1992, Discard estimates of American plaice in the Gulf of Maine northern shrimp fishery and the Gulf of Maine-Georges Bank large mesh otter trawl fishery, In Report of the 14th Northeast Regional Stock As- " sessment Workshop (SAW 14), Research Document 14/3. NEFSC Reference Document92-03 (Appendix),
Northeast Fisheries Science Center. 1992, Report of the 14th Northeast Regional Stock Assessment Workshop (14th SAW). Research Document 14/2. NEFSC Reference Document92-03.
O'Brien, L., R.K. Mayo, N. Buxton, andM. Lambert. 1992. Assessment of American plaice in the Gulf of
'Maine-GeorgesBankRegion 1992, In Report of the 14th Northeast Regional Stock Assessment Workshop (SAW 14), Working Paper 9. NEFSC Reference Document 92-03.
Sullivan,L.F. 1982. Americanplaice, Hippoglossoides platessoides, in the Gulf of Maine, Kingston, RI: University of Rhode Island. Master's thesis.

Page 66
Witch Flounder The witch flounder or gray sole,
GlyptocephalUs cynoglossus, is common throughout the Gulf of Maine and also occurs in deeper areas on and adjacent to Georges Bank and along the shelf edge as far south as Cape Hatteras. Research vessel survey data suggest that the Gulf of Maine population may be relatively discrete from populations in other areas. Witch flounder appear to be sedentary, preferring moderately deep areas; few fish are taken shallower than 27 m (15 fathoms) and most are caught between 110 and 275 m (60 and 150 fathoms). Spawning occurs in late spring and summer. Witch flounder attain lengths up to 60 cm (24 in.) and weights of approximately 2 kg (4.5 lb).
The principal fishing gear used to catch witch flounder is the otter trawl. Recreational catches and foreign catches are insignificant. Fishing is managed under the New England Fisheries Management Council's Multispecies FMP. Totallandings increased in 1991 (from 1,400 to 1,800 mt) but were still the second-lowest in the past 27 years.
Since 1960, the U.S. nominal catch has been distributed almost evenly between Georges Bank and the Gulf of Maine, although in recent years most of the u.s. catch has .come from the latter area. Canadian nominal catches from both areas have been minor (less than 50 mt annually since 1970). Distant-water fleet catches on Georges Bankaveraged2,600mtin 1971-1972, but subsequently declined sharply and have been negligible since 1977. After averaging 2,800 mt during 1973-1981, nominal catches increased sharply during the early 1980s and peaked at 6,500 mt in 1984. Since 1984, landings have steadily declined. A Grand Banks fishery for witch flounder, which developed in 1985 and continued through 1990, accounted for an annual U.S. harvest of 400 mt, however, no landings were reported in 1991. Also,
Scientist Dan Hayes displays witch flounder caught during the groundfish survey, 1992 NMFS phoro by Brenda Figuerido
67 mt was harvested in 1991 in the Mid-Atlantic region.
NEFSC autumn survey catches seem to accurately reflect trends in biomass. Heavy exploitation by distant-water fleets in 1971-1972 was followed by a decline in the autumn index from an average of 3.2 kgJtow in 1966-1970to 1.5 kg/tow in 1975. Bio-
mass increased in 1977-1978 due to reduced effort in the northern shrimp fishery. Subsequent indices, however, have declined steadily to the lowest levelsonrecord. The 1991 value of 0.5 kg/tow represents no change in the resource condition from 1990.
The low level of landings since 1988 reflects a declining biomass, as

Witch Flounder· Gulf of Maine-Georges Bank
7.-------------------------------------------r7
6
'Cii'5 b o 8. 4 (/) Z
~ U 3 0:: ~ w ~ 2
LANDINGS ---
o 0 62 64 66 68 70 72 74 76 78 80 82 84 86 88 90 92
YEAR
Table 10.1 Recreational and commercial landings (thousand rnebic tons)
Clltegory 1972-81 1982 1983 1984 Averllge
U.S. recreational Commercial
U.S. 2.7 4.8 5.8 6.5 Canada <0.1 <0.1 <0.1 <0.1 Other 0.4
Total nominal catch 3.1 4.8 5.8 6.5
Long-tenn potential catch SSB for long-term potential catch Importance of recreational fishery Management Status of exploitation Age at 50% maturity
Size at 50% maturity
Assessment level Overfishing definition
1985
6.0 <0.1
6.1
Fishing mortality rate corresponding to overfishing definition
Yellr 1986
4.5 <0.1
4.5
1987 1988 1989 1990 1991
3.4 3.2 2.1 1.4 1.8 <0.1 <0.1 <0.1 <0.1 <0.1
3.4 3.2 2.1 1.4 1.8
<3,OOOmt Unknown
Insignificant Multispecies FMP
Overexploited 3.6 years, males
4.4 years, females 25.3 cm (10.0 in.) males
30.4 cm {l2.0 in.) females Index
20% MSP
Unknown
M=O.15 FO.I
= Unknown F IIIU = Unknown FI991
= Unlcno'wrl
Page 67
"It appears that harvests of 3,000 mt or more cannot be sustained over the
long term."
reflected in low survey indices and in low catch-per-unit -effort indices ( 1991 CPUE indices were among the lowest in the time series). These declines suggest that this resource is being adversely affected by current levels of exploitation. Additionally, high discard rates of juvenile witch flounder are associated with the small-mesh Northern shrimp fishery in the Gulf of Maine. It appears that harvests of 3,000 mt or more cannot be sustained over the long tenn. Landings may remain stable or increase slightly in 1992 as a moderately strong 1985 year class moves through fishery. The population is clearly overexploited, as the stock size is less than one-fifth of the level seen in the late 1960s and early 1970s.
For further information
Burnett, 1., and S. H. Clark. 1983. Status of witch flounder in the Gulf ofMaine-1983. NEFC Wooru Hole Laboratory Reference Document83-36. Available from: NOAA/NMFS, Northeast Fisheries Science Center, Woods Hole, MA 02543.
Northeast Fisheries Center. 1986. Report of the Second NEFC Stock Assessment Workshop. NEFC· Wooru Hole Laboratory Reference Document 86-09. Available from: NOAA/NMFS, Northeast Fisheries SCience Center, Woods Hole, MA 02543.
Burnett, 1., M. R. Ross, and S. H. Clark. 1992. Several biological aspects of the witch flounder (Glyptocephalus cynoglossus (L.» in the Gulf of Maine-Georges Bank region. 1. Northw. Atl. Fish. Sci. 12:15-25.

Page 68
Winter Flounder The winter flounder, blackback,
or. lemon sole, Pleuronectes arnericanus, is distributed in the Northwest Atlantic from Labrador to Georgia. Abundance is highest from the Gulf of St. Lawrence to Chesapeake Bay. Winter flounder may attain sizes up to 58 cm (23 in.) total length. The diet consists primarily of benthic invertebrates. Movement patterns are generally localized. During winter, smaIlscale seasonal migrations occur to estuaries, embayments, and saltwater ponds to spawn, and from these locations to deeper water during summer. There is evidence that winter flounder tend to return to the same spawning locations in consecutive years. Restricted movement patterns and differences in growth, meristic, and morphometric characteristics suggest that relatively discrete local groups exist.
Tagging and meristic studies indicate discrete groups of winter flounder north of Cape Cod, east and south of Cape Cod, and on Georges Bank. For descriptive purposes, groups will be described separately for the Gulf of Maine, Southern New England -Middle Atlantic, and Georges Bank; additional studies of stock structure are needed. Winter flounder are typically exploited in coastal locations, although offshore shoal areas, particularly Georges Bank and Nantucket Shoals, support important winter flounder fisheries.
The principal commercial fishing gear used to catch winter flounder is the otter trawl. Recreational catches are significant, especially in the southern parts of the range. The fishery is managed under the New England Fisheries Management Council's Multispecies FMP. Total conunerciallandings in 1991 (7,500 mt) were slightly higher than 1989-1990 levels (6,700 mt, average), but remained near recordlow levels.
Winter flounder, like most flounder, are right-handed. The winter flounder at top is normal. The flounder on the bottom is aberrant, a left-handed winter flounder (note position of lower jaw and gill cover.)
Gulf of Maine
Commercial landings from the Gulf of Maine increased from a steady 1,000mt for the period 1961 to 1977 to nearly 3,000 mt in 1982. Recreational landing estimates, first' available in 1979, combined to produce a total catch of7, 100 mt in that year. Totallandings dropped precipitously in 1983 to 3,400 mt primarily due to a 70 percent reduction in recreational landing estimates and a 25 percent reduction in commerciallandings. Since then, landings in
the recreational fisheries have fluctuated, but landings in both fisheries have continued to trend downward. Combined landings in 1991 were only 1,100 mt, a record low for the elevenyear time series. Estimated recreational catches in 1991 «100 mt) were the lowest levels observed. Commercial landings of 1,000 mt were the lowest since 1969.
Bottom trawl survey abundance indices from the Massachusetts Division of Marine Fisheries spring survey for the Massachusetts Bay-Cape Cod

'Iii' b o S. V1
Winter Flounder Gulf of Maine
4,-----------------------------------------T30
\ I " " MASS. 'I I I
SPRING I " SURVEY -,' I INDEX •
,-... 25 £
3: o 20 .J;..
I U '<i:
Z 2 f2
U 15 Z
u ~ IW ~
COMMERCIAL LANDINGS ____ L5
~
10 8 c:;:
~ a::
5 Iii
04-~~~~~~~--~~~~_r~--._~~~~~TO 62 64 66 68 70 72 74 76 78 80 82 84 86 88 90 92
YEAR
Table 11.1 Recreational catches and commercial landings (thousand metric tons)
Category 1972-81 1982 1983 1984 Average
U.S. recreational 4.4' 4.3 1.3 1.2 Commercial
United States 1.7 2.8 2.1 1.7 Canada <0.1 <0.1 <0.1 <0.1 Other
Total nominal catch 6.1 7.1 3.4 2.9
Long-tenn potential catch SSB for long-tenn potential catch Importance of recreational fishery Management
Status of exploitation Age at 50% maturity Size at 50% maturity
r-
Assessment level Overfishing definition
Xellr 1985 1986 1987 1988 1989 1990 1991
2.0 0.3 1.9 1.0 0.9 0.4 <0.1
1.6 1.3 1.2 1.3 1.2 1.1 1.0 <0.1 <0.1 <0.1 <0.1 <0.1 <0.1 <0.1
3.6 1.6 3.1 2.3 2.1 1.5
Unknown Unknown
Major = Multispecies FMP (NEFMC)
FMP for Inshore Stocks of Winter Flounder (ASMFC)
Overexploited 3.4 years
27.6 cm (10.9 in.) males 29.7 cm (11.7 in.) females
Index 20% MSP (NEFMC) 40% MSP (ASMFC)
1.1
Fishing mortality rate corresponding to overfishing definition >0.49
M = 0.28 Fl!l9l = 1.0 FO.l = Unknown F = Unknown .u
Page 69
" Estimated recreational catches in 1991 «100 mt)
were the lowest levels observed. Commercial
landings of 1,000 mt were the lowest since 1969."
Bay areas decreased after 1983, and have trended downward to the lowest values in the series in 1988-1991. Commercial catch-per-unit-effort indices (tonnage class 2 otter trawlers) peaked in the late 1960s to early 1970s, averaging 3.0 mt/days fished between 1968 and 1971. The index has declined steadily since then, to remain at record low levels, averaging 0.9 mt/df in 1986-1991. Although the 1991 value (1.0 mt/df) is the highest in the last six years, it is the sixth lowest in the 28-year timeseries.
The continuing low level of landings, continuing low levels in commercial catch-per-unit-effort indices, and the low trawl survey indices in recent years indicate that winter flounder abundance in the Gulf of Maine has been reduced substantially by recent exploitation. Because recreational catches have been equal to or greater than commercial landings, future improvements in the condition of the stock will depend on decreases in exploitation in both sectors, and on improved recruitment. The stock at present is considered to be over-exploited.
Georges Bank
Commercial landings from the Georges Bank region increased from 1,900 mt in 1976 to near record-high levels during 1980-1984 (average of 3,8oomt/yr). Between 1985 and 1988, landings averaged 2,400 mt per year; and in recent years (1989-1991) averaged 1,900 mt per year. No recreational catches have been reported from this stock.
Landings in 1991 (1,800 mt) remained near the lowest on record. Catch-per-unit-effort indices in 1991 were also among the lowest ever observed. The NEFSC autumn survey

Page 70
Winter Flounder Georges Bank
5~--------------------------------------T5
'in' a
4
o 8- 3 (f1 Z
~ ~ 2 fW ::E
COMMERCIAL
LANDINGS ""
., ..... ,~,/ 'J
> ........... /, ~~~~~~ INDEX
o 0 62 64 66 68 70 72 74 76 78 80 82 84 86 88 90 92
YEAR
Table 11.2 Recreational catches and conunercial landings (thousand metric tons)
Year Category 1972-81 1982 1983 1984 1985 1986 1987 1988 1989 1990 1991
Average·
U.S. recreational Conunercial
United States 2.9 3.0 3.9 3.9 Canada ,<0.1 <0.1 <0.1 <0.1 Other 0.2
Total nominal catch 3.1 4.1 3.9 3.9
Long-tenn potential catch SSB for long-tenn potential catch Importance of recreational fishery Management Status of exploitation Age at 50% maturity Size at 50% maturity
Assessment level Overfishing definition .
2.2 <0.1
2.2
Fishing mortality rate corresponding to overfishing definition
1.8 <0.1
1.8
2.6 2.8 1.9 1.9 1.8 <0.1 <0.1 <0.1 <0.1 <0.1
2.6 2.8 1.9 1.9 1.8
Unknown Unknown
Insignificant Multispecies FMP
Overexploited 1.9 years
25.6 cm (10.1 in.) male 24.9 cm (9.8 in.) females
Index 20% MSP
>0.48
M = 0.9-0.20 Fu = Unknown F .... = Unknown FI991 = Unknown
"Landings in 1991 (1,800 mt) remained near the
lowest on record."
stock biomass index has generally trended downward since 1977. The survey index declined again in 199 ~ to the lowest value in the 27 -year survey time series.
Although a fonnal assessment of the Georges Bank stock has yet to be conducted, commercial and survey data both indicate that the stock has declined to record low levels, and is overexploited.
Southern New EnglandMiddle Atlantic
Commercial landings from the southern New England-Mid-Atlantic area increased from roughly 4,000 mt in the mid-1970s to nearly 12,000 mt in 1981. Recreational catches are unknown for that period. Commercial catches have declined steadily from their early 1980s level, while recreational catches increased from 1980 to 1985, and then declined. The combined recreational and commercial landings increased 20 percent between 1990 and 1991, from a record low of 4,500 mt to 5,809 mt, the thir~ lowest .observation in the 12-year time series. Commercial laridings in 1991 (4,700 mt), although 3 t' percent above the near-record low 1990 level (3,600 int), remained well below historical averages (6,800 mt, 1964-1991). Recreational landings declined from 2,000 mt in 1989 to approximately 900 mt in 1990 and 1,I00mtin 1991, record low levels.
NEFSC spring survey indices show trends similar to those of commercial catches since about 1975, iricreasing through 1981 and genenilly declining, with the exception of 1985,
- to near record-low levels between 1989 and 1991. Commercialcatch-per-uniteffort indices (tonnage class 3 otter trawlers) showed a continuous decline from the 1964-1983 average of2. 7 mt/ dfto a record low of 0.8 rot/df in 1989,

'Iii' (:) o B VJ
Winter Flounder southern New England-Georges Bank
16,-------------------------------------------r6
12
COMMERCIAL /LANDINGS
Z 8 ~ u 0:: IW ~
4
SPRING i ,-SURVEY /; ... ,_ /' '<-\ ,f"'--, INDEX r <ii.., __ .,. .... "'.../ ... --"
- ~" ... r, .... ~ ...... ".' ~,_' ~.,.IJIIIIP'··...,,, ... ". o 0
62 64 66 68 70 72 74 76 78 80 82 84 86 88 90 92
YEAR
Table 1 L3 Recreational catches and. conunerciallandings (thousand metric tons)
Category 1972-81 1982 1983 Average
U,S, recreational 3,8' 3,2 5,0 Conunercial
United States 6,3 9A 8.7 Canada <0.1 <0.1 <0.1 Other 0.3
Total nominal catch lOA 12,6 13.7
, Based on MRFSS statistics 1979-81.
Long-tenn potential catch SSB for long-tenn potential catch hnportance of recreational fishery Management
Status of exploitation Age at 50% maturity Size at 50% maturity
1984
6,4
8,9 <0.1
15,3
Fishing mortality rate corresponding to overfishing definition
M = 0.28-0.42 Fu = Unknown
1985
7,9
6,6 <0,1
14.5
Year 1986 1987 1988 1989 1990 1991
3,3 4_0 3,9 2,0 0,9 1.1
4_9 5.2 4.3 3.7 3.6 4_7 <0.1 <0.1 <0.1 <0.1 <0,1 <0.1
8.2 9.2 8.2 5,7 4,5 5.8
Significant Multispecies FMP (NEFMC)
FMIP for Inshore Stocks of Winter Flounder (ASMFC)
Overexploited 3.1 years
29.0 em (11.4 in.) males 27.6 em (10.9 in.) females
Index 20% MSP (NEFMC)
40% (ASMFC)
>0.57 (NEFMC) >0.32-1.01 (ASMFC)
F = Unknown mu
Page 71
'There are uncertainties, however, in the stock structure in this region
with suggestions of many localized groups."
and have remained low since then (0.8 mt/df in 1991).
Continued low commercial and survey indices in the recent years suggest that any incre~ in landings will not be sustainable in the near future. There are uncertainties, however, in the stock structure in this region with suggestions of many localized groups. Thus, local fluctuations in catches might be expected since fishing pressure is not applied unifonnly throughout the region. The status of the stocks can not be detennined with certainty without increasing the level of the assessment, although it appears likely that on average the stocks are overexploited .
For further information
Almeida, F.P. 1989. Allocation of recreational catch statistics using MRFSS intercept data and applicationtowinterflounder. NOAA Technical Memorandum NMFS-FjNEC-73.
Foster, K. L. 1987. Status of winter flounder Pseudopleuronectes americanus stocks in the Gulf of Maine, Southern New England and Middle Atlantic areas. NEFC Woods" Hole lAboratory Reference Document 87-06.
Gabriel, W.L. 1985. Spawning stock biomass per recruit analyses for seven northwest Atlantic demersal finfish species. NEFC Woods" Hole lAboratory Reference Document 84-04.
Gabriel, W.L. and K.L. Foster. 1986. Preliminary assessment of winter flounder (Pseudopleuronectesamericanus Walbaum). NEFSC Woods" Hole lAboratory Reference Document 86-16.
NEFSC. 1992. Report of the 13th Northeast Regional Stock Assessment Workshop. NEFSC Reference Document 92-02.

Page 72
Windowpane Flounder
. Windowpane or sand flounder, ScophthalmUs aquosus, is a trun-bodied, left-handed flounder distributed along the Northwest Atlantic continental shelf from the Gulf of st. llwrence to Florida.. The greatest commerCial concentrations exist in waters less than 46 m (25 fathoms) from Georges Bank and Southern New England. Sexual maturity occurs between ages 3 and 4. Spawning occurs from late spring to autumn, peaking in July-August on Georges Bank and September in Southern New England. Windowpane commonly attain lengths up to 41 cm (16.1 in.).
No stock structure information is presently available. A provisional summary of information is given for two areas corresponding· to survey strata, based on suggested differences in growth, maturity and abundance trends between fish from Georges Bank and Southern New England. Because the proportion of landings contributed by the Gulf of Maine and Mid-Atlantic areas is low (less than 7 percent), information from these two areas is combined with that from Georges Bank and Southern New England areas, respectively.
The principle commercial fishing gear for windowpane flounder is the otter trawl. Recreational and foreign catches are insignificant although rustoric foreign catches in the industrial fishery category may have been substantial. The windowpane fishery is managed under the NEFMC's Multispecies FMP. United States landings in 1991 (3,700 mt) were nearly twice those in 1990 (1,900 mt), and were about 45 percent greater than recent average landings (2,500 mt, 1986-1990).
NMFS photos by Brenda Ftguerldo

"Increased landings in 1991,largely due to
record landings in areas adjacent to the U.S.
Canada boundary on Georges Bank, probably reflect an expansion of the fishery offshore, as well as the targeting of
windowpane flounder as an alternative to other
depleted flatfish stocks."
Windowpane were first exploited as a commercial species in 1943-1945 during the end of World War II. Between then and 1975, these fish were exploited (and reported) only as an industrial species. Separate commerciallandings data for this species were first available in 1975. Commercial landings declined from 1975 to 1976, to a low of 900 mt in 1980. Subsequently, annual landings increased to a peak of 4,200 mt in 1985 and are now at 87 percent of this record level, at 3,700 mt.
Gulf of Maine-Georges Bank
Commercial landings from the Gulf of Maine-Georges Bankarea have fluctuated between 400 and 2, 100 mt through 1990, and have averaged 1,100 mtsince 1975. Landings in 1991 (2,900 mt) show a 165 percent increase from 1990 levels. No recreational catches have been reported from this area.
Increased landings in 1991, largely due to record landings in areas adjacent to the U.S.-Canada boundary on Georges Bank, probably reflect an expansion of the fishery offshore, as well as the targeting of windowpane flounder as an alternative to other depleted flatfish stocks. NEFSC autumn offshore indices are highly variable, but have declined substantially since 1984. Preliminary indices of commercial catch-per-unit-effort show a declining trend since 1975. It is thus likely that this stock is overexploited.
Page 73
Windowpane Flounder Gulf of Maine-Georges Bank
3~----------------------------------------T3
..-LANDINGS
o 0 62 64 66 68 70 72 74 76 78 80 82 84. 86 88 90 92
YEAR
Table 12.1 Recreational catches and conunerciallandings (thousand metric tons)
Year Category 1975-81' 1982 1983 1984 1985 1986 1987 1988 1989 1990 1991
Average
U.S. recreational Conunercial
United States 0.9 0.4 0.5 0.7 2.1 1.8 1.4 0.8 1.6 1.1 2.9 Other
Total nominal catch 0.9 0.4 0.5 0.7 2.1 1.8 1.4 0.8 1.6 1.1 2.9
, Landings not reported by individual species herore 1975.
Long-term potential catch SSB for long-term potential catch Importance of recreational fishery Management Status of exploitation Age at 50% maturity Size at 50% maturity Assessment level Overfishing definition Fishing mortality rate corresponding
to overfishing definition
Fo.1 = Unknown
Unknown Unknown
Insignificant Multispecies FMP
Overexploited Unknown
22 cm (8.7 in.) Index
Under development
Unknown
F ... = Unknown F1lI91 = Unknown

Page 74
"Both NEFSC autumn offshore survey indices and preliminary indices of commercial catch
per-unit effort have declined since the early . 1980s to record-low
levels in recent years."
Southern New EnglandMiddle Atlantic
Commercial landings from the Southern New England-Mid-Atlantic area averaged 700 mt in the first decade of the fishery. Landings between 1986 and 1990 averaged 1,200mtand have generally declined since 1985 peak levels of 2,100 mt. No recreational catches have been reported from . this area. Landings in 1991 (800 mt) declined 9 percent from 1990 and approach the low levels observed prior to 1985.
Both NEFSC autumn offshore survey indices and preliminary indices of commercial catch-per-unit effort have declined since the early 1980s to record -low levels in recent years. This would indicate that this stock is overexploited.
For further information
.. .
Bigelow, H.B., and W.C. Schroeder. 1953. Fishes of the Gulf of Maine. Fish. Bull., U.S. 53.
Moore, E.L. 1947. Studies on the marine resources of Southern New England, VI: The sand flounder, Lophopsetta aquosa (Mitchill); a
. general study of the species with special emphasis on age determination by means of scales and otoliths. Bull. Bingham Oceanogr. Collect. Yale Univ.1l(3):1-79.
O'Brien,L.,Bumett,J. andR.K. Mayo. In press. Maturation of nineteen species of finfish off the northeast coast of the United States, 1985-1990. NOAA Tech. Rep.
"iii' b 0 8-(/) Z
~ U ~ I-W ::::!E
Windowpane Flounder Southern New England-Middle Atlantic
2.5--r-.---------------------r2
2
1.5
LANDINGS
0.5
,-...
~ 1.5·3
~ i'-u !<i u z j ::::!E
Cl w c::::
0.5 ~. 0:: l(/)
o 0 62 64 66 68 70 n 74 76 78 80 82 84 86 88 90 92
YEAR
Table 12.2 Recreational catches and cornmerciallandings (thousand metric tons)
Year Category 1975-81' 1982 1983 1984 1985 1986 1987 1988 1989 1990 1991
Average
u.s. recreational Commercial
United States 0.7 0.7 0.8 1.1 2.1 1.4 0.9 1.8 1.1 0.9 0.8 Other
Total nominal catch 0.7 0.7 0.8 1.1 2.1 1.4 0.9 1.8 1.1 0.9 0.8
, Landings not reported by individUAl species before 1975.
Long-term potential catch SSB for long-term potential catch Importance of recreational fishery Management Status of exploitation Age at 50% maturity Size at 50% maturity Assessment level Overfishing definition Fishing mortality rate corresponding
to overfishing definition
M = Unknown FO.I
= Unknown
unknown Unknown
Insignificant Multispecies FMP
Overexploited Unknown
21 cm (8.3 in.) Index
Under development
Unknown
F mu = Unknown FI991 = ·Unknown

Goosefish, also called monkfish or angler, Lophius americanus, range from the Grand Banks and northern Gulf of st. Lawrence south to Cape Hatteras, North Carolina. These fish exhibit a eurybathic depth distribution from the tideline to as deep as 840 m, although few larger individuals are found deeper than 400 m (475 fathoms). Goosefish have been found in waters ranging from 00 to 24°C (32° to 74° F), but are most abundant in the range of 3° to llOC (38° to 52° F), depending on the region. Seasonal migrations appear to be related to avoiding water wanner than 15°C (60" F), or availability of preferred foods such as squids, butterfish, hakes, and sand lance.
The goosefish has been described as mostly mouth with a tail attached, and reports of goosefish eating prey almost as big as themselves are common. Growth is fairly rapid and similar for both sexes up to age 4,47 to 48 cm (19 in.). After this, females grow a bit more rapidly and seem to live longer, about 12 years, reachlng a size of slightly more than 100 cm (39.4 in.). Males have not been found older than age 9, approximately 90 cm (35.4 in.), with few older than age 6.
Female goosefish mature after about 4 years, 49 cm (19.3 in.), and males after 3 years, 37 cm (14.5 in.). Goosefish spawn in spring, summer, and early autumn (depending on latitude). This a protracted period during whlch the females lay a non-adhesive, mucoid egg raft or veil that is buoyant and contains a complex structure of individual chambers, each containing one to three eggs and an opening for water circulation. This veil is unique to goosefishes, and can be as large as 12 m (39 ft) long by 1.5 m (5 ft) wide. Incubation ranges from 7 to 22 days, after whlch the larvae spend several months in a pelagic phase before settling to a benthlc existence at a size of about 8 cm (3.1 in).
Goosefish have hlstorically been
Page 75
Goosefish
Scientist Bob Livingston manhandles goosefish, 1960s survey NMFSphoro
almost exclusively a bycatch of groundfisbing and scalloping ventures. Until recently, thls species was not common in U.S. markets, consequently, most of the U.S.-caught fish went to shack. Now, however, goosefish, or poor-roan's lobster, is being sold in response to the dwindling supply (and rising prices) oftraditional species of groundfish. In the last ten years, goosefish livers have also found a growing market (mostly as exports to Japan), and as a result landings have shown a steady increase from 1970 to 1990. Landed weight of tails rosefrom 19.3 mt in 1964 to 643 mt in 1975, and from 1975 to 1980 increased to 2,305 mt. By 1989,4,323 mt were landed (representing about 11,000 mt of live weight) before dropping to 3,844 in 1990 and rising again in 1991 to 4,532 mt. Over the lastten years, calculated live weight for all goosefish parts (tails, whole fish, livers, cheeks, and belly flaps) landed haS risen steadily from around 2,600 mt in 1982 to 13,800 mt in 1991. From 1964 to the mid-1970s, the majority of landed goosefish were taken in otter trawls in the southern Gulf of Maine and northwestern Georges Bank regions. In the late 19705, otter trawls
began landing measurable quantities from Southern New England and a greater portion of the Gulf of Maine and Georges Bank. At the same time, scallop dredges working on Georges Bank and in Southern New England and the mid-Atlantic began landing goosefish tails in increasing numbers. At the present, scallop dredges account for about 50 percent of the landed tails. Otter trawls and scallop dredges have accounted for more than 90 per
'cent of all landings. In the last five . years, there has been a constant increase in the number of trips that are landing goosefish in all areas. There also seems to be an increase in the number of directed goosefish trips for some vessels fishlng with trawls, scallop dredges and sink gill nets.
The steady growth of the liver market has also been of interest. From 1982, when 10 mt where landed, this product jumped to 28 mt in 1985 and to 180mtin 1990. In 1991,271 mtofthis product were landed. Along with this increase in landings, there has been a significant increase in ex-vessel price. With prices rising from $0.92/1b in 1982, to $4. 16/1b in 1991, the proportion of total goosefish revenues represented by livers has grown from < 1

Page 76
Goosefish Gulf of Maine-Middle Atlantic
5,-------------------------------------------r5
'VI' 4 b o 2-~ ~ i..J.... o (/')
:3
Z 2 ~ U
~ w ~
-en 4.c.. 3 o ~
3U ~ U Z <t:
2~ Cl w [i:
~ 10:::
f(/')
o 0 62 64 66 68 70 72 74 76 78 80 82 84 86 88 90 92
. YEAR
Table 13.1 Recreational catches and commercial landings (thousand metric tons)
Category 1972-81 1982 1983 1984 Average
U.S. recreational <0.1 <0.1 <0.1 <0.1 Commercial
United States Ll 2.6 2.6 2.6 Canada <0.1 <0.1 <0.1 0.3 Other
Total nominal catch 1.2 2.6 2.6 2.9
Long-tenn potential catch SSB for long-tennpotential catch Importance of recreational fishery Management Status of exploitation Age at 50% maturity
Size at 50% maturity
Overfishing definition Fishing mortality rate corresponding
to overfishing definition
M=O~ FO•1 = Unknown
Year 1985 1986
<0.1 <0.1
3.0 2.4 1.3 0.3
4.3 2.8
1987 1988 1989 1990 1991
<0.1 <0.1 <0.1 <0.1 <0.1
6.9 8.1 11.6 10.6 12.8 0.7 0.9 1.2 1.6 1.0
7.7 9.0 12.8 12.2 13.9
Unknown Unknown
Insignificant None
Overfished 4 years, females
3 years, males 49 cm (19.3 in.) females
37 cm (14.6 in.) males Index None
Unknown
Fmu = 0.2 FI991 = >~IDU
'The increase in landings of tails and livers may
indicate a true increase in fishing mortality that is being expressed in the
survey index."
percent to almost 12 percent in that time. Additionally, in 1991 a new market category was added. "Peewee" tails are tails that weigh less than one-half pound. These "drumsticks" come from fish that are slightly less than 15 in.long. In 1991, 80,OOOlb (36 mt) of this size category were landed.
Since this fish was until recently only bycatch from other fisheries, catch-per-unit-effort (CPUE) data are difficult to obtain. However, the NEfSC autumn survey biomass index shows a reasonably sharp decline over the last 15 years. The average standardized catch-per-tow over the last 10 years is 1.01, kg/tow, compared with 2.37 kg/tow, the average of preceeding years. In the last 5 years, this value has been less than 1.0 kg/tow and in 1990, the value of 0.82 kg/tow was the third lowest on record. In 1991, the index rose to 0.9 kg/tow, still well below any values previous to 1982.
Given the near-record low abundance of the stock and sharp increases in landings in recent years, the stock apPears to be overfished.
For further information
Annstrong, M.P. 1987. Life history of the goosefish, Lophius americanus. Williamsburg, Virginia: College of William and Mary .. Master's thesis.
Bigelow, H.B. and W.C. Schroeder. 1953. Fishes of the Gulf of Maine. Fish. Bull., U.S. 53:1-577.
Grosslein, M.D. and T.R. Azarovitz. 1982. Goosefish, Lophius americanus. In: Fish distribution. MESA New York Bight Atlas Monograph 15. Albany, New York: New York Sea Grant Institute.
NEFSC. 1992. Report of the 14th Northeast Regional Stock Assessment Workshop. NEFSC Reference Document 92-07.

Scup or porgy, Stenotomus chrysops, occurs primarily in the MidAtlantic Bight from Cape Cod to Cape Hatteras. Seasonal migrations occur during spring and autumn. In summer, scup are common in inshore waters from Massachusetts to Virginia, while in winter scup are found in offshore waters between Hudson Canyon and Cape Hatteras at depths ranging from 70to 180m (38 to 98 fathoms). Sexual maturity is essentially complete by age 2 at a total length of 19 cm (7.5 in.); spawning occurs during summer months. Although ages up to 20 years have been reported, recent catches have been dominated by age 2 to 3 fish. Scup attain a maximum length of about 40 cm (16 in.). Tagging studies have indicated the possibility of a Southern New England stock and another stock extending south from New Jersey. Because the separation of stocks is not well-defmed spatially, this separation is not used here.
The principal commercial fishing gear is the otter trawl. Recreational catches are significant. With the exception oflocal regulation within individual state waters, the fishery is not yet subject to management although a fishery management plan is being projected. Landings increased 70 percent in 1991 (from6,I00mtto 1O,400mt), with higher catches reported in both commercial and recreational fisheries.
Nominal commercial catches by U . S. vessels fluctuated between 18,000 and 22,000 mt annually between 1953 and 1963, but declined to between 4,000 and 5,000 mt during the early 1970s. Nominal catches by distantwater fleets peaked at 5,900 mt in 1963, but declined to less than 100 mt per year after 1975. Beginning in the early 1970s, the u.S. nominal commercial catch steadily increased and reached a peak of 9,800 mt in 1981. Landings declined significantly thereafter. Commercial landings of 6,700 mt in 1991 followed record-low land-
ings in 1989 (3,600 mt) and the fourth lowest level on record (since 1930) in 1990 (4,200 mt).
Most of the increase in landings during the 1970s is attributable to increased fixed-gear and otter trawl catches in the Southern New EnglandNew Jersey area. The Virginia winter trawl fishery, which produced nominal catches in excess of 5,000 mt in the early 1960s, has averaged less than 350 mt in the past 10 years. The proportion taken by the Virginia fishery has declined from 40 to 60 percent of the total prior to 1967, to 2 to 16 percent since 1973. "Recreational catches represent 20 to 50 percent of total nominal catches during the past ten years. The 1991 recreational catch (3,700 mt) is nearly double the 1990 level (1,900 mt) and about 25 percent greater than the 1981-1990mean (3,000 mt).
Catch-per-unit-effort of Southern New England otter trawlers decreased 6.2mt/dayin 1977-79t05.8 mt/dayin 1982-84, and to 3.0 mt/day fished in
Page 77
Scup
NMFS photo by Bmnda Figuerido
1989-90, approaching record low levels of 1971-72. In 1991, values increased substantially, equaling the 1982-84 average. The NEFSC autumn offshore survey index (age 1 and older) is very variable. The index increased sharply from 1979 to the second highest value in the time series in 1981. Since 1981, the index has fluctuated widely, but is trending downward. The 1987-88 indices were the lowest observed in the time series. The 1991 index, although above 1987-1988 levels, is still the fifth lowest value obServed in the time series.
A comparison of scup length-frequencies from the commercial fisheries during 1983-91 reveal that commerciallength-frequency distributions have shifted to smaller fish (including young-of-year). There are generally few older scup, those longer than 35 cm (14 in.) and older than 7 years, in either commercial or recreational fisheries. The maximum length observed in NEFSC autumn surveys has declined from a mean of 30 cm (14 in.)

Page 78
Scup Southern New England-Middle Atlantic
12.-----------------------------------------~4
COMMERCIAL /LANDINGS
", ' " ''''', jI ,~
; \ .
,j \\ .-i' \\ i \1.,.: ,-- \
33 o
~ u ~
2U Z « w ~
o· w c::
1~ , '~',f- \ \ I' ',' \; ~ , \.... \' ..1' ..... ~,
'"",":
T-~~,-~~,-~~,_~~~~~~~~~~O 76 78 80 82 84 86 88 90 92
YEAR Table 14.1 Recreational catches and commercial landings (thousand metric tons)
Year Category 1972-81 1982 1983 1984 1985 1986 1987 1988 1989 1990 1991
Average
U.S. recreational Commercial
United States
3.2'3.1 3.4 1.4 3.3 5.9 3.2 2.3 3.2 1.9 3.7
7.3 8.7 7.8 7.8 6.7 6.9 6.1 5.8 3.6 4.2 6.7' Canada, Other O.S <0.1 <0.1 <0.1 <0.1
Total nominal catch 11.0 ll.8 11.2 9.2 10,0 12.8 9.3
I Based on 1979-1981 MRFSS statistics. , Preliminary estimate.
Long-tenn potential catch SSB for long-tenn potential catch Importance of recreational fishery Management Status of exploitation Age at 50% maturity Size at 50% maturity Assessment level Overfishing definition Fishing mortality rate corresponding
to overfishing definition
M=0.20 Fo.J = 0.20 FIDIIJ[ = 0.35
8.1 6.8 6.1 10.4
10,000 to 15,000 mt Unknown
Major None
Overexploited 2 years
15.5 cm (6.1 in.) Yield-per-recruit
Under development
Under development
'The truncated age distributi?ns suggest that exploitation is focusing on young fish, and that the fishery is probably
dependent on incoming year classes."
between 1982 and 1986, to 24 cm (9.5 in.) between 1987-199 L Instantaneous fishing mortality (F) in the Southern New England area was estimated to be about 0.3 in 1981 but has probably exceeded F max in recent years.
Although landings and catch-perunit-effort increased in 1991 from nearrecord lows in 1989-1990, the overall declining trend in survey indices suggest that recent exploitation has reduced stock abundance substantially. The truncated age distributions suggest that exploitation is focusing on young fish, and that the fishery is probably dependent on incoming year classes. These considerations clearly indicate that the population is overexploited.
For further information
Mayo, R K., 1982. An assessment of the scup, Stenotomus chrysops (L.), popUlation in the Southern New England and Mid-Atlantic regions. NEFC Woods Hole Laboratory Reference Document 82-46.
Northeast Fisheries Center. 1989. Report of the 7th NEFC Stock Assessment Workshop. NEFC Woods Hole Laboratory Reference Document89-04. Available from: NOAA/ NMFS, Northeast Fisheries Science Center, Woods Hole, MA 02543.
Northeast Fisheries Center. 1990. Report of the 11th NEFC Stock Assessment Workshop. NEFSC Reference Document 90-09. Available from: . NOAA/NMFS, Northeast Fisheries Science Center, Woods Hole, MA 02543.

Black sea bass, Centropristis striata, occur off the northeastern United States along the entire Atlantic coast, and consist of two stocks north and south of Cape Hatteras, North Carolina. The northern group of black sea bass winter along the 100 m (55 fathom) depth contour off Virginia and Maryland, then migrate north and west into the major coastal bays and become associated with structured bottom habitat (reefs, oyster beds, wrecks).
Spawning begins in March off North Carolina and occurs progressively later (until October) further north. Most black sea bass begin life as females and later transform into males. Both sexes reach 50 percent maturity by age 2 with the median size at maturity for males and females at 19.0 and 19.1 cm (7.5 in.), respectively. Transformation from female to male generally occurs between ages 2 and 5. Females are rarely found older than 8 years (>35 cm or 14 in.), while males may live up to 15 years (>60 cm or 24 in.). Black sea bass are ollUlivorous, feeding on crustaceans, molluscs, echinodenns, fish, and plants.
The principal commercial fishing gears used to catch black sea bass are otter trawls and fish traps. Recreational fishing is as significant as commercial fishing. Currently there is no management outside state waters. Total catch declined in 1991 to 2,000 mt, down from 2,800 mt in 1990.
Reported commercial landings north of Cape Hatteras fluctuated around 2,6OOmt from 1887 until 1948, when landings increased to 6,900 mt. Landings peaked at 9,900 mt in 1952, declined steadily to 600 mt in 1971, and then increased to 2,400 mt in 1977. Between 1980 and 1990, commercial landings have ranged from 1,100 to 1,900 mt, with average landings of 1,470 mt. Total landings have fluctuated without trend in the 1980s, punctuated by years with much higher recreational catches. Commercial land-
Page 79
Black Sea Bass
ings in 1991 were 1,080 mt. The only reported catch by distant-water fleets was 1,500 mt in 1964. Estimated recreational landings, occurring primarily in the middle Atlantic states, have ranged from 500 mt to 8,100 mt in the 1980s, with no apparent trend. (The high values for 1982 and 1986,8,100 mt and 6,300 mt respectively, are due in part to sampling effects.)
The estimated recreational landingshave contributed 31 percent (1981) to 87 percent (1982) of the total nominal catch in the past ten years. Estimated recreational landings for 1991 from the Middle Atlantic and New England regions were 916 mt.
Standardized catch-per-unit -effort (CPUE, mt/days fished in trips landing 25 percent or more black sea bass) in the Mid-Atlantic trawl fishery peaked at 3.56 in 1984, declined to 1.26 in 1986 and increased to 2.60 in 1988. Catch-per-unit-effort for 1991 decreased to 0.59 mt/days fished. Data from the NEFSC spring offshore bottom trawl survey indicate an increase inabundancefrom 1970(0.1 fish/tow)
to 1977 (8.2 fish/tow), followed by a decline to 0.3 fish/tow in 1985. Indices increased to 2.4 fish/tow in 1986, but have dropped to 1.1 fish/tow in 1991. Prerecruit indices (fish < 12 cm) from the autumn inshore bottom trawl survey indicate above-average year classes occurred in 1977, 1982, and 1986. Recruitment in 1991 appears below average.
Size composition data from commerciaJ landings indicate that black sea bass recruit fully to the trap and trawl fisheries by ages 2 and 3, respectively. The biologically optimum age at first harvest for black sea bass, based on yield-per-recruit analysis, is 6 years at F=O.3. High prerecruit indices from the NEFSC survey correspond to increased commercial landings two years later, but periods of higher landings (and CPUE) are boef. This suggests that the fishery tends to reduce incoming year classes rapidly. The assessment information is insufficient to alIowa definitive understanding of the status of this stock, but the stock would appear to be overexploited.

Page 80
Black Sea Bass Gulf of Maine-Middle Atlantic
5~----------------------------------------~10
'iii' b
4
a B3 (/) Z ~ Sd 2 Cl::: r--w ~
SPRING SURVEY" INDEX [\
: ;
.""'" "~ ... " .1
~ .. ". o a 62 64 66 68 70 72 74 76 78 80 82 84 86 88 90 92
YEAR
Table:: 15.1 Recreational and conunerciallandings (thousand me::bic tons)
Year Category 1972-81 1982 1983 1984 1985 1986 1987 1988 1989 1990 1991
Average
U.S.1Ure8.tional 1.2' 8.1 2.3 0.7 Conunacial
Unitc::d Stales 1.4 1.2 1.5 1.9 Canada Otha
Total nominal catch 2.6 9.3 3.8 2.6
, Preliminary estimllte. 2 1979-1981.
Long-tenn potential catch SSB for long-tenn potential catch Importance of recreational fishery Management Status of exploitation Age at 50% maturity Size at 50% maturity Assessment level Overfishing definition
1.5
1.2
2.7
Fishing mortality rate corresponding to overfishing definition
M=O.2 FG.1 =0.11
6.3
1.8
8.1
1.0 1.6 2.1 1.3 0.9'
1.8 1.7 1:2 1.5 1.1
2.8 3.3 3.3 2.8 2.0'
Unknown Unknown
Major Some state regulations
Overexploited 2 years
19 cm. (7.5 in.) Yield-per-recruit
Under development
Unknown
F = 0.17 DIU
"High prerecruit indices from the NEFSC survey
correspond to increased commercial landings two years later, but periods of
higher landings (and CPUE) are brief. This
suggests that the fishery tends to reduce incoming
year classes rapidly. "
For further information
Low, B.A., Ir. 1981. Mortality rates and management strategies for black sea bass off the southeast coast of the United States. NonhAmer. J. of Fisheries Mgmt. 1(2):93-103.
Musick, I.A. and L.P.Mercer: 1977. Seasonal distribution of black sea bass, Centropristis striata, in the Mid-Atlantic Bight with comments on the ecology of fisheries of the species. Trans. Am. Fish. Soc. 106(1): 12-25.
Northeast Fisheries Center. 1990. Report of the 11th Northeast Regional Stock Assessment Workshop. NEFSC Reference Document 90-09. Available from: NOAA/NMFS, Northeast Fisheries Science Center, Woods Hole, MA 02543.

The ocean pout, Macro'l.oarces americanus, is a demersal eel-like species ranging from Labrador to Delaware that attains lengths of up to 98 cm (39 in.) and weightsof5.3 kg (14.2Ib). Ocean pout prefer depths of 15 to 80 m (8 to 44 fathoms) and temperatures of 6° to 7°C (43° to 45°F). Tagging studies and NEFSC bottom-trawl survey data indicate that ocean pout do not undertake extensive migrations, but rather move seasonally to different substrates. During winter and spring, ocean pout feed over sand or sandgravel bottom and are vulnerable to otter trawl fisheries. In summer, ocean pout cease feeding and move to rocky areas, where spawning occurs in September and October. The demersal eggs are guarded by both parents until hatching. During this period, ocean pout are not available to commercial fishing operations. Catches. typically increase when adults return to their feeding grounds in late autumn arid winter. The diet consists primarily of invertebrates, with fish being only a minor component.
Stock identification studies suggest the existence of two stocks: one occupying the Bay of Fundy-northern Gulf of Maine region east of Cape Elizabeth, and a second stock ranging from Cape Cod Bay south to Delaware. The southern stock is characterized by faster growth rates, and to date has supported the commercial fishery.
The principal fishing gear used to catch ocean pout is the otter trawl, and the fishery occurs primarily between December and May each year. Fishing in federal waters is managed under the. New England Fishery Management Council's Multispecies FMP; the state of Massachusetts regulates the inshore fishery in Cape Cod Bay. Total nominallandings increased slightly in 1991 (from 1,300 mtto 1,400 mt).
Commercial interest in ocean pout has fluctuated widely. Ocean pout were marketed as a food fish during
Page 81
Ocean Pout
World War II, and landings peaked at 4,500 mt in 1943. However, an outbreak of a protozoan parasite that caused lesions on ocean pout eliminated consumer demand for this species as food. From 1964 to 1974, an industrial fishery developed, and nominal catches by the U.S. fleet averaged 4,700 mt. Soviet vessels began harvesting ocean pout in large quantities in 1966 and total nominal catches peaked at 27,000 mt in 1969. Foreign catches declined substantially afterward, and none have been reported since 1974. United States nominal
NMFSphoto
. catches declined to an average of 600 mt annually during 1975 to 1983.
Catches increased in 1984 and 1985 to 1,300 mt and 1,500 mtrespectively, due to the development of a small directed fishery in Cape Cod Bay supplying the fresh fillet market. Landings· have since remained relatively constant, averaging about 1,450 mt annually. Although a relatively strong 1987 year class recruited to the commercial fishery in 1990-1991, landings in 1992 and 1993 are expected to approximate those in recent years due to the limited market for the species.

Page 82
'Vi' b o
16
Ocean Pout Middle Atlantic-Gulf of Maine
~------,-------------~----------~8
S. 12 (f) Z
~ ~ 8 a:: IW ~
4
~~~~-,-,~~~~~~~~~~~o 64 66 68 70 72 74 76 78 80 82 84 86 88 90 92
YEAR Table 16.1 Recreational and cormnerciallandings (thousand mebic tons)
Year Category 1972-81 1982 1983 1984 1985 1986 1987 1988 1989 1990 1991
Average
U.S. recreational Commercial
United States 1.3 0.3 0.4 1.3 Canada' Other 0.4
Total nominal catch 1.7 0.3 0.4 1.3
Long-tenn potential catch SSB for long-tenn potential catch Importance of recreational fishery Management
Status of exploitation Age at 50% maturity
. Size at 50% maturity! Gulf of Maine
Southern New England
Assessment level Overfishing definition Fishing mortality rate corresponding
to overfishing defmition
-
1.5 0.8
I.S 0.8
2.2 1.8 1.3 1.3 1.4
2.2 1.8 1.3 1.3 1.4
Unknown Insignificant
Multispecies FMP and state regulations Fully exploited
Unknown
26.2 cm (10 in.), females; 30.3 cm (12 in.), males
31.3 em (12 in.), females: 31.9 cm (13 in.), males
Index 20% MSP
Unknown
M = Unknown Fo.\ = Unknown F = UnknownF = Unknown JDU 1991
1 Ocean pout appear to have a three-year egg development period.
" ... catches at the present level appear sustainable. "
Landings from southern New England dominated the catch for the fourth consecutive year, accounting for 75 percent of the total 1991 U.S. harvest, reversing landing patterns observed in 1986-1987 when the Cape Cod Bay fishery was dominant.
Due to the ocean pout'~ pattern of seasonal distribution, the NEFSC spring survey index is more useful than the autumn survey for evaluating relative abundance. The Massachusetts spring inshore survey appears to be useful in the identification of strong year classes. From 1968 to 1975 (encompassing peak. levels of foreign fishing and the domestic industrial fishery), commercial landings and NEFSC Spring survey indices followed similar trends; both declined from historic high values in 1968-1969 to lows of 300 mtand 1.6 kg/tow, respectively, in 1975. Between 1975 and 1985,survey indices increased to record high levels, peaking in 1981 and 1985. Subsequently, survey catch-per-tow indices have fluctuated about the long-tenn survey average; the spring 1991 index was 3.9 kg per tow.
The population appears to be fully exploited, and catches at the present level appear sustainable.
For further information
Northeast Fisheries Center. 1990. Report of the 11 th NEFC Stock Assessment Workshop. NEFSC Reference Document 90-09.
Olsen, Y. H., and Merriman, D. 1946. Studies on the marine resources of southern New England, IV: The biology and economic importance of the ocean pout, Macrozoarces . americanus (Bloch and Schneider). Bull. Bingham Oceanogr. Collec. 9:1-184.
Orach-Meza, F. L., 1975. Distribution and abundance of ocean pout, Macro1.oarces americanus (Bloch and Schneider), in the western North Atlantic Ocean. Kingston, RI: University of Rhode Island. Master's thesis.

The white hake, Urophycis tenuis, a boreal specieS that occurs from N ewfoundland to Southern New England, is found on muddy bottom throughout the Gulf of Maine. Stock boundaries are uncertain, although research vessel survey data indicate that the Gulf of Maine population is more or less discrete from populations further north and east. Depth distribution varies by age and season; juveniles typically occupy shallower areas than adults, but individuals of all ages tend to move inshore or shoalward in spring and sununer, dispersing to deeper areas in autumn. Most trawl catches are taken at depths of 110 m (60 fathoms) or more, although hake are taken as shallow as 27 m (15 fathoms) during gillnetting operations in summer.
In the Gulf of Maine region, spawning occurs in winter and spring, although the season and the extent of spawning is not clearly defined. White hake attain a maximum length of 135 cm (53 in.) and weights of up to 21 kg (46lb), with females being larger. Ages of more than 20 years have been documented. Juveniles feed primarily upon shrimp and other crustaceans, but adults feed almost exclusively on fish, includingjuveniles of their own species.
The principal fishing gear used to catch white hake are otter trawls and gill nets. Recreational catches are insignificant, and foreign catches are of minor importance. Fishing is managed under the New England Fishery Management Council's Multispecies FMP. Total landings increased slightly in 1991 (6,200 mt) compared with 1990 (5,500 mt).
The U.S. nominal catch has been taken primarily in the western Gulf of Maine both incidentally to directed operations for other demersal species and as an intended component in mixed-species fisheries. Since 1968, U.S. vessels have accounted for approximately 94 percent of the Gulf of Maine-Georges Bank white hake catch.
Page 83
White Hake
Total nominal catch increased steadily from less than 1,000 mt during the late 19605 to a peak level of 7,500 mt in 1984, declined to 5,500 mt by 1990, but increased to 6,200 mt in 1991. The increase evident throughout the 1970s and early 1980s likely reflects both a· general increase in incidental catches associated with the greater fishing power of the expanded New England otter trawl fleet and an increase in
NMFS photo by Brends Figuerido
directed fishing effort toward white hake. Small individuals are difficult to distinguish from red hake, Urophycis chuss, resulting in an unknown degree of bias in reported nominal catches.
The NEFSC autumn survey biomass index has fluctuated without any consistent long-term trends since the early 1970s, although total landings tended to follow inter-annual fluctuations until the early 1980s. Except for

Page 84
White Hake Gulf of Maine-Georges Bank
8~------------------------------------------r 18
'Iii' (:)
7
6
o 5 8-V'l Z 4 ~ u iX :3 t:i :::!:
2
,:/' ..... .
, .. i ' '~··"' .. f~ :; .
~ ; 't.= ..
16 ,...."
01 ~
14-3: 0
12~ I U
10 '< u Z
8 i:) :::!:
6 Cl w CL:
4 ~ a:: I-V'l
2
o 0 62 64 66 68 70 n 74 76 78 80 82 84 86 88 90 92
YEAR
Table 17.1 Recreational catches and conunerci8J.landings (lhousand metric tons)
Category 1972-81 1982 1983 1984 Average
U.S. recreational <0.1 <0.1 <0.1 <0.1 Conunercial
United States 4.6 6.0 6.2 6.5 Canada 0.2 0.8 0.8 1.0 Other <0.1 <0.1 <0.1 <0.1
Total nominal catch 4.8 6.8 7.0 7.5
Long-term potential catch SSB for long-term potential catch Importance of recreational fishery Management Status of exploitation
" Age at 50% maturity Size at 50% maturity Assessment level Overfishing definition
1985
<0.1
6.4 0.9
<0.1 7.3
Fishing mortality rate corresponding to overfishing definition
Year 1986 1987 1988 1989 1990 1991
<0.1
5.3 1.0
<0.1 6.3
<0.1 <0.1 <0.1 <0.1 <0.1
5.5 5.4 5.0 5.0 5.6 0.7 0.6 0.6 0.5 0.6
<0.1 <0.1 6.2 6.0 5.6 5.5 6.2
6,5OOmt Unknown
Insignificant Multispecies FMP
Fully exploited 1.4 years
34 cm (13.4 in.) Index
25th percentile of NEFSC bottom-trawl survey
biomass index
Unknown
M = Unknown Fo.1 = Unknown Fm .. = Unknown FI99I = Unknown
"Given the stability in stock biomass since 1981, the mean 1981-1990 catch of 6,500 mt
may be an appropriate estimate of the long-term
potential catch."
an anomalously low index in 1982, indices for 1981 to 1991 have been quite stable at a level 30 to 40 percent below the 1970-1980 average although the smoothed index indicates an apparent steady increase since 1982. Catches have generally declined since 1984, but still remain high relative to pre-1981 levels. Given the stability in stock biomass since 1981, the mean 1981"1990 catch of 6,500 mt may be an appropriate estimate of the longterm potential catch. Since recent catches have been close to this level, the population is considered to be fully exploited.
For further information
Burnett, 1., S. H. Clark, and L. 0 'Brien. 1984. A preliminary assessment of white hake in the Gulf of Maine -Georges Bank area. NEFC Woods Hole Laboratory Reference Document 8"4-31. " Available from: NOAA/NMFS, Northeast Fisheries Science Center, Woods Hole, MA 02543.
Northeast Fisheries Center. 1986. Report of the Second NEFC Stock Assessment Workshop. NEFC Woods Hole Laboratory Reference Document 86-09. Available from: NOAA/NMFS, Northeast Fisheries Science Center, Woods Hole, MA 02543.
Northeast Fisheries Center. 1990. Report of the 11 tho NEFC Stock Assessment Workshop. NEFSC Reference Document 90-09. Available from: NOAA/NMFS, Northeast Fisheries Science Center, Woods Hole, MA 02543.

The cusk, Brosme brosme, is a deepwater species that is found in rocky, hard-bottom areas throughout the Gulf of Maine. Spawning occurs in spring and early smnmer; eggs rise to the surface where hatching and larval development occur. When they are about 5 cm (2 in.) in length, juveniles move to the bottom where they become sedentary and rather solitary in habit. Individuals commonly attain lengths up to 80 em (32 in.) and weights up to 4.5 kg (20 lb). Little is known about stock structure.
The principal fishing gears used to catch cusk are otter trawl, longline, and gill net. Recreational fishing is insignificant and foreign catches are minor. The fishery is not under management. Total catches in 1991 were 2,100 mt), 400 mt more than in 1990, and the highest annual total since 1985.
During the late 19605 and early 1970s, annual landings were relatively stable at about 1,700 mt per year, but increased in the late 1970s - early 1980s, peaking at 3,800 mt in 1981. Subsequently, landings gradually declined reaching a low of 1,500 mt in 1988. Since 1989, landings have been increasing. The bulkofthe U.S. catch has been taken from the Gulf of Maine while nearly all of the Canadian catch has been from Georges Bank. The 1991 U.S. catch was 1,500 mt and accounted for 71 percent of the total yield. Canadian landings in 1991 were 600 mt.
Historically, otter trawls have accounted for between 50 and 87 percent of the annual U.S. landings. In 1985-1986, longline landings of cusk markedly increased (to 23 percent of the total landings) as a result of a new auto-Iongline fishery. This fishery ceased operations in 1987 however, and longline gear accounted for only 5 percent of the total landings during 1987-1989. The fishery became active again in 1990-1991 and accounted
for 17 percent of the landings. Otter trawls, however, still accounted for the majority of the landings in 1991 (56 percent).
The NEFSC autumn survey index has fluctuated during the time series.
Page 85
Cusk
NMFS photo by Brenda Figuerido
The 1991 autumn index increased slightly from the very low 1990 value.
Annual landings have generally declined since 1981, and survey indices of abundance have declined substantially in recent years. The current

Page 86
'Vi' b, 0 0 ........... (/) Z
~ u 0:: I-W ~
Cusk Gulf of Maine-Georges Bank
4~------------------------------------------r4
.3
2
AUTUMN ~ \f SURVEY / ~ INDEX '
o a 62 64 66 68 70 72 74 76 78 80 82 84 86 88 90 92
YEAR
Table 18,1 Recreational catches and commercial landings (thousand metric tons)
Year Category 1972-81 1982 1983 1984 1985 1986 1987 1988 1989 1990 1991
Average
V,g, recreational <0.1 <0.1 0.1 <0,1 Commercial
V ni ted States 1.4 1.8 1.8 1.7 Canada 0.6 1.2 0.6 0.5 Other
Total nominal catch 2,0 3,0 -2.4 2.2
Long-tenn potential catch SSB for long-tenn potential catch Importance of recreational fishery Management Status of exploitation Age at 50% maturity Size at 50% maturity Assessment level Overfishing definition Fishing mortality rate corresponding
to overfishing definition
<0,1 <0.1 <0.1 <0,1
2,3 1.8 1.4 1.1 0.3 0.1 0.3 0.4
2.6 1.9 1.7 1.5
<0,1 <0,1 <0,1
0,9 1.2 1.5 0.7 0,5 0.6
1.6 1.7
,Unknown ,Unknown
Insignificant None
Overexploited Unknown Unknown
Index N/A
Unknown
2,1
M = Unknown Fo.1 = Unknown F mu = Unknown FI991 = Unknown
"Annual landings have generally declined since 1981. and survey indices
of abundance have gradually declined since
1963."
level of assessment is too low to allow definitive assessment of the status of the stock. However, the stock appears to be overexploited.
For further information
Bigelow, H.B., and W.e. Schroeder, 1953. Fishes of the Gulf of Maine. Fish. Bull., U.S. 53.
NMFS photo by Brenda Figuerido

Page 87
Atlantic Wolffish The wolffish or catfish, An
arhichas lupus, is a cold-water species of relatively minor importance in Gulf of Maine fisheries. Research vessel surveys conducted by the Northeast Fisheries Science Center indicate that populations on Georges Bank and in the western Gulf of Maine are discrete from wolffish in the Browns Bank -Scotian Shelf area. West of the Scotian Shelf, abundance appears to be highest in the southwestern portion ofthe Gulf of Maine from Jeffreys Ledge to the Great South Channel at depths of 80 to 120 m (45 to 65 fathoms). ~ Wolffish are sedentary and rather solitary in habit, and populations tend to be localized. Little is known about the biology of this species. Individuals may attain lengths of 150 cm (59 in.) and weights of 18 kg (40 Ib). They are significant shellfish predators.
Wolffish have been taken primae rily as bycatch in the otter trawl fishery, although the species may also be an intended component in some mixed fishery situations. Recreational catches are insignificant, and foreign catches of minor importance. There is no management. The total landings for 1990 were 500 mt, the lowest since the mid-1970s.
Since 1970,theD.S. nominai commercial catch has been about evenly divided between Georges Bank and the Gulf of Maine. In the last two decades, U.S. vessels have taken more than 75 percent of the total Georges Bank-Gulfof Maine catch, with most of the remainder taken by Canadian fishermen. The total Georges BankGulf of Maine nominal catch increased from 200 mt in 1970 to an average of around 1,000 mt since 1980. United States landings in 1990 were just under 400 mt, continuing the trend of a 100 to 200 mt decline per year since 1983. In 1991, the U.S. landings increased to almost 490 mt, but the Canadiantake dropped to 55 mt. This
NMFSphoto
NMFS photo by Brenda Figuerido

Page 88
'"iii' b 0 0 '-"
U1 Z
~ U 0:: I-W :::2:
1.4
1.2
1.0
0.8
0.6
0.4
0.2
Atlantic Wolffish ·Gulf of Maine-Georges Bank
.---------------------------------------~5
-en 4c, 3 o
~ 3U
'<t u Z <t
2~ Cl w c::: ~
'~
0.0 C 62 64 66 68 70 n. 74 76 78 80 82 84 86 88 90 92
YEAR
Table 19.1 Recreational catches and cornmerciallandings (thousand metric tons)
Year Category 1972-81 1982 1983 1984 1985 1986 1987 1988 1989 1990 1991
Average
U.S. recreational <0.1 <0.1 <0.1 <0.1 <0.1 <0.1 <0.1 <0.1 <0.1 <0.1 <0.1 Commercial
United Slates 0.5 0.9 1.2 1.1 1.0 0.9 0.7 0.5 0.5 0.4 0.5 Canada 0.1 0.1 0.2 0.1 0.1 0.1 0.1 0.1 0.1 0.1 <0.1 Other
Total nominal catch 0.6 0.8 1.1 1.3 1.2 1.1 1.0 0.8 0.6 0.5 0.5
Gulf of Maine - Georges Bank Atlantic Wolffish
I M = Unknown FO•I = Unknown
<l,OOOmt Unknown
Insignificant None
Overexploited Unknown Unknown
Index· N/A
None
FOlU = Unknown F1991 = Unknown
"The decline in landings since 1983 and the
longer-term decline in the trawl survey indices
suggest that recent levels of exploitation have
reduced biomass substantially."
total of about 550 mt is lower than any since the mid-1970s.
After fluctuating considerably from 1968 to 1982, the NEFSC spring survey index has shown a consistent downward trend in recent years and values of 0.43 kg/tow (1990) and 0.3 kg/tow (1991) are the lowest in the series. The average of the last five years, 0.64 kg/tow, is considerably less than the average of the previous years (2.4 kg/tow).
The decline in landings since 1983 and the longer-term decline in the trawl survey indices indicate that recent levels of exploitation have reduced biomass substantially. Although an analytic assessment is not available, the stock is clearly overexploited and depleted.
For further information
Bigelow, H.B., and W.e. Schroeder. 1953. Fishes of the Gulf of Maine. Fish. Bull., U.S. 53.

~:~1'~:;::-'-~:::::-::: '. :._.-::_/ .:,C.·"
,,~~":'
Tilefish, Lopholatilus chamaeleonticeps, inhabit the outer continental shelf from Nova Scotia to South America and are relatively abundant in the Southern New England-Mid-Atlantic area at depths of 80 to 440 m (44 to 240 fathoms). They are generally found in and around submarine canyons where they occupy' burrows in the sedimentary substrate. Tilefish are relatively slow growing and long-lived, with a maximum age and length of 35 years and IlOcm(43.3 in.) fork length in females and 26 years and 112 clI! (44.1 in.) fork length in males. At lengths in excess of 70 cm (27.6 in.), the predorsal adipose flap, characteristic of this species, is larger in males and can be used to distinguish the sexes. Tilefish of both sexes become functionally mature by age 5 (50 cm or 20 in_).
Nominal catches were first recorded in 1915 (148 mt); 4,500 mt were taken in 1916, which is the largest annual catch to date, but only 5 mt were reported by 1920. Landings briefly increased to 1,000-1,500 mt during the early 1950s, followed by a decline to 30 mt in 1968-1969. Most recently, catches increased to 3,800 mt in 1979 but have steadily declined to 1991 landings of 1187 mt. Since the 1970s, the predominant gear type used in this fishery is longlines. A small recreational fishery developed during the late 19605 in New York and New Jersey with landings never exceeding 100 mt. Recent recreational catches are virtually non-existent.
Beginning in the early 1970s, a directed commercial tilefish fishery by longliners expanded rapidly from New Jersey and New York. Total fishing effort in standardized days fished (number of hours fished x number of sets of long line) increased from 61 df in 1973 to 1,929 in 1987. Subsequently, catch-per-unit-effort declined from 6.1 mt/df in 1973 to 0.7 mtJdf in 1991.
A yield-per-recruit analysis calculated in the early 1980s estimated FO,I =0.17 andF max =0.27, based on age at recruitment to the fishing gear of 4. Estimates of F from a VPA during the late 1970s and early 1980s increased from 0.20 (1977) toO.74 (1981). Estimates of F from a VPA have not been
Page 89
Tilefish
NMFSphoro
available since 1984, but the current level of F is estimated to ne equal to or greater than the 1981 level (0.74). Long-term potential catch for tilefish estimated from a non-equilibrium surplus production model was about 1,100 mt.
Landings and CPUE data indicate
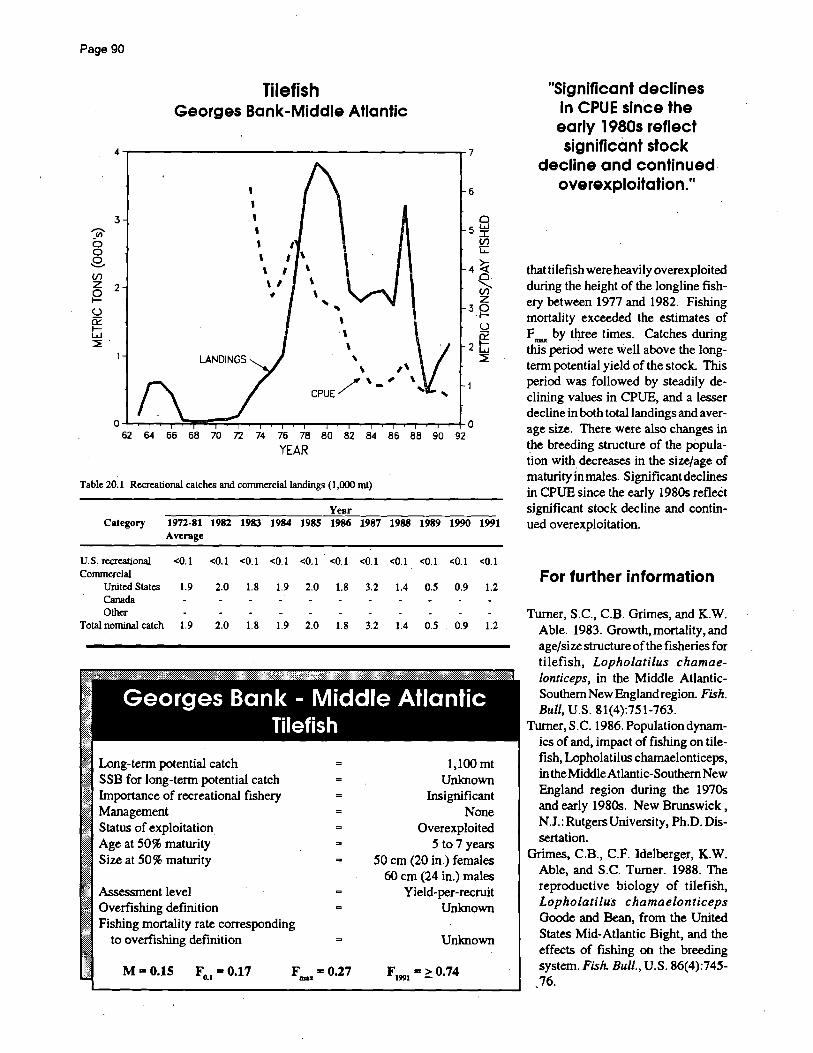
Page 90
Tilefish Georges Bank-Middle Atlantic
4.-------------------------------------~7
'Iii' b o 8, (/)
.3
Z 2 ~ U a= IW ~.
I I , , \
\ I ' , , \
* \ '" I
\ \ ,
\ ,\
6
o SW :r
(/) c:::
4~ O.
~ z 3J~
u a= 2t:i ~
.,K \ ,
CPUE/ -
0 64 66 68 70 n 74 76 78 80 82 84 86 88 90 92
YEAR
Table 20.1 Recreational catches and conunercial1andings (1,000 ml)
Year Category 1972·81 1982 1983 1984 1985 1986 1987 1988 1989 1990 1991
Average
U.S. recreational <0.1 <0.1 <0.1 <OJ <0.1 <0.1 <0.1 <0.1 <0.1 <0.1 <0.1 Commercial
United States 1.9 2.0 1.8 1.9 2.0 1.8 3.2 1.4 O.S 0.9 1.2 Canada
I
Other Total nominal catch 1.9 2.0 1.8 1.9 2.0 1.8 3.2 1.4 O.S 0.9 1.2
Georges Bank - Middle Atlantic Tilefish
I' Long-tenn potential catch ;: SSB for long-tenn potential catch I Importance of recreational fishery r~ Management
Status of exploitation Age at 50% maturity Size at 50% maturity
Assessment level Overfishing definition Fishing mortality rate corresponding
to overfishing definition
M = 0.15 Fu = 0.17 F =0.27 DIU
1,100mt Unknown
Insignificant None
Overexploited 5 to 7 years
50 cm (20 in.) females 60 cm (24 in.) males
Yield-per-recruit Unknown
Unknown
FI991 = ~ 0.74
"Significant declines in CPUE since the early 1980s reflect significant stock
decline and continued overexploitation."
thattilefish were heavily overexploited during the height of the longline fishery between 1977 and 1982. Fishing mortality exceeded the estimates of F IIIIU. by three times. Catches during this period were well above the longtenn potential yield of the stock. This period was followed by steadily declining values in CPUE, and a lesser decline in both total landings and average size. There were also changes in the breeding structure of the population with. decreases in the size/age of maturity in males. Significant declines in CPUE since the early 1980s refleCt significant stock decline and continued overexploitation.
For further information
Turner, S.c., C.B. Grimes, and K.W. Able. 1983. Growth,mortality,and age/size structure of the fisheries for tilefish, Lopholatilus chamaelonticeps, in the Middle AtlanticSouthern New England region. Fish. Bull, U.S. 81(4):751-763.
Turner, S.C. 1986. Populationdynamics of and, impact of fishing on tilefish, Lopholatilus chamaelonticeps, in the Middle Atlantic-Southern New England region during the 1970s and early 1980s. New Brunswick, NJ.:RutgersUniversity, Ph.D.Dissertation.
Grimes, C.B., c.P. Idelberger, K.W. Able, and S.c. Turner. 1988. The reproductive biology of tilefish, Lopholatilus chamaelonticeps Goode and Bean, from the United States Mid-Atlantic Bight, and the effects of fishing on the breeding system. Fish. Bull., U.S. 86(4):745-
,76.

Page 91
Atlantic Herring The Atlantic herring, Clupea
harengus, is widely distributed in continental shelf waters from Labrador to Cape Hatteras. Important commercial fisheries for juvenile herring (ages 1 to 3) have been in existence since the laSt century along the coasts of Maine and New Brunswick. Development of large-scale fisheries for adult herring is comparatively recent, primarily occurring in the western Gulf of Maine, on Georges Bank., and on the Scotian Shelf. Gulf of Maine herring migrate from feeding grounds along the Maine coast during autumn to the southern New England - Mid-Atlantic region during winter, with larger individuals tending to migrate further distances. Tagging experiments have also provided evidence of intermixing of Gulf of Maine-Scotian Shelf herring during different phases of the annual migration.
Spawning in the Gulf of Maine occurs during late August-October, beginning in northern locations and progressing southwru::d. Atlantic herring are not fully mature until ages 4 to 5. Recent evidence suggests a densi tydependent effect on growth and maturation, indicating that the average age at maturity may vary annually. The eggs are demersal and are typically deposited on rock or gravel substrates. Primary spawning locations off the northeastern United States occur on the Maine coast, Jeffreys Ledge and Nantucket Shoals; Georges Bank formerly supported an extensive spawning ground. Incubation is temperature dependent, but usually requires 7 to 10 days. Larvae metamorphose by late spring into juvenile brit herring that may form large aggregations in coastal waters during summer. By age 2, juvenile herring are fully vulnerable to the coastal fixed-gear fisheries (stop seines and weirs), which have greatly declined in recent years.
Coastal Stock Complex
In the past, the herring resource along the East Coast of the United States has been divided into the Gulf of Maine and Georges Bankstocks. There is genetic and tagging evidence that both supports and refutes this stock division. Of greater concern to those managing the resource is the fact that the fishery-independent measures of abundance for herring are for fish originating from both spawning areas. As a consequence, the herring from the Gulf of Maine and from Georges Bank have been combined for assessment purposes into a single coastal stock complex. This approach has many advantages over the separate stock approach, but also poses a number of challenges for the future assessment and management of herring.
Total catches for the coastal stock complex have changed substantially over the past two decades. Catches averaged 50,149 mt during the years 1987 to 1991, whereas two decades ago they exceeded 300,000 mt. The change in catch is best understood by examining the changes in the regional fisheries that exploit the stock complex.
The fishery in the Gulf of Maine consists of fixed and mobile gear fisheries in coastal waters. Landings in the coastal fishery have averaged 43,000 mt over the last two decades. There has been a great deal of annual vari-
NMFS photo by Bob Brigham
ability in the landings, but there is little evidence of any long-term trend. There is a trend, though, in the distribution of landings between the two principal gear types: mobile and fixed gear. Over the past five years, more than 90 percent of the catch of herring in Maine has been taken in mobile gear, compared with less than 50 percent during the 1970s. This shift in catches appears to be related to reduced availability of herring to the fixed-gear fisheries. Due to recent declines in export . markets for adult herring, a significant proportion of the catch has not been used for human consumption.
The herring fishery on Georges Bank was initiated in 1961 with increased foreign fishing activity off the northeast coast of the United States. Landings peaked in 1968 at 373,600 mt and subsequently declined to only 43,500 mt in 1976 as the stock collapsed. There has been no directed fishery for Atlantic herring on Georges Bank since that time.
The estimates of stock biomass (ages 2 and older) for the coastal stock complex were in excess of I rnillionmt before the collapse associated with the Georges Bank fishery. After the collapse, stock size estimates were less than 100,000 mt. In the the early 1980s, fishing pressure from the offshore fleets stopped and the stock began to rebuild. Today, the stock complex biomass appears to be approaching pre-collapse levels, but caution

Page 92
1200
1000
'Vi' 0 800 0 B VJ Z 600 0 I-
U 0:: I- 400 UJ ~
200
, \
Atlantic Herring Coastal Stock Complex
\ STOCK BIOMASS \ (AGE 2+) ~,' , .. I .. I ,
I \ I , .. , .. I , I , I
\ I I ,
LANDINGS I ,
,;
I I
I
66 68 70 72 74 76 78 80 82 84 86 BB 90 92
YEAR
Table 21. I Recreational catches and cornmerciallandings (thousand metric tons)
Year Clltegory 1972-81 1982 1983 1984 1985 1986 1987 1988 1989 1990 1991
Average
U.S. recreational Conunerciai
U.S. 124.5 32.3 23.2 32.7 25.9 32.1 39.7 40.9 .53.0 63.0 54.3 Canada Other
Total nominal catch' 124.5 32.3 23.2 32.7 25.9 32.1 39.7 40.9 53.0 63.0 54.3
1 Age groups 1 Bnd older.
Coastal Stock Complex Atlantic Herring
Long-term potential catch' SSB for long-term potential catch Importance of recreational fishery Management Status of exploitation Age at 50% maturity Size at 50% maturity Assessment level Overfishing definition Fishing mortality rate corresponding
to overfishing definition
M=0.20 Fo.l = 0.18
tf ".,. 'Average age 2+ biomass Bt 20% MSP.
120,000 mt Unknown
Insignificant Spawning Area Closure
Underexploited 3 years
26.0 cm (10.2 in.) Age structured
None defined
None defined
F = None ....
" The suggestion that stock abundance is
higher than during the 1970s is not in question, but the exact level of stock size is difficult to
ascertain."
must be exercised in interpreting these stock size estimates. Because there is no fishery in the offshore waters, recent estimates of stock size depend on abundance levels suggested by survey trawl catches and larval herring densities. The suggestion that stock abundance is higher than during the late 1970s is not in question, but the exact level of stock size is difficult to ascertain.
The status of the coastal stock complex has improved significantly but unevenly in recent years. The reCent rebuilding of the stock complex is attributed to increased spa':"Jling on coastal spawning grounds and Nantucket Shoals. The Georges Bank spawning contingent, which represents the largest historic component of the stock complex, has not recovered from its virtual anhiliation during the early 1970s.
A joint Atlantic States Marine Fisheries Commission and New England Fishery Management Council plan for herring is being developed. The plan will include guidance for the orderly redevelopment of the offshore fishery.
For further information
Fogarty, M.J., and S.H. Clark. 1983. Status of herring stocks in the Gulf of Maine region for 1983. NEFC WoodS' Hole LAboratory Reference Document 83-46. 33 p. A vailabie from: NOAA/NMFS, Northeast Fisheries Science Center, Woods Hole, MA 02543.
Northeast Fisheries SCience Center. 1992. Report of the 13th Northeast Regional Stock Assessment Workshop (SAW 13). NEFSC Reference Document 92-02.

Page 93
Atlantic Mackerel Atlantic mackerel, Scomber
scombrus, is a fast swinuning, pelagic, schooling species distributed in the Northwest Atlantic between Labrador and North Carolina. There are two major spawning components of this population: a southern group that spawns primarily in the Mid-Atlantic Bight during April and May, and a northern group that spawns in the Gulf of St. Lawrence in June and July. Both groups winter between Sable Island (off Nova Scotia) and Cape Hatteras in waters generally warmer than 7°C (45°P), with extensive northerly (spring) and southerly (autumn) migrations to and from spawning and summering grounds. Maximum observed size in recent years is about 47 cm or 18.5 in. (fork length) and 1.3 kg (3 Ib) in weight. Sexual maturity begins at age 2 and is usually complete by age3. Maximum age is about 20 years.
Mackerel are subjected to seasonal fisheries, both commercial and recreational, throughout most of their distributional range. United States commercial catches have occurred mainly between January and May in southern New England and Mid-Atlantic coastal waters and between May and December in coastal Gulf of Maine waters. United Atates recreational catches occur mainly between April and October in areas of seasonal occurrence. Catches in Canadian waters off Nova Scotia and Newfoundland have typically been between May and November. Catches by other countries, principally during the intensive fishery conducted between 1968 and 1977, occurred mainly between December and April between Georges Bank and Cape Hatteras.
Mackerel in the Northwest Atlantic were managed by nationally-allocated catch quotas between 1973 and 1977 by ICNAF. Since implementation of the MFCMA on 1 March 1977, mackerel in U.S. waters have been
managed by the NMFS, initially under a PMP and since February 1980 under the Mid-Atlantic Fishery Management Council's Squid, Mackerel, Butterfish FMP. Management is based on total allowable catch (T AC) limits, which have been increased over the 1980s.
Mackerel landings increased dramatically beginning in the late 1960s, reaching a peak of roughly 400,000 mt in 1973. Landings subsequently declined to roughly 30,000 mt in the late 1970s, increased steadily from 1980 to 1988, and declined in 1989 and 1990. Total landings from this stock declined 9 percent in 1991 (60,590mtt055,238 mt). Increases in landings in the 1980s were due to larger U.S. and foreign joint venture fishing operations.
The U.S. accounted for 50 percent of the 1991 international catch on the Northwest Atlantic stock, including about 25,700 mt of commercial and 2,011 mt of recreational catch. The Canadian catch increased slightly from 18,200 mt in 1990 to 22,186 mt in 1991. The distant-water fleet catch dropped from 9,130 mt in 1990 to 5,349 mt in 1991.
NMFS photo by Brenda F/rluarido
Year classes from 1975 to 1980 were all relatively weak. Cohorts since 1981 have been much stronger (except for 1983), particularly the 1982 year class, which is the largest since 1967. The 1984 to 1988 cohorts also appear to be relatively strong.
Total stock biomasS (ages 1 and older) increased from around 300,000 mtduring 1962-1965 to 1.6millionmt in 1969 before dropping to astable low level during 1977-1981, averaging 776,000 mt per year. The total stock has increased since 1981, reaching more than 2.0 million mt in 1990. Spawning stock biomass (50 percent of age 2 fish and 100 percent of age 3 and older) increased from about 600,000 mt in 1982 to more than 2.0 million mt in 1990 and remained high in 1991.
Rebuilding of the mackerel stock has been aided by relatively low catches during 1980-1990 (average of 55,000 mt) as well as improved recruitment from the 1981to 1982 and 1984 to 1988 year classes. Projections indicate that the catch in 1992 can be increased substantially, to several hun-

Page 94
3000
2500
Atlantic Mackerel Labrador-North Carolina
I I , ,
I
. 'ill' I
b 2000 I a 8- ,. I ,
I
Vl Z 1500 ~ U et: r- 1000 w ~
500 I I , --
0 62 64 66
#0 ..
I ... \ STOCK BIOMASS ~ (AGE 1+) .. , ,
I
68 70 72
, \
74
I , ..
76 78
YEAR
I , , J \,
TOTAL LANDINGS
80 82
I , I
84 86 88 90 92
Table 22.1 Recreational catches and commercial landings (thousand rnelIic tons)
Category 1972-81 1982 1983 1984 Average
U.S. recreational 4.9 1.2 3.3 2.6 Commercial
United Slates 2.0 3.3 3.8 6.0 Canada 29.6 16.4 19.8 18.2 Other 166.8 6.6 6.0 15.0
Total nominal catch 203.3 27.5 32.9 41.8 Optimum yield N/A 30.0 30.0 101.7
long-tenD potential catch SSB for long-tenn potential catch Importance of recreational fishery Management Status of exploitation Age at 50% maturity Size at 50% maturity Assessment level Overfishing definition
Fishing mortality rate corresponding to overfishing definition
Year 1985 1986 1987 1988 1989 1990 1991
3.3 3.9 5.6 4.2 2.3 2.0 2.0
6.6 9.6 12.3 12.3 14.6 31.3 25.7 30.1 31.1 22.2 23.3 18.7 18.2 22.2 32.4 25.4 35.1 42.9 36.8 9.1 5.3 73.2 70.0 75.2 82.7 72.4 60.6 55.2 83.6 225.3 154.6 106.0 74.0 83.0 114.0
134,0001 mt 1.0-1.2 million mt
Moderate = Squid, Mackerel, Butterfish FMP
Underexploited 2 years
32.7 cm (12.9 in.) fork length Age structured
Minimum SSB of 600,000 mt and Fo.! fishing rate
0.27
M = 0.20 FOol = 0.27 F = 0.96 FI991 = <0.05 DIU
I Assuming constant recruilmentllt level or geometric melln or 1961-1984 yellr classes and rlShing mOrllllity at F ....
"Projections indicate that the. catch in 1992 can be increased substantially.
to several hundred thousand metric tons,
without adversely affecting the
productivity of the spawning stock
biomass."
dred thousand metric tons, without adversely affecting the productivity of the spawning stock biomass. Given the large biomass and the recent decreases in the growth rate of individual fish, the population can sustain substantially more fishing, and is considerrably underexploited.
For further information
Anderson, E.D. 1984. Status of the Northwest Atlantic mackerel stock-1984. NEFC Woods' Hole laboratory Reference Document 85-03. Available from: NOAA/NMFS, Northeast Fisheries Science Center, Woods Hole, MA 02543.
Overholtz, W.J.,and B.L. Parry. 1985. Update of the status of the Northwest Atlantic mackerel stock for 1985. NEFC Woods' Hole laboratory Reference Document 85-13. Available from: NOAA/NMFS, Northeast Fisheries Science Center, Woods Hole, MA 02543.
Overholtz, W.J.,S.A.Murawski, W.L. Michaels, and L.M. Dery. 1988. The effects of density dependent population mechanisms on assessment advice for the northwest Atlantic mackerel stock. NOAA Tech. Memo. NMFS-F/NEC-62. Available from: NOAA/NMFS, Northeast Fisheries Science Center, Woods Hole, MA 02543.
Northeast Fisheries Center. 1991.' Report of the 12th Northeast Regional Stock Assessment Workshop. NE;FSC Reference Document 90-03. Available from: NOAA/NMFS, Northeast Fisheries Science Center, Woods Hole, MA 02543.

Atlantic butterfish (Peprilus tria canthus) are present in commercially significant amounts between Cape Hatteras and Southern New England. The butterfish population is assumed to constitute a unit stock in waters north of Cape Hatteras, where the stock migrates inshore and northward during the summer and returns to offshore waters in the winter due to temperature preferences. Spawning takes place chiefly during the summer months and peaks in July. Juvenile butterfish begin recruiting to the spawning stock at the end of their first year. Although the maximum recorded age for this species is 6 years, few fish are observed beyond age 3.
Butterfish have been landed by domestic fIshennen since the 1800s, and, from 1920 to 1962, the annual domestic harvest averaged 3,500 mt. Foreign catches began in the 1960s and the average annual landings increased to more than 11,000 mt in the late 1960s and early 1970s (Murawski and Waring 1979). Overall, landings have dropped to an average of 3,000 mt per year since foreign allocations have been curtailed. In 1991, domestic butterfish landings totaled 2,160 mt. This represents a decrease of 10 percent from the 2,395 mt landed in 1990.
Butterfish are managed by the Mid-Atlantic Fishery Management Council under provisions of the Atlantic Mackerel, Squid, and BuUerfish Fishery Management Plan. For 1991, the maximum optimum yield and the allowable biological catch for butterfish were 16,000 mt while the domestic allowable harvest was 10,000 mt (MAFMC 1990). Similar regulations are in effect for 1992 (MAFMC 1991).
The catch-per-tow index (total weight for all ages) from the NEFSC 1991 autumn bottom trawl survey decreased by 8 percent, while the 1991 age 1+ index (24.42 age one and older fish/tow) decreased by 36 per-
Page 95
Butterfish
cent from 1990. Above average prerecruit indices over the past four years, however, suggest that butterfish reproduction remains strong in the Northwest Atlantic.
Research survey data indicate that the butterfish population is at a relatively high level of abundance in comparison to the period of heaviest exploitation from 1969 to 1976. While stock abundance is probably sufftcient to support catches at the optimum yield
NMFS phctosby Brenda N;}uerldo
level (16,000 mt), butterfish landings are sensitive to market conditions and the availability of schools of larger fish. Preliminary butterfish landings during the first quarter of 1992 are almost twice the first quarter landings in 1991. This increase in winter landings probably reflects improved availability of the stock as well as enhanced export opportunities in the Japanese butterfish market. As a result, butterfish landings are likely to increase in

Page 96
BuHerfish Gulf of Maine-Middle Atlantic
30 ,-------------------------------------------r20
........ 25 -E
'iii" AUTUMN ,~ SURVEY,-. ( INDEX ~/ ~
15 3: o
~ b 20 0 B u
!c( V) Z 0 I-
U 0= I-w :::!;
15
10
. . .
5 ~. 7"tl~ .. .I, "./ \.~:
U 10 Z
;5. :::!;
o w [i:
5 ~ a::: lV)
o 0 62 64 66 68 70 n 74 76· 78 80 82 84 86 88 90 92
YEAR
Table 23.1 Recreational and conunercial catches (thousand metric tons)
Year Category 1972-81 1982 1983 1984 1985 1986 1987 1988 1989 1990 1991
Average
u.s. recreational Conunercial
United States 2.7 9.1 4.9 12.0 4.7 4.4 4.5 2.1 3.2 2.4- 2.2 Canada Other 6.0 0.6 0.6 0.4 0.8 0.2 0.0 0.0 <0.1 <0.1 0.0
Total nominal catch 8.7 9.7 5.5 12.4 5.5· 4.6 4.5 2.1 i 3.2 2.4 2.2 Total allowable catch 11.0 11.0 11.0 <16.0 <16.0 <16.0 10.0 10.0 10.0 10.0
Gulf of Maine - Middle Atlantic Bufterfish
Long-term potential catch SSB for long-term potential catch Importance of recreational fishery Management
Status of exploitation Age at 50% maturity Size at 50% maturity Assessment level Overfishing definition
« Fishing mortality rate corresponding " to overfishing definition
M = 0.80 F 0.1 = 1.60 F > 2.50 ""'"
16,OOOmt Unknown
Insignificant Squid, Mackerel, and
Butterfish FMP Underexploited
0.9 years 12 cm fork length Yield-per-recruit
3-year moving average of autumn prerecruit index falls
within lowest quartile of this time series
Unknown
FI991
= Unknown
" ... even if landings were to double in 1992,
buHerfish would still be an underexploited
resource in the Northw~st Atlantic.".
1992. But even if landings were to double in 1992, butterfish would still be an underexploited resource in the Northwest Atlantic.
For further information
Mid-Atlantic Fishery Management Council. 1990. 1991 Allowable biological catch, optimwn yield, domestic annual harvest, domestic annual processing, joint venture processing, and total allowable level of foreign fishing recommendations for Atlantic mackerel, £Oligo, Illex, and Butterfish. Dover, DE: Mid-Atlantic Fishery Management Council.
Mid-Atlantic Fishery Management Council. 1991. 1992 Allowable biological catch, optimum yield, domestic annual harvest, domestic annual processing, joint venture processing, and total allowable level of foreign fishing recommendations for Atlantic mackerel, £Oligo, /llex, and butterfish. Dover; DE: Mid-Atlantic Fishery Management Council.
Murawski, S. and G. Waring. 1979. A population assessment ofbutterfish, Peprilus rriacanthus, in the Northwest Atlantic Ocean. Trans. Am. Fish. Soc. 108:427-439.
Northeast Fisheries Science Center. 1991. Report of the 12th Northeast Regional Stock Assessment Workshop (12th SAW). NEFSC Reference Document 91-03. Available from: NOAA/NMFS, Northeast Fisheries Science Center, Woods Hole, MA 02543.

The bluefish, Pomatomus saltatrix, is a migratory, pelagic species found throughout the world in most temperate coastal regions, except the eastemPacific. Along the U.S. Atlantic coast, bluefish are found from Maine to Florida, migrating northward in the spring and southward in the fall. A unit stock of bluefish along the Atlantic coast is assumed for management purposes. Bluefish are voracious predators that feed on a wide variety of fish and invertebrates. They may reach ages of about 12 years and sizes in excess of l00cm(39in.)and 14 kg (31 lb).
The principal commercial fishing gear used to catch bluefish is the otter trawl. Recreational fishing is very important with catches far exceeding commercial catches. Most of the recreational catch of bluefish is taken in the Middle Atlantic states (New York to Virginia) by boat-based fishermen. A fishery management plan for bluefish developed by the Mid-Atlantic Fishery Management Council (MAFMC) and the Atlantic States Marine Fisheries Commission (ASMFC) was approved by the Secretary of Commerce in early 1990.
Total catches of bluefish (commercial and recreational) from Maine to Florida peaked in 1980 at an estimated 76,200 mt. Total catches have generally declined from 1980 to the present, but with some fluctuations. Total catch decreased 10 percent from 1990 to 1991 (30,500 mt to 27,600 mt). Commercial landings peaked in 1983 at 7,600 mt. Commercial landings decreased 5 percent in 1991, from 6,300 mt to 6,000 mt, and accounted for about 22 percent of the total catch.
The recreational component of lhe fishery, which has historically constituted 80 to 90 percent of the total catch, peaked in 1980 at nearly 70,000 mt. The 1991 recreational catch of 21,600 mt was a decrease of 11 percent from the previous year (24,200 mt), and
Page 97
Bluefish
Scientist John Ziskowski with bluefish, Albatross IV survey cruise, 1992
accounted for about 85 percent of the total catch. An index of recreational
NMFS photo by Brenda Figuerldo
fishing effort for bluefish trended upward from 1981 (21 million bluefish

Page 98
Bluefish Atlantic Coast
80~----------------------------------------T4
60 3 .......... en 'W C-o '\ a. 0 I ~ B \
I VJ \ 0::: Z 40
, , \ 2~
~ 'I .. <,;) .. z <..>
RECREAnONAL /
\ ~ ~ \ ,~
f- , , ~ I
w CPUE , <..>
~ \' ~ !c{ , 20 , ,U ..
..... _- ...... .. 0 0
78 80 82 84 86 88 90 92
YEAR
Table 24.1 Recreational calches and conunerciallandings (lhousand rnelric Ions)
Year Category 1972-81 1982 1983 1984 1985 1986 1987 1988 1989 1990 1991
Ayerage
U.S. recreational 63.92 56.6 62.8 39.3 45.0 59.4 49.7 35.3 23.9 24.2 21.6' Commercial
Uniled Stales 5.0 6.9 7.6 5.8 6.2 6.3 6.9 6.2 4.7 6.3 6.0 Canada Olhcr 0.1
Tolal nominal calch 69.0 63.5 70.4 45.1 51.2 65.7 56.6 41.5 28.6 30.5 27.6'
1 Preliminary estimate. Z Mean for 1979-81.
Atlantic Coast Bluefish
;~~~~ :~::~::
If Long-tenn potential catch ~~l SSB for long-tenn potential catch , fg;;on& fimery
Size at 50% maturity Assessment level Overfishing definition Fishing mortality rate corresponding
to overfishing definition
M = 0.35 Fo.1 = 0.18 F""", = 0.27
Unknown Unknown
Major Bluefish FMP
Fully exploited 1 year
35 cm (13.8 in.) Index FMSY
0.35-0.40
"Current stock assessment information is
insufficient to allow a quantitative
determination of the status of exploitation
for bluefish."
trips) to an estimated 37 million bluefish trips in 1988, then declined to about 30 million trips in 1989, and increased slightly to about 31 million trips in 1991. Coast wide, recreational catch-per-bluefish-trip by weight and numbers peaked in 1981 at2.72kg1trip (1.49 fish/trip), and has since trended downward, declining to 0.69 kg/trip (0.56 fish/trip) in 1991.
Current stock assessment information is insufficient to allow a quantitative determination of the status of exploitation for bluefish. Indices of juvenile bluefish abundance suggest that a moderately strong year class recruited to the stock in 1989, and contributed significantly to the fishery in 1990 and 1991. However, trends in recreational catches and the index of abundance based on recreational catch and effort data indicate that bluefish abundance has decreased substantially during the past decade, and that the stock is fully exploited.
For further information
Northeast Fisheries Center. 1988. Report of the 5th NEFC Stock Assessment Workshop (5th SAW). NEFC Woods Hole Laboratory Reference Document 87-12.
Northeast Fisheries Center. 1988. Report of the 6th NEFC Stock Assessment Workshop (6th SAW). NEFC Woods Hole Laboratory Reference Document 88-02.
Northeast Fisheries Center. 1990. Report of the 11 th NEFC Stock Assessment Workshop (11 th SAW). NEFSC Reference Document90-09. Available from: NOAA/NMFS, Northeast Fisheries Science Center, Woods Hole, MA 02543.

Spiny dogfish, Squaz,,/S acanthias, are distributed in the western North Atlantic from Georgia to Newfoundland. During spring and autumn, they are found along the coastal waters between North Carolina and Southern New England. Dogfish are chiefly summer visitors to the Gulf of Maine (including Georges Bank) and more northern waters, and in winter are distributed primarily in deeper waters along the edge of the continental shelf. They tend to school by size and, for large mature individuals, by sex. Dogfish are voracious feeders and are known to attack schools of herring and mackerel, as well as concentrations of haddock, cod, sand lance, and other species. In the Northwest Atlantic, the maximum ages reported for males and females are 35 and 40 years, respectively. The species bears live young, with a gestation period of about 18 to 22 months producing 2 to 15 pups with an average of 6.
The principal commercial fishing gears used for catching dogfish are otter trawls and sink gillnets. Dogfish are frequently caught as bycatch during groundfish operations and discarded. Recreational fishing and foreign fishing are insignificant. At present, there is no fishery management plan, but one will be implemented within two years. Landings decreased 20 percent in 1990 (14,300 mt to 11,5(0).
Reported international nominal catches peaked at about 21,000 mt in 1972 and declined sharply from 1975 to 1978. Distant-water fleets consistently accounted for virtually all of the reported catches. Domestic catches since 1979 have fluctuated between 2,600 mt and 6,900 mt, with no trend. Landings in 1991 remained relatively high and landings in 1992 are expected to remain at these high levels due to the strong demand in the European market, attributable to declines in European dogfish stocks.
Page 99
Spiny Dogfish
Scientist Marjorie Lambert sorting a dogfish haul, RN Albatross IV groundfish survey, 1992.
Minimum biomass estimates of spiny dogfish based on NEFSC spring bottom trawl survey catches increased slightly from 1991 estimates of 642,000 mtto 662,OOOmtinl992, 128 percent more than the 1968-89 geometric average of 291,000 mt. Minimum biomass estimates during the decade (1980-1989) have generally been higher than values observed between 1968 and 1979. The 1992 estimate is 35 percent more than the 1980-89 geometric average.
The U.S. fishery for dogfish is similar to the European fisheries in being selective for large individuals [larger than 2.3 kg (5.1Ib), 83 cm (33 in.)], which are mainly mature females, to meet processing and marketing requirements. However, at certain times of the year, smaller individuals, consisting of both mature and immature males as well as immature females, are taken as by catch and discarded. Since this species bears live young, a directed fishery on mature females may significantly impact spawning potential. The potential for rapid overexploitation of sharks has been observed
NMFS photo by Brenda Figuerido
in U. S. West Coast and European fisheries. This results from low growth and fecundity rates, schooling of large mature individuals by sex, and direct stock recruitment relationships.
A conservative estimate of the maximum sustainable yield (MSY) for the species is between 40,000 mt and 60,000 mt, based on European studies (Holden 1968), which suggest that no more than 20 percent of the minimum biomass can be harvested annually. Under this harvest scenario, about 90,000 mt (20 percent of the 1980-1990 average) could be taken annually from the present population.
Assuming that the 1992 minimum biomass estimate is correct (0.7 million mt), then about 128,000 mt could be landed from the stock. The low levels of current landings belies the increasing stock size in recent years. Increases in dogfish and skate abundance, coupled with decreases in abundance of many demersal species, have resulted in the NEFSC trawl survey catches by weight on Georges Bank, for example, changing from roughly 25 percent dogfish and skates in 1963

Page 100
30
25
'Cii' b 20 a a '-" V) Z 15 8 U ~ t- 10 w ~
5
Spiny Dogfish Gulf of Maine-Middle Atlantic
,-----------------------------------------~200
LANDINGS -----...
SPRING " SURVEY ---- n INDEX -..! \
en 160 .c,
3: o
~ 120 U
< U Z
~ 80 ~
o w c::: ~
40 0::: tV)
~~~~_r~--~~--~_r~--~~--~_r~--+O 64 66 68 70 72 74 76 78 80 82 84 86 88 90 92
YEAR
Table 25.1 Recreational catches and commercial landings (thousand metric tons)
Year Category 1972-~1 1982 1983 1984 1985 1986 1987 1988 1989 1990 1991
Average
U.S. recreational Commercial
United States 4.5 6.6 4.9 4A 4.0 2.6 2.6 B 4.4 10 lL5 Canada Other 6.8 OA 0.1 <0.1 <0.1
Total norninal catch 11,3 7.0 4.9 4A 4.0 2.7 2.6 2.9 4A 14.3 11,5
Gulf of Maine-Middle Atlantic Spiny Dogfish
Long-term: potential catch SSB for long-tenn potential catch Importance of recreational fishery Management Status of exploitation Age at 50% maturity
Size at 50% maturity
Assessment level Overfishing definition Fishing mortality rate corresponding
to overfishing definition
M= 0.05 Fo.l = 0.10
40,000 - 60,000 mt 300-450,000 mt
Insignificant None
Underexploited 6 years, males
12 years, females 60.1 cm (23 in.) males
80.7 cm (32 in.) females Index
N/A
N/A
F = 0.39 Fl99l < FO.1 IJIIIlI
"Minimum biomass estimates of spiny· dogfish based on
NEFSC spring boHom trawl survey catches
increased slightly from 1991 estimates of 642,000 mt to 662,000 mt in 1992,
128 percent more than the 1968-89 geometric average of 291,000 mt."
to nearly 7 5 percent of these species in recent years. Such large increases in relative biomass of very low-valued species has raised concerns about possible biological interactions of elasmobranch species with more highly valued gadoid and flounder stocks.
For further information
Grosslein, M.D. 1974. A first approximation of MS Y for spiny dogfish in Subareas 5 and 6 and Division 4. ICNAF Res. Doc. 74/30.
Holden, M.l. 1968. The rational exploitation of the Scottish-Norwegian stocks of spurdogs (Squalus acanthias L.). Ministry of Agriculture, Fisheries and Food, Fishery Investment Series II 25(8):1-27.
Nammack, M. F. 1982. Life history and management of spiny dogfish,
-Squalus acanthias, off the northeastern United States. Williamsburg, V A: College of William and Mary. Master's thesis.
Northeast Fisheries Center. 1990. Report Of the Eleventh Stock Assessment Workshop. NEFSC Reference Document90-09. Available from: NOAA/NMFS; Northeast Fisheries Science Center, Woods Hole, MA 02543.
Slauson, T. P. 1982. Growth, maturation, and fecundity of the spiny dogfish, Squalus acanthias, in the northwestern Atlantic. Stony Brook, NY: State University of New York at Stony Brook Master's thesis.

Skates, Family Rajidae, are distributed throughout the Northwest Atlantic from near the tide line to depths exceeding700m(383f~thoms). Members of this family lay eggs that are enclosed in a hard, leathery case commonlycalledamermaid'spurse. Incubation time is 6 to 12 months, with the young having the adult form at the time of hatching. There are seven species of Raja occurring along the North Atlantic coast of the United States: little skate (Raja erinacea), winter skate (R. ocellata), barndoor skate (R. laevis) , thorny skate (R. radiata), brier skate (R. eglanteria), leopard skate (R. garmani) and smooth-tailed skate (R. senta).
The center of distribution for the little and winter skates is Georges Bank and Southern New England. The' thorny, bamdoor, smooth-tailed, and leopard skates are commonly found in the Gulf of Maine. The brier skate is a southern species, located primarily in the Chesapeake Bight. Skates are not known to undertake large-scale migrations, but they do move inshore and offshore in response to seasonal changes in water temperature, generally offshore in summer and early autumn and vice-versa during the winterspring period.
The principal commercial fishing method used to catch skates is otter trawling. Skates are frequently caught as by catch during groundfishing operations and discarded. Recreational landings are insignificant. There are currently no regulations governing the harvesting of skates in U.S. waters.
Landings of skates (all species combined) off the northeast United States were 11,210 mt in 1991, which was not an appreciable change from 11,300 mt landed in 1990. Skates have been reported in New England fishery landings since such data have been recorded (the late 1800s). However, landings (primarily from off Rhode Island), never exceeded several hun-
dred metric tons until the advent of distant-water fleet fishing during the 19605. Skate landings peaked in 1969 at 9,500 mt, and declined quickly during the 1970s. In 1981 reported skate landings bottomed out at 538 mt, and have since increased steadily. The increase in domestic landings is partially in response to the increased demand for lobster bait, and, more significantly, to the increased export market for skate wings. The species that comprise the wing landings are winter and thorny skates, which are the two species currently known to be used for human consumption. Bait landings are primarily little skate, based on the areas fished and the known species distribution patterns.
Survey abundance indices for skates (again all species combined) are expressed as the minimum population estimate from area-swept calculations and smoothed to reflect trends in the data. Over the time series from 1968 to 1991, smoothed survey indices for skates showed three distinct trends in the data. During the first half of the
Page 101
Skates
NMFS photo by Brenda Fi(luerlda
time series, 1968 through 1979, abundance indices have shown a slight but steadily declining trend in the data, reaching a series low of 81,000 mt in 1979. Since 1980, the survey index has increased significantly, reaching its highest point in the time series, 151,000 mt, in 1987. During most recent years, the smoothed abundance index has again begun to decline. The 1991 spring survey biomass estimate was 128,000 mt, slightly below the long-term (1968-1991) average of 138,000 mt.
Recent increases in skate landings and the potential forrapidly expanding export markets bring into question the level at which sustainable fisheries for thesespeciescanbernaintained. Skates have a limited reproductive capacity, and the stocks may be easily collapsed through extensive expoitation. In areas of the world where skates are more fully utilized, their numbers have been reduced to extremely low levels (e.g., Irish Sea). Similarly, although the aggregate population abundance indices may be increasing, particularly

Page 102
'Iii'
Skates Gulf of Maine - Middle Atlantic
12~------------------------------------------r250
10 SPRING SURVEY ~ MINIMUM BIOMASS -......... /\ >
'Iii' 200 b
o B
b 8 o
.. r\\ ··1\~-~
(/) Z
150 ~ B (/) U Z 6 2 .i .. ~r t/ \.~ ~
.. j .. w 100 ~ u
~ w 4 ...-';;;.··· .. 1.-':;;.·,-/ I (/) (/) « ~
~
2 50 0
CD
o 0 62 . 64 66 68 70 n 74 76 78 80 82 84 86 88 90' 92
YEAR
Table 26.1 RecreaLional catches and commercial landings (thousand metric tons)
Year Category 1972-81 1982 1983 1984 1985 1986 1987 1988 1989 1990 1991
Average
U.S. recreaLional Commercial
United States 3.1 0.6 3.6 4.1 Canada <0.1 Other 5.0
Total nominal catch 8.2 0.6 3.6 4.1
Long-tenn potential catch SSB for long-tenn potential catch Importance of recreational catch Management Status of exploitation Age at 50% maturity Size at 50% maturity Assessment level Overfishing definition Fishing mortality rate corresponding . to overfishing definition
M=0.4 Fo.l = 0.49
'Pertains to little skate.
4.0 4.2 5.1 <0.1 <0.1
0.1 4.0 4.3 5.1
F = 1.0 max
5.9 6.6 11.3 11.2 <0.1
5.9 6.6 11.3 11.2
25,OOOmt Unknown
Insignificant None
Underexploited 4 years l
40 cm (15.8 inY Index None
Unknown
"In other areas of the world where skates are more fully utilized, their
numbers have been reduced to extremely low
levels (e.g., Irish Sea)."
vulnerable species (e.g., barndoor skate) may show signs of recruitment overfishing.
For further information
Bigelow, H.B., and W.C. Schroeder. 1953. Fishes of the Gulf of Maine. Fish. Bull., U.S. 53.
Holden, M.J. 1973. Are long-tenn sustainable fisheries for elasmobranchs possible? Rapports et Proces- Verbaux Reunion Counceil International pour L 'Exploration de la Mer 164:360c367.
NortheaSt Fisheries Science Center. 1990. Report of the lIth NEFC Stock Assessment Workshop. NEFSC Reference Document 90-09. Availablefrom: NOAA/NMFS, Northeast Fisheries Science Center, Woods Hole, MA 02543.
Waring, G.T. 1984. Age, growth and mortality of the little skate off the northeast coast of the United States. Trans. Amer. Fish. Soc. 113:314-321.

Page 103
Short-Finned Squid The short-finned squid (Illex
illecebrosus) population is assumed to constitute a unit stock throughout its range of commercial exploitation from Cape Hatteras to Newfoundland. Illex grow to lengths of up to 35 cm (14 in.)(dorsal-mantle length, and live for up to 24 months. Domestic landings in the Northwest Atlantic are composed mainly of individuals between 10 and 28 cm (4 to 11 in.). Illex migrate offshore in late autumn and return to nearshore waters in the summer to feed. Illex have a crossover life cycle" where squid hatched in the' winter spawn in the summer of the following year, and most squid hatched in the summer spawn in the winter of the following year (MesnilI977). Major Illexspawning grounds have been identified south of Cape Hatteras, although spawning may occur in other areas as well.
Domestic landings of Illex began in the 1800s. From 1928 to 1966, annual squid landings from Maine to North Carolina (including Loligo peaZei) ' averaged roughly 2,000 mt. Directed foreign fishing for Illex began in 1972, and from 1972 to 198'2 total Illex landings averaged 19,000 mt. From 1983 to 1991, foreign allocations were curtailed and Illex landings averaged 8,400 mt annually.
Domestic landings were a record 11,900 mtin 1991, an increase of 5 percent over 1990 landings. Although fishing effort directed at Illex decreased in 1991, catch-per-unit-effort indices increased substantially. Nonetheless, directed effort in 1991 was almost twice its average for 1982 to 1990.
Illex are managed by the MidAtlantic Fishery Management Council under provisions of the Atlantic Mackerel, Squid, and Butterfish Fishery Management Plan. For 1991, the maximum optimum yield, the allowable biological catch, and the domestic aIlowableharvest for Illexwere 30,000, 22,500, and 18,000 mt, respectively
(MAFMC 1990), For 1992, the allowable biological catch and the domestic allowable harvest were increased to 30,000 mt (MAFMC 1991).
The stratified mean-number-pertow of all sizes of Illex squid obtained in the NEFSC autumn bottom trawl survey provides an index of relative stocka bundance and subsequent availability to commercial effort. For 1991, the survey index was 6 percent above its 1967-1990 mean, and was 143 percent above its 1982-1986 mean. Other
NMFS pholo by Brenda FiQuerido
survey indices also indicate that current Illex abundance is greater than during 1982-1986 and near its 1967-1991 average.
Domestic Illex landings in 1991 were considerably lower than those sustained by the foreign distant-water fleets from 1972 to 1982. At present, the relative abundance of Illex is higher than during 1982-1986, when catchper-unit-effort in the domestic fishery and research survey indices were low. However, availability of Illex to the

Page 104
30
25
'Cii' b 20 0 B V1 Z 15 ~ U a:: f- 10 w ~
5
0
Short-Finned Squid Gulf of Maine-Middle Atlantic
LANDINGS __
:."",\
f jl'tt~'" f I V ; '\ il' j ~ AUTUMN' ----- SURVEY \
~
70
60 '0' ..s. ~
50~ I U
40 '<i: u z ~
30 ~
0 w 20 !;;
'<i: a:: f-
10 (f)
.. _ .. ~/ INDEX t~""';'.~ .. 1 ~~~~~~~~~~~~~~~~O 62 64 66 68 70 72 74 76 78 80 82 84 86 88 90 92
YEAR
Table 27.1 Recreational and corrunercial catches (thousand metric tons)
Category 1972-81 1982 1983 1984 Average
U.S. recreational Corrunercial
United Slates 0.6 5.9 9.9 9.5 Canada Other 18.8 12.4 1.8 0.7
Total catch 19.4 18.3 11.7 10.2 Total allowable catch 30.0 30.0 30.0
Long-teon potential catch SSB for long-teon potential catch Importance of recreational fishery Management
Status of exploitation Age at 50% maturity Size at 50% maturity Assessment level Overfishing definition
Fishing mortality rate corresponding to overfishing definition
1985
5.0
L1 6.1
30.0
Year 1986
5.2
0.2 5.4
25.0
1987 1988 1989 1990 1991
10.3 2.0 6.8 11.7 11.9
<0.1 10:3 2.0 6.8 .11.7 11.9 22.5 22.5 17.0 15.0 30.0
30,OOOmt Unknown
Insignificant Squid, Mackerel and
Butterfish FMP Underexploited
1.5 years 20 cm dorsal-mantle length
Index 3-year moving average of
autumn prerecruit index falls within lowest quartile of
this time series
Unknown
M~1.0 Fo.l = Unknown F IIIIlI = N/A Fl99l = Unknown
"However, availability of //lex to the domestic
fishery and the research survey varies annually, in part because the U.S. EEl
is near the edge of the stock's distribution."
domestic fishery and the research survey varies annually, in part because the U.S. EEZ is near the edge of the stock's distribution. Thus it is difficult to predict whether Illex landings will increase again in 1992 even though catch quotas have been raised. Overall, the Illex resource is presently underexploited relative to its historic and long-teon potential yields.
For further information
Mesnil, B. 1977. Growth and life cycle of squid, Loligo pealei and Illex illecebrosus, from the Northwest Atlantic. NAFO Research Document 76/VIJ65.
Mid-Atlantic Fishery Management CounciL 1990. 1991 Allowable biological catch, optimum yield, domestic annual harvest, domestic annual processing, joint venture processing, and total allowable level of foreign fishing recommendations for £Oligo, Illex, and butterfish. Dover, DE: Mid-Atlantic Fishery Management CounciL
Mid-Atlantic Fishery Management CounciL 1991. 1992 Allowable biological catch, optimum yield, domestic annual harvest, domestic annual processing, joint venture processing, and total allowable levelof foreign fishing recommendations for Atlantic mackerel, £Oligo, Illex, and butterfish. Dover, DE: Mid-Atlantic Fishery Management CounciL
NEFSC. 1992. Report of the 14th Northeast Regional Stock Assessment Workshop (14th SAW). NEFSC Reference Document 92-07.

Page 105
Long-Finned Squid The long-finned squid Lo/igo
pealei is assumed to constitute a unit stock throughout its range of commercial exploitation from Nova Scotia to Cape Hatteras. Lo/igo can attain lengths of more than 40 cm (16 in.) in dorsal-mantle length, and ages up to 3 years, however, most individuals harvested in commercial fisheries are between 9 and 30 cm (3.5 to 12 in.) long. North of Cape Hatteras, Loligo migrate offshore during late autumn to winter in deeper waters and return to inshore waters during the spring and early summer to feed and spawn. Spawning activity for Loligo peaks twice a year during the spring and the late-summer or early-fall. The spring and late-summer cohorts cross over when spawning: most spring-spawned hatchlings spawn in the late summer of the following year while hatchlings spawned in the late summer spawn in the spring two years later (Mesnil 1977).
The domestic fishery for Loligo began in the late 1800s, and from 1928 to 1966, annual squid landings from Maine to North Carolina (induding Illex illecebrosus landings) averaged roughly 2,000 mt. A directed foreign fishery for Loligo developed in 1967, and total annual landings averaged 19,900 mt from 1967 to 1986. Since 1986 however, foreign fishing allocations have been curtailed and domestic landings have averaged 17,600 mt.
In 1991, domestic landings of Loligo were 19,392 mt, an increase of 25 percent over 1990. The vastmajority of these landings were made in the Southern New England and Mid-Atlantic Bight areas by vessels using bottom otter-trawl gear. Catch-perunit-effort indices and total fishing effort also increased in 1991.
Loligo are managed by the MidAtlantic Fishery Management Council under provisions of the Atlantic Mackerel, Squid, and Butterfish Fishery Management Plan. For 1991, the
maximum optimum yield and the allowable biological catch for Loligo were 44,000 and 37,000 mt, respectively. The domestic allowable harvest was 31,000 mt (MAFMC 1990). For 1992, the domestic allowable harvest has been raised to 34,000 mt (MAFMC 1991).
The stratified mean-number-pertow of all sizes of Loligo squid obtained in the NEFSC autumn bottom trawl survey provides an index of relative stock abundance. In 1991, this
NMFS pllotos by Brenda Figuerido
index was 20 percent above its 1967-1990 mean, and 1 percent below its 1990 value.
Catch-per-unit-effort and research survey indices suggest that the Loligo population is near its average level of abundance since intensive exploitation of the stock began in the late 1960s. Commercial availability of Loligo, however, depends upon environmental factors, making it difficult to predict whether overall landings will increase in 1992. Preliminary

Page 106
~ b 0 B (() Z
~ U 5: r-w ~
Long-Finned Squid Gulf of Maine-Middle Atlantic
50.-------------------------------------------r 700
40
30
20
10
600 '0' .s. 3=
500 ~ I U
400 !;;j: U Z oCt
300 ~
Cl w 200 !;!;;
!;;j: g:
100' (()
o 0 62 64 66 68 70 n 74 76 78 80· 82 84 86 88 90 92
YEAR
Table 28.1 Recreational and commercial catches (thousand metric tons)
Year Category 1972-81 1982 1983 1984 1985 1986 1987 1988 1989 1990 1991
Ave.rage
U.S. recreational Commercial
United States 2.2 5.5 15.9 11.6 Canada Other 23.0 15.8 11.7 11.0
Total catch 25.2 21.3 27.6 22.6 Allowable 44.0 44.0 44.0
biologic! catch
Long-tenn potential catch SSB for long-tenn potential catch Importance of recreational fishery Management
Status of exploitation Age at 50% maturity Size at 50% maturity Assessment level Overfishing definition
10.2
6.5 16.7 33.0
Fishing mortality rate corresponding to overfishing definition
M 2:,1.0 FOol = Unknown
13.3 11.5 19.1 23.0 15.5 19.4
4.6 <0.1 <0.1 <0.1 0.0 0.0 17.9 11.5 19.1 23.0 15.5 19.4 37.0 37.0 37.0 37.0 37.0 37.0
'44,OOOmt Unknown
Insignificant Squid, Mackerel and
Butterfish FMP Underexploited
1 year 16 cm dorsal-mantle length
Index 3-year moving average of
autumn prerecruit index falls within lowest quartile of
this time series
Unknown
F IIIU = N/A FI!I9I = Unknown
"Commercial availability of Loligo, however, de
pends upon environmental factors, making it
difficult to predict whether overall landings
will increase in 1,992."
landings figures for the first quarter of 1992 were more than double those for 1991. However, preliminary data for the Massachusetts inshore fishery dur- ' ing late April and May indicate that landings were much lower than expected. While total Loligo landings in 1992 are not likely to drop below 1991 levels, catch-per-unit-effort may decrease. At present, the Loligo stock is considered underutilized.
For further information
Mesnil, B. 1977. Growth and life cycle of squid, Loligo peale; and lllex illecebrosus, from the Northwest Atlantic. NAFO Research Document 76fVI/65.
Mid-Atlantic Fishery Management Council. 1990. 1991 Allowable biological catch, optimum yield, domestic annual harvest, domestic annual processing, joint venture processing, and total allowable level of foreign fishing recommendations for Loligo, /llex, and butterfish. Dover, DE: Mid-Atlantic Fishery Management Council.
Mid-Atlantic Fishery Management Council. 1991. 1992 Allowable biological catch, optimum yield, domestic annual harvest, domestic annual processing, joint venture processing, and total allowable level of foreign fishing recommendations for Atlantic mackerel, Lo/igo, lllex, and butterfish. Dover, DE: Mid-Atlantic Fishery Management Council.
Northeast Fisheries Science Center. 1992. Report of the 14th Northeast Regional Stock Assessment Workshop (14th SAW). NEFSC Reference Document 92-07 . Available from: NOAAjNMFS, Northeast Fisheries Science Center, Woods Hole, MA 02543.

Page 107
American· Lobster The American lobster, Homarus
americanus, is distributed in the N orthwest Atlantic from Labrador to Cape Hatteras from coastal regions out to depths of 700 m (400 fathoms). Lobsters are locally abundant in coastal regions within the Gulf of Maine and off southern New England and less abundant in more southerly areas. Coastal lobsters are concentrated in rocky areas where shelter is readily available, although occasional high densities occur in mud substrates suitable for burrowing. Offshore populations are most abundant in the vicinity of submarine canyons along the continental shelf edge. Tagging experiments in coastal waters suggest that small lobsters undertake rather limited movement, with some evidence that larger individuals may travel extensively. In contrast, offshore lobsters show well-defined shoal ward migrations during the spring, traveling as much as 300km (186mi),regularly 80 kIn (50 mi). Lateral movements along the shelf edge have been demonstrated as well.
Lobsters exhibit a complex life cycle in which mating occurs following molting of the female and the eggs (7,000 to 80,(00) are carried under the females abdomen during a 9 to 11 month incubation period. The eggs hatch during late spring or early summer and the pelagic larvae undergo four molts before attaining adult characteristics and settling to the bottom. Lobsters molt approximately 20 times (in 5 to 8 yr) before reaching minimum size. A significant proportion of the lobsters caught in inshore are not sexually mature.
The principal fishing gear used to catch lobsters is the trap. Lobsters are also taken as a bycatch with otter trawls. Recreational fishing occurs, especially in coastal waters, but estimates of the catch are not available. Foreign fishing is insignificant. The fishery is
Charlie Wheeler with big lobster, early 19605.
managed under the New England Fishery Management Council's Lobster FMP, and within 3 mi of shore under various state regulations. The primary regulatory measure is carapace length. Total landings increased 15 percent from 1989 to 1990 (from 24,000 mt to 27,600 mt). In 1991, total u.s. landings rose again to 28,700 mt (slightly over 4 percent from 1990).
NMFS photo by Bob Brigham
Inshore Fishery
Nominal landings in the U.S. inshore fishery remained relatively stable from 1965 to 1975, ranging from 10,300 mt to 12,200 mt, averaging 11,100 mt. From 1978 to 1990, the catch has risen steadily from 12,900 mt to a record 22,600 mt in 1990, an
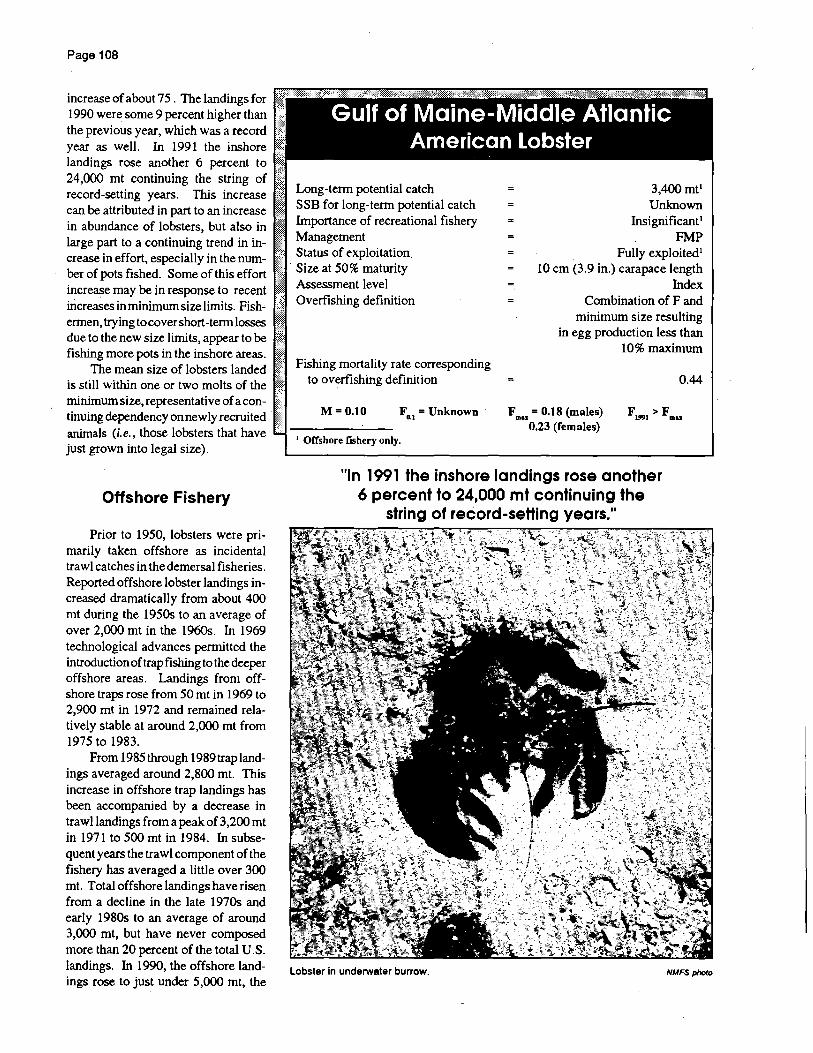
Page 108
increase of about 75. The landings for 1990 were some 9 percent higher than the previous year, whlch was a record year as well. In 1991 the inshore landings rose another 6 percent to 24,000 mt continuing the string of record-setting years. This increase can be attributed in part to an increase in abundance of lobsters, but also in large part to a continuing trend in increase in effort, especially in the number of pots fished. Some of this effort increase may be in response to recent increases in minimum size limi ts. Fish" ermen, trying to cover short -term losses due to the new size limits, appear to be fishlng more pots in the inshore areas.
The mean size of lobsters landed is still within one or two molts of the minimum size, representati ve of a continuing dependency on newly recruited animals (i.e., those lobsters that have just grown into legal size).
Offshore Fishery
Prior to 1950, lobsters were primarily taken offshore as incidental trawl catches in the demersal fisheries. Reported offshore lobster landings increased dramatically from about 400 mt during the 1950s to an average of over 2,000 mt in the 1960s. In 1969 technological advances permitted the introduction of trap fishing to the deeper offshore areas. Landings from offshore traps rose from 50 mt in 1969 to 2,900 mt in 1972 and remained relatively stable at around 2,000 mt from 1975 to 1983.
From 1985 through 1989 trap landings averaged around 2,800 mt. This increase in offshore trap landings has been accompanied by a decrease in trawl landings from a peak of 3,200 mt in 1971 to 500 mt in 1984. In subsequent years the traw I component of the fishery has averaged a little over 300 mt. Total offshore landings have risen from a decline in the late 1970s and early 1980s to an average of around 3,000 mt, but have never composed more than 20 percent of the total U. S. landings. In 1990, the offshore landings rose to just under 5,000 mt, the
Long-term potential catch SSB for long-term potential catch Importance of recreational fishery Management Status of exploitation
. Size at 50% maturity Assessment level Overfishing definition
Fishlng mortality rate corresponding to overfishing definition
M= 0.10 Fo.1 = Unknown .
I Offshore fishery only.
3,400mtl Unknown
Insignificant 1
FMP Fully exploited 1
10 cm (3.9 in.) carapace length Index
Combination of F and minimum size resulting
in egg production less than 10% maximum
F mu = 0.18 (males) 0.23 (females)
0.44
IIln 1991 the inshore landings rose another 6 percent to 24,000 mt continuing the
string of record-setting years."
Lobster in underwater burrow. NMFS photo

American Lobster Gulf of Maine-Middle Atlantic
.30 ...,--------------------..-1.6
25
"in' b 20 0 8-Vl Z 15 ~ u 0: I- 10 W ~
5
o O~
62 64 66 68 70 72 74 76 78 80 82 84 86 88 90 92
YEAR
Table 29.1 Cormnercial and recreational landings (thousand metric tons), live weight). Landings statistics have been revised to reflect unreported catches.
Yellr Category 1971-81 1981 1983 1984 1985 1986 1987 1988 1989 1990 1991
Average
U.S. recreational' Cormnercial
United States Offshorel 2.6 2.5 2.4 4.2 Inshore' 12.4 16.1 17.6 16.4
Canada Georges Bank 0.2 0.2 0.2 0.2
Total nominal catch 15.2 18.8 20.2 20.8
I Recreational catches unknown. 2 Includes trawl and ol'fshore trap catches. 3 IDBhore trap catches,
highest on record, representing an increase of about 50 percent over the previous year. The contribution of the offshore fishery to overall landings in 1990 was about 19 percent of the total. In 1991, the offshore component of the landings dropped slightly to around 4,700 mt (16 percent of the total).
The NEFSC autumn survey bio-' mass index declined steadily from 1.15 kg/tow in 1964 to 0.68 kg/tow in 1971. From 1971 to 1976, this index averaged 0.69 kg/tow, and increased to an average of 0.86 kg/tow from 1977 to 1980. In 1986, the autumn index dropped to 0.8 kg/tow and to 0.75 in
2.6 3.4 3.3 3.0 3.3 5.0 4.7 18.0 17.8 17.3 19.2 20.7 22.6 24.0
0.2 <0.1 <0.1 <0.1 <0.1 0.1 0.2 20.8 20.9 20.7 22.2 24.0 27.7 28.9
1987 and 1988. A slight rise in the index from 1989 to 1991 brought this value up to 0.8, slightly below the average of 0.82 for the previous 20-year period. Trends in the commercial CPUE index (catch-per-trap-haul-setover-day or kg/THSOD) follow that of the NEFSC autumn survey . Thus these trends in biomass indices and offshore landings are consistent in indicating a reduction in stock biomass following the development of the offshore fishery, with stabilization of the stock at reduced levels in recent years.
The increases in the offshore landings in the past decade and the contin-
Page 109
" If consistent recruitment in the coastal areas
depends on high abundance of spawning
lobsters offshore. then recent decreases in the abundance caused by the development of the offshore trap fishery may result in reduced inshore catches in future years,"
ued intense inshore fishery have raised the question of the relationship between animals in these two areas. If consistent recruitment in the coastal areas depends on high abundance of spawning lobsters offshore, then recent decreases in the abundance caused by the development of the offshore trap fishery may result in reduced inshore catches in future years. It would be prudent to view lobsters from both areas as a whole resource. Work is currently underway to develop means of tying these areas together. Assessments conducted at SAW 14 indicate that the resource is at least fully exploited in all areas and may be overexpoited when considered regionwide.
For further information
Fogarty, MJ.,' R.A. Cooper, J.R. Uzmann, and T.S. Burns. 1982. Assessment of the USA offshore American lobster, Homarus americanus, fishery. ICES CM. 1982/ K:13. 21 p.
Northeast Fisheries Science Center. 1992. Report of the 14th Northeast Regional Stock Assessment Workshop (14th SAW). NEFSC Reference Document 92-07. Available from: NOANNMFS, Northeast Fisheries Science Center, Woods Hole, MA 02543.

Page 110
Northern Shrimp (--:::::-:::-
~ The northern shrimp, Pandalus
borealis, supports important commercial fisheries in the North Atlantic and the North Pacific; the Gulf of Maine marks the southernmost extent of its Atlantic range. Distribution within the Gulf appears to be governed in large measure by temperature conditions; highest concentrations occur in the southwestern Gulf of Maine where temperatures are coolest, and seasonal changes in distribution appear to correlate well with localized temperature trends. Historical trends in abundance also appear to have been strongly influenced by temperature, with abovenormal temperatures being associated with poor recruitment. This stock collapsed during themid-1970s, but abundance has since increased considerably.
Northern shrimp are hermaphrodites, maturing first as males. After spawning as males in late summer at about 2.5 years of age, individual shrimp pass through a series of ~ansitional stages the following winter and spring, and then spawn as females (age 3.5 years) the following summer. Eggs are extruded onto the abdomen and fertilized within a month of spawning. During autumn and winter, egg-hearing females migrate inshore, where the eggs hatch (late winter at age 4). Females may survive to spawn in subsequent years, although natural mortality appears to increase sharply following first hatching.
Shrimp are taken primarily by otter trawling, although pots have also been used successfully along the central Maine coast. -There -is no recreational or foreign fishery. Management is by the participating states (Maine, New Hampshire and Massachusetts) under the auspices of the Atlantic States Marine Fisheries Commission (ASMFC). The fishery has been managed primarily by mesh size regulations and seasonal closures. Current management allows for fish-
ing seasons of varying length within a window of 183 days (December 1 to May 31), depending on resource conditions. Fishing was allowed during the full 183 day time frame from the 1986 fishing season (December 1985 through May 1986) through the 1991 season. The 1992 fishing season was reduced somewhat (December 16, 1991 to May 15,1992) in response to assessment evidence for declining abundance and recruitment.
Fishing effort haS been directed -primarily toward mature females in inshore areas during winter; effort tends to shift further offshore in spring, reflecting both post-hatch movement and improving weather conditions. Total effort on this stock (number of trips) has risen-steadily from 1,100 trips in 1980 to 12,300 trips during the 1987 fishing season; effort during the 1988-1990 fishing seasons was relatively constant, at an average of about 9,400 trips. For the 1991 fishing season, effort declined somewhat (7,200 trips).
Nominal catches peaked at 12,800 mt in 1969, averaged approximately 11,OOOmt during 1970-1972, and then
-NMFS pholo by Brenda Figuerldo
declined precipitously during the midto late 1970s. Landings subsequently increased steadily from 300 mt in 1980 to 5,000 mt in 1987, and then decreased to an average of 3,300 mt for 1988 a:nd 1989. Landings for 1990 totaled approximately 4,400 mt, reflecting recruitment of the strong 1987 year class; but the 1991 total declined to 3,4oomt. This-decline is believed to reflect changes in availability associated with higher than normal water temperatures in inShore areaS 'during winter of-1991. Preliminary data for the 1992 fishing season indicate a total of 3,300 mt.
Since 1983, the primary source of assessment information for this stock has been the cooperative state-federal survey conducted each August by the Northern Shrimp TechnicalComrnittee aboard the NEFSC RfV Gloria Michelle. This survey has detected two strong year Classes, one produced in 1982 and a second produced in 1987; other year classes in the time series have been considerably weaker. Summer survey index values peaked in 1985-1986 and then declined in

Northern Shrimp Gulf of Maine
14.-------------------...,.-5
12
"'iii' 10 b o S (f) Z ~
8
U 6 0:: tW ~ 4
2
j\
f~\~ /.'\ ~ ~i ~
\f , ~
'\ ,~
,\ t, ~. ,
AUTUMN " SURVEY --- ~ ,,-. INDEX " .. ~
LANDINGS
O+-~~~~_T~~~_T~~~~~~~~~~_+O 62 64 66 68 70 n 74 76 78 80 82 84 86 88 90 92
YEAR
Table 30.1 Recreational catches and conunercial landings (thousand metric tons)
Year Category 1972-81 1982 1983 1984 1985 1986 1987 1988 1989 1990
Average
U.S. recreational Conunercial
United States 3.7 1.6 1.6 3.3 4.2 4.7 5.0 3.1 3.6 4.4 Canada Other
Total nominal catch 3.7 1.6 1.6 3.3 4.2 4.7 5.0 3.1 3.6 4.4
Gulf of Maine Northern Shrimp
~1 ~ Long-tenn potential catch ••••• SSB for long-tenn potential catch ; Importance of recreational fishery I Management
Status of exploitation ~ , Age at 50% maturity 1: ~~; Size at 50% maturity :~: Assessment level
I ~=:;~S~:es-mng
Unknown N/A
Insignificant Interstate Shrimp FMP
Fully exploited 2 years
9 cm (3.5 in.) Index None
N/A
iii!: ~:~ M=0.5 FO•I = 0.5 F IDOl! = Undefmed FI991 = 0.1
1991
3.4
3.4
Page 111
'The 1987 year class is now considerably re
duced, and subsequent year classes appear to
be much weaker."
1987, reflecting increased natural and fIShing mortality on the 1982 year class. Catch-per-tow then increased again with recruitment of the 1987 year class; weight-per-tow indices for 1990 were among the highest observed in the time series. Trends for the NEFSC autumn survey index have been similar. Both indices declined in 1991, reflecting increased mortality on the 1987 year class.
The 1987 year class is now considerably reduced, and subsequent year classes appear to be much weaker. Consequently, stock biomass and landings are expected to decline further during 1993-1994.
For further information
McInnes, D. 1986. Interstate fishery management plan for the northern shrimp (Panda Ius borealis Kroyer) fishery in the western Gulf of Maine. Atl. States Mar. Fisher. Commis. Fish. Mgt. Rept. No.9.
Northern Shrimp Technical Committee. 1991. Assessment report for Gulf of Maine northern shrimp, 1991. Report to the Northern Shrimp Section of the Atlantic States Marine Fisheries Commission, November 1991. Washington, D.C.: Atlantic States Marine Fisheries Commission.
Northern Shrimp Technical Committee. Unpublished. Cruise results: Gulf of Maine northern shrimp survey, July 29-August9, 1991. Available from: NOAA/NMFS, Northeast Fisheries Science Center, Resource Survey Investigation, Woods Hole, MA 02543.

Page 112
Surfclam Surfclams, Spisula solidissima,
are distributed in western North Atlantic waters from the southern Gulf of St. Lawrence to Cape Hatteras. Commercial concentrations are found primarily off New Jersey and the Delmarva Peninsula, although some fishable quantities exist in Southern New England waters, on Georges Bank, and off the Virginia Capes. In the MidAtlantic region, surfC\ams are found from the beach zone to a depth of about 60 m; beyond 40 m, however, abundance is low. Growth rates are relatively rapid, with clams reaching harvestable size in about six to seven years. Maximum size is about 22.5 cm (8-7/8 in.), but clams larger than 20 cm (7-7/8 in.) are rare. Surfclams are capable of reproduction at the end of their first year of life, although most do not spawn until the end of their second year. Eggs and sperm are shed directly into the water column; recruitment to the bottom occurs after a planktonic larval period of about three weeks (at 22°C).
The principal fishing gear for sllrfclam is the hydraulic clam dredge. Recreational and foreign fishing is insignificant. The EEZ fishery is managed under the Surf Clam-Ocean Quahog FMP of the Mid-Atlantic Fishery Management Council. The primary management measure is a total allowable catch (T AC) limit, as well as minimum size and area closures to limit the taking of small clams. Landings from EEZ and state waters decreased 8 percent in 1991 (32,600 mt to 30,000 mt).
Total landings of surfclams averaged roughly 20,000 mt in the early 19605, increased to over 46,000 mt by 1974, and then decreased by 1979 to well below the earlier average of 20,000 mt. Landings have subsequently increased under management restrictions, especially in EEZ waters.
Regulation of the fishery has proceeded with a principal objective being to rebuild depleted stocks. This
Surlclams and quahogs
was accomplished under Amendments 1 through 7 of the Surf Clam-Ocean Quahog FMP. Under Amendment 8,
. anITQ (Individual Transferable Quota) system was established in 1990, whereby the annual landings quota was allocated disproportionally to the vessels participating in the fishery, based on a combination of performance history and vessel size. The intent of thls system is to address economic inefficiencies that resulted from the intensive regulatory scheme used to rebuild the depleted stocks. Attendant with the adoption of the ITQ scheme, the restrictions on hours and days of the week fished and a moratorium on vessel construction were dropped. In their place, trading of vessel allocations is intended to reduce vessel overcapitalization, and result in a more
NMFSphoto
efficient use of harvest sector capital. In 1990, 128 vessels participated in the Mid-Atlantic EEZ fishery. The number of vessels in the fishery declined to 75 in 1991 (-41percerit) with theadoption of Amendment #8 to the FMP. Two management areas, New England and Mid-Atlantic, were formerly identified in the FMP, but have been combined in Amendment #8 of the FMP. A single annual quota (24,300 nit of meats in 1992) applies to all management areas. Currently, the Georges Bank region remains closed to the harvesting of surfc\ams, due to the presence of paralytic shellfish poisoning toxins.
Intensive fishing for surfc\ams was initiated during the post-World War II era in response to increasing demands and dwindling supplies of traditional

Surfclams 50,-----------------------------------------T8
'Iii' 40 b 0
6 __
0 0') .......... C til
3 S .30 ,
~ ~ 1\ , 'P \ ,
lL. 4:c 0 \ , <.:)
til \ ,
W , Z 20 \ 3 ~
MID-ATLANTIC ~ '<i: u I w f2 SURVEY 2~ f- INDEX , , W 10 ~ \ ,
\ , --
o 0 6.3 65 67 69 71 7.3 75 77 79 81 83 85 87 89 91 93
YEAR
Table 31.1 Recreational catches and commercial landings (thousand metric tons, meats)
Year Category 197Z-81 198Z 1983 1984 1985 1986 1987 1988 1989 1990 1991
Average
U.S. recreational Commercial
United States EEZ 21.1 16.7 20.5 24.7 23.7 24.9 22.1 23.9 22.3 24.0 20.6 State waters 5.5 5.9 4.9 7.2 9.2 10.8 5.4 4.9 8.1 8.5 9.4
Canada Total nominal catch 26.6 22.6 25.4 31.9 32.9 35.7 27.5 28.8 30.4 32.6 30.0 Total allowable 18.1 18.9 24.3 24.3 24.3 24.3 24.3 24.3 24.3 24.3
EEZcatch
New England-Middle Atlantic Surf Clams
Long-term potential catch SSB for Long-term potential catch Importance of recreational fishery Management
Status of exploitation Age at 50% maturity Size at 50% maturity Assessment level Overfishing definition
Fishing mortality rate corresponding to overfishing definition
24,300mt Unknown
Insignificant Surf Clam and Ocean
QuahogFMP Fully exploited
2 years 5 cm (2.0 in.) shell length
Index Optimum yields between 14,300 mt and 22,400 mt
0.1
Page 113
"The number of vessels in the fishery declined
to 75 in 1991 (-41 percent) with the
adoption of Amendment #8 to the FMP."
clam species. Almost all of these early , landings were derived off Long Island
and northern New Jersey. Extensive offshore beds were discovered and developed off Pt. Pleasant, N.J. during the 1950s; combined with inshore beds near Cape May-Wildwood, the New Jersey resources supported the fishery until the early 1970s. Declining productivity off New Jersey prompted a shift of effort to the south during the early 1970s. New beds off southern Virginia and North Carolina contributed to a tremendous increase in total landings during 1973-1975. Average catches in these three years of 40,100 mt (meats) were 50 percent greater than the 1965-1977 average of 27,000 mt. The southern Virginia-NorthCarolina fishery collapsed during 1976; most vessels returned to more northern ports. During 1989, most of the Middle-Atlantic landings were taken off New Jersey, with the remainder taken off the Delmarva Peninsula and south. Total EEZ landings in 1991 were 20,600 mt, representing a 14 percent decrease from the previous year's total of 24,000 mt.
Biomass indices from research vessel surveys generally parallel trends in landing statistics from various portions of the management area. Stock biomass and landings of surfclams declined steadily off the northern New Jersey coast from the mid-1960s to 1977. A mass mortality of surfclams in the northern New Jersey area during the summer of 1976 reduced the abundance of commercial-sized clams to extremely low levels. Surveys from 1978 onward indicated a substantial 1976 year class in the area subjected to the clam kill. Growth to harvestable
Fo.1 = 0.11 F DIU = 0.46 FI991 = 0.1 size of this single year class off north-~------------~~------~~--------~~------~
M=O.OS

Page 114
"Catch-per-unit-effort (bushels-per-hour-fished)
has peaked for the Mid-Atlantic fishery and will continue to decline
gradually in the absence of strong year classes spawned since 1977."
em New Jersey resulted in an increasing proportion of total Mid-Atlantic catches from that area. Almost all of the 1976 year class is larger than the minimum size (12 cm), which for the 1991 fishing season, was suspended due to the relatively low abundance of prerecruit-sized clams and the likely incentive under Amendment 8 to target beds of larger surfclams.
Biomass off the Delmarva Peninsula continued at relatively high levels until the return of the fleet from southern Virginia-North Carolina during 1976. Concentration of the offshore fishery in Delmarva waters between 1976 and 1980 resulted in declining stocks of commercial sizes. Recent surveys indicate that the abundance of the 1977 year class has remained high but is declining. These clani have grown at substantially slowerrates than the 1976, year class off New Jersey, perhaps in response to the very high density of surfclams off Delmarva.
Research vessel survey data collected through 1992 indicated adequate surfclam resource to support the Middle Atlantic EEZ fishery at or near the current levels (18,000 to 23,000 mt of meats) for the next few years. Likewise, landings of 3,000 to 4,000 mt of meats can be sustained from New England waters (southern New England and Georges Bank) for the next decade. With the closure of the Georges Bank fishery, biomass will likely accumulate due to the low natural mortality rate of surfclams.
Landings from inshore (state) waters increased between 1987 and 1991 (5,400 mt to 9,400 mt). TItis increase in nearshore landings is due
primarily to greater landings from inshore New York waters, and to a lesser extent, from off New Jersey.
EEZ landings continue to be relatively stable due to the large standing stock relative to the annual quota. In the last several years, concentrated fishing in the New Jersey area off Atlantic City has reduced biomass in that area. Nevertheless, substantial resources there, and especially off the Delmarva Peninsula, are sufficient to sustain the fisheryduring the next several years. Catch -per-uni t -effort (bushels-perhour-fished) has peaked for the Mid- . Atlantic fishery and will continue to . decline gradually in the absence of strong year classes spawned since 1977.
NMFSpholD
For further information
Murawski, S.A. 1989. Assessment updates for middle Atlantic, southern New England, and Georges Bank surf clam populations. Report of the 9th NEFC StockAssessment Workshop (9th SAW), Working Paper #4. NEFSC Reference Document 89-08. Available from: NOAAjNMFS, Northeast Fisheries Science Center, Woods Hole, MA 02543.
Murawski, S.A., and J .S. Idoine. 1990. Yield sustainability under constant catch policy and stochastic recruitment. Trans. Amer. Fish. Soc. 118(4):349-367.
Northeast Fisheries Center. 1989. Report of 9th NEFC Stock AssessmentWorkshop(9thSA W). NEFSC Reference Document 89-08. Available from: NOAA/NMFS, Northeast Fisheries Science Center, Woods Hole, MA 02543.

Page 115
Ocean Quahog
The ocean quahog,Arctica islandica, is a bivalve rnolluskfound in temperate and boreal waters on both sides of the North Atlantic. Distribution in the western Atlantic ranges from Newfoundland to Cape Hatteras in depths from 8 to 256 m. Quahogs are rarely found where bottom water temperatures exceed 16°C and occur progressively further offshore between Cape Cod and Cape Hatteras. In the Gulf of Maine region, ocean quahogs are distributed in relatively nearshore waters, with fishable concentrations 3 to 7 mi from shore.
In the Middle Atlantic region, ocean quahog populations are composed primarily of relatively large (> 70 mm shell length), old individuals, and there is little evidence of recent recruitment to these populations. In contrast, Gulf of Maine populations (primarily off eastern Maine) are comprised of smaller (about 50 mm shell length) individuals, with more dynamic
recruitment in recent years. Growth rates of ocean quahog are similar in Gulf of Maine and Middle Atlantic areas. Results of mark-recapture, shell banding, and length frequency studies indicate that the ocean quahog has a longevity of more than 100 years, and that after age 20 the growth rate is exceedingly slow. Spawning apparently occurs over a protracted interval from summer through autumn, freefloating larvae develop slowly ( more than 90 days until setting), and thus may drift far from their parents.
The principal gear used is the hydraulic clam dredge, and most ocean quahogs are caught off southern New Jersey and the Delmarva peninsula. Recreational and foreign fishing in the EEZ are insignificant. The EEZ fishery is managed under the Surf ClamOcean Quahog FMP of the Mid-Atlantic Fishery Management Council. Provisions of Amendment 8 of the Surf Clam-Ocean Quahog FMP insti-
NMFSphoto
tute for the first time an ITQ (individual transferable quota) system for both surfclarns and ocean quahogs, allocating percentages of the annual quota, based on vessel performance history and vessel size. For ocean quahog, management measures in effect include an annual quota (22,700 mt of shucked meats), vessel allocations, and reporting requirements for both processors and fishing vessels.
Ocean quahogs were first harvested commercially during World War II off Rhode Island. Total landings, however, never exceeded 2,000 mt of shucked meats until 1976 when offshore exploitation began off New Jersey and Maryland. Steady declines in offshore Mid-Atlantic surfclam stocks combined with the massive kill of surfclarns off New Jersey in 1976 stimulated fishing for the deeper-dwelling ocean quahog. Total ocean quahog landings increased dramatically between 1976 and 1979, from 2,500

Page 116
"If current harvest rates and patterns are
maintained, the ocean quahog fishery off New Jersey and Delmarva
should continue to exhibit declining CPUE and
a northward shift of the fishery,"
tft 15,800 mt of meats per year. Landings in 1991 (22,000) were near the record high level observed in 1985. Most of the landings are currently derived from the EEZ waters of the MidAtlantic Bight, with some EEZ landings from off Maine, and an inshore fishery (state waters) off Rhode Island. Landings from the Gulf of Maine fishery are primarily for small (about 50 mm shell length) quahogs, which are sold as a fresh, in-shell product. Landings of larger quahogs in Middle Atlantic waters are used-in processed clam products (for example, chowders, minced clams, juices, etc.)
Resource surveys for ocean quahog in the Georges Bank-Cape Hatteras region have been conducted by the NEFSC since 1965. Biomass indices from swept-area calculations indicate a biomass (meat weight) of about 1.1 million mt. These calculations are considered a minimum estimate of standing stock to the extent that the survey dredge is not 100 percent efficient in catching animals encountered in the dredge path. Of this total biomass, 6 percent in the Southern Virginia-North Carolina region, 8 percent off Delmarva, 21 percent off New Jersey, 21 percent-Long Island, 28 percent-Southern New England, and 22 percent on Georges Bank.
Trends in fishery perfonnance from 1979 to 1991 have been documented using catch and effort data from mandatory logbook submissions. These data indicate a significant downward trend since 1987 (after an initial
Long-tenn potential catch SSB for long-tenn potential catch Importance of recreational fishery Management
Status of exploitation
Age at 50% Maturity
Size at 50% maturity Assessment level Overfishing definition
Fishing mortality rate corresponding to overfishing definition
M = 0.01-0.10 Fo.1 = Unknown
22,700mt 1,135,000 mt Insi gnificant
Surf Clam and Ocean QuahogFMP
Fully Exploited in some areas
8 years, males 11 years, females
50 mm (2.0 in.) shell length Index
Optimum yields between 18,100 and 27,200 mt
<1.0
FI991 = <0.1 F = 0.03-0.05 mas
NMFSphoto
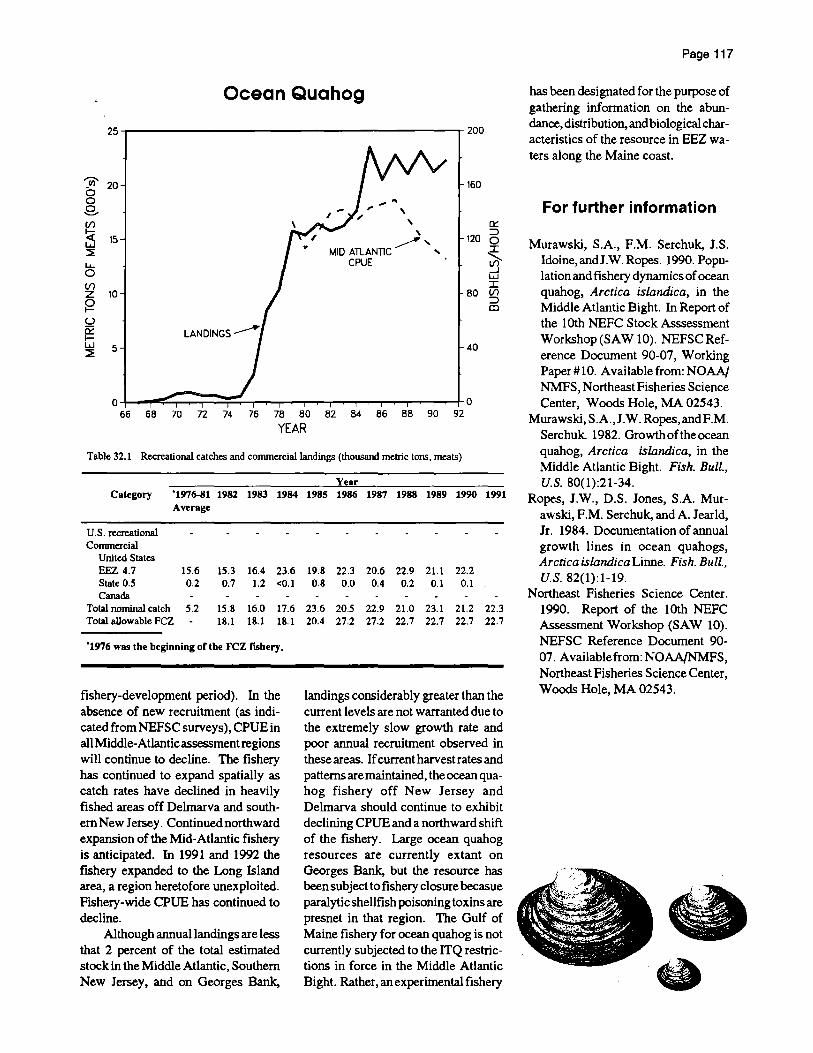
Ocean Quahog
25,-------------------------------------------r200
'Iii' 20 160 a 0 " .. s. , V1
, 0::
3 , , 120
:::::> 15
MID ATLANnC ~ " " 0
~ ~ 1..1.. CPUE V1 0 ....J
W V1 I Z 10 80 III
~ :::::> CD
u 12 I-W 5 40 ~
o 0 66 68 70 72 74 76 78 80 82 84 86 88 90 92
YEAR
Table 32.1 Recreational catches and cornmerciallandings (thousand metric tons, meats)
Year Category '1976-81 1982 1983 1984 1985 1986 1987 1988 1989 1990 1991
Average
u.s. recreational COJTUnercial
United States EEZ 4.7 15.6 15.3 16.4 23.6 State 0.5 0.2 0.7 1.2 <0.1 Canada
Total nominal catch 5.2 15.8 16.0 17.6 Total allowable FCZ 18.1 18.1 18.1
"1976 was the beginning or the FC Z fIShery.
fishery-development period). In the absence of new recruitment (as indicated from NEFSC surveys), CPUE in all Middle-Atlantic assessment regions will continue to decline. The fishery has continued to expand spatially as catch rates have declined in heavily fished areas off Delmarva and southern New Jersey. Continued northward expansion of the Mid-Atlantic fishery is anticipated. In 1991 and 1992 the fishery expanded to the Long Island area, a region heretofore unexploited. Fishery-wide CPUE has continued to decline.
Although annual landings are less that 2 percent of the total estimated stock in the Middle Atlantic, Southern New Jersey, and on Georges Bank,
19.8 22.3 20.6 22.9 21.1 22.2 0.8 0.0 0.4 0.2 0.1 0.1
23.6 20.5 22.9 21.0 23.1 21.2 22.3 20.4 27.2 27.2 22.7 22.7 22.7 22.7
landings considerably greater than the current levels are not warranted due to the extremely slow growth rate and poor annual recruitment observed in these areas. If current harvest rates and patterns are maintained, the ocean quahog fishery off New Jersey and Delmarva should continue to exhibit declining CPUE and a northward shift of the fishery. Large ocean quahog resources are currently extant on Georges Bank, but the resource has been subject to fishery closure becasue paralytic shellfish poisoning toxins are presnet in that region. The Gulf of Maine fishery for ocean quahog is not currently subjected to the ITQ restrictions in force in the Middle Atlant.ic Bight. Rather, an experimental fishery
Page 117
has been designated for the purpose of gathering information on the abundance, distribution, and biological characteristics of the resource in EEZ waters along the Maine coast.
For further information
Murawski, S.A., F.M. Serchuk. 1.S. Idoine,andJ.W. Ropes. 1990. Population and fishery dynamics of ocean quahog, Arctica islandica, in the Middle Atlantic Bight. In Report of the 10th NEFC Stock Asssessment Workshop (SAW 10). NEFSCReference Document 90-07, Working Paper#10. Available from: NOAA! NMFS, Northeast Fisheries Science Center, Woods Hole, MA 02543.
Murawski,S.A.,J.W.Ropes,andP.M. Serchuk 1982. Growth of the ocean quahog, Arctica islandica, in the Middle Atlantic Bight. Fish. Bull., u.s. 80(1):21-34.
Ropes, J.W., D.S. Jones, S.A. Murawski, P.M. Serchuk. and A. Jearld, Jr. 1984. Documentation of annual growth lines in ocean quahogs, Arctica islandica Linne. Fish. Bull., u.s. 82(1):1-19.
Northeast Fisheries Science Center. 1990. Report of the 10th NEFC Assessment Workshop (SAW 10). NEFSC Reference Document 90-07. Available from: NOAA/NMFS, Northeast Fisheries Science Center, Woods Hole, MA 02543.
-•' .. '~

Page 118
Sea Scallop Sea scallops, P/acopecten magel
/anicus, are found in western North Atlantic continental shelf waters from Newfoundland to North Carolina. North of Cape Cod, scattered concentrations may occur in shallow water less than 20 m (11 fathoms) deep, but in more southerly and in offshore areas, scallops nonnally are found at depths between 40 and 200 m (22 to 110 fathoms). Commercial concentrations generally exist between 40 and 100m (22 to 55 fathoms) in waters cooler than 20"C (68°F). Principal U.S. commercial fisheries are conducted in the Gulf of Maine, on Georges Bank, and in the Mid-Atlantic offshore region. Recreational fishing is insignificant, occurring primarily in Maine where shallow-water scallop beds frequently exist.
Scallops grow rapidly during the first several years of life. Between ages 3 and 5, scallops commonly increase 50 to 80 percent in shell height and quadruple in meat weight. During this time span, the number of meats per pound is reduced from greater than 100 to about 23. Maximum size is about 23 cm (9.0 in.), but scallops larger than 17 cm (6.7 in.) are rare. Sexual maturity commences at age 2, but scallops younger than age 4 probably contribute little to total egg production due to their presumed low fecundity. Spawning occurs in late summer and early autumn, varying slightly between years and areas. Eggs are buoyant, and larvae remain in the water column for 4 to 6 weeks before settling to the bottom.
The commercial fishery for scallops is conducted year-round with dredges and otter trawls as primary gear. The U.S. fishery is managed under the New England Fishery Man- . agementCouncil'sFMPfortheAtlan- , tic Sea Scallop Fishery. Total (United States and Canada) landings increased slightly in 1991 (22,600 mt to 22,800 mt).
Long-tenn potential catch Gulf of Maine Georges Bank Mid-Atlantic
SSB for long-tenn potential catch Importance of recreational fishery Management Status of exploitation Age at 50% maturity. Size at 50% maturity
Assessment level Overfishing definition Fishing mortality rate corresponding
to overfishing definition
M =0.10 FO.1
= 0.12
300 mt (territorial waters) 1O,OOOmt 3,OOOmt
Unknown Insignificant
Sea Scallop FMP Overexploited
2 to 4 yrs (GB and MA) 60 mm (2.4 in.) to
90 mm (3.5 in.) shell height (GB and MA)
Age Structured (DeLury) 5%MSP
F = 0.23 F:: = 0.71
F,,,, = 0.71
FI991 = 1.5 to 1.8
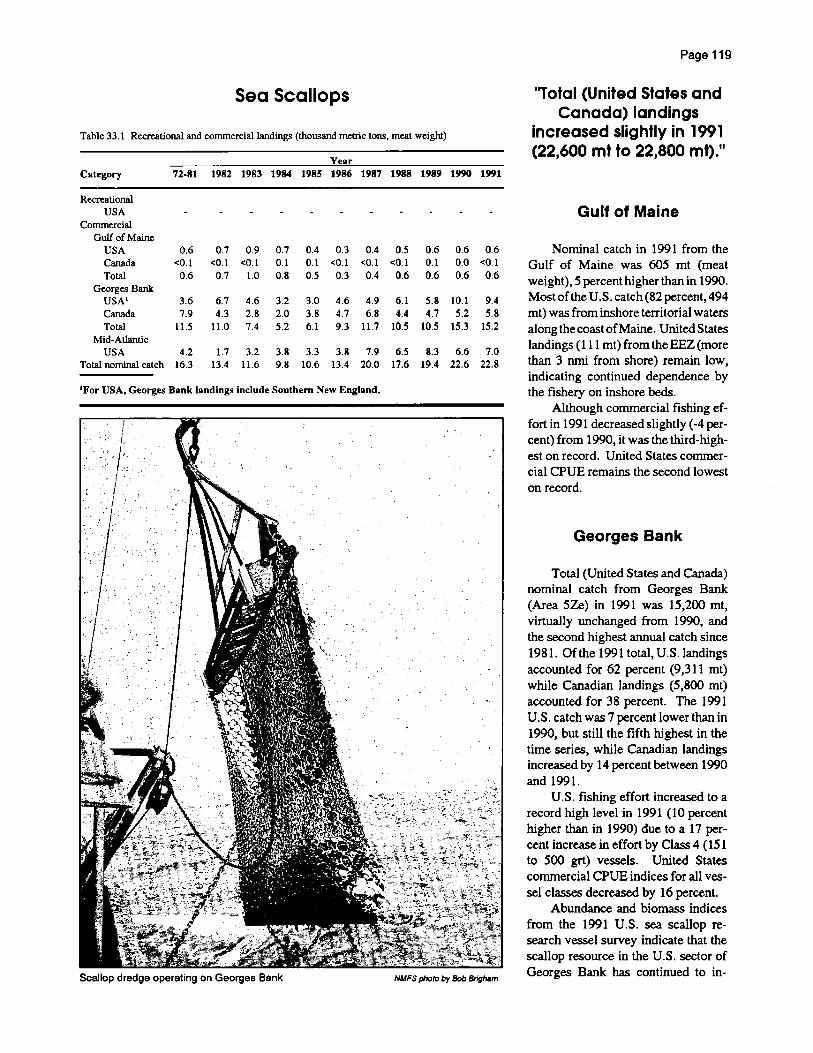
Sea Scallops-
Table 33.1 Recrealional and commercial landings (thousand metric tons, meat weight)
Year Category 72-81 1982 1983 1984 1985 1986 1987 1988 1989 1990 1991
Recrealional USA
Commercial GuU of Maine
USA 0.6 0.7 0.9 0.7 0.4 0.3 0.4 0.5 0.6 0.6 0.6 Canada <0.1 <0.1 <0.1 0.1 0.1 <0.1 <0.1 <0.1 0.1 0.0 <0.1 Total 0.6 0.7 1.0 0.8 0.5 0.3 0.4 0_6 0.6 0.6 0.6
Georges Bank USA' 3.6 6.7 4.6 3.2 3_0 4.6 4.9 6.1 5.8 10.1 9.4 Canada 7.9 4_3 2.8 2.0 3.8 4.7 6.8 4_4 4.7 5.2 5.8 Total 11.5 11.0 7.4 5.2 6.1 9.3 11.7 10.5 10.5 15.3 15.2
Mid-Atlantic USA 4.2 1.7 3.2 3.8 3.3 3.8 7.9 6_5 8.3 6.6 7.0
Total nominal catch 16.3 13.4 11.6 9.8 10.6 13.4 20.0 17.6 19.4 22.6 22.8
'For USA, Georges Bank landings include Southern New England.
Scallop dredge operating on Georges Bank NMFS photo by Bob Brigham
Page 119
''Total (United States and Canada) landings
increased slightly in 1991 (22,600 mt to 22,800 mt)."
Gulf of Maine
Nontinal catch in 1991 from the Gulf of Maine was 605 mt (meat weight), 5 percent higher than in 1990. Most ofthe U.S. catch (82 percent, 494 mt) was from inshore territorial waters along the coast of Maine. United States landings (111 mt) from the EEZ (more than 3 nmi from shore) remain low, indicating continued dependence by the fishery on inshore beds.
Although commercial fishing effort in 1991 decreased slightly (-4 percent) from 1990, it was the third-highest on record. United States commercial CPUE remains the second lowest on record.
Georges Bank
Total (United States and Canada) nontinal catch from Georges Bank (Area 5Ze) in 1991 was 15,200 mt, virtually unchanged from 1990, and
. the second highest annual catch since 1981. Of the 1991 total, U.S. landings accounted for 62 percent (9,311 mt) while Canadian landings (5,800 mt) accounted for 38 percent. The 1991 U. S. catch was 7 percent lower than in 1990, but still the fifth highest in the time series, while Canadian landings increased by 14 percent between 1990 and 1991.
U.S. fishing effort increased to a record high level in 1991 (10 percent higher than in 1990) due to a 17 percent increase in effort by Class 4 (151 to 500 grt) vessels. United States commercial CPUE indices for all vessel classes decreased by 16 percent.
Abundance and biomass indices from the 1991 U.S. sea scallop research vessel survey indicate that the scallop resource in the U.S. sector of Georges Bank has continued to in-

Page 120
"Fishing effort on Georges Bank is at record levels
and for beyond what the resource can sustain in
the long run. "
crease over the 1989 record low levels. In the South Channel region of the bank, all indices of abundance and biomass sharply increased in 1991. In the southeastern part of the bank, a substantial increase in survey indices of total abundance and biomass were observed from the 1990 values. The indices for the U.S. northern edge and peak regions decreased somewhat in 1991 from record-high 1990 values, however, prerecruit (less than 72 mm shell height) indices were the highest since the partitioning of the bank in 1984. The survey data indicate that recruitment of the 1988 year class is outstanding in the South Channel, strong in the southeast, U.S. northern edge, and peak regions of the bank. The U.S. Georges Bank scallop resource is still dominated by small scallops (81 percent of the scallops caught in the 1991 survey were larger than 80 meat count).
Fishing effort on Georges Bank is at record levels and far beyond what the resource can sustain in the long run. Current fishing mortality in the southeast part of Georges Bank is estimated to be F=0.6, while in th~ South Channel region, current fishing mortality is estimated to be F=1.9, higher thanF mu (F=.23, NEFSC 1991) and at least double that resulting in overfishing as provisionally defined by the New England Fishery Management Council. At this high fishing mortality rate, the fishery is almost entirely dependent on incoming recruitment and the scallop resource composed of only a few age groups. As such, any increases in stock abundance due to good recruitment will be short-lived and annual yield will fluctuate widely.
If the fishery continues to focus heavily on incoming recruitment, as it has in the past, resource conditions will deteriorate.
'Vi' 0 8-U1 ~ w ~ u... 0 U1 Z
~ u 0:: f-W ~
'Vi' 0 0 0 '--"
U1 ~ w ~
u... 0 U1 Z 0 I-
U 0:: I-W ~
Sea Scallops Gulf of Maine
20~-----------------------------------------.
16
12
LANDINGS~
8
4
O+-~~~~~~-r~~~~~,-~~~~~~-r~
62 64 66 68 70 72 74 76 78 80 82 84 86 88 90 92
YEAR
Sea Scallops Georges Bank
20~------------------------------------------r
16
12
8
4
LANDINGS / " , ,
'" , , , SURVEY / \ " INDEX
~ \ , \ "
. \ I
"
5
l/l ~ w
4~ 0'1
0 3: 0
31-r U ~ U
2Z 4: w ~
0 w G:
~ 0:: I-U1
o 0 62 64 66 68 70 72 74 76 78 80 82 84 86 88 90 92
YEAR

"Given the present low abundance of the
Mid-Atlantic resource, landings from this stock
are expected to be lower than the 1991 level (7,000
mt) through 1992, perhaps in the range of the long-term potential
catch estimate."
Middle Atlantic
Total nominal catch in 1991 was 7,011 mt, 8 percent higher than in 1990. For the second time since 1986, the Mid-Atlantic region did not dominate the U.S. sea scallop catch as only 41 percent of the total was taken from the Mid-Atlantic. Most of the MidAtlantic catch (67 percent) was from the New York Bight region (4,728mt), with landings in this region increasing by 38 percent between 1990 and 1991. In the more southerly scallop regions (Delmarva and VirginiaJNorth Carolina), landings decreased by 24 percent for Delmarva and 46 percent for Virginia/North Carolina over 1990 values, however, Delmarva landings still remained high at 2,192 mt.
Fishing effort in the Mid-Atlantic area increased by 30 percent in 1991, to a record of 17,360 days. Fishing activity increased across all vessel classes, with Class 3 (51 to 150 grt) increasing by 56 percent and a record high of 9,015 days. Overall CPUE in the Mid-Atlantic fishery declined by 20 percent in 1991.
Abundance and biomass indices from the 1991 U.S. sea scallop survey indicate that the resource abundance in the Mid-Atlantic has declined from the record-high levels of the late 1980s. Harvestable-size and total scallops have declined in all regions, while indices of prerecrui t scallops increased significantly only in the Delmarva region. The pattern of above-average
Page 121
Sea Scallops Middle Atlantic
12 -r---------------------T1.6
SURVEY
Vi' ~ w ::1! 'Cii' 10
b o
~ _____ INDEX , 1.2 m e, S VJ 8
~ w ::1!
t 6
VJ Z o I- 4 U
~ w ::1! 2
~LANDINGS
I
3 ~ ~ U
0.8 ~ U Z <t w ::1!
0.48 c::: ~ a::: IVJ
o 0.0 62 64 66 68 70 72 74 76 78 80 82 84 86 88 90 92
YEAR
recruitment observed in the Mid-Atlantic region in the 1985-1989 surveys (1982-1986 cohorts) has not continued with respect to the 1987 and 1988 cohorts. The Mid-Atlantic area is no longer dominated by small scallops (36 percent of the scallops caught in this area were greater than 80 meat count).
Given the present low abundance of the Mid-Atlantic resource, landings from this stock are expected to be lower than the 1991 level (7,000 mt) through 1992, perhaps in the range of the long-tenn potential catch estimate. In this region, fishing mortality appears to have increased over time. Current fishing mortality in the Delmarva region was 1.6, approximately double the fishing mortality in the provisional overfishing definition of the New England Fishery Manage-
• ment Council.
For further information
Northeast Fisheries Science Center. 1992. Report of the 14th Northeast Regional Stock Assessment Workshop (14th SAW). NEFSC Reference Document 92- 07. Available from: NOAA/NMFS, Northeast Fisheries Science Center, Woods Hole, MA 02543.
Wigley, S.E. and F.M. Serchuk. 1991. Current resource conditions in USA Georges Bank and Mid-Atlantic sea scallop populations: Results of the 1991 NMFS sea scallop research vessel survey. In Report of the 13th Northeast Regional Stock AssessmentWorkshop, Working Paper 17. NEFSC Reference Document92-02. Available from: NOAA/NMFS, Northeast Fisheries Science Center, Woods Hole, MA 02543.
Serchuk, P.M. and S.B. Wigley. 1992. Status of the sea scallop fisheries off the Northeastern United States, 1991. In Report of the 13th Northeast Regional Stock Assessment Workshop, Working Paper 11. NEFSC Reference Document 92-02. Available from: NOAA/NMFS, Northeast Fisheries Science Center, Woods Hole, MA 02543.

Page 122
River Herring River herring is a tenn applied
collectively to alewife, Alosa pseudoharengus, and blueback herring, Alosa aestivalis. The coastal range of the blueback herring is from Nova Scotia to Florida; the coastal range of the alewife is farther north, from Labrador to South Carolina. In coastal rivers where the ranges overlap, the fisheries for the two species are mixed. Both species are anadromous and undertake upriver spawning migrations during spring. Alewives may live as long as 10 yr and reach a length of 36 cm (14 in.). Blueback herring live for about 7 or 8 yr and reach a maximum length of about 32 cm (13 in.).
Alewives spawn in the spring when water temperatures are between 160Cand 19oC; blueback herring spawn later in the spring, when water temperatures are about 5°C wanner. Fecundity and age at maturity for both species are similar. Between 60,000 and 300,000 eggs are produced per female; and maturity is reached at ages 3 to 5, primarily at age 4.
The river herring fishery is one of the oldest in North America and was exclusively a U.S. inshore fishery until the late 1960s, when distant-water fleets began fishing for river herring off the Mid-Atlantic coast. The principal fishing gears used to catch river herring are fish weirs, pound nets, and gill nets. Recreational fishing does not contribute significantly to total landings. The U.S. nominal catch averaged 24,800 mt annually between 1963 and 1969. In 1969, the nominal catch began a downward trend until the midto late 1970s, and averaged 4,000 to 5,000 mt until the late 1980s. Total landings north of Cape Hatteras, N.C. have since declined to 615 mt in 1991. North Carolina, Virginia, and Maine are the only states with substantial commercial fisheries, accounting for approximately 90 percent of total landings.
In response to the observed decline in nominal catch and the lack of a coastwide increase in stock biomass, the Atlantic States Marine Fisheries Commission prepared a comprehensive coastwide management plan for shad and river herring with the partici-
NMFS photo by Brenda Figuerldo
pation of all coastal states between Maine and Florida. Bycatch of river herring in the foreign directed fisheries is managed under the Mid-Atlantic Fishery Management Council's Squid, Mackerel, and Butterfish FMP. Although fishing pressure on the resource

"Although fishing pressure on the resource has
eased considerably in recent years and the
condition of spawning habitats has improved,
recovery of the biomass has not been equal among all rivers."
has eased considerably in recent years and the condition of spaMling habitats has improved, recovery of the biomass has not been equal among all rivers. Several river herring stocks along the east coast are still being exploited above optimal levels and some potential spaMling habitats remain unavailable. The dramatic decline in landings since the rnid-1960s reflects substantial declines inresource abundance since that time.
For further information
Crecco, V.A. and M. Gibson. 1990. Stock assessment of river herring. from selected Atlantic coast rivers. ASMFCSpeciaIReport#19. Available from: Atlantic States Marine Fisheries Commission, 1400 16th St., N.W., Washington, D.C 20036.
Harris, PJ. and R.A. Rulifson. 1989. Investigations of ocean landings for American shad. and river herring from United States east coast waters. ASMFC special report #18. Availabl~ from: Atlantic States Marine Fisheries Commission, 1400 16th St., N.W., Washington, D.C. 20036.
Richkus,W.A.andG.DiNardo.1984. Current status and biological characteristics of the anadromous alosid stocks of eastern United States: American shad, hickory shad, alewife, and blueback herring. Columbia, MD: Martin Marietta Environmental Center. Available from: Atlantic States Marine Fisheries Commission, 1400 16th St., N.W., Washington, D.C. 20036.
Page 123
River Herring Gulf of Maine-Middle Atlantic
30
25
"iii' 0 20 0 8 VI Z 15 :;2 U u:: f- lO w ~
5
64 66 68 70 72 74 76 78 80 82 84 86 88 90 92
YEAR
Table 34.1 Recreational catches and commercial landings (thousand metric tons)
Year Category 1972-81 1982 1983 1984 1985 1986 1987 1988 1989 1990 1991
Average
U.S. recreational Commercial
United States 8.1 5.7 4.2 4.1 6.1 3.9 4.1 2.4 1.8 1.4 0.6 Canada Other 5.1 <0.1 <0.1 <0.1 <0.1 <0.1 <0.1 <0.1 <0.1 <0.1 <0.1
Total nominal catch 13.2 5.7 4.2 4.1 6.1 3.9 4.1 2.4 1.8 1.4 0.6
Maine - Middle Atlantic River Herring
Long-term potential catch SSB for long-term potential catch Importance of recreational fishery
~{; Management
I !'~':':' ::.:;:':
; Status of exploitation ? Age at 50% maturity ••••••••. Size at 50% maturity
Assessment level •••••• Overfishing definition
.~~.... Fishing mortality rate corresponding to overfishing definition
M = Variable Fo.1 = Variable
UnknOMl UnknOMl
Minor Shad and River Herring
Interstate Plan; Squid, Mackerel, and BuUerfish FMP
Varies by river =2 to 4 years (varies by latitude)
28 cm (11.0 in.) Index
UnknOMl
UnknOMl
Fmu = Variable FI991 = Variable

Page 124
American Shad The American shad, Alosa sapi
dissima, is an anadromous member of the family Clupeidae (herrings). Along the Atlantic coast, its range extends from southern Labrador to northern Florida. American shad undergo extensive seasonal migrations along the Atlantic coast. Shad migrate into rivers for spawning beginning in April in southern rivers, and continuing until July in the northernmost rivers. Following their downstream migration, shad migrate north along the coast to Canada where they feed during the summer. A southward migration occurs along the continental shelf where the fish winter prior to spring spawning migrations to their natal rivers.
American shad have a range of life history patterns depending on their river of origin. In southern rivers, shad return to spawn by age 4, and spawn 300,000 to 400,000 eggs; they usually spawn only once, however. With increasing latitude, the mean age at first spawning increases to 5, and the number of eggs per spawning decreases to 125,000 to 250,000 eggs; the number of spawnings per life time, however, increases.
Virtually every major coastal river along the Atlantic seaboard has, at one time, supported a stock. American shad have been the subject of intensive exploitation for their flesh and roe with nominal commercial catch along the Atlantic coast exceeding 22,000 mt in 1896. The principal fishing gear currently used for American shad is the gill net. Commercial catch reported north of Cape Hatteras, N.C. during the 1980s has been the lowest on record, averaging 1,000 mt. annually since 1980. Landings during 1991 were at the average level of 1,009 mt. Recreational fishing may be significant, but no estimates of landings are available.
Excessive fishing has been blamed for stock declines in the Hudson and Connecticut Rivers, as well as rivers in
Maryland, North Carolina, and Florida. Dams along the Susquehanna River led to an almost complete disappearance of what was once a major fishery. Pollution in the lower Delaware was cited as the primary cause for the decline in the fishery in that system. The Atlantic States Marine Fisheries Commission has implemented a coastwide management plan for American shad and river herring to facilitate cooperative management and restoration plans between states. Restoration efforts
NMFSphoto
involving habitat improvement, fish passageways, and stocking programs have resulted in improved returns to some river systems, particularly the Delaware, Connecticut, and Susquehanna Rivers.
An assessment of shad from twelve rivers along the Atlantic coast with established populations indicates that MSY ranges from 6 to 1,236 mt depending on the drainage area of the river. Present catch levels are generally far below these levels, although

'"iii' 0 0 S. Vl Z
~ U 0:: I-W ~
American Shad Gulf of Maine-Middle Atlantic
3.5
3.0
2.5
2.0
1.5
1.0
0.5
0.0 -+-.....,. ....... ~ ................ .,.........,...-.....,....,........., ................. .,.....,.....,.....,......,........ ........ .,..............,..........-l 62 64 66 68 70 n 74 76 78 80 82 84 86 88 90 92
YEAR
Table 35.1 Recreational catches and commercial landings (lhousand metric tons)
Yellr Clltegory 72-81 1982 1983 1984 1985 1986 1987 1988 1989 1990 1991
Average
u.s. recreational Conunercial
United States 1.2 0.9 0.7 1.1 0.7 1.1 0.9 1.3 1.3 1.0 Canada Olher
Total nominal catch 1.2 0.9 0.7 1.1 0.7 1.1 0.9 1.3 1.3 1.0
Gulf of Maine-Middle Atlantic American Shad
:~F .,~: Long-term potential catch
I ~im SSB for long-term potential catch ;j; Importance of recreational fishery ~:t Management .. Status of exploitation W Age at 50% maturity
:< Size at 50% maturity ~J; Assessment level n: Overfishing definition ;;;; Fishing mortality rate corresponding fr to overfishing definition
6 to 1,236 mt, varying among river systems
Unknown Major
Individual states Varies
=2 to 4 years (varies by latitude) 40 em (15.8 in.)
Index Unknown Unknown
M = varies by latitude F8.l = Unknown F1!191 = Variable
F = 0.35-1.25 ...,.
1.0
1.0
Page 125
recent increases in ocean intercept fisheries for American shad contribute an unknown degree of exploitation to certain river systems. The assessment information is insufficient to confidently determine the status of individual or aggregated stocks.
For further information
Gibson, M.R., V.A. Crecco, and D.L. Stang. 1988. Stock assessment of American shad from selected Atlantic coast rivers. ASMFC Spec. Rpt. No. 15. Available from: Atlantic States Marine Fisheries Commission, 1400 16th St., N.W., Washington, DC 20036.
Richkus,W. A., and G. DiNardo. 1984. Current status and biological characteristics of the anadromous alosid stocks of eastern United States: American shad, hickory shad, alewife, and blueback herring. Columbia, MD: Martin Marietta Environmental Center. Available from: Atlantic States Marine Fisheries Commission, 1400 16th St.,N.W., Washington, DC 20036.

Page 126
Striped Bass The striped bass, M orone saxatilis,
is an anadromous species distributed along the Atlantic coast from northern Florida to the St. Lawrence estuary, along the Pacific coast from Ensenada Mexico to British Columbia, and i~ numerous inland lakes and reservoirs. Striped bass spawn in mid-February in Florida and late June or July in Canada, and from mid-March to late July in California. Spawning occurs at or near the surface in fresh or slightly brackish waters at temperatures ranging from 100 to 23°C; peak spawning activity is observed between 15° and 200C.Larvae range from 2.0 to 3.7 mm in total length at hatching and initiate feeding after 4 to 10 days. At about 13 mm in length, larval striped bass form small schools and move inshore; juvenile striped bass move downriver into higher salinity waters during their first summer or autumn.
Most striped bass along the Atlantic coast are involved in two types of migration: an upriver spawning migration from late winter to early spring, and a coastal migration that is apparently not associated with spawning activity. CoaStal migrations may be quite extensive; striped bass tagged in Chesapeake Bay have been captured in the Bay of Fundy. Coastal migratory behavior appears to be limited to stocks north of Cape Hatteras and is related to sex and age of the fish.
Atlantic coastal fisheries for striped bass rely primarily on production from stocks spawning in the Hudson River and in tributaries of the Chesapeake Bay. The Chesapeake stock historically has produced most of the striped bass found along the coast. However since 1970, juvenile production in the Chesapeake Bay has been extremely poor. Consequently, commercial landings began a severe decline in the mid-1970s. Findings of the Emergency Striped Bass Study (ongoing since 1980) suggest that the decline in abundance of the Chesa-
.. .
/ Long-term potential catch . SSB for long-tern potential catch . Importance of recreational fishery Management Status of exploitation Age at 50% maturity
Size at 50% maturity
Assessment level Overfishing definition
Fishing mortality rate corresponding to overfishing definition
M = 0.15 Fo.1 = Dot calculated
'Moderate exploitation began in 1990.
Urlknown· .' Unknown
. -MajorStriped Bass ISFMP
Under protection l
2 years, males 6 years, females
29.7 cm (11.7 in.) males 71.1 cm (28.0 in.) females
Population projection Fishing mortality in excess
of target rates .
0.25 (during recovery phase)
0.5 (when stocks fully recovered)
F =0.5 IDIIl<
FI990 = 0.23

Striped Bass Gulf of Maine-Middle Atlantic
10 35
I SURVEY 30 I RECRUITMENT 8 .I/INDEX '0' .s
'Cii' .1 I 25 ...J
b , I I , => 0 <! , • I '1 B 6
, COMMERCIAL I I
/LANDINGS '1 20 ~ (/) z '1 W !2 • I ~ U 4 ' , 15 I a: I ~ I- « w I U :::!:
,\ , 10 Z I • \ I ~ 2 '"" I
\ :::!: I I 5
0 0 62 64 66 68 70 n 74 76 78 80 82 84 86 aa 90 92
YEAR
Table 36.1 Recreational harvest and cOlTUl1erciallandings (thousand metric tons)
Category 1972-81 1982 1983 1984 Average
u.s. recreational 1.5' 1.6 1.2 0.5 COlTUl1ercial
United Slates 3.4 1.1 0.8 1.3 Canada Other
Total nominal catch 4.9 2.7 2.0 1.8
I 79-81 (survey not conducted prior to 1979). 2 Preliminary NMFS datil.
peake Bay stock was probably due primarily to overfishing, however poor water quality in spawning and nursery habitats likely also contributed.
During the mid-1980s, stringent management measures were adopted by the states from Virginia to Maine to attempt to rebuild the Chesapeake stocks. These measures, aimed at protecting the 1982 and subsequent year. classes until females could spawn at least once, have been effective in increasing spawning stock abundance, but not necessarily recruitment. From 1987 through 1990, indices of juvenile production in Virginia's tributaries the Chesapeake Bay were at or near record high levels; in 1991 the index was near
Year 1985 1986 1987 1988 1989 1990 1991
0.8 0.4 0.4 0.6 0.3 1.2 1.62
0.6 0.2 0.2 0.2 0.1 0.4 0.5
1.4 0.6 0.6 0.8 0.4 1.6 2.1
the long-term average. However, Maryland's index of juvenile abundance has remained far below average except in 1989. Maryland's 1989 index was the second highest on record, and exceeded management criteria for relaxing fishery regulations in 1990.
Recreational landings of striped bass often equal or exceed commercial landings. In 1991, recreational landings approached 1,600 mt, while commercial landings were only 500 mt. During 1991, an estimated 4 million striped bass were caught by recreational anglers; 92 percent of these were released alive. Commercial harvest is made using a variety of gears, including gill nets, haul seines, pound nets,
Page 127
'These measures, aimed at protecting the 1982 and subsequent year classes until females could spawn at least
once, have been effective in increasing
spawning stock abundance, but not
necessarily recruitmenf'
and handlines, and is closely moni-tored by each state that allows com-mercial fishing.
For further information
Richards, R.A. and D.O. Deuel. 1987. Atlantic striped bass: Stock status and the recreational fishery. Mar. Fish. Rev. 49(2):58-66.
USDOI and USDOC. 1992. Emer-gency striped bass research study. Report for 1990. Washington, DC: U.S. Department of the Interior, U.S. Department of Commerce. Avail-able from: NMFS F/CM3, 1335 East-West Highway, Silver Spring, MD 20910.
Page 128
Atlantic Salmon The Atlantic salmon, Salrno salar,
is a highly desirable foOd fish and prized sport catch native to New England rivers. The historic North American range of Atlantic salmon extended from theriversofUngavaBay, Canada to Long Island Sound. As a consequence of industrial and agricultural development, most of the runs native to New England have been extirpated. Self-supporting runs of Atlantic salmon in the United States can only be found in Maine. Restoration efforts, in the fonn of stocking and fish passage construction, are unc!erway in the Connecticut, Pawcatuck, Merrimack and Penobscot rivers of New England.
Atlantic salmon life history is ex ~ tremely complex owing to its use of both freshwater and marine habitats and long ocean inigrations. Atlantic salmon spawn in fresh water during fall. Eggs remain in grav~l substrate over winter until they hatch and emerge as fry during spring. Juvenile salmon, commonly calledparr, remam in freshwater 2 to 3 years in New England Rivers depending on growth. "When parr grow to sufficient size (> 16 cm or 6.4 in.) they mature into smolts and migrate to the sea. As evidenced from tagging data for ~ew England stocks, young salmon migrate as far north as the Labrador Sea during their first summer in the ocean.
After their first winter at sea (the fish are now referred to as 1 sea-winter salmon) a small portion of the cohort becomes sexually mature and returns to their natal rivers. Those remaining at sea feed in the coastal waters of Canada and Greenland. Historically, it has been in these foraging areas, including Nova Scotia, Newfoundland, Labrador, and West Greenland, that
commercial gill net fisheries for salmon took place. After their second winter at sea, most U. S. salmon return to spawn. Three sea-winter and repeat spawning salmon life history patterns do occur in New England stocks.
Homewater fisheries are limited to an angling fishery in the state of Maine only. Angler landings averaged 381 salmon in recent years which resulted in an exploitation r,ate of approximately 10 percent of the run to Maine Rivers. Managem~nt authority for Atlantic salmon in U.S. waters resides with the states and the New England Fishery Management Council.
Distant-water fisheries (the commercial gill net fisheries in Canada and Greenland) have been evaluated by extensive tagging experiments with U.S. stocks. Harvest estimatesbased on Carlin tag returns put exploitation ofthe U.S. 1 sea-winter stock component at approximately 60 percent in recent years and at approximately 80 percent for the 2 sea-winter component. These levels of exploitation indicate that the stocks are overexploited. The commercial fisheries in Canada and Greenland are managed'under the auspices of North Atlantic Salmon Conservation Organization (NASCO) of which the United States is a mem~ ber. The Greenland fishery is managed with a quota system that has been in place since 1976. The Canadian fishery has been managed with timearea closures and quotas, but beginning in 1992 the largest component of the fishery, the fishery around the Island of Newfoundland, was closed for a moratorium period of 5 yr and a fishing license buy-back program was initiated by the Canadian government.
For further information
Mills, D. 1989. Ecology and Management of Atlantic Salmon. Chapman and Hall. New York.
Anonymous. 1992. RepOrt of the . ICES North Atlantic Salmon Working Group. ICES C.M.1992/Assess: 15. Copenhagen. Denmark.

Atlantic Salmon 16~--------------------------------------~
12
8
4
" ARVEST(yEAR i-I) "-. II :'
--", ' I ",'
,
I ' ,
I ' I , .... ,
1 , , ,
.. I,
\
O~~~-r~~~--~~~-r~~~--~~~-r~ 66 68 70 n 74 76 78 80 82 84 86 88 90 92
YEAR
Table 37.1 Recreational catches and conunerciallandings (nwnbers)
Year Category 1972-81 1982 1983 1984 1985 1986 1987 1988 1989 1990 1991
Average
u.s. Recreational 553 1230 355 639 958 1091 424 400 1007 1414 477 Conunercial'
United States Canada 2271 3206 3401 2657 4575 1104 1161 590 1722 780 N/A Greenland 2712 2567 976 1697 3242 4183 4149 3742 3797 1322 N/A
Total 5536 7003 4732 4994 8775 6378 5734 4714 6526 3516 477
'Carlin tag harvest estimates.
;' Atlantic Salmon >~
Long-term potential catch SSB for long-term potential catch Importance of recreational fishery Management
Status of exploitation Age at 50% maturity Size at 50% maturity Assessment level Overfishing definition
Fishing mortality rate corresponding to overfishing defmition
M = 0.12 FO•1 = Unknown
Unknown Unknown
Major State regulation, FMP,
NASCO Treaty Overexploited
2 sea years 71.0 em (28.0 in.)
Modified VP A = None defined, optimum yield
is set at zero under FMP
Not defined
F = Unknown .... F'!IIll =0.9
Page 129
"Homewater fisheries are limited to an angling fishery in the state of Maine only. Angler
landings averaged 381 salmon in recent years
which resulted in an exploitation rate of ap
proximately 10 percent of the run to Maine Rivers. II

Page 130
Sturgeon The Atlantic, Acipenser oxy
rhynchus, and shortnose, Acipenser brevi rostrum , sturgeons have been uti-1ized as high-quality food fish and as a source of caviar since colonial days. Both species are distributed as far south as Florida, but the Atlantic sturgeon has a more northerly distribution being recorded in the Canadian Province of Labrador whereas the shortnose sturgeon ranges only to the Province of New Brunswick. Sturgeon once supported a substantial commercial fishery, but like other anadromous species their populations were adversely affected by the industrial use of rivers beginning in the 1800s and by overfishing. Their decline has left only remanent populations of both species and has resulted in the enactment of state management measures to protect the Atlantic sturgeon and listing of the shortnose sturgeon as an endangered species under the federal Endangered Species Act (ESA). Today, the lack of fish passage facilities at darns and poor habitat conditions continue to stand as impediments to the re-establishment of many sturgeon populations.
The basic life history patterns for the two species are very similar, but there are important differences in migration range and timing that serve to minimize habitat overlap. Sturgeons are relatively slow-growing and mature late in life. These two factors that combine to make them vulnerable to overexploitation. Juveniles and adults are benthic or bottom feeders consuming a variety of crustaceans, bivalves, and wonn prey. As adults, shortnose sturgeon are smaller than Atlantic sturgeon reaching a body length of approximately 100 cm (40 in.) whereas the Atlantic sturgeon can be twice that length. Both species begin their spawning migration to freshwater during late winter to early summer. The migration occurs latter in the year at higher
Sturgeon East Coast
140
120
100
U1 Z
80 ~ u ii: fo- 60 w ::::E
40
20
O~~~~~~'-~~--~T-'-~~~~'--r~ 60 62 64 66 68 70 72 74 76 78 80 82 84 86 88 90 92
YEAR
Table 3·8.1 Recreational catches and commercial landings (metric tons)
Year Category 1972-81 1982 1983 1984 1985 1986 1987 1988 1989 1990 1991
Average
U.s. recreational Commercial
United States 84 87 45. 78 Canada
Total 84 87 45 78
latitudes, and where the species cooccur; the shortnose sturgeon tends to begin its spawning migrations earlier than the Atlantic sturgeon. Though they mature late in life, both species are highly fecund with total egg production proportional to their body size. Juvenile sturgeon will remain in freshwater for their. first summer of life and then migrate to deeper more brackish water in winter. The juveniles will migrate to and from freshwater for a number of years before joining the
61 49 41 45· 56 ·6~· 96
61 49 41 45 56 69 96
adult migration pattern. Migrations out of freshwater are well known for the Atlantic sturgeon, but are still undocumented· for the rarer shortnose sturgeon. Tagging studies have demonstrated Atlantic sturgeon can make considerable oceanic migrations both north and south of their natal river systems.
A large commercial fishery for sturgeon once existed, but today only a limited directed fishery still occurs and a large proportion of the landings

Shortnose Sturgeon
Long-term potential catch SSB for long-term potential catch Importance of recreational fishery Management Status of exploitation Age at 50% maturity Size at 50% maturity Assessment level Overfishing definition
Fishing mortality rate corresponding to overfishing definition
Unknown Unknown
Insignificant ESA Recovery Plan
Protected 10 years
60.0 cm (24.0 in.) Index
Not defined, prohibited under the ESA
None defined
M = 0.12 F o.1 = Unknown F ...... = Unknown FI991 = Unknown
Page 131
"Recent increases in landings are due to increased catches in developing ocean
fisheries in New York and New Jersey. There is no significant sport fishery
for sturgeon."
mercial fishery to levels of 10 percent of 1890 landings (7 million lb) while at the same time protecting stressed populations of Atlantic sturgeon. There are minimum size limits (7 ft) and restric-
L..-__________________________ ---' tions on harvest in some states. The
Atlantic Sturgeon
Long-term potential catch SSB for long-term potential catch Importance of recreational fishery Management Status of exploitation a Age at 50% maturity
N~ Size at 50% maturity ;ii; Assessment level j~j; Overfishing definition
~j Fi~~~:e;~~!i~yd:~~~~o~esponding
Unknown Unknown
Insignificant ASMFCPlan
Overexploited 20 to 25 yrs
200.0 cm (79.0 in.) Index
None defined
None defined
M = 0.12 F o.1 = Unknown F ...... = Unknown Fl991 = Unknown
are by-catch. Around the tum the century landings of sturgeon, believed to be a mix of the two species, were in excess of 3,000 mt (7 millon lb) a year. As these populations were overexploited, catches declined dramatically to only incidental landings during the period 1900 to 1950. Some fishing activity, primarily in the Carolinas, began during the 1960s which sustained landings of 100 tons through the 1980s. Most of these fisheries are now closed in compliance with the fishery
management plan for Atlantic sturgeon. Recent increases in landings are due to increased catches in developing ocean fisheries in New York and New Jersey. There is no significant sport fishery for sturgeon.
Management for sturgeons is in the form of an Atlantic States Marine Fisheries Commission (ASMFC) plan for the Atlantic sturgeon and a recovery plan under the Endangered Species Act for the shortnose sturgeon. The ASMFC plan seeks to restore the com-
shortnosesturgeon ESA Recovery Plan is being revised. Shortnose sturgeon populations in some rivers, for ex-ample the Kennebec and Hudson, may be large enough to allow reclassification of their endangered status.
For further information
Dadswell, MJ., B.D. Taubert, T.S. Squires. D. Marchette, 1. Buckley. 1984. Synopsis of biological data on shortnose sturgeon, Acipenser brevirostrumLeSueur 1818. NOAA! NMFS Technical Report 14.
Gilbert, c.R. 1989. Species profiles: life histories and environmental requirements of coastal fishes and invertebrates (Mid-Atlantic Bight)-Atlantic and shortnose sturgeons. U.S. Fish and Wildlife Service BiologicaIReport82(11.122) u.s. Army CorpsojEngineers TREL-82-4 28pp.
Page 132
Common Name Index
A G R
Alewife ..................................... 122 Goosefish ................................... 75 Red hake ..................................... 52 American lobster ...................... 107 Gray sole .................................... 66 Redfish ....................................... 47 American plaice .......................... 64 River herring ............................ 122 American shad .......................... 124 H Atlantic cod ............................... .41 s Atlantic herring .......................... 91 Haddock ...... , .............................. 44 Atlantic mackerel ....................... 93 Hake Salmon ..................................... 128 Atlantic wolffish ......................... 87 Red ...................................... 52 Sand flounder ............................. 72 Angler ......................................... 75 Silver .................................. 49 Scallop, sea .............................. 118
. White .. ~ ............................... 83 Scup ........................... .-............... 77 B Herring ....................................... 91 Sea scallop ............. : ..... : ........ : .. 118
Shad .............. .-.......................... 124 Bass L Short-finned squid .................... 103
Black sea ............................. 79 Silver hake ................................. 49 Striped ............................... 126 Lemon sole ................................ 68 Skates ...................... ~ ................ 101
Black sea bass ............................. 79 Lobster ..................................... 107 Spiny dogfish ............................. 99 Blackback ................................... 68 Long-finned squid .................... 105 Squid Blueback herring ...................... 122 Long-finned ...................... 105 Bluefish ............. : ........................ 97 M Short-finned ...................... 103 Butterfish .................................... 95 Striped bass .............................. 126
Mackerel .................................... 93 Sturgeon c Monkfish .................................... 75 Atlantic .............................. 130
Shortnose .......................... 130 Catfish ........................................ 87 N Summer flounder ....................... 62 Clam ......................................... 112 Surfc1am ................................... 112 Cod ............................................. 41 Northern lobster ....................... 107 Cusk ............................................ 85 Northern shrimp ....................... 110 T
D o Tilefish ....................................... 89
Dab .............................................. 64 Ocean perch ............................... 47 w Dogfish ....................................... 99 Ocean pout ................................. 81
Ocean quahog .......................... 115 White hake ................................. 83 F Whiting ...................................... 49
p Winter flounder .......................... 68 Flounder Witch flounder ........................... 66
Summer ............................... 62 Pollock ....................................... 55 Windowpane ....................... 72 Porgy .......................................... 77 y Winter .................................. 68 Witch ................................... 66 Q Yellowtail flounder .................... 57 yellowtail ............................ 57
Fluke ........................................... 62 Quahog, ocean ......................... 115

Page 133
Scientific Name Index
A I R
Acipenser brevi rostrum .............. 130 Illex illecebrosus ..... ................... 103 &Jja eglanteria .......................... 101 Acipenser oxyrhynchus .... ........... 130 &Jja erinacea ............................. 101 Arctica islandica ........................ 115 L &Jja garmani ............................. 10 1 Alosa aestivalis ........................... 122 &Jja laevis .................................. 10 1 Alosa sapidissima ....................... 124 £Oligo pealeii ............................. 105 Alosap'Seudoharengus ............... 122 £ophius americanus .................... 75 &Jja ocellata .............................. 10 1 Anarhichas lupus ......................... 87 £opholatilus chamaeleonticeps ... 89 &Jja radiata ............................... 10 1
&Jja senta .................................. 101 B M
s Brosme bros me............................ 85 Macrozoarces americanus .......... 81
Melanogrammus aeglefinus ........ 44 Salmo salar ................................ 128 c Merluccius bilinearis ................... 49 Scomber scombrus ............. , ......... 93
Morone saxatilis ........................ 126 Scophthalmus aquosus ................. 72 Centropristis striata .................... 79 Sebastesfasciatus ........................ 47 Clupea harengus ......................... 91 p Spisula solidissima ..................... 112
Squalus acanthias ........................ 99 G Pandalus borealis ....... ............... 110 Stenotomus chrysops ........... ......... 77
Paralichthys dentatus .................. 62 Gadus morhua ............................. 41 Peprilus triacanthus .................... 95 u Glyptocephalus cynoglossus ....... 66 Placopecten magellanicus ......... 118
Pleuronectes ferrugineus ............. 57 Urophycis chuss ........................... 52 H Pollachius virens ......................... 55 Urophycis tenuis .......................... 83
Pomatomus saltatrix .................... 97 Hippoglossoides platessoides ..... 64 Pleuronectes americanus ............. 68 Homarus americanus ................. 107
* u. S. GOVERf'Io1ENT PRINTI":; OFFICE: 1992--)O~-026-60004
